SMARTgrid - docs.idahopower.com · Idaho Power Company 2015 Smart Grid Report Public Document Page...
136
HYDRO SMART grid Report
Transcript of SMARTgrid - docs.idahopower.com · Idaho Power Company 2015 Smart Grid Report Public Document Page...

HYDRO
October 1, 2015
SMARTgridReport


Idaho Power Company 2015 Smart Grid Report
Public Document Page i
TABLE OF CONTENTS Table of Contents ............................................................................................................................. i
List of Tables ................................................................................................................................. iv
List of Figures ................................................................................................................................ iv
List of Appendices ......................................................................................................................... vi
List of Acronyms .......................................................................................................................... vii
Executive Summary .........................................................................................................................1
Solicitation of Stakeholder Input .....................................................................................................2
I. Smart Grid Goals, Objectives, Strategy, and Process...................................................................3
A. Goals and Objectives .......................................................................................................3
The Smart Grid is Customer Centered .................................................................................3
Smart Grid is Data Rich .......................................................................................................3
Edge of Network ..................................................................................................................3
B. Strategy .............................................................................................................................4
Operations ............................................................................................................................4
Customer Systems ................................................................................................................5
Advanced Metering Infrastructure (AMI) ...........................................................................5
C. Process ..............................................................................................................................6
II. Status of Smart Grid Investments................................................................................................6
A. Transmission Network and Operations Enhancements ....................................................7
Transmission Situational Awareness Oscillation Monitoring Pilot .....................................7
Transmission Situational Awareness Voltage Stability Monitoring System Pilot ..............7
Transmission Situational Awareness Peak Reliability Coordinator (RC) Hosted Advanced Application .............................................................................................8
Available Transfer Capability (ATC) Calculation Tool ......................................................9
Dynamic Line Rating Pilot ................................................................................................10
B. Substation and Distribution Network and Operations Enhancements ............................11
Transmission Transformer Geomagnetic Disturbance (GMD) Monitoring ......................11

2015 Smart Grid Report Idaho Power Company
Page ii Public Document
Conservation Voltage Reduction (CVR) Enhancement Project ........................................11
ENGO Solid State Reactive Power Compensation Device Pilot .......................................19
C. Customer Information and Demand-Side Management (DSM) Enhancements ............19
Advanced Metering Infrastructure .....................................................................................19
myAccount .........................................................................................................................20
Direct Load Control ...........................................................................................................25
Online Outage Map Proves Popular ..................................................................................27
New Online Tool Shows Resources Used for Electrical Generation ................................29
D. Distributed Resource and Renewable Resource Enhancements .....................................30
Renewable Integration Tool (RIT) .....................................................................................30
Photovoltaic (PV) and Feeder Peak Demand Alignment Pilot ..........................................31
Renewable and Other Energy Contracts—Status Update ..................................................31
Net Metering—Status Update ............................................................................................31
E. General Business Enhancements ....................................................................................34
Idaho Power Enterprise Data Warehouse (EDW) .............................................................34
Meter Data Management System (MDMS) Upgrade ........................................................34
III. Future Smart Grid Investments ................................................................................................35
A. Transmission Network and Operations Enhancements ..................................................35
Transmission Situational Awareness Grid Operator’s Monitoring and Control Assistant ....................................................................................................35
Power System Engineering Research Center (PSERC) .....................................................36
B. Substation and Distribution Network and Operations Enhancements ............................39
Substation Fiber-Based Protection and Control Pilot ........................................................39
Automated Volt/VAr Management System (VVMS) Pilot ...............................................40
Distribution System Communications Strategy .................................................................41
Replace the Existing Outage Management System (OMS) ...............................................42
Implementation of Automated Connect/Disconnect Capability at Selected Locations through the AMI System .......................................................................43
Implement Additional AMI Outage Scoping and Restoration Confirmation Functionality ....................................................................................44

Idaho Power Company 2015 Smart Grid Report
Public Document Page iii
Solar End-of-Feeder Project ..............................................................................................45
C. Customer Information and Demand-Side Management Enhancements .........................45
Customer Relationship Management (CRM) ....................................................................45
Integrated Demand Response Resource Control ...............................................................46
Ice-Based Thermal Energy Storage (TES) ........................................................................46
D. Distributed Resource and Renewable Resource Enhancements .....................................47
Renewable Integration Tool—Current Project Developments ..........................................47
E. General Business Enhancements ....................................................................................48
The Mobile Workforce Management System Upgrade .....................................................48
IV. Smart Grid Opportunities and Constraints ..............................................................................48
A. Transmission, Substation, Operations, and Customer Information Enhancements ........49
Personalized Customer Interaction ....................................................................................49
Modification of Idaho Statute for Electric Vehicle (EV) Charging ...................................49
Use of Technology and Process Changes to Improve Workforce Efficiency ...................50
B. Evaluations and Assessments of Smart Grid Technologies ...........................................50
Electric Vehicle Charging Impacts Study ..........................................................................50
Photovoltaic and Feeder Peak Demand Alignment Pilot ...................................................51
Electric Vehicles for Idaho Power Circulator Route .........................................................52
Solar-Powered Parking Lot Lighting .................................................................................53
C. Smart Grid Pilots and Programs ......................................................................................54
D. State of Key Technologies ..............................................................................................55
V. Targeted Evaluations.................................................................................................................55
VI. Related Activities.....................................................................................................................57
A. Cyber and Physical Security ...........................................................................................57
B. Privacy ............................................................................................................................57
C. General Customer Outreach and Education ....................................................................58
Overview ............................................................................................................................58
Customer Outreach and Education Events ........................................................................58

2015 Smart Grid Report Idaho Power Company
Page iv Public Document
Communications ................................................................................................................59
VII. Conclusion ..............................................................................................................................60
LIST OF TABLES Table 1
CVR treatment and control transformers identified or selected for energy savings validation. ....................................................................................................................................13
Table 2 CSPP & PPA Renewable Generation Projects ...........................................................................31
Table 3 Number of net metering systems—pending and active as of August 31, 2015 ..........................32
Table 4 Nameplate capacity (MW)—pending and active as of August 31, 2015....................................32
LIST OF FIGURES Figure 1
Idea processing ..............................................................................................................................6
Figure 2 Dynamic Line Rating Equipment Installed in Hells Canyon ......................................................10
Figure 3 ENGO unit measured voltage, no VAr injection, voltage histogram .........................................15
Figure 4 ENGO unit measured voltage, no VAr injection, kVAR histogram ...........................................15
Figure 5 ENGO unit measured voltage, no VAr injection, voltage profile ...............................................16
Figure 6 ENGO unit measured value, active VAr injection, voltage histogram .......................................17
Figure 7 ENGO unit measured value, active VAr injection, kVAR histogram ........................................17
Figure 8 ENGO unit measured value, active VAr injection, voltage profile ............................................18

Idaho Power Company 2015 Smart Grid Report
Public Document Page v
Figure 9 Mobile-adapted screen ................................................................................................................21
Figure 10 myAccount mobile menu options ...............................................................................................21
Figure 11 Mobile daily/hourly usage screen ...............................................................................................22
Figure 12 Mobile next estimated bill screen ...............................................................................................22
Figure 13 Desktop Next Estimated Bill Screen ...........................................................................................23
Figure 14 Example of a tweet ......................................................................................................................24
Figure 15 Examples of myAccount messaging at an event .........................................................................25
Figure 16 Mobile next estimated bill screen ...............................................................................................25
Figure 17 Screenshot of Idaho Power’s online outage map ........................................................................28
Figure 18 Outage map customer visits ........................................................................................................29
Figure 19 Hourly generation versus demand...............................................................................................30
Figure 20 Cumulative Net Metering System Counts 2002 to year-to-date August 31, 2015. ....................33
Figure 21 Cumulative installed net metering capacity 2002 to year-to-date August 31, 2015 (MW) ........33
Figure 22 A circulator vehicle and charging station at Idaho Power’s corporate headquarters ..................53
Figure 23 Solar-powered parking lot lighting before and after ...................................................................54
Figure 24 Parking lot lighting system energy consumption/generation ......................................................54

2015 Smart Grid Report Idaho Power Company
Page vi Public Document
LIST OF APPENDICES Appendix A
Stakeholder Input
Appendix B Outage Map Launch and ETR Overview for Customer Service
Appendix C Peak Reliability Project Plan
Appendix D Summary of Descriptions, Benefits and Costs
Appendix E Summary of Expected Benefits
Appendix F July 2015 Idaho Power Connections Newsletter

Idaho Power Company 2015 Smart Grid Report
Public Document Page vii
LIST OF ACRONYMS A/C—Air Conditioning
ACC—Automated Capacitor Control
ANSI—National Service Voltage Standard
AMI—Advanced Metering Infrastructure
ATC—Available Transfer Capability
CGI—CGI Group Incorporated
CIS—Customer Information System
CR&B—Customer Relationship and Billing
CRM—Customer Relationship Management
CSPP—Cogeneration and Small Power Producers
CSR—Customer Service Representative
CVR—Conservation Voltage Reduction
DR—Demand Response
DSM—Demand-Side Management
EDW—Enterprise Data Warehouse
ENGO—Edge of Network Grid Optimization
ETC—Expected Transmission Commitment
EV—Electric Vehicle
FERC—Federal Energy Regulatory Commission
GIC—Geomagnetic Induced Currents
GMD—Geomagnetic Disturbance
IEEE—Institute of Electrical and Electronics Engineers
IEE—Itron Enterprise Edition

2015 Smart Grid Report Idaho Power Company
Page viii Public Document
ILC—Irrigation Load Control
INL—Idaho National Lab
IRP—Integrated Resource Plan
kV—Kilovolt
kW—Kilowatt
kWh—Kilowatt-hour
LSE—Linear State Estimator
LTC—Load Tap Changer
MDMS—Meter Data Management System
MVAr—Megavolt-ampere-reactive
MW—Megawatt
NERC—North American Electricity Reliability Commission
NIST—National Institute of Standards & Technology
OMS—Outage Management System
PLC—Power Line Carrier
PMU—Phasor Measurement Unit
PPA—Power Purchase Agreement
PSERC—Power System Engineering Research Center
PUD—Public Utility District
PV—Photovoltaic
RC—Reliability Coordinator
RD&D—Research, Development and Deployment
RIT—Renewable Integration Tool
QoS—Quality of Service
SE—State Estimator

Idaho Power Company 2015 Smart Grid Report
Public Document Page ix
SGIG—Smart Grid Investment Grant
SGM—Smart Grid Monitoring
SPS—Special Protection Systems
TES—Thermal Energy Storage
TOD—Time Of Day
TOU—Time of Use
TVP—Time Variant Pricing
VAr—Volt Ampere Reactive
VSMS—Voltage Stability Monitoring System
VVMS—Volt/VAr Management System
WECC—Western Electricity Coordinating Council


Idaho Power Company 2015 Smart Grid Report
Public Document Page 1
EXECUTIVE SUMMARY Idaho Power Company (“Idaho Power” or “Company”) is pleased to present its 2015 Smart Grid
Report in compliance with Order No. 12-158 issued by the Public Utility Commission of Oregon (Commission) in Docket UM 1460. The Commission’s smart grid goal and objectives as set forth in this order are as follows:
The Commission’s goal is to benefit ratepayers of Oregon investor-owned utilities by fostering utility investments in real-time sensing, communication, control, and other smart-grid measures that are cost-effective to consumers and that achieve some of the following:
Enhance the reliability, safety, security, quality, and efficiency of the transmission and distribution network
Enhance the ability to save energy and reduce peak demand
Enhance customer service and lower cost of utility operations
Enhance the ability to develop renewable resources and distributed generation.
This document presents Idaho Power’s third annual Smart Grid Report and addresses the Company’s efforts toward accomplishing the Commission’s goals. This report explains the Company’s overall strategies, goals, and objectives as they pertain to its smart grid efforts. It provides a review of current smart grid projects, initiatives, and activities being performed by the Company and describes additional projects the Company plans to undertake in the next five years. Opportunities the Company has identified, as well as potential constraints, are also discussed.
Idaho Power evaluates new smart grid technologies and opportunities in a systematic process to determine if they solve an existing problem, improve efficiency, increase reliability, safety or security, or enhance customer satisfaction. Opportunities for funding smart grid projects are evaluated using common criteria alongside other capital projects being considered by the Company.
2015 has been a year where Idaho Power focused on providing customers new ways to view information extracted from the grid. These new tools are described in Sections II.C. and III.C. concerning customer information enhancements.
In addition to fulfilling or meeting Commission reporting requirements, this document serves as a high level strategic document for Idaho Power to plan and track its smart grid projects. It acts as a company-wide repository of all smart grid projects, reports, and studies underway or planned in the near-term future.
The Commission’s specific recommendations for this report included in Order No. 15-053, Docket UM 1675, will be reviewed in Section V, Targeted Evaluations.

2015 Smart Grid Report Idaho Power Company
Page 2 Public Document
SOLICITATION OF STAKEHOLDER INPUT In preparation for filing this report, Idaho Power provided the public and other parties with opportunities to contribute information and asked for ideas on smart grid investments and applications.
To solicit input from the general public, Idaho Power developed a draft report again this year which was available for review by the public and other stakeholders during the review period. The Company placed an advertisement—Share Your Ideas About Smart Grid—in the two newspapers with the best coverage in Idaho Power’s Oregon service area. An advertisement was placed in the Argus Observer (Ontario) on August 16 and 28, 2015, and in the Hells Canyon Journal (Halfway) on August 19 and September 2, 2015. Idaho Power included a web link in the newspaper ads that directed readers to a copy of the draft Smart Grid Report.
On Friday, August 14, 2015, Idaho Power sent an email soliciting comments to all parties on the service lists of the initial smart grid docket, UM 1460; Idaho Power’s last Oregon general rate case docket, UE 233; Idaho Power’s last integrated resource planning docket, LC 63; and Idaho Power’s 2013 Smart Grid Report docket, UM 1675. As an additional effort this year, Idaho Power identified some Oregon customers who had previously worked with Idaho Power on renewable and resource planning issues and sent them tailored emails providing them an opportunity to review the 2015 Smart Grid Report draft and provide any suggestions or comments. Idaho Power attached a draft Smart Grid Report to the email solicitations.
Idaho Power requested comments be submitted by September 4, 2015. Idaho Power received one set of informal comments from Oregon Commission Staff as a result of this solicitation process.
Copies of the newspaper advertisements, both email solicitations, and the informal comments received including Idaho Power’s responses are provided in Appendix A. Also included is a screen shot of the Smart Grid landing page from the Idaho Power web page.

Idaho Power Company 2015 Smart Grid Report
Public Document Page 3
I. SMART GRID GOALS, OBJECTIVES, STRATEGY, AND PROCESS
The smart grid is a concept whereby utilities deploy new technologies to reduce costs and improve the operation of the electrical power system. As an industry, utilities have been doing this for years; it is not new. What is new is the speed in which new technologies are becoming available and the abundance of data now available through Advanced Metering Infrastructure (AMI) meters and monitoring devices.
This document represents a vision of what Idaho Power’s future may look like in the near to mid-term future and presents various projects and programs that Idaho Power is undertaking or may undertake to prepare for that future. Some of the projects are already underway while others are for future implementation. The 2015 Smart Grid Report is a vision paper supported with concrete studies and analysis created by a working group of Idaho Power senior managers and senior staff. The vision represented herein is forward looking and as such, may be adjusted in some areas as the years progress.
A. Goals and Objectives
The Smart Grid is Customer Centered
The smart grid concept provides customers easier access to their energy use information and empowers them to act on that information. It provides real-time signals to customers and in general, serves them in a manner that allows them to be more involved and proactive in managing their energy use. Idaho Power believes that customers expect utilities to provide a different experience than the traditional paradigm of service provided in the past. In part, this paradigm change is driven by the increasing use of technology in our everyday lives. Idaho Power believes customers will and do expect a different experience than what has been traditionally provided. Customers will seek an experience that includes information that enables them to make choices in their energy use.
Smart Grid is Data Rich
The smart grid is a data rich environment with embedded sensing devices located throughout the electric system that allows for automation of protection and control while providing the information needed to more efficiently operate the system. It provides two-way flows of information between devices and between Idaho Power and its customers. It gives the utility the ability to more efficiently integrate distributed resources. It provides resiliency in utility response to storm or event driven outages, speeding up restoration efforts.
Edge of Network
The smart grid is moving to the edge of the network – an area where utilities have traditionally not gone. This edge goes all the way down to the secondary side of the service transformer and even into the homes and businesses served by Idaho Power. The ability to control power quality

2015 Smart Grid Report Idaho Power Company
Page 4 Public Document
down to the customer level enables the system to become more efficient and responsive to customer needs while maintaining customer privacy.
The smart grid represents an opportunity to enhance the value customers receive from the electric system. Idaho Power is committed to helping customers realize this value through good planning and making wise investments, considering both costs and benefits associated with any smart grid project. Idaho Power must realize this vision while maintaining the safety and reliability expected of it by both customers and employees. By optimizing and modernizing the power system, Idaho Power can enhance customer service, improve power reliability, promote energy efficiency, and more efficiently integrate renewable resources.
At Idaho Power, the smart grid vision consists of seven major characteristics:
1. Enhance customer participation and satisfaction
2. Accommodate generation/energy storage
3. Enable new products/services/markets
4. Improve power quality
5. Optimize asset efficiency
6. Anticipate and respond to disturbances
7. Provide resilient operation/robustness
B. Strategy The Company’s strategy for realizing the smart grid vision consists of focusing investments in the following areas:
Operations
Idaho Power will make considerable investments in the coming years in real-time sensing, diagnostic, communications, and control equipment to increase the efficiency and reliability of the system and make the system more resilient. Simultaneous with these investments, Idaho Power must mold together planning activities, field work, and operations. Actions will be taken to integrate new operations tools into existing tools that are familiar to system operators.
Determining a strategy for communicating with the many devices to be installed on the electrical system is critical to the smart grid’s long-term success. While Idaho Power has operated a number of different communication systems for many years, many of the systems are becoming outdated or have reached capacity. A distribution system communications strategy must provide speed, bandwidth, and high security while minimizing costs.
Idaho Power will undertake some specific operational projects that are described more fully in this report including the following:

Idaho Power Company 2015 Smart Grid Report
Public Document Page 5
Replace the Outage Management System (OMS)
Refine the renewable energy (wind) integration tool
Install a transmission line situational awareness tool
Conduct a substation fiber-based protection and control pilot
Enhance the existing Conservation Voltage Reduction (CVR) program
Develop a distribution communications strategy
Customer Systems
Idaho Power believes its customers’ expectations are changing and they want more information about their energy use. In order to provide customers easier access to information about their energy use and enable them to take actions based on that information, many background activities must take place.
Some specific customer systems projects that will be undertaken and are described more fully in this report are:
Refine the Enterprise Data Warehouse (EDW)
Develop a Customer Relationship Management (CRM) system
Develop online information for customers including an outage map
Advanced Metering Infrastructure (AMI)
With most Idaho Power meters now having AMI capabilities, Idaho Power seeks to more fully utilize the tremendous amount of information received to improve service offered to its customers. These meters also possess additional functionality that should be investigated.
Some specific projects that will be undertaken and are described more fully in this report are:
Implement automated service connect/disconnect through the AMI system
Upgrade station communications
Upgrade the Meter Data Management System (MDMS)
Investigate the ability of AMI to control line devices
Integrating these projects enhances Idaho Power’s ability to manage peak demand, integrate renewable resources, keep prices as economical as possible, offer innovative rate designs, increase energy efficiency, and improve grid reliability.

2015 Smart Grid Report Idaho Power Company
Page 6 Public Document
C. Process Idaho Power has a systematic process for evaluating smart grid projects. The Research, Development, and Deployment (RD&D) department is the primary department responsible for the assessment of new grid technologies, including smart grid opportunities. Project leaders are responsible for tracking and evaluating industry technologies, managing technology pilots, and assessing pilot-project outcomes.
The project leaders plan the utility-wide deployment of successful technologies and submit these plans for capital funding. Smart grid technologies are collected and evaluated with all other ideas. The high-level process is shown in Figure 1.
Figure 1 Idea processing
Smart grid ideas are analyzed to determine if they solve an existing problem, improve efficiency, increase reliability, safety or security, or enhance customer satisfaction. The RD&D leaders also develop smart grid ideas into deployable pilot projects and evaluate the cost/benefit of the project. The pilot project is submitted to a review team to ensure all aspects of the project have been included in the initial design and to evaluate external impacts of the project (e.g., communication infrastructure and operating capabilities). The project is then evaluated for funding against all other projects. After the pilot project is funded and deployed, it is evaluated against the projected costs and benefits determined in the initial evaluation stage. If the pilot project meets expectations, a project plan is developed for utility-wide deployment.
II. STATUS OF SMART GRID INVESTMENTS The following sections describe the smart grid projects, initiatives, and activities currently underway and the results to date.

Idaho Power Company 2015 Smart Grid Report
Public Document Page 7
A. Transmission Network and Operations Enhancements
Transmission Situational Awareness Oscillation Monitoring Pilot
The pilot phase of this project was intended to monitor system-wide oscillations using Idaho Power Phasor Measurement Unit (PMU) data as described in the 2014 Smart Grid Report. This pilot has been completed and the application is currently running on an Idaho Power server; however, the output of the analysis tool is currently not being used in transmission operations as the software needs further development to provide meaningful visualization information to system operators.
During the pilot project, Idaho Power identified that additional PMU signals are needed near Idaho Power generation facilities in order to provide sufficient input data to the oscillation analysis software. In May of this year, Idaho Power completed the installation of PMUs at the following generating stations: Brownlee, Hells Canyon, Oxbow, Lower Salmon, and Bliss. The Company expects to completed the installation of an additional five PMU sites at Bennet Mountain, Danskin, North Power, CJ Strike, and American Falls by May of 2017. An additional Phasor Data Concentrator will be installed at Boise Bench before July of 2016.
There is still a need to implement a reliable mechanism for streaming and archiving the data to be used in the various applications. Idaho Power plans to acquire a PI System Access Server next year for all archiving and streaming functions. This should provide a more robust platform for tool development and interfacing with the PMU data. At least one more additional year of development and integration work will be needed to develop the oscillation analysis software.
Transmission Situational Awareness Voltage Stability Monitoring System Pilot
The expectation for the VSMS software was to monitor real-time voltage stability, as well as have the capability to utilize archived PMU data to perform post-event voltage stability analysis. The pilot phase of this project as described in the 2014 Smart Grid Report has been completed. Currently the voltage stability monitoring application is not operational. The voltage stability results produced by the application during the pilot project provide little operations benefit and require significant development for operational use.
Idaho Power also identified during the pilot project that the installation of additional PMUs would be required in order to collect the data needed for the methodology used in the voltage stability monitoring algorithm. Therefore, Idaho Power is not continuing development of the voltage stability monitoring system software at this time.
Idaho Power is currently exploring a different algorithm for voltage stability analysis that appears to have reached a more matured level of development. Further testing at a couple of stations will be required for benchmarking and calibrating the monitoring tool.
Notwithstanding other pilot projects currently under consideration for providing Transmission Situational Awareness by Voltage Stability Monitoring, the initial pilot project may be revisited

2015 Smart Grid Report Idaho Power Company
Page 8 Public Document
once the software matures sufficiently and additional PMUs are in place to support its full implementation.
Transmission Situational Awareness Peak Reliability Coordinator (RC) Hosted Advanced Application
The western system RC, now titled Peak Reliability, maintains a Western Electricity Coordinating Council (WECC)-wide State Estimator (SE) data model for real-time transmission system contingency analysis so its operators can perform their primary function of maintaining system-wide reliability. The term contingency refers to changes in the modeled system due to non-normal events such as a line or generator outage.
Maintaining a WECC-wide SE data model has proven very difficult for operators and planners due to system complexity and differences in the models used by the various utilities in the WECC. Peak Reliability developed a slate of advanced applications to maintain the system estimator. These advanced applications provide users with an assessment of the current state of the transmission system including the following:
Voltage magnitude and angle at all modeled buses
Megawatt (MW) and megavolt-ampere-reactive (MVAr) flow on all lines and transformers
MW and MVAr flow on loads and generating units
Transformer load tap changer (LTC) tap position
Phase shifter tap position
Identification of pre- and post-contingency facility rating, System Operating Limit, and Interconnection Reliability Operating Limit exceedances
Identification of network islands
Identification of potential post-contingency cascading outages
Identification of potential post-contingency islanding conditions
The advanced application tools used by Peak Reliability consist of the following:
Real-Time Network Analysis tools:
State Estimator
Real-Time Contingency Analysis
Network Study Applications

Idaho Power Company 2015 Smart Grid Report
Public Document Page 9
Power Flow
Study Contingency Analysis
Fast Network Analysis
Real-Time monitoring of Interconnection Reliability Limits based on a state-estimator implementation of the Region of Stability Existence application.
Several years ago Idaho Power proposed to WECC that it be given the ability to remotely use an instance of the Peak Reliability advanced applications for real-time contingency analysis by installing a system for remote access and retrieval of the SE solution. The hardware and applications for remote support were installed at Idaho Power in 2014. Additionally, seven other utilities in the WECC are now using the advanced applications tool with a number of other utilities expected to join. Other utilities currently using the hosted advanced applications tool are Avista, Northwestern Energy, Grant County Public Utility District (PUD), Chelan County PUD, Douglas County PUD, Tucson Electric Power, and Seattle City Light.
Available Transfer Capability (ATC) Calculation Tool
As described in the 2014 Smart Grid Report, Idaho Power, in collaboration with Pacific Northwest National Lab, developed a probabilistic-based method and tool flexible enough to allow Idaho Power to determine the ATC for any existing and future transmission path.
The tool has been initially configured to perform these calculations on only one of the Company’s transmission paths (Midpoint West). Different from the deterministic approach, this tool considers stochastic variations of wind generation and load and the impacts of such variations in calculating ATC.
Calculating ATC is critical to knowing how much power can be reliably transferred over the interconnected transmission network. An overestimation of ATC can jeopardize the reliability of the transmission system or cause unexpected congestion, while an underestimation of ATC can lead to inefficient transmission system utilization.
The initial ATC tool has been developed and evaluated by Idaho Power. The calculations and methods have been verified; however, the software does not have sufficient flexibility to model future system changes. Idaho Power contracted with North Carolina State University to develop a graphical user interface to adjust the program inputs to expand the applicability of the tool. There are four key features being implemented:
1. Visualization of statistic characteristics of input data sets
2. Parameter selection
3. Results: Expected Transmission Commitment (ETC) statistics
4. Results: ETC confidence interval

2015 Smart Grid Report Idaho Power Company
Page 10 Public Document
This phase of the project was completed in 2014. North Carolina State University developed a graphical user interface tool. Work needs to be done to gather data to perform the analyses. At this time, Idaho Power is evaluating ways to streamline the data gathering process and also include solar resources in the calculations.
Dynamic Line Rating Pilot
As described in the 2014 Smart Grid Report, Idaho Power and the Idaho National Lab (INL) are collaborating on a system that predicts wind speed and direction along the transmission line from an area-specific wind model using real-time weather station information located along the transmission line. The software program calculates the actual line limits based on the measured ambient conditions and wind model. A pilot system with 15 weather stations has been installed in a test area monitoring a portion of the 230 kilovolt (kV) and 138 kV transmission lines between Hagerman, Bliss, and Glenns Ferry, Idaho. The original pilot system is being expanded to include 46 weather stations covering the entire line corridor from Midpoint Substation north of Twin Falls to Boise Bench Substation in Boise, Idaho. Five of the additional weather stations are now installed with the remainder to be installed during 2015.
Since last year’s report, the pilot project has progressed with the installation of several new weather stations. INL has developed and is presently updating the software to calculate operating line limits to be completed in 2015. Idaho Power/INL have begun to gather data to assess the potential to dynamically rate transmission line operating limits in the Hells Canyon area with six weather stations presently installed. A seventh weather station installation is under way. Data gathering is expected to continue through 2015 and will be assessed after the end of the year. Due to the extreme topology of the Hells Canyon area, this is a very challenging endeavor. Idaho Power and INL continue to work closely together to further this technology and approach.
Figure 2 Dynamic Line Rating Equipment Installed in Hells Canyon

Idaho Power Company 2015 Smart Grid Report
Public Document Page 11
B. Substation and Distribution Network and Operations Enhancements
Transmission Transformer Geomagnetic Disturbance (GMD) Monitoring
As described in the 2014 Smart Grid Report, Idaho Power has analyzed the transmission substations in its system to determine those that may be susceptible to geomagnetic induced currents (GIC). GIC are created when a space weather event (solar storm) interacts with and creates variation in the earth’s magnetic field that could potentially damage some electrical power equipment. This analysis has identified three Idaho Power substations that may experience GIC during a very large GMD event. Two GIC sensors have been installed to date. The data is periodically gathered and aligned with GMD events to assess if the event resulted in measureable GIC. Unfortunately, the data gathered indicates that the installations do not accurately or reliably measure the GIC and are not suitable for continued measurement or analysis. A combination of environmental conditions as well as installation location and sensor scaling all contribute to this condition. Idaho Power does not have a solution to solve the GIC sensor inaccuracy issue and does not have plans to pursue other technologies to monitor GIC.
The Federal Energy Regulatory Commission (FERC) and North American Electricity Reliability Commission (NERC) have also begun to address GMD. In May 2013, FERC issued Order No. 779 directing NERC to develop reliability standards to address the potential impact of GMDs on the reliable operation of the Bulk Power System. FERC Order No. 779 issued directives to NERC to develop reliability standards in two stages. Stage 1 standards have been approved under NERC Project 2013-03 Geomagnetic Disturbance Mitigation as NERC Standard EOP-010-1. Stage 1 standards require applicable entities to develop and implement operating procedures that can mitigate the effects of GMD events. These operating procedures have been developed and are in place at Idaho Power. The Stage 2 standards will be drafted as NERC Standard TPL-007-1. Stage 2 standards require applicable entities to conduct initial and ongoing assessments of the potential impact of benchmark GMD events on their respective systems. The benchmark GMD event established by NERC is far below the GMD event magnitudes that have been modeled and studied by Idaho Power. The experience gained by Idaho Power through the model development and study process helped develop the operating procedures required in EOP-010-1 and the transmission planning processes and procedures that will be required in TPL-007-1.
Conservation Voltage Reduction (CVR) Enhancement Project
As described in the 2014 Smart Grid Report, Idaho Power is midway through a multi-year project, to be completed in 2016, aimed at enhancing Idaho Power’s existing CVR program. The long-term goal is to operate a CVR program at all transformers where it can be efficiently and cost-effectively implemented. The CVR program would be dynamically controlled such that voltages on transformers are minimized while maintaining customers’ voltage levels to meet the National Service Voltage Standard (ANSI) C84.1. CVR would also be able to reduce demand on transformers during peak load periods in response to capacity requirements.

2015 Smart Grid Report Idaho Power Company
Page 12 Public Document
The scope of the CVR Enhancements Project includes the following:
Validate energy savings associated with CVR using measured instead of modeled values
Quantify the costs and benefits associated with implementing CVR
Determine methods for expanding the CVR program to additional feeders
Pilot methods for making Idaho Power’s CVR program more dynamic
Determine methods for ongoing measurement and validation of CVR effectiveness
The Estimated Costs for the CVR Enhancements Project are:
The Expected Customer Benefits of the CVR Enhancements Project are: If successfully implemented, CVR may reduce customer energy use and system losses.
Energy Savings Validation Idaho Power evaluated various methods for validating the energy savings associated with CVR. Idaho Power chose a method similar to that described in the EPRI Green Circuits: Distribution Efficiency Case Studies document. In accordance with EPRI Green Circuits, Idaho Power is aggregating AMI data on separate treatment transformers and comparing the data against a set of control transformers to produce CVR factors for each customer class and weather zone.
The validation study will look at the effects of CVR on Commercial (Tariff Rate Schedule 7 and/or 9S) and Residential (Tariff Rate Schedule 1) customers in each of six company-identified weather zones. One generic irrigation transformer was selected for the purpose of evaluating impacts on irrigation customers (Tariff Rate Schedule 24).
There are six weather zones identified as Boise, Twin Falls, Pocatello, McCall, Ontario, and Ketchum. One treatment transformer in each weather zone is being studied for each rate class. Where both rate classes can be studied with the same transformer, i.e. sufficient commercial and residential customers are located on a single transformer above the regulation point, the same transformer is used for both customer class analyses.
The general process for setting up the study is as follows:
1. Identify Treatment Transformers: Identify transformers on which CVR settings will be applied in a two-day on and two-day off protocol.
Labor $157,000
Material 82,000
Contingency 24,000
Total $263,000

Idaho Power Company 2015 Smart Grid Report
Public Document Page 13
2. Identify Control Transformers: Select a similar transformer in the same weather zone having sufficient residential, commercial, or irrigation customers above the line regulators on each associated feeder to act as a control for the treatment transformer customers.
3. For each Treatment and Control transformer pair, identify a selection of customers to be used in the analysis.
4. Capture hourly AMI data for each of the treatment and control customers and the hourly average transformer voltage to analyze along with the CVR on-off response. An appropriate regression model will be used to analyze the data based on the level of aggregation to be determined during analysis.
Table 1 CVR treatment and control transformers identified or selected for energy savings validation.
Treatment Control
Boise Commercial MRDN T-131 CDAL T-133
Residential MRDN T-131 MRDN T-132
Twin Falls Commercial TFSN T-134 TFSN T-133
Residential TFSN T-134 TFSN T-133
Pocatello Commercial ALMA T-132 POCO T-054
Residential ALMA T-132 POCO T-054
Ketchum Commercial KCHM T-132 HALY T-131
Residential KCHM T-132 EKHN T-132
McCall Commercial MCAL T-131 MCAL T-133
Residential MCAL T-131 MCAL T-133
Ontario Commercial CARO T-061 VALE T-061
Residential CARO T-061 (500) PAET T-132
Irrigation Irrigation PTVY_T131 PTVY_T-132
SCADA-controlled Load Tap Changer (LTC) controllers were installed on each treatment transformer so day-on/day-off commands could be performed remotely. This also allows the CVR settings to be turned off remotely should voltages fall below ANSI standards.
The energy savings validation will occur after the data-collection phase. Data collection is scheduled to finish March 2016 after which Idaho Power will analyze the data.
Edge of Network Grid Optimization (ENGO) Solid State Reactive Power Compensation Device use for improving the dynamic performance of CVR The ENGO-V10 provides dynamic voltage control to correct for low voltage conditions and provides fast variable voltage control on the low-voltage side of distribution transformers. The

2015 Smart Grid Report Idaho Power Company
Page 14 Public Document
devices include voltage monitoring, advanced analytics, diagnostics, and communications, providing visibility to the secondary side voltage profile. When low voltage levels are present, the unit detects and acts to help regulate the voltage by injecting up to 10 kVAR of reactive power in one kVAR increments into the circuit. Advanced algorithms assure that multiple units can be simultaneously deployed on a feeder, even when near each other, and they will act in a coordinated fashion. Testing at Idaho Power has shown that the unit can detect a low voltage event and inject reactive power into the circuit in just over a half cycle (eight milliseconds).
The units measure the raw voltage waveform, taking 32 samples per cycle. They report voltages every minute and provide measured minimum and maximum voltages along with an average voltage captured over the minute. The units communicate this information using a cellular network and automatically download readings in batch files approximately every two hours. The data can be retrieved via the ENGO Manager software; a web-hosted application developed by Varentec. A user can also command the ENGO units to communicate their real-time data at any time using ENGO Manager.
In collaboration with Varentec, Idaho Power has installed 65 ENGO devices on the TERY-012 feeder in Pocatello, Idaho. A SCADA-controlled LTC controller was installed on the TERY T131 transformer which supplies this feeder so day-on/day-off testing of CVR can be performed. This transformer was previously identified as a potential CVR transformer but the voltage drop was too great on feeder TERY-012 thus CVR was not deployed. If the ENGO units can successfully be used to raise the voltage on TERY-012, TERY T131 can qualify for CVR control.
The goal is two-fold:
1. Provide voltage support at points along the feeder that are modeled as voltage low points so that CVR can be applied, and
2. Determine if deploying such a large number of units on a single feeder can act to optimize the voltage on the feeder primary side (12.47 kV), thus improving the voltage profile along the entire feeder.
Data is presently being collected and different control routines are being applied as part of the testing. The following three figures show a voltage reading from an ENGO unit in the off condition (not injecting reactive power). The first bar chart (Figure 3) is a voltage histogram which indicates discrete voltage values and the percentage of time over the 24-hour period the device measured each value. Figure 4 is a kVAR histogram which indicates the number of kVAR the ENGO unit was injecting during the 24-hour period. The larger line graph (Figure 5) shows the voltage profile over the entire day. The dark blue line indicates the average voltage measured during each minute over the day and the lighter blue outline indicates the maximum and minimum voltages measured each minute.

Idaho Power Company 2015 Smart Grid Report
Public Document Page 15
Figure 3 ENGO unit measured voltage, no VAr injection, voltage histogram
Figure 4 ENGO unit measured voltage, no VAr injection, kVAR histogram

2015 Smart Grid Report Idaho Power Company
Page 16 Public Document
Figure 5 ENGO unit measured voltage, no VAr injection, voltage profile

Idaho Power Company 2015 Smart Grid Report
Public Document Page 17
The next three figures show data taken from the same ENGO unit on the following day, both days having similar and elevated temperatures. In all of these figures, the ENGO unit is on and injecting reactive power. Figures 6 and 7 are bar charts showing voltage and kVAR when the ENGO unit is on. In Figure 8, the yellow line indicates the ENGO unit’s voltage set point and the green line indicates the number of kVAR being injected into the circuit.
Figure 6 ENGO unit measured value, active VAr injection, voltage histogram
Figure 7 ENGO unit measured value, active VAr injection, kVAR histogram

2015 Smart Grid Report Idaho Power Company
Page 18 Public Document
Figure 8 ENGO unit measured value, active VAr injection, voltage profile
Close inspection of these charts shows the ENGO unit improved the voltage by approximately one to two volts and tightened the voltage band around the setpoint of 246 volts. Of particular interest is the voltage histograms, Figures 3 and 6, which indicates a significant improvement in the voltage profile when the ENGO unit was active. It must be noted that this is only a snapshot and a more complete data analysis will be performed to determine the effects on voltage and reactive power flow with emphasis on determining the effects on feeder primary voltage.

Idaho Power Company 2015 Smart Grid Report
Public Document Page 19
ENGO Solid State Reactive Power Compensation Device Pilot
In 2014, Idaho Power deployed 10 ENGO units on feeder PNUF-042 to evaluate their viability for voltage support on feeders with spot voltage problems in place of more expensive solutions such as reconductoring or installing small voltage regulators. Because this particular feeder experiences significant voltage flicker due to its length and rural nature, the units were also tested to determine if they could mitigate voltage flicker.
The results of the testing thus far show mixed results. On the one hand, the units do act to improve the voltage at the locations where they are installed. On the other hand, Idaho Power has not detected any ability for ENGO units to mitigate voltage flicker, though this was not something the units were designed for. Because of the desire to mitigate flicker, the units were left in place and more testing is currently being performed to determine if flicker mitigation can be realized via differing voltage set point commands to the ENGO units. The final report for this project is expected by early 2016.
The Estimated costs for the ENGO Pilot are: Labor $53,000
Material 34,000
Contingency 9,000
Total $96,000
The Expected Customer Benefits of the ENGO Pilot are: If successfully implemented, ENGO devices can flatten the voltage profile at customers’ premises and may be used to defer or replace more expensive methods for resolving voltage issues.
C. Customer Information and Demand-Side Management (DSM) Enhancements
Advanced Metering Infrastructure
In 2011, Idaho Power completed the installation of AMI hardware and software, a MDMS, a metering data warehouse, and approximately 500,000 digital AMI meters (including 18,000 meters in Oregon) for a total investment of $73 million. The AMI system is currently collecting hourly energy consumption data and daily kilowatt-hour (kWh) and kilowatt (kW) readings for all AMI meters deployed in Idaho and Oregon. The AMI system provides two-way communications to 99 percent of Idaho Power’s metered retail service locations (93 percent in Oregon). The remaining metered retail service locations did not meet Idaho Power’s business case requirements at the time the implementation plan was initiated in 2009. Idaho Power continues to manually read meters in these locations and periodically reevaluates the business case for installing AMI equipment in substations located in sparsely populated areas.

2015 Smart Grid Report Idaho Power Company
Page 20 Public Document
Idaho Power continues to leverage the AMI system for uses beyond consumption data collection. These additional uses include the following:
Outage Detection—If a meter stops communicating, a trouble order is issued.
Partial Power Detection—The phase voltages on all three-phase services are measured three times a day. If one of the phase voltages shows as missing, a trouble order is initiated.
System Voltage Reads—Voltage data is collected three times a day at all active three-phase services and other locations as requested by company planning or field engineers (currently 40,000 sites).
Select Load and Voltage Studies—In place of installing additional field monitoring devices, voltage and load information can be collected for specific service locations upon request.
Customer Load Control—The AMI system communicates commands to both the A/C Cool Credit and Irrigation Peak Rewards demand response (DR) programs.
Reverse Power Flow Detection—The AMI system detects unauthorized customer generation, attempted energy diversion activities, and metering installation errors.
Transformer Rated Meter Installation Verification—Operations periodically validates system current and voltage.
Investigations of Non-Communication Issues—These investigations have uncovered service issues including unintended distribution circuit field ties, distribution capacitor issues, distribution line regulator issues, overloaded circuits, and power quality issues.
Remote Connect/Disconnect—Beginning September 15, 2015, Idaho Power started using the AMI system capability of remotely connecting and disconnecting services in Idaho for customer move-ins and move-outs and also for customer nonpayment disconnects and reconnects. Idaho Power is investigating expanding this capability to Oregon customers in 2016.
myAccount
myAccount continues to be an effective engagement platform for Idaho Power’s customers. In the last 12 months, on average approximately 143,000 myAccount logins were registered each month. Customers can access very detailed account information including their hourly AMI data via idahopower.com, at their convenience, 24 hours a day, 7 days a week. myAccount enables customers to make informed choices about their energy use and provides information on how to use energy wisely. Additionally, customers can view their bill, make payments, and initiate online account transactions and inquiries.

Idaho Power Company 2015 Smart Grid Report
Public Document Page 21
In January of 2015, Idaho Power released a mobile version of idahopower.com which included many aspects of myAccount AMI information such as Daily and Hourly Usage and Next Estimated Bill (see Figures 9 through 13). Customer education on the mobile offering was a focus in the spring of 2015.
Figure 9 Mobile-adapted screen
Figure 10 myAccount mobile menu options

2015 Smart Grid Report Idaho Power Company
Page 22 Public Document
Figure 11 Mobile daily/hourly usage screen
Figure 12 Mobile next estimated bill screen
Idaho Power Company 2015 Smart Grid Report
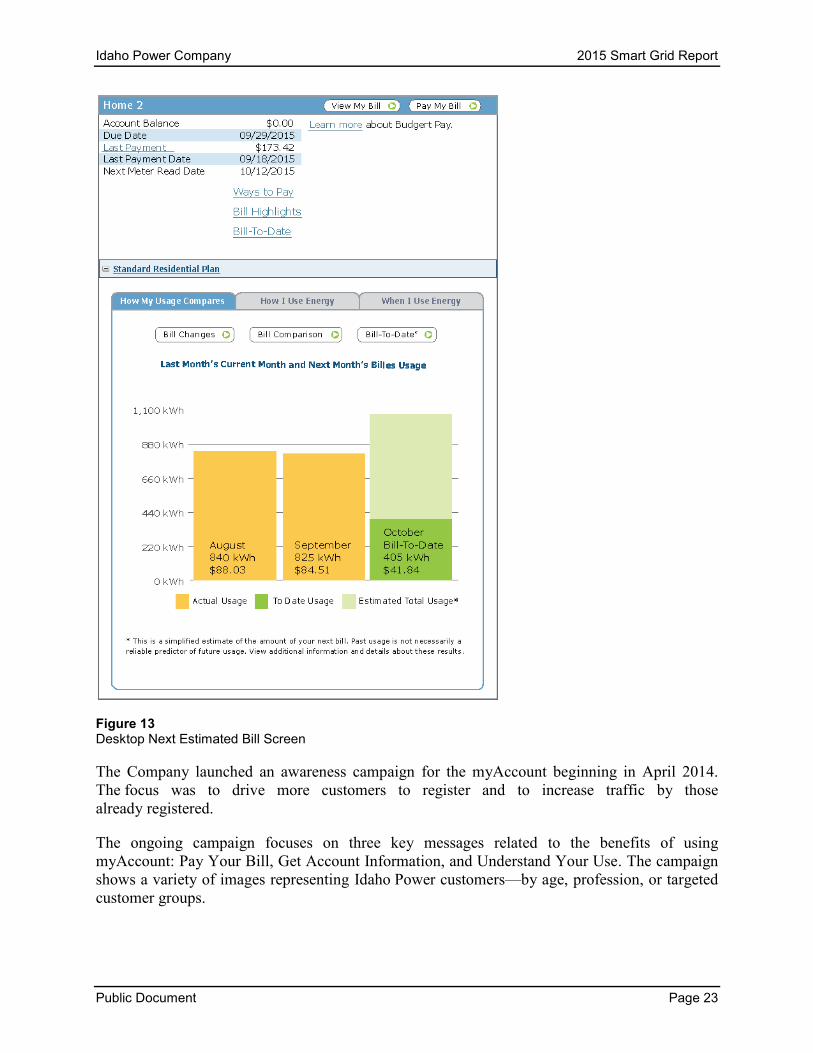
Public Document Page 23
Figure 13 Desktop Next Estimated Bill Screen
The Company launched an awareness campaign for the myAccount beginning in April 2014. The focus was to drive more customers to register and to increase traffic by those already registered.
The ongoing campaign focuses on three key messages related to the benefits of using myAccount: Pay Your Bill, Get Account Information, and Understand Your Use. The campaign shows a variety of images representing Idaho Power customers—by age, profession, or targeted customer groups.
2015 Smart Grid Report Idaho Power Company
Page 24 Public Document
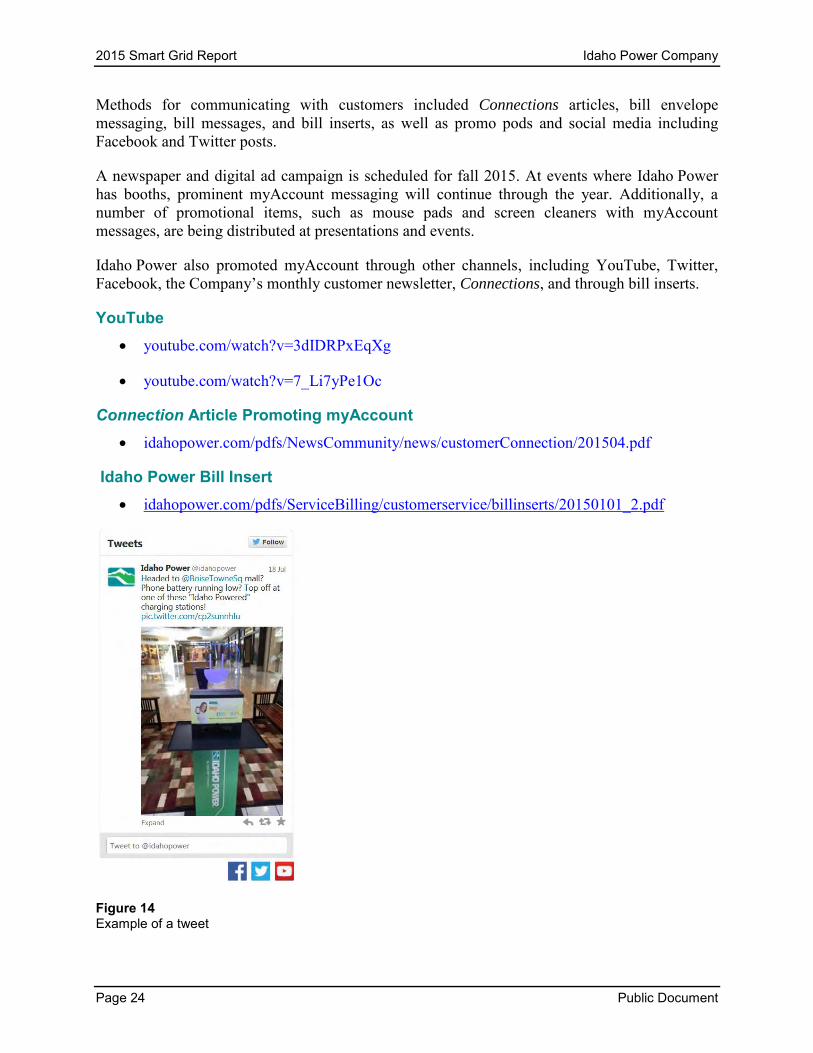
Methods for communicating with customers included Connections articles, bill envelope messaging, bill messages, and bill inserts, as well as promo pods and social media including Facebook and Twitter posts.
A newspaper and digital ad campaign is scheduled for fall 2015. At events where Idaho Power has booths, prominent myAccount messaging will continue through the year. Additionally, a number of promotional items, such as mouse pads and screen cleaners with myAccount messages, are being distributed at presentations and events.
Idaho Power also promoted myAccount through other channels, including YouTube, Twitter, Facebook, the Company’s monthly customer newsletter, Connections, and through bill inserts.
YouTube youtube.com/watch?v=3dIDRPxEqXg
youtube.com/watch?v=7_Li7yPe1Oc
Connection Article Promoting myAccount idahopower.com/pdfs/NewsCommunity/news/customerConnection/201504.pdf
Idaho Power Bill Insert idahopower.com/pdfs/ServiceBilling/customerservice/billinserts/20150101_2.pdf
Figure 14 Example of a tweet

Idaho Power Company 2015 Smart Grid Report
Public Document Page 25
Figure 15 Example of myAccount messaging at an event
Figure 16 Mobile next estimated bill screen
Direct Load Control
Idaho Power has offered optional direct load control, or DR, programs since 2004 to residential and irrigation customers, and to all of its customer segments since 2009. The Company has offered an air conditioning (A/C) cycling program, A/C Cool Credit; an irrigation direct load control program, Irrigation Peak Rewards; and a commercial/industrial DR program, FlexPeak Management. The A/C Cool Credit and Irrigation Peak Rewards programs use smart grid technology, more specifically the power line carrier (PLC) technology to activate load control devices installed on customer equipment. All three programs use the hourly load data made possible by AMI to help determine the load reduction achieved during a DR event and the Company uses the hourly data to reconcile customer payments for some Irrigation Peak Rewards and Flex Peak participant payments.
Irrigation Peak Rewards The Irrigation Peak Rewards program is a voluntary program (Oregon Schedule 23) available to agricultural irrigation customers. The purpose of the program is to serve as a peaking resource during times of extreme load on the Idaho Power system by turning off participants’ irrigation pumps with the use of one or more load control devices during the program season, June 15 through August 15. A control device attached to most of the participant’s individual pump electrical panels allows Idaho Power to remotely control the pumps.
During 2015, approximately 2,263 customer sites were enrolled in the Irrigation Peak Rewards program, of these 55 are located in Oregon. Irrigation Peak Rewards was used three times during the summer of 2015, on June 29, July 2, and August 11. Preliminary results indicate the program’s maximum peak reduction at generation level was approximately 325 MW.

2015 Smart Grid Report Idaho Power Company
Page 26 Public Document
Flex Peak The Flex Peak program is designed for Idaho Power’s industrial and large commercial customers who are capable of reducing their electrical energy loads for short periods of time during summer peak days. Idaho Power took over management of this program from a third party aggregator in the spring of 2015 (Oregon Schedule 76). Participants are notified of a demand reduction event two hours prior to the event and in most cases reductions are achieved by the participants manually turning off equipment or otherwise changing their operations. The program objective is to reduce the demand on Idaho Power’s system during periods of extreme peak electricity use.
Seventy-one participant sites were enrolled in the Flex Peak program in 2015. The Flex Peak program was also used three times during the summer of 2015, on June 30, July 21, and August 4. Preliminary results indicate the program’s maximum peak reductions at generation level was approximately 24 MW.
A/C Cool Credit The A/C Cool Credit program is a voluntary, dispatchable DR program (Oregon Schedule 74) for residential customers. Using communication hardware and software, Idaho Power cycles participants’ central A/C or heat pumps off and on via a direct load control device installed on the A/C or heat pump unit. Participants receive a monthly monetary incentive for participating in the program during the summer season.
Approximately 29,473 PLC controlled switches are installed on customers’ A/C or heat pump units in Idaho Power’s service area. Of these, 383 are installed in Oregon. These switches allow Idaho Power to cycle customers’ A/Cs or heat pumps during a cycling event. A/C Cool Credit was used three times during the summer of 2015 on June 30, July 21, and July 31. Preliminary results indicate the program’s maximum load reduction at generation level was 36 MW.
Irrigation Load Control (ILC) Pilot Idaho Power predominantly uses cell phone and web-based technology to enable the Company’s Irrigation Peak Rewards program. The objective of the ILC Pilot is to investigate using grid-enabled PLC communication to activate load control devices on agricultural irrigation service locations to turn off irrigation pumps during program events. As part of the American Reinvestment and Recovery Act Smart Grid Investment Grant (SGIG), Idaho Power began conducting a pilot using grid-enabled PLC communication that would provide a reduced cost and more secure environment for program communication. The Company currently has 130 AMI-enabled load control switches installed on participants’ service points. To use the load control switches, Idaho Power added a transformer to the switches and tested the communications to these devices.
In 2014, Idaho Power resolved a few installation issues and utilized the AMI-enabled technology successfully at the sites on which it was installed. Overall, Idaho Power has determined it is a viable method; the load control devices will work on irrigation installations and can be used in the Irrigation Peak Rewards program. In the future, Idaho Power will continue to evaluate the pros and cons for customers and the Company of moving to the grid-enabled PLC communication technology. This evaluation will focus on a cost-benefit evaluation of whether to fully move to this technology for the program or stay with the current cell phone technology.

Idaho Power Company 2015 Smart Grid Report
Public Document Page 27
Online Outage Map Proves Popular
Idaho Power’s online outage map is proving popular with customers and recording heavy traffic. The map launched April 28, 2015, for both mobile and desktop platforms, and provides the following information: general vicinity of the outage, number of customers affected, crew status and estimated time of restoration, if known. Appendix B attached is an internal PowerPoint presentation created for Idaho Power customer service employees during the launch of the tool.
On August 11, 2015, the map experienced its heaviest traffic to date. During that timeframe, there were several wildfires burning in the service area including the Soda Fire in Eastern Oregon that burned almost 280,000 acres. Almost 7,000 customers visited the map to get updates and information, with a near even split between desktop and mobile users.
The map is also pinned to the top of Idaho Power’s Facebook and Twitter pages, so it is the first post users see upon loading the page. Idaho Power developed this map application in house and will continue to upgrade the map with new features and information as they become available.
Figures 17 and 18 show how the map looks on the application and graphs outage map hits for August 2015, respectively.

2015 Smart Grid Report Idaho Power Company
Page 28 Public Document
Figure 17 Screenshot of Idaho Power’s online outage map

Idaho Power Company 2015 Smart Grid Report
Public Document Page 29
Figure 18 Outage map customer visits
New Online Tool Shows Resources Used for Electrical Generation
Idaho Power has created a new online tool to help customers understand how their electricity is generated. At idahopower.com/generationdemand, anyone can see an hourly breakdown of changes in customer demand and the different resources feeding energy into the grid. It is also a useful tool for employees to use when explaining how the Company’s fuel mix shifts to maintain a constant balance between energy being generated on the grid and energy being used.
Idaho Power’s electrical system must constantly balance customer load with the energy being generated or delivered to the system. Demand varies moment by moment. Every time someone flips on a light switch, turns on an irrigation pump, or shuts down a factory conveyor belt for the night, Idaho Power must meet those changing needs as they happen 24/7, 365 days a year. In addition, the grid has to integrate energy from intermittent resources such as wind and solar, where the output can change quickly.
A bar chart provides an overview of how hydro, natural gas, coal, and power purchased from other sources such as wind and geothermal combine to serve more than 520,000 Idaho Power customers across 24,000 square miles of the Company’s service area. Clicking on one of the hourly bars provides more detailed information, such as how close to capacity each resource was operating for that hour, and the percent of system output by generation resource. A snapshot of the tool is shown in Figure 19.

2015 Smart Grid Report Idaho Power Company
Page 30 Public Document
Figure 19 Hourly generation versus demand
D. Distributed Resource and Renewable Resource Enhancements
Renewable Integration Tool (RIT)
As reported in the 2014 Smart Grid Report, the Idaho Power SGIG helped fund the RIT project. The RIT project is intended as a set of tools to allow grid operators and power supply transaction specialists to effectively and reliably integrate variable renewable resources with traditional generation resources.
In 2014, the RIT was split into two tools: the Wind Forecast Tool and the Load Forecast Tool. Both tools are now operational and in use by system operators to manage the integration of energy from renewable sources. Interactive user forecast adjustments have been made that allow operators to manually adjust the real-time forecast to match the current state of the system and correct errors. Data gathering is occurring to determine if improvements in forecast accuracy can be obtained for a reasonable investment in additional tool development.

Idaho Power Company 2015 Smart Grid Report
Public Document Page 31
A number of additional enhancements to the original RIT are being considered or are currently under development. One of these is described in Section III.D.
Photovoltaic (PV) and Feeder Peak Demand Alignment Pilot
As discussed in last year’s report, Idaho Power has installed three solar-intensity monitoring stations along a distribution feeder to determine the impact of installing PV panels to maximize PV output with feeder peak demand. An update concerning this pilot project can be found in Section IV.
Renewable and Other Energy Contracts—Status Update
Idaho Power purchases wind and other renewable generation from both cogeneration and small power production (CSPP) and utility renewable energy power purchase agreement (PPA) resources. As of August 31, 2015, Idaho Power had contracts to purchase energy from 107 CSPP contracts with a nameplate capacity of 783 MW. As of August 31, 2015, Idaho Power has signed CSPP-related agreements in both Oregon and Idaho for the following renewable resource types as shown in Table 2.
Table 2 CSPP & PPA Renewable Generation Projects
On-line as of August 31, 2015
On-line during 2016
On-line during 2017
Totals
Resource Type Number
Nameplate Capacity
(MW)
Number Nameplate Capacity
(MW)
Number Nameplate Capacity
(MW)
Number Nameplate Capacity
(MW)
Biomass 10 29
- -
- -
10 29 CoGen 1 16
- -
- -
1 16
Geothermal 2 35
- -
- -
2 35 Hydro 66 145
2 1
2 9
70 155
Solar - -
15 320
- -
15 320 Thermal 3 15
- -
- -
3 15
Wind 28 678
5 50
- -
33 728 Totals 110 918
22 371
2 9
134 1,299
Note: Because Idaho Power sells (or does not own) the renewable energy certificates or “green tags” associated with certain projects in its resource portfolio, and uses the proceeds to benefit customers, the Company is not permitted to say that renewable energy from those projects is delivered to customers.
Net Metering—Status Update
As of August 31, 2015, Idaho Power’s net metering service consisted of 644 active systems, with applications pending for an additional 61 systems. Cumulative nameplate capacity from active systems totaled 4.51 MW, with an additional 0.80 MW associated with pending applications, for a grand total of 5.32 MW. The majority of net metering systems are solar PV at 4.74 MW, followed by wind at 0.43 MW, and small hydro/other at 0.15 MW.
Tables 3 and 4 provide the total number of active and pending net metering systems and nameplate capacity by resource type, jurisdiction, and customer class.

2015 Smart Grid Report Idaho Power Company
Page 32 Public Document
Table 3 Number of net metering systems—pending and active as of August 31, 2015
Solar PV Wind Hydro/Other Total
Idaho
Residential 511 57 6 574 Commercial and Industrial 96 6 4 106 Irrigation 2 1 - 3
Total Idaho 609 64 10 683 Oregon
Residential 9 2 - 11 Commercial and Industrial 8 - - 8 Irrigation 4 - - 4
Total Oregon 21 2 - 23 Total company
Residential 520 59 6 585 Commercial and Industrial 104 6 4 114 Irrigation 5 1 - 6
Total company 629 66 10 705
Table 4 Nameplate capacity (MW)—pending and active as of August 31, 2015
Solar PV Wind Hydro/Other Total
Idaho
Residential 2.52 0.33 0.06 2.91 Commercial and Industrial 1.62 0.05 0.09 1.76 Irrigation 0.09 0.04 - 0.13
Total Idaho 4.23 0.42 0.15 4.81 Oregon
Residential 0.04 0.00 - 0.04 Commercial and Industrial 0.15 - - 0.15 Irrigation 0.31 - - 0.31
Total Oregon 0.50 0.00 - 0.51 Total company
Residential 2.56 0.33 0.06 2.95 Commercial and Industrial 1.78 0.05 0.09 1.92 Irrigation 0.41 0.04 - 0.45
Total company 4.74 0.43 0.15 5.32

Idaho Power Company 2015 Smart Grid Report
Public Document Page 33
In terms of growth, Idaho Power’s net metering service continues to expand. The figure below details cumulative active net metering system counts from 2002 to year-to-date August 31, 2015.
Figure 20 Cumulative Net Metering System Counts 2002 to year-to-date August 31, 2015.
The figure below details cumulative installed net metering capacity growth from 2002 to year-to-date August 31, 2015.
Figure 21 Cumulative installed net metering capacity 2002 to year-to-date August 31, 2015 (MW)
0
100
200
300
400
500
600
700
2002 2003 2004 2005 2006 2007 2008 2009 2010 2011 2012 2013 2014 2015
Cumulative Net Metering System Counts (2002-2015 YTD)
-
0.500
1.000
1.500
2.000
2.500
3.000
3.500
4.000
4.500
5.000
2002 2003 2004 2005 2006 2007 2008 2009 2010 2011 2012 2013 2014 2015
Cumulative Installed Net Metering Capacity 2002 to 2015 YTD (MW)
2015 Smart Grid Report Idaho Power Company
Page 34 Public Document
The rapid growth in net metering service since 2002 demonstrates how the Company’s grid is evolving to meet customers’ desires to generate some or all of their electrical consumption, and underscores the importance of ongoing evaluation of the associated service provisions and pricing to ensure that Idaho Power continues to offer safe, reliable, and fair-priced electrical service to all customers.
E. General Business Enhancements
Idaho Power Enterprise Data Warehouse (EDW)
The EDW provides an analytic database to store customer and meter data. The EDW supports the Company’s analytical and reporting needs by providing a location combining information from both legacy and current customer information systems. It also ensures that reporting activities do not adversely impact performance on the metering, MDMS, and Customer Relationship and Billing (CR&B) source systems.
The first phase of this project was completed in November 2011 and included collecting, organizing, and providing meter data for reporting and analysis. The second phase combines customer data extracted from the CR&B system, as well as the legacy customer information system (CIS+), for reporting and analysis. This phase began with the implementation of CR&B on September 1, 2013. In December 2013, DSM information was added to the EDW. In June 2014, access to basic customer information for approved users was enabled. Additional releases of EDW in 2015 include customer interaction records and records of customer charges and payments.
Idaho Power currently has daily and hourly energy-use data stored for all AMI metered service points. Basic customer information from CR&B is stored in the EDW. The EDW has enabled the following:
Customer viewing of their energy use via myAccount
Available data for internal load analysis and development of broader system analysis capabilities
Energy-use data available to internal functions with approved business access
Basic customer information available for viewing through a portal for employees with approved business access
Ad-hoc access granted to authorized employees for approved business access
Enhanced financial reporting
Meter Data Management System (MDMS) Upgrade
The Itron Enterprise Edition (IEE) MDMS receives data from the AMI system, ensures the accuracy and integrity of the data, and processes the data to the CR&B system and the EDW. The upgraded system went live on June 17, 2015.

Idaho Power Company 2015 Smart Grid Report
Public Document Page 35
Upgrading the current version of IEE from 7.0 to 8.1 will comply with Idaho Power’s Enterprise Technology Advisory Board technology roadmap that seeks to achieve a sustainable technology portfolio capable of meeting the requirements of Idaho Power. Idaho Power will also take advantage of previously paid software maintenance fees that permit software upgrades without additional licensing costs. Software upgrades will ensure appropriate vendor support and increase potential customer billing and pricing options.
III. FUTURE SMART GRID INVESTMENTS This section describes smart grid investments to be undertaken over the next five years (including pilots and testing). As stated previously, in addition to meeting reporting requirements, this section serves as a high-level strategic document for Idaho Power to plan its future smart grid projects. As such, the format of this section is different from the other sections in this report. The description for each of the following projects is laid out in the following format:
1. Present: What Idaho Power’s present system looks like with regard to the individual project described.
2. Objective: What the objective is of the individual project described.
3. Pilot or Project Description: A description of the proposed or existing pilot or project.
4. Benefit: How the investment will reduce costs, improve customer service, improve reliability, facilitate demand-side and renewable resources, or provide other system benefits.
A. Transmission Network and Operations Enhancements
Transmission Situational Awareness Grid Operator’s Monitoring and Control Assistant
Present Idaho Power system operators rely on day-ahead power flow analysis and some real-time analysis tools to manage the grid.
Objective The goal of this project is to advance grid reliability by improving the quality and use of the synchrophasor data received from more than 584 PMUs installed throughout the western interconnection by participating utilities by developing an application to manage the grid.
Pilot or Project Description Idaho Power, Southern California Edison, Peak Reliability, California Independent System Operator, Bonneville Power Administration, San Diego Gas and Electric, and V&R Energy have
2015 Smart Grid Report Idaho Power Company
Page 36 Public Document
received a U.S. Department of Energy research and demonstration grant for a new synchrophasor-based software application “Grid Operator’s Monitoring & Control Assistant.” See Appendix C for Peak Reliability’s project plan. The funding matches dollars committed by the seven participants to extend and deploy synchrophasor technologies. Peak Reliability will use the grant to improve the quality and use of the synchrophasor data it receives from the PMUs referenced above.
The proposed software application will consist of the following major components:
1. Use of Linear State Estimator (LSE) for the following purposes:
Validating the results of conventional model-based SE
Determining the observability of the network in terms of voltage stability
Utilizing cases created by LSE for voltage stability analysis
2. Automatic computation of advisory optimal corrective actions for voltage stability preservation.
3. Computing phase angle difference limits in real-time using a new methodology for line/path stressing based on maximized loading of transmission lines/paths.
4. Displaying easy-to-understand visualization of synchrophasor data, voltage stability analysis results, and optimal corrective actions on a custom-built situational awareness wall.
V&R Energy will perform a demonstration of the software tool. Idaho Power will prepare and provide data to V&R Energy, respond to the data-related questions, review and provide feedback on the functionalities of the tool, test the software tool in-house, and attend required meetings and training sessions on the software application.
Benefit The software will validate the SE, perform computation of corrective actions to maintain voltage stability, compute phase angle difference limits, and provide operator visualization of synchrophasor data. The software will provide visibility in between snapshots of the SE and also during those critical times when the SE solution is not available. The overall goal of the project is to improve grid reliability.
Power System Engineering Research Center (PSERC)
In addition to the future projects described above, Idaho Power intends to participate in PSERC—an Industry-University Cooperative Research Center, drawing on university capabilities to creatively address the challenges facing the electric power industry. It conducts research for innovative solutions to these challenges using multidisciplinary research expertise in a multi-campus work environment and facilitates the interchange of ideas and collaboration

Idaho Power Company 2015 Smart Grid Report
Public Document Page 37
among academia, industry, and government which also helps educate the next generation of power system engineers.
The first of these projects will work on developing standard tools for certification, commissioning, in-service maintenance, and risk assessment of critical systems.
Typical examples are the deployment of synchrophasor-based Wide Area Protection, Monitoring and Control (WAMPAC) and Special Protection Systems (SPS).
Project Benefits Critical systems are introduced to improve monitoring, control, and protection performance and hence are expected to operate correctly each and every time they are called upon. The nature of such designs is that they are complex and widely distributed. A possibility that the system components have some hidden failures or do not meet certain standards is real, particularly when the system is initially commissioned or after the system has been in service for a long time. Having a rigorous procedure and adequate tools to test different aspects of the hardware and software design, from the component to the overall system level, is the only way to assure more robust and reliable operation of the critical systems. This project addresses the criteria for robust and reliable operation and offers solutions in terms of both the methodology and practical tools to perform required testing and evaluation.
Expected Outcomes The outcome will be delivery of several testing and evaluation tools that otherwise are not readily available on the market today:
Testing and certification lab for device and system testing of synchrophasor systems that can also be adapted to test SPS and Emergency Management System (EMS) critical applications remotely. The lab will meet the widely accepted International Organization for Standardization/International Electrotechnical Commission (ISO/IEC) 17025 and ISO/IEC Guide 65 (recently revised as ISO 17065:2012) international standards for testing-laboratory and certification-body management systems respectively. This will complement recent efforts by the National Institute of Standards & Technology (NIST) and the Institute of Electrical and Electronics Engineers (IEEE) to make the certification process readily available to the industry by providing certification labs at all participating schools, and at any other organization interested in replicating the tools and test procedures. Testing lab can also be used with Erkios middleware architecture for remote testing of synchrophasors device testing.
Testing and certification equipment and protocols for commissioning critical systems supplemented with a wide array of hardware and software tools that will allow both substation measurement equipment (Intelligent Electronic devices (IEDs)) and system-wide solutions to be deployed and verified in the field before the production use. This set of tools will also contain operator-aimed displays that will convey the stages of the tests and will provide an assurance that the tests are performed comprehensively and successfully.

2015 Smart Grid Report Idaho Power Company
Page 38 Public Document
Calibration and field-testing equipment for in-service maintenance over life-cycle of the critical system operation providing assessment of the deterioration of the Quality of Service (QoS) performance and automated triggers when such situation occurs to alert the personnel to engage in system calibration and performance verification. Newly developed distributed (substation-based) dynamic state estimation with an ability to compare measurements to detailed device/system models each data scan cycle will be used to implement the mentioned tools.
Software tools to enable remote testing and detection of failures in the devices and related data management architecture will be developed. Developed software tools can be automatically triggered or executed on demand and will collect data for remote testing. It will also support automated assessment of the hidden failure presence, and will offer a methodology for correction of such failures in a timely manner. The solution will include online analysis of input data stream to spot any deviations in the measured data that may lead to conclusion about potential system malfunctioning.
Visualization tools that are able to track the QoS state of critical systems and inform operators about deterioration modes. The visualization capability will not only alert the operators about possible QoS issues but also help the maintenance crew to identify the causes of problems and develop a quick strategy for maintaining and repairing the system. The visualization approach will also allow operators and other interested parties to understand the risks of operating the system based on the findings facilitated by the other tools mentioned above.
Potential Applications The tools will be demonstrated on synchrophasor WAMPAC solutions, but the test protocols and equipment/software will be made available in a modular design that can be utilized for full evaluation and testing of any critical systems including SPS and EMS. Three test environments will be created that emulate the following:
Synchrophasor system
EMS/SCADA
SPS for a given application
Each test environment will be used to demonstrate how the developed tools may be applied and what the benefits are. Some of the test environments, such as the synchrophasor test environment, may be installed across several universities by providing measurement equipment in one location and data concentrators and/or visualization displays at other locations. This way the test environment will resemble actual system displacement where the measurement equipment may be in substations, data concentrators in a control center, and displays at Independent System Operators and/or transmission operators, and everything is connected through a communication network.
A second project will be chosen from the ones listed below following an evaluation and discussion period with the project team members.

Idaho Power Company 2015 Smart Grid Report
Public Document Page 39
Monitoring and Maintaining Limits of Area Transfers with PMUs This project will develop practical methods based on PMUs to detect and act on conditions in which transfer of power through areas of the power system should be curtailed to satisfy thermal line limits and small signal stability limits. Closed loop controls for robust stability will also be developed. The larger objective is to combine measurements with physical network models to turn PMU data into actionable advice for operators to improve the management of bulk power transfers and control instabilities.
Real-Time Synchrophasor Measurements Based Voltage Stability Monitoring and Control This project will attempt to improve the situational awareness of the power grid by assessing the short-term and long-term voltage stability in real-time using synchrophasor measurements. These methods have been validated on standard IEEE test cases and their performance on a real system (~ 10,000 buses) will be studied. The analysis will provide insights on the effective locations for short-term monitoring and efficient control strategies. The long-term voltage stability assessment using a reduced local network for a given limited number of PMUs will be developed. These algorithms will be integrated and implemented on a real-time test environment for validation and to anticipate issues in actual implementation.
B. Substation and Distribution Network and Operations Enhancements
Substation Fiber-Based Protection and Control Pilot
Present Present technology and practices require numerous multi-conductor copper cables to connect pieces of substation yard equipment to the control building for protection and control. These copper control cables represent a significant percentage of the overall cost of a new substation.
Objective Newly built Idaho Power substations would use fiber optics in lieu of copper wires to connect pieces of substation yard equipment to the control building for protection and control.
Pilot or Project Description Idaho Power, Schweitzer Engineering Laboratories, and Alcatel-Lucent are currently developing the digital equipment needed to implement a highly reliable substation fiber optic network. The pilot project will install a system in 2015 that parallels an existing substation protection and control system to demonstrate the reliability and viability of this technology. The fiber optic-based protection and control demonstration project at Hemingway substation is progressing. The conceptual design is complete and the various components have been selected. Schweitzer Engineering Laboratories is presently building the yard cabinets and control racks that will be used for this project. Construction is anticipated to be complete in the fourth quarter of 2015 with the fiber optic cable, yard cabinets, and control rack installation. Data collection will occur for one year after construction. This project will not only demonstrate the protection and control

2015 Smart Grid Report Idaho Power Company
Page 40 Public Document
over fiber optic concepts, but will implement very accurate time distribution over a highly reliable fiber optic network—a necessary development for this standards-based approach to proceed.
Benefit Once demonstrated, not only will this technology potentially reduce costs for Idaho Power and its customers in future installations by decreasing the amount of copper wire installed, but it could prompt industry-wide adoption of this approach.
Automated Volt/VAr Management System (VVMS) Pilot
Present Idaho Power currently operates an Automated Capacitor Control (ACC) system that effectively controls reactive power flow (Volt-Ampere reactive power or VAr) at substation transformers by controlling distribution feeder capacitor banks. In place since the late 1990s, the ACC system is installed at 76 Idaho Power distribution substations. It uses one-way radio communications to command capacitor banks on and off with the goal to be near unity power factor at the substation transformer at all times with a slightly leading power factor at heavy load and a slightly lagging power factor at light load. Control is performed via computers at each substation; the system is not currently centrally controlled.
As effective as the system has been, the aging ACC system components are beginning to fail leading to a system that is progressively less reliable. Direct replacement of the components is difficult because many are obsolete and no longer vendor-supported. Additionally, the present system is not suited to future growth.
Objective Idaho Power’s distribution system would have fully automated capacitor banks communicating two ways with a centralized control system. The capacitor banks would be controlled via a dedicated VVMS. The VVMS would monitor reactive power flow at the distribution substation level and would maintain near unity power factor (at the substation) in order to support the reactive power requirements of the bulk electrical system. Additionally, voltage would be monitored along distribution feeders and capacitor banks would be switched on and off in a coordinated fashion to maintain adequate voltage level to customers while maintaining adequate reactive power flow.
New solid state reactive compensation devices may be installed on the customer side of service transformers to provide voltage support in areas where low voltage exists. Additionally, new solid state voltage regulators could also be placed on the customer side of service transformers that would be able to both buck (decrease) and boost (increase) voltage levels in response to voltage variations caused by customer-owned distributed generation devices.
The entire VVMS would operate to smooth voltage variations along a distribution feeder caused by variable and intermittent distributed generation sources at customer sites.

Idaho Power Company 2015 Smart Grid Report
Public Document Page 41
Pilot or Project Description Beginning in 2016, Idaho Power will pilot a new vendor-supported VVMS combined with bi-directional communications to replace the existing ACC system. The VVMS will control distribution substation transformer LTCs, line regulators, and distribution capacitor banks. Because of the speed at which VVMS systems are improving in the utility industry, Idaho Power decided to defer the pilot project to at least 2016 to allow the vendor-supported VVMS platforms to mature and also give Idaho Power the opportunity to determine a general Volt-VAr management strategy that can be applied across the distribution system.
Benefit To provide customers with adequate voltage to operate their devices, it is important to control reactive power flow and voltage on feeders. Utilities have traditionally done this by manually switching capacitor banks on and off seasonally and installing voltage regulators at strategic locations along distribution feeders. More recent technology allows utilities to automate and communicate with the capacitor bank switching and voltage regulator controls thus flattening the voltage profile along the feeders. This communication and automation will provide Idaho Power the ability to more efficiently integrate small distribution system-based generating customers.
Distribution System Communications Strategy
Present Idaho Power currently communicates with a diverse group of distribution system devices using a variety of communications systems that include licensed radio frequencies, public unlicensed radio frequencies, telecommunication company landlines, cellular systems, and PLC. The communication system used is evaluated based on the control or data requirements for the various distribution system devices. The need for security, bandwidth, reliability, coverage, latency, survivability, and interoperability dictates which communication system most cost-effectively fits the need.
For example, Idaho Power currently communicates with the capacitor banks associated with the ACC program using one-way radio communications. As this program shifts into a more robust automated VVMS, two-way communications will become necessary.
Objective One example of how Idaho Power can execute this communications strategy is to test the AMI system to determine if it has the capability to perform simple command and control functions on distribution capacitor banks.
Pilot or Project Description Idaho Power is in the early stages of feasibility testing of the automated control of distribution capacitor banks using the AMI System.
Benefit Using Idaho Power’s AMI system to communicate with distribution capacitor banks could provide a robust communications solution that is more resistant to obsolescence than the present system. Using a communications system that is already installed everywhere Idaho Power has

2015 Smart Grid Report Idaho Power Company
Page 42 Public Document
AMI would provide control of distribution capacitor banks without the need to install additional communications equipment in substations.
Replace the Existing Outage Management System (OMS)
Present Idaho Power’s existing OMS is aging and is no longer supported by the original vendor. In 2010, Idaho Power began the effort to select a vendor and implement a new OMS. The project was progressing until early 2012 when critical Idaho Power resources assigned to the OMS project were needed to support the higher priority CR&B project. In the fall of 2012, Idaho Power suspended the OMS project but reinitiated it in late 2014. The focus in 2015 has been selecting and contracting with a vendor to provide the desired OMS capability. The design phase of the project began in August 2015.
Objective Idaho Power requires an OMS that can integrate into existing control and operating software platforms and that can be used with Idaho Power’s geographical information and mobile workforce management systems. The OMS would be used primarily to efficiently and accurately capture customer outage information that would be used for coordinating restoration work and reporting activities.
The Company desires the OMS to enable a direct interface to Idaho Power’s meters to validate outage scope and restoration. Through the OMS application, OMS operators will query specific meters in suspected outage areas. The OMS application will provide outage data presentation through direct communications with AMI meters, verify the scope of customer-reported outages, and provide confirmation of power restoration. Additionally, Smart Grid Monitoring (SGM) System devices (described in the Implement Additional AMI Outage Scoping and Restoration Confirmation Functionality project below) may be used for more timely notice of outages. Verification of an outage prior to dispatching resources to restore service will allow the restoration crew to be more efficient in terms of customer restoration times, and confirming restoration will eliminate the chance of restoration crews leaving the area before service is restored to all customers.
Pilot or Project Description This project will develop the requirements and operational characteristics of a new OMS. This project is planned to be accomplished in two primary phases: (1) Vendor Selection and Design and (2) Implementation. The vendor selection and the design phase is to be completed in 2015 followed by the implementation phase in 2016. Completion of the project is forecasted to be in the fourth quarter of 2016.
Benefit A new OMS platform will aid in customer service restoration after power system interruption events. It will allow more efficient use of restoration crews thereby increasing customer satisfaction and decreasing costs.

Idaho Power Company 2015 Smart Grid Report
Public Document Page 43
Implementation of Automated Connect/Disconnect Capability at Selected Locations through the AMI System
Present Idaho Power’s AMI project that concluded in 2011 did not include the installation of remote controlled connect/disconnect switches. At that time, Idaho Power was not able to justify the cost of installing these switches at all metering points on its distribution system. Company representatives continued to physically visit customer service locations to manually connect and disconnect services as needed.
Objective Idaho Power has always recognized the capability of the AMI system to remotely control service connect/disconnect switches. After the initial AMI installation, the Company analyzed the costs and benefits of installing AMI controlled service connect/disconnect switches at a select number of locations. The Company believes that the capital costs are more than offset by eliminating manual connects/disconnects at locations that have multiple visits to manually connect or disconnect service each year.
Pilot or Project Description Approximately 14,500 residential service locations in Idaho Power’s total service area (approximately 772 in Oregon) have multiple actual connect/disconnect events each year. The Company has replaced the current meters at these locations with new meters equipped with remotely controlled connect/disconnect switches via the AMI system. Meters removed from service are being used for new business and maintenance activities, reducing the need to purchase additional standard AMI meters. Idaho Power has recently implemented remote connect/disconnect functionality in its Idaho service area effective September 15, 2015. However, Idaho Power has not yet implemented this functionality in its Oregon service area because additional work is needed to comply with OAR 860-021-0405(9)(b)(B). A team focused on implementing remote connect/disconnect in the Oregon service area will begin in the fourth quarter of 2015. Idaho Power will keep Commission staff apprised of its progress and will ensure staff is fully informed before proceeding with implementing this functionality.
Below is a list of project milestones:
1. Began installing remote connect/disconnect AMI meters, April 21, 2014
2. Completed installations of remote connect/disconnect AMI meters, December 31, 2014
3. Held stakeholder meetings and obtained necessary regulatory approvals for the process changes required to implement automated connect/disconnect capability in Idaho, February 17, 2015
4. Implemented the necessary information technology system configuration to support the connect/disconnect process in Idaho, September 1, 2015
5. Implemented the automated connect/disconnect process in Idaho, September 15, 2015
2015 Smart Grid Report Idaho Power Company
Page 44 Public Document
6. Develop a project plan to implement remote connect/disconnect functionality in Oregon by December 31, 2015.
Benefit By installing this technology as described, Idaho Power expects to realize the following benefits:
1. Reduce the annual cost of connecting and disconnecting services
2. Improve customer service by consistently completing the connect/disconnect function in a more timely manner
3. Remove a potential safety risk for employees traveling to customer locations, accessing service locations, and removing and installing energized meters as is currently done for manual connect/disconnect activities
4. Reduce the environmental impact of driving hundreds of thousands of miles each year to perform this function manually
5. Gain experience with this capability and establish a foundation for evaluating the possibility of offering a prepaid service option for customers at some future date
Implement Additional AMI Outage Scoping and Restoration Confirmation Functionality
Present Formerly known as the Sentry System, Idaho Power has implemented an SGM system that monitors system reliability. The SGM system has approximately 1,400 monitored sites that record momentary and sustained outage activity. At present sustained outage notification from the SGM system is fed directly into Idaho Power’s OMS which notifies operators when a sustained outage is detected. Once aware of the outage, the OMS operators can request a manual query of AMI meters in the affected area to more precisely identify the location of the outage.
In 2013, Idaho Power tested AMI integration with the SGM system and found that the systems can exchange sufficient data to provide the OMS with outage information related to event origination and tracking of outage restoration activity.
Objective Idaho Power desires to more fully automate outage locating through the use of technology. The SGM system used in conjunction with the AMI system can quickly and accurately locate outages on the distribution system to improve system outage restoration efforts.
Pilot or Project Description This project will develop an interface to allow the SGM system to identify a list of meters to be interrogated based on known system outages and/or restorations. The project will then enable the AMI system to interrogate the meters identified by the SGM system and inform the OMS of any

Idaho Power Company 2015 Smart Grid Report
Public Document Page 45
meters that remain in an outage condition. This will limit the need for manual query for outage scoping.
This work has been included within the scope, cost, and schedule of the OMS replacement project. The completion of the project is forecasted to be in the fourth quarter of 2016.
Benefit The main benefit will be improvement in system outage restoration performance. Additionally, this would allow Idaho Power to utilize momentary outages to locate open fuses if fuse saving is being implemented, or could be implemented, in areas to improve the System Average Interruption Frequency Index. Currently, if a fuse tap is in an outage condition, Idaho Power relies on customer notification of the outage to begin restoration activities.
Solar End-of-Feeder Project
In addition to the projects identified above, Idaho Power plans to pursue a small-scale proof-of-concept photovoltaic (PV) and battery system pilot project which is being considered for feeders with low voltage near the end of the feeder. The purpose of the pilot project is to evaluate its operational performance and its cost-effectiveness. The system will be designed to maintain the feeder voltage within +/- 5 percent of nominal voltage (ANSI C84.1) and be cost competitive with other options. During 2015 and 2016, the physical and economic feasibility will be examined. If feasible, a pilot system will be constructed and monitored. The results of the work will be reported in future smart grid reports and the 2017 Integrated Resource Plan (IRP).
C. Customer Information and Demand-Side Management Enhancements
Customer Relationship Management (CRM)
Present Idaho Power seeks to enhance current internal marketing applications and processes to increase its ability to effectively provide analytics, reporting, and information for communication efforts both within the Company and to external channels.
Objective The objective of incorporating a single CRM system, integrated with the CR&B system, will allow Idaho Power to manage and track customer interactions related to energy efficiency and other customer relations activities with the ultimate goal of increasing the effectiveness of Idaho Power’s program and service offerings.
Pilot or Project Description Using the CRM capabilities of the CR&B system, the CRM application will retrieve data from a variety of data sources (meter usage data, customer data, demographics, program data, etc.). The software will provide the ability to query and report both formally and on an ad hoc basis.

2015 Smart Grid Report Idaho Power Company
Page 46 Public Document
Customer preference management (opt-out, marketing frequency, topic choice, etc.) will also be a component of the system.
Benefit The information will allow Idaho Power to better market its customer programs and service offerings. Systematically using various sources of data to reach customers should result in reduced printing and postage costs through more effective customer segmentation and targeted marketing. The information will aid the Company to reach customers more efficiently through the gradual shift to electronic channels, such as email.
Integrated Demand Response Resource Control
Present Idaho Power manages three DR programs as described in Section II of this report. The dispatch associated with each program is unique to the program and requires various steps by generation dispatch employees utilizing multiple systems.
Objective An opportunity exists to increase operator visibility to programs and gain efficiencies when dispatching DR programs during events.
Pilot or Project Description The project would include a review of the potential to electronically tie each DR program’s dispatch software into one software interface. If it is determined that electronically connecting the systems into one software interface is possible, then development of criteria for a customized front-end screen would take place. Functionality would also include the ability to manage individual customer opt-outs by event.
Benefit A single-interface dispatch solution would create efficiencies for dispatch employee training and knowledge through one system rather than three. It can also provide an environment where it is less likely for incorrect program dispatch to take place which can have direct impact on customer satisfaction with the programs.
Ice-Based Thermal Energy Storage (TES)
Present Idaho Power, in its 2015 IRP, proposes a pilot project to investigate the costs and benefits of using ice-based TES.
Objective The objective of this pilot is to investigate costs and benefits of using TES on a customer facility.

Idaho Power Company 2015 Smart Grid Report
Public Document Page 47
Pilot or Project Description Ice-based TES systems are distributed capacity—providing resources that shift peak-hour A/C load to off-peak periods. The load shifting occurs because the ice-based TES systems create ice during overnight hours, and then use the stored ice in place of energy-intensive compressor units to provide cooling for A/C systems during peak-demand hours.
The initial phase of the pilot project will involve soliciting customer interest for the installation of an ice-based TES system, designing the system, and preparing a detailed cost estimate. Based on deployments elsewhere, the typical customer for an ice-based TES system is from the commercial sector. The pilot project’s second phase will involve purchasing and installing the equipment, followed by data collection to determine the effectiveness of the concept in the Idaho Power service area.
Benefit Load is shifted from peak periods to off-peak periods because the TES system makes ice overnight during the off-peak period and is then used in place of A/C systems to operate during peak periods. Also, the TES system is reportedly a near-zero net energy process meaning energy savings realized because of cooler overnight temperatures during the ice-making stage of the cycle are large enough to offset energy losses occurring as part of the energy storage process.
D. Distributed Resource and Renewable Resource Enhancements
Renewable Integration Tool—Current Project Developments
Present The Idaho Power SGIG helped fund the RIT project. The RIT project was intended to develop tools to allow grid operators to more efficiently and reliably integrate variable renewable resources with traditional generation resources.
In 2014, the RIT was split into two tools: the Wind Forecast Tool and the Load Forecast Tool. Both of these are now operational and are providing benefit to the grid operators. However, with the increased interest in interconnecting solar generation resources, the lack of a solar forecast tool has been noted. During 2015, Idaho Power will develop a solar forecast tool for use starting in 2016.
Objective Develop a solar forecast tool to help grid operators more effectively integrate energy from an increasing number of intermittent solar generators interconnected with the Idaho Power system.
Pilot or Project Description A project is in progress to develop similar forecasting capabilities that are offered by the Wind Forecast Tool for solar generation resources. Proliferation of distributed solar generation resources is expected to increase significantly over the next five to 10 years. The solar forecast

2015 Smart Grid Report Idaho Power Company
Page 48 Public Document
tool is expected to facilitate the reliable integration of these resources by grid operators. The first edition of the solar forecast tool will be operational early in 2016. Once in service, ongoing data gathering and analysis will determine the maturity of the tool and identify future opportunities.
Benefit A fully functional suite of RITs will allow grid operators to more efficiently and reliably integrate variable renewable resources with traditional generation resources.
E. General Business Enhancements
The Mobile Workforce Management System Upgrade
Present Since 2007, Idaho Power has been using CGI Group’s (CGI) PragmaCad mobile workforce management system. This system is integrated with several other major systems necessary to automate and support field service personnel. The version of PragmaCad in operation at the Company is several years old, and although still supported by CGI, it is multiple versions behind the latest release supplied by CGI. The latest release has increased functionality that will improve the efficiency of field personnel.
Objective Upgrade the existing version of PragmaCad to the latest version to maintain vendor support and realize the benefits of increased functionality that will improve the efficiency of field personnel.
Pilot or Project Description Idaho Power’s plans to upgrade the existing version of PragmaCad in 2015 have changed. Transitioning from the existing version to CGI’s current release is more than a simple upgrade because new integrations are required. One of the major integrations is with the OMS system which, as stated earlier, is being replaced. Consequently, the decision was made to combine the OMS replacement and the PragmaCad upgrade projects. This work has been included within the scope, cost, and schedule of the OMS replacement project.
Benefit Upgrading PragmaCad to the latest version will ensure continued vendor support and improve the efficiency of Idaho Power’s field personnel thus reducing costs.
IV. SMART GRID OPPORTUNITIES AND CONSTRAINTS This section describes other smart grid opportunities Idaho Power is considering for investment over the next five to 10 years and any constraints that affect the Company’s investment considerations.

Idaho Power Company 2015 Smart Grid Report
Public Document Page 49
A. Transmission, Substation, Operations, and Customer Information Enhancements
Personalized Customer Interaction
Today, Idaho Power’s customers using a desktop computer, tablet, or mobile phone can register and log-in to myAccount and utilize the Energy Use Advising Tool to receive information regarding their energy use. Customers also have access to an outage map that displays current outages that affect more than 20 customers. As previously described in Section II.C., the map provides information on the location of the outage, number of customers impacted, crew status, and if known, the estimated time of restoration. Idaho Power is preparing for the continued growth in the multiple communication channels customers are using, and will use, to conduct business. Customers expect Idaho Power to proactively send them the information that is most important to them via the channel of their choice. Those channels will include the following: email, text messaging, phone applications, and social media platforms. Upon receiving this information, the customer will be empowered through the technology to adjust energy using devices in their home or business to manage their energy usage or respond to outages. Examples of topics in which Idaho Power believes customers will seek more interactive engagement include:
Outage information
Bill alerts
Energy management tools
Mobile workforce management
Business transactions
Idaho Power does not currently have established systems to proactively engage customers or personalize thresholds for the customer. Idaho Power is exploring opportunities and system improvements to more actively engage its customers using the technologies preferred by customers.
Modification of Idaho Statute for Electric Vehicle (EV) Charging
During the 2015 Idaho legislative session, Idaho Power supported legislation that allows for non-utility entities to provide EV charging. Generally, the Idaho public utilities law has a two-part test for determining what defines a public utility: (1) any person or corporation that provides utility service (such as electricity) and (2) for compensation in Idaho. With the advent of electric vehicles, concerns arose about whether persons or entities that sell electricity to recharge the batteries of electric vehicles in Idaho might unintentionally become public utilities subject to the Idaho Public Utility Commission’s jurisdiction and regulation. The 2015 Idaho Legislature passed an amendment to Idaho Code § 61-119 under House Bill 185 that modifies the definition of electric corporation. This modification creates an exception for those companies that purchase

2015 Smart Grid Report Idaho Power Company
Page 50 Public Document
electricity “from a public utility…to charge the batteries of an electric motor vehicle as provided by order or rule of the commission.” This amendment took effect July 1, 2015.
On May 28, 2015, Idaho Power filed modifications to I.P.U.C. No. 29, Tariff No. 101 to comply with the new Idaho law. Earlier, in 2012, Idaho Power had modified its Rule C, Service and Limitations, of the Oregon Tariff Schedule to comply with a change in ORS 757.005, allowing electric vehicle service providers in Oregon to purchase electricity from Idaho Power and sell it to the public for the purpose of charging an electric vehicle.
Use of Technology and Process Changes to Improve Workforce Efficiency
Today Idaho Power distribution line design and construction processes utilize minimal technology in the field. Distribution designers travel to meet the customer to evaluate the service location and confirm the customer’s request, travel back to the office to design the job, and enter the design in the work management system. Similarly Customer Representatives providing energy-related services to customers utilize minimal field technology. Company representatives manage their work via paper orders and exchange information with customers via hard copy print outs.
Idaho Power will determine what technological and process improvements will improve efficiency and services provided by field employees in customer-facing positions.
For example, the Company will evaluate if tablets that are wirelessly connected to Idaho Power systems would improve the efficiency of distribution designers as they meet with customers in the field. The devices could electronically send the information obtained to a centralized organization that designs the customer’s request. The revised draft could then be sent back to the field distribution designer who meets with the customer and finalizes the arrangement, including digitized signatures via the tablet for documentation purposes. A similar example could include customer representatives with tablets meeting with customers and accessing customer information to provide proactive analysis on pricing, usage, and programs to satisfy customers’ needs.
Other technologies and process improvement ideas will be evaluated in a similar manner.
B. Evaluations and Assessments of Smart Grid Technologies
Electric Vehicle Charging Impacts Study
Idaho Power’s EV Charging Impacts Project is an optional customer program intended to evaluate the impact of residential EV charging on Idaho Power’s distribution system. An AMI meter in the customer’s garage-based charging station circuit allows Idaho Power to analyze how these customers are charging their cars. These meters are not used for billing purposes but only for remote monitoring of charging patterns.

Idaho Power Company 2015 Smart Grid Report
Public Document Page 51
The program has been in operation for three years and will finish at the end of 2015. Data analysis indicates that participating customers increase their monthly household energy use by an average 21 percent due to EV charging. While a significant consumption increase, EVs have great potential for shifting charging to off-peak if a utility offers appropriate incentives. Consequently, this load may not prove detrimental to the distribution system and may even be beneficial to the system as a whole.
Photovoltaic and Feeder Peak Demand Alignment Pilot
Idaho Power has installed three solar-intensity monitoring stations along a distribution feeder to determine the impact of aligning PV panels to maximize PV output with feeder peak demand. Each monitoring station is comprised of three solar-intensity monitors with the following orientation: south for maximum annual energy output (typical customer orientation), west for maximum output coincident with feeder peak demand, and horizontal for the global solar intensity reference.
Solar intensity data was gathered at three locations in west Boise during the summer of 2013. Analysis of the data indicates there is a relationship between solar intensity and electrical load under certain circumstances:
Solar intensity analyzed at the southerly-configured sensors led load by approximately four hours with a correlation of 0.94 across all three locations.
Solar intensity analyzed at the westerly-configured sensors led load by approximately two hours with a correlation of 0.9 across all three locations. The curves of the westerly-configured irradiances tended to peak nearer the actual time of feeder peak loads, but with lower certainty than the southerly- and horizontally-configured irradiances.
Solar intensity analyzed at the horizontally-configured sensors led load by approximately four hours with a correlation of 0.95 across all three locations.

2015 Smart Grid Report Idaho Power Company
Page 52 Public Document
The data also indicates that PV panel orientation can be aligned to more closely follow the peak demands on a summer afternoon; however, more study is needed to assess overall benefits as well as the detriments to this approach. Solar intensity data has now been gathered through July 2015 and is currently being analyzed.
Electric Vehicles for Idaho Power Circulator Route
Idaho Power purchased two new electric vehicles (Nissan Leaf) for employee use when traveling between company facilities in the Boise area. Funded as a Sustainability Program project, the EVs will promote employee use of public/alternative transportation to get to and from work, then use a company EV when traveling between facilities is required. Additionally, the EVs will help to demonstrate the viability of electric vehicles to the general public. As part of this project,

Idaho Power Company 2015 Smart Grid Report
Public Document Page 53
Idaho Power installed seven new charging stations at various facilities to augment the existing charging stations at Idaho Power’s Boise Operations Center.
In operation since February 2015, over 160 individual employees have reserved and used one of the circulator vehicles through August 31, 2015, for business-related travel.
Figure 22 A circulator vehicle and charging station at Idaho Power’s corporate headquarters
Solar-Powered Parking Lot Lighting
The 2014 Smart Grid Report included a report on a project completed in September 2013 where high-pressure sodium lighting was replaced with high-efficiency light emitting diodes (LEDs) in an employee parking lot. Solar panels mounted on each light pole feed energy back onto Idaho Power’s distribution system with the intent that the system will consume net-zero energy on a yearly basis. The system was manufactured and installed by Boise-based Inovus.
Before and after photos of the parking lot are shown in Figure 23.

2015 Smart Grid Report Idaho Power Company
Page 54 Public Document
Figure 23 Solar-powered parking lot lighting before and after
Idaho Power is now able to report on the performance of the solar and LED parking lot lighting system. The system achieved net-zero energy consumption during it first two years (September 2013 to August 2014, and September 2014 to August 2015) of operation. As expected, performance of the system varies throughout the year – as the days get longer the solar panels produce more energy and the LED lights consume less; and similarly, as the days get shorter the solar panels produce less energy and the LED lights consume more. The LED lights have an adjustable dimming profile to further optimize the system. The diming capability and the seasonal differences in solar panel production and LED light consumption are illustrated in Figure 24. Positive amounts indicated net consumption and negative amounts indicated net generation.
Figure 24 Parking lot lighting system energy consumption/generation
C. Smart Grid Pilots and Programs Although not organized or managed as a specific project, Idaho Power actively monitors smart grid-related technology advancements, articles, research, reports, demonstration projects, and demonstration results as applicable. As energy generation, consumption, and management
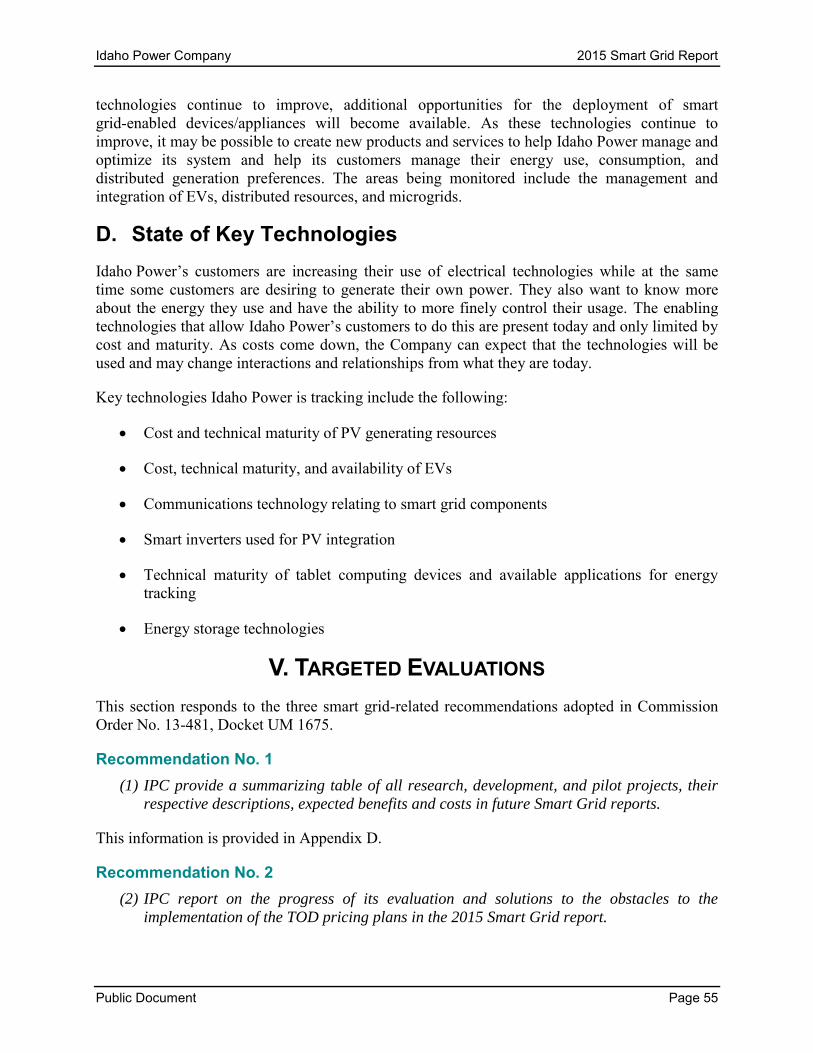
Idaho Power Company 2015 Smart Grid Report
Public Document Page 55
technologies continue to improve, additional opportunities for the deployment of smart grid-enabled devices/appliances will become available. As these technologies continue to improve, it may be possible to create new products and services to help Idaho Power manage and optimize its system and help its customers manage their energy use, consumption, and distributed generation preferences. The areas being monitored include the management and integration of EVs, distributed resources, and microgrids.
D. State of Key Technologies Idaho Power’s customers are increasing their use of electrical technologies while at the same time some customers are desiring to generate their own power. They also want to know more about the energy they use and have the ability to more finely control their usage. The enabling technologies that allow Idaho Power’s customers to do this are present today and only limited by cost and maturity. As costs come down, the Company can expect that the technologies will be used and may change interactions and relationships from what they are today.
Key technologies Idaho Power is tracking include the following:
Cost and technical maturity of PV generating resources
Cost, technical maturity, and availability of EVs
Communications technology relating to smart grid components
Smart inverters used for PV integration
Technical maturity of tablet computing devices and available applications for energy tracking
Energy storage technologies
V. TARGETED EVALUATIONS This section responds to the three smart grid-related recommendations adopted in Commission Order No. 13-481, Docket UM 1675.
Recommendation No. 1 (1) IPC provide a summarizing table of all research, development, and pilot projects, their
respective descriptions, expected benefits and costs in future Smart Grid reports.
This information is provided in Appendix D.
Recommendation No. 2 (2) IPC report on the progress of its evaluation and solutions to the obstacles to the
implementation of the TOD pricing plans in the 2015 Smart Grid report.

2015 Smart Grid Report Idaho Power Company
Page 56 Public Document
Idaho Power believes that it is important to implement time-of-use (TOU) rates through seasonal pricing for all residential customers as a foundation before a more sophisticated time-of-day (TOD) pricing plan is introduced. Although Idaho Power currently has seasonal pricing in place for its residential customers in Idaho, Oregon has been more reluctant to adopt such pricing structures. Idaho Power has had TOU rates in place for many years for its Idaho residential customers through seasonal rates before it offered the optional residential TOD pilot plan in Idaho. Idaho Power believes that a logical first step would be to implement seasonal rates for Oregon residential customers. The Company has proposed seasonal rates in Oregon for its residential customers, which it has done in its last several general rate case proposals but they have not been approved. Idaho Power does not know when it will file its next general rate case in Oregon; however, Idaho Power plans to propose seasonal rates for residential customers in any future general rate case proposal.
Therefore, rather than working on solutions to the obstacles to the implementation of TOD pricing plans, most of Idaho Power’s effort in this area has been looking into rate design issues and exploring the ability of the billing system to process and bill time of day residential customers as described more fully in the following section.
One of Idaho Power’s primary goals in designing fair and appropriate rate structures is to reflect the costs to serve the customers in the specific rate classes. In order to reflect the appropriate cost structure in any new TOD offering for residential customers, Idaho Power would propose to reflect the variable power supply costs time block differentials. Prior to the last few years, Idaho Power was not able to analyze hourly net power supply cost information due to the voluminous nature of this data. However, due to advances in the Company’s ability to utilize the output of its AURORA modeling software, Idaho Power can now utilize this hourly data to shape time differentiated energy rates. Idaho Power provided an initial study in Docket UM 1415 when, in compliance with Order No. 12-159, Idaho Power completed and submitted to the Commission the Time Differentiated Cost of Service Data Study. The data presented in this study was intended to provide the Commission with information regarding the cost of serving Idaho Power‘s customers at various times throughout the year, on a seasonal, monthly, and TOD basis. This study showed that current differences in costs between peak and off-peak time blocks are smaller than the differentials currently used in the optional residential TOD pilot plan in Idaho.
Idaho Power currently has approximately 1,600 customers on its Idaho optional TOD pilot plan. The ability of the CR&B system to process large numbers of residential TOD customers will require an enhancement to the system. During the last year, Idaho Power has been exploring the cost, feasibility and timing of enhancements to the CR&B system that would enable large numbers of residential customers to be billed under a TOD rate structure.
Recommendation No. 3 (3) IPC quantify the benefits expected from all Smart Grid programs and identify when the
benefits will flow to its customers.
The Commission stated in Order No. 12-158 that its goal of the smart grid is to benefit the ratepayers of Oregon. In responding to Recommendation No. 3 above, Idaho Power structured its comments around the detail as outlined on page 3 of the Order:

Idaho Power Company 2015 Smart Grid Report
Public Document Page 57
The Commission’s goal is to benefit ratepayers of Oregon investor-owned utilities by fostering utility investments in real-time sensing, communication, control, and other smart-grid measures that are cost-effective to consumers and that achieve some of the following:
1. Enhance the reliability, safety, security, quality, and efficiency of the transmission and distribution network
2. Enhance the ability to save energy and reduce peak demand 3. Enhance customer service and lower cost of utility operations 4. Enhance the ability to develop renewable resources and distributed
generation.
In Appendix E, Idaho Power has attempted to quantify the benefits expected from each of the Smart Grid projects by identifying which of the Commission’s goals are met by each project and when customers will see those benefits.
VI. RELATED ACTIVITIES This section discusses activities that relate to smart grid operations.
A. Cyber and Physical Security All smart grid-related projects or plans conform to Idaho Power’s Information Security Standards which are in place to secure its cyber assets. Idaho Power’s aim is to strengthen its long-standing tradition of electric reliability while fostering a culture of compliance and satisfying a broad set of reliability standards.
Smart grid projects also conform to the requirements of Idaho Power’s Physical Security Program which prevents unauthorized access to personnel, equipment, material, and documents while safeguarding against espionage, sabotage, acts of terrorism, damage, and theft. Physical security is an integral part of all critical infrastructure protection, safety, fire, and crime-prevention programs.
B. Privacy Idaho Power is committed to protecting the privacy of its customers and the data contained within company systems as stated in its Corporate Security Policy and evidenced by the Company’s Corporate Security program. For confidential data, such as customer information and energy usage data, Idaho Power limits access using a need-to-know approach enforced by role-based access controls for employees and contractors and supported by periodic required training. The policies and controls undergo periodic reviews to ensure they support applicable mandates and guidance.
Idaho Power recognizes that new risks are emerging from smart grid technologies, both from the increase in data and the increasing interconnectivity of systems. To stay current on these, Idaho Power has joined collaborative public/private partnerships such as the National Institute of Standards and Technology Smart Grid Interoperability Panel Cyber Security Working Group.

2015 Smart Grid Report Idaho Power Company
Page 58 Public Document
Idaho Power customers can access their energy usage data electronically via a registered and password-protected login (myAccount) on the Idaho Power website. Customers can also request that Idaho Power provide hard-copy usage information via fax, email, or mail.
Idaho Power provides protected customer information to entities other than the customer only under one of the following conditions:
Receipt by Idaho Power of a court-ordered subpoena
Presentation by a third-party of legal documentation substantiating the power of attorney for the customer of record
Receipt by Idaho Power of written authorization from the customer of record identifying the third-party to whom information is to be released and specifying the information to be released
Notification by a public utility commission that the customer of record has filed a complaint at which point information will be provided to Commission staff
In addition to the above conditions under which information for an individual customer may be provided, Idaho Power has several contractual business relationships with third-parties for the procurement of services essential to the operation of the business (e.g., bill print services) that are subject to non-disclosure agreements and data security requirements.
C. General Customer Outreach and Education
Overview
Over the past six years as AMI installation has been completed, Idaho Power has provided residential, small commercial, and irrigation customers self-service options at idahopower.com. The self-service options help customers learn about energy, how they are using it, and how they can save it. This technology gives customers the ability to view their hourly and monthly meter data with additional energy tools and analytics technology.
Using data collected from AMI meters, Idaho Power Customer Service Representatives (CSR) have the ability to answer residential and small commercial customers’ questions about their detailed energy usage. This specific data is available for a time variant pricing rate structure (residential), while using features in the CSR tool, the Meter Highlights tool (with bill-to-date functionality), and the Rate Comparison tool for residential customers. The CSR tool will allow authorized, internal employees to see the same data as the internet self-serve customer. This helps the CSR to consult with the customer about energy usage and high bill complaints.
Customer Outreach and Education Events
Idaho Power further increased its energy efficiency presence in the community in 2014 by providing energy efficiency and program information through 116 outreach activities, including

Idaho Power Company 2015 Smart Grid Report
Public Document Page 59
events, presentations, trainings, and other outreach activities documented in the Outreach Tracking System. In addition to these activities, Idaho Power field staff throughout Idaho Power’s service area delivered 164 presentations to local organizations addressing energy efficiency programs and wise energy use. In 2014, Idaho Power’s Community Education team provided 67 presentations on The Power to Make a Difference to 1,756 students. The customer education representatives and other staff also completed 32 senior citizen presentations on energy efficiency programs and shared information about saving energy to a total of 912 seniors in the Company’s service area. Additionally, Idaho Power’s energy efficiency program managers responded with detailed answers to 288 customer questions about energy efficiency and related topics received via Idaho Power’s website.
As part of National Energy Awareness Month in October 2014, Idaho Power held its fourth annual student art contest in the Idaho Power service area, bringing energy education into the classroom and inspiring students and families to think more about energy. “Ways to Save Energy” was one of the categories, and both overall and regional winning students and their teachers were recognized.
At the outreach events, Idaho Power employees cover a wide range of information, answer customer questions, and assist customers in registering for the Company online self-help services. The Company also promotes idahopower.com, using myAccount to help customers learn more about using energy, tips and ideas to save energy, energy efficiency program information, AMI meter information, payment options, and general company information.
Communications
Idaho Power communicates frequently with customers through a variety of channels, including, but not limited to, billing statements, bill messages, bill inserts, Connections articles, customer letters, doorknockers, postcards, brochures, web content at idahopower.com, hold messaging on the Company’s 1-800-488-6151 phone line, social media, public events, and customer visits.
As an example of how Idaho Power is educating employees and customers about the value of the grid, see Appendix F for a recent edition of the Connections newsletter that is distributed through customer bills for the benefit of Idaho Power customers.
Idaho Power has successfully leveraged the functionality of AMI and especially the hourly meter data to enable the majority of its customers to learn more about their energy usage and how to use energy wisely. The Company has used events and other channels to provide customers relevant information on a frequent basis about energy efficiency, company and program information, and updates about AMI metering. Idaho Power also sends a new customer welcome letter inviting them to visit idahopower.com to learn more about their energy usage and to register on myAccount.

2015 Smart Grid Report Idaho Power Company
Page 60 Public Document
VII. CONCLUSION Idaho Power continues to develop a vision and a strategy to anticipate what the future energy delivery system will look like and how it will meet customer needs and preferences. The Company continues to develop, test, and deploy the technologies needed to facilitate the transition to a smart grid future and accommodate renewable generation into the power system.
The Company strives to enable more proactive customer interaction, as with the implementation of the Mobile Website, Outage Map, and Resource Generation tool which informs and enables participation by customers.
Idaho Power is dedicated to continuing efforts toward a smart grid system to provide Idaho Power’s customers with an efficient, reliable, and safe power system that fits with customer expectations of a more interactive experience.


Towell, Kimberly
Subject: FW; Idaho Power Smart Grid Report - Comment solicitationAttachments: DRAFT 201 5 Oregon Smart Grid Report (001 72872xBCD5C).pdf
Subject: FW: Idaho Power Smart Grid Report - Comment solicitation
Idaho Power Company will be submitting its third annual Smart Grid Report to the Public Utility Commission of Oregon
(OPUC) on October 1, 2015. This report summarizes our efforts to improve our system reliability, increase the efficiency
of our overall system and provide customers with easy to use information on how they are using our product.
As a customer who has previously collaborated with us to address renewable and resource planning issues, Idaho Power
believes you may have a special interest in aspects of this report. We are sending a draft of this report to you so that
you may review this draft and, if you have suggestions or comments, provide them to us as we are preparing our final
report.
The Smart Grid, as defined by the OPUC, is utility investments in technology with two-way communication capability
that will (1) improve the control and operation of the utility's transmission or distribution system, and (2) provide
consumers information about their electricity use and its cost and enable them to respond to price signals from the utility
either by using programmable appliances or by manually managing their energy use.
We can include your feedback in our final report if you can respond by September 15, 2015, but would welcome your
ideas any time. To share your comments and ideas please email smartgrid(S)idahopower.com or call Darlene Nemnich at
(208) 388-2505.
For more information about smart grid, and Idaho Power smart grid reports and projects, go to
www.idahopower.com/smarterid.
Thank you,
"Darfene Nemnich \ Senior Regulatory Affairs Analyst | Idaho Power Company
1221 West Idaho Street, Boise, ID 83702 | ^'208.388.2505 I dnemnichPidahopower.com

HYDRO
SMARTgridShare Your Ideas About
Idaho Power is preparing its annual smart grid investment report to the Public Utilities Commission of Oregon (OPUC). As part of this annual report, between August 15 and Sept. 4 we are seeking input, information and ideas from the public on smart grid investments and applications.
Please go to www.idahopower.com/smartgridto review a draft version of the report. You’ll also � nd more information about what the smart grid is, and how a smarter electrical grid can move the energy industry into a new era of reliability, availability and e� ciency.
To share your input, please email [email protected] or call Idaho Power Senior Regulatory Analyst Darlene Nemnich at (208) 388-2505. A summary of customer comments will be provided to the OPUC with Idaho Power’s report.
� e smart grid represents energy innovation, leveraging a combination of improvements that enhance customer service, power reliability, availability of renewable resources, and opportunities for time, energy and cost savings. Both the 2013 and 2014 reports can be found on our website.

Home Contact Us Site Map
Smart Grid: Modern IngenuityUsername or E-ma
3 5 p r :• -
Password
Forgot Password?
Forgot Username?
c FAQs
2014 Smart Grid Report
myAccount Login2013 Smart Grid Report
Service and Billing2011 Smart Grid Plan (pdfj
Proiects mformatiomOutage Center
Benefits Everyone Sjpp is1" Center
E ectrc Veh c esEnergy Efficiency
News and CommunityFor Idaho Power, the Smart Grid represents energy innovation. It gives customers information
Our Environment they need to be wise energy consumers, lit uses new technology to retrieve data and takeactions that benefit electrical grid performance. And it leverages a combination ot improvements
The Smart Grid; Anthat enhance customer service and power reliability, help integrate renewable resources, andIntroductioncreate opportunities for time, energy and cost savings.U.S. Department of E .About Us
Smart Grid Benefits5^5 ';::rii:LaC'V
Company Background Enable customers to make more informed energy use decisions Sngr Grid InfornatiorOfficer Profiles Reduce the time and impact of outages ClearinghouseFacts About Idaho Power Limit effects of power line disturbances to strengthen the gndvision, Values, Mission Support integration of renewable energy into our resource portfolioOur Energy Future
Smart Grid
Employee Porta Public Comment Period for Draft Report
SustainabilityIdaho Power is compiling its zG15 Oregon Smart Gnd Report fpon and would like your
Energy Sources comments on the draft document. Comments are being solicited through Sept 4, 2015. SubmitPower Lines comments to;Rates and Regulatory
Company Reports;
Service Area Map 2014 Oregon Smart Grid Report <pdf)Our Plan 2013 Smart Grid Rscol (PDF)Our View 2011 Smart Grid Plan (PDF)
Business To Business
Site Map | Energy Emergency | Terms - Conditions | Privacy Policy | Forward-Lookmg Statements | IDACORP
nan©1995-2015 Idaho Pov/er Company, n Mobile

Towell, Kimberly
From:
Sent:To:
Cc:Subject:
Attachments:
Towell, KimberlyFriday, August 14, 2015 3:38 PM'docketsfgoregoncub.org'; 'oregondocketsfgpacificorp.com'; '[email protected]';
'johrKggrid-net.com'; 'renee.m.francefgdoj.state.or.us'; '[email protected]'; Michael Breish;'[email protected]'; '[email protected]': '[email protected]';'[email protected]': '[email protected]'; '[email protected]';'[email protected]'; '[email protected]'; '[email protected]'; '[email protected]'; '[email protected]'; ¦[email protected]';'[email protected]': '[email protected]'; '[email protected]';'[email protected]'; "[email protected]': '[email protected]';'[email protected]'; '[email protected]'; '[email protected]';'[email protected]': '[email protected]'; '[email protected]';'[email protected]'; '[email protected]'; '[email protected]'; '[email protected]'; '[email protected]'; '[email protected]':'[email protected]'; '[email protected]'; '[email protected]';
'[email protected]'; '[email protected]'; '[email protected]';'[email protected]'
Nordstrom, Lisa; White, Tami; Said, Greg; Tatum, Tim; Nemnich, Darlene; Bearry, Christa
Idaho Power Company's 2015 Oregon Smart Grid Report - Comments SolicitedDRAFT 2015 Oregon Smart Grid Report (00172872xBCD5C).pdf;AD_Smart_Grid_Argus_Observer_2015.pdf
Parties to Docket Nos. UM 1460, UE 233, LC 63, and UM 1675:
Idaho Power Company will be submitting its third annual Smart Grid Report to the Public Utility Commission of Oregon
on October 1, 2015. As part of the annual report, Idaho Power is seeking public input and contributions from August 15
through September 4, 2015, on the attached Draft Smart Grid Report. To share your comments and ideas please email
[email protected] or call Darlene Nemnich at (208) 388-2505.
Public input is being solicited through advertisements in the Argus Observer and Hells Canyon Journal newspapers. A
copy of the advertisement is attached.
For more information about smart grid, and Idaho Power smart grid reports and projects, go to
www.idahopower.com/smartgrid.
Thank you,
'DarkmHmnkh\ Senior Regulatory Affairs Analyst | Idaho Power Company
1221 West Idaho Street, Boise, ID 83702 | S208.388.2505 I dnemnichtaidahopower.com

Idaho Power Company’s Responses to OPUC’s Informal Comments - 1
IDAHO POWER COMPANY’S RESPONSE TO INFORMAL COMMENTS FROM OPUC STAFF ON IDAHO POWER’S DRAFT 2015 SMART GRID REPORT
Submitted by Michael Breish on September 4, 2015 General Comment Staff finds Idaho Power’s (IPC or the Company) draft 2015 Smart Grid Report to be well written and intuitively organized given the wide range of smart grid activities that the Company is undertaking or planning to pursue. Staff primarily requests additional information or clarification in these informal comments and appreciates the opportunity to provide input prior to submission of the final report. Comments regarding items in Order No. 15-053 At the time of publication, IPC was still finalizing the Company’s responses to the three requirements issued by the Commission in Order No. 15-053. Additional Comments Customer Engagement and Experience Efforts currently undertaken by the Company to enhance the customer experience are multifaceted, utilizing numerous multimedia channels, as well as enabling, encouraging customers to better manage their electricity use and explore energy management opportunities. Staff finds IPC’s continued efforts in further developing their customer engagement practices to be promising and looks forward to future improvements. Staff has comments regarding a few components of this topic within the draft report:
1. “Personalized Customer Interaction” Staff concurs that IPC customers, and utility customers across the nation, will increasingly want more personalized data to complement their existing service. IPC states that the Company does not currently have the means to proactively engage customers or personalize “thresholds.” Is IPC utilizing outside services, such as vendors or consultants, to advise the Company in obtaining the necessary systems or services to do so? From the Company’s self-reporting, Staff assumes that almost all of IPC’s customer engagement happens in-house. Staff would appreciate the Company identifying current or planned third-party services rendered for customer service, and opportunities where the Company could do so. RESPONSE: Idaho Power Company (“Idaho Power” or “Company”) will continue to leverage its current technology platforms when expanding customer service offerings and opportunities. However, to ensure the best possible service to customers, the Company will work with outside vendors when needed. A current example of partnering with an outside vendor is work that is being done on a new

Idaho Power Company’s Responses to OPUC’s Informal Comments - 2
“paperless” billing program. Currently, customers requesting an electronic bill are required to use CheckFree, an electronic billing vendor. The new paperless billing program being developed would be managed by Idaho Power. Customer’s would enroll, view, and manage their paperless bills by registering as a myAccount user. It is anticipated Idaho Power will contract with an outside vendor to manage the email process in delivering the email notification to customers. Additional examples of Idaho Power’s current use of outside vendors include Energy Use Advising tools and a successful on-line, no-fee bill payment offering.
2. Customer Satisfaction Customer participation and satisfaction comprise one of the seven major characteristics of the Company’s defined smart grid vision. IPC measures customer participation by access to customer “myAccount’ services or through energy efficiency program use for example. However, Staff cannot determine if and how the Company measures customer satisfaction. Staff would like to know more about IPC’s benchmarking practices for all customer classes’ programs and their respective customer experience and opinion, including any measurement of satisfaction. If none, does IPC have plans for future means of regularly measuring customer satisfaction with the Company as a whole or for individual programs? Is customer engagement plateauing in any areas that may be due to dissatisfaction? How might the Company address dissatisfied customers? RESPONSE: Burke, Inc. Customer Relationship Index (CRI): Idaho Power has been conducting customer satisfaction surveys with Burke, Inc. since 1995. The CRI is used as the primary measurement of these surveys and incorporates overall satisfaction, customer perception of quality and value, advocacy, and loyalty. Following are attributes of this research:
All four customer segments (residential, small business, large commercial and industrial, and irrigation) are included in the surveys.
Surveyed customers are randomly selected from the customer data base. Surveys are conducted on a quarterly basis allowing for normalization of
one-time events or weather. Surveys are conducted by telephone with an option for online responses
for large commercial and industrial customers. Scheduling for large commercial and industrial customers to take the
survey at a time that is convenient for them is facilitated by Idaho Power major account representatives.
Extensive historical data provides relevant information and trending related to Idaho Power customer satisfaction over time.
Consistent fielding periods from year to year with flexibility when necessary.

Idaho Power Company’s Responses to OPUC’s Informal Comments - 3
Surveys provide a representative sample of customers in all segments based on age and education level for residential customers, and longevity as a customer and regional location for small-medium sized business, large commercial and industrial, and irrigation customers.
The Burke survey provides over 19 years of consistent measurement with sound statistical analysis that accurately represents Idaho Power’s service delivery to its customers.
J.D. Power and Associates: J.D. Power and Associates conducts two customer satisfaction studies for the electric utility industry — the residential and the business studies. Idaho Power typically subscribes to both of these studies on an annual basis. Both studies are conducted with members of online panels. Panelists are identified for both J. D. Power and Associates electric utility studies based on zip code. These studies provide:
Longevity and breadth of research experience in the utility industry. Both the J.D. Power and Associates residential and business studies allow
Idaho Power to “benchmark” against other utilities using the same criteria. The overall age, education, and income demographics in the residential
study closely align with national census statistics. The studies are syndicated studies meaning that all utilities that meet the
criteria are measured as part of the study, not just those who subscribe. Annual results are reported publicly. Residential surveys are conducted quarterly, business surveys twice per
year. Results allow Idaho Power to assess how it compares to specific utilities in
the northwest. Results are reported at an attribute level to aid in identifying improvement
opportunities compared to industry, segment, or peer utilities.
Other research: Idaho Power has also recently developed an online customer community that is used for short one-topic surveys on a monthly basis. Idaho Power occasionally conducts ad hoc research related to specific energy efficiency programs or topics. This research is typically conducted through mail surveys or online surveys. Customer Engagement: Idaho Power does not currently measure customer engagement, per se. The Company measures customer satisfaction and the strength of customer relationships. On an ongoing basis, Idaho Power’s customer satisfaction has been very consistent with slight movements over time. In 2013 and 2014, Idaho Power experienced slight decreases in customer satisfaction. Areas for improvement identified during this period included Idaho Power establishing itself as the energy expert that customers can go to for energy-related issues and questions. The Company also endeavors to consider all customers requirements when planning for future energy needs. Idaho Power

Idaho Power Company’s Responses to OPUC’s Informal Comments - 4
has embarked on several campaigns to address these issues. For the energy expert issue, Idaho Power has developed specific outreach programs for small business and irrigation customers (i.e., those customer classes identified as having the most improvement opportunity). These outreach programs have entailed regional customer representatives and agricultural representatives establishing relationships with customers in their areas, identifying program offerings Idaho Power has that could benefit the customers, and involvement in local civic organizations. For the planning for future energy needs concerns, Idaho Power communicates and posts to its website information related to its Integrated Resource Plan (“IRP”). Regional representatives are also encouraged to discuss the IRP with customers when and where appropriate. Additionally, Idaho Power is in the process of developing an environmentally focused multi-year advertising campaign. Responses to Dissatisfied Customers: Idaho Power identifies dissatisfied customers in several ways. Incorporated into Idaho Power’s website is a system for contacting the Company with questions or complaints. When a question or complaint comes through the website, the communication is assigned to the appropriate Idaho Power representative for resolution. The Customer Service Center receives customer complaints through customer calls and emails. These are resolved by the Customer Service Representatives or are assigned to the appropriate Company representative. Idaho Power has Customer Representatives, Agricultural Representatives, and Major Customer Representatives that regularly work with customers in the field to answer questions and resolve customer complaints. Through the Burke, Inc. survey, customers have the option of requesting that an Idaho Power representative follow up on an issue or complaint. These requests are assigned to the appropriate Company representative for resolution. The Idaho Public Utilities Commission (“IPUC”), the Public Utility Commission of Oregon (“OPUC”), and Idaho Power work together to resolve informal complaints received by the commissions. When an informal complaint is received by the IPUC or the OPUC, it is forwarded to an Idaho Power customer service support representative for a thorough investigation. After the commission staff addresses whether the Company is operating within the respective commission’s rules and guidelines, Commission staff then communicates the findings to the customer. Idaho Power uses social media to engage customers, highlight positive customer experiences as feedback, answer questions, and provide general customer service. Simple questions or issues are handled immediately by Idaho Power’s social media manager. For more complex issues, the social media manager can work with a dedicated liaison at the Customer Service Center who can research customer accounts and provide guidance to provide a timely response to the customer’s inquiry.

Idaho Power Company’s Responses to OPUC’s Informal Comments - 5
3. Prepaid metering Utilities across the nation and Oregon are increasingly looking into implementing prepaid metering capabilities as smart grid hardware and software continue to develop. Ethical concerns are a significant component of any type of prepaid metering arrangement with customers. Staff would like to know the Company’s current and planned efforts relating to prepaid metering; how IPC would engage stakeholders, namely any consumer advocate or low-income organizations, if the Company were to pursue such a feature; and the regulatory means through which the Company would implement prepaid metering capabilities in Oregon. RESPONSE: Idaho Power is not currently pursuing a prepaid metering service. A prepaid metering service offering will depend on our customers’ needs and desires to have such an option. The Company will also need to develop a cost-effective business case aligning technology, processes, and regulatory requirements for offering a prepaid metering option.
Transmission and Distribution System IPC advanced a number of the Company’s transmission and distribution projects since the 2014 Smart Grid Report, some of which have produced notable results.
1. Transmission Situational Awareness Oscillation Monitoring Pilot Staff would like to know if the Company can provide a timeline and scope of the further development needed for the requisite oscillation analysis software. Additionally, can the Company provide any further information, including a timeline, for the installation of additional PMUs that are needed near the generation stations? Granularity of efforts moving forward would be appreciated and Staff commends IPC on a successful pilot. RESPONSE: In May of this year, Idaho Power completed the installation of PMUs at the following generating stations: Brownlee, Hells Canyon, Oxbow, Lower Salmon and Bliss. The Company expects to finish the design work for the installation of an additional five PMU sites at Bennet Mountain, Danskin, North Power, CJ Strike, and American Falls, as well as one more PMU at Boise Bench by July of 2016. Idaho Power plans to have the actual installation completed by May of 2017. There is still a need to implement a reliable mechanism for streaming and archiving the data to be used in the various applications. We plan to acquire a PI System Access Server next year for all archiving and streaming functions. This should provide a more robust platform for tool development and interfacing with the PMU data. At least one more additional year of development and integration work will be needed to develop the oscillation analysis software.

Idaho Power Company’s Responses to OPUC’s Informal Comments - 6
2. Transmission Situational Awareness Voltage Stability Monitoring Project Pilot projects reduce the risk of resources being spent on a project that may ultimately not deliver what was anticipated at project conception, which IPC demonstrated with this particular pilot. Though funds were saved with the absence of further development, Staff would like to know if the Company can foresee circumstances under which this project would produce sufficient benefits to warrant its continuation. If so, a description of such a scenario in the report would be helpful. RESPONSE: Notwithstanding other pilot projects currently under consideration for providing Transmission Situational Awareness by Voltage Stability Monitoring, the prior pilot project may be revisited once sufficient PMUs are in place to support its full implementation. Note that these PMUs will be required not only at generating stations but at substations (including all lines out of a bus) at which the voltage monitoring is to be performed.
3. Available Transfer Capability Staff seeks clarification and additional information regarding this tool. From the draft text, Staff understands that North Carolina State University will develop a graphical user interface, but will this contracted work address the insufficient flexibility of the existing model? If not, what are the Company’s plans to enable the tool to model future system changes? RESPONSE: The graphical user interface was intended to facilitate the display of results obtained by the tool (mainly probabilistic available transfer capability (“ATC”)). Note that with a given total transfer capability and the existing transmission commitments statistics, as determined from the tool, the ATC can be easily calculated. The latest version of the tool developed by North Carolina State University can accommodate future system changes, but there is still a fair amount of work that needs to be performed externally to gather the necessary data (historical path flows, historical and forecasted wind and loads, etc) to perform the analysis. At this time we are evaluating ways to streamline the data gathering process and include other renewable resources (i.e., solar) in the calculations.
4. Dynamic Line Rating (DLR) Information from other utility efforts in implementing DLR shows that significant asset utilization increases can occur when the transmission line circumstances are optimal. Staff would appreciate any preliminary data from the Company’s DLR efforts thus that can be shared within the report, such as projections of increased transmission carrying capacity and the associated percent changes.

Idaho Power Company’s Responses to OPUC’s Informal Comments - 7
RESPONSE: The only preliminary data available at this time is from the DLR test area between Hagerman and Glenns Ferry. This preliminary data indicates that the additional conductor thermal capacity available over the static limit ranges between 0 percent and 40 percent with an average of 20 percent. These numbers only correspond to the test area and do not represent the entire line. In order to utilize DLR, the entire line needs to be instrumented and the limit calculated for each test point in order to find the limiting point for the whole line. This information is not yet available.
5. Transmission Transformer Geomagnetic Disturbance (GMD) Monitoring As of now, IPC is the only investor-owned utility in Oregon actively testing GMD, so Staff very much appreciates the work and reporting. Does the Company have any plans to modify the sensor installations in order to collect more accurate or reliable data? Is the Company considering other technologies that may better measure geomagnetic induced currents (GIC)? Staff would also like clarification regarding the NERC standards: does the fact that NERC’s GMD benchmark fall below IPC’s indicate that NERC may need to raise its respective benchmark, or that the Company’s substations require a greater GMD to induce damaging effects? Finally, can IPC provide greater detail, including specific damage and estimated costs and downtime, if GIC were to occur? RESPONSE: At this point, Idaho Power does not have a solution to solve the GIC sensor inaccuracy issue and does not have plans to pursue other technologies to monitor GIC. The NERC GMD task force has come up with a proposed benchmark event. The task force has additionally developed scaling factors for this benchmark event that account for earth resistivity and geomagnetic latitude. After reviewing its methods, Idaho Power is confident in using the task forces benchmark. Idaho Power did not have scaling factors at its disposal when it originally studied GMD effects on its system. With these scaling factors applied, the geoelectric field strength is reduced to the point where significant GIC does not occur in our system. Idaho Power has not studied specific damage and estimated costs and downtime due to a GMD event. But based on the NERC benchmark, and the studies the Company has performed, Idaho Power does not expect significant GIC to occur.
6. Renewable Integration Tool (RIT) IPC and its partner organization continue to improve the capabilities of what are now two separate tools that originated from the RIT. Staff is hoping that the Company can include any data demonstrating the benefits from the use of the tool in operations, such as percentage increase in asset utilization?

Idaho Power Company’s Responses to OPUC’s Informal Comments - 8
RESPONSE: Following is a write-up of the RIT:
Prior to the development of the RIT, Balancing Operations utilized two different methods for forecasting wind generation on a preschedule basis:
1) The first method utilized was based on a calculation of what the
wind generation averaged over several years. After reviewing the generation over a several year period it was observed that the average generation was very close to 33 percent of the total installed capacity. For example, if Idaho power had 200 megawatts (“MW”) of installed capacity then the average generation was approximately 66 MW per hour over several years. Utilizing this observation, Idaho Power began using 33 percent of the installed capacity for a preschedule wind generation forecast. The problem with this methodology was that although it was accurate over a longer period of time (months or years) it failed to reasonably forecast wind variations on a daily or hourly basis because it was only utilizing historical information. This methodology also did not account for scheduled outages at the generating facilities.
2) Realizing the flaws in the 33 percent forecasting methodology,
Idaho Power went to a rolling three-day average of actual historical wind generation, hoping it would be more accurate than the 33 percent of installed capacity. In this method a simple calculation was made each preschedule day which took the hourly average of actual wind generation over the prior three days and used this value for the next day(s) being prescheduled. Again, flaws were observed in this methodology. First, large changes in wind generation due to weather changes were not being captured because the forecast was only utilizing historical information. This methodology also did not account for scheduled outages at generating facilities.
After several discussions between operators, supervisors, and senior management, it was determined that the two methods described above were inadequate and a better forecasting methodology was needed for wind generation.
To determine the added value of the RIT, Balancing Operations reviewed hourly data for a three-month period, beginning on February 1, 2014, and ending on April 30, 2014. In this analysis, the absolute value for the wind forecast error was calculated on a megawatts per hour (“MWh”) basis for the three different wind generation forecasting methods: (1) 33 percent of total installed wind capacity, (2) a rolling three-day average of actual historical wind generation, and (3) the new forecast produced by the RIT.

Idaho Power Company’s Responses to OPUC’s Informal Comments - 9
For the three-month period analyzed, the average absolute MWh forecasting error value for the 2 methods described above, as well as for the new RIT forecast are as follows:
1) 33 percent of installed capacity average error = 136 MWh 2) Rolling three-day average of actual generation average error = 149
MWh 3) RIT forecast average hourly error = 100 MWh
After calculating how much improvement Idaho Power had gained in the wind forecast error by developing the RIT, next we had to determine a way to assign a value to the improved forecast. This required that two factors be determined. First, it had to be determined what percentage of the improved forecast calculated by the RIT was estimated as being captured by the Balancing Operations. Second, we had to determine what dollar value to assign to the improved forecast based on the MW that were estimated to be captured by the Balancing Operations. To further explain, even though the RIT forecast was on average 36 MW better per hour than the average error calculated by utilizing the next best forecast previously used (33 percent of installed capacity) over the three months, the Balancing Operation’s are still dealing with a fair amount of uncertainty due to the unexpected variability in wind generation, so the amount of benefit is not a one-for-one when comparing the two forecasts errors. Although the development of the RIT results in more confidence in the wind generation forecast, this confidence can vary from day-to-day as well as hour-to hour. At times this confidence can be very high based on current conditions; however, under certain weather conditions confidence can be much lower. Based on this information, we chose to use a conservative value and assumed that we capture 25 percent of the improved forecast when making operational decisions. For example, based on the previous 33 percent of installed capacity forecasting methodology, if the wind forecast was expected to be 100 MW for an hour then a Balancing Operations may have left enough operating flexibility on the generators to accommodate actual wind generation anywhere between 0 MW and 200 MW for that hour. However, with the new RIT and increased confidence in its forecast, the Balancing Operations may only leave enough operating flexibility on the generators to accommodate actual wind generation anywhere between 25 MW and 175 MW. The result is a 25 MW decrease in additional INC and DEC regulating reserves being held on the Idaho Power system for uncertainty in wind variations. It is important to note that this level of increased

Idaho Power Company’s Responses to OPUC’s Informal Comments - 10
confidence is a conservative estimate and it can and does change based on system conditions, including wind forecast accuracy for that day. Second, after estimating a percentage of the improved wind forecast that was being captured by the Balancing Operations we had to determine what economic value to assign to this realized MW value. Due to the complexity of trying to determine all the factors that were considered by the day ahead and real time Balancing Operations when managing the system generation, as well as trying to assign a dollar value to all the factors that could have been considered, we had to determine an economic value to assign to the 25 percent of the improved forecast that was determined to be captured. To do this we had to consider several variables that could impact this economic value to assign to the MW. These variables include: loads, day ahead market prices, real time market prices, coal plant dispatch prices, gas plant dispatch prices, hydro generation prices, minimum loading on generators, regulating margin, and required reserves. Based on the factors described above, it was determined that a conservative value of $15/MW would be assigned to 25 percent MW value that is estimated to be captured from the improved RIT forecast. It is important to note that this $15/MW value is only an estimate and it can and does change based on system conditions as well as changes in the variables described above. By assigning the $15/MW economic value to the 25% MW value of the improved wind forecast due to development of the RIT, Idaho Power calculates the value of the RIT to be approximately $287,000 for the three-month period analyzed, February 1, 2014, through April 30, 2014. This is approximately $96,000/month for the value of the improved wind forecast utilizing the RIT as opposed to the two methods utilized prior to the RIT development. This is only an estimate and the monthly values can and will change based on system conditions, as well as the variables described above.
Advanced Metering Infrastructure (AMI) IPC’s efforts of utilizing AMI in a variety of ways are impressive thus far. Staff requests that the Company include the following in the final 2015 Smart Grid Report if possible:
Additional detail on the frequency of reevaluation for Oregon customers who currently do not have AMI?

Idaho Power Company’s Responses to OPUC’s Informal Comments - 11
RESPONSE: Idaho Power performs a high level review annually; however, the business case for installing AMI for the remaining customers in Oregon remains cost prohibitive.
What are some of the characteristics of the business case for the
remaining customers in Oregon without AMI? RESPONSE: The 1,370 Oregon customers who do not have AMI are in remote locations, with low customer density. These customers are served through 13 distribution substations. The estimated cost to install our current AMI technology for the remaining Oregon customers would be $2.7 Million ($1,970 per endpoint). Our initial deployment of AMI for 488,000 customers was $74 Million ($152 per end point).
Is sub-hourly data functionality available in the current AMI?
RESPONSE: The power line carrier does not have the communication bandwidth to support data collection beyond hourly on a large scale.
Can the Company include any annual data on number of meter outage detection? RESPONSE: Idaho Power does not have outage data specifically related to AMI reporting. Idaho Power does report part power and certain non-communication situations as outages.
Can additional appliances, such as a smart water heater, utilize the customer load control feature? RESPONSE: Idaho Power’s AMI system cannot communicate directly with any customer’s “smart” appliances. The load control functionality of the Company’s AMI system is based on installing an AMI switch in the appliance circuit and opening or closing that switch.


Outage Map Launch and ETR Overview for Customer Service
April 2015
Outage Map Launch and ETR
Overview for Customer Service
April 2015
An IDACORP Company

Background
• In 2012 Mobile-enabled field employees were asked to enter an Estimated Time of Restoration (ETR) on all outage orders.
• In 2014 a company initiative was launched to develop a 3 year roadmap for outage communication.
• A cross-functional team was established to review our current outage restoration and communication processes, customer satisfaction surveys, and outage communication practices .
• This team provided 29 recommendations to improve outage communications over a three year period.

• Local and national research confirms that communicating ETR is the most important piece of information the utility can provide regarding an outage.
• The second most important piece of information is the status of the crew.
• IPCo has put a process in place to communicate both ETRs and crew status to customers via an online Outage Map.
Estimated Time of Restoration (ETR)

Communicating ETRs
• The scheduled “go-live” for the Outage Map is April 28, 2015.
• This will be a soft launch.
• The responsibility to update the ETR ultimately lands with the troubleman or crew, however, dispatch employees will also be monitoring ETRs that have expired and may call for an update.
• Updated ETRs will be communicated to the customer on the Outage Map first. Manual updates to the IVRU messages and social media will follow. – CSROs will be watching closely for ETR updates and will continue their
practice of updating messages as new information becomes available
• The outage map is tied to OMS and will be refreshed every five minutes.

Understanding Estimates
• Research indicates that customers understand an ETR is only an estimate.
• Safety is our top priority at all times. To avoid situations where employees feel rushed to meet restoration times, if restoration efforts are taking longer than anticipated, the field employees will update the ETR so that the new information can be communicated with customers.
• Empathize with customers that are impacted when ETRs change, and assure them that we are working as quickly and safely as possible to restore their power.

Outage Map Basics
• The outage map will be located on our website in the Outage Center. Customers may view either the full version or a mobile version of the map.

Outage Map Basics
• A customer does not need to be logged in to myAccount to access the Outage Map.
• The following information will be available for known outages, both planned and unplanned: – Time the outage started
– Number of customers affected
– Status
• Under investigation
• Crew has been assigned
• Crew is enroute
• Crew is on site
– Estimated Time of Restoration (ETR)

Outage Map Basics
• Outages are indicated by triangles with an exclamation mark.
• Customers can use the Legend on the map to quickly estimate the size of each outage based on the color of the triangle.

Outage Map Basics
• Customers can click on the triangle for the outage they would like information on, and a text box will open with the available information for the outage. If no ETR has been entered yet, a generic message will be displayed as indicated below:

What the Map Won’t Show
• Boundary Information - This will be available on the IVRU message as per normal process or you can refer to CLRIS notes to answer customer questions. – Customers can zoom in, zoom out, and move around on the map to
view other areas. Zooming out too far can make multiple outages look like a single outage.
• Cause of the Outage – General information about the cause of the outage may be available on the IVRU message or in the CLRIS notes if it is known, but it won’t be included on the Outage Map.
• Trouble Order Entry Option – Customers are directed to call our office to report a power outage.

Outage Map
• Note to customers at the top of the Outage Map page:
Use the outage map to find current outages and estimated
restoration times.
Please Note: this map is automatically updated every 5 minutes.
Restoration times are estimates only. Conditions can change rapidly,
especially during a storm or emergency, affecting the accuracy of
information on the outage map.
To report an outage, or get detailed outage information, call 208-
388-2323 from the Treasure Valley, or 1-800-488-6151 from
outside the Treasure Valley.

Top 3 Questions and Answers
• When will the Outage Map be available to customers?
• What information will be available on the Outage Map?
• What information will NOT be available on the Outage Map?


2408449.3 Page 1 of 12
Project Plan Part A: General As more fully described below, PRSP Subrecipient will provide to Peak a licensed Linear State Estimator prototype and enhance Peak’s currently licensed version of the Physical and Operational Margins (“POM”) Region of Stability Existence (“ROSE”). PRSP Subrecipient will provide all of the requisite licenses to Peak for both the Linear State Estimator and POM ROSE. POM, ROSE, and POM-State Estimator (POM-SE) are PRSP Subrecipient intellectual property. Peak-ROSE software is a customization of ROSE software for Peak. Peak-ROSE software delivered during the project consists of the following programs:
• Physical and Operational Margins (POM); • Optimal Mitigation Measures (OPM); • Boundary of Operating Region (BOR); • Potential Cascading Modes (PCM).
Two copies (one Real-Time and one Off-Line) of Peak-ROSE software will be delivered to Idaho Power Company (“IPC”), Southern California Edison (“SCE”), and San Diego Gas & Electric (“SDG&E”). One copy of real-time Peak-ROSE covers development, testing, training, and production environments. POM-SE configuration for the project is POM- Linear State Estimator (“LSE”) program. LSE prototype will be delivered to California Independent System Operator (“CAISO”), IPC, Peak, SCE, and SDG&E. PRSP Subrecipient will build and make available the situational awareness wall. Based on cases created by LSE, measurement-based voltage stability analysis and corrective actions (previously known as remedial actions) are in scope.
Location of Project
The Services will be delivered primarily in the Peak offices at 7600 NE 41st Street, Suite 150 in Vancouver, Washington or 4850 Hahns Peak Drive, Suite 120 in Loveland, CO (“Facility”). Some work may be accomplished remotely if deemed appropriate by Peak.

PRSP Program Management Services PRSP Subrecipient — Peak Contract
2408449.3 Page 2 of 12
PRSP Subrecipient Furnished Property or Services
PRSP Subrecipient is required to provide all computers, software, cell phones, and other supplies, materials or equipment reasonably needed to perform the required services.
Peak Furnished Property or Services
Peak will provide PRSP Subrecipient with limited access to desk space, meeting or conference room space at Peak’s premises for PRSP Subrecipient to perform the services under this Contract at no charge to PRSP Subrecipient.
Part B: Technical Requirements and Work Activities
The Scope of Work for the software and support to be provided by the PRSP Subrecipient to support the PRSP is shown below.
PRSP Subrecipient shall provide to Peak an LSE that meets all of the following functional requirements:
The LSE shall perform the following functions as it relates to input data:
1. LSE shall be able to read a C37.118 data stream from any data source.
2. LSE shall be able to read a capture file as recorded and produced by Grid Protection Alliance’s OpenPDC program.
3. LSE shall be able to read a CSV file format of future definition as determined by Peak Reliability and PRSP Subrecipients.
LSE shall be able to identify bad data, and to deliver a more correct value given the other measured quantities within close proximity to the bad quantity. LSE shall meet the following functional requirements associated with bad data detection and correction:
1. LSE shall detect and report topology errors or measurement errors.
2. LSE shall flag and report bad data in a manner that supports situational awareness of the bad data point.
3. LSE shall be capable of estimating and replacing a synchrophasor measured quantity given the appropriate measurement redundancy in the area.

PRSP Program Management Services PRSP Subrecipient — Peak Contract
2408449.3 Page 3 of 12
4. LSE shall report to the user through a user interface and through automated reporting on a user configured periodicity (for example, once a day or once a week) synchrophasor data flagged as bad by LSE and/or replaced by LSE.
5. LSE will be able to create a “corrected” C37.118 data stream that includes the data that has been identified as bad and corrected by the LSE.
6. Bad Data Detection shall be able to run at a minimum of 30 times per second which will include a report identifying:
a. Any topology issues identified.
b. All suspected bad data will be replaced, and must be identified as being bad.
c. Provide results that enable the user to identify potential problem PMUs to examine for trouble shooting.
LSE shall meet the following Linear State Estimation requirements:
1. LSE will only refer to Phasor Measurement Unit (“PMU”) measurement-observable portions (islands) of the bulk electric system where a State Estimation will be executed.
a. LSE shall solve for all measurement observable portions of the system, whose bounds will be determined by the observability (or as allowed by current visibility) resulting in individual “islands” that are able to be solved by LSE throughout the system.
b. Non-measurement-observable portions of the system shall be equivalized through a method that will be reported to Peak and PRSP Subrecipients.
2. For non-observable parts of the system, where an iterative algorithm is needed, LSE shall provide a solution as fast as possible but not to exceed the “nominal” Westwide System Model (“WSM”) traditional State Estimator (“SE”) solution time of 10 seconds.
3. LSE shall enable the user to start and stop cycling of the LSE configurable through a user interface.
4. LSE must detect observability and provide information on observable islands in both text (i.e. delimited or tabular) and visual formats including:

PRSP Program Management Services PRSP Subrecipient — Peak Contract
2408449.3 Page 4 of 12
a. Identifying changes in topology which may affect visible islands (increase or decrease).
b. Information for each measurement observable island shall include:
i. Number of measurements.
ii. Number/names of buses in observable islands.
iii. Identification of critical measurements which will have major impacts on the observability boundary. (those which will make the system more or less observable by virtue of their own)
5. LSE shall enable the user to access input, output, and change settings to run LSE.
6. LSE shall enable the user to execute LSE on demand or by schedule mechanism.
7. LSE shall be able to export a solution for each identified observable island as well as for the combined observable/non-observable system to be used by current and future versions of ROSE.
8. LSE shall be able to run in a debug mode / study mode to get a re-run of a chosen measurement set as previously specified in the document for the LSE input data requirements.
9. LSE will display to the user, the following post run information and diagnostic capabilities:
a. Start time of LSE execution;
b. End time of LSE execution; and
c. Measurement set identifiable for a given run (i.e. voltages, angles, flows, etc.).
d. Comparison of input quantities with the estimated quantities.
e. Presenting user with the severity of the bad data which was detected.
f. Exporting the solution in a CSV file including the following items: measurement values, estimate values (voltage and phase angle) and

PRSP Program Management Services PRSP Subrecipient — Peak Contract
2408449.3 Page 5 of 12
identification of the measurement / estimate with area/zone/company name, station name, and bus name.
g. Number of observable network portions.
h. Availability of solution
PRSP Subrecipient shall provide Peak-ROSE that meets all of the following functional requirements:
1. Peak-ROSE shall be able to read and implement a full topology model as provided in the WSM export including:
a. Allowing for changes in topology without having to go through Study Network Analysis (“STNET”) to export another case;
b. Enabling topology processing;
c. Visually navigating the one-line display of the substation;
d. Using this for Remedial Action Scheme (“RAS”) modeling if equipment status is used.
2. Peak-ROSE shall be able to calculate self-sensitivities at each solved operating point (dV/dQ) with a positive sensitivity indicating a stable system, while a negative sensitivity would indicate an unstable system. (i.e. operating on the underside of the Power Voltage (“PV”) curve).
a. This would give another needed indication of the true voltage stability, and help deal with some of the numerical instabilities that exist.
1. Peak has witnessed ROSE solving on a low voltage solution and then reporting that interface value as the limit.
b. Peak Subrecipient states that they can calculate the bus with the highest self-sensitivity at the point of collapse (nose). Please provide more detailed explanation of how Peak Subrecipient accomplishes this.
3. Peak-ROSE shall be able to enable multi-threading in order for each run of Peak- ROSE to be completed within the same time it takes Real Time Contingency Analysis (“RTCA”) to run (currently every 5 minutes).
4. Peak-ROSE will include the following Output File Enhancements:

PRSP Program Management Services PRSP Subrecipient — Peak Contract
2408449.3 Page 6 of 12
a. Energy Management System (“EMS”) alarm output file including:
1. Worst Contingency;
2. Violated Element;
3. Name and kV level of the weakest bus (for voltage stability);
4. Volts Amps Reactive (“VAR”) margin at the weakest bus (for voltage stability);
5. Phase angle values of given buses corresponding to Basecase and Voltage Stability Limit for data mining and the ability to determine phase angle pairs at a later time.
5. Peak-ROSE shall perform PV-Curve analysis on the base-case (pre-contingency) and post-Contingency and stop the computation at an injection level (for both base-case and post-Contingency PV analysis) at which any one of the following occurs first:
a. Stability violation is encountered;
1. If for a contingency, stop computations for that contingencies but continue on with the other remaining contingencies
b. Source has reached its maximum capacity; or
c. Maximum transfer level as defined by scenario input file has been reached.
6. Peak-ROSE shall be able to add to the generator exciter capabilities/information Line Drop Compensation (LDC) /Reactive Current Compensation (RCC) consisting of adding or subtracting a reactance at the terminal to determine what and where the Automatic Voltage Regulator (“AVR”) will regulate, and to enable the user to view Reactive Capability Curve.
7. Peak-ROSE shall allow users to rearrange/add/subtract/filter/search the columns in the “tables” section and include LABELS in all of the components for better visibility. The LABELS will follow the naming convention of long EMS ID (up to 32 char) proposed by Peak and Bonneville Power Administration (“BPA”) for GE/PSLF and PowerWorld tools consistent with the Peak document detailing long EMS ID.

2408449.3 Page 7 of 12
Objective Activities
Agreement Execution PRSP (PRSP Subrecipient and Peak) executed agreement
ROSE Software Integration at Idaho Power Company (IPC)
1. Deliver ROSE software 2. Integrate ROSE software,
including configuration for use with Peak's real-time provided WSM
3. Successful end-to-end test that demonstrates full functionality.
4. Address and fix critical software defects
LSE Prototype at IPC - Observability Study
1. Observability study of Power Systems. Delivery is a report identifying existing measurement observability boundaries and desired PMU locations to provide improved observability for the LSE.
ROSE Software Integration at SDG&E
1. Deliver ROSE software 2. Integrate ROSE software,
including configuration for use with Peak's real-time provided WSM
3. Successful end-to-end test that demonstrates full functionality.
4. Address and fix critical software defects
Peak-ROSE Enhancement #1: Peak-ROSE needs to read and implement a full topology model
1. Peak-ROSE shall have the capability to read and implement a full topology model
2. Peak Subrecipient to provide release notes and announce to all participants that enhancement is available on Peak Subrecipient provided SFTP site. (Exhibit E, Peak-ROSE #1)
LSE Prototype at IPC 1. LSE software will be installed
and tested using IPC data, and critical variances addressed by

2408449.3 Page 8 of 12
the vendor. 2. Peak Subrecipient will
successfully demonstrate end-to-end testing of the LSE using streaming C37.118 data as an input.
3. The LSE software installed will be tested and satisfactorily meet all functional requirements described in Exhibit E.
Peak-ROSE Enhancement #2: Calculate Self-sensitivities
1. Calculate self-sensitivities at each solved operating point
2. Peak Subrecipient to provide release notes and announce to all participants that enhancement is available on Peak Subrecipient provided SFTP site. (Exhibit E, V&R ROSE #2
Peak-ROSE Enhancement #3: Enable multi-threading
1. Enable multi-threading for ROSE
2. Peak Subrecipient to provide release notes and announce to all participants that enhancement is available on Peak Subrecipient provided SFTP site. (Exhibit E, Peak Subrecipient ROSE #3)
LSE at CAISO 1. LSE software will be installed
and tested using CAISO data, and critical variances addressed by Peak Subrecipient.
2. Peak Subrecipient will successfully demonstrate end-to-end testing of the LSE using streaming C37.118 data as an input.
3. The LSE software installed will be tested and satisfactorily meet all functional requirements described in Exhibit E.

2408449.3 Page 9 of 12
Peak-ROSE Enhancement #4: Output File Enhancements
1. Output file enhancements to improve alarming and overall situational awareness
2. Peak Subrecipient to provide release notes and announce to all participants that enhancement is available on Peak Subrecipient provided SFTP site. (Exhibit E, Peak Subrecipient ROSE #4)
LSE at SDG&E 1. Observability study of Power
Systems. Delivery is a report identifying existing measurement observability boundaries and desired PMU locations to provide improved observability for the LSE.
2. LSE software will be installed and tested using SDG&E data, and critical variances addressed by Peak Subrecipient.
3. Peak Subrecipient will successfully demonstrate end-to-end testing of the LSE using streaming C37.118 data as an input.
4. The LSE software installed will be tested and satisfactorily meet all functional requirements described in Exhibit E.
Peak-ROSE Enhancement #5: Enhancements to PV-Curve Analysis
1. Stop PV analysis if either of the following occur: a. Stability violation is
encountered. b. Source has reached
maximum capacity. c. Maximum transfer level as
defined in scenario has been reached.
2. Peak Subrecipient to provide release notes and announce to all participants that enhancement is available on Peak Subrecipient provided SFTP site. (Exhibit E, Peak Subrecipient ROSE #5)

2408449.3 Page 10 of 12
LSE at SCE 1. Observability study of Power Systems. Delivery is a report identifying existing measurement observability boundaries and desired PMU locations to provide improved observability for the LSE.
2. LSE software will be installed and tested using SCE data and critical variances addressed by Peak Subrecipient.
3. Peak Subrecipient will successfully demonstrate end-to-end testing of the LSE using streaming C37.118 data as an input.
4. The LSE software installed will meet all functional requirements described in Exhibit E.
LSE at Peak 1. LSE software will be installed and tested using Peak data and critical variances addressed by Peak Subrecipient.
2. Peak Subrecipient will successfully demonstrate end-to-end testing of the LSE using streaming C37.118 data as an input.
3. The LSE software installed will be tested and satisfactorily meet all functional requirements described in Exhibit E.
Peak-ROSE Enhancement #6: Add to the generator exciter capabilities/information
1. Add line drop compensation and reactive current
2. Peak Subrecipient to provide release notes and announce to all participants that enhancement is available on Peak Subrecipient provided SFTP site. (Exhibit E, Peak Subrecipient ROSE #6)
Peak-ROSE Enhancement #7: Allow users to rearrange/add/subtract/filter/search the columns in the
1. Verify that users are allowed to rearrange/add/subtract/filter/search the columns in Tables
2. Peak Subrecipient to provide

2408449.3 Page 11 of 12
Tables release notes and announce to all participants that enhancement is available on Peak Subrecipient provided SFTP site. (Exhibit E, Peak Subrecipient ROSE #7)
Peak-ROSE Enhancement Completion
Upon successful completion of all stated ROSE enhancements stipulated by Peak within Exhibit E, (#1 - #7) the following will be performed for each enhancement and overall POM performance (not to exceed 6 weeks upon completion): 1. Successful end-to-end test that
demonstrates full functionality 2. Address and fix critical
software defects
ROSE Software Integration at SCE
1. Deliver ROSE software 2. Integrate ROSE software,
including configuration for use with Peak's real-time provided WSM
3. Successful end-to-end test that demonstrates full functionality
4. Address and fix critical software defects
Measurement-based voltage stability analysis
1. Demonstrate that ROSE successfully performs voltage stability using LSE provided measurement-based cases as input.
2. Deliver measurement-based ROSE software to participants
3. Perform end-to-end testing for each participant to demonstrate that the measurement-based voltage stability works as expected.
4. Address and fix critical software defects as identified by CAISO, IPC, SDG&E, SCE and Peak.

2408449.3 Page 12 of 12
Measurement-based corrective actions functionality in ROSE
1. ROSE shall identify corrective actions to mitigate the following conditions: a. Low voltage b. Voltage collapse c. Line and
transformer thermal overload
2. Deliver correction action software to all participants
3. Address and fix critical software defects identified by CAISO, IPC, SDG&E, SCE and Peak
Building situational awareness wall
1. Provide display mockup of visualization wall
2. Review participant comments and update display mockup as necessary to meet participant needs
3. Develop visualization wall for implementation at participant sites.
Transferring the technology to project participants and training at Peak and TOs.


Summary of Descriptions, Benefits and Costs
INITIATIVE STATUS COMPLETION PAGE #
II. STATUS OF CURRENT SMART GRID INVESTMENTS
A. Transmission Network and Operations EnhancementsTransmission Situational Awareness Oscillation Monitoring Pilot Complete/In Use 2015 7Description:
Benefits:
Cost: $35,000 total cost of pilot
Transmission Situational Awareness Voltage Stability Monitoring Pilot Complete/In Use 2015 7Description:
Benefits:Either one of these pilots if pursued fully should enhance Idaho Power's level of situational awareness.Cost: $35,000 total cost of pilotTransmission Situational Awareness Peak Reliability Hosted Advanced Application Complete/In Use 2015 8Description:
Benefits:
The oscillation analysis software would monitor system-wide oscillations using Idaho Power Phasor Measurement Unit (PMU) data. At this time we are waiting to have additional PMUs installed at more of our generating facilities. We plan to have new PMUs installed at 10 more plants by May of 2017. At that time depending on what is available in the market we will re-evaluate this option. We are also expecting to have a new PI-archiving system for all of our PMU data in place by that date.
Once all the PMUs are installed, and the archiving system operational and integrated with this tool, Idaho Power expects to provide additional situational awareness in terms of monitoring potentially harmful oscillatory modes real time. This will increase the reliability of the system.
The expectation for the VSMS software was to monitor real-time voltage stability, as well as have the capability to utilize archived PMU data to perform post-event voltage stability analysis. Pending additional installation of PMUs at key locations, this project may be revisited at that time. Further testing at a couple of stations will be required for benchmarking and calibrating the monitoring tool. Idaho Power is currently exploring engaging in another pilot project on the same area (different algorithm) of voltage stability that appears to have reached a more matured level of development.
This provides remote access to Peak Reliability Coordinator (RC) state estimator as well as a set of displays used by Peak RC to monitor the interconnection. Peak Reliability’s Hosted Advanced Applications (HAA) provides enhanced situational awareness of pre- and post-contingency system conditions that help Transmission Operators (TOPs) to reliably monitor their systems. The Hosted Advanced Applications File Management tool provides a means for HAA users to manage their files in the HAA environment including file transfer (state estimator solutions) between a local machine and the HAA environment.
Idaho Power is currently developing a process that utilizes the cases posted in the HAA for next-day study work. This will enhance secure operation of the system by allowing to perform contingency analysis on closer to expected conditions for the next day and determine ahead of time mitigating plans and operating procedures when needed.
1 of 12

Summary of Descriptions, Benefits and Costs
INITIATIVE STATUS COMPLETION PAGE #
Cost: $75,000 AnnuallyAvailable Transfer Capacity Calculation Tool Complete/In Use 2014 9Description:
Benefits:This will defer the need for investment on transmission upgrades.Cost: $90,000 total cost of projectDynamic Line Rating Pilot Ongoing 10Description:
Benefits:
Cost: $440,000 total cost of project over the past five years
B. Substation and Distribution Network and Operations EnhancementsTransmission Transformer Geomagnetic Disturbance Monitoring Complete/In Use 2014 11Description:
This tool will allow for a more realistic determination of the available transfer capacity (ATC) based on actual utilization of the transmission facilities and statistical behavior of the renewable resources. The GUI was intended to facilitate the display of results obtained by the tool (mainly probabilistic ATC). Note that with a given total transfer capability (TTC) and the existing transmission commitments (ETC) statistics as determined from the tool, the ATC can be easily calculated. The latest version of the tool developed by NCSU can handle future system changes, but there is still a fair amount of work that needs to be performed externally to gather the necessary data (historical path flows, historical and forecasted wind and loads, etc) to perform the analysis. At this time Idaho Power is evaluating ways to streamline the data gathering process and include other renewable resources (i.e., solar) in the calculations.
Transmission line ratings are static and are based on conservative and often worst-case environmental factors. A dynamic transmission line rating system is based on real time or near real time measured environmental conditions, such as ambient temperature, wind speed and wind direction. This allows the line rating to be more accurate as it is based on actual conditions. An increase of at least 20% of the static line rating is often possible.
Idaho Power can save money, defer construction and alleviate operational concerns regarding congestion with such a system. Quite often transmission system congestion is due to an increase in wind generation, which may also cool the lines that are carrying the increased generation, alleviating the congestion. Additionally, revenue can be generated by increasing the ability to move energy across transmission paths and money can be saved by utilizing existing hydro-generation resources.
The potential effects of geomagnetic disturbances (GMD) on the electric grid has resulted in much attention from FERC, NERC and other organizations. Regulatory requirements surrounding GMD have been issued. Although Idaho Power has kept abreast of GMD issues, a formal study and geomagnetic induced current (GIC) measurement has never been undertaken. Knowledge of the effects and the potential critical locations will allow Idaho Power to be prepared should a severe GMD occur. The ability to measure GIC would validate the study. A formal mitigation operations procedure has been drafted.
2 of 12

Summary of Descriptions, Benefits and Costs
INITIATIVE STATUS COMPLETION PAGE #
Benefits:
Cost: $48,000 total cost of projectConservation Voltage Reduction Enhancements Under Development 2016 11Description:
Benefits:CVR may reduce customer energy use and system losses.Cost: $263,000 total cost of projectENGO Solid State Reactive Power Compensation Device Pilot Under Development 2015 19Description: Evaluate ENGO unit ability to mitigate voltage problems in place of more expensive solutions such as reconductoring or installing small voltage regulators.Benefits:
Cost: $96,000 total cost of project
C. Customer Information and Demand-Side Management EnhancementsAdvanced Metering Infrastructure Complete/In Use 2011 19Description:
Benefits:
Cost: $74,000,000 total cost of projectmy Account (Energy Use Advising Tool) Ongoing TBD 20
A better understanding of the impact that geomagnetic disturbances have on the Idaho Power system is warranted. Idaho Power purchased and installed GIC modeling software that integrates with the system planning software. GMD mitigation procedures have been implemented. Idaho Power does not have a solution to solve the GIC sensor inaccuracy issue and does not have plans to pursue other technologies to monitor GIC.
Minimize voltages on transformers while maintaining customers’ voltage levels to meet the National Service Voltage Standard (ANSI C84.1). CVR would also be able to reduce demand on transformers during peak load periods in response to capacity requirements. The scope of the project includes the following: validate energy savings associated with CVR using measured instead of modeled values; quantify the costs and benefits associated with implementing CVR; determine methods for expanding the CVR program to additional feeders; pilot methods for making Idaho Power’s CVR program more dynamic; and determine methods for ongoing measurement and validation of CVR effectiveness.
ENGO devices can flatten the voltage profile at customers' premises and may be used to defer or replace more expensive methods for resolving voltage issues.
Idaho Power has deployed the Aclara Two-way Automated Communications System (TWACS) on 99% of the retail customers served, 99% in Idaho and 93% in Oregon. The TWACS technology is installed in the distribution substation and communicates with meters through the distribution power line.
Reduced operating costs, and enhanced data collection. The system provides daily kW and kWh readings and hourly energy consumption for each meter. The system also provides enhanced failure and voltage monitoring.
3 of 12

Summary of Descriptions, Benefits and Costs
INITIATIVE STATUS COMPLETION PAGE #
Description:
Benefits:
Cost: $207,000 total cost of projectDirect Load Control Ongoing Annual Expense 25Description:
Benefits:
Cost: $10,626,070 total 2014 annual expenses for demand responseCustomer Outage Map Ongoing 2015 27Description:
Benefits:
Cost: No additional costs were incurred by Idaho Power for this activity. The work was performed as regular work duties.Generation Resources Online Tool Ongoing 2015 29
All three programs use the hourly load data made possible by AMI to help determine the load reduction achieved during a DR event and the company uses the hourly data to reconcile customer payments for some Irrigation Peak Rewards and Flex Peak participant payments.
myAccount gives customers on-line access to Bill and Payment History, Usage History, Daily And Hourly Energy Use, Energy Use vs Degree Days, Pay My Bill, Ways To Pay My Bill, Add An Account, Electric Service Requests, myAccount Profile, Understanding My Bill, FAQs, How My Usage Compares, How I Use Energy, and When I Use Energy.
Improved customer satisfaction, decreases phone contact with the customer service center, allows customers to pay bills on line and through automatic deposit, helps customers use electricity wisely.
Idaho Power has offered optional direct load control, or DR, programs since 2004 and to all of its customer segments since 2009. The company has offered an air conditioning (A/C) cycling program, A/C Cool Credit; an irrigation direct load control program, Irrigation Peak Rewards; and a commercial/industrial DR program, FlexPeak Management. The A/C Cool Credit and Irrigation Peak Rewards programs use smart grid technology, more specifically the power line carrier (PLC) technology to activate load control devices installed on customer equipment. All three programs use the hourly load data made possible by AMI to help determine the load reduction.
Idaho Power's Outage Map application provides customers with near-real-time information about outages that impact their home or business. Idaho Power launched the online Outage Map application on April 28, 2015. The Outage Map is located on the Idaho Power website in the Outage Center. Customers can view either the full version if using a desktop computer or they can use the mobile version if using a mobile device. The map is tied to the Outage Management System and will be automatically updated every five minutes.
Improved customer service during electricity outages. The Outage Map enables Idaho Power to improve customer communication and better meet customer expectations. The following information will be available for known outages, both planned and unplanned: time the outage started, number of customers affected, the status of the restoration crew (enroute or on site), and the estimated time of restoration (ETR).
4 of 12

Summary of Descriptions, Benefits and Costs
INITIATIVE STATUS COMPLETION PAGE #
Description:
Benefits:
Cost: No additional costs were incurred by Idaho Power for this activity. The work was performed as regular work duties.
D. Distributed Resource and Renewable Resource EnhancementsRenewable Integration Tool Complete/In Use 2015 30Description:
Benefits:
Cost: $470,000 total cost of project
E. General Business EnhancementsIdaho Power Enterprise Data Warehouse Ongoing TBD 34Description: The Enterprise Data Warehouse (EDW) is a database for storing customer and meter data.Benefits:
Idaho Power has created a new online tool to help customers understand how electricity is generated. The tool is located on the Idaho Power website in the About Us/Energy Sources section. The chart displays an hourly breakdown of changes in customer demand and how different resources combine to serve Idaho Power customers.
The tool helps employees explain how the company’s fuel mix shifts to maintain a constant balance between energy coming onto the grid and energy being used. The tool also helps customers understand how Idaho Power meets the requirement to integrate energy from resources such as wind and solar, where the output can change quickly.
The RIT was developed to provide the Load Serving Operators a more accurate wind generation forecast to utilize when balancing supply and demand. A wind generation forecast is generated for both day ahead and real time balancing purposes and displays the trends for both actual generation and the forecast generation for determining forecast accuracy. The day ahead and real time operators utilize this forecast to determine what resources are available and needed to serve firm system demand for the next day(s) and hour(s).
Reduced power supply cost due to the more efficient and economic operation of the company's resources. With a less accurate wind forecast, operators are often required to leave additional incremental and decremental regulating reserves available on the system to account for the uncertainty of variable generation. This can result in additional energy transactions (purchases and sales) as well as the inefficient operation of company owned resources. The improved wind generation forecast reduces the amount of both incremental and decremental reserves that must be maintained to account for that uncertainty as well as a reduction in energy transactions (purchases and sales) that are often times not economically beneficial. There is also a reliability benefit; a more accurate wind forecast helps ensure that sufficient resources are maintained at all times to serve Idaho Power's firm load obligations.
The EDW supports the Company's analytical and reporting needs by providing a location combining information from both legacy and current customer information systems. EDW supports customer data viewing and analytics. It also ensures that reporting activities do not adversely impact performance of the source systems.
5 of 12

Summary of Descriptions, Benefits and Costs
INITIATIVE STATUS COMPLETION PAGE #
Cost: Preliminary Cost Estimate of $1,584,648Meter Data Management System Upgrade Complete/In Use 2015 34Description: Upgrade the existing version of Itron Enterprise Edition (IEE) to the latest version.Benefits:
Cost: $351,738 total cost of projectIII. FUTURE SMART GRID INVESTMENTS
A. Transmission Network and Operations EnhancementsTransmission Situational Awareness Grid Operator’s Monitoring and Control Assistant Under Development TBD 35Description:
Benefits:
Cost: $200,000 total cost of projectPower System Engineering Research Center (PSERC) Under Development TBD 36Description:
Benefits:Idaho Power's main interest in this effort will focus on developing a PMU performance analyzer and the necessary software for end (PMU) to end (archiving data system) testing. The testing will be initiated and executed remotely. The results of the testing, including errors in PMU measurements are analyzed and visualized in a summarized display. By monitoring the health and performance of the PMU system, planning and operational decisions made based on software tools that make use of data generated by the PMUs will be more accurate and less likely to produce wrong actions. This will result in better utilization of our PMU investments and a more secure and reliable system.
Moved IEE from the no longer supported Windows XP operating system to Windows 7 thereby eliminating certain security concerns. The upgrade also allowed Idaho Power to eliminate some customizations that are now part of the base product supported by Itron.
This project relates to the Linear State Estimator (LSE) and Region of Stability Existence (ROSE) tools. The LSE is a quasi real-time state estimator solution based on PMU data. This provides for a non-iterative power flow solution of the (reduced) system.The ROSE tool will be fed by either the Peak RC state estimator or the LSE and will calculate real time a margin to voltage stability or to a Path SOL violation.
These tools will help enhance situational awareness by determining margins to real-time path System Operating Limits (SOLs) and in particular provide both a backup mechanism during times the Peak RC state estimator (SS) solution is unavailable and partial visibility in between snapshots of the SS.
This is a PSERC High Impact Project : Life-cycle management of critical systems through certification, commissioning, in-service maintenance, remote testing and risk assessment. The life-cycle management of critical systems is particularly complex since it requires tools and methodologies that are not readily available, so some custom approaches are typically taken, which may be costly. Typical examples are the deployment of synchrophasor based Wide Area Protection, Monitoring and Control (WAMPAC) and Special Protection System (SPS)where no standard tools for certification, commissioning, in-service maintenance and risk assessment are available. This project will deliver such tools and make some of them readily available for the industry to use at the host universities.
6 of 12

Summary of Descriptions, Benefits and Costs
INITIATIVE STATUS COMPLETION PAGE #
Cost: $50,000 total cost of project
B. Substation and Distribution Network and Operations EnhancementsSubstation Fiber-Based Protection and Control Pilot Pilot 2015 39Description:
Benefits:
Cost: $95,000 total cost of projectAutomated Volt/VAr Management System Pilot Pilot 2018 40Description:
Benefits:
Cost: Budget has not been determined.Distribution System Communications Strategy Under Evaluation TBD 41Description:
Benefits:
Cost: Installation cost of $1,500 - $5,000 per device; monthly operational expense of $25 - $100 per device.Replace the Existing Outage Management System Under Development 2016 42
Idaho Power's Research, Development, and Deployment team has been working with a protective relay supplier and a network communications equipment supplier developing specifications and methodologies needed to design, build and maintain a new fiber communications digital substation concept. It is proposed that the new systems being developed be overlaid on the existing systems at the HemingwayTransmission Station. The Hemingway to Summer Lake 500 kV line sees frequent activity and would provide an ideal test environment for development of this technology.
Present technology and practices require many multi-conductor cables from each piece of substation equipment to the control building for protection, control, and communications purposes. The cost for this type of cable for phase one at Hemingway substation was $1,000,000 before installation. Extensive and expensive cable trenching systems are required, and the cost of terminating the cables at the equipment end and the building end is large These costs may be dramatically reduced by replacing control, metering and protection cables within the yard (except equipment power supply cables) with equipment-located data and control modules, and connecting them to the control and protection equipment located in the building utilizing digital communications over fiber optic cables. Because of the small size of fiber cables and the significantly lower number of cables needed, less expensive cableways could be installed in place of the large cableways now used. Installation costs would be significantly reduced.
Idaho Power will pilot a new vendor supported VVMS combined with bidirectional communications to replace the existing Automated Capacitor Control system.
Provide customers with adequate voltage to operate their devices and also to help integrate small distribution system-based generating customers.
Idaho Power communicates with a diverse group of distribution system devices (i.e. reclosers, capacitor banks, line fault indicators, meters, and outage monitors) using a variety of communications systems.
Using communications system elements to monitor and control various distribution system devices allows for better situational awareness and operational efficiency.
7 of 12

Summary of Descriptions, Benefits and Costs
INITIATIVE STATUS COMPLETION PAGE #
Description:
Benefits:
Cost: The estimated cost for the combined OMS and Mobile Workforce Management System upgrade is $4.8 million.Implementation of Automated Connect/Disconnect Capability at Selected Locations Through AMI Complete/In Use 2015 43Description:
Benefits:
Cost: $1.0 million total cost of projectImplement Additional AMI Outage Scoping and Restoration Confirmation Functionality Under Development 2016 44Description:
Benefits:
Cost: The estimated cost for the combined OMS and Mobile Workforce Management System upgrade is $4.8 million. Solar End-of-Feeder Project Pilot 2017 45Description:
Benefits:
Cost: $225,000 total cost of project
C. Customer Information and Demand-Side Management Enhancements
Improve the speed and accuracy of locating outages and confirming the number of customers involved.
Replace the existing Outage Management System (OMS). The new OMS will integrate into existing control and operating software platforms, including: the Geographic Information System (GIS), Supervisory Control and Data Acquisition (SCADA), Advance Meter Information (AMI), Mobile Workforce Managment (MWM), and Customer Relationship and Billing (CR&B) systems.
The existing OMS is aging and no longer supported by the original vendor. The new system will include enhanced outage management capabilities enabling the Company to more quickly and efficiently dispatch repair crews resulting in decreased costs and increased customer satisfaction.
Install approximately 14,500 meters with remote controlled disconnect and reconnect capability at customer locations historically requiring multiple visits annually.
Reduce annual costs of disconnecting and reconnecting service to our customers. Improved customer service by consistently completing the disconnect and reconnect work in a more timely manner. Reduce safety risks associated with traveling to and completing work on customer premises. Reduce environmental impact of driving tens of thousands of miles annually performing this function.
Integrate the passive AMI system with the active Sentry System.
Explore and install a pilot project to determine the possible benefits of using energy storage, ""smart"" inverter technology and/or PV solar panels at the end of the feeder.
To resolve low voltage issues as a lower cost alternative to more expensive re-conductoring. The company is about to connect several hundred MWs of solar generation, but has limited field experience with the solar panels, inverters and batteries. This project will also allow Idaho Power to gain this needed experience. This project was included in IPC's 2015 IRP report.
8 of 12

Summary of Descriptions, Benefits and Costs
INITIATIVE STATUS COMPLETION PAGE #
Customer Relationship Management (CRM) Planned Q4-2015 45Description:
Benefits:
Cost: Forecasted cost of $2,100,000 including Idaho Power labor and contracted resources.Integrated Demand Response Resource Control Under Evaluation TBD 46Description:
Benefits:
Cost: The estimated cost for the first phase of this project is $30,000.Ice-Based Thermal Energy Storage Pilot Under Evaluation TBD 46Description:
Benefits:
Cost: $100,000 total cost of project
D. Distributed Resource and Renewable Resource EnhancementsRenewable Integration Tool: Potential Future Project Under Development TBD 47
Using the CRM capabilities of the CR&B system, the CRM application will retrieve data from a variety of data sources (meter usage data, customer data, demographics, program data, etc.). The software will provide the ability to query and report both formally and on an ad hoc basis. Customer preference management (opt-out, marketing frequency, topic choice, etc.) will also be a component of the system.
The information will allow Idaho Power to better market its customer programs and service offerings. Systematically using various sources of data to reach customers should result in reduced printing and postage costs through more effective customer segmentation and targeted marketing. The information will aid the company to reach customers more efficiently through the gradual shift to electronic channels, such as email.
Idaho Power manages three DR programs. The dispatch associated with each program is unique to the program and requires various steps by generation dispatch employees utilizing multiple systems. An opportunity exists to increase operator visibility to programs and gain efficiencies when dispatching DR programs during events.
A single-interface dispatch solution would create efficiencies for dispatch employee training and knowledge through one system rather than three. It could also provide an environment where it is less likely for incorrect program dispatch to take place which can have a direct impact on customer satisfaction with the programs.
Ice-Based Thermal Energy Storage (TES) are distributed capacity-providing resources shifting peak-hour A/C load to off-peak periods. Initial phase will identify a customer for installation of an Ice-Based TES system, design the system, and prepare a detailed cost estimate. The second phase involves purchasing and installing the equipment, and data collection to determine effectiveness.
Load shifting from peak period to off-peak period because the TES system makes ice overnight during the off-peak period and is then used in place of A/C systems that operate during peak-demand hours. Also, the TES system is reportedly a near-zero net energy process; energy savings realized because of cooler overnight temperatures during the ice-making stage of the cycle are large enough to offset energy losses occurring as part of the energy storage process.
9 of 12

Summary of Descriptions, Benefits and Costs
INITIATIVE STATUS COMPLETION PAGE #
Description:
Benefits:
Cost: $60,000 total cost of project
E. General Business EnhancementsUpgrade the Mobile Workforce Management System Under Development 2016 48Description:
Benefits:
Cost: The estimated cost for the combined OMS and Mobile Workforce Management System upgrade is $4.8 million.IV. SMART GRID OPPORTUNITIES AND CONSTRAINTS
A. Transmission, Substation, Operations, and Customer Information EnhancementsPersonalized Customer Interaction Under Evaluation TBD 49Description:
Benefits:Customers will be empowered through the technology to adjust energy using devices in their home or business to manage utility costs.Cost: Costs for this conceptual project have not been determined.Passage of Change of Statute for EV Charging Complete/In Use 2015 49
Improvements in functionality include: automated appointment management that today is performed manually; user profiles that stay with the user despite the user location; mobile material inventory capability; improved routing capability. Each of these enhancements helps improve the efficiency of operations.
The Renewable Integration Tool (RIT) that was developed for forecasting wind generation is being expanded to forecast the solar generation that is scheduled to come on-line over the next few years. The benefits of expanding the RIT into solar generation are the same as the benefits for wind generation.
Reduced power supply cost due to the more efficient and economic operation of the company's resources. With a less accurate wind forecast, operators are often required to leave additional incremental and decremental regulating reserves available on the system to account for the uncertainty of variable generation. This can result in additional energy transactions (purchases and sales) as well as the inefficient operation of company owned resources. The improved solar generation forecast reduces the amount of both incremental and decremental reserves that must be maintained to account for that uncertainty as well as a reduction in energy transactions (purchases and sales) that are often not economically beneficial. There is also a reliability benefit; a more accurate solar forecast helps ensure that sufficient resources are maintained at all times to serve IPC's firm load obligations.
Upgrade the existing version of PragmaCAD to the latest version to maintain vendor support and realize improvements in the functionality of the latest version.
Proactively provide information to customers that is most important to them using email, text messaging, phone applications, and social media platforms.
10 of 12

Summary of Descriptions, Benefits and Costs
INITIATIVE STATUS COMPLETION PAGE #
Description:
Benefits:
Cost: No additional costs were incurred by Idaho Power for this activity. The work was performed as regular work duties.Use of Technology and Process Changes to Improve Workforce Efficiency Under Evaluation TBD 50Description:
Benefits:Improved efficiency of operations for customer-facing employees.Cost: Costs for this conceptual project have not been determined.
B. Evaluations and Assessments of Smart Grid TechnologiesElectric Vehicle Charging Impacts Study Under Development 2016 50Description: Evaluate the impact of residential EV charging on Idaho Power's distribution system.Benefits:EVs may prove beneficial to customers because of better asset utilization, lower operational costs, and the ability to shift charging to off-peak.Cost: $51,000 total cost of projectPhotovoltaic and Feeder Peak Demand Alignment Pilot Complete/In Use 2014 51Description:
Benefits:
During the 2015 Idaho Legislative session, Idaho Power supported legislation that eases the way for non-utility entities in Idaho to provide electric vehicle charging. The 2015 Idaho Legislature passed an amendment to Idaho Code $ 61-119 under House Bill 185 that modifies the definition of electric corporation. This modification creates an exception for those companies that purchase electricity “from a public utility…to charge the batteries of an electric motor vehicle as provided by order or rule of the commission.”
House Bill 185 would exempt from Idaho Public Utilities Commission regulation the resale of electricity purchased from a public utility by a charging station owner that is resold to customers using public charging stations. This legislation removes a barrier to entry and permits the charging station owner to charge users for the energy received from the charging station.
Determine what technological and process improvements will improve efficiency and services provided by field employees in customer-facing positions.
Conduct a study of a residential/small commercial feeder to determine the number of weather stations, including solar intensity monitors, that need to be installed along the feeder to gather and characterize the solar/weather patterns. Gather feeder load data and correlate the feeder load to the solar generation potential along the feeder. Includes purchase and installation of (probably) permanent solar intensity monitors, PV panels, and power metering and recording equipment.
Solar intensity appears to follow system load. The use of solar panels without energy storage may help shave load during times of peak need. During cloudy time periods, load can decrease and solar panel output will also decrease. Real-time solar intensity should be studied as it relates to real-time system load at the feeder level. The use of solar panels, particularly at the residential and commercial level may help shave peak load.
11 of 12

Summary of Descriptions, Benefits and Costs
INITIATIVE STATUS COMPLETION PAGE #
Cost: $25,000 total cost of projectElectric Vehicles for Idaho Power Circulator Route Complete/In Use 2015 52Description:
Benefits:Demonstrate the viability of EVs to the general public and promote employee use of public/alternative transportation.Cost: $86,000 total cost of projectSolar-Powered Parking Lot Lighting Complete/In Use 2013 53Description:
Benefits:The employee parking lot will consume net-zero energy on a yearly basis.Cost: This project was funded by shareholder dollars. No project costs were charged to customers.
Key: Complete/In Use – a project that was completed and is now being usedOngoing – for projects that have already been started and have no completion date because they are ongoing.Under Development – for projects that either are not complete at this time or are continuing to be improvedPilot – a limited scope installation to prove the technology application in the Idaho Power systemPlanned – initiative that is included in five-year plan and budget Under Evaluation – the technology or concept is being evaluated and is not at the planned or pilot stage yetTBD – to be determined
Notes: • Red print means 2015 projects. Projects reported initially in the 2014 Smart Grid Report are in black print.• Dates in this document may have been adjusted from 2014 Smart Grid Report due to project timeline changes.• Some projects have been relocated in this table from 2014 Smart Grid Report in order to place in more correct categories.
Idaho Power purchased two new battery-electric vehicles for employee use when traveling between company facilities in the Boise area. Also purchased and installed 7 new charging stations at various facilities for these vehicles.
High-pressure sodium lighting was replaced with high-efficiency LEDs in an employee parking lot. Solar panels were mounted on each light pole so that energy can be fed back onto Idaho Power’s distribution system when the solar panels produce more energy than the LED lights consume.
12 of 12


Summary of Expected Benefits
Enhance Transmissionand
Distribution Network
Enhance abilityto save energy and
reduce peak demand
Enhance customerservice and lower cost
of utility operations
Enhance ability todevelop renewable resources
and distributed generation
Advanced Metering Infrastructure Current Benefits Current Benefits
Use of Technology and Process Changes to Improve Workforce Efficiency
Future Benefits
Automated Volt/VAr Management System Pilot Future Benefits
Available Transfer Capacity Calculation Tool Current Benefits
Conservation Voltage Reduction Enhancements
Future Benefits
Customer Relationship Management Future Benefits Future Benefits
Direct Load Control Current Benefits Current Benefits
Distribution System Communications Strategy Future Benefits
Dynamic Line Rating Pilot Current Benefits
Electric Vehicle Charging Impacts Study Future Benefits
ENGO Solid State Reactive Power Compensation Device Pilot
Current Benefits
Ice-Based Thermal Energy Storage Future Benefits Future Benefits
Idaho Power Enterprise Data Warehouse Current Benefits
Implement Additional AMI Outage Scoping and Restoration Confirmation Functionality
Future Benefits Future Benefits
Implementation of Automated Connect/Disconnect Capability at Selected Locations
Current Benefits
Integrated Demand Response Resource Control
Future Benefits Future Benefits
Meter Data Management System Upgrade Current Benefits
1
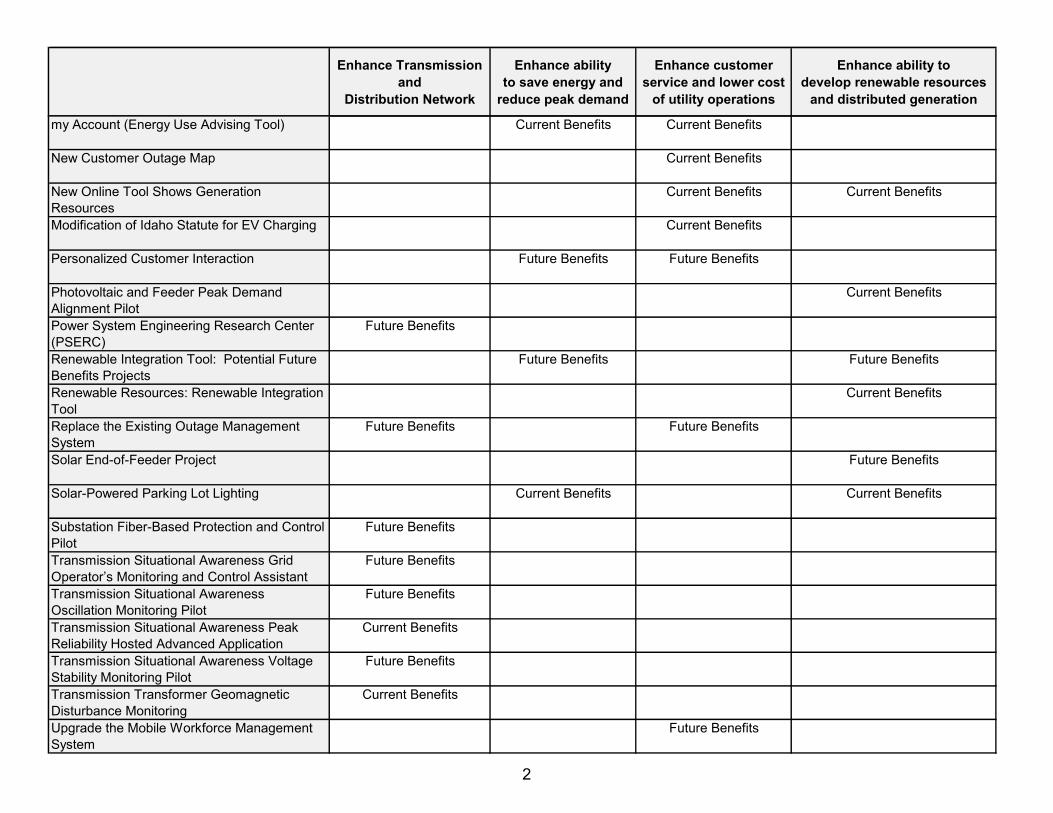
Summary of Expected BenefitsEnhance Transmissionand
Distribution Network
Enhance abilityto save energy and
reduce peak demand
Enhance customerservice and lower cost
of utility operations
Enhance ability todevelop renewable resources
and distributed generation
my Account (Energy Use Advising Tool) Current Benefits Current Benefits
New Customer Outage Map Current Benefits
New Online Tool Shows Generation Resources
Current Benefits Current Benefits
Modification of Idaho Statute for EV Charging Current Benefits
Personalized Customer Interaction Future Benefits Future Benefits
Photovoltaic and Feeder Peak Demand Alignment Pilot
Current Benefits
Power System Engineering Research Center (PSERC)
Future Benefits
Renewable Integration Tool: Potential Future Benefits Projects
Future Benefits Future Benefits
Renewable Resources: Renewable Integration Tool
Current Benefits
Replace the Existing Outage Management System
Future Benefits Future Benefits
Solar End-of-Feeder Project Future Benefits
Solar-Powered Parking Lot Lighting Current Benefits Current Benefits
Substation Fiber-Based Protection and Control Pilot
Future Benefits
Transmission Situational Awareness Grid Operator’s Monitoring and Control Assistant
Future Benefits
Transmission Situational Awareness Oscillation Monitoring Pilot
Future Benefits
Transmission Situational Awareness Peak Reliability Hosted Advanced Application
Current Benefits
Transmission Situational Awareness Voltage Stability Monitoring Pilot
Future Benefits
Transmission Transformer Geomagnetic Disturbance Monitoring
Current Benefits
Upgrade the Mobile Workforce Management System
Future Benefits
2


An Evolving Grid Provides Modern Benefits for Customers Deep in Hells Canyon, the Snake River spins a massive electrical turbine. In the wind-swept hills of northeastern Oregon, large blades atop tall towers spin in the breeze.In the western Idaho desert, water vapor rises from cooling towers at a natural-gas-fired power plant. In a sunny parking lot in downtown Boise, solar panels on light poles turn sunshine into electricity.
What ties all of these things together? The electrical grid. The grid brings
energy from hundreds of different sources and delivers it to you 24 hours a day. It’s all around us, but most people rarely give the grid a second thought.
This magnificent machine is more than the wires and poles you see every day. It includes advanced equipment like breakers, relays, switches and transformers. Sophisticated technology monitors and responds to constant changes in supply and demand. Vast sections of the grid run underground, unseen and unnoticed, but critical. The
grid is flexible, reliable, and crosses thousands of miles of rugged terrain to ensure power is available at the flip of a switch.
Here’s a closer look at Idaho Power’s electrical grid and how it serves you.
Evolution
What began more than a hundred years ago as little more than a string of wires carrying power from Swan Falls Dam
CoverThe Grid Connects People, Technology and Power
Page 2Grid Components Play Important Roles
Page 3Idaho Power Parking Lot Features Solar Lighting
Page 2Sustained Power Outages Decline
Like us at facebook.com/idahopower • Follow us at twitter.com/idahopower (@idahopower) • Watch us on youtube.com/idahopower
(continued on page 2)
ConnectionsJuly 2015
Idaho Power Lineman Graham Beswick works on a transmission line near Warm Lake. Transmission lines are the “freeways” of the grid.

2
to Silver City mines now touches every corner of Idaho Power’s service area. Nearly 32,000 miles of transmission and distribution lines deliver electricity to more than half a million homes and businesses across 24,000 square miles.
This modern electrical grid is evolving, allowing us to use electricity more wisely and do things that seemed impossible not long ago.
What was once merely a way to deliver energy is now a dynamic two-way channel. Customers can monitor their own energy use on a daily basis. Modern meter technology allows accurate, up-to-date usage info to be sent securely over the same lines that
deliver power. Grid operators can more quickly identify trouble spots, increasing reliability and reducing the length of outages.
The modern grid constantly balances customer use and energy generation, and it is flexible enough to handle bigger changes, such as the increasing use of renewable energy and the need to charge electric vehicles.
Wind, Sun and Water Power
The grid integrates new renewable energy sources like solar and wind with “baseload” resources like hydro, natural gas and coal. The grid enables energy to flow from anywhere it’s being generated to wherever our customers need it. When the sun isn’t shining or the wind
Evolving Grid (continued from page 1)News Feed
Reliability Data Show ImprovementThe grid is highly reliable. It provides the power you need, when you need it. The System Average Interruption Frequency Index chart below reflects the annual average frequency of sustained power outages (those lasting five minutes or longer) on Idaho Power’s system. There has been an overall decline, showing an improvement in system reliability. This was accomplished through maintenance programs that replace or repair aging or failing assets, installing animal guarding, adding protective devices and clearing vegetation around power lines.
Components of the Grid Have Important RolesThe electrical grid has many components. Here are some of the key pieces that make up the grid and bring power to your door.• Power generation sources like hydroelectric dams, coal and natural gas plants, and renewable sources like wind and solar.• Transmission lines move large amounts of electricity from where it’s generated to the areas where it’s used. Transmission lines also connect utilities to promote greater reliability of the regional grid systems. • Substations house equipment that switches, changes or regulates electric voltage. • Distribution lines deliver electricity to customers (including homes and businesses). • Smart meters record hourly energy use and monthly total energy use. To access your smart meter data, register or log in to myAccount at idahopower.com.
idahopower.com/reliability
News Feed
The many components of the electrical grid are interconnected. Each has an important role to play in bringing you reliable, fair-priced power.
Sustained Interruptions Per Customer
2.672.48
3.05
2.211.98 1.91
1.67
1.191.47 1.41
1.22
20040
0.5
1.0
1.5
2.0
2.5
3.0
3.5
2005 2006 2007 2008 2009 2010 2011 2012 2013 2014

3
stops blowing, other resources like hydro and natural gas can respond by increasing their output. The addition of solar and wind farms to our region makes the grid’s flexibility even more valuable.
Small-scale generation projects installed by individuals or businesses access the grid through a program called Net Metering. Most of these projects are solar panels, although some small wind and hydro projects are connected as well. When customers generate more electricity than they use, the excess energy flows back to the grid, earning customers credits on their monthly bill. When they need more than they produce, net metering customers use energy from the grid.
Reliability Upgrades
When you see Idaho Power crews working in your neighborhood, chances are they are taking steps to improve the reliability of your electrical service.
Idaho Power spends millions each year to ensure electricity is always there when you need it. We have many programs in place specifically to maintain reliable electric service. These include strengthening power lines
against things that cause outages, replacing millions of feet of cable, and testing and treating power poles to make sure they’re sound.
We’re also looking into a pilot project that would use solar panels, a battery system and new technology to boost voltages in areas of the grid where they can be weak.
Transmission Benefits
The Boardman to Hemingway transmission line project is a critical part of strengthening the regional electric grid. This proposed high-voltage power line will help integrate wind and solar, and also will provide additional capacity for exchanging energy between the Northwest and the Intermountain West, depending on which region is experiencing the highest demand.
We’re All in This (Grid) Together
Only part of your bill goes to pay Idaho Power for the electricity you use. The majority — about 70 percent — actually pays for building, operating and maintaining the grid that reliably delivers your power. It’s similar to how part of your cell phone bill pays for the communication network that allows it to work.
By maintaining and upgrading equipment, implementing new technology and looking for opportunities to increase reliability, Idaho Power is working to ensure the electrical grid will serve our customers through the 21st century and beyond.
idahopower.com/netmetering
idahopower.com/reliability
boardmantohemingway.com
In July 2013, Idaho Power teamed with Inovus to revamp the lighting in our downtown Boise parking lot. The new system replaced existing high-pressure sodium lighting units with high-efficiency LEDs powered by the sun.
“This project let us investigate Inovus’ technology, and gave us insight into how it can be used in the electric utility of the future,” said Operations Strategy Director Karl Bokenkamp. “It was a tremendous benefit to work with a Boise-based company that’s also a leader in the space.”
The lights feature an integrated, top-mounted solar panel, and each pole is separately metered to measure how much energy the units generate and how much they consume. The goal was to have a “net-zero” system, meaning that over the course of a year, the amount of energy generated during the day would be roughly equal to what the lights consumed at night. And two weeks shy of the system’s one-year anniversary, that’s exactly what happened.
“It’s important to remember that even though the system is net zero, it’s still using energy at night, and it relies on the grid to function,” said Bokenkamp. “That’s the beauty of the system: It produces energy during the day when customer demand is high, and consumes it at night when demand drops off.”
Inovus CEO and co-founder Clay Young was impressed by the installation and excited by the results. “This project successfully demonstrated a very innovative approach to street and area lighting,” said Young. He also was impressed by the seamless interaction between Inovus’ system and the Idaho Power grid.
“The grid is going to play more of a role in the future because it’s going to be the basis for resiliency, and for helping to manage systems
Lighting Project Shows How Solar and the Grid Work Together
Inovus CEO Clay Young
(continued on page 4)

Recipes are selected for nutritional value and low energy use in preparation. They are approved by Registered Dietitians Holly Hutchinson and Erin Green from the Central District Health Department in Boise, Idaho.
Connections is published monthly to inform our customers about services we provide, programs we offer and industry issues impacting our service area in southern Idaho and eastern Oregon. Our goal is to engage and inspire you to learn more about Idaho Power and how we are working together to meet your energy needs today and tomorrow.
Comments or questions are welcome at idahopower.com/contactusor contact us at: Corporate CommunicationsP.O. Box 70, Boise, ID 83707
Printed on recycled paper4
From The Electric Kitchen
DinnerGrilled Chicken-Pineapple Skewers
1 lb boneless, skinless chicken breast2 cups fresh or canned pineapple, cut into 1” cubes (reserve the juice)½ red onion, cut into 1” pieces1 green bell pepper, cut into 1” cubes1 red bell pepper, cut into 1” cubes
Marinade:2 Tbsp olive oil2 Tbsp mustard1 Tbsp pineapple juice2 tsp honey1–2 cloves garlic, crushed
Dietary information per serving:
Calories: 268Fat: 10gCarbohydrate: 20gProtein: 27gSodium: 200mgFiber: 2.8gCholesterol: 65mg
In a small mixing bowl, whisk together marinade ingredients. Cut chicken breast into 1–1 ½ inch pieces, add to marinade and stir to coat. Cover and refrigerate for at least one hour, longer for stronger flavor. If using bamboo skewers, be sure to soak in water for 30 minutes prior to assembling. Metal skewers may also be used. Assemble skewers, alternating chicken, pineapple chunks, onion and peppers (each skewer will have approx. 4 chunks of chicken). Heat grill to medium-high, or 375 degrees. Grill skewers until just beginning to brown, approx. 10 minutes each side. Makes 4 servings of two skewers each.
July 2015
idahopower.�m/saveProgram continuation, eligibility requirements and terms and conditions apply.
S�rthere.
Sav energyis as easy as dial it in.
Raising your thermostat in the summer is a cool idea. You can save up to 3% on air conditioning costs for every degree you turn it up. Live comfortably. Save money.
like ours,” Young said. “When you think about it, the grid is similar to a computer network: Both are composed of electrons moving over a network, and, like the internet, if one system in the network goes down, other systems are there to back it up. For instance, if there’s an issue with one transmission line, the whole electrical grid will not fail.”
In the end, the project demonstrated what can be accomplished when the reliability and convenience of the existing power grid is combined with new technologies like Inovus. This potent combination will continue to create opportunities for customers to have more control over their energy use, and even generate a portion of their supply.
idahopower.com/sustainability
Solar and the Grid (continued from page 3)