SMART SOCIETY SMART LIFE - Trek 2000...
136
SMART SOCIETY SMART LIFE ANNUAL REPORT 2016
Transcript of SMART SOCIETY SMART LIFE - Trek 2000...

SMART SOCIETY SMART LIFE
ANNUAL REPORT 2016

CONTENTS
Introduction 1Chairman’s Message 2Intellectual Property 4Trek’s Patented Solutions 6Pillars of Innovation 8Financial Review 12Board of Directors 14Group Structure 17Key Management 18Corporate Information 20

SMART SOCIETY, SMART L IFE | 1
Listed on the Singapore Stock Exchange (SGX:5AB) in 2000, we offer state-of-the-art design solutions ranging from Interactive Consumer Solutions, Wireless, Antipiracy, Compression and Encryption to sophisticated Enterprise Solutions. As a design solutions provider, Trek operates under an asset-light business model, supported by a portfolio of patents granted across the world. We have offices in the U.S., Malaysia, Thailand, India, Hong Kong, Singapore, the Netherlands, China, Vietnam and Japan in order to serve the rapidly growing digital market.
Trek was named by Forbes Global as one of the Best Small Companies in the World in 2000 and 2002. We were also ranked as the Best Managed Small Company in Singapore by AsiaMoney (of Euromoney). Trek also received the INVENT Singapore Award 2008, the ASEAN Business Award for Innovation in 2011, Asia-Pacific Enterprise Leadership Awards for Spirit of Innovation Award in 2013, and SD Association Leadership Award in 2014. More recently, we were conferred the One Asia – Avant-Garde Award and International Management Action Award in 2015.
Upholding our tagline, “Innovation: Inside Out”, Trek’s core differentiation lies in its R&D expertise. Supported by a team of visionary leaders, we strive to innovate relentlessly and change peoples’ lives for the better.
Trek 2000 International Ltd (Trek) is a global industry innovator, patent owner and inventor of the revolutionary ThumbDrive® USB flash drive. Our vision and mission is to be a leading solutions provider for the Internet-of-Things (IoT) ecosystem.
SMART SOCIETY, SMART L IFE | 1

2 | Trek 2000 International Ltd • Annual Report 2016
CHAIRMAN’S STATEMENT
Dear Shareholders,
On behalf of the Board of Directors of Trek 2000 International Ltd, I am pleased to present you with our annual report for the financial year ended 31 December 2016 (“FY2016”).
Anything that can be connected, will be connectedThe world is becoming more connected than ever. The Internet of Things (“IoT”) has brought about the seamless interaction between us and everyday devices. At its core, IoT is simple: it is about connecting devices over the internet, letting them talk to us, applications, and each other.
According to independent research firm Gartner Inc., 8.4 billion connected things will be in use worldwide in 2017, up 31 percent from 2016, and will reach 20.4 billion by 20201. This phenomenon is nothing new to us as our overarching strategy is to be the leading solutions provider for the IoT ecosystem. For years, we have laid the
groundwork for innovative creations that will transform the way we work, live and interact.
Achieving New Records Against this backdrop and despite a global economy characterised by subdued growth, our asset-light business model delivered a record year of revenue and profitability. Backed by our proven expertise in technological innovations, our cornerstone Interactive Consumer Solutions (“ICS”) segment continued to spearhead growth accounting for 98.4% of our revenue as it gained traction within consumer wearable, medical and cloud technologies. Accordingly, our revenue grew 11.4% year-on-year (“yoy”) to a record US$165.7 million.
Coupled with effective cost containment measures and increased sales of expanded Wi-Fi and IoT module applications, our gross profit surged 351.9% to US$18.4 million alongside a 8.4 percentage point
expansion in gross profit margin to 11.1%. As we executed our growth strategy with new innovations and an expansion of our services, we posted a record US$6.1 million net profit for FY2016.
Additionally, our robust core business operations generated US$9.0 million of positive operating cash flow. This was supported by strengthening business fundamentals as our inventory turnover improved to 26 days (FY2015: 57 days). Amid an uncertain business landscape, we strengthened our balance sheet as cash and cash equivalents increased 21.2% yoy to US$28.4 million. Accounting for loans and borrowings amounting US$2.5 million, our net cash position improved to US$26.7 million as at 31 December 2016.
Positioning for Future GrowthHome to half of the world’s population, Asia presents an abundance of growth opportunities with an ever-rising ageing population and burgeoning
“DESPITE A GLOBAL ECONOMY CHARACTERISED BY SUBDUED GROWTH, OUR ASSET-LIGHT BUSINESS MODEL DELIVERED A RECORD YEAR OF REVENUE AND PROFITABILITY.”

SMART SOCIETY, SMART L IFE | 3
CHAIRMAN’S STATEMENT
middle-class. Together with the prevalence of chronic diseases and the growing affluence in the region, this has collectively led to an increase in demand for high quality medical technology (“Medtech”) products. In the Asia Pacific region alone, the Medtech market is expected to rise from US$88.0 billion in 2015 to US$133.0 billion in 20202. In light of the prevailing industry trends, we have identified the Medtech vertical, which resides within our ICS segment, as our next key driver of growth.
Backed by our longstanding reputation as innovators and supported by a portfolio of patented products, we seek to further penetrate the Medtech market. At present, we have garnered momentum by embedding devices with our proprietary software while leveraging on our Smart Gateway and Cloud platforms to seamlessly collect and exchange data. This has led to the creation of a variety of Medtech devices ranging from Patient Alert System which provides real-time tracking of patient activity to our Smart Sensor for diapers with its humidity and temperature detection functionality.
In addition, we foresee rapid growth in the demand for NAND flash memory products. As a leading external storage solutions provider with a portfolio of our own innovative and patented products and solutions, this augurs well for our ICS and Customised Solutions segments.
While we remain vigilant of global uncertainties, our streamlined operations backed by our net cash position and US$12.4 million worth of quoted and unquoted investments positions us favourably to capture the growth opportunities in the IoT and Data Storage markets.
AppreciationIn a year where we worked hard in attaining a record set of results, I would like to express my sincere appreciation to our shareholders who have stood by us through thick and thin. Following a thorough review of our business processes by Deloitte and Touche Enterprise Risk Services, we have implemented improved policies and procedures along with increased vigilance of our internal controls. As we move forward with unwavering support from our major shareholders, I would like to reiterate our commitment to the highest standards of corporate governance
to protect the interests of all our stakeholders.
In closing, I would also like to express my gratitude to Mr Chan Leng Wai for his invaluable contributions to the Group in recent times. On behalf of the Board of Directors, we wish Mr Chan all the best in his future endeavours as he retires from his role as an Independent, Non-Executive Director. While we thank Mr Chan for his past contributions to the Group, please join me in welcoming Mr Loh Yih as Independent Non-Executive Director to our Board and Member of the Audit Committee.
Being the largest shareholder in the Company, you can trust that my interests are aligned with yours. Trek is what it is today because we are a trailblazer and not a follower. Together, we will continue to pursue our collective dream of transforming lives through our innovative products and solutions.
Henn TanChairman & CEOTrek 2000 International Ltd
Revenue grew
year-on-year (“yoy”)
to a record
million.
11.4%
US$165.7
1 Gartner Inc., Gartner Says 8.4 Billion Connected “Things” Will Be in Use in 2017, Up 31 Percent From 2016, February 20172 McKinsey & Company, Meeting growing Asia–Pacific demand for medical technology, February 2016

4 | Trek 2000 International Ltd • Annual Report 2016
• Personal Vital Signal Storage• Personal Vital Signal Collection• Personal Vital Signal tracking• Personal Vital Signal Analytic• Tracking Vital Signal in
anywhere and any time
Smart Gateway
Fitness Wrist Band monitoring• Heart Rate• SpO2• Body temperature• Activity• Fall down detection
TREK 2000’S MEDTECH ARCHITECTURE
Trek is in a transformative era as we seek to penetrate the IoT segment, in particular Medtech. By embedding devices with proprietary software and sensors, we aim to leverage on our Smart Gateway and Cloud platforms to seamlessly collect and exchange data.
Patient Alert System (PAS)• Real-time tracking of patient
activity
• Vital Signal Data Storage• Vital Signal Data Analytic• Vital Signal Data manage console
Medtech Cloud
Smart Toy with built-in camera• Real-time tracking of user activity• In-built self-motion-sensing ability
Smart Sensor for diapers• Humidity detection• Temperature Detection
Wireless Sensing• Wireless Sensor for 24x7
sample ECG data• Heart Rate• HRV• Respiration rate• Fall down detection

SMART SOCIETY, SMART L IFE | 5
In FY2016, we successfully filed three new patents, further boosting our library of patents granted worldwide. The strength of our R&D remains an integral component for future growth and sustainability.
• Australia • Brazil • Brunei • Canada • China
OUR IP REACH
• Wireless
• USB
• Anti-piracy
• Security/Encryption
• Centralised Management System (CMS)
• Portable Storage Solutions encompassing Flash Memory
• PC and Mobile Apps
• Eurasia • Europe • Germany • Hong Kong • India
• Indonesia • Israel • Japan • Malaysia• New Zealand
• Philippines • Saudi Arabia• Singapore• South Africa • South Korea
• Taiwan • Thailand• UAE • United Kingdom • USA • Vietnam
Inte
llec
tual
Pro
pert
y
OUR PATENTED CORE TECHNOLOGY SOLUTIONS
SMART SOCIETY, SMART L IFE | 5

6 | Trek 2000 International Ltd • Annual Report 2016
1. Wireless Solutions
a. Patient Alert SystemTargeted at patients with dementia, this wearable device comes with in-built sensors and is attached to the base of a patient’s foot. When the device comes into contact with the floor, it will set off an alert via bluetooth to nearby attending medical staff.
b. Flucard®Flucard® is a revolutionary SD card that enables the seamless connection and transfer of digital content between electronic devices. The versatility of the Flucard® has led to the development of an ecosystem encompassing endless possibilities within the IoT segment.
c. ThumbDrive® SmartbandThe wearable ThumbDrive® Smartband is embedded with a USB drive and a variety of fitness-related features. Software developers can also write their own applications on the ThumbDrive® Smartband’s platform.
d. Flucard® UltraFlucard® Ultra is a faster, more advanced version of its original. It allows the wireless sharing of photos and videos as well as upload to the Flucard® portal or server of choice for instantaneous backup.
e. Ai-BallAi-Ball is the world’s smallest portable video camera. The device boasts high quality 2-megapixel video with Wi-Fi streaming of up to 20 metres.
Patient Alert System
Flucard® Pentax ThumbDrive® Smartband
Flucard® Ultra Ai-Ball Smart Gateway Smart Sensor for diapers
ThumbDrive® Hippo
TREK’S PATENTED SOLUTIONS
f. Smart Gateway Trek Smart Gateway is a platform that supports the multiple usage of applications for both clinical and home monitoring in the healthcare domain. The system connects seamlessly to Trek’s Cloud which then collects a client’s personal information and analyses the data. The Smart Gateway coordinates all wireless protocol to Internet or Local Networks for the sharing of resources.
g. Smart Sensor for diapersInadequate detection of wet diapers is the most common cause of a baby’s diaper rash. Trek’s Smart Sensor for diaper is a re-usable IoT device attached to a diaper in order to detect its humidity and temperature. When a diaper gets wet, the device will then immediately notify the parent or care-giver.

SMART SOCIETY, SMART L IFE | 7
ThumbDrive® Cloud
ThumbDrive® Crypto
ThumbDrive® Swipe
ThumbDrive® STRIKES
CHEZThumbDrive® Swipe
ThumbDrive® SWAN
Solid State Drive
2. ThumbDrive® Solutions
a. ThumbDrive® The patented ThumbDrive® is a thumb-sized external portable data storage device that utilises flash memory technologies to store digital data.
b. ThumbDrive® CloudThumbDrive® Cloud is fully integrated with Cloudstringers and provides a platform for users to store, view, share, exchange and transact their digital content.
c. ThumbDrive® Crypto ThumbDrive® Crypto ensures the encryption of all storage with the utilisation of a built-in hardware encryption system. The Advanced Encryption Standard (AES) is the regulatory standard approved by the U.S. Government.
d. ThumbDrive® SwipeThe ThumbDrive® Swipe is equipped with state-of-the-art finger authentication sensor technology to personalise the protection of information on the device.
e. STRIKESSTRIKES, short for “Secure TRansaction, Identity, Key, Encryption & Storage”, is a flash drive with an integrated smart chip for the purpose of secondary authentication for online transactions.
f. ThumbDrive SWANThumbDrive® SWAN (or TD SWAN) drive has the unique Single-Write Access-Numerous (SWAN) feature on the USB flash drive. Files could only
be written once to the drive and will stay intact and pristine. It is well suited for secure storage and archives of important data files.
g. CHEZ Solution CHEZ Solution allows enterprises to protect crucial information by preventing access to all unauthorisedmobile storages devices. CHEZ Solution is widely recognised by government agencies and companies as a top-notch security solution for the digital age.
h. Trek’s Solid State Drive Trek’s Solid State Drive (“SSD”), is a flash based drive that provides an alternative to the commonly used hard disk drive.
Trek’s SSD utilizes an advance flash memory controller that enables it to achieve higher read/write speeds, parallel data transfer and wear-levelling, which optimize performance, reliability and endurance of the device. This drive also delivers improved system responsiveness that improves overall computing experience and faster boot and application loading times. To ensure data protection, Trek’s SSD also incorporates AES data encryption to help users prevent unauthorised data access.

8 | Trek 2000 International Ltd • Annual Report 2016
The world is experiencing the beginning of an IoT Revolution, where the proliferation of connected devices is expected to transform the way we work, live and interact.
Our core principle, “Innovation: Inside Out”, demonstrates our mission to continuously invent products and solutions for the benefit of mankind. Supported by our track record of successfully developing disruptive technologies, our focus lies on developing new innovations within three main segments:
• Medical Technology (Medtech)
• Wearable Technology
• Cloud Technology
Riding the Wave of Digital Revolution
8 | Trek 2000 International Ltd • Annual Report 2016

SMART SOCIETY, SMART L IFE | 9
Vital statistics monitored using Flucard-
enabled devices
Upload vital statistics from device to
cloud seamlessly
Quick transfer of medical info for doctors to access
BRINGING THE DOCTOR TO YOUR DOORSTEPThe global advancement in Medtech is expected to grow at a CAGR of 6% to an estimated value of US$300 billion in 2017. Tapping on this growth opportunity, we aim to introduce game-changing solutions that integrate technology into our current healthcare system. Our mission is to raise the accessibility of healthcare and transform the way it is delivered.

10 | Trek 2000 International Ltd • Annual Report 2016
100 Steps12km Distance
800 Calories
Trackprogress on the go
SMART BODYWEAR FOR THE MODERN CONSUMERThe wearable technology industry is expected to grow at a CAGR of 17.8% till US$31.27 billion by 2020. Apart from consumer wearables such as fitness and medical devices, the birth of wearable scanners and computing devices for warehouse, logistics, and other industrial operations is creating a world of endless possibilities.

SMART SOCIETY, SMART L IFE | 11
Media uploaded in real time to
cloud ecosystem
Exclusive contents are transacted through
Cloud Stringer’s Marketplace
Transacted contents can bedownloaded seamlessly
from Cloud Stringer’sPortal
Capture images & videos with Flucard®-equipped
cameras and all wireless cameras
SHARING CONTENT AT THE TOUCH OF A BUTTONLeveraging on the Flucard® ecosystem, Cloudstringers is an online platform and marketplace that can be used to store, buy or sell content. In addition, Cloudstringers also provides an enterprise solution for television and broadcast stations to streamline processes related to the storage, purchase and download of media digital content.

12 | Trek 2000 International Ltd • Annual Report 2016
FINANCIAL REVIEW
Segmental analysis by business segments
The Group’s Interactive Consumer Solutions (“ICS”) division continues to be the key revenue generator, accounting for 98.4% of overall revenue for the full year ended 31 December 2016 (“FY2016”). The business segment consists of proprietary products and solutions including the Thumbdrive®, Flucard®, Security Solutions, WiFi Memory Modules for embedded devices.
The Customised Solutions (“CS”) segment contributed to 1.6% of overall FY2016 revenue, a decrease compared to a contribution of 5.1% for FY2015. This is a result of the Group’s on-going strategy to allocate its resources to the ICS segment, the Group’s key growth driver.
Segmental analysis by geography
Despite intense competition within the technology industry, the Group extended its market presence within key regions of focus. For FY2016, the China and Hong Kong market was the main contributor to the Group’s revenue, registering substantial year-on-year (“yoy”) growth by more than 100.0% to US$92.4 million. Similarly, the Group reported a more than 100.0% yoy surge in revenue to US$28.1 million in Malaysia.
In Taiwan, the Group’s revenue increased 19.7% yoy to U$12.1 million for FY2016. Conversely, revenue from the United States of America declined marginally to US$4.5 million.
As part of the Group’s strategy to focus on key regions such as China, Hong Kong and Taiwan, revenue from Singapore declined 81.1% yoy to US$22.1 million for FY2016.
Income Statement
For FY2016, the Group reported an 11.4% yoy increase in revenue to US$165.7 million mainly due to growth in both the ICS division and licensing fees.
Correspondingly, the Group posted a strong turnaround, reversing a US$6.6 million loss for FY2015 to a net profit attributable to owners of the Company amounting US$6.1 million for FY2016.
The Group’s performance is attributable to the following factors:
Revenue
The Group’s ICS business reported a 15.5% yoy increase in revenue to US$163.1 million for FY2016 driven by increased sales of expanded Wi-Fi and Internet of Things (“IoT”) memory module applications.
Gross Profit
Backed by effective cost containment measures, the Group’s gross profit increased 351.9% yoy to US$18.4 million. This translated to a 8.4 percentage point expansion in gross profit margin to 11.1%.
Expenses
The Group’s total expenses amounted to US$11.8 million for FY2016 (FY2015: US$13.4 million) representing a decrease of 11.9% yoy. The factors contributing to the changes are:
• Research and development expenses reported a decrease of 21.0% yoy to US$2.9 million for FY2016 (FY2015: US$3.7 million). The decrease was mainly due to a decrease in intangible assets written off and amortisation expense of intangible assets for FY2016.
• Marketing and distribution expenses decreased 21.6% yoy to US$2.5 million for FY2016 (FY2015: US$3.2 million) mainly due to decrease in marketing activities regionally.
Revenue by Segments
Interactive Consumer Solutions Customised Solutions
98.4 % 94.9%
1.6% 5.1%
FY2016 FY2015

SMART SOCIETY, SMART L IFE | 13
FINANCIAL REVIEW
• General administrative expenses increased 5.2% yoy to US$6.2 million for FY2016 (FY2015: US$5.9 million) mainly due to increase in professional fees and decrease in property, plant and equipment written off.
• Other expenses decreased 97.8% yoy to US$0.01 million in FY2016 (FY2015: US$0.4 million) mainly due to no foreign exchange loss in FY2016.
Net profit after tax attributable to owners of the Company
Despite the challenging economic environment, the Group reported a net profit attributable to owners of the Company of US$6.1 million in FY2016 as compared to a US$6.6 million loss for FY2015.
Balance Sheet
Key highlights
Group
• Property, plant and equipment – The increase in the Group’s property, plant and equipment was mainly due to additions and offset by depreciation charge and impairment loss during the year.
• Intangible assets – The Group’s intangible assets decreased by US$1.6 million was mainly due to write-off of capitalised development cost to profit or loss and amortisation during the year.
• Quoted investments – The Group’s investment in quoted investment increased by US$3.5 million to US$12.2 million as at 31 December 2016 compared to US$8.7 million as at 31 December 2015. This was due to additional investments made in quoted investments.
• Inventories – The Group’s inventories amounted to US$10.3 million as at 31 December 2016, a decrease by US$12.2 million from US$22.5 million as at 31 December 2015. Inventory turnover is 26 days in FY2016 (FY2015: 57 days).
• Trade and other receivables – The Group’s trade and other receivables amounted to US$17.1 million as at 31 December 2016 compared to US$15.9 million as at 31 December 2015. Trade receivables turnover is 20 days in FY2016 (FY2015: 20 days).
• Trade payables and accruals – The Group’s trade payables and accruals amounted to US$14.5 million as at 31 December 2016 compared to US$29.5 million as at 31 December 2015. Trade payables turnover is 36 days in FY2016 (FY2015: 74 days).
Company
• Investment in subsidiaries – The Company’s investment in subsidiaries decreased by US$1.7 million was mainly due to impairment made during the year.
• Trade and other receivables – The Company’s trade and other receivables decreased by US$25.6 million was mainly due to repayments made by subsidiaries amounting to US$13.1 million and impairment made on long outstanding receivables from subsidiaries amounting to US$12.4 million.
Cashflow Statement
The Group’s core business operations generated US$9.0 million of positive operating cash flow for FY2016.
The Group’s net cash used in investing activities amounted US$4.3 million while net cash generated from financing activities amounted US$0.3 million for FY2016.
The Group’s cash and cash equivalents as at 31 December 2016 amounted US$28.4 million compared to US$23.5 million as at 31 December 2015 which was reflective of the net cash generated from operating activities and net cash used in investing activities.
73.9
Revenue (In USD Millions)
165.
7
80.411
0.9
2016 2015 2014 2013 2012
148.
8

14 | Trek 2000 International Ltd • Annual Report 2016
BOARD OF DIRECTORS
1. Mr. Henn Tan Chairman, Chief Executive Officer and Executive Director Mr. Tan is Chairman and Chief Executive Officer of the Company. Mr. Tan has been an Executive Director since the Company’s inception. As Chairman and CEO, he is responsible for leading Management in building and developing the Group’s operations as well as strengthening its management structure for future growth and expansion. He holds a Bachelor of Science degree from University of Ireland.
Mr. Tan has more than 20 years’ experience in the electronics industry and has received the following awards:
• Ernst & Young Emerging Entrepreneur of the Year in 2002.
• He is a holder and inventor of numerous patents worldwide.
• The INVENT Singapore Award 2008.
• Special Achievement Award of the Year 2010 by Asia Pacific Entrepreneurship.
• Engineering Leadership Award by the Institute of Electrical and Electronics Engineer Inc (IEEE) in 2011.
• Rotary ASME Entrepreneur of the year for Innovation in 2011.
• Spirit of Innovation Award 2013 conferred by Asia-Pacific Enterprise Leadership Awards (APELA).
He is a Director of Ren Ci Hospital Limited since November 2010. He does not hold any directorship or chairmanship in other listed companies presently and over the preceding three years.
2. Mr. Khor Peng SoonIndependent, Non-Executive Director and Lead Independent Director Mr Khor joined the Board on 4 February 2013 and was appointed as Member of the Remuneration Committee on
30 April 2013 and Chairman of the Risk Review Committee on 10 May 2013. He was appointed as Member of the Nominating Committee on 8 May 2014 and Member of the Audit Committee on 15 May 2015.
He is the Chairman of ONI Global Pte Ltd. In this capacity, he oversees the company’s GNC retail operations and shops in Singapore, Malaysia and Taiwan. He is also the Managing Director of JP Ying Advisory and the Executive Director of Reborne Pte Ltd. He sits on the board of another publicly listed company Plastoform Holdings Limited and the boards of several other private companies.
Mr. Khor previously held senior management positions in Temasek Holdings, SembCorp, EY and the EDB. He holds a Master of Engineering Science (Industrial Engineering) degree from the University of New South Wales, Australia.
1 2

SMART SOCIETY, SMART L IFE | 15
BOARD OF DIRECTORS
3. Dr. Long Ming Fai, Edwin Executive Director and Deputy Chief Executive Officer Dr Long Ming Fai Edwin joined the Board as an Independent Director and Member of Audit Committee and Risk Review Committee on 15 May 2015. Subsequently, he has been appointed as Executive Director on 1 October 2015. He was subsequently appointed as a Deputy Chief Executive Officer (CEO) on 2 June 2016. He ceased as Member of Audit Committee on 12 July 2016
Prior to his appointment as the Deputy CEO, he was the President, IT Division at New Silkroutes Group Ltd and Director of Digiland (Thailand) Co. Ltd.
Dr Long has more than 25 years of experience in the product development and business management of IT electronics and consumer electronics products. He was also instrumental
in starting up various electronics companies developing and marketing IT products and appliances.
He holds a Bachelor of Engineering (Hons) in Mechanical Engineering and a Ph.D. in Engineering (Control Systems).
He does not hold any directorship or chairmanship in other listed companies presently and over the preceding three years.
4. Mr. Chay Yee Meng Independent, Non-Executive Director Mr Chay Yee Meng re-joined the Board on 22 March 2016 and was appointed as Independent Non-Executive Director and Chairman of Audit and Nominating Committees.
He is Chairman of Autoscan Technology Pte Ltd. Mr. Chay retired from the Board of National Kidney Foundation on 29 Nov 2012,
but stays on as a member of the National Kidney Foundation Finance Committee. He is also a member of SMU Business School Advisory Board. Mr. Chay was a founding Board member of ECS Holding Ltd and was its Audit Committee member 2002 to 2007, and founding Director and Chief Financial Officer of Natsteel Electronics Ltd from 1993 to 2000, then as Head of Finance of Solectron Technology Asia Pacific Region from 2001 to 2002. He has more than 20 years experience in the electronics industry.
He graduated with a Bachelor of Accountancy degree from Nanyang University and is a FCA of ISCA (Fellow member of Institute of Singapore Chartered Accountants) since 1983.
He does not hold any directorship or chairmanship in other listed companies presently and over the preceding three years.
3 4

16 | Trek 2000 International Ltd • Annual Report 2016
BOARD OF DIRECTORS
5. Ms. Celine Cha Mui Hwang Independent, Non-Executive Director Ms Celine Cha Mui Hwang was appointed as Independent Non-Executive Director of the Company on 1 October 2015 and subsequently appointed as Member of Remuneration Committee and Risk Review Committee on 22 March 2016.
Ms Cha is the Project Director, Merger & Acquisition of OSIM International Ltd and has been with the company for 21 years. Prior to heading Merger & Acquisition, she was the Chief Merchandising Officer and was instrumental in the development and design of OSIM products as well as the global Purchase and Shipping Operations.
She is a graduate with an Advanced Diploma in Marketing from the then PSB Academy.
She does not hold any directorship or chairmanship in other listed companies presently and over the preceding three years.
6. Mr. Chan Leng Wai Independent, Non-Executive Director Mr Chan Leng Wai was appointed as Independent Non-Executive Director and Member of Audit Committee on 3 June 2016.
He is the Founder and CEO of PeopleNet Associates Pte Ltd and PeopleNet Associates Sdn Bhd, a Business and HR Consultancy firm with offices in Singapore and Malaysia. Prior to this he held senior corporate positions including those of General Manager and Chief Financial Officer with a South East Asian trading group and a US Technology company in Singapore and Hong Kong.
Mr. Chan has a Master in Management Studies and was a Fellow of the Chartered Association of Certified Accountants (FCCA), Fellow of the Chartered Institute of Management Accountants (FCMA) and Member of the Chartered Institute of Marketing (MCIM). He was also the President of CIMA Singapore.
He does not hold any directorship or chairmanship in other listed companies presently and over the preceding three years.
7. Mr. Loh Yih Independent, Non-Executive DirectorMr Loh Yih joined the Board on 31 May 2017 and was appointed as Independent Non-Executive Director and Member of Audit Committee.
He is currently the Executive Chairman of Acesian Partners Limited, listed in Singapore, overseeing the performance of the Group. He is also the Managing Partner of MGF Capital Group. He sits on the board of other publicly listed companies in Singapore such as Ban Leong Technologies Limited and International Press Softcom Limited as Independent Director. Besides that, he is also the Independent Director of Weichai Power Co. Ltd listed in Hong Kong and Shenzhen.
Mr. Loh was previously the Managing Director of Netplus Communications Pte Ltd, an internet service provider. He was also previously held senior positions in Standard Chartered Merchant Bank and West Merchant Bank.
He graduated from the National University of Singapore with a Bachelor of Accountancy (Honours). He is also a Chartered Financial Analyst.
5 6 7

SMART SOCIETY, SMART L IFE | 17
GROUP STRUCTURE
TREK 2000 International Ltd
Trek Technology(Singapore) Pte Ltd
100%
Trek Technology (India) Pvt Ltd
Domestic Branches: Bangalore, New Delhi, Chennai and Mumbai
100%
Cloud Stringers(S) Pte Ltd
65.6%
Unimemory Technology(S) Pte Ltd
75.7%
T3 Solutions (HK) Limited
100%
S-Com System (S)Pte Ltd100%
Trek Technology(Thailand) Company Ltd
100%
Trekstor USA Inc.100%
Racer TechnologyPte Ltd
19%
Japan-Singapore Future Technology Lab Pte Ltd
100%
Trek Systems (M) Sdn BhdBranch Offices:
Penang and Kuala Lumpur100%
ThumbdriveMedia Sdn Bhd
100%
Trek Technology (Shanghai) Co. Ltd
Domestic Branches: Shenzhen and Beijing
100%
Trek Technology(HK) Co. Ltd
100%
Trek Systems(Shanghai) Co Ltd
100%
Trek TechnologyEurope B.V.
100%
Trek TechnologyJapan Office
100%
Trek Technology,Ho Chi Minh Vietnam
Rep. Office100%
Trek Technology,Philippines Rep. Office
100%
SMART SOCIETY, SMART L IFE | 17

18 | Trek 2000 International Ltd • Annual Report 2016
Mr. Willy Koh Kee Joo CEO, Racer Technology Pte Ltd Mr. Koh is the Founder/Chief Executive Officer (Corporate) of Racer Technology Pte Ltd. He has more than 28 years’ experience and is responsible and oversees the smooth operations of all the factories. He heads the R & D division for medical devices and prototyping and has few product patterns under his name.
Beside Racer he also a co-founder of five start-up companies, and was a recipient of successful Entrepreneur for 2011, SME1 Asia 2011 Award. He holds an Advance Diploma in Mechanical Engineering, diploma in Chemical Process (Gold Medallist). He is a member of The Institution of Manufacturing Engineer England since 1991, Senior Member of Society of Manufacturing USA since 2000 and member of Machining Technology Association MTA.
Mr. Tan Kuok Keong, Freddie Chief Financial OfficerMr. Tan joined the Group on 5 January 2017. He is responsible for overseeing the Group’s financial and management accounting, taxation and corporate compliance matters.
Mr Tan has more than 16 years of experience in accounting, audit and finance-related work. Prior to joining the Company, he was the Group Financial Controller of a Catalist listed company on SGX-ST, where he was responsible for the group’s finance and accounting functions and ensuring compliance with financial reporting standards and corporate governance.
Mr Tan previously worked in Big Four accounting firms as Senior Audit Manager where he was responsible for the audits of listed and multi-
national companies, and small and medium enterprises across various industries.
Mr Tan is a Chartered Accountant of Singapore and non-practicing member of the Institute of Singapore Chartered Accountants. He holds a Bachelor of Accountancy from Nanyang Technological University.
Mr. Foo Kok WahPresident, Operations, Sales and Customised Solutions Division Mr. Foo joined The Group in 1991 as its General Manager (Sales & Marketing) and helped propelled the growth of its network of subsidiaries. Mr. Foo has been involved in the electronics industry for more than 20 years and is also responsible for the overall performance of the Group’s Sales Operations and Customised Solutions division.
Dr. Shew Paul WaieHead of R&D, Software Dr. Shew joined the Group in 2006 and brings with him 25 years of experience. He is responsible for the overall planning and development of software and hardware capabilities. Dr. Shew received his Bachelor of Engineering degree and Ph.D in Electrical Engineering from the National University of Singapore.
Mr. Lee Chia Ta Executive Director/Chief Operation Officer, Racer Technology Pte Ltd. Mr. Lee is the Executive Director/Chief Operation Officer (Corporate) of Racer Technology Pte Ltd. He has more than 20 years’ experience in managing manufacturing operations, especially injection moulding line and quality control requirements. He holds qualify certificate in Manufacturing.
Mr. Kuan Mun KwongPresident, Global Marketing/Sales, Strategic Business Mr MK Kuan currently heads the Strategic Business reporting directly to the CEO. He has more than 18 years’ experience in International Sales and more than 12 years’ experience in Engineering.
He has extensive knowledge of the global markets from US, Europe to Asia including Japan. He was also based in China’s Beijing and Shenzhen for 3 years to develop and establish partnerships. As an engineer, he was Thomson’s STAR performer and an inventor and holder to a patent.
Mr Kuan holds a Diploma in Electronics Engineering.
Mr. Chan Koon KeetHead of R&D (Firmware), Kuala Lumpur, Malaysia. Mr. Chan is the Group’s Senior Engineer and Head of R&D & Firmware in Kuala Lumpur, since 2001 is responsible for the project planning and execution of the Group’s firmware based projects. Mr. Chan holds a Degree in Electrical & Electronics Engineering.
Mr. Tan Chun Liang, NickCountry Manager – Thailand Mr. Nick Tan as Country Manager, he is responsible for the overall Marketing and Sales, Planning and Strategy in Thailand, since 2005. He is also managing the retail and hypermarkets channels in Singapore. He holds a Diploma in Business and Management (Monash Australia) and Business Marketing Certificate of Chartered Institute of Marketing.
KEY MANAGEMENT

SMART SOCIETY, SMART L IFE | 19
and Sales, Planning and Strategy in Vietnam. He majored in Business Administration from the Hue Scientific University.
Mr. Wayne Tan Joon YongDirector – Cloud Stringers (S) Pte LtdTan Joon Yong Wayne is the founder, a shareholder and a director of Cloud Stringers, a subsidiary of the Company, since 2012 and is responsible for the overall Marketing and Sales, Planning and Strategy. Wayne led the online/web-based Cloud Stringers product and functional and User specification definitions, construction of technological and feature roadmap. He continues to develop strategic partnership in implementing online/web-based business value propositions for ready to market fulfilment.
Mr. Wayne Tan holds a Bachelor of Marketing & International Business from The University at Buffalo, State University of New York.
Mr. Gopu SivaCountry Manager – IndiaMr. Gopu Siva joined the Group since 1997 and has developed his capabilities to his current position as Country Manager, India. As Country Manager, he is responsible for the overall Marketing and Sales, Planning, Strategy, Accounting and Administrations in India. He is the holder of an Engineering Degree from University of Kerala.
Mr. Eddie Chan Kam LoyCountry Manager – Indonesia Mr. Eddie Chan as Country Manager, he is responsible for the overall Marketing and Sales, Planning and Strategy in Indonesia, since 2009. He is also managing the retail and hypermarkets channels in Malaysia. He holds a Diploma in Commerce.
Mr. Nguyen Phuc NinhSenior Sales Manager – Vietnam Mr. Nguyen joined the Group in 2015 and as Senior Sales Manager is responsible for the overall Marketing
KEY MANAGEMENT
Mr. Junichi Yamazaki Country Manager – Japan Mr. Junichi as Country Manager and Partnership Progamme Management is also responsible for the Planning and Strategy in Japan, since 2010. He holds a Master’s Degree in Engineering, Electric Engineering, Keio University, Yokohama, Japan.
Mr. Zhao Lin Country Manager – China/ Hong KongMr. Zhao Lin as Country Manager, he is responsible for the overall Marketing and Sales, Planning and Strategy in China/Hong Kong, since 2011. Mr. Zhao Lin holds a Bachelor’s degree in Information and Engineering from Jiangxi University of Science and Technology, Ganzhou City.

20 | Trek 2000 International Ltd • Annual Report 2016
BOARD OF DIRECTORS
Executive:Henn Tan (Chairman and Chief Executive Officer)Dr Long Ming Fai Edwin
Non-Executive and Independent:Chay Yee MengKhor Peng SoonChan Leng WaiCeline Cha Mui HwangLoh Yih
Audit CommitteeChay Yee Meng (Chairman)Khor Peng SoonChan Leng WaiLoh Yih
Nominating CommitteeChay Yee Meng (Chairman) Khor Peng Soon Henn Tan
Remuneration CommitteeKhor Peng Soon (Chairman)Celine Cha Mui Hwang Henn Tan
Risk Review CommitteeKhor Peng Soon (Chairman)Celine Cha Mui Hwang Dr Long Ming Fai Edwin
COMPANY SECRETARYTan Wee Sin
REGISTERED OFFICE30 Loyang Way #07-13/14/15Loyang Industrial EstateSingapore 508769
Telephone number : (65) 6546 6088
Fax number : (65) 6546 6066
www.trek2000.com.sg www.thumbdrive.com www.flu-card.com www.ai-ball.com www.cloudstringers.com
STOCK LISTINGSingapore Stock Exchange Ticker Symbol: TREKISIN CODE: SG 1159-8829-65
CORPORATE INFORMATION
SHARE REGISTRARSBoardroom Corporate & Advisory Services Pte Ltd50 Raffles Place#32-01 Singapore Land TowerSingapore 048623
AUDITORSErnst & Young LLPOne Raffles Quay#18-01 North TowerSingapore 048583
AUDIT PARTNER IN-CHARGE Mak Keat MengDate of Appointment : Since financial year ended 31 December 2014

FINANCIAL CONTENTS
Report on Corporate Governance 22
Directors’ Statement 38
Independent Auditor’s Report 43
Income Statements 47
Statements of Comprehensive Income 48
Balance Sheets 49
Statements of Changes in Equity 51
Consolidated Cash Flow Statement 55
Notes to the Financial Statements 57
Statistics of Shareholdings 121
Notice of Eighteenth Annual General Meeting 123
Proxy Form

22 | Trek 2000 International Ltd • Annual Report 2016
REPORT ON CORPORATE GOVERNANCE
Trek 2000 International Ltd (“the Company”) is committed to maintaining high standards of corporate governance in complying with the Code of Corporate Governance 2012 (“2012 CGCode”) which forms part of the Continuing Obligations of the Singapore Exchange Securities Trading Limited (“SGX‑ST”)’s Listing Manual. Good corporate governance establishes and maintains an ethical environment, which strives to enhance the interests of all shareholders. The Company has adhered to the principles and guidelines of the 2012 CGCode. This report outlines the Company’s corporate governance processes, practices and activities that were in place for the financial year ended 31 December 2016 (“FY2016”), with specific references to the guidelines of the 2012 CGCode.
BOARD MATTERS
Board’s Conduct of its Affairs (Principle 1)
The Board of Directors (“the Board”), which meets at least four times a year, supervises the management of the business and the affairs of the Company and its subsidiaries (“the Group”). The Board’s role is to:
1. provide entrepreneurial leadership, set strategic aims, and ensure that the necessary financial and human resources are in place for the Group to meet its objectives;
2. establish a framework of prudent and effective controls which enables risks to be assessed and managed;
3. review management performance;
4. set the Group’s values and standards, and ensure that obligations to shareholders and other stakeholders are understood and met; and
5. consider sustainability issues as part of its strategic formulation.
To facilitate effective management of the Board, certain functions have been delegated to four Board Committees namely Audit Committee (“AC”), Nominating Committee (“NC”), Remuneration Committee (“RC”) and Risk Review Committee (“RRC”), each of which has its own written Terms of Reference and whose actions are reported to and monitored by the Board. Apart from its statutory responsibilities, the Company has adopted internal guidelines setting forth matters that require Board’s approval. The types of material transactions that require the Board’s approval under such guidelines are as follows:
a) Approval of quarterly results announcements;
b) Approval of annual results and accounts;
c) Declaration of interim dividends and proposal of final dividends;
d) Convening of shareholders’ meetings;
e) Approval of corporate strategy;
f) Authorisation of merger and acquisition transactions; and
g) Authorisation of major transactions.

SMART SOCIETY, SMART L IFE | 23
REPORT ON CORPORATE GOVERNANCE
The Board meets regularly on a quarterly basis and as warranted. Ad hoc meetings are also convened to deliberate on urgent substantive matters. Attendance via telephone conference and conference via audio‑visual communication at Board meetings are allowed pursuant to the Company’s Constitution. The number of Board and Board Committee meetings held in the year and the attendance of each Board member at these meetings are disclosed below.
Board of DirectorsAudit
CommitteeRemuneration
CommitteeNominating Committee
Risk Review Committee
Number of Meetings
Number of Meetings
Number of Meetings
Number of Meetings
Number of Meetings10
Held Attended Held Attended Held Attended Held Attended Held Attended
Mr. Henn Tan 5 4 N.A. N.A. 1 1 2 1 N.A. N.A.
Dr. Long Ming Fai Edwin1 5 5 7 2/2 N.A. N.A. N.A. N.A. 0 0
Mr. Khor Peng Soon 5 5 7 6 1 1 2 2 0 0
Mr. Chay Yee Meng2 5 5 7 5/5 N.A. N.A. 2 1/1 N.A. N.A.
Ms. Celine Cha Mui Hwang3 5 5 N.A. N.A. 1 1 N.A. N.A. 0 0
Mr. Chan Leng Wai4 5 4/4 7 5/5 N.A. N.A. N.A. N.A. N.A. N.A.
Mr. Gurcharan Singh5 5 0/1 N.A. N.A. N.A. N.A. N.A. N.A. N.A. N.A.
Mr. Poo Teng Pin6 5 0/1 N.A. N.A. N.A. N.A. N.A. N.A. N.A. N.A.
Mr. Heng Hang Song Francis7 5 0/0 7 2/2 N.A. N.A. N.A. N.A. N.A. N.A.
Mr. Ng Chong Khim8 5 0/0 7 2/2 1 0/0 2 0/0 N.A. N.A.
Mr. Loh Yih9 5 0/0 7 0/0 N.A. N.A. N.A. N.A. N.A. N.A.
N.A. – Not Applicable
Denotes:1 Dr. Long Ming Fai Edwin was re‑designated as Deputy Chief Executive Officer and Executive Director on 2 June
2016. He ceased as Member of Audit Committee on 12 July 2016.2 Mr. Chay Yee Meng was appointed as Independent Non‑Executive Director and Chairman of Audit Committee
and Nominating Committee on 22 March 2016.3 Ms. Celine Cha Mui Hwang was appointed as Member of Remuneration Committee and Risk Review Committee
on 22 March 2016.4 Mr. Chan Leng Wai was appointed as Independent Non‑Executive Director and Member of Audit Committee on
3 June 2016.5 Mr. Gurcharan Singh resigned from the Board as Executive Director and Chief Financial Officer on 2 June 2016.6 Mr. Poo Teng Pin resigned from the Board as Executive Director on 12 July 2016.7 Mr. Heng Hang Song Francis ceased as Chairman of Audit Committee on 22 March 2016 and resigned as
Independent Non‑Executive Director of the Company on 25 March 2016.8 Mr. Ng Chong Khim ceased as Chairman of Nominating Committee, Member of Audit Committee, Remuneration
Committee and Risk Review Committee on 22 March 2016 and resigned as Independent Non‑Executive Director on 24 March 2016.
9 Mr. Loh Yih was appointed as Independent Non‑Executive Director and a Member of the Audit Committee on 31 May 2017.
10 No Risk Review Committee’s Meeting was held during the year.

24 | Trek 2000 International Ltd • Annual Report 2016
Access to Information (Principle 6)
As a general rule, Board papers are required to be sent to Directors at least seven days before Board meeting so that the Members may better understand the matters before the Board meeting and discussion may be focused on questions that the Board has about the Board papers. In order to ensure that the Board is able to fulfill its responsibilities, management provides the Board with a management report containing adequate and timely information. Such reports cover financial updates with explanations of material variances over previous years’/periods’ actual results. In addition, management will also update the Board on matters of the Company from time to time when necessary.
The Directors have separate and independent access to the Company’s senior management, who together with the Company Secretary, are responsible for ensuring that the Board procedures are followed and that applicable rules and regulations are complied with. Pursuant to the Company’s Constitution, the Company Secretary shall be appointed by the Directors on such terms and for such period as they may think fit. The Company Secretary administers, attends and prepares minutes of all Board meetings. The Company Secretary assists the Chairman in ensuring that board procedures are followed and regularly reviewed to ensure the effective functioning of the Board, and that the Company’s Constitution and the relevant rules and regulations, including the requirements of the Companies Act and the Listing Manual of the SGX‑ST, are complied with. The Company Secretary also assists the Chairman and the Board in implementing and strengthening corporate governance practices and processes.
A formal letter is sent to a director upon his appointment setting out his duties and responsibilities. The Board may take independent professional advice as and when necessary to enable it to discharge its responsibilities effectively. Apart from keeping the Board informed of all relevant new laws and regulations, the Company has an orientation programme for new directors in connection with their duties as Directors which includes detailed presentation by key senior management covering the structure, business, activities and growth strategies of the Group. Depending on their skillsets and background, directors are sponsored for relevant courses, conferences and seminars in order that they can be better equipped to fulfil their governance role and to comply with directors’ obligations. Where there are statutory and regulatory changes that affect the obligations of directors, the Company will organise briefings by external legal counsel.
Board Composition and Guidance (Principle 2)
The Board comprises seven Directors, five of whom namely, Mr. Chay Yee Meng, Mr. Khor Peng Soon, Mr. Chan Leng Wai, Ms. Celine Cha Mui Hwang and Mr. Loh Yih, are Independent Non‑Executive Directors.
A brief description of the background of each Director is presented at the “Board of Directors” section.
The Board, through the NC, reviews the independence of each Independent Director, board structure, size and composition annually. As Independent Directors made up more than half of the Board, there is strong independent element on the Board and no individual or group of individuals is able to dominate the Board’s decision‑making process. The Board consists of high caliber members with a wealth of knowledge, expertise and experience. They contribute valuable direction and insights, drawing from their vast experience in matters relating to accounting, finance, business and general corporate matters.
The NC has reviewed and is satisfied that the current composition and board size is appropriate for effective decision making, having taken into consideration the nature and scope of the Group’s operation.
As five (5) out of its seven (7) directors are Independent Directors, the requirement of the Code that the Independent Directors must made up at least half of the Board, where the Chairman of the Board and the Chief Executive Officer (“CEO”) is the same person and is not an independent director, is satisfied. Each of the Independent Director has confirmed that he does not has any relationship with the Company or its related corporations, its shareholders who have an interest of at least 10% of the Company’s totals voting shares, or its officers including confirming not having any relationship and circumstances set out in guideline 2.3 of the 2012 CGCode, that could interfere, or be reasonably perceived to interfere, with the exercise of independent judgement in carrying out the functions as an Independent Director with a view to the best interest of the Group. The Board and the NC has reviewed, determined and confirmed the independence of the Independent Directors.
REPORT ON CORPORATE GOVERNANCE

SMART SOCIETY, SMART L IFE | 25
The NC is of the view that the multiple board representations held presently by the Directors do not hinder them from carrying out their duties to the Company.
The Board has considered and agreed with the NC’s recommendation to defer the need to set guidelines for maximum directorships in a listed company that a Director can hold. The NC does not make any determination on the tenure of an Independent Non‑Executive Director as the NC takes the view that in ascertaining a Director’s independence, it is his ability to exercise independence of mind and judgment to act honestly and in the best interests of the Company that matters.
The Company has benefited from management’s access to its Directors for guidance and exchange of views both inside and outside the formal environment of Board and Board Committee meetings.
Chairman and Chief Executive Officer (Principle 3)
Since the incorporation of the Company, Mr. Henn Tan has been both the CEO and Chairman of the Board. The Company has benefited from the leadership of Mr. Henn Tan who is knowledgeable about the business of the Company and its subsidiaries. The presence of a majority of Independent Directors on the Board provides the balance to Board deliberations so that powers are not concentrated in the hands of an individual.
Whilst the CEO/Chairman has executive responsibilities for the day‑to‑day operations of the Group, his other responsibilities as Chairman, among others, include:
a) Approving Board meeting agenda and leading the Board to ensure its effectiveness;
b) Reviewing key proposals and Board papers before they are presented to the Board and ensuring that Board Members are provided with accurate and timely information;
c) Monitoring communications and relations between the Company and its Shareholders, between the Board and management, between Executive and Non‑Executive Directors, and between Independent and Non‑Independent Directors, with a view to encouraging constructive relations and dialogue amongst them;
d) Facilitating the effective contribution of Non‑Executive Directors; and
e) Promoting high standards of corporate governance.
The Company has appointed Mr. Khor Peng Soon as the Lead Independent Director who will make himself available to shareholders where they have concerns and for which contact through the normal channels of the Chairman and CEO or Chief Financial Officer has failed to resolve or is inappropriate.
Board Membership (Principle 4)
The NC comprises three members, who at the date of this Report are:
Mr. Chay Yee Meng ‑ ChairmanMr. Khor Peng Soon ‑ MemberMr. Henn Tan ‑ Member
Mr. Chay Yee Meng was appointed as Chairman of the NC with effect from 22 March 2016 succeeding Mr. Ng Chong Khim who had ceased as Chairman of the NC on 22 March 2016. Mr. Chay Yee Meng, is by profession a qualified accountant. The NC, which has written Terms of Reference, is responsible for making recommendations to the Board on all board appointments and re‑appointments, including identifying and short listing suitable candidates. The responsibilities of the NC also include the following:
a) Annual review of skills required by the Board, and the size of the Board;
b) Review the independence of each Director and ensure that the independent directors make up at least half of the Board and also comprise a lead independent director who is a member of the NC;
REPORT ON CORPORATE GOVERNANCE

26 | Trek 2000 International Ltd • Annual Report 2016
c) Review whether a Director is able to and has been adequately carrying out his duties as a Director of the Company, when he has multiple board representations, taking into consideration the directors’ number of listed company board representations and other principal commitments;
d) Decide how the Board’s performance may be evaluated, and propose objective performance criteria to assess effectiveness of the Board as a whole and the contribution of each Director;
e) Formal assessment of the effectiveness of the Board as a whole and each individual Director; and
f) Review and recommend to the Board on relevant matters relating to the board succession plans, development of process for evaluation of Board, Board committees and Directors’ performance, and training programs for the Board, etc.
The NC has in place a formal process for the selection of new Directors and re‑appointment of Directors as follows:
a) The NC evaluates the balance of skills, knowledge and experience of the Board and, in light of such evaluation and in consultation with Board, prepares a description of the role and the essential and desirable competencies for a particular appointment.
b) If required, the NC may engage consultants to undertake research on, or assess, candidates for new positions on the Boards;
c) The NC meets with short‑listed candidates to assess their suitability and ensure that the candidates are aware of the expectations; and
d) The NC makes recommendations to the Board for approval.
The NC also reviews the independence of the Directors as mentioned under Guideline 2.3 of the 2012 CGCode on an annual basis. The NC has affirmed that Mr. Khor Peng Soon, Mr. Chay Yee Meng, Mr. Chan Leng Wai, Ms. Celine Cha Mui Hwang and Mr. Loh Yih are independent and free from any relationship outlined in the 2012 CGCode. Each of the Independent Directors has also confirmed his independence in accordance with the 2012 CGCode. None of the Independent Director has served on the Board beyond nine (9) years from their respective date of appointment. Guideline 2.4 of the 2012 CGCode is therefore not applicable to the Board.
At each Annual General Meeting (“AGM”), one‑third of the Directors with the longest term in office are required to retire and submit themselves for re‑election. At the forthcoming AGM, Mr. Tan Henry @ Henn Tan, Ms. Celine Cha Mui Hwang and Mr. Chan Leng Wai will be due for retirement pursuant to Article 103 of the Company’s Constitution. Mr. Loh Yih, the newly appointed director will submit himself for retirement pursuant to Article 108 of the Company’s Constitution. Mr. Tan Henry @ Henn Tan, Ms. Celine Cha Mui Hwang and Mr. Loh Yih, being eligible, have offered themselves for re‑election. Mr. Chan Leng Wai has indicated that he will not be seeking re‑election as Director of the Company and will retire at the conclusion of the AGM. Upon Mr. Chan Leng Wai’s retirement, he will cease to be the member of the Audit Committee.
Mr. Tan Henry @ Henn Tan will, upon re‑election as Director, remains as the Chairman, Chief Executive Officer and Executive Director and a member of Remuneration and Nominating Committees.
Ms. Celine Cha Mui Hwang will, upon re‑election as Director, remains as a member of the Remuneration and Risk Review Committees. The Board considers Ms. Celine Cha Mui Hwang to be independent for the purpose of Rule 704(8) of the SGX‑ST Listing Manual.
Mr. Loh Yih will, upon re‑election as Director, remains as a member of the Audit Committee. The Board considers Mr. Loh Yih to be independent for the purpose of Rule 704(8) of the SGX‑ST Listing Manual.
The NC has recommended and the Board has agreed for the aforesaid Directors who are due for retirement pursuant to Article 103 and Article 108 of the Constitution of the Company, to seek re‑election at the forthcoming AGM.
REPORT ON CORPORATE GOVERNANCE

SMART SOCIETY, SMART L IFE | 27
In making the recommendation, the NC considers the overall contribution and performance of the Directors.
Key information regarding Directors such as shareholding in the Company and its related corporations, directorships or chairmanships both present and those held over the preceding three years in other listed companies are set out in the “Board of Directors” section of this annual report.
As at the date of this Report, there was no Independent Director being appointed as a Director of the Company’s principal subsidiaries. The Board will inform the revised Board structures of the principal subsidiaries and the appointment of Independent Director into the principal activities from time to time.
The Company does not have any alternate Directors as the Board does not encourage the appointment of alternate Directors unless it is an exceptional case.
The date of each of the Directors’ initial reappointment, last re‑election is set out below:
AgeAcademic & professional qualifications
Board committee as Chairman or Member
Directorship: date of first appointment/ Date of last re-election
Board appointment whether executive or non-executive
Due for re-election at next AGM
Name of Director:
Mr. Henn Tan 60 Bachelor of Science degree from University of Ireland
Member:‑ RC; and‑ NC
Mr. Henn Tan was appointed as Director on 23 September 1999 and was last re‑elected on 24 April 2015
Executive Chairman & CEO
Yes (Article 103)
Mr. Chay Yee Meng
61 Bachelor of Accountancy degree from Nanyang University and Fellow member of Singapore Chartered Accountants (FCA)
Chairman:‑ AC; and‑ NC
Mr. Chay was appointed on 22 March 2016 and was last re‑elected on 14 October 2016
Non‑Executive / Independent
N.A.
Mr. Khor Peng Soon
67 Master of Engineering Science degree from University of New South Wales, Sydney, Australia
Chairman:‑ RC; and‑ RRC.
Member:‑ AC; and‑ NC
Mr. Khor Peng Soon was appointed on 4 February 2013 and was last re‑elected on 14 October 2016
Non‑Executive / Independent
N.A.
Dr. Long Ming Fai Edwin
53 Bachelor of Engineering with Honours from the University ofStrathclyde and a Ph.D in Control Systems from the University of California.
Member:‑ RRC
Dr. Long Ming Fai Edwin was appointed on 15 May 2015 and was last re‑elected on 14 October 2016.
Deputy CEO & Executive Director
N.A.
Ms. Celine Cha Mui Hwang
50 Advanced Diploma in Marketing from PSB Academy
Member:‑ RC; and‑ RRC.
Ms. Cha was appointed on 1 October 2015 and was last re‑elected on 14 October 2016.
Non‑Executive / Independent
Yes (Article 103)
Mr. Chan Leng Wai
60 Master in Management Studies; was a Fellow of the Chartered Association of Certified Accountants (FCCA); was a Fellow of the Chartered Institute of Management Accountants (FCMA) and was a Member of the Chartered Institute of Marketing (MCIM)
Member:‑ AC
Mr. Chan Leng Wai was appointed on 3 June 2016 and was last re‑elected on 14 October 2016.
Non‑Executive / Independent
N.A.
Mr. Loh Yih 53 Honours Degree in Accountancy from Nanyang University of Singapore and Chartered Financial Analyst
Member:‑ AC
Mr. Loh Yih was appointed on 31 May 2017
Non‑Executive / Independent
Yes (Article 108)
REPORT ON CORPORATE GOVERNANCE

28 | Trek 2000 International Ltd • Annual Report 2016
Board Performance (Principle 5)
The NC undertakes an annual evaluation of the overall effectiveness of the Board. Based on the recommendations by the NC, the Board has established processes and objective performance criteria for evaluating the effectiveness of the Board as a whole and the effectiveness of the individual Directors. The performance criteria for the Board evaluation include the size and composition of the Board, the Board’s access to information, Board proceedings, the discharge of the Board’s functions and the communications and guidance given by the Board to the Management.
Each director also undertakes a self‑assessment to evaluate their contribution to the Board. This self‑assessment process takes into account, inter alia, the commitment, value of contribution to the development of strategy, availability at board meetings, interactive skills, degree of preparedness, industry awareness and business knowledge and experience of each director.
The results of the evaluation exercise will be considered by the NC, which will then make recommendations to the Board, aimed at assisting the Board to discharge its duties more effectively.
Each member of the NC shall abstain from participating in any deliberations of the NC in respect of the assessment of his/her own performance or re‑nomination as Director.
The Board comprises members with considerable years of experience in the industry, technology, finance and management. Each member brings to the Board his expertise in the relevant fields to make balanced decisions. The NC is of the view that the performance of the Board as a whole is satisfactory. The Board’s performance is ultimately reflected in the performance of the Group.
REMUNERATION MATTERS
Procedures for Developing Remuneration Policies (Principle 7)
The RC comprises the following members:
Mr. Khor Peng Soon ‑ ChairmanMs. Celine Cha Mui Hwang ‑ MemberMr. Henn Tan ‑ Member
The Board recognises that the composition of the RC is not in accordance with the 2012 CGCode’s guidelines that the RC should be made up entirely Non‑Executive Directors. However, the Board is of the view that the current composition of the RC is able to provide the necessary objective inputs to the various decisions made by the Board. Mr. Henn Tan, the member and Executive Chairman & CEO, also abstains from all discussions, deliberations and decision of his own remuneration.
The members of the RC carry out their duties in accordance with the Terms of Reference, which include the following:
a) Advising the Board on the framework of remuneration policies for Executive, Non‑Executive Directors and key management personnel;
b) Reviewing and approving the granting of share options to the Executive Directors;
c) Reviewing and approving the award of aggregate variable cash bonuses and share options to the employees of the Group; and
d) Overseeing management development and succession planning in the Group.
REPORT ON CORPORATE GOVERNANCE

SMART SOCIETY, SMART L IFE | 29
The Company adopts a formal procedure for the fixing of the remuneration packages of individual Director. No Director is involved in deciding his own remuneration. In settling remuneration packages, the Company takes into account remuneration conditions within the same industry benchmarking against comparable companies, as well as the Group’s relative performance.
The RC reviews the fairness and reasonableness of the termination clauses of the service agreements of the Executive Directors and key management personnel to ensure that such contracts of service contain fair and reasonable termination clauses which are not overly generous, with an aim to be fair and avoid rewarding poor performance.
Where necessary, the RC will consult external professionals on remuneration matters of the Directors and key management personnel. No remuneration consultants were engaged by the Company in FY2016.
Level and Mix of Remuneration (Principle 8)
Executive Directors do not receive directors’ fees. The remuneration policy for Executive Directors and Senior Management staff consists of three key components, that is, fixed cash, annual variable and long‑term incentive. The fixed component includes salary, pension fund contributions and other allowances. The variable component takes into account the risk policies of the Company and comprises a performance based bonus which forms a significant proportion of the total remuneration package of the Executive Directors and is payable on the achievement of individual and corporate performance targets. The long‑term incentive is granted based on the individual employee’s performance and contributions. The remuneration policy has been endorsed by the RC and the Board.
The RC also administers the Trek 2000 International Ltd Share Option Scheme 2011 (the “2011 Scheme”) and determines the grant of share options to eligible participants. The 2011 Scheme and other components of the remuneration package for Executive Directors and Senior Executives serve as an added incentive.
Generally, remuneration matters relating to the Directors and key Executives are reviewed and recommended by the RC to the Board for approval, except for some standard components of the key executives’ remuneration, like annual salary review and company‑wide bonus payment, which will be reviewed and authorised by the senior management of the Company.
Non‑Executive Directors are paid a basic fee and an additional fee for serving on any of the Committees and are also granted share options based on their respective contributions to the Board and Board Committees. A Directors’ Fee policy has been put in place to determine the quantum of fees payable to Directors. All Independent Non‑Executive Directors receive directors’ fees, which are subject to the approval of shareholders at the AGM.
The RC is of the view that it is currently not necessary to use contractual provisions to allow the Company to reclaim incentive components of remuneration from the Executive Directors and key management personnel in exceptional circumstances of misstatement of financial statements, or of misconduct resulting in financial loss to the Company and the Group.
Disclosure on Remuneration (Principle 9)
The Remuneration Framework covers all aspects of remuneration for the Executive Directors, Non‑Executive Directors, Independent Directors and Key Executives of the Company.
To maintain confidentiality on the remuneration policies of the Company, the Board is of the view that it is in the best interests of the Company to keep the disclosure of remuneration of each individual Director and key management personnel in salary bands.
REPORT ON CORPORATE GOVERNANCE

30 | Trek 2000 International Ltd • Annual Report 2016
A breakdown, showing the level and mix of each individual director’s remuneration for the FY2016 are as follows:
Directors’ Remuneration Band Fees(1)
%Salary
%Bonus
%Share Options
%Total
%
S$500,000 to S$750,000
Mr. Henn Tan ‑ 59 15 26 100
Below S$250,000
Dr. Long Ming Fai Edwin (2) 6 67 27 ‑ 100
Mr. Khor Peng Soon 100 ‑ ‑ ‑ 100
Mr. Chay Yee Meng (3) 100 ‑ ‑ ‑ 100
Ms. Celine Cha Mui Hwang 100 ‑ ‑ ‑ 100
Mr. Chan Leng Wai (4) 100 ‑ ‑ ‑ 100
Mr. Loh Yih (5) ‑ ‑ ‑ ‑ ‑
Mr. Gurcharan Singh (6) ‑ 100 ‑ ‑ 100
Mr. Poo Teng Pin (7) ‑ 100 ‑ ‑ 100
Mr. Heng Hang Song Francis (8) 100 ‑ ‑ ‑ 100
Mr. Ng Chong Khim (9) 100 ‑ ‑ ‑ 100
(1) Aggregate fees are subject to approval by shareholders at an AGM.(2) Dr. Long Ming Fai Edwin was appointed as Deputy Chief Executive Officer and Executive Director on 2 June 2016.(3) Mr. Chay Yee Meng was appointed as Independent Non‑Executive Director and Chairman of Audit Committee
and Nominating Committee on 22 March 2016.(4) Mr. Chan Leng Wai was appointed as Independent Non‑Executive Director and Member of Audit Committee on
3 June 2016.(5) Mr. Loh Yih was appointed as Independent Non‑Executive Director and Member of the Audit Committee on 31
May 2017.(6) Mr. Gurcharan Singh resigned on 2 June 2016.(7) Mr. Poo Teng Pin resigned on 12 July 2016.(8) Mr. Heng Hang Song Francis resigned on 25 March 2016.(9) Mr. Ng Chong Khim resigned on 24 March 2016.
In aggregate, the total remuneration paid to the top thirteen (13) key management personnel in FY2016 was US$975,403.
Details relating to the Share Option Scheme 2011 are provided in the Report of the Directors.
REPORT ON CORPORATE GOVERNANCE

SMART SOCIETY, SMART L IFE | 31
Key Executives
The remuneration of the top thirteen (13) executives of the Group (who are not Directors of the Company) for the financial year ended 31 December 2016 is shown in the following bands:
Remuneration Band Name of Executives
S$250,000 to S$499,999 Mr. Willy Koh – Chief Executive Officer, Racer Technology Pte Ltd
Mr. Lee Chia Ta – Executive Director/Chief Operation Officer, Racer Technology Pte Ltd
Below S$250,000 Mr. Foo Kok Wah – President, Operations/Sales and Customised Solutions Division
Mr. Kuan Mun Kwong – President, Global Marketing/Sales, Strategic Business
Dr. Shew Paul Waie – Head, of R&D, Software
Mr. Wayne Tan – Director, Cloud Stringers (S) Pte Ltd
Mr. Chan Koon Keet – Head of R&D, Kuala Lumpur
Mr. Eddie Chan Kam Loy ‑ Country Manager, Indonesia
Mr. Gopu Siva – Country Manager, India
Mr. Nguyen Phuc Ninh – Country Manager, Vietnam
Mr. Junichi Yamazaki ‑ Country Manager, Japan
Mr. Nick Tan – Country Manager, Thailand
Mr. Zhao Lin ‑ Country Manager, China/Hong Kong
The Company’s former Executive Director and Chief Financial Officer, Mr Gurcharan Singh, retired from the Company on 2 June 2016 at the age of 60. In recognition of his loyalty, long service and past contribution to the growth of the Company, the Company is paying him a retirement gratuity of S$188,000 to be made in monthly installment of S$7,833 for a period of 24 months after his retirement.
Save as disclosed, there were no termination, retirement and post‑employment benefits granted to Directors, the CEO and the top thirteen (13) key management personnel during the year.
Immediate Family Member of Director
There are no employees who are immediate family members of a director whose remuneration exceed S$50,000 during the year, except for Mr. Tan Boon Tat, brother of Mr. Henn Tan, CEO & Chairman of the Company, and Mr. Tan Joon Yong Wayne, son of Mr. Henn Tan, whose remuneration is in the band range of S$50,000 to S$100,000 during the FY2016.
REPORT ON CORPORATE GOVERNANCE

32 | Trek 2000 International Ltd • Annual Report 2016
ACCOUNTABILITY AND AUDIT
Risk Management and Internal Controls (Principle 11)
The Company has established a RRC comprising:
Mr. Khor Peng Soon – ChairmanDr. Long Ming Fai Edwin – MemberMs. Celine Cha Mui Hwang – Member
The objective of the RRC is to set forth the processes and procedures to identify risk areas in the Group and adopt policies and functions to manage these risks.
The Terms of Reference of the RRC include the following:
(i) Review the adequacy of the Group’s risk review framework to ensure that robust risk review is in place:
l Adopt an enterprise‑wide risk review framework to enhance its risk management capabilities
l Financial and operational key risk indicators are in place to track key risk exposures
(ii) Review and discuss with Management, the policies and procedures for identifying, assessing, controlling, monitoring and reporting the Group’s significant risk:
l The procedures for identifying strategic and business risks and controlling their financial impact on the Group and the operational effectiveness of the policies and procedures related to risk.
l The policies for ensuring compliance with relevant regulatory and legal requirements and in the case of financial statements, generally accepted accounting principles.
l Arrangements for the protection of the Group’s ownership of intellectual property and other non‑physical assets.
l Policies and practices for detecting, reporting and preventing fraud, serious breaches of business conduct, and whistle‑blowing procedures supporting reporting to the RRC.
(iii) Review the risk profile of the Group periodically, and discuss with Management the policies, procedures and action plans for mitigating and managing risks
(iv) Review the overall appropriateness and effectiveness of the risk review system.
In accordance with audit plans, the Company’s internal and external auditors have conducted an annual review of the effectiveness of the Company’s material internal controls, including financial, operational, compliance and information technology controls, and risk management systems. Any material non‑compliance or failure in internal controls and recommendations for improvements are reported to the Audit Committee (“AC”). The AC has also reviewed the effectiveness of the actions taken by the management on the recommendations made by the internal and external auditors in this respect.
The Company has appointed external professional firms to conduct an independent review (“Review”) on (a) the inconsistencies in accounting records and certain transactions including transactions with interested persons and related parties, which were not previously disclosed in the financial statements and (b) any suspicious transactions in light of the report by the Company’s auditors to the Accounting and Corporate Regulatory Authority of Singapore and the investigations by the Commercial Affairs Department into the Company’s affairs. As at to‑date, the Review is still ongoing. Hence, the CEO and Chief Financial Officer are unable to provide assurance that the Company’s risk management and internal control systems are adequate and effective pending the outcome of the Review.
REPORT ON CORPORATE GOVERNANCE

SMART SOCIETY, SMART L IFE | 33
Nevertheless, subject to the findings of the Review, the CEO and Chief Financial Officer confirm, assured and represented that the financial records of the Group have been properly maintained and the financial statements give a true and fair view of the Company’s and Group’s state of affairs, operations and finances.
The Board, with the concurrence of the AC and pending completion of the Review, is satisfied that in the absence of any evidence to the contrary, the systems of internal controls, including financial, operational, compliance and information technology controls, and risk management maintained by the Company’s management that was in place throughout the financial year and up to the date of this Report, provides reasonable, but not absolute, assurance against material financial misstatements or loss, and include the safeguarding of assets, the maintenance of proper accounting records, the reliability of financial information, compliance with appropriate legislation, regulation and best practice, and the identification and containment of business risk. The Board notes that no system of internal control could provide absolute assurance against the occurrence of material errors, poor judgment in decision‑making, human error, losses, fraud or other irregularities.
Audit Committee (Principle 12)
The AC comprises four Board members, all of whom are Independent and Non‑Executive Directors. The members of the AC at the date of this report are:
Mr. Chay Yee Meng – ChairmanMr. Khor Peng Soon – MemberMr. Chan Leng Wai – MemberMr. Loh Yih – Member
Mr. Chay Yee Meng was appointed Chairman of the AC with effect from 22 March 2016 succeeding Mr. Heng Hang Song Francis who had ceased as Chairman of the AC on 22 March 2016. Mr. Chay Yee Meng, is by profession a qualified accountant. The other members of the AC have many years of experience in business management and finance. The NC is of the view that the members of the AC have sufficient financial management expertise and experience to discharge the AC’s functions. The AC is routinely updated on proposed and impending changes in accounting standards and issues which have a direct impact on financial statements.
The AC convened seven meetings during the financial year. The AC has also met with the internal and external auditors, without the presence of the Company’s management, at least once a year. Details of members and their attendance at meetings are provided in page 23.
The AC, which has written Terms of Reference, performs the following functions:
(i) Reviews the audit plans of the internal and external auditors of the Company and ensures the adequacy of the Company’s system of accounting controls and the co‑operation given by the Company’s management to the external and internal auditors;
(ii) Reviews significant financial reporting issues so as to ensure the integrity of the financial statements of the Company and any formal announcements relating to the Group’s financial performance before submission to the Board of Directors;
(iii) Reviews the adequacy and effectiveness of the Company’s material internal controls, including financial, operational, compliance and information technology controls and risk management systems via reviews carried out by the internal auditors;
(iv) Meets with the internal and external auditors, without the presence of management at least once a year;
(v) Reviews legal and regulatory matters that may have a material impact on the financial statements, related compliance policies and programmes and any reports received from regulators;
(vi) Reviews the cost effectiveness and the independence and objectivity of the external auditors;
(vii) Reviews the nature and extent of non‑audit services provided by the external auditors to ensure that their independence is not compromised;
REPORT ON CORPORATE GOVERNANCE

34 | Trek 2000 International Ltd • Annual Report 2016
(viii) Recommends to the Board of Directors the external auditors to be re‑appointed, approves the audit fees and reviews the scope and results of the audit;
(ix) Reports actions and minutes of the AC to the Board of Directors with such recommendations as the AC considers appropriate; and
(x) Reviews interested person transactions in accordance with the requirements of the SGX‑ST’s Listing Manual.
The AC has the power to conduct or authorise investigations into any matters within the scope of the AC’s scope of responsibilities. Management has put in place, and the AC has reviewed and endorsed arrangements by which staff of the Group may, in confidence, raise concerns about possible improprieties in matters of financial reporting or other matters. The objective for such arrangements is to ensure independent investigation of such matters and for appropriate follow‑up action.
The AC, having reviewed all non‑audit services provided by the external auditors to the Group, is satisfied that the nature and extent of such services would not affect the independence of the external auditors. For the FY2016, S$542,000 was paid and payable to the external auditors for audit and non‑audit services, of which S$90,000 or 16.6% were for non‑audit services. The AC is satisfied with the independence and objectivity of Ernst & Young LLP as external auditors. The AC has also conducted a review of interested person transactions.
Ernst & Young LLP in Singapore audits Singapore‑incorporated principal subsidiaries that are not exempt from audit under the Singapore Companies Act. Subsidiaries incorporated in countries outside Singapore that require an audit in their local jurisdictions are largely audited by other independent member firms of the Ernst & Young. Our overseas associates which engage other auditing firms do not constitute a significant number. The names of the auditing firms of our subsidiaries and associates are disclosed at pages 87 and 89 of this Annual Report. The Company has complied with Rules 712 and 716 of the SGX Listing Manual in relation to the engagement of its auditors.
No former partner or director of the Company’s existing auditing firm is a member of the AC.
To keep abreast of the changes in accounting standards and issues which have a direct impact on the financial statements, the AC will seek advice from the external auditors at the AC meetings held.
The external auditor, Ernst & Young LLP has indicated to the AC and the Board of their intention not to seek re‑appointment as auditors of the Company at the forthcoming AGM. The Board was also of the view that a change of auditors will benefit the Company from the perspective of good corporate governance. This change will enable the Company to benefit from the fresh perspectives and views of another audit firm and enhance the independence and effectiveness of the independent audit of the Company’s accounts.
In view of the foregoing, the AC had considered several reputable audit firms in Singapore. After reviewing the credentials, services, proposed fees and their ability to meet the Group’s requirements, the AC is of the opinion that Moore Stephens LLP will be able to meet the audit requirements of the Group. The Directors, with the concurrence of the Audit Committee, recommended that Moore Stephens LLP be appointed as the new auditors be tabled for shareholders’ approval at the AGM.
Further details on the proposed change of auditors can be found in the Notice of Annual General Meeting dated 14 June 2017.
Whistle Blowing Policy
The Company has adopted the whistle‑blowing policy where staff of the Group may, in confidence, raise concerns on any suspicion of wrongdoings which covers improprieties in matters of financial reporting, fraudulent acts and other matters within the Group. The Management and the AC have been vested with the power and authority to receive, investigate and enforce appropriate follow up actions when any such non‑compliance matter is brought to its attention.
REPORT ON CORPORATE GOVERNANCE

SMART SOCIETY, SMART L IFE | 35
Internal Audit (Principle 13)
The Company and the Group have established an internal audit function that is independent of the activities it audits. The AC reviews the adequacy and effectiveness of the internal audit function and approves the hiring, removal, evaluation and compensation of the head of the internal audit function or the firm to which the internal audit function is outsourced. The internal auditors plan the audit scope and schedule in consultation with the management, which is subject to the review and final approval of the AC. The internal auditors report findings and recommendations to the Chairman of the AC.
The AC has reviewed the scope and results of the internal audit and is satisfied that the internal audit function is adequately resourced and that there is appropriate coordination between the internal and external auditors and management.
The AC has reviewed the Company’s risk assessment and based on the internal audit reports and management controls in place. The Board, with the concurrence of the AC, is satisfied that there are adequate internal controls in the Group, including financial, operational, compliance and information technology controls, and risk management systems.
Accountability (Principle 10)
The Board recognises the importance of providing accurate and relevant information on a timely basis. In this respect, the AC reviews all financial statements and recommends them to the Board for approval.
The Board provides shareholders with a balanced and understandable assessment of the Group’s performance, financial position and prospects on a quarterly basis via quarterly announcements of results and other ad hoc announcements as required by the Singapore Exchange. The Company’s Annual Report is sent to all Shareholders and is also accessible at the Company’s website.
SHAREHOLDER RIGHTS AND RESPONSIBILITIES
Shareholder Rights (Principle 14)Communication with Shareholders (Principle 15)Greater Shareholder Participation (Principle 16)
The Board is mindful of the obligations to provide regular, effective and fair communication to Shareholders. Information is communicated to the Shareholders on a timely basis. Where inadvertent disclosure has been made to a select group, the Company will make the same disclosure publicly to all as soon as practicable.
Other than the routine announcements made in accordance with the requirements of the Listing Manual, the Company has issued additional announcements and press releases to update Shareholders on the activities and developments of the Company and the Group during the year.
The Board welcomes the views of Shareholders on matters affecting the Group, whether at Shareholders’ meetings or on an ad hoc basis. Shareholders are informed of Shareholders’ meetings through notices published in the newspapers and reports or circulars sent to all Shareholders. Each item of special business included in the notice of the meeting is accompanied, where appropriate, by an explanation for the proposed resolution. Separate resolutions are proposed for substantially separate issues at the meeting. The Chairman of the Audit, Remuneration and Nominating Committees are normally available at the meeting to answer those questions relating to the work of these Committees. The external auditors are also present to address the Shareholders’ queries about the conduct of the audit and the preparation and content of the Auditors’ Report.
Unless otherwise provided by the Statutes, the Company’s Constitution allows a member of the Company to appoint any number of proxies to attend and vote at Shareholders’ meetings. The Company is not implementing absentia‑voting methods such as by mail, email, fax until security, integrity and other pertinent issues are satisfactorily resolved.
The Company will record the minutes of general meetings that include substantial and pertinent comments from shareholders relating to the agenda of the meetings and responses from the Management. Such minutes will be made available to shareholders upon their written request.
REPORT ON CORPORATE GOVERNANCE

36 | Trek 2000 International Ltd • Annual Report 2016
The Company will put all resolutions to vote by poll at general meetings and an announcement of the detailed results of the number of votes cast for and against each resolution and the respective percentages will be made on the same day.
The Group does not have a dividend policy in place at present. The Board may consider adopting a dividend policy in the future. In determining the form, frequency and amount of dividends that the Company may recommend or declare in respect of any particular year or period, the Board will take into consideration of the Group’s cash position, actual and projected financial performance, projected capital requirement and the level of funding required for the Group’s operation.
The Board has not declared any dividend payment for FY2016 after taking into account various factors, including the Group’s financial performance and uncertain economic and business conditions, which will require the retention of earnings to build up reserve to preserve the Company’s liquidity position. This will also enable the Group to make investments for long term growth where needed.
Financial and other communication are made available on the Group’s website at www.trek2000.com.sg and this is regularly updated.
DEALINGS IN SECURITIES
The Company, its Directors and certain officers and staff are refrained from trading in Trek 2000 shares two weeks before the announcement of the quarterly results and one month before the announcement of the full year results. This has been made known to Directors, Officers and Staff of the Company and the Group. In particular, it has been highlighted that to deal in the Company’s securities as well as securities of other listed companies when the Officers (Directors and employees) are in possession of unpublished material price sensitive information in relation to those securities is an offence. The Officers are also discouraged from dealing in the Company’s securities on short‑term considerations. The Company, while having provided the window periods for dealing in the Company’s securities, has its own internal compliance code in providing guidance to its officers with regard to dealing in the Company’s securities including reminders that the law on insider trading is applicable at all times.
INTERESTED PERSON TRANSACTIONS
The Company has adopted an internal policy in respect of any transactions with interested persons. An independent inquiry into certain potential interested party transactions entered into by the Group with T‑Data Systems (S) Pte Ltd and S‑Com Solutions (Hong Kong) Co. Limited conducted by TSMP Law Corporation and RSM Corporate Advisory Pte Ltd is still ongoing as at the date of this report as stated in Note 2.28 to the Financial Statements.
Name of Interested Person Nature of transactions
Aggregate value of all interested person transactions during the financial year under review (excluding transactions less than S$100,000 and transactions conducted under shareholders’ mandate pursuant to Rule 920 of the Listing Manual)
Aggregate value of all interested person transactions conducted under shareholders’ mandate pursuant to Rule 920 of the Listing Manual (excluding transactions less than S$100,000)
Thumbdrive Plus (Thailand) Co, Ltd
‑ Purchases made from asubsidiary, TrekTechnology (S) Pte Ltd
‑ US$91,587 ‑ Nil
‑ Service fees billed to asubsidiary, CloudStringers (S) Pte Ltd
‑ US$15,000 ‑ Nil
The Company does not have any general mandate from shareholders pursuant to Rule 920 of the Listing Manual.
REPORT ON CORPORATE GOVERNANCE

SMART SOCIETY, SMART L IFE | 37
MATERIAL CONTRACTS
No material contracts were entered between the Company or any of its subsidiaries with any director or controlling shareholder during the FY2016.
RISK MANAGEMENT
Inherent Industry Risk
The Group is exposed to fast changing technology and industry development. The Group faces technological obsolescence if it is not able to constantly upgrade itself; keep up with the latest technological and industry developments or innovate to produce new products. In the event that it is unable to continue upgrading its capabilities to keep abreast of rapid technological changes, there will be a negative impact on the turnover and profitability. However, the capabilities and strength of the Group’s research and development have enabled it to meet to the changing demands, as revealed through its library of patents registered and granted by the Group.
Global Shortage of Key Components
The Group relies heavily on certain key components used in its solutions, such as NAND flash memory chips and SmartMedia cards. At present, owing to the general market demand for such components, the Group may encounter shortages in the supply of such components from time to time. This may cause the prices of some or all of these components to increase, which will thereby have an adverse impact on our profits.
Dependence on Key Personnel
The continued success of the Group, to some extent, is dependent on its key management and technical personnel. The Company and the Group constantly look into the issue of attracting, retaining, training and recruiting suitably qualified and talented managers for its operations. The Group has continued to undertake measures to strengthen the top management team and to re‑structure its management team by the internal promotion of several managers to ensure that the Trek 2000 team continues to be driven and well‑guided to pursue further challenges ahead. In addition, the Group is committed to provide vigorous training to its technical staff force to ensure that their skills measure up to and surpass the industries’ and customers’ requirements in order to retain its competitive edge.
USE OF PROCEEDS FROM PLACEMENT OF NEW SHARES AND SALE OF TREASURY SHARES
As at the date of this Annual Report, the proceeds from placement of 26,000,000 new shares and sale of 1,000,000 treasury shares (“Net Proceeds”) have been utilised as follows:
Use of Net Proceeds (as announced on 24 June 2015)
Amount allocated (as announced on 24 June 2015) (S$)
Amount allocated as a percentage of Net Proceeds (as announced on 24 June 2015) (%)
Net Proceeds utilised as at the date of this Annual Report (S$)
Balance of Net Proceeds as at the date of this Annual Report (S$)
Research and Development (involves ongoing strategic research and development, particularly in the areas of medical diagnostic technology)
5.79 million 50 ‑ 5.79 million
General Working Capital (to fund the ongoing growth and expansion of the Group’s business and operations)
5.79 million 50 ‑ 5.79 million
Total 11.58 million 100 ‑ 11.58 million
As at the date of this Annual Report, the Net Proceeds have not yet been utilised.
REPORT ON CORPORATE GOVERNANCE

38 | Trek 2000 International Ltd • Annual Report 2016
DIRECTORS’ STATEMENT
The directors are pleased to present their statement to the members together with the audited consolidated financial statements of Trek 2000 International Ltd (the “Company”) and its subsidiaries (collectively, the “Group”) and the income statement, statement of comprehensive income, balance sheet and statement of changes in equity of the Company for the financial year ended 31 December 2016.
Opinion of the directors
In the opinion of the directors,
(i) the accompanying balance sheets, income statements, statements of comprehensive income, statements of changes in equity and consolidated cash flow statement together with notes thereto are drawn up so as to give a true and fair view of the financial position of the Group and of the Company as at 31 December 2016 and the financial performance of business, and changes in equity of the Group and the Company and the changes in cash flows of the Group for the year ended on that date, and
(ii) at the date of this statement, there are reasonable grounds to believe that the Company will be able to pay its debts as and when they fall due.
Directors
The directors of the Company in office at the date of this statement are:
Henn Tan Chairman and Chief Executive OfficerDr. Long Ming Fai EdwinKhor Peng SoonChay Yee Meng (Appointed on 22 March 2016)Celine Cha Mui HwangChan Leng Wai (Appointed on 3 June 2016)
Arrangement to enable directors to acquire shares and debentures
Except as described in the paragraph on “Options”, neither at the end of nor at any time during the financial year was the Company a party to any arrangement whose objects are, or one of whose objects is, to enable the directors of the Company to acquire benefits by means of the acquisition of shares or debentures of the Company or any other body corporate.
Directors’ interest in shares and debentures
The following directors, who held office at the end of the financial year, had, according to the register of directors’ shareholdings required to be kept under Section 164 of the Singapore Companies Act, Cap. 50, an interest in shares and share options of the Company and related corporations other than wholly‑owned subsidiaries as stated below:
Direct interest Deemed interest
Name of directorAt
1.1.2016At
31.12.2016At
21.1.2017At
1.1.2016At
31.12.2016At
21.1.2017
Ordinary shares of the Company
Henn Tan 100,077,591 100,077,591 100,077,591 3,338,276 3,338,276 3,338,276
Chay Yee Meng ‑ ‑ ‑ ‑ 625,000 625,000

SMART SOCIETY, SMART L IFE | 39
DIRECTORS’ STATEMENT
Directors’ interest in shares and debentures (cont’d)
Name of directorAt
1.1.2016 At
31.12.2016At
21.1.2017
Options to subscribe for ordinary shares in the Company
Henn Tan 2,720,000 2,720,000 2,720,000
Khor Peng Soon 90,000 90,000 90,000
Options to subscribe forordinary shares in Cloud Stringers (S) Pte. Ltd.
Henn Tan 700,000 700,000 700,000
Options to subscribe forordinary shares in Racer Technology Pte. Ltd
Henn Tan 712,500 712,500 ‑
No. of shares
Name of director Deemed interest held through:At
31.12.2016At
21.1.2017
Ordinary shares of the Company
Henn Tan Wife, Ang Poh Tee 720,000 720,000
Henn Tan Son, Tan Joon Yong Wayne 2,371,176 2,371,176
Henn Tan Son, Tan Joon Wei Winn 247,100 247,100
Name of director Deemed interest held through:At
31.12.2016At
21.1.2017
Ordinary shares of Cloud Stringers (S) Pte. Ltd.
Henn Tan Son, Tan Joon Yong Wayne 400,000 400,000
Except for the options to subscribe for ordinary shares in Racer Technology Pte. Ltd, there was no change in any of the above‑mentioned interests between the end of the financial year and 21 January 2017.
By virtue of Section 7 of the Singapore Companies Act, Cap. 50, Mr Henn Tan is deemed to be interested in the shares held by the Company in its subsidiaries.
Except as disclosed in this statement, no director who held office at the end of the financial year had interests in shares, share options, warrants or debentures of the Company, or of related corporations, either at the beginning or at the end of the financial year.

40 | Trek 2000 International Ltd • Annual Report 2016
Directors’ contractual benefits
Except as disclosed in the financial statements, since the end of the previous financial year, no director of the Company has received or become entitled to receive a benefit by reason of a contract made by the Company or a related corporation with the director, or with a firm of which the director is a member, or with a company in which the director has a substantial financial interest.
Options
(i) The Trek 2000 International Ltd Share Option Scheme 2011 (the “ESOS 2011”) was approved by shareholders at an extraordinary general meeting held on 21 April 2011. Following the approval, the Trek 2000 International Ltd share option scheme (the “ESOS 2001”) was terminated (collectively the “ESOS”).
(ii) The ESOS caters to participants, who are selected full‑time employees, executive directors and non‑executive directors of the Group.
Under the ESOS, all options to be issued will have a term no longer than ten years from the date of grant, except for directors who do not hold executive functions, for which, the options issued will have a term no longer than 5 years from date of grant.
(iii) The ESOS is administered by the Remuneration Committee which comprises the following directors:
Khor Peng Soon (Chairman)Celine Cha Mui HwangHenn Tan
(iv) The options granted by the Company do not entitle the holders of the options, by virtue of such holdings, to any rights to participate in any share issues of any other company in the Group.
(v) During the financial year ended 31 December 2016, no options were granted and accepted under the ESOS 2011 to subscribe for ordinary shares.
(vi) During the financial year ended 31 December 2016, no options were exercised under the ESOS to subscribe for ordinary shares.
(vii) During the financial year ended 31 December 2016, 1,745,000 options were forfeited due to resignation of employees/directors.
(viii) Details on outstanding options to subscribe for ordinary shares as at 31 December 2016 are found in Note 27 to the financial statements.
DIRECTORS’ STATEMENT

SMART SOCIETY, SMART L IFE | 41
Options (cont’d)
(ix) Directors granted options under the ESOS are as follows:
DirectorsESOSGrant
Optionsgranted
during thefinancial
year
Aggregate options
granted since commencement
of plan to end offinancial year
Aggregate optionsexercised/
(lapsed) since commencement
of the plan to end of financial year
Aggregateoptions
outstandingat end of
financial year
Exerciseprice(S$)
Henn Tan No. 11 – 120,000 – 120,000 0.399
No. 12 – 600,000 – 600,000 0.326
No. 19 – 2,000,000 – 2,000,000 0.247
Khor Peng Soon No. 19 – 90,000 – 90,000 0.362
(x) Since the commencement of the ESOS till the end of the financial year:
No participants except for Henn Tan who has received 5% or more of the total number of options available under ESOS;
No options that entitle the holder to participate, by virtue of the options, in any share issue of any other corporation have been granted; and
No options have been granted at a discount.
Audit Committee
The audit committee (“AC”) carried out its functions in accordance with Section 201B(5) of the Singapore Companies Act, Cap. 50 including the following:
Reviews the audit plans of the internal and external auditor of the Company, and reviews the internal auditors’ evaluation of the adequacy of the Company’s system of internal accounting controls and the assistance given by the Company’s management to the external and internal auditor
Reviews the quarterly and annual financial statements and the auditor’s report on the annual financial statements of the Company before their submission to the board of directors
Reviews effectiveness of the Company’s material internal controls, including financial, operational and compliance controls and risk management via reviews carried out by the internal auditor
Meets with the external auditor, other committees, and management in separate executive sessions to discuss any matters that these groups believe should be discussed privately with the AC
Reviews legal and regulatory matters that may have a material impact on the financial statements, related compliance policies and programmes and any reports received from regulators
Reviews the cost effectiveness and the independence and objectivity of the external auditor
Reviews the nature and extent of non‑audit services provided by the external auditor
DIRECTORS’ STATEMENT

42 | Trek 2000 International Ltd • Annual Report 2016
Audit Committee (cont’d)
Recommends to the board of directors the external auditor to be nominated, approves the compensation of the external auditor, and reviews the scope and results of the audit
Reports actions and minutes of the AC to the board of directors with such recommendations as the AC considers appropriate
Reviews interested person transactions in accordance with the requirements of the Singapore Exchange Securities Trading Limited’s Listing Manual
The AC, having reviewed all non‑audit services provided by the external auditor to the Group, is satisfied that the nature and extent of such services would not affect the independence of the external auditor. The AC has also conducted a review of interested person transactions.
The AC convened seven meetings during the year with full attendance from all members. The AC has also met with internal and external auditors, without the presence of the Company’s management, at least once a year.
Further details regarding the AC are disclosed in the Report on Corporate Governance.
Auditors
The auditor, Ernst & Young LLP, is not seeking for re‑appointment. A resolution to appoint a new auditor will be proposed at the forthcoming Annual General Meeting.
On behalf of the Board,
Henn TanDirector
Dr. Long Ming Fai EdwinDirector
Singapore29 May 2017
DIRECTORS’ STATEMENT

SMART SOCIETY, SMART L IFE | 43
Report on the Audit of the Financial Statements
Disclaimer of Opinion
We were engaged to audit the financial statements of Trek 2000 International Ltd (the “Company”) and its subsidiaries (collectively the “Group”), which comprise the balance sheets of the Group and the Company as at 31 December 2016, income statements, statements of comprehensive income and statements of changes in equity of the Group and the Company and the consolidated cash flow statement of the Group for the year then ended, and notes to the financial statements, including a summary of significant accounting policies.
We do not express an opinion on the accompanying financial statements of the Group and the Company. Because of the significance of the matters described in the Basis for Disclaimer of Opinion section of our report, we have not been able to obtain sufficient appropriate audit evidence to provide a basis for an audit opinion on these financial statements.
Basis for Disclaimer of Opinion
Opening balances
We issued a disclaimer of opinion on the financial statements of the Group and the Company for the year ended 31 December 2015. The basis for the disclaimer of opinion included, amongst others, the inability to obtain sufficient audit evidence arising from matters relating to i) the on‑going investigations and inquiries into affairs of the Group and the Company (Note 2.28), ii) the appropriateness of the stated carrying values of assets, iii) appropriateness of tax provisions and iv) subsequent events. Further details on the basis for disclaimer of opinion are set out in our audit report dated 21 September 2016.
As the opening balance as at 1 January 2016 formed the basis for determining the financial performance, changes in equity and cash flows for the financial year ended 31 December 2016, we are unable to determine whether adjustments are required to the financial statements of the Group and the Company for the financial year ended 31 December 2016.
We also draw attention to Note 37 which describes further adjustments made to restate the Group’s financial statements for the year ended 31 December 2015. Based on information made available to us, we are unable to obtain sufficient appropriate audit evidence about the appropriateness and adequacy of the adjustments made.
Ongoing reviews and investigations
As disclosed in Note 2.28 to the financial statements, we had informed the management of certain inconsistencies in the accounting records maintained by the Group and the Company during the course of our audit and expressed concerns over the validity of certain transactions recorded therein.
Arising from the above, the Group had appointed external professional firms to conduct an independent review into the inconsistencies in accounting records and certain transactions, including transactions with interested persons and related parties. The Company also announced that the Commercial Affairs Department of the Singapore Police Force (“CAD”) is conducting its investigations into the affairs of the Company. As at the date of this report, the review by external professional firms and CAD investigation are ongoing.
The outcome of the review and investigation into the affairs of the Group and the Company could uncover other information which may require adjustments and/or additional disclosures to the financial statements.
INDEPENDENT AUDITOR’S REPORTFor the financial year ended 31 December 2016

44 | Trek 2000 International Ltd • Annual Report 2016
Report on the Audit of the Financial Statements (cont’d)
Basis for Disclaimer of Opinion (cont’d)
Financial position and results of Racer Technology Pte. Ltd (“Racer”) and its subsidiary companies (collectively, “Racer Group”)
As at the date of issue of the financial statements, we have not completed the audit of the financial statements of Racer Group. The financial results, assets and liabilities of Racer Group which have been consolidated by the Group affect several line items in the consolidated financial statements of the Group. Racer’s relative contribution in terms of total assets as at 31 December 2016, revenue and net profit for the year then ended is significant to the Group.
We further draw attention to Note 38 to the financial statements. The disposal of Racer Group at a loss subsequent to year‑end presents an indicator that the assets held by Racer Group at 31 December 2016 may be impaired. Despite the loss, management have assessed that no impairment is required on the assets held by Racer Group as at 31 December 2016 as they are of the view that the recoverable amounts of these assets exceeded their stated carrying value of $18,267,589 (Note 14) then.
We have not been able to obtain the information and explanations that we considered necessary in order to satisfy ourselves as to i) whether the financial statements of Racer Group are in form and content appropriate and proper for inclusion in the Group’s consolidated financial statements and ii) whether the summarised financial information of Racer Group disclosed in Note 14 to the financial statements were appropriate. Consequently, we are unable to determine whether any adjustments in respect of the aforementioned are necessary.
Carrying values of property, plant and equipment (“PPE”) and intangible assets
The carrying values of PPE and intangible assets held by the Group and the Company as at 31 December 2016 were as follows:
Carrying values2016
Group$
Company$
Property, plant and equipment (Note 12) 10,314,463 13,093
Intangible assets (Note 13) 3,565,621 1,600,965
As disclosed in Note 9 to the financial statements, the Group recognised write‑offs and impairment losses on PPE and intangible assets of $214,305 and $810,546 respectively for the financial year ended 31 December 2016.
Based on information made available to us, we are unable to determine whether the basis used by management to allocate the carrying values of PPE and intangible assets to their associated cash‑generating units are appropriate. We have not been also provided with sufficient information and explanations we considered necessary to assess the reasonableness of the assumptions used in establishing the recoverable amounts of PPE and intangible assets. Consequently, we are not able to ascertain if the basis for providing impairment loss for PPE and intangible assets are appropriate. Accordingly, we are unable to determine whether any adjustments to the stated carrying values of PPE and intangible assets as at 31 December 2016 are necessary.
INDEPENDENT AUDITOR’S REPORTFor the financial year ended 31 December 2016

SMART SOCIETY, SMART L IFE | 45
Report on the Audit of the Financial Statements (cont’d)
Basis for Disclaimer of Opinion (cont’d)
Tax provisions
As disclosed in Note 10 to the financial statements, the Group recorded income tax expense of $918,376 for the year ended 31 December 2016. The income tax payable and deferred tax liabilities recognised by the Group at 31 December 2016 were $1,243,725 and $697,890, respectively.
We have not been provided with sufficient information to ascertain whether the tax implications of matters described in the preceding paragraphs had been adequately dealt with in these financial statements. Consequently, we are unable to determine whether any adjustments to the recorded income tax expense, income tax payable and deferred tax liabilities are required.
In view of the matters set out in the preceding paragraphs, we are unable to determine the appropriateness, completeness and accuracy of the financial statements, nor are we able to quantify the extent of further adjustments that might be necessary in respect of the financial statements of the Group and the Company for the financial year ended 31 December 2016.
Responsibilities of Management and Directors for the Financial Statements
Management is responsible for the preparation of financial statements that give a true and fair view in accordance with the provisions of the Companies Act, Chapter 50 (the “Act”) and Financial Reporting Standards in Singapore (“FRSs”), and for devising and maintaining a system of internal accounting controls sufficient to provide a reasonable assurance that assets are safeguarded against loss from unauthorised use or disposition; and transactions are properly authorised and that they are recorded as necessary to permit the preparation of true and fair financial statements and to maintain accountability of assets.
In preparing the financial statements, management is responsible for assessing the Group’s ability to continue as a going concern, disclosing, as applicable, matters related to going concern and using the going concern basis of accounting unless management either intends to liquidate the Group or to cease operations, or has no realistic alternative but to do so.
The directors’ responsibilities include overseeing the Group’s financial reporting process.
Auditor’s Responsibilities for the Audit of the Financial Statements
Our responsibility is to conduct an audit of the consolidated financial statements of the Group, the balance sheet and the statement of changes in equity of the Company in accordance with Singapore Standards on Auditing and to issue an auditor’s report. However, because of the matters described in the Basis for Disclaimer of Opinion section of our report, we were not able to obtain sufficient appropriate audit evidence to provide a basis for an audit opinion on these financial statements.
We are independent of the Company in accordance with the Accounting and Corporate Regulatory Authority (ACRA) Code of Professional Conduct and Ethics for Public Accountants and Accounting Entities (ACRA Code) together with the ethical requirements that are relevant to our audit of the financial statements in Singapore, and we have fulfilled our other ethical responsibilities in accordance with these requirements and the ACRA Code.
INDEPENDENT AUDITOR’S REPORTFor the financial year ended 31 December 2016

46 | Trek 2000 International Ltd • Annual Report 2016
Report on the Audit of the Financial Statements (cont’d)
Report on Other Legal and Regulatory Requirements
In our opinion, in view of the significance of the matters referred to in the Basis for Disclaimer of Opinion section of our report, we do not express an opinion on whether the accounting and other records required by the Act to be kept by the Company and by those subsidiary corporations incorporated in Singapore of which we are the auditor, have been properly kept in accordance with the provisions of the Act.
The engagement partner on the audit resulting in this independent auditor’s report is Mak Keat Meng.
____________________________Ernst & Young LLPPublic Accountants andChartered AccountantsSingapore
29 May 2017
INDEPENDENT AUDITOR’S REPORTFor the financial year ended 31 December 2016

SMART SOCIETY, SMART L IFE | 47
(In US Dollar)
Group Company
Note 2016 2015 2016 2015
Restated*
$ $ $ $
Revenue 4 165,724,961 148,835,762 4,546 6,046
Cost of sales (147,284,732) (144,755,109) (17,483) (147,791)
Gross profit/(loss) 18,440,229 4,080,653 (12,937) (141,745)
Other items of income:
Interest income 5 661,778 714,394 565,176 668,699
Other income 6 700,290 1,026,057 114,784 486,584
Other items of expense:
Research and development (2,904,610) (3,676,988) (290,524) (492,767)
Marketing and distribution (2,515,009) (3,209,963) (300,982) (789,681)
General administration (6,227,717) (5,919,560) (16,217,449) (1,436,017)
Other expenses 7 (9,505) (429,595) (90,312) (76,484)
Finance costs 8 (145,102) (153,059) – –
Profit/(Loss) before income tax 9 8,000,354 (7,568,061) (16,232,244) (1,781,411)
Income tax (expense)/benefit 10 (918,376) 204,010 – –
Profit/(Loss) for the year 7,081,978 (7,364,051) (16,232,244) (1,781,411)
Attributable to:
Owners of the Company 6,073,373 (6,646,279) (16,232,244) (1,781,411)
Non‑controlling interests 1,008,605 (717,772) – –
7,081,978 (7,364,051) (16,232,244) (1,781,411)
Earnings/(Loss) per share attributable to owners of the Company (cents per share) 11
Basic 1.87 (2.15)
Diluted 1.87 (2.15)
* ‑ Certain amounts shown here do not correspond to the 2015 financial statements. Refer to Note 37 for adjustments made.
The accompanying accounting policies and explanatory notes form an integral part of the financial statements.
INCOME STATEMENTSFor the financial year ended 31 December 2016

48 | Trek 2000 International Ltd • Annual Report 2016
(In US Dollar)
Group Company
2016 2015 2016 2015
Restated*
$ $ $ $
Profit/(Loss) for the year 7,081,978 (7,364,051) (16,232,244) (1,781,411)
Other comprehensive income:
Items that may be reclassified subsequently to profit or loss
Net fair value changes on quoted investments
‑ Fair value adjustment 10,538 (148,770) 10,538 (148,770)
‑ Transfer to profit or loss upon disposal (913) (328,572) (913) (328,572)
9,625 (477,342) 9,625 (477,342)
Foreign currency translation (276,598) (1,647,818) – –
Total comprehensive income for the year 6,815,005 (9,489,211) (16,222,619) (2,258,753)
Attributable to:
Owners of the Company 6,006,341 (7,807,078) (16,222,619) (2,258,753)
Non‑controlling interests 808,664 (1,682,133) – –
6,815,005 (9,489,211) (16,222,619) (2,258,753)
* ‑ Certain amounts shown here do not correspond to the 2015 financial statements. Refer to Note 37 for adjustments made.
The accompanying accounting policies and explanatory notes form an integral part of the financial statements.
STATEMENTS OF COMPREHENSIVE INCOMEFor the financial year ended 31 December 2016

SMART SOCIETY, SMART L IFE | 49
(In US Dollar)
Group Company
Note 2016 2015 2016 2015
Restated*
$ $ $ $
Non-current assets
Property, plant and equipment 12 10,314,463 10,143,065 13,093 5,962
Intangible assets 13 3,565,621 5,160,935 1,600,695 1,808,776
Investment in subsidiaries 14 – – 3,484,976 5,225,294
Investment in associates 15 – – 5,407 5,407
Quoted investments 16 12,244,281 8,748,876 12,244,281 8,748,876
Unquoted investments 17 180,364 182,163 – –
26,304,729 24,235,039 17,348,452 15,794,315
Current assets
Inventories 18 10,294,457 22,517,912 – –
Trade and other receivables 19 17,106,736 15,934,243 562,834 26,139,710
Prepayments 258,798 264,865 75,886 7,760
Cash and short‑term deposits 21 29,234,449 24,256,093 9,081,049 392,631
56,894,440 62,973,113 9,719,769 26,540,101
Total assets 83,199,169 87,208,152 27,068,221 42,334,416
Current liabilities
Trade payables and accruals 22 14,464,012 29,476,025 121,406 81,435
Other payables 22 4,205,958 2,328,481 1,069,499 318,476
Provision for customer claims 23 900,000 – – –
Hire purchase payables 24 150,748 154,054 – –
Term loans and overdrafts 25 1,241,102 1,249,078 – –
Income tax payable 1,243,725 768,245 – –
22,205,545 33,975,883 1,190,905 399,911
Net current assets 34,688,895 28,997,230 8,528,864 26,140,190
* ‑ Certain amounts shown here do not correspond to the 2015 financial statements. Refer to Note 37 for adjustments made.
BALANCE SHEETSAs at 31 December 2016
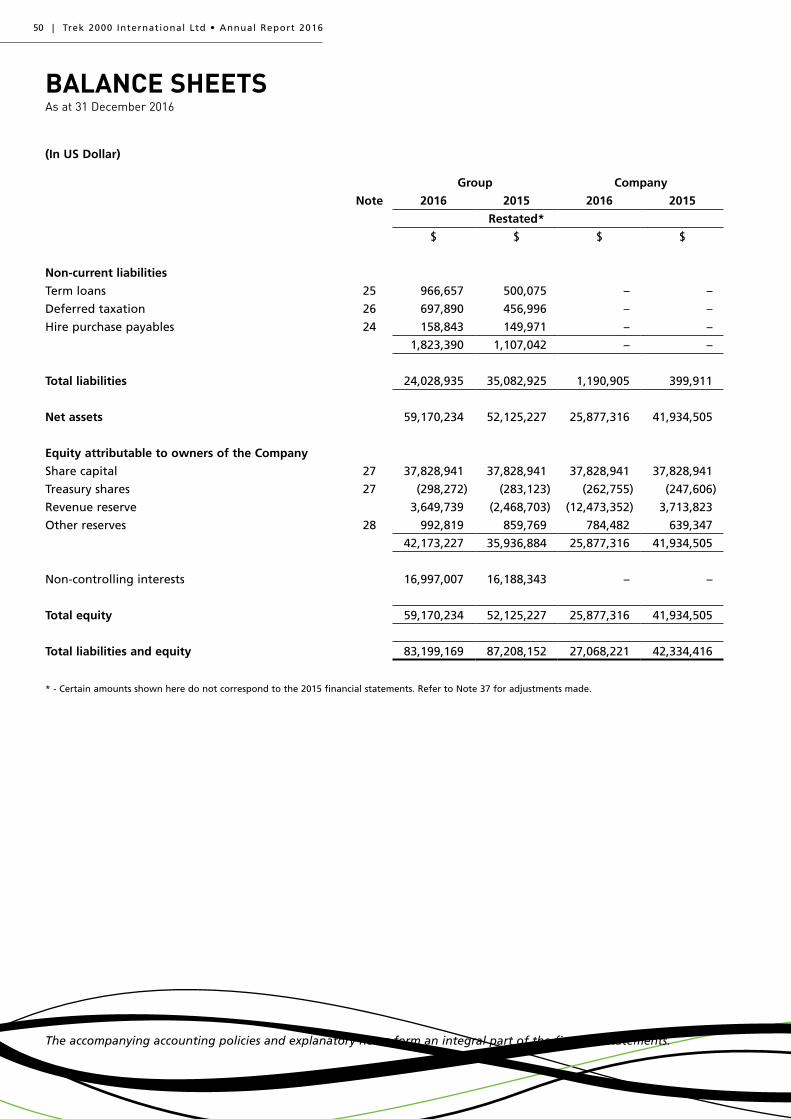
50 | Trek 2000 International Ltd • Annual Report 2016
(In US Dollar)
Group Company
Note 2016 2015 2016 2015
Restated*
$ $ $ $
Non-current liabilities
Term loans 25 966,657 500,075 – –
Deferred taxation 26 697,890 456,996 – –
Hire purchase payables 24 158,843 149,971 – –
1,823,390 1,107,042 – –
Total liabilities 24,028,935 35,082,925 1,190,905 399,911
Net assets 59,170,234 52,125,227 25,877,316 41,934,505
Equity attributable to owners of the Company
Share capital 27 37,828,941 37,828,941 37,828,941 37,828,941
Treasury shares 27 (298,272) (283,123) (262,755) (247,606)
Revenue reserve 3,649,739 (2,468,703) (12,473,352) 3,713,823
Other reserves 28 992,819 859,769 784,482 639,347
42,173,227 35,936,884 25,877,316 41,934,505
Non‑controlling interests 16,997,007 16,188,343 – –
Total equity 59,170,234 52,125,227 25,877,316 41,934,505
Total liabilities and equity 83,199,169 87,208,152 27,068,221 42,334,416
* ‑ Certain amounts shown here do not correspond to the 2015 financial statements. Refer to Note 37 for adjustments made.
The accompanying accounting policies and explanatory notes form an integral part of the financial statements.
BALANCE SHEETSAs at 31 December 2016

SMART SOCIETY, SMART L IFE | 51
(In
US
Do
llar)
Gro
up
Tota
leq
uit
y
Equ
ity
attr
ibu
tab
le
to o
wn
ers
of
the
Co
mp
any,
to
tal
Shar
eca
pit
al
(No
te 2
7)Tr
easu
rysh
ares
Rev
enu
ere
serv
e
Tota
lo
ther
re
serv
esC
apit
alre
serv
e
Ass
et
reva
luat
ion
re
serv
e
Fair
va
lue
adju
stm
ent
rese
rve
Emp
loye
esh
are
op
tio
n
rese
rve
Tran
slat
ion
rese
rve
Oth
er
rese
rves
No
n-
con
tro
llin
gin
tere
sts
2016
$$
$$
$ $
$$
$$
$$
$
Op
enin
g b
alan
ce a
t 1
Jan
uar
y 20
16
(Res
tate
d)
52,1
25,2
2735
,936
,884
37,8
28,9
41(2
83,1
23)
(2,4
68,7
03)
859,
769
2,71
6,55
12,
028,
550
(112
,664
)65
6,64
0(9
28,0
69)
(3,5
01,2
39)
16,1
88,3
43
Pro
fit
for
the
year
7,08
1,97
86,
073,
373
––
6,07
3,37
3–
––
––
––
1,00
8,60
5
Oth
er c
om
pre
hen
sive
in
com
e
Net
gai
n o
n q
uo
ted
in
vest
men
ts9,
625
9,62
5–
––
9,62
5–
–9,
625
––
––
Fore
ign
cu
rren
cy
tran
slat
ion
(276
,598
)(7
6,65
7)–
––
(76,
657)
––
––
(76,
657)
–(1
99,9
41)
Oth
er c
om
pre
hen
sive
in
com
e fo
r th
e ye
ar,
net
of
tax
(266
,973
)(6
7,03
2)–
––
(67,
032)
––
9,62
5–
(76,
657)
–(1
99,9
41)
Tota
l co
mp
reh
ensi
ve
inco
me
for
the
year
6,81
5,00
56,
006,
341
––
6,07
3,37
3(6
7,03
2)–
–9,
625
–(7
6,65
7)–
808,
664
Co
ntr
ibu
tio
ns
by
and
d
istr
ibu
tio
ns
to o
wn
ers
Shar
e b
uyb
ack
(15,
149)
(15,
149)
–(1
5,14
9)–
––
––
––
––
Gra
nt
of
equ
ity‑
sett
led
sh
are
op
tio
ns
245,
151
245,
151
––
–24
5,15
1–
––
245,
151
––
–
Forf
eitu
re o
f ve
sted
eq
uit
y‑se
ttle
d s
har
e o
pti
on
s–
––
–45
,069
(45,
069)
––
–(4
5,06
9)–
––
Tota
l tra
nsa
ctio
ns
wit
h
ow
ner
s in
th
eir
ca
pac
ity
as o
wn
ers
230,
002
230,
002
– (1
5,14
9)45
,069
200,
082
––
–20
0,08
2–
––
Clo
sin
g b
alan
ce a
t 31
Dec
emb
er 2
016
59,1
70,2
3442
,173
,227
37,8
28,9
41(2
98,2
72)
3,64
9,73
999
2,81
92,
716,
551
2,02
8,55
0(1
03,0
39)
856,
722
(1,0
04,7
26)
(3,5
01,2
39)
16,9
97,0
07
The
acco
mp
anyi
ng
acc
ou
nti
ng
po
licie
s an
d e
xpla
nat
ory
no
tes
form
an
inte
gra
l par
t o
f th
e fi
nan
cial
sta
tem
ents
.
STATEMENTS OF CHANGES IN EQUITYFor the financial year ended 31 December 2016

52 | Trek 2000 International Ltd • Annual Report 2016
(In
US
Do
llar)
Gro
up
(R
esta
ted
)To
tal
equ
ity
Equ
ity
attr
ibu
tab
le
to o
wn
ers
of
the
Co
mp
any,
to
tal
Shar
eca
pit
al
(No
te 2
7)Tr
easu
rysh
ares
Rev
enu
eR
eser
ve
Tota
lo
ther
re
serv
esC
apit
alre
serv
e
Ass
et
reva
luat
ion
re
serv
e
Fair
va
lue
adju
stm
ent
rese
rve
Emp
loye
esh
are
op
tio
n
rese
rve
Tran
slat
ion
rese
rve
Oth
er
rese
rves
No
n-
con
tro
llin
gin
tere
sts
2015
$$
$$
$ $
$$
$$
$$
$O
pen
ing
bal
ance
at
1 Ja
nu
ary
2015
47,3
98,8
7139
,462
,494
29,6
05,2
42(2
56,9
14)
5,30
0,68
04,
813,
486
2,71
6,55
12,
028,
550
364,
678
214,
790
(511
,083
)–
7,93
6,37
7Lo
ss f
or
the
year
(7,3
64,0
51)
(6,6
46,2
81)
––
(6,6
46,2
81)
––
––
––
–(7
17,7
70)
Oth
er c
om
pre
hen
sive
in
com
eN
et lo
ss o
n q
uo
ted
in
vest
men
ts(4
77,3
42)
(477
,342
)–
––
(477
,342
)–
–(4
77,3
42)
––
––
Fore
ign
cu
rren
cy
tran
slat
ion
(1,6
47,8
18)
(683
,455
)–
––
(683
,455
)–
––
–(6
83,4
55)
–(9
64,3
63)
Oth
er c
om
pre
hen
sive
in
com
e fo
r th
e ye
ar,
net
of
tax
(2,1
25,1
60)
(1,1
60,7
97)
––
–(1
,160
,797
)–
–(4
77,3
42)
–(6
83,4
55)
–(9
64,3
63)
Tota
l co
mp
reh
ensi
ve
inco
me
for
the
year
(9,4
89,2
11)
(7,8
07,0
78)
––
(6,6
46,2
81)
(1,1
60,7
97)
––
(477
,342
)–
(683
,455
)–
(1,6
82,1
33)
Co
ntr
ibu
tio
ns
by
and
d
istr
ibu
tio
ns
to o
wn
ers
Incr
ease
in s
har
e th
rou
gh
ex
erci
se o
f sh
are
op
tio
ns
63,7
8963
,789
63,7
89–
––
––
––
––
–D
ivid
end
s p
aid
(1,1
23,1
02)
(1,1
23,1
02)
––
(1,1
23,1
02)
––
––
––
––
Sale
of
trea
sury
sh
ares
via
p
lace
men
ts o
f sh
ares
316,
768
316,
768
–22
1,39
7–
95,3
71–
––
––
95,3
71–
Issu
ance
of
shar
es
thro
ug
h p
lace
men
t ex
erci
se8,
159,
910
8,15
9,91
08,
159,
910
––
––
––
––
––
Shar
e b
uyb
ack
(247
,606
)(2
47,6
06)
–(2
47,6
06)
––
––
––
––
–G
ran
t o
f eq
uit
y‑se
ttle
d
shar
e o
pti
on
s44
1,85
044
1,85
0–
––
441,
850
––
–44
1,85
0–
––
Cap
ital
co
ntr
ibu
tio
ns
fro
m n
on
‑co
ntr
olli
ng
in
tere
st1,
252,
918
––
––
––
––
––
–1,
252,
918
Dilu
tio
n o
f su
bsi
dia
ry5,
351,
040
(3,3
30,1
41)
––
–(3
,330
,141
)–
––
–26
6,46
9(3
,596
,610
)8,
681,
181
Tota
l tra
nsa
ctio
ns
wit
h
ow
ner
s in
th
eir
ca
pac
ity
as o
wn
ers
14,2
15,5
674,
281,
468
8,22
3,69
9(2
6,20
9)(1
,123
,102
)(2
,792
,920
)–
––
441,
850
266,
469
(3,5
01,2
39)
9,93
4,09
9
Clo
sin
g b
alan
ce a
t 31
Dec
emb
er 2
015
52,1
25,2
2735
,936
,884
37,8
28,9
41(2
83,1
23)
(2,
468,
703)
859,
769
2,71
6,55
12,
028,
550
(112
,664
)65
6,64
0(9
28,0
69)
(3,5
01,2
39)
16,1
88,3
43
The
acco
mp
anyi
ng
acc
ou
nti
ng
po
licie
s an
d e
xpla
nat
ory
no
tes
form
an
inte
gra
l par
t o
f th
e fi
nan
cial
sta
tem
ents
.
STATEMENTS OF CHANGES IN EQUITYFor the financial year ended 31 December 2016

SMART SOCIETY, SMART L IFE | 53
(In
US
Do
llar)
Co
mp
any
Tota
leq
uit
y
Shar
eca
pit
al
(No
te 2
7)Tr
easu
rysh
ares
Rev
enu
ere
serv
e
Tota
lo
ther
rese
rves
Fair
va
lue
adju
stm
ent
rese
rve
Emp
loye
esh
are
op
tio
n
rese
rve
Oth
erre
serv
es
$$
$$
$$
$$
2016
Op
enin
g b
alan
ce a
t 1
Jan
uar
y 20
1641
,934
,505
37,8
28,9
41(2
47,6
06)
3,71
3,82
363
9,34
7(1
12,6
64)
656,
640
95,3
71
Loss
fo
r th
e ye
ar(1
6,23
2,24
4)–
–(1
6,23
2,24
4)–
––
–
Oth
er c
om
pre
hen
sive
inco
me
Net
gai
n o
n q
uo
ted
inve
stm
ents
9,62
5–
––
9,62
59,
625
––
Oth
er c
om
pre
hen
sive
inco
me
for
the
year
, n
et o
f ta
x9,
625
––
–9,
625
9,62
5–
–
Tota
l co
mp
reh
ensi
ve in
com
e fo
r th
e ye
ar(1
6,22
2,61
9)–
–(1
6,23
2,24
4)9,
625
9,62
5–
–
Co
ntr
ibu
tio
ns
by
and
dis
trib
uti
on
s to
o
wn
ers
Shar
e b
uyb
ack
(15,
149)
–(1
5,14
9)–
––
––
Gra
nt
of
equ
ity‑
sett
led
sh
are
op
tio
ns
180,
579
––
–18
0,57
9–
180,
579
–
Forf
eitu
re o
f ve
sted
eq
uit
y‑se
ttle
d s
har
e o
pti
on
s–
––
45,0
69(4
5,06
9)–
(45,
069)
–
Clo
sin
g b
alan
ce a
t 31
Dec
emb
er 2
016
25,8
77,3
1637
,828
,941
(262
,755
)(1
2,47
3,35
2)78
4,48
2(1
03,0
39)
792,
150
95,3
71
The
acco
mp
anyi
ng
acc
ou
nti
ng
po
licie
s an
d e
xpla
nat
ory
no
tes
form
an
inte
gra
l par
t o
f th
e fi
nan
cial
sta
tem
ents
.
STATEMENTS OF CHANGES IN EQUITYFor the financial year ended 31 December 2016

54 | Trek 2000 International Ltd • Annual Report 2016
(In
US
Do
llar)
Co
mp
any
Tota
leq
uit
y
Shar
eca
pit
al
(No
te 2
7)Tr
easu
rysh
ares
Rev
enu
ere
serv
e
Tota
lo
ther
rese
rves
Fair
va
lue
adju
stm
ent
rese
rve
Emp
loye
esh
are
op
tio
n
rese
rve
Oth
erre
serv
es
$$
$$
$$
$$
2015
Op
enin
g b
alan
ce a
t 1
Jan
uar
y 20
1536
,581
,649
29,6
05,2
42(2
21,3
97)
6,61
8,33
657
9,46
836
4,67
821
4,79
0–
Loss
fo
r th
e ye
ar(1
,781
,411
)–
–(1
,781
,411
)–
––
–
Oth
er c
om
pre
hen
sive
inco
me
Net
loss
on
inve
stm
ent
secu
riti
es(4
77,3
42)
––
–(4
77,3
42)
(477
,342
)–
–
Oth
er c
om
pre
hen
sive
inco
me
for
the
year
, n
et o
f ta
x(4
77,3
42)
––
–(4
77,3
42)
(477
,342
)–
–
Tota
l co
mp
reh
ensi
ve in
com
e fo
r th
e ye
ar(2
,258
,753
)–
–(1
,781
,411
)(4
77,3
42)
(477
,342
)–
–
Co
ntr
ibu
tio
ns
by
and
dis
trib
uti
on
s to
o
wn
ers
Incr
ease
in s
har
es t
hro
ug
h e
xerc
ise
of
shar
e o
pti
on
s63
,789
63,7
89–
––
––
–
Issu
ance
of
shar
es t
hro
ug
h p
lace
men
t ex
erci
se
8,15
9,91
08,
159,
910
––
––
––
Sale
of
trea
sury
sh
ares
via
pla
cem
ent
of
shar
es31
6,76
8–
221,
397
–95
,371
––
95,3
71
Shar
e b
uyb
ack
(247
,606
)–
(247
,606
)–
––
––
Gra
nt
of
equ
ity‑
sett
led
sh
are
op
tio
ns
441,
850
––
–44
1,85
0–
441,
850
–
Div
iden
d o
n o
rdin
ary
shar
es(1
,123
,102
)–
–(1
,123
,102
)–
––
–
Clo
sin
g b
alan
ce a
t 31
Dec
emb
er 2
015
41,9
34,5
0537
,828
,941
(247
,606
)3,
713,
823
639,
347
(112
,664
)65
6,64
095
,371
The
acco
mp
anyi
ng
acc
ou
nti
ng
po
licie
s an
d e
xpla
nat
ory
no
tes
form
an
inte
gra
l par
t o
f th
e fi
nan
cial
sta
tem
ents
.
STATEMENTS OF CHANGES IN EQUITYFor the financial year ended 31 December 2016

SMART SOCIETY, SMART L IFE | 55
(In US Dollar)
Note 2016 2015
$ $
Restated*
Cash flow from operating activities:
Profit/(Loss) before income tax 8,000,354 (7,568,061)
Adjustments for:
Allowance for doubtful debts, net 50,494 613,802
Amortisation of intangible assets 13 960,201 1,128,302
Depreciation of property, plant and equipment 12 1,071,787 1,179,629
Impairment of property, plant and equipment 12 211,945 –
Property, plant and equipment written off 2,360 915,320
Intangible asset written off 810,546 1,237,677
Net fair value loss/(gain) on quoted investments (transferred from equity on disposal of quoted investments) 6, 7 9,505 (328,572)
Net gain on disposal of property, plant and equipment 6 (19,433) (76,825)
(Reversal)/Allowance for stock obsolescence 18 (3,755,101) 4,466,614
Share based payment 245,151 441,850
Interest income 5 (661,778) (714,394)
Interest expense 8 145,102 153,059
Provision for customer claims 900,000 –
Unrealised foreign exchange losses (260,829) (262,912)
Operating cash flows before changes in working capital 7,710,304 1,185,489
(Increase)/Decrease in trade and other receivables, and prepayments (1,418,815) 18,420,796
Decrease/(Increase) in inventories 16,003,328 (14,341,953)
(Increase)/Decrease in trade and other payables (13,144,614) 3,341,834
Cash flows generated from operations 9,150,203 8,606,166
Interest received 138,447 47,762
Interest paid (145,102) (153,059)
Income taxes paid (190,831) (76,522)
Net cash generated from operating activities 8,952,717 8,424,347
Cash flow from investing activities:
Proceeds from disposal property, plant and equipment 25,110 213,352
Proceeds from disposal of quoted investments 4,937,190 7,345,822
Purchase of property, plant and equipment 12 (1,345,721) (1,168,867)
Purchase of quoted investments (8,433,475) (6,864,765)
Consideration received in relation to the disposal of subsidiary in prior years 151,895 79,391
Payment for patent and trademark registration expenses 13 (19,901) (14,044)
Payment for development expenditures 13 (155,522) (715,788)
Interest income from quoted investments 5 523,331 666,632
Net cash used in investing activities (4,317,093) (458,267)
* ‑ Certain amounts shown here do not correspond to the 2015 financial statements. Refer to Note 37 for adjustments made.
CONSOLIDATED CASH FLOW STATEMENTFor the financial year ended 31 December 2016

56 | Trek 2000 International Ltd • Annual Report 2016
(In US Dollar)
Note 2016 2015
$ $
Restated*
Cash flow from financing activities:
Purchase of treasury shares (15,149) (247,606)
Proceeds from exercise of employee share options 27 – 63,789
Proceeds from share placement exercise – 8,476,678
Payment of hire purchase instalments (220,445) (241,713)
Repayment of term loans (88,425) (4,567,292)
Proceeds from term loans 574,029 –
Capital contribution from non‑controlling interests – 3,084,337
Payment of dividends 36 – (1,123,102)
Net cash generated from financing activities 250,010 5,445,091
Net increase in cash and cash equivalents 4,885,634 13,411,171
Cash and cash equivalents at beginning of year 23,453,151 10,162,382
Effect of exchange rate changes on cash and cash equivalents 84,408 (120,402)
Cash and cash equivalents at end of year 21 28,423,193 23,453,151
* ‑ Certain amounts shown here do not correspond to the 2015 financial statements. Refer to Note 37 for adjustments made.
The accompanying accounting policies and explanatory notes form an integral part of the financial statements.
CONSOLIDATED CASH FLOW STATEMENTFor the financial year ended 31 December 2016

SMART SOCIETY, SMART L IFE | 57
1. Corporate information
Trek 2000 International Ltd (the “Company”) is a limited liability company incorporated and domiciled in Singapore and is listed on the Singapore Exchange Securities Trading Limited (“SGX‑ST”).
The registered office and principal place of business is located at 30 Loyang Way, #07‑13/14/15, Loyang Industrial Estate, Singapore 508769.
The principal activities of the Company are those of an investment holding company and the ownership of a portfolio of intellectual property. The principal activities of subsidiaries and associates are stated in Notes 14 and 15 respectively.
2. Summary of significant accounting policies
2.1 Basis of preparation
The consolidated financial statements of the Group and the balance sheet, income statement, statement of comprehensive income and statement of changes in equity of the Company have been prepared in accordance with Singapore Financial Reporting Standards (“FRS”).
The financial statements have been prepared on the historical cost basis, except as disclosed in the accounting policies below.
The financial statements are presented in United States Dollars (“USD” or “$”), except when otherwise indicated.
The Accounting Standards Council announced on 29 May 2014 that Singapore incorporated companies listed on the Singapore Exchange will apply a new financial reporting framework identical to the International Financial Reporting Standards. The Group will adopt the new financial reporting framework on 1 January 2018.
2.2 Changes in accounting policies
The accounting policies adopted are consistent with those of the previous financial year except in the current financial year, the Group has adopted all the Financial Reporting Standards (“FRS”) that are effective for annual periods beginning on or after 1 January 2016. The adoption of these standards did not have any effect on the financial performance or position of the Group and the Company.
2.3 Standards issued but not yet effective
The Group has not adopted the following standards and interpretations that have been issued but not yet effective:
Description
Effective for annualperiods beginning
on or after
Amendments to FRS 7 Disclosure Initiative 1 January 2017
FRS 109 Financial Instruments 1 January 2018
FRS 115 Revenue from Contracts with Customers 1 January 2018
FRS 116 Leases 1 January 2019
NOTES TO THE FINANCIAL STATEMENTSFor the financial year ended 31 December 2016

NOTES TO THE FINANCIAL STATEMENTSFor the financial year ended 31 December 2016
58 | Trek 2000 International Ltd • Annual Report 2016
2. Summary of significant accounting policies (cont’d)
2.3 Standards issued but not yet effective (cont’d)
Except for FRS 109 and FRS 115 the directors expect that the adoption of the other standards above will have no material impact on the financial statements in the period of initial application. The nature of the impending changes in accounting policy on adoption of FRS 109 and FRS 115 are described below.
FRS 109 Financial Instruments
FRS 109 introduces new requirements for classification and measurement of financial assets, impairment of financial assets and hedge accounting. Financial assets are classified according to their contractual cash flow characteristics and the business model under which they are held. The impairment requirements in FRS 109 are based on an expected credit loss model and replace the FRS 39 incurred loss model. Adopting the expected credit losses requirements will require the Group to make changes to its current systems and processes.
The Group currently measures one of its investments in unquoted equity securities at cost. Under FRS 109, the Group will be required to measure the investment at fair value. Any difference between the previous carrying amount and the fair value would be recognised in the opening retained earnings when the Group apply FRS 109.
FRS 109 is effective for annual periods beginning on or after 1 January 2018 with early application permitted. Retrospective application is required, but comparative information is not compulsory. The Group is currently assessing the impact of FRS 109 and plans to adopt the standard on the required effective date.
FRS 115 Revenue from Contracts with Customers
FRS 115 establishes a five‑step model that will apply to revenue arising from contracts with customers. Under FRS 115, revenue is recognised at an amount that reflects the consideration which an entity expects to be entitled in exchange for transferring goods or services to a customer. The principles in FRS 115 provide a more structured approach to measuring and recognising revenue when the promised goods and services are transferred to the customer i.e. when performance obligations are satisfied.
Key issues for the Group include identifying performance obligations, accounting for contract modifications, applying the constraint to variable consideration, evaluating significant financing components, measuring progress toward satisfaction of a performance obligation, recognising contract cost assets and addressing disclosure requirements.
Either a full or modified retrospective application is required for annual periods beginning on or after 1 January 2018 with early adoption permitted. The Group is currently assessing the impact of FRS 115 and plans to adopt the new standard on the required effective date.
2.4 Basis of consolidation and business combinations
A) Basis of consolidation
The consolidated financial statements comprise the financial statements of the Company and its subsidiaries as at the end of the reporting period. The financial statements of the subsidiaries used in the preparation of the consolidated financial statements are prepared for the same reporting date as the Company. Consistent accounting policies are applied to like transactions and events in similar circumstances.
All intra‑group balances, income and expenses and unrealised gains and losses resulting from intra‑group transactions and dividends are eliminated in full.
Subsidiaries are consolidated from the date of acquisition, being the date on which the Group obtains control, and continue to be consolidated until the date that such control ceases.

NOTES TO THE FINANCIAL STATEMENTSFor the financial year ended 31 December 2016
SMART SOCIETY, SMART L IFE | 59
2. Summary of significant accounting policies (cont’d)
2.4 Basis of consolidation and business combinations (cont’d)
A) Basis of consolidation (cont’d)
Losses within a subsidiary are attributed to the non‑controlling interest even if that results in a deficit balance.
A change in the ownership interest of a subsidiary, without a loss of control, is accounted for as an equity transaction. If the Group loses control over a subsidiary, it:
‑ de‑recognises the assets (including goodwill) and liabilities of the subsidiary at their carrying amounts at the date when control is lost;
‑ de‑recognises the carrying amount of any non‑controlling interest;
‑ de‑recognises the cumulative translation differences recorded in equity;
‑ recognises the fair value of the consideration received;
‑ recognises the fair value of any investment retained;
‑ recognises any surplus or deficit in profit or loss;
‑ re‑classifies the Group’s share of components previously recognised in other comprehensive income to profit or loss or retained earnings, as appropriate.
B) Business combinations
Business combinations are accounted for by applying the acquisition method. Identifiable assets acquired and liabilities assumed in a business combination are measured initially at their fair values at the acquisition date. Acquisition‑related costs are recognised as expenses in the periods in which the costs are incurred and the services are received.
In business combinations achieved in stages, previously held equity interests in the acquiree are remeasured to fair value at the acquisition date and any corresponding gain or loss is recognised in profit or loss.
The Group elects for each individual business combination, whether non‑controlling interest in the acquiree (if any) that are present ownership interests and entitle their holders to a proportionate share of net assets in the event of liquidation, is recognised on the acquisition date at fair value, or at the non‑controlling interest’s proportionate share of the acquiree’s identifiable net assets. Other components of non‑controlling interest are measured at their acquisition date fair value, unless another measurement basis is required by another FRS.
Any excess of the sum of the fair value of the consideration transferred in the business combination, the amount of non‑controlling interest in the acquiree (if any), and the fair value of the Group’s previously held equity interest in the acquiree (if any), over the net fair value of the acquiree’s identifiable assets and liabilities is recorded as goodwill. In instances where the latter amount exceeds the former, the excess is recognised as gain on bargain purchase in profit or loss on the acquisition date.

NOTES TO THE FINANCIAL STATEMENTSFor the financial year ended 31 December 2016
60 | Trek 2000 International Ltd • Annual Report 2016
2. Summary of significant accounting policies (cont’d)
2.5 Transactions with non-controlling interests
Non‑controlling interest represents the equity in subsidiaries not attributable, directly or indirectly, to owners of the Company, and are presented separately in the consolidated statement of comprehensive income and within equity in the consolidated balance sheet, separately from equity attributable to owners of the Company.
Changes in the Company’s ownership interest in a subsidiary that do not result in a loss of control are accounted for as equity transactions. In such circumstances, the carrying amounts of the controlling and non‑controlling interests are adjusted to reflect the changes in their relative interests in the subsidiary. Any difference between the amount by which the non‑controlling interest is adjusted and the fair value of the consideration paid or received is recognised directly in equity and attributed to owners of the Company.
2.6 Foreign currency
The financial statements are presented in United States Dollar, which is also the Company’s functional currency. Each entity in the Group determines its own functional currency and items included in the financial statements of each entity are measured using that functional currency.
(a) Transactions and balances
Transactions in foreign currencies are measured in the respective functional currencies of the Company and its subsidiaries and are recorded on initial recognition in the functional currencies at exchange rates approximating those ruling at the transaction dates. Monetary assets and liabilities denominated in foreign currencies are translated at the rate of exchange ruling at the end of the reporting period. Non‑monetary items that are measured in terms of historical cost in a foreign currency are translated using the exchange rates as at the dates of the initial transactions. Non‑monetary items measured at fair value in a foreign currency are translated using the exchange rates at the date when the fair value was measured.
Exchange differences arising on the settlement of monetary items or on translating monetary items at the end of the reporting period are recognised in profit or loss.
(b) Consolidated financial statements
For consolidation purpose, the assets and liabilities of foreign operations are translated into USD at the rate of exchange ruling at the end of the reporting period and their profit or loss are translated at the exchange rates prevailing at the date of the transactions. The exchange differences arising on the translation are recognised in other comprehensive income. On disposal of a foreign operation, the component of other comprehensive income relating to that particular foreign operation is recognised in profit or loss.
2.7 Property, plant and equipment
All items of property, plant and equipment are initially recorded at cost. Subsequent to recognition, property, plant and equipment, other than freehold and leasehold properties are measured at cost less accumulated depreciation and any accumulated impairment losses.
Freehold and leasehold properties are measured at fair value less accumulated depreciation and impairment losses recognised after the date of the revaluation. Valuations are performed with sufficient regularity to ensure that the carrying amount does not differ materially from the fair value of the properties at the end of the reporting period.

NOTES TO THE FINANCIAL STATEMENTSFor the financial year ended 31 December 2016
SMART SOCIETY, SMART L IFE | 61
2. Summary of significant accounting policies (cont’d)
2.7 Property, plant and equipment (cont’d)
Any revaluation surplus is recognised in other comprehensive income and accumulated in equity under the asset revaluation reserve, except to the extent that it reverses a revaluation decrease of the same asset previously recognised in profit or loss, in which case the increase is recognised in profit or loss. A revaluation deficit is recognised in profit or loss, except to the extent that it offsets an existing surplus on the same asset carried in the asset revaluation reserve.
Any accumulated depreciation as at the revaluation date is eliminated against the gross carrying amount of the asset and the net amount is restated to the revalued amount of the asset. The revaluation surplus included in the asset revaluation reserve in respect of an asset is transferred directly to revenue reserve on retirement or disposal of the asset.
Depreciation of an asset begins when it is available for use and is computed on a straight‑line basis over the estimated useful life of the assets as follows:
Freehold property ‑ 50 yearsLeasehold property ‑ Over the term of the lease (20 to 60 years)Furniture and fittings ‑ 8 yearsRenovations ‑ 8 yearsOffice equipment ‑ 6 yearsComputers ‑ 3 yearsMotor vehicles ‑ 6 yearsPlant and machinery ‑ 3 to 16 years
Assets under construction are not depreciated as these assets are not yet available for use.
The carrying values of property, plant and equipment are reviewed for impairment when events or changes in circumstances indicate that the carrying values may not be recoverable.
The residual values, useful life and depreciation method are reviewed at each financial year‑end, and adjusted prospectively, if appropriate.
An item of property, plant and equipment is derecognised upon disposal or when no future economic benefits are expected from its use or disposal. Any gain or loss arising on derecognition of the asset is included in the profit or loss in the year the asset is derecognised.
2.8 Intangible assets
Intangible assets acquired separately are measured initially at cost. Following initial acquisition, intangible assets are measured at cost less any accumulated amortisation and any accumulated impairment losses. Internally generated intangible assets, excluding capitalised development costs, are not capitalised and expenditure is reflected in profit or loss in the year in which the expenditure is incurred.
The useful lives of intangible assets are assessed as either finite or indefinite.
Intangible assets with finite useful lives are amortised over the estimated useful lives and assessed for impairment whenever there is an indication that the intangible asset may be impaired. The amortisation period and the amortisation method are reviewed at least at each financial year‑end. Changes in the expected useful life or the expected pattern of consumption of future economic benefits embodied in the asset is accounted for by changing the amortisation period or method, as appropriate, and are treated as changes in accounting estimates. The amortisation expense on intangible assets with finite useful lives is recognised in the profit or loss through the “Research and development” and “Cost of sales” line items, consistent with the function of the intangible assets.

NOTES TO THE FINANCIAL STATEMENTSFor the financial year ended 31 December 2016
62 | Trek 2000 International Ltd • Annual Report 2016
2. Summary of significant accounting policies (cont’d)
2.8 Intangible assets (cont’d)
The Group does not have intangible assets with indefinite useful lives.
Gains or losses arising from derecognition of an intangible asset are measured as the difference between the net disposal proceeds and the carrying amount of the asset and are recognised in the profit or loss when the asset is derecognised.
(i) Research and development costs
Research costs are expensed as incurred. Deferred development costs arising from development expenditures on an individual project are recognised as an intangible asset when the Group can demonstrate the technical feasibility of completing the intangible asset so that it will be available for use or sale, its intention to complete and its ability to use or sell the asset, how the asset will generate future economic benefits, the availability of resources to complete and the ability to measure reliably the expenditure during the development.
Following initial recognition of the deferred development costs as an intangible asset, it is carried at cost less accumulated amortisation and any accumulated impairment losses. Amortisation of the intangible asset begins when development is complete and the asset is available for use. Deferred development costs have a finite useful life and are amortised over the period of expected sales from the related project (ranging from 5 to 20 years) on a straight‑line basis.
The carrying value of development costs is reviewed for impairment annually when the asset is not yet in use or more frequently when an indication of impairment arises during the year.
(ii) Patents and trademarks
Patent and trademark costs relate to the costs of registering the invention and trademarks. These are stated at cost and amortised over the estimated useful lives up to a maximum of 20 years from the date of commercialisation, during which the benefits of the expenditure are expected to arise.
2.9 Impairment of non-financial assets
The Group assesses at each reporting date whether there is an indication that an asset may be impaired. If any such indication exists, or when annual impairment assessment for an asset is required, the Group makes an estimate of the asset’s recoverable amount.
An asset’s recoverable amount is the higher of an asset’s or cash‑generating unit’s fair value less costs of disposal and its value in use and is determined for an individual asset, unless the asset does not generate cash inflows that are largely independent of those from other assets or group of assets. Where the carrying amount of an asset or cash‑generating unit exceeds its recoverable amount, the asset is considered impaired and is written down to its recoverable amount.
In determining fair value less costs of disposal, recent market transactions are taken into account, if available. If no such transactions can be identified, an appropriate valuation model is used.
Impairment losses of continuing operations are recognised in profit or loss in those expense categories consistent with the function of impaired assets, except for assets that are previously revalued where the revaluation was taken to other comprehensive income. In this case, the impairment is also recognised in other comprehensive income up to the amount of any previous revaluation.
NOTES TO THE FINANCIAL STATEMENTSFor the financial year ended 31 December 2016
SMART SOCIETY, SMART L IFE | 63
2. Summary of significant accounting policies (cont’d)
2.9 Impairment of non-financial assets (cont’d)
A previously recognised impairment loss is reversed only if there has been a change in the estimates used to determine the asset’s recoverable amount since the last impairment loss was recognised. If that is the case, the carrying amount of the asset is increased to its recoverable amount. That increase cannot exceed the carrying amount that would have been determined, net of depreciation, had no impairment loss been recognised previously. Such reversal is recognised in the profit or loss unless the asset is measured at revalued amount, in which case the reversal is treated as a revaluation increase.
2.10 Subsidiaries
A subsidiary is an investee that is controlled by the Group. The Group controls an investee when it is exposed, or has rights, to variable returns from its involvement with the investee and has the ability to affect those returns through its power over the investee.
In the Company’s separate financial statements, investment in subsidiaries is accounted for at cost less impairment losses.
2.11 Associates
An associate is an entity over which the Group has the power to participate in the financial and operating policy decisions of the investee but does not have control or joint control of those policies.
The Group account for its investments in associates using the equity method from the date on which it becomes an associate.
On acquisition of the investment, any excess of the cost of the investment over the Group’s share of the net fair value of the investee’s identifiable assets and liabilities is accounted as goodwill and is included in the carrying amount of the investment. Any excess of the Group’s share of the net fair value of the investee’s identifiable assets and liabilities over the cost of the investment is included as income in the determination of the entity’s share of the associate’s profit or loss in the period in which the investment is acquired.
Under the equity method, the investment in associates are carried in the balance sheet at cost plus post‑acquisition changes in the Group’s share of net assets of the associates. The profit or loss reflects the share of results of the operations of the associates. Distributions received from associates reduce the carrying amount of the investment. Where there has been a change recognised in other comprehensive income by the associates, the Group recognises its share of such changes in other comprehensive income. Unrealised gains and losses resulting from transactions between the Group and associate are eliminated to the extent of the interest in the associates.
When the Group’s share of losses in an associate equals or exceeds its interest in the associate, the Group does not recognise further losses, unless it has incurred obligations or made payments on behalf of the associate.
After application of the equity method, the Group determines whether it is necessary to recognise an additional impairment loss on the Group’s investment in associate. The Group determines at the end of each reporting period whether there is any objective evidence that the investment in the associate is impaired. If this is the case, the Group calculates the amount of impairment as the difference between the recoverable amount of the associate and its carrying value and recognises the amount in profit or loss.
The financial statements of the associates are prepared as the same reporting date as the Company. Where necessary, adjustments are made to bring the accounting policies in line with those of the Group.

NOTES TO THE FINANCIAL STATEMENTSFor the financial year ended 31 December 2016
64 | Trek 2000 International Ltd • Annual Report 2016
2. Summary of significant accounting policies (cont’d)
2.12 Financial assets
Initial recognition and measurement
Financial assets are recognised when, and only when, the Group becomes a party to the contractual provisions of the financial instrument. The Group determines the classification of its financial assets at initial recognition.
When financial assets are recognised initially, they are measured at fair value, plus, in the case of financial assets not at fair value through profit or loss, directly attributable transaction costs.
Subsequent measurement
The subsequent measurement of financial assets depends on their classification as follows:
(a) Loans and receivables
Non‑derivative financial assets with fixed or determinable payments that are not quoted in an active market are classified as loans and receivables. Subsequent to initial recognition, loans and receivables are measured at amortised cost using the effective interest method, less impairment. Gains and losses are recognised in profit or loss when the loans and receivables are derecognised or impaired, and through the amortisation process.
(b) Available-for-sale financial assets
Available‑for‑sale financial assets include equity and debt securities. Equity investments classified as available‑for‑sale are those, which are neither classified as held for trading nor designated at fair value through profit or loss. Debt securities in this category are those which are intended to be held for an indefinite period of time and which may be sold in response to needs for liquidity or in response to changes in the market conditions.
After initial recognition, available‑for‑sale financial assets are subsequently measured at fair value. Any gains or losses from changes in fair value of financial assets are recognised in other comprehensive income, except that impairment losses, foreign exchange gains and losses on monetary instruments and interest calculated using the effective interest method are recognised in profit or loss. The cumulative gain or loss previously recognised in other comprehensive income is reclassified from equity to profit or loss as a reclassification adjustment when the financial asset is derecognised.
Investments in equity instruments whose fair value cannot be reliably measured are measured at cost less impairment loss.
Derecognition
A financial asset is derecognised where the contractual right to receive cash flows from the asset has expired. On derecognition of a financial asset in its entirety, the difference between the carrying amount and the sum of the consideration received and any cumulative gain or loss that had been recognised in other comprehensive income is recognised in profit or loss.
Regular way purchase or sale of a financial asset
All regular way purchases and sales of financial assets are recognised or derecognised on the trade date i.e., the date that the Group commits to purchase or sell the asset. Regular way purchases or sales are purchases or sales of financial assets that require delivery of assets within the period generally established by regulation or convention in the marketplace concerned.

NOTES TO THE FINANCIAL STATEMENTSFor the financial year ended 31 December 2016
SMART SOCIETY, SMART L IFE | 65
2. Summary of significant accounting policies (cont’d)
2.13 Impairment of financial assets
The Group assesses at each end of the reporting period whether there is any objective evidence that a financial asset is impaired.
(a) Financial assets carried at amortised cost
For financial assets carried at amortised cost, the Group first assesses whether objective evidence of impairment exists individually for financial assets that are individually significant, or collectively for financial assets that are not individually significant. If the Group determines that no objective evidence of impairment exists for an individually assessed financial asset, whether significant or not, it includes the asset in a group of financial assets with similar credit risk characteristics and collectively assesses them for impairment. Assets that are individually assessed for impairment and for which an impairment loss is, or continues to be recognised are not included in a collective assessment of impairment.
If there is objective evidence that an impairment loss on financial assets carried at amortised cost has been incurred, the amount of the loss is measured as the difference between the asset’s carrying amount and the present value of estimated future cash flows discounted at the financial asset’s original effective interest rate. If a loan has a variable interest rate, the discount rate for measuring any impairment loss is the current effective interest rate. The carrying amount of the asset is reduced through the use of an allowance account. The impairment loss is recognised in profit or loss.
When the asset becomes uncollectible, the carrying amount of impaired financial asset is reduced directly or if an amount was charged to the allowance account, the amounts charged to the allowance account are written off against the carrying value of the financial asset.
To determine whether there is objective evidence that an impairment loss on financial assets has been incurred, the Group considers factors such as the probability of insolvency or significant financial difficulties of the debtor and default or significant delay in payments.
If in a subsequent period, the amount of the impairment loss decreases and the decrease can be related objectively to an event occurring after the impairment was recognised, the previously recognised impairment loss is reversed to the extent that the carrying amount of the asset does not exceed its amortised cost at the reversal date. The amount of reversal is recognised in profit or loss.
(b) Financial assets carried at cost
If there is objective evidence (such as significant adverse changes in the business environment where the issuer operates, probability of insolvency or significant financial difficulties of the issuer) that an impairment loss on financial assets carried at cost has been incurred, the amount of the loss is measured as the difference between the asset’s carrying amount and the present value of estimated future cash flows discounted at the current market rate of return for a similar financial asset. Such impairment losses are not reversed in subsequent periods.
(c) Available-for-sale financial assets
In the case of equity investments classified as available‑for‑sale, objective evidence of impairment include (i) significant financial difficulty of the issuer or obligor, (ii) information about significant changes with an adverse effect that have taken place in the technological, market, economic or legal environment in which the issuer operates, and indicates that the cost of the investment in equity instrument may not be recovered; and (iii) a significant or prolonged decline in the fair value of the investment below its costs.

NOTES TO THE FINANCIAL STATEMENTSFor the financial year ended 31 December 2016
66 | Trek 2000 International Ltd • Annual Report 2016
2. Summary of significant accounting policies (cont’d)
2.13 Impairment of financial assets (cont’d)
(c) Available-for-sale financial assets (cont’d)
If an available‑for‑sale financial asset is impaired, an amount comprising the difference between its acquisition cost (net of any principal repayment and amortisation) and its current fair value, less any impairment loss previously recognised in profit or loss, is transferred from other comprehensive income and recognised in profit or loss. Reversals of impairment losses in respect of equity instruments are not recognised in profit or loss; increase in their fair value after impairment are recognised directly in other comprehensive income.
In the case of debt instruments classified as available‑for‑sale, impairment is assessed based on the same criteria as financial assets carried at amortised cost. However, the amount recorded for impairment is the cumulative loss measured as the difference between the amortised cost and the current fair value, less any impairment loss on that investment previously recognised in profit or loss. Future interest income continues to be accrued based on the reduced carrying amount of the asset, using the rate of interest used to discount the future cash flows for the purpose of measuring the impairment loss. The interest income is recorded as part of finance income. If, in a subsequent year, the fair value of a debt instrument increases and the increases can be objectively related to an event occurring after the impairment loss was recognised in profit or loss, the impairment loss is reversed directly in profit or loss.
2.14 Cash and cash equivalents
Cash and cash equivalents comprise cash at bank and on hand, demand deposits, and short‑term, highly liquid investments that are readily convertible to known amount of cash and which are subject to an insignificant risk of changes in value. These also include bank overdrafts that form an integral part of the Group’s cash management.
2.15 Inventories
Inventories are stated at the lower of cost and net realisable value. Costs incurred in bringing the inventories to their present location and conditions are accounted for as follows:
‑ Raw materials: purchase costs on a first‑in first‑out basis, which includes purchase price and other incidental costs.
‑ Finished goods and work‑in‑progress: cost of direct materials and labour and a proportion of manufacturing overheads based on normal operating capacity. These costs are assigned on a first‑in first‑out basis.
Where necessary, allowance is provided for damaged, obsolete and slow moving items to adjust the carrying value of inventories to the lower of cost and net realisable value.
Net realisable value is the estimated selling price in the ordinary course of business, less estimated costs of completion and the estimated costs necessary to make the sale.

NOTES TO THE FINANCIAL STATEMENTSFor the financial year ended 31 December 2016
SMART SOCIETY, SMART L IFE | 67
2. Summary of significant accounting policies (cont’d)
2.16 Provisions
Provisions are recognised when the Group has a present obligation (legal or constructive) as a result of a past event, it is probable that an outflow of resources embodying economic benefits will be required to settle the obligation and the amount of the obligation can be estimated reliably.
Provisions are reviewed at each balance sheet date and adjusted to reflect the current best estimate. If it is no longer probable that an outflow of economic resources will be required to settle the obligation, the provision is reversed. If the effect of the time value of money is material, provisions are discounted using a current pre‑tax rate that reflects, where appropriate, the risks specific to the liability. When discounting is used, the increase in the provision due to the passage of time is recognised as finance costs.
2.17 Government grants
Government grants are recognised when there is a reasonable assurance that the grant will be received and all attaching conditions will be complied with. Government grants related to income are recognised in profit or loss on a systematic basis over the periods in which the Group recognises as expenses the related costs for which the grant are intended to compensate.
2.18 Borrowing costs
Borrowing costs are capitalised as part of the cost of a qualifying asset if they are directly attributable to the acquisition, construction or production of that asset. Capitalisation of borrowing costs commences when the activities to prepare the asset for its intended use or sale are in progress and the expenditures and borrowing costs are incurred. Borrowing costs are capitalised until the assets are substantially completed for their intended use or sale. All other borrowing costs are expensed in the period they occur. Borrowing costs consist of interest and other costs that an entity incurs in connection with the borrowing of funds.
2.19 Financial liabilities
Initial recognition and measurement
Financial liabilities are recognised when, and only when, the Group becomes a party to the contractual provisions of the financial instrument. The Group determines the classification of its financial liabilities at initial recognition.
All financial liabilities are recognised initially at fair value plus in the case of financial liabilities not at fair value through profit or loss, directly attributable transaction costs.
Subsequent measurement
After initial recognition, financial liabilities that are not carried at fair value through profit or loss are subsequently measured at amortised cost using the effective interest method. Gains and losses are recognised in profit or loss when the liabilities are derecognised, and through the amortisation process.
De-recognition
A financial liability is de‑recognised when the obligation under the liability is discharged, cancelled or expires. When an existing financial liability is replaced by another from the same lender on substantially different terms, or the terms of an existing liability are substantially modified, such an exchange or modification is treated as a de‑recognition of the original liability and the recognition of a new liability, and the difference in the respective carrying amounts is recognised in profit or loss.

NOTES TO THE FINANCIAL STATEMENTSFor the financial year ended 31 December 2016
68 | Trek 2000 International Ltd • Annual Report 2016
2. Summary of significant accounting policies (cont’d)
2.19 Financial liabilities (cont’d)
Offsetting of financial instruments
Financial assets and financial liabilities are offset and the net amount is presented in the balance sheets, when and only when, there is a currently enforceable legal right to set off the recognised amounts and there is an intention to settle on a net basis, or to realise the assets and settle the liabilities simultaneously.
2.20 Employee benefits
(a) Defined contribution plans
The Group participates in the national pension schemes as defined by the laws of the countries in which it has operations. In particular, the Singapore companies in the Group make contributions to the Central Provident Fund scheme in Singapore, a defined contribution pension scheme. Contributions to defined contribution pension schemes are recognised as an expense in the period in which the related service is performed.
(b) Employee share option plans
Employees of the Group receive remuneration in the form of share options as consideration for services rendered. The cost of these equity‑settled share based payment transactions with employees is measured by reference to the fair value of the options at the date on which the options are granted which takes in account market conditions and non‑vesting conditions. This cost is recognised in profit or loss, with a corresponding increase in the employee share option reserve, over the vesting period. The cumulative expense recognised at each reporting date until the vesting date reflects the extent to which the vesting period has expired and the Group’s best estimate of the number of options that will ultimately vest. The charge or credit to profit or loss for a period represents the movement in cumulative expense recognised as at the beginning and end of that period and is recognised in employee benefits expense.
The employee share option reserve is transferred to revenue reserve upon expiry of the share options.
2.21 Leases
As lessee
Finance leases which transfer to the Group substantially all the risks and rewards incidental to ownership of the leased item, are capitalised at the inception of the lease at the fair value of the leased asset or, if lower, at the present value of the minimum lease payments. Any initial direct costs are also added to the amount capitalised. Lease payments are apportioned between the finance charges and reduction of the lease liability so as to achieve a constant rate of interest on the remaining balance of the liability. Finance charges are charged to profit or loss. Contingent rents, if any, are charged as expenses in the periods in which they are incurred.
Capitalised leased assets are depreciated over the shorter of the estimated useful life of the asset and the lease term, if there is no reasonable certainty that the Group will obtain ownership by the end of the lease term.
Operating lease payments are recognised as an expense in profit or loss on a straight‑line basis over the lease term. The aggregate benefit of incentives provided by the lessor is recognised as a reduction of rental expense over the lease term on a straight‑line basis.

NOTES TO THE FINANCIAL STATEMENTSFor the financial year ended 31 December 2016
SMART SOCIETY, SMART L IFE | 69
2. Summary of significant accounting policies (cont’d)
2.22 Revenue
Revenue is recognised to the extent that it is probable that the economic benefits will flow to the Group and the revenue can be reliably measured, regardless of when the payment is made. Revenue is measured at the fair value of consideration received or receivable, taking into account contractually defined terms of payment and excluding taxes or duty. The Group assesses its revenue arrangements to determine if it is acting as principal or agent. The Group has concluded that it is acting as a principal in all of its revenue arrangements. The following specific recognition criteria must also be met before revenue is recognised:
(a) Sale of goods
Revenue from sale of goods is recognised upon the transfer of significant risk and rewards of ownership of the goods to the customer, usually on delivery of goods. Revenue is not recognised to the extent where there are significant uncertainties regarding recovery of the consideration due, associated costs or the possible return of goods.
(b) Licensing income
When the licensing fees to be received are contingent on the occurrence of a future event, the licensing fees are recognised at their fair value where there is reasonable assurance that the licensing income will be received, which is normally when the event has occurred.
Licensing fees received upfront are recognised on a straight‑line basis over the life of the agreement when the licensee has the right to use the technology for a specified period of time and the Group has remaining obligations to perform. In instances where the Group has no remaining obligations to perform, the licensing fees received upfront are recognised at the time of receipt.
(c) Interest income
Interest income is recognised using the effective interest method.
(d) Dividend income
Dividend income is recognised when the Group’s right to receive payment is established.
2.23 Taxes
(a) Current income tax
Current income tax assets and liabilities for the current and prior periods are measured at the amount expected to be recovered from or paid to the taxation authorities. The tax rates and tax laws used to compute the amount are those that are enacted or substantively enacted at the end of the reporting period, in the countries where the Group operates and generates taxable income.
Current income taxes are recognised in profit or loss except to the extent that the tax relates to items recognised outside profit or loss, either in other comprehensive income or directly in equity. Management periodically evaluates positions taken in the tax returns with respect to situations in which applicable tax regulations are subject to interpretation and establishes provisions where appropriate.

NOTES TO THE FINANCIAL STATEMENTSFor the financial year ended 31 December 2016
70 | Trek 2000 International Ltd • Annual Report 2016
2. Summary of significant accounting policies (cont’d)
2.23 Taxes (cont’d)
(b) Deferred tax
Deferred tax is provided using the liability method on temporary differences at the end of the reporting period between the tax bases of assets and liabilities and their carrying amounts for financial reporting purposes.
Deferred tax liabilities are recognised for all temporary differences, except:
‑ Where the deferred tax liability arises from the initial recognition of goodwill or of an asset or liability in a transaction that is not a business combination and, at the time of the transaction, affects neither the accounting profit nor taxable profit or loss; and
‑ In respect of taxable temporary differences associated with investments in subsidiaries, associates and interests in joint ventures, where the timing of the reversal of the temporary differences can be controlled and it is probable that the temporary differences will not reverse in the foreseeable future.
Deferred tax assets are recognised for all deductible temporary differences, the carry forward of unused tax credits and unused tax losses, to the extent that it is probable that taxable profit will be available against which the deductible temporary differences, and the carry forward of unused tax credits and unused tax losses can be utilised except:
‑ Where the deferred tax asset relating to the deductible temporary difference arises from the initial recognition of an asset or liability in a transaction that is not a business combination and, at the time of the transaction, affects neither the accounting profit nor taxable profit or loss; and
‑ In respect of deductible temporary differences associated with investments in subsidiaries, associates and interests in joint ventures, deferred tax assets are recognised only to the extent that it is probable that the temporary differences will reverse in the foreseeable future and taxable profit will be available against which the temporary differences can be utilised.
The carrying amount of deferred tax assets is reviewed at the end of each reporting period and reduced to the extent that it is no longer probable that sufficient taxable profit will be available to allow all or part of the deferred tax asset to be utilised. Unrecognised deferred tax assets are reassessed at the end of each reporting period and are recognised to the extent that it has become probable that future taxable profit will allow the deferred tax asset to be recovered.
Deferred tax assets and liabilities are measured at the tax rates that are expected to apply in the year when the asset is realised or the liability is settled, based on tax rates (and tax laws) that have been enacted or substantially enacted at the end of each reporting period.
Deferred tax relating to items recognised outside profit or loss is recognised outside profit or loss. Deferred tax items are recognised in correlation to the underlying transaction either in other comprehensive income or directly in equity and deferred tax arising from a business combination is adjusted against goodwill on acquisition.
Deferred tax assets and deferred tax liabilities are offset, if a legally enforceable right exists to set off current income tax assets against current income tax liabilities and the deferred taxes relate to the same taxable entity and the same taxation authority.

NOTES TO THE FINANCIAL STATEMENTSFor the financial year ended 31 December 2016
SMART SOCIETY, SMART L IFE | 71
2. Summary of significant accounting policies (cont’d)
2.23 Taxes (cont’d)
(c) Sales tax
Revenues, expenses and assets are recognised net of the amount of sales tax except:
‑ Where the sales tax incurred on a purchase of assets or services is not recoverable from the taxation authority, in which case the sales tax is recognised as part of the cost of acquisition of the asset or as part of the expense item as applicable; and
‑ Receivables and payables that are stated with the amount of sales tax included.
The net amount of sales tax recoverable from or payable to the taxation authority is included as part of receivables or payables in the balance sheet.
2.24 Share capital and share issuance expenses
Proceeds from issuance of ordinary shares are recognised as share capital in equity. Incremental costs directly attributable to the issuance of ordinary shares are deducted against share capital.
2.25 Treasury shares
The Company’s own equity instruments, which are reacquired (treasury shares) are recognised at cost and deducted from equity. No gain or loss is recognised in profit or loss on the purchase, sale, issue or cancellation of the Company’s own equity instruments. Any difference between the carrying amount of treasury shares and the consideration received, if reissued, is recognised directly in equity. Voting rights related to treasury shares are nullified for the Company and no dividends are allocated to them respectively.
2.26 Contingencies
A contingent liability is:
(a) a possible obligation that arises from past events and whose existence will be confirmed only by the occurrence or non‑occurrence of one or more uncertain future events not wholly within the control of the Group; or
(b) a present obligation that arises from past events but is not recognised because:
(i) It is not probable that an outflow of resources embodying economic benefits will be required to settle the obligation; or
(ii) The amount of the obligation cannot be measured with sufficient reliability.
A contingent asset is a possible asset that arises from past events and whose existence will be confirmed only by the occurrence or non‑occurrence of one or more uncertain future events not wholly within the control of the Group.
Contingent liabilities and assets are not recognised on the balance sheet of the Group, except for contingent liabilities assumed in a business combination that are present obligations and which the fair values can be reliably determined.

NOTES TO THE FINANCIAL STATEMENTSFor the financial year ended 31 December 2016
72 | Trek 2000 International Ltd • Annual Report 2016
2. Summary of significant accounting policies (cont’d)
2.27 Segment reporting
For management purposes, the Group is organised into operating segments based on their products and services which are independently managed by the respective segment managers responsible for the performance of the respective segments under their charge. The segment managers report directly to the management of the Company who regularly review the segment results in order to allocate resources to the segments and to assess the segment performance. Additional disclosures on each of these segments are shown in Note 35, including the factors used to identify the reportable segments and the measurement basis of segment information.
2.28 Ongoing investigations and inquiries into affairs of the Group and the Company
(a) Transactions with T-Data Systems (S) Pte. Ltd.
On 25 February 2016, the Company announced that it has, through the Company’s Audit Committee, discovered certain potential interested person transactions (“IPT”) entered into by the Group with T‑Data Systems (S) Pte. Ltd. (“T‑Data”).
Ms. Loo Soo Hooi (“Ms Loo”) is the spouse of the then Executive Director of the Company Mr. Poo Teng Pin. Ms Loo was the sole shareholder of T‑Data from 27 November 2007 to 18 September 2012. Mr. Tan Joon Yong Wayne, who is the son of the chairman and CEO of the Company, Mr. Henn Tan, was a major shareholder of T‑Data from 18 September 2012 to 26 March 2014. At 31 December 2016, Ms Tan Ai Ching (“Ms Tan”) is the sole shareholder of T‑Data (2015: Ms Tan, Mr. Tan Chun Chieh Edwin (“Edwin Tan”) and Ms Loo were shareholders of T‑Data). Edwin Tan and Ms Tan are the nephew and niece of Mr. Henn Tan, respectively.
The material transactions and balances recorded by the Group with T‑Data for the years ended 31 December 2015 and 2016 are as follows:
2016 2015
$ $
Transactions with T-Data
Sales of goods and services to T‑Data 7,118,692 102,284,000
Development expenditure paid/payable to T‑Data – (350,000)
“Licensing fees” charged by T‑Data 133,506 227,370
Balances with T-Data at year-end
Trade receivables due from T‑Data 275,218 3,267,000
On 7 April 2016, the Company announced the appointment of TSMP Law Corporation (“TSMP”) to conduct an independent review of the IPT. On 8 June 2016, the Company announced the appointment of RSM Corporate Advisory Pte Ltd (“RSM”) as forensic accountants to review the past transactions and provide their findings and analysis from a forensic financial.
These reviews are still ongoing as at the date of this report. Further adjustments, restatements or disclosures could be made to the financial statements in future upon completion of these reviews.

NOTES TO THE FINANCIAL STATEMENTSFor the financial year ended 31 December 2016
SMART SOCIETY, SMART L IFE | 73
2. Summary of significant accounting policies (cont’d)
2.28 Ongoing investigations and inquiries into affairs of the Group and the Company (cont’d)
(b) Inconsistencies in the Group and the Company’s accounting records
The auditor had informed the management of certain inconsistencies in the accounting records maintained by the Group and the Company during the course of their audit for the 2015 and 2016 financial statements and expressed concerns over the validity of certain transactions recorded therein. The basis of the auditor’s concerns comprised i) the lack of valid supporting documentation for certain licensing income recorded in the past and ii) discrepancies in respect of the recording of certain intangible assets, plant and equipment, inventories, sales and expenses.
During the audit of the 2015 financial statements, the Company was informed that its auditor had made a report to the Accounting and Corporate Regulatory Authority of Singapore (“ACRA”) under Section 207(9) of the Singapore Companies Act (Cap. 50) (“Companies Act”) of matters that have come to their attention in the course of their audit.
Arising from the above, the Company has appointed RSM as forensic accountants to conduct an independent review into the transactions highlighted by the auditor during their audit of both the 2015 and 2016 financial statements.
As at the date of this report, the review by RSM is still ongoing. Further adjustments, restatements or disclosures to the current and preceding year’s financial statements could be required in future upon the completion of RSM’s review.
(c) Investigations by Commercial Affairs Department of the Singapore Police Force (“CAD”)
On 25 May 2016 and 1 June 2016, the Company announced that several executives of the Company are assisting the CAD in its investigations on a possible offence under the Penal Code, Chapter 224 (the “Penal Code”) pursuant to the provisions of the Criminal Procedure Code (Chapter 68, 2012 Revised Edition) (the “CPC”). The CAD has also requested for certain accounting and banking records of the Company and certain subsidiaries of the Group.
The appointment of RSM as forensic accountants to conduct an independent review also included the review of these transactions entered by the Group and the Company that are believed to be the subject of investigations by the CAD.
The review by RSM and investigations by the CAD into the affairs of the Group and the Company are still ongoing and may result in further adjustments to the financial statements. The Company is unable to determine if these investigations would have an impact on the Company and the Group’s ongoing business operations.
3. Significant accounting judgments and estimates
The preparation of the Group’s consolidated financial statements requires management to make judgments, estimates and assumptions that affect the reported amounts of revenues, expenses, assets and liabilities, and the disclosure of contingent liabilities at the end of each reporting period. Uncertainty about these assumptions and estimates could result in outcomes that require a material adjustment to the carrying amount of the asset or liability affected in the future periods.

NOTES TO THE FINANCIAL STATEMENTSFor the financial year ended 31 December 2016
74 | Trek 2000 International Ltd • Annual Report 2016
3. Significant accounting judgments and estimates (cont’d)
3.1 Judgments made in applying accounting policies
In the process of applying the Group’s accounting policies, management has made the following judgments, apart from those disclosed in Note 2.28 and those involving estimations, which have the most significant effect on the amounts recognised in the consolidated financial statements:
Development costs
Development costs are capitalised in accordance with the accounting policy in Note 2.8. Initial capitalisation of costs is based on management’s judgment that technological and economical feasibility is confirmed, usually when a product development project has reached a defined milestone according to an established project management model. In determining the amount to be capitalised, management makes assumptions regarding the expected future cash generation of the project, discount rates to be applied and the expected period of benefits. The carrying amount of the Group’s intangible assets at balance sheet date is disclosed in Note 13 to the financial statements.
3.2 Key sources of estimation uncertainty
The key assumptions concerning the future and other key sources of estimation uncertainty at the end of each reporting period, that have a significant risk of causing a material adjustment to the carrying amounts of assets and liabilities within the next financial year are discussed below:
(a) Impairment of loans and receivables
The Group assesses at the end of each reporting period whether there is any objective evidence that a financial asset is impaired. To determine whether there is objective evidence of impairment, the Group considers factors such as the probability of insolvency or significant financial difficulties of the debtor and default or significant delay in payments.
Where there is objective evidence of impairment, the amount and timing of future cash flows are estimated based on historical loss experience for assets with similar risk characteristics. The carrying amount of the Group’s trade receivables at the end of the reporting period is disclosed in Note 19 to the financial statements.
(b) Taxes
Uncertainties exist with respect to the interpretation of complex tax regulations and the amount and timing of future taxable income. Given the wide range of international business relationships and the long‑term nature and complexity of existing contractual agreements, differences arising between the actual results and the assumptions made, or future changes to such assumptions, could necessitate future adjustments to tax provisions already recorded. The Group establishes provisions, based on reasonable estimates, for possible consequences of audits by the tax authorities of the respective countries in which it operates. The amount of such provisions is based on various factors, such as experience of previous tax audits and differing interpretations of tax regulations by the taxable entity and the relevant tax authority. Such differences of interpretation may arise on a wide variety of issues depending on the conditions prevailing in the domicile of the respective subsidiaries.
(c) Impairment of plant and equipment and intangible assets
Plant and equipment and intangible assets are stated at cost less any impairment losses. The Group reviews the carrying amounts of plant and equipment and intangible assets to determine if there are any indicators of impairment. If any such indication exists, the recoverable amounts of the plant and equipment and intangible assets are estimated to determine the extent of the impairment loss (if any). The carrying amounts of the Group’s plant and equipment and intangible assets can be found in Note 12 and 13 to the financial statements, respectively.

NOTES TO THE FINANCIAL STATEMENTSFor the financial year ended 31 December 2016
SMART SOCIETY, SMART L IFE | 75
4. Revenue
Group Company
2016 2015 2016 2015
$ $ $ $
Sale of goods 165,510,680 148,730,594 – –
Licensing income 214,281 105,168 4,546 6,046
165,724,961 148,835,762 4,546 6,046
5. Interest income
Group Company
2016 2015 2016 2015
$ $ $ $
Interest income from:
‑ Short‑term deposits 138,447 47,762 41,845 2,067
‑ Quoted investments 523,331 666,632 523,331 666,632
661,778 714,394 565,176 668,699
6. Other income
Group Company
2016 2015 2016 2015
$ $ $ $
Net gain on disposal of property plant and equipment 19,433 76,825 1,432 –
Freight income 27,054 52,021 – –
Foreign exchange gain 53,380 136,314 17,196 15,381
Government grants 264,053 161,205 – 12,493
Net gain on disposal of quoted investments – 328,572 – 328,572
Others 336,370 271,120 96,156 130,138
700,290 1,026,057 114,784 486,584
7. Other expenses
Group Company
2016 2015 2016 2015
$ $ $ $
Foreign exchange loss – 429,595 80,807 76,484
Net loss on disposal of quoted investments 9,505 – 9,505 –
9,505 429,595 90,312 76,484

NOTES TO THE FINANCIAL STATEMENTSFor the financial year ended 31 December 2016
76 | Trek 2000 International Ltd • Annual Report 2016
8. Finance costs
Group Company
2016 2015 2016 2015
$ $ $ $
Interest expense on:
‑ Obligations under finance leases 15,159 15,524 – –
‑ Term loans 129,943 137,535 – –
145,102 153,059 – –
9. Profit/(Loss) before income tax
The following items have been included in arriving at profit/(loss) before income tax:
Group Company
2016 2015 2016 2015
Restated
$ $ $ $
Allowance for doubtful debts, net
‑ Third‑party 50,494 613,802 – –
‑ Subsidiaries – – 12,364,832 –
Depreciation of property, plant and equipment 1,071,787 1,179,629 7,115 3,055
Property, plant and equipment written‑off (charged to general administration expense) 2,360 915,320 – –
Impairment of property, plant and equipment 211,945 – – –
Impairment of investment in a subsidiary – – 1,740,318 –
Provision for customer claims 900,000 – – –
Amortisation of intangible assets (1) 960,201 1,128,302 227,442 335,065
Intangible assets written‑off (2) 810,546 1,237,677 – 261,934
Operating lease expense (Note 31) 145,956 281,241 – 9,119
Legal and other professional fees 965,055 466,801 802,701 368,539
Employee benefits expense (Note 29) 4,151,797 4,800,013 251,477 490,065
Audit fees:
‑ Auditor of the Company (3) 470,901 216,222 363,309 146,725
‑ Other auditors 10,843 12,589 – –
Non‑audit fees:
‑ Auditor of the Company 65,354 57,921 12,732 12,981
‑ Other auditors 29,176 5,830 – –
(1) The Group’s and Company’s amortisation of intangible assets of $941,556 (2015: $978,535) and $209,960 (2015: $187,275), respectively are reported under “Research and development” in the income statement. The Group’s and Company’s remaining amortisation of intangible assets of $18,645 (2015: $149,767) and $17,482 (2015: $147,790) respectively are reported under “Cost of sales” in the income statement.
(2) The Group’s and Company’s intangible assets written‑off of $810,546 (2015: $1,010,307) and $Nil (2015: $261,934), respectively are reported under “Research and development” in the income statement. In 2015, remaining intangible assets written‑off by the Group amounting to $227,370 are reported under “Marketing and distribution” in the income statement.

NOTES TO THE FINANCIAL STATEMENTSFor the financial year ended 31 December 2016
SMART SOCIETY, SMART L IFE | 77
9. Profit/(Loss) before income tax (cont’d)
(3) The audit fees paid/payable to the auditor of the Company pertains to the following:
Group Company2016 2015 2016 2015
$ $ $ $Audit of the financial statements for the
year ended 31 December‑ 2014 and prior – (32,030) – (12,574)‑ 2015 142,944 248,252 145,529 159,299‑ 2016 327,957 – 217,780 –
470,901 216,222 363,309 146,725
10. Income tax expense/(benefit)
The major components of income tax expense/(benefit) for the years ended 31 December 2016 and 2015 are:
Group Company
2016 2015 2016 2015
$ $ $ $
Consolidated income statement:
Current income tax:
‑ Current income taxation 563,551 – – –
‑ Under/(Over) provision in prior years 115,034 (69,908) – –
678,585 (69,908) – –
Deferred income tax
‑ Origination and reversal of temporary differences 239,791 97,994 – –
‑ Over provision in prior years – (232,096) – –
239,791 (134,102) – –
Income tax expense/(benefit) recognised in profit or loss 918,376 (204,010) – –

NOTES TO THE FINANCIAL STATEMENTSFor the financial year ended 31 December 2016
78 | Trek 2000 International Ltd • Annual Report 2016
10. Income tax expense/(benefit) (cont’d)
Relationship between tax expense/(benefit) and accounting profit/(loss)
The reconciliation between tax expense/(benefit) and the product of accounting profit/(loss) multiplied by the applicable corporate tax rate for the years ended 31 December 2016 and 2015 is as follows:
Group Company
2016 2015 2016 2015
$ $ $ $
Tax expense/(benefit) at the domestic rates applicable to profits in the countries where the Group operates 1,369,829 (1,540,515) (2,759,481) (302,840)
Adjustments:
Non‑deductible expenses 429,134 249,796 2,430,191 196,906
Income not subject to taxation (19,289) (2,283) – –
Effect of income taxed at concessionary rate(1) (1,306,170) – – –
Under/(Over) provision in prior years 115,034 (302,004) – –
Deferred tax assets not recognised 550,821 1,445,665 329,290 105,934
Others (220,983) (54,669) – –
Income tax expense/(benefit) recognised in profit or loss 918,376 (204,010) – –
(1) A subsidiary of the Company has been granted the Development and Expansion Incentive (“DEI”) under the International Headquarters Award by the Economic Development Board (“EDB”) based on the Letter of Offer dated 16 January 2012. The period of the incentive is 10 years and the date of commencement of the incentive is 7 November 2011. In this regard, qualifying income in excess of the subsidiary’s base income is subject to tax at the concessionary tax rate of 5%.
The above reconciliation is prepared by aggregating separate reconciliations for each national jurisdiction.
At the end of the reporting period, the Group has tax losses of approximately $22,955,513 (2015: $24,597,151) that are available for offset against future taxable profits of the companies in which the losses arose, for which no deferred tax asset is recognised due to the uncertainty of its recoverability. The use of these tax losses is subject to the agreement of the tax authorities and compliance with certain provisions of the tax legislation of the respective countries in which the companies operate.

NOTES TO THE FINANCIAL STATEMENTSFor the financial year ended 31 December 2016
SMART SOCIETY, SMART L IFE | 79
11. Earnings/(Loss) per share
Basic earnings/(loss) per share is calculated by dividing profit/(loss) for the year, net of tax, attributable to owners of the Company by the weighted average number of ordinary shares outstanding during the financial year.
Diluted earnings per share are calculated by dividing profit/(loss) for the year, net of tax, attributable to owners of the Company by the weighted average number of ordinary shares outstanding during the year plus the weighted average number of ordinary shares that would be issued on the conversion of all the dilutive potential ordinary shares into ordinary shares.
The following table reflects the profit/(loss) and share data used in the computation of basic and diluted earnings per share for the years ended 31 December:
Group
2016 2015
Restated
$ $
Profit/(Loss) net of tax, attributable to owners of the Company used in computation of basic earnings per share 6,073,373 (6,646,279)
No. of shares
Weighted average number of ordinary shares for basic earnings per share computation 324,116,925 308,937,172
Basic earnings/(loss) per share (in cents) 1.87 (2.15)
Group
2016 2015
No. of shares
Weighted average number of ordinary shares for basic earnings per share computation * 324,116,925 308,937,172
Weighted average number of ordinary shares used to compute diluted earnings per share * 324,116,925 308,937,172
Diluted earnings per share (in cents) 1.87 (2.15)
* The weighted average number of shares takes into account the weighted average effect of changes in treasury shares transactions during the year.
+ 4,982,500 (2015: 6,727,500) share options granted to employees under the existing share option scheme have not been included in the calculation of diluted earnings per share because they are anti‑dilutive.
Since the end of the financial year, senior executives have exercised the options to acquire Nil (2015: 445,000) ordinary shares. There have been no other transactions involving ordinary shares or potential ordinary shares since the reporting date and before the completion of these financial statements.
The basic earnings/(loss) per share and diluted earnings per share are calculated by dividing the profit/(loss) for the year attributable to owners of the Company by the weighted average number of ordinary shares for basic earnings/(loss) per share computation and weighted average number of ordinary shares for diluted earnings per share computation respectively. These profit/(loss) and share data are presented in the table above.
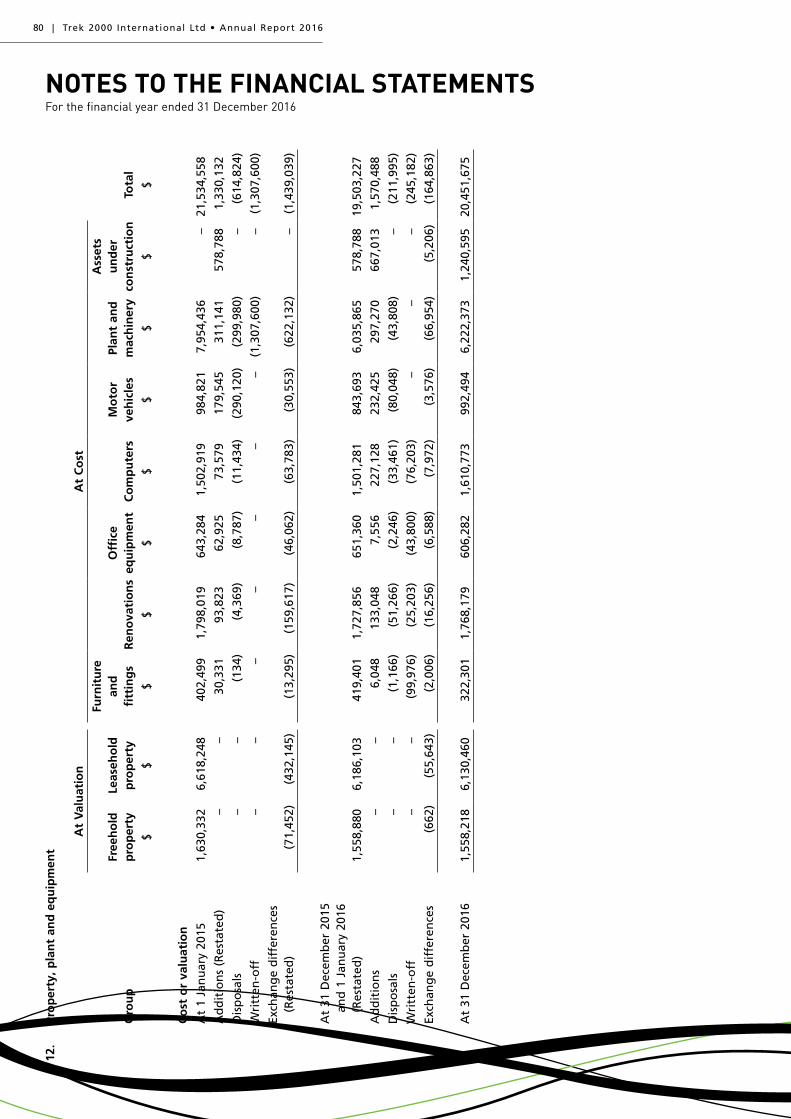
NOTES TO THE FINANCIAL STATEMENTSFor the financial year ended 31 December 2016
80 | Trek 2000 International Ltd • Annual Report 2016
12.
Pro
per
ty, p
lan
t an
d e
qu
ipm
ent
At
Val
uat
ion
At
Co
st
Gro
up
Free
ho
ldp
rop
erty
Leas
eho
ldp
rop
erty
Furn
itu
rean
dfi
ttin
gs
Ren
ova
tio
ns
Off
ice
equ
ipm
ent
Co
mp
ute
rsM
oto
rve
hic
les
Plan
t an
dm
ach
iner
y
Ass
ets
un
der
co
nst
ruct
ion
Tota
l
$$
$$
$$
$$
$$
Co
st o
r va
luat
ion
At
1 Ja
nu
ary
2015
1,63
0,33
26,
618,
248
402,
499
1,79
8,01
964
3,28
41,
502,
919
984,
821
7,95
4,43
6–
21,5
34,5
58
Ad
dit
ion
s (R
esta
ted
)–
–30
,331
93,8
2362
,925
73,5
7917
9,54
531
1,14
157
8,78
81,
330,
132
Dis
po
sals
––
(134
)(4
,369
)(8
,787
)(1
1,43
4)(2
90,1
20)
(299
,980
)–
(614
,824
)
Wri
tten
‑off
––
––
––
–(1
,307
,600
)–
(1,3
07,6
00)
Exch
ang
e d
iffe
ren
ces
(Res
tate
d)
(71,
452)
(432
,145
)(1
3,29
5)(1
59,6
17)
(46,
062)
(63,
783)
(30,
553)
(622
,132
)–
(1,4
39,0
39)
At
31 D
ecem
ber
201
5 an
d 1
Jan
uar
y 20
16
(Res
tate
d)
1,55
8,88
06,
186,
103
419,
401
1,72
7,85
665
1,36
01,
501,
281
843,
693
6,03
5,86
557
8,78
819
,503
,227
Ad
dit
ion
s –
–6,
048
133,
048
7,55
622
7,12
823
2,42
529
7,27
066
7,01
31,
570,
488
Dis
po
sals
––
(1,1
66)
(51,
266)
(2,2
46)
(33,
461)
(80,
048)
(43,
808)
–(2
11,9
95)
Wri
tten
‑off
––
(99,
976)
(25,
203)
(43,
800)
(76,
203)
––
–(2
45,1
82)
Exch
ang
e d
iffe
ren
ces
(662
)(5
5,64
3)(2
,006
)(1
6,25
6)(6
,588
)(7
,972
)(3
,576
)(6
6,95
4)(5
,206
)(1
64,8
63)
At
31 D
ecem
ber
201
61,
558,
218
6,13
0,46
032
2,30
11,
768,
179
606,
282
1,61
0,77
399
2,49
46,
222,
373
1,24
0,59
520
,451
,675

NOTES TO THE FINANCIAL STATEMENTSFor the financial year ended 31 December 2016
SMART SOCIETY, SMART L IFE | 81
12.
Pro
per
ty, p
lan
t an
d e
qu
ipm
ent
(co
nt’
d)
At
Val
uat
ion
At
Co
st
Gro
up
Free
ho
ldp
rop
erty
Leas
eho
ldp
rop
erty
Furn
itu
rean
dfi
ttin
gs
Ren
ova
tio
ns
Off
ice
equ
ipm
ent
Co
mp
ute
rsM
oto
rve
hic
les
Plan
t an
dm
ach
iner
y
Ass
ets
un
der
co
nst
ruct
ion
Tota
l
$$
$$
$$
$$
$$
Acc
um
ula
ted
dep
reci
atio
n
and
imp
airm
ent
At
1 Ja
nu
ary
2015
164,
939
340,
565
310,
296
1,33
8,00
445
3,58
495
4,77
767
5,33
45,
560,
789
–9,
798,
288
Dep
reci
atio
n c
har
ge
for
the
year
(R
esta
ted
)62
,170
144,
880
24,8
9391
,018
66,9
6817
2,61
786
,761
530,
322
–1,
179,
629
Dis
po
sals
––
(107
)(2
,132
)(7
,997
)(9
,093
)(2
65,7
27)
(193
,241
)–
(478
,297
)
Wri
tten
‑off
––
––
––
–(3
92,2
80)
–(3
92,2
80)
Exch
ang
e d
iffe
ren
ces
(Res
tate
d)
(19,
455)
28,0
50(1
1,65
6)(1
25,4
48)
(35,
558)
(56,
710)
(16,
734)
(509
,667
)–
(747
,148
)
At
31 D
ecem
ber
201
5 an
d 1
Jan
uar
y 20
16
(Res
tate
d)
207,
654
513,
495
323,
426
1,30
1,44
247
6,99
71,
061,
591
479,
634
4,99
5,92
3–
9,36
0,16
2
Dep
reci
atio
n c
har
ge
for
the
year
61,3
2414
4,14
422
,636
102,
053
48,2
6217
9,45
311
9,64
839
4,26
7–
1,07
1,78
7
Imp
airm
ent
loss
––
24,4
4757
,442
26,5
50–
35,8
1767
,689
–21
1,94
5
Dis
po
sals
––
(344
)(5
1,26
6)(2
,071
)(3
2,48
7)(8
0,04
8)(4
0,10
2)–
(206
,318
)
Wri
tten
‑off
––
(99,
976)
(22,
843)
(43,
800)
(76,
203)
––
–(2
42,8
22)
Exch
ang
e d
iffe
ren
ces
(1,1
17)
53,4
60(2
,018
)(1
7,57
8)(6
,432
)(8
,427
)(3
,639
)(7
1,79
1)–
(57,
542)
–
At
31 D
ecem
ber
201
626
7,86
171
1,09
926
8,17
11,
369,
250
499,
506
1,12
3,92
755
1,41
25,
345,
986
–10
,137
,212
Net
car
ryin
g a
mo
un
t
At
31 D
ecem
ber
201
5 (R
esta
ted
)1,
351,
226
5,67
2,60
895
,975
426,
414
174,
363
439,
690
364,
059
1,03
9,94
257
8,78
810
,143
,065
At
31 D
ecem
ber
201
61,
290,
357
5,41
9,36
154
,130
398,
929
106,
776
486,
846
441,
082
876,
387
1,24
0,59
510
,314
,463

NOTES TO THE FINANCIAL STATEMENTSFor the financial year ended 31 December 2016
82 | Trek 2000 International Ltd • Annual Report 2016
12. Property, plant and equipment (cont’d)
Computers
Company 2016 2015
$ $
Cost
At 1 January 127,641 126,363
Additions 14,246 1,278
Disposals (1,547) –
At 31 December 140,340 127,641
Accumulated depreciation
At 1 January 121,679 118,624
Depreciation charge for the year 7,115 3,055
Disposals (1,547) –
At 31 December 127,247 121,679
Net carrying amount
At 31 December 13,093 5,962
Revaluation of freehold and leasehold properties
The Group engaged independent valuers to determine the fair value of the freehold and leasehold properties. The dates of revaluation were:
Freehold property at 10 Jalan Besar: 26 November 2014Leasehold property at 30 Loyang Way: 24 November 2014Leasehold property at 28 Changi South Street 1: 5 February 2015Leasehold property at PLO 67 Jalan Cyber 2, Senai Industrial Estate III: 2 October 2014
The Group assessed that based on the market conditions and circumstances, the carrying value of these properties approximates to the fair value as of 31 December 2016.
If the freehold and leasehold properties were measured using the cost model, the carrying amounts as at 31 December would be as follows:
Group
2016 2015
$ $
Freehold property 202,171 209,186
Leasehold properties 1,547,337 1,615,239
Assets pledged as security
The leasehold properties at 28 Changi South Street 1 Changi South Industrial Estate Singapore and PLO 67 Jalan Cyber 2, Senai Industrial Estate III, Central Park, Johor Malaysia with net carrying amounts of $4,025,180 (2015: $4,140,033) and $853,564 (2015: $889,253) respectively are mortgaged to the banks as security for the loans (Note 25).

NOTES TO THE FINANCIAL STATEMENTSFor the financial year ended 31 December 2016
SMART SOCIETY, SMART L IFE | 83
12. Plant, property and equipment (cont’d)
Assets held under hire purchase
During the financial year, the Group acquired plant and equipment with an aggregate cost of $224,767 (2015: $161,265) by means of hire purchase. The cash outflow on acquisition of plant and equipment amounted to $1,345,721 (2015: $1,168,867).
The carrying amount of motor vehicles, and plant and machinery under hire purchase agreements as at the end of the reporting period were $108,950 and $371,848 respectively (2015: $122,972 and $261,760). Hire purchase assets are pledged as securities for the related hire purchase liabilities.
13. Intangible assets
Group Patents TrademarksDevelopment
costs Total
$ $ $ $
Cost
At 1 January 2015 6,305,427 461,912 7,738,593 14,505,932
Additions 14,044 – 715,788 729,832
Written‑off * (395,574) (21,326) (1,134,204) (1,551,104)
Exchange differences (3,086) – (497) (3,583)
At 31 December 2015 and 1 January 2016 5,920,811 440,586 7,319,680 13,681,077
Additions 19,901 – 155,522 175,423
Written‑off * (195,127) – (883,496) (1,078,623)
Exchange differences (372) – (101) (473)
At 31 December 2016 5,745,213 440,586 6,591,605 12,777,404
Accumulated amortisation
At 1 January 2015 3,898,843 296,248 3,510,403 7,705,494
Amortisation 334,864 16,685 776,753 1,128,302
Written‑off * (112,199) – (201,228) (313,427)
Exchange differences (227) – – (227)
At 31 December 2015 and 1 January 2016 4,121,281 312,933 4,085,928 8,520,142
Amortisation 275,509 18,524 666,168 960,201
Written‑off * (173,000) – (95,077) (268,077)
Exchange differences (316) – (167) (483)
At 31 December 2016 4,223,474 331,457 4,656,852 9,211,783
Net carrying amount
At 31 December 2015 1,799,530 127,653 3,233,752 5,160,935
At 31 December 2016 1,521,739 109,129 1,934,753 3,565,621
* – The write‑offs during the year relates to patents and development costs for projects that were assessed by management to be no longer
commercially viable.

NOTES TO THE FINANCIAL STATEMENTSFor the financial year ended 31 December 2016
84 | Trek 2000 International Ltd • Annual Report 2016
13. Intangible assets (cont’d)
Company Patents and trademarks
2016 2015
$ $
Cost
At 1 January 5,584,418 5,928,093
Additions 19,361 12,690
Written‑off – (356,365)
At 31 December 5,603,779 5,584,418
Accumulated amortisation and impairment
At 1 January 3,775,642 3,535,005
Amortisation 227,442 335,065
Written‑off – (94,428)
At 31 December 4,003,084 3,775,642
Net carrying amount
At 31 December 1,600,695 1,808,776
Patents and trademarks
Patents and trademarks (e.g. “TREK”, “DivaDrive”, “Flucard” and “ThumbDrive”) relate to costs of registering the invention and trademark, which are internal developments. As explained in Note 2.8, patents and trademarks are amortised over 5 to 20 years from the date of commercialisation and have an average remaining amortisation period of 3.8 years (2015: 8.5 years).
Development costs
Development costs relate to development expenditure incurred on each individual project. As explained in Note 2.8, development costs are amortised over 5 to 20 years from the date the project is completed and have an average remaining amortisation period of 2.4 years (2015: 3.6 years).
All research costs and development costs not eligible for capitalisation have been expensed and recognised in “Research and development” line item in profit or loss.
Amortisation expense
The amortisation of patents, trademarks and development costs is included in the “Cost of sales” and “Research and development” line items in the profit or loss.
14. Investment in subsidiaries
Company
2016 2015
$ $
Shares, at cost 3,484,976 5,225,294

NOTES TO THE FINANCIAL STATEMENTSFor the financial year ended 31 December 2016
SMART SOCIETY, SMART L IFE | 85
14. Investment in subsidiaries (cont’d)
(a) Composition of the Group
Name of company(Country of incorporation)
Principalactivities
Proportion (%)of ownership
interest
2016 2015
% %Held by the Company:
Trek Technology (Singapore)Pte Ltd (i)(Singapore)
Research, design, development and dealing in computer hardware, software, electronic components and other related products
100 100
S‑Com System (S) Pte Ltd (i)(Singapore)
Research, design, development and dealing in computer hardware, software, electronic components and other related products
100 100
Trek Systems (M) Sdn Bhd (ii)(Malaysia)
Research, design, development and dealing in computer hardware, software, electronic components and other related products
100 100
Trek Technology (HK) Co. Ltd (ii)(Hong Kong)
Marketing and distribution 100 100
Trekstor USA Inc. #(United States of America)
Marketing and distribution 100 100
Trek Technology (Shanghai)Co. Ltd (iii)(People’s Republic of China)
Marketing and distribution 100 100
Trek Technology Europe B.V. (iv)(The Netherlands)
Marketing and distribution 100 100
Racer Technology Pte Ltd (“Racer”) (i) (Singapore)
Manufacture of plastic products 19 19
Japan‑Singapore Future Technology Lab Pte Ltd (i)(Singapore)
Research and experimental development on medical technologies
100 100

NOTES TO THE FINANCIAL STATEMENTSFor the financial year ended 31 December 2016
86 | Trek 2000 International Ltd • Annual Report 2016
14. Investment in subsidiaries (cont’d)
(a) Composition of the Group (cont’d)
Name of company(Country of incorporation)
Principalactivities
Proportion (%)of ownership
interest
2016 2015
% %
Held through Trek Technology (Singapore) Pte Ltd
Trek Technology (India) Pvt Ltd (viii)(India)
Research, development, marketing and distribution 100 100
Cloud Stringers (S) Pte Ltd (ix) (Singapore)
Development and marketing of web portal services, including social networking sites.
65.6 65.6
Unimemory Technology (S)Pte Ltd (x) (Singapore)
Research, design, development and distribution of memory modules and other related products and solutions.
75.7 75.7
T3 Solution (HK) Limited (vi)(Hong Kong)*
Marketing and distribution 100 100
Held through Trek Technology (HK) Co. Ltd
Trek Systems (Shanghai) Co Ltd (vii) (People’s Republic of China)
Marketing and distribution 100 100
Held through Trek Systems (M) Sdn Bhd
Thumbdrive Media Sdn Bhd (ii) (Malaysia)
Research, design, development and dealing in computer hardware, software, electronic components and other related products
100 100
Held through Racer:
Racer Technology Sdn Bhd (v) (Malaysia)
Manufacture of plastic products for consumer, industrial and commercial use
19.0 19.0
PT Racer Technology Batam (xi) (Indonesia)
Manufacture of plastic products for consumer, industrial and commercial use
18.8 18.8

NOTES TO THE FINANCIAL STATEMENTSFor the financial year ended 31 December 2016
SMART SOCIETY, SMART L IFE | 87
14. Investment in subsidiaries (cont’d)
(a) Composition of the Group (cont’d)
(i) Audited by Ernst & Young LLP, Singapore(ii) Audited by member firms of Ernst & Young Global in Malaysia and Hong Kong(iii) Audited by Shanghai Yonghua Certified Public Accountants Co., Ltd(iv) Audited by Vola & Leinders Registered Accountants(v) Audited by YF. Ng & Associates, Malaysia(vi) Audited by Artmell CPA Limited, Hong Kong(vii) Audited by Shanghai Mingyu Daya Certified Public Accountants Co Ltd, China(viii) Audited by T. D. Jagadeesha & Co., Chartered Accountants, India(ix) Audited by KPMG LLP, Singapore(x) Audited by Chan Geok Huat & Co, Singapore(xi) Audited by Reanda Bernardi, Indonesia
# No statutory audit requirement in the country of incorporation* At 31 December 2015, shares in the subsidiary are held in trust by a person related to a director of the
Company. These shares were transferred to the Company during 2016.
Investment in Racer
The Group considers Racer as a subsidiary as it has the power to govern the financial and operating policies of Racer through its ability to control its Board of Directors and direct the relevant activities, i.e. the activities that significantly affect the returns of Racer.
(b) Interest in subsidiaries with material non-controlling interest (“NCI”)
The Group has the following subsidiary sub‑group that has NCI that is material to the Group.
Name of SubsidiaryPrincipal place of
business
Proportion of ownership interest
held by non-controlling interest
Profit/(Loss) allocated to NCI
during the reporting period
$
Accumulated NCI at the end of
reporting period$
31 December 2016:
Racer and its subsidiaries(“Racer Group”) Singapore 81% 1,043,521 15,645,425
31 December 2015:
Racer Group Singapore 81% (513,515) 14,801,843

NOTES TO THE FINANCIAL STATEMENTSFor the financial year ended 31 December 2016
88 | Trek 2000 International Ltd • Annual Report 2016
14. Investment in subsidiaries (cont’d)
(c) Summarised financial information about subsidiaries with material NCI
Summarised financial information including consolidation adjustments but before intercompany eliminations of Racer Group with material non‑controlling interests are as follows:
Summarised balance sheets
Racer Group
2016 2015
Restated
$ $
Current
Assets 18,267,589 19,658,666
Liabilities (6,697,458) (8,615,601)
Net current assets 11,570,131 11,043,065
Non-current
Assets 6,356,106 5,812,519
Liabilities (709,176) (765,700)
Net non‑current assets 5,646,930 5,046,819
Net assets 17,217,061 16,089,884
(d) Summarised statement of comprehensive income
Racer Group
2016 2015
Restated
$ $
Revenue 23,786,652 25,826,759
Profit/(Loss) before income tax 1,446,615 (448,596)
Income tax expense (158,318) (23,001)
Profit/(Loss) after tax and total comprehensive income 1,288,297 (471,597)
(e) Other summarised information
Racer Group
2016 2015
Restated
$ $
Net cash flows from operations 1,602,979 3,281,603
Acquisition of significant Property, Plant and Equipment 1,255,095 1,124,322

NOTES TO THE FINANCIAL STATEMENTSFor the financial year ended 31 December 2016
SMART SOCIETY, SMART L IFE | 89
14. Investment in subsidiaries (cont’d)
(f) Dilution of shareholdings in Racer
On 16 March 2015, Racer issued 6 million shares to its Chief Executive Officer, diluting the Group’s ownership interest in Racer from 47.5% to 19%. At the same time, Racer issued options to the Company which, when exercised to the fullest extent, would enable the Company to bring its ownership interest in Racer back to 47.5%.
The Group has assessed that it continues to have the power to govern the financial and operating policies of Racer through its majority board representation, and direct the relevant activities of Racer both before and after the abovementioned transaction. Accordingly, Racer continues to be consolidated into the Group and the above transaction was accounted for as an equity transaction in accordance with the Group’s accounting policy set out in Note 2.4 to the financial statements.
15. Investment in associates
Group Company
2016 2015 2016 2015
$ $ $ $
Unquoted shares, at cost 1,523,440 1,523,440 2,902,384 2,902,384
Goodwill on acquisition 1,378,944 1,378,944 – –
Impairment loss (2,896,977) (2,896,977) (2,896,977) (2,896,977)
Share of post‑acquisition reserve (5,407) (5,407) – –
Carrying amount of investments – – 5,407 5,407
There is no material associate in the Group. The associates are:
Name of company(Country of incorporation) Principal activities
Percentageof equity held
by the Company
2016 2015
% %
Trek Technology (Thailand) Company Ltd (i)(Thailand)
Marketing of computer, hardware, software, electronic components and other related products
39 39
STrek International Company Limited (ii) (Hong Kong)
Dormant 45 45
(i) Audited by C.L. Accounting & Law(ii) Audited by H.H. Liu & Co., CPA
The Group has not recognised losses relating to its associates where their share of losses exceeds the Group’s interests in the associates. The Group’s cumulative share of unrecognised losses at the end of the reporting period was $316,828 (2015: $330,876) of which $14,048 (2015: $834) was the share of the current year’s losses. The Group has no obligation in respect of these losses. STrek International Co Ltd has also become dormant after year ended 31 December 2009.
The profit for the year and total comprehensive income of the associates, not adjusted for the proportion of ownership interest held by the Group, was $36,021 (2015: $2,139).

NOTES TO THE FINANCIAL STATEMENTSFor the financial year ended 31 December 2016
90 | Trek 2000 International Ltd • Annual Report 2016
16. Quoted investments
Group and Company
2016 2015
$ $
Available-for-sale financial assets
‑ USD corporate bonds 12,244,281 8,388,637
‑ Singapore Dollar (“SGD” or “S$”) quoted investments – 360,239
12,244,281 8,748,876
The quoted corporate bonds pay fixed interest rates on a quarterly to semi‑annually basis ranging from 4.375% to 11% (2015: 3.89% to 8.375%) per annum.
17. Unquoted investments
Group
2016 2015
$ $
Available-for-sale financial assets
Unquoted equity investments, at cost 180,364 182,163
18. Inventories
Group
2016 2015
$ $
Balance sheet:
Raw materials 9,012,512 20,807,508
Work in progress 323,328 481,929
Finished goods 958,617 1,228,475
Total inventories at lower of cost and net realisable value 10,294,457 22,517,912
Inventories are stated after deducting allowance for inventory obsolescence and net realisable value adjustments: (2,256,671) (6,011,772)
Income statement:
Inventories recognised as an expense in cost of sales Inclusive of the following charge: 146,366,087 144,605,342
‑ Reversal for stock obsolescence/(Inventories written‑down) 3,755,101 (4,466,614)

NOTES TO THE FINANCIAL STATEMENTSFor the financial year ended 31 December 2016
SMART SOCIETY, SMART L IFE | 91
19. Trade and other receivables
Group Company
2016 2015 2016 2015
$ $ $ $
Trade receivables:
‑ Third parties 9,585,754 8,681,578 17,312 18,194
‑ Associate 131,141 167,141 – –
‑ Related company 158,321 158,566 – –
9,875,216 9,007,285 17,312 18,194
Allowance for doubtful debts:
‑ Third parties (385,739) (518,942) – –
‑ Associate (131,141) (167,141) – –
‑ Related company (120,000) (88,593) – –
(636,880) (774,676) – –
Trade receivables, net of allowance 9,238,336 8,232,609 17,312 18,194
Other receivables (Note 20) 7,868,400 7,701,634 545,522 696,561
Amounts due from subsidiaries, net of allowance – – – 25,424,955
Other receivables and amounts due from subsidiaries, net of allowance 7,868,400 7,701,634 545,522 26,121,516
Total trade and other receivables 17,106,736 15,934,243 562,834 26,139,710
Add: Cash and short‑term deposits (Note 21) 29,234,449 24,256,093 9,081,049 392,631
Less: Sales tax receivable (1,170,153) (646,969) (16,279) (16,512)
Total loans and receivables 45,171,032 39,543,367 9,627,604 26,515,829
Trade receivables
Trade receivables are non‑interest bearing and are generally on 30 to 90 days’ terms. They are recognised at their original invoice amounts which represent their fair values on initial recognition.
Amounts due from subsidiaries
The amounts due from subsidiaries were non‑trade in nature, unsecured, non‑interest bearing and repayable in cash upon demand.
The amounts due from subsidiaries are stated after deducting allowance for doubtful debts of $12,364,832 (2015: $Nil).

NOTES TO THE FINANCIAL STATEMENTSFor the financial year ended 31 December 2016
92 | Trek 2000 International Ltd • Annual Report 2016
19. Trade and other receivables (cont’d)
Receivables that are impaired
The Group’s trade receivables that are impaired at the balance sheet date and the movement of the allowance accounts used to record the impairment are as follows:
Group
Collectively impaired Individually impaired
2016 2015 2016 2015
$ $ $ $
Trade receivables ‑ nominal amounts 711,027 951,433 – 388,896
Less: Allowance for impairment (636,880) (774,676) – (388,896)
74,147 176,757 – –
Movement in allowance accounts
At 1 January 774,676 652,241 – 307,066
Charge for the year 86,494 685,802 – 153,548
Write‑back (36,000) (72,000) – (119,128)
Utilised (184,159) (472,526) – –
Exchange differences (4,131) (18,841) – –
At 31 December 636,880 774,676 – 341,486
Trade receivables that are individually determined to be impaired at the balance sheet date relate to debtors that are in significant financial difficulties and have defaulted on payments. These receivables are not secured by any collateral or credit enhancements. The charge/ write‑back is recorded in “Marketing and distribution” in income statement.
Receivables that are past due but not impaired
The Group has trade receivables amounting to $6,299,505 (2015: $1,481,347) that are past due at the balance sheet date but not impaired. These receivables are unsecured and the analysis of their aging at the end of the reporting period is as follows:
Group
2016 2015
$ $
Trade receivables past due but not impaired
Lesser than 30 days 5,431,167 1,128,130
30 to 60 days 405,434 353,217
More than 60 days 462,904 –
6,299,505 1,481,347

NOTES TO THE FINANCIAL STATEMENTSFor the financial year ended 31 December 2016
SMART SOCIETY, SMART L IFE | 93
20. Other receivables
Group Company
2016 2015 2016 2015
$ $ $ $
Restated Restated
Deposits 195,464 332,097 – –
Sundry receivables 553,371 940,997 311,096 602,361
Accrued income 235,547 96,816 234,426 94,200
Amounts due from non‑controlling interest 3,484,871 3,519,621 – –
Amounts due from a former subsidiary 3,399,147 2,812,103 – –
7,868,400 7,701,634 545,522 696,561
Sundry receivables
Sundry receivables are interest free, unsecured and repayable on demand. Included in sundry receivables is an amount of $294,182 (2015: $517,354) relating to outstanding consideration receivable from the sale of a former subsidiary of the Group. These amounts are due from a director of a subsidiary and a company related to that director.
Amounts due from non-controlling interest
These represents the Outstanding Amounts owed by the CEO of Racer (Note 37).
Amounts due from a former subsidiary
These amounts are interest free, unsecured and repayable on demand and relates to advances provided by a subsidiary of the Group to a former subsidiary. In 2016, the Group agreed to revise the repayment terms to allow the former subsidiary to repay these amounts in 18 equal instalments commencing February 2017. As a director of the subsidiary was also the major shareholder and director of the former subsidiary, the amounts are subject to the application of section 163 in the Companies Act. These transactions are ratified in an Extraordinary General Meeting of the subsidiary held on 27 July 2016.
Subsequent to year‑end, the subsidiary obtained a charge over certain assets and shares of the former subsidiary as security for the advances. In addition, the subsidiary obtained a personal undertaking from the director of the subsidiary for any shortfall in the recoverability of the advances.
21. Cash and short-term deposits
Group Company
2016 2015 2016 2015
$ $ $ $
Cash at banks and on hand 12,715,825 19,475,350 1,287,070 392,631
Short‑term deposits 16,518,624 4,780,743 7,793,979 –
Cash and short‑term deposits 29,234,449 24,256,093 9,081,049 392,631
Cash at banks earns interest at floating rates based on daily bank deposit rates. Short‑term deposits are made for varying periods of between one week and three months depending on the immediate cash requirements of the Group and the Company, and earn interests at the respective short‑term deposit rates, ranging from 0.01% to 1.15% (2015: 0.01% to 0.65%) per annum.

NOTES TO THE FINANCIAL STATEMENTSFor the financial year ended 31 December 2016
94 | Trek 2000 International Ltd • Annual Report 2016
21. Cash and short-term deposits (cont’d)
For the purpose of the consolidated cash flow statement, cash and cash equivalents comprise the following at the end of the reporting period:
Group Company
2016 2015 2016 2015
$ $ $ $
Cash and short‑term deposits 29,234,449 24,256,093 9,081,049 392,631
Bank overdrafts (Note 25) (811,256) (802,942) – –
Cash and cash equivalents 28,423,193 23,453,151 9,081,049 392,631
22. Trade payables and accruals
Group Company
2016 2015 2016 2015
$ $ $ $
Trade payables and accruals
‑ Third parties 14,002,543 29,462,563 121,406 81,435
‑ Related parties 461,469 13,462 – –
14,464,012 29,476,025 121,406 81,435
Other payables
‑ Other creditors 1,720,685 313,847 – –
‑ Non‑trade creditors 165,367 372,720 113,294 78,002
‑ Accrued expenses 2,307,815 1,599,202 849,911 240,474
‑ Related parties 12,091 42,712 – –
‑ Subsidiary – – 106,294 –
4,205,958 2,328,481 1,069,499 318,476
Total trade and other payables 18,669,970 31,804,506 1,190,905 399,911
Add:
Hire purchase payables 309,591 304,205 – –
Term loans and overdrafts 2,207,759 1,749,153 – –
Total financial liabilities carried at amortised cost 21,187,320 33,857,864 1,190,905 399,911
Trade payables and accruals
These are non‑interest bearing. Trade payables are normally settled on 60‑day terms while other payables have an average term of six months.
Amounts due to related parties and subsidiaries
These amounts are non‑interest bearing, unsecured and repayable in cash upon demand.
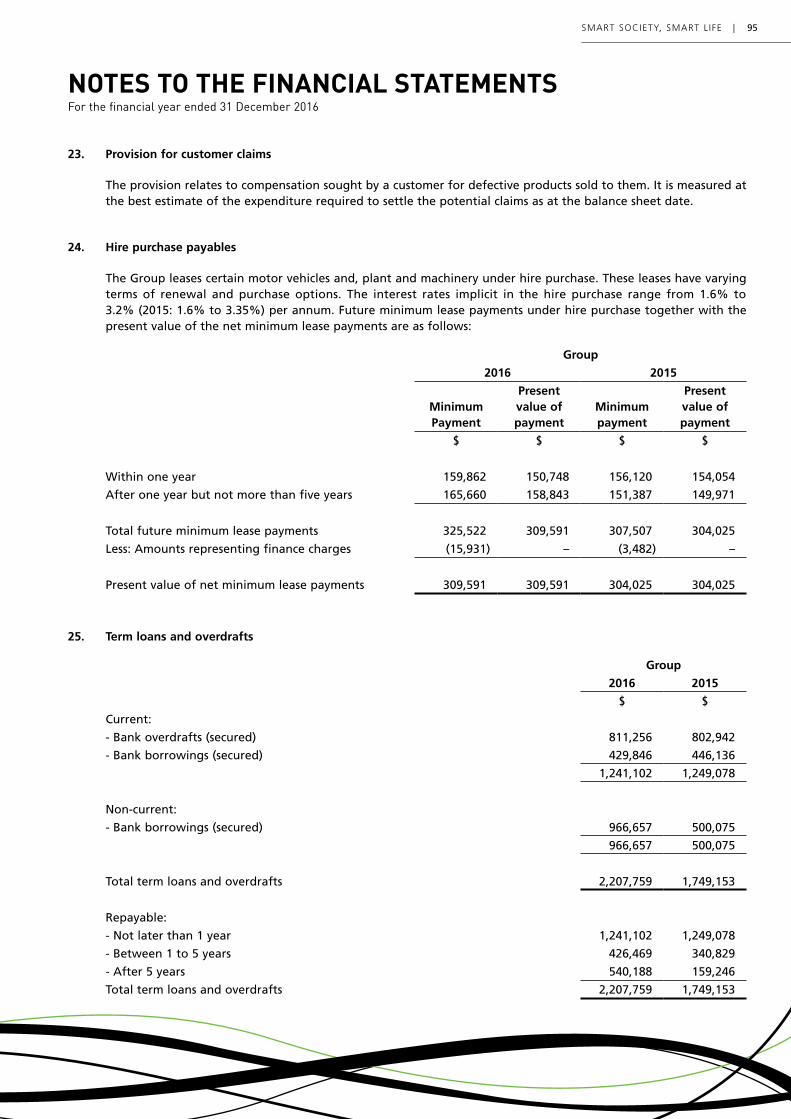
NOTES TO THE FINANCIAL STATEMENTSFor the financial year ended 31 December 2016
SMART SOCIETY, SMART L IFE | 95
23. Provision for customer claims
The provision relates to compensation sought by a customer for defective products sold to them. It is measured at the best estimate of the expenditure required to settle the potential claims as at the balance sheet date.
24. Hire purchase payables
The Group leases certain motor vehicles and, plant and machinery under hire purchase. These leases have varying terms of renewal and purchase options. The interest rates implicit in the hire purchase range from 1.6% to 3.2% (2015: 1.6% to 3.35%) per annum. Future minimum lease payments under hire purchase together with the present value of the net minimum lease payments are as follows:
Group
2016 2015
MinimumPayment
Presentvalue ofpayment
Minimumpayment
Presentvalue ofpayment
$ $ $ $
Within one year 159,862 150,748 156,120 154,054
After one year but not more than five years 165,660 158,843 151,387 149,971
Total future minimum lease payments 325,522 309,591 307,507 304,025
Less: Amounts representing finance charges (15,931) – (3,482) –
Present value of net minimum lease payments 309,591 309,591 304,025 304,025
25. Term loans and overdrafts
Group
2016 2015
$ $
Current:
‑ Bank overdrafts (secured) 811,256 802,942
‑ Bank borrowings (secured) 429,846 446,136
1,241,102 1,249,078
Non‑current:
‑ Bank borrowings (secured) 966,657 500,075
966,657 500,075
Total term loans and overdrafts 2,207,759 1,749,153
Repayable:
‑ Not later than 1 year 1,241,102 1,249,078
‑ Between 1 to 5 years 426,469 340,829
‑ After 5 years 540,188 159,246
Total term loans and overdrafts 2,207,759 1,749,153

NOTES TO THE FINANCIAL STATEMENTSFor the financial year ended 31 December 2016
96 | Trek 2000 International Ltd • Annual Report 2016
25. Term loans and overdrafts (cont’d)
Bank overdrafts
Bank overdrafts are denominated in SGD, repayable on demand, bear interest over bank’s prime lending rate and are secured by a legal charge over the leasehold property of a subsidiary, located at 28 Changi South Street 1, Changi South Industrial Estate, Singapore 486772.
Bank borrowings
Bank borrowings are denominated mainly in SGD and Malaysian Ringgit (“RM”). As of 31 December 2016, the interest rates for bank borrowings ranged from 2.98% to 5.85% (2015: 2.38% to 5%) per annum.
The borrowings are secured by a legal charge over the leasehold property of a subsidiary of the Group (Note 12), located at 28 Changi South Street 1, Changi South Industrial Estate, Singapore 486772. These borrowings are also guaranteed by a director of a subsidiary of the Group.
26. Deferred taxation
Deferred tax liability recognised mainly relate to temporary differences between the accounting depreciation and amortisation of assets held by certain subsidiaries with its tax depreciation and amortisation.
27. Share capital and treasury shares
(a) Share capital
Group and Company
2016 2015
No. ofshares $
No. ofshares $
Issued and fully paid ordinary shares
At 1 January 324,116,925 37,828,941 297,671,925 29,605,242
Placement of new ordinary and treasury shares – – 26,000,000 8,235,969
Transaction costs on placement of new shares – – – (76,059)
Cash on exercise of employee share options – – 445,000 63,789
At 31 December 324,116,925 37,828,941 324,116,925 37,828,941
The holders of the ordinary shares (except treasury shares) are entitled to receive dividends as and when declared by the Company. All ordinary shares carry one vote per share without restrictions. The ordinary shares have no par value.
The Company has an employee share option plan under which options to subscribe for the Company’s ordinary shares have been granted to employees and directors of the Group.

NOTES TO THE FINANCIAL STATEMENTSFor the financial year ended 31 December 2016
SMART SOCIETY, SMART L IFE | 97
27. Share capital and treasury shares (cont’d)
(b) Treasury shares
Group
2016 2015
No. ofshares $
No. ofshares $
At 1 January 1,450,100 283,123 1,293,000 256,914
Sale of Treasury Shares – – (1,000,000) (221,397)
Purchase of Treasury Shares 71,900 15,149 1,157,100 247,606
At 31 December 1,522,000 298,272 1,450,100 283,123
Company
2016 2015
No. ofshares $
No. ofshares $
At 1 January and 31 December 1,229,000 262,755 1,157,100 247,606
Treasury shares relate to ordinary shares of the Company that are held by the Company. As a result of the acquisition of Racer in 2009, Racer’s investment in the Company is deemed as treasury shares.

NOTES TO THE FINANCIAL STATEMENTSFor the financial year ended 31 December 2016
98 | Trek 2000 International Ltd • Annual Report 2016
27.1
Sh
are
cap
ital
an
d t
reas
ury
sh
ares
(co
nt’
d)
(c)
Shar
e o
pti
on
s
The
op
tio
ns
gra
nte
d,
exer
cise
d a
nd
fo
rfei
ted
un
der
th
e Tr
ek 2
000
Inte
rnat
ion
al L
td S
har
e O
pti
on
Sch
eme
(“ES
OS”
) d
uri
ng
th
e ye
ar a
nd
op
tio
ns
ou
tsta
nd
ing
at
the
end
of
the
year
are
as
follo
ws:
Dat
e o
f o
pti
on
sg
ran
ted
2007
Op
tio
ns
20 A
pri
l20
07
2007
Op
tio
ns
20 A
pri
l20
07
2007
Op
tio
ns
9 N
ove
mb
er20
07
2007
Op
tio
ns
9 N
ove
mb
er20
07
2009
Op
tio
ns
12 M
ay20
09
2009
O
pti
on
s12
May
2009
2010
O
pti
on
s12
Feb
ruar
y20
10
2010
O
pti
on
s12
Feb
ruar
y20
10
2011
O
pti
on
s11
Ju
ly
2011
2011
O
pti
on
s11
Ju
ly20
11
2013
Op
tio
ns
29 A
ug
ust
2013
2013
Op
tio
ns
29 A
ug
ust
2013
Gra
nt
op
tio
n
nu
mb
er11
1112
1213
1314
1416
1617
17
Op
tio
n e
xerc
ise
per
iod
Fro
m20
Ap
r20
0820
Ap
r20
099
No
v20
089
No
v20
0912
May
2010
12 M
ay20
1112
Feb
2011
12 F
eb20
1211
Ju
ly20
1211
Ju
ly20
1329
Au
g20
1429
Au
g20
15
To20
Ap
r20
1720
Ap
r20
179
No
v20
179
No
v20
1712
May
2019
12 M
ay20
1912
Feb
2020
12 F
eb20
2011
Ju
ly20
2111
Ju
ly20
2129
Au
g20
2329
Au
g20
23
Nu
mb
er o
f h
old
ers
at 3
1.12
.201
62
21
13
5–
–7
71
1
Exer
cise
pri
ce p
er
op
tio
nS$
0.39
9S$
0.39
9S$
0.32
6S$
0.32
6S$
0.14
6S$
0.14
6S$
0.20
0S$
0.20
0S$
0.35
6S$
0.35
6S$
0.24
3S$
0.24
3
Nu
mb
er o
f o
pti
on
s o
uts
tan
din
g
At
1.1.
2016
210,
000
210,
000
650,
000
650,
000
12,5
0075
,000
25,0
0025
,000
375,
000
375,
000
15,0
0015
,000
Gra
nte
d
––
––
––
––
––
––
Exer
cise
d–
––
––
––
––
––
–
Forf
eite
d(1
00,0
00)
(100
,000
)(3
50,0
00)
(350
,000
)–
(45,
000)
(25,
000)
(25,
000)
(50,
000)
(50,
000)
––
At
31.1
2.20
1611
0,00
011
0,00
030
0,00
030
0,00
012
,500
30,0
00–
–32
5,00
032
5,00
015
,000
15,0
00
The
det
ails
of
the
ESO
S, w
hic
h w
as s
tart
ed in
200
1, w
ere
set
ou
t in
th
e fi
nan
cial
sta
tem
ents
of
that
yea
r. R
efer
to
No
te 2
8 fo
r fu
rth
er d
etai
ls.

NOTES TO THE FINANCIAL STATEMENTSFor the financial year ended 31 December 2016
SMART SOCIETY, SMART L IFE | 99
27.2
Sh
are
cap
ital
an
d t
reas
ury
sh
ares
(co
nt’
d)
(c)
Shar
e o
pti
on
s
The
op
tio
ns
gra
nte
d, e
xerc
ised
an
d f
orf
eite
d u
nd
er t
he
ESO
S d
uri
ng
th
e ye
ar a
nd
op
tio
ns
ou
tsta
nd
ing
at
the
end
of
the
year
are
as
follo
ws:
Dat
eo
pti
on
sg
ran
ted
2015
Op
tio
ns
29 J
anu
ary
2015
2015
Op
tio
ns
29 J
anu
ary
2015
2015
Op
tio
ns
10 F
ebru
ary
2015
2015
Op
tio
ns
10 F
ebru
ary
2015
2015
Op
tio
ns
10 F
ebru
ary
2015
2015
O
pti
on
s10
Feb
ruar
y20
15
2015
Op
tio
ns
10 F
ebru
ary
2015
2015
O
pti
on
s10
Feb
ruar
y20
15To
tal
2016
Gra
nt
op
tio
n n
um
ber
1818
1919
1919
1919
Op
tio
n e
xerc
ise
per
iod
Fro
m29
Jan
uar
y20
1629
Jan
uar
y20
1710
Feb
ruar
y20
1610
Feb
ruar
y20
1710
Feb
ruar
y20
1610
Feb
ruar
y20
1710
Feb
ruar
y20
1610
Feb
ruar
y20
17
To29
Jan
uar
y20
2529
Jan
uar
y20
2510
Feb
ruar
y20
2510
Feb
ruar
y20
2510
Feb
ruar
y20
2510
Feb
ruar
y20
2510
Feb
ruar
y20
2010
Feb
ruar
y20
20
Nu
mb
er o
f h
old
ers
at 3
1.12
.201
6–
–3
31
11
1
Exer
cise
pri
ce p
er o
pti
on
S$0.
351
S$0.
351
S$0.
247
S$0.
247
S$0.
362
S$0.
362
S$0.
362
S$0.
362
Nu
mb
er o
f o
pti
on
s o
uts
tan
din
g
At
1.1.
2016
100,
000
100,
000
1,60
0,00
01,
600,
000
300,
000
300,
000
45,0
0045
,000
6,72
7,50
0
Gra
nte
d
––
––
––
––
–
Exer
cise
d–
––
––
––
––
Forf
eite
d(1
00,0
00)
(100
,000
)–
–(2
25,0
00)
(225
,000
)–
–(1
,745
,000
)
At
31.1
2.20
16–
–1,
600,
000
1,60
0,00
075
,000
75,0
0045
,000
45,0
004,
982,
500
The
det
ails
of
the
ESO
S, w
hic
h w
as s
tart
ed in
200
1, w
ere
set
ou
t in
th
e fi
nan
cial
sta
tem
ents
of
that
yea
r. R
efer
to
No
te 2
8 fo
r fu
rth
er d
etai
ls.

NOTES TO THE FINANCIAL STATEMENTSFor the financial year ended 31 December 2016
100 | Trek 2000 International Ltd • Annual Report 2016
28. Other reserves
(a) Capital reserve
The capital reserve arose from the acquisition of assets and liabilities pursuant to the restructuring exercise carried out in 2000.
(b) Asset revaluation reserve
The revaluation reserve represents increases in the fair value of property, net of tax, and decreases to the extent that such decrease relates to an increase on the same asset previously recognised in other comprehensive income.
(c) Fair value adjustment reserve
Fair value adjustment reserve represents the cumulative fair value changes, net of tax, of available‑for‑sale financial assets until they are disposed of or impaired.
(d) Employee share options reserve
Employee share option reserve represents equity‑settled share options granted to employees (Note 28). The reserve is made up of the cumulative value of services received from employees recorded over the vesting period commencing from the grant date of equity‑settled share options, and is reduced by the expiry, withdrawal or exercise of the share options.
(e) Translation reserve
The translation reserve represents the exchange differences arising from the translation of the financial statements of foreign operations whose functional currencies are different from that of the Group’s presentation currency.
(f) Other reserve
Other reserve comprises the surplus from the sale of treasury shares and the deficit arising from the dilution of the Group’s interest in Racer.
29. Employee benefits
Group Company
2016 2015 2016 2015
$ $ $ $
Employee benefits (including directors):
Salaries 3,195,988 4,370,180 – –
Directors’ fees 99,525 59,153 70,898 48,215
Bonuses 459,274 286,289 – –
Contributions to defined contribution plans 307,381 358,329 – –
Shared‑based payments (Employee Share Option Plans) 245,151 441,850 180,579 441,850
Employee benefits capitalised as intangible assets (155,522) (715,788) – –
Employee benefits charged to profit or loss during the year 4,151,797 4,800,013 251,477 490,065

NOTES TO THE FINANCIAL STATEMENTSFor the financial year ended 31 December 2016
SMART SOCIETY, SMART L IFE | 101
29. Employee benefits (cont’d)
The Trek 2000 International Ltd Share Option Scheme
Group Executives, including directors, are granted options based on quantitative and non‑quantitative performance indicators, including past performance, expertise, and potential for greater achievements and contributions to the Group. The option will vest over two years after the date of grant. The options, once vested, remain exercisable as long as the employee (including directors) remains in service. The exercise price shall be equal to the average of the last dealt price for a share for the five consecutive trading days immediately preceding the date of grant. The options granted to Group Executives and Group Directors who do not hold executive functions in the Group, have contractual lives of ten and five years respectively. The options are to be settled in equity.
Movement of share options during the financial year
The following table illustrates the number (“No.”) and weighted average exercise prices (“WAEP”) of, and movements in, share options during the financial year.
2016 2015
No.WAEP
S$ No.WAEP
S$
Outstanding at 1 January 6,727,500 0.297 3,082,500 0.316
Granted (1) – – 4,090,000 0.271
Forfeited (2) (1,745,000) 0.340 – –
Exercised – – (445,000) 0.195
Outstanding at 31 December (4) 4,982,500 0.282 6,727,500 0.297
Exercisable at 31 December 3,262,500 0.296 2,637,500 0.336
(1) The weighted average fair value of options granted during the year was S$Nil (2015: S$0.247).
(2) 1,445,000 (2015: Nil) of the options forfeited pertains to those options held by directors who have resigned from the Group.
(3) 1,295,000 (2015: Nil) of the options forfeited pertains to those options held by directors who are holding executive functions in the Group. The option period of which, commences from the first anniversary of the date of grant but before the tenth anniversary of such date of grant.
(4) The range of exercise prices for options outstanding at the end of the year was 2016: S$0.146 to S$0.399 (2015: S$0.146 to S$0.399). The weighted average remaining contractual life for these options is 4.5 years (2015: 5.5 years).

NOTES TO THE FINANCIAL STATEMENTSFor the financial year ended 31 December 2016
102 | Trek 2000 International Ltd • Annual Report 2016
29. Employee benefits (cont’d)
Fair value of share options granted
The fair value of share options as at the date of grant, was estimated using a binomial option pricing model, taking into account the terms and conditions upon which the options were granted.
The following table lists the inputs to the model used for the options granted in 2015:
2015
Dividend yield (1) (%) 2.2
Expected volatility (2) (%) 67
Historical volatility(3) 67
Risk‑free interest rate (4) (%) 1.82
Expected life of option (5) (years) 5.5
(1) Dividend yield was estimated based on historical dividend share for previous years and future dividend streams projected by management.
(2) Expected volatility was determined after considering the historical volatility of the share price that is generally commensurate with the expected term of the option, and after considering the effects of the Company’s market profile and major corporate transactions.
(3) Historical volatility was estimated based on the analysis of the historical volatility of the shares of the Company.
(4) Risk‑free interest rate used was the annual yield of a Singapore Government Securities Bond, based on the Singapore Sovereign yield curve, with maturity comparable to the expected term of the grants.
(5) Expected life of option was estimated based on the expected exercise trends of the employees under the scheme, having considered the expected share price performance in the future.
Racer share option scheme 2011 (the “Racer ESOS”)
Key executive staffs of Racer who have contributed to the growth of Racer have also been granted share options to subscribe for shares in Racer. These options vest over 5 years after the date of grant. The options, once vested remain exercisable as long as the employee (including Racer’s directors) remains in service.
No new options are issued under the Racer ESOS during the year. The total outstanding options under this scheme at 31 December 2016 are 3,000,000 (2015: 3,000,000) and their exercise price was S$1.678 (S$1.678). 1,800,000 (2015: 1,200,000) of these options were exercisable at 31 December 2016.

NOTES TO THE FINANCIAL STATEMENTSFor the financial year ended 31 December 2016
SMART SOCIETY, SMART L IFE | 103
30. Related party transactions
(a) Sale and purchase of goods and services
In addition to the related party information disclosed elsewhere in the financial statements, the following significant transactions between the Group and related parties took place at terms agreed between the parties during the financial year. They are made at terms equivalent to those prevailing in arm’s length transactions with third parties.
Group Company
2016 2015 2016 2015
$ $ $ $
Sale of goods to related company 91,587 284,541 – –
Service fee expense to related company 15,000 30,000 – –
Service fee income from subsidiaries – – 96,000 129,648
Service fee expense to subsidiaries – – 435,000 435,000
(b) Compensation of key management personnel
Group Company
2016 2015 2016 2015
$ $ $ $
Short‑term employee benefits 1,651,401 1,836,043 85,708 48,215
Contributions to defined contribution plans 105,980 102,897 – –
1,757,381 1,938,940 85,708 48,215
Comprise amounts paid to:
‑ Directors of the Group 1,303,857 1,355,161 85,708 48,215
‑ Other key management personnel 453,524 583,779 – –
1,757,381 1,938,940 85,708 48,215

NOTES TO THE FINANCIAL STATEMENTSFor the financial year ended 31 December 2016
104 | Trek 2000 International Ltd • Annual Report 2016
30. Related party transactions (cont’d)
(b) Compensation of key management personnel (cont’d)
Key management personnel’s (including directors) interests in the Trek 2000 International Ltd Share Option Scheme
During the financial year:
Nil (2015: 4,090,000) share options were granted to Nil (2015: 10) key management personnel under the Trek 2000 International Ltd Share Option Scheme 2011 (2015: at exercise price ranging from S$0.243 to S$0.362 per share).
Share options granted to the Company’s directors (including non‑executive directors) are disclosed in the directors’ report.
At the end of the reporting period, the total number of outstanding share options granted by the Company to the directors under the Trek 2000 International Ltd Share Option Scheme 2011 amount to 2,810,000 (2015: 4,105,000).
As the end of the reporting period, the total number of outstanding share options granted by the Company to the abovementioned key management personnel (including directors) under the Trek 2000 International Ltd Share Option Scheme 2011 are as follows:
220,000 ordinary shares at a price of S$0.399 each, exercisable between 20 April 2008 and 20 April 2017
600,000 ordinary shares at a price of S$0.326 each, exercisable between 9 November 2008 and 9 November 2017
42,500 ordinary shares at a price of S$0.146 each, exercisable between 12 May 2010 and 12 May 2019
650,000 ordinary shares at a price of S$0.356 each exercisable between 11 July 2012 and 11 July 2021
30,000 ordinary shares at a price of S$0.243 each exercisable between 29 August 2014 and 29 August 2023
3,200,000 ordinary shares at a price of S$0.247 each exercisable between 10 February 2016 to 10 February 2025
150,000 ordinary shares at a price of S$0.362 each exercisable between 10 February 2016 to 10 February 2025
90,000 ordinary shares at a price of S$0.362 each exercisable between 10 February 2016 to 10 February 2020

NOTES TO THE FINANCIAL STATEMENTSFor the financial year ended 31 December 2016
SMART SOCIETY, SMART L IFE | 105
30. Related party transactions (cont’d)
(b) Compensation of key management personnel (cont’d)
Key management’s personnel’s interests in the Racer ESOS
At the end of the reporting period, the total number of outstanding share options granted to key management personnel (including Racer’s directors) under the various share option schemes are as follows:
600,000 ordinary shares of Racer at a price of S$1.678 each, exercisable after 27 July 2014
600,000 ordinary shares of Racer at a price of S$1.678 each, exercisable after 27 July 2015
600,000 ordinary shares of Racer at a price of S$1.678 each, exercisable after 27 July 2016
600,000 ordinary shares of Racer at a price of S$1.678 each, exercisable after 27 July 2017
600,000 ordinary shares of Racer at a price of S$1.678 each, exercisable after 27 July 2018
Key management’s personnel’s interests in the Cloud Stringers (S) Pte Ltd (“Cloud Stringers”) Share Option Scheme
At the end of the reporting period, the total number of outstanding share options granted to key management personnel (including Cloud Stringers’s directors) under the various share option schemes are as follows:
1,100,000 ordinary shares of Cloud Stringers at a price of S$0.25 each, exercisable after 12 April 2018
31. Operating lease commitments as lessee
The Group has entered into commercial leases on certain motor vehicles, office equipment and rental of office spaces. These leases have an average tenure of between three and six years with no renewal option or contingent rent provision included in the contracts. The Group is restricted from sub‑leasing the leased equipment to third parties. Minimum lease payments recognised as an expense in profit or loss for the financial year ended 31 December 2016 amounted to $145,956 (2015: $281,241).
Future minimum lease rental payable under non‑cancellable operating lease at the end of the reporting date is as follows:
Group
2016 2015
$ $
Not later than one year 225,770 200,685
Later than one year but not later than five years 146,997 121,706

NOTES TO THE FINANCIAL STATEMENTSFor the financial year ended 31 December 2016
106 | Trek 2000 International Ltd • Annual Report 2016
32. Fair value of assets and liabilities
(a) Assets and liabilities measured at fair value
Fair value hierarchy
The Group categorises fair value measurements using a fair value hierarchy that is dependent on the valuation inputs used as follows:
‑ Level 1 ‑ Quoted prices (unadjusted) in active markets for identical assets or liabilities that the Group can access at the measurement date,
‑ Level 2 ‑ Inputs other than quoted prices included within Level 1 that are observable for the asset or liability, either directly or indirectly, and
‑ Level 3 – Unobservable inputs for the asset or liability.
The following table shows an analysis of each class of assets and liabilities measured at fair value at the end of the reporting period:
Group
2016
Quoted prices in active
markets for identical
instruments
Significant observable
inputs other than quoted
prices
Significant unobservable
inputs Total
(Level 1) (Level 2) (Level 3)
$ $ $ $
Financial assets:
Available‑for‑sale financial assets
‑ Quoted investments (Note 16) 12,244,281 – – 12,244,281
Financial assets carried at fair value as at 31 December 2016 12,244,281 – – 12,244,281
Non-financial assets:
Property, plant and equipment
‑ Freehold property – – 1,290,357 1,290,357
‑ Leasehold property – – 5,419,361 5,419,361
Non‑financial assets carried at fair value as at 31 December 2016 – – 6,709,718 6,709,718

NOTES TO THE FINANCIAL STATEMENTSFor the financial year ended 31 December 2016
SMART SOCIETY, SMART L IFE | 107
32. Fair value of assets and liabilities (cont’d)
(a) Assets and liabilities measured at fair value (cont’d)
Group
2015
Quoted prices in active
markets for identical
instruments
Significant observable
inputs other than quoted
prices
Significant unobservable
inputs Total
(Level 1) (Level 2) (Level 3)
$ $ $ $
Financial assets:
Available‑for‑sale financial assets
‑ Quoted investments (Note 16) 8,748,876 – – 8,748,876
Financial assets carried at fair value as at 31 December 2015 8,748,876 – – 8,748,876
Non-financial assets:
Property, plant and equipment
‑ Freehold property – – 1,351,226 1,351,226
‑ Leasehold property – – 5,672,608 5,672,608
Non‑financial assets carried at fair value as at 31 December 2015 – – 7,023,834 7,023,834
The following table presents the valuation techniques and key inputs that were used to determine the fair value of the freehold and leasehold properties categorised under Level 3 of the fair value hierarchy in 2014 (i.e. date of last valuation).
Valuation techniques Key unobservable inputs Range
Market comparison Transacted prices of comparable properties. Adjustments are made for any difference in the location, tenure, size and condition of the specific property.
$20 psf to $2,988 psf
The Group’s Chief Financial Officer (“CFO”) oversees the Group’s financial reporting valuation process and is responsible for the setting of the Group’s valuation policies and procedures. In this regard, the CFO reports to the Group’s Audit Committee. It is the Group’s policy to engage external valuation experts who possess the relevant credentials and knowledge on the subject of valuation, valuation methodologies and FRS 113 fair value measurement guidance to perform the valuation.

NOTES TO THE FINANCIAL STATEMENTSFor the financial year ended 31 December 2016
108 | Trek 2000 International Ltd • Annual Report 2016
32. Fair value of assets and liabilities (cont’d)
(a) Assets and liabilities measured at fair value (cont’d)
Company
2016
Quoted prices in active
markets for identical
instruments
Significant observable
inputs other than quoted
prices
Significant unobservable
inputs Total
(Level 1) (Level 2) (Level 3)
$ $ $ $
Financial assets:
Available‑for‑sale financial assets
‑ Quoted investments (Note 16) 12,244,281 – – 12,244,281
Financial assets as at 31 December 2016 12,244,281 – – 12,244,281
Company
2015
Quoted prices in active
markets for identical
instruments
Significant observable
inputs other than quoted
prices
Significant unobservable
inputs Total
(Level 1) (Level 2) (Level 3)
$ $ $ $
Financial assets:
Available‑for‑sale financial assets
‑ Quoted investments (Note 16) 8,748,876 – – 8,748,876
Financial assets as at 31 December 2015 8,748,876 – – 8,748,876
(b) Assets and liabilities not measured at fair value but for which fair value is disclosed
The following table shows an analysis of the Group’s assets and liabilities not measured at fair value but for which fair value is disclosed:
Group
2016
Fair value measurements at the end of the reporting period using
Quoted pricesin active
markets for identical
assets(Level 1)
Significant observable
inputs other than quoted
prices(Level 2)
Significant unobservable
inputs(Level 3)
Fair value total
Carrying amount
$ $ $ $ $
Liabilities:
Term loans (non‑current) – 852,229 – 852,229 966,657
Hire purchase payables – 292,775 – 292,775 309,591

NOTES TO THE FINANCIAL STATEMENTSFor the financial year ended 31 December 2016
SMART SOCIETY, SMART L IFE | 109
32. Fair value of assets and liabilities (cont’d)
(b) Assets and liabilities not measured at fair value but for which fair value is disclosed (cont’d)
Group
2015
Fair value measurements at the end of the reporting period using
Quoted pricesin active
markets for identical
assets(Level 1)
Significant observable
inputs other than quoted
prices(Level 2)
Significant unobservable
inputs(Level 3)
Fair value total
Carrying amount
$ $ $ $ $
Liabilities:
Term loans (non‑current) – 471,151 – 471,151 500,075
Hire purchase payables – 288,085 – 288,085 304,025
Determination of fair value
Term loans, hire purchase payables
The fair values as disclosed in the table above are estimated by discounting expected future cash flows at market incremental lending rate for similar types of lending, borrowing or leasing arrangements at the end of the reporting period.
(c) Fair value of financial instruments by classes that are not carried at fair value and whose carrying amounts are not reasonable approximation of fair value
The fair value of financial assets that are not carried at fair value and whose carrying amounts are not reasonable approximation of fair values are as follows:
Group
2016 2015
Carryingamount
Fairvalue
Carryingamount
Fairvalue
$ $ $ $
Financial asset:
‑ Equity instruments at cost 180,364 * 182,163 *
* Investments in equity instruments carried at cost (Note 17)
Fair value information has not been disclosed for the Group’s investments in equity instruments that are carried at cost because the fair value cannot be measured reliably. In addition, the variability in the range of reasonable fair value estimates derived from valuation techniques is significant. The Group does not intend to dispose of these investments in the foreseeable future. The Group intends to eventually dispose of these investments through sale to institutional investors.

NOTES TO THE FINANCIAL STATEMENTSFor the financial year ended 31 December 2016
110 | Trek 2000 International Ltd • Annual Report 2016
33. Financial risk management objectives and policies
The Group and the Company are exposed to financial risks arising from its operations and the use of financial instruments. The key financial risks include credit risk, foreign exchange risk, liquidity risk and market price risk. The Board of Directors reviews and agrees the policies and procedures for the management of these risks which are executed by the Chief Financial Officer. The Audit Committee provides independent oversight to the effectiveness of the risk management process. It is, and has been throughout the current and previous financial year, the Group’s policy that no derivatives shall be undertaken. The Group and the Company do not apply hedge accounting.
The following sections provide details regarding the Group’s and the Company’s exposure to the above‑mentioned financial risks and the objectives, policies and processes for management of these risks.
There has been no change to the Group’s exposure to these financial risks or the manner in which it manages and measures the risks, except as disclosed in the credit risk section.
(a) Credit risk
Credit risk is the risk of loss that may arise on outstanding financial instruments should a counterparty default on its obligations. The Group’s and the Company’s exposure to credit risk arises primarily from trade and other receivables. For other financial assets (including investment securities and, cash and cash equivalents), the Group and the Company minimise credit risk by dealing with high credit rating counterparties.
The Group’s objective is to seek continual revenue growth while minimising losses incurred due to increased credit risk exposure. In addition, trade receivables balances are monitored on an ongoing basis with the result that the Group’s exposure to bad debt is not significant
Exposure to credit risk
At the end of the reporting period, the Group’s and the Company’s maximum exposure to credit risk is represented by the carrying amount of each class of financial assets recognised in the balance sheet.
Financial assets that are neither past due nor impaired
Trade and other receivables that are neither past due nor impaired are creditworthy debtors with reasonable payment record with the Group. Cash and cash equivalents, and investment securities that are neither past due nor impaired are placed with or entered into with reputable financial institutions or companies with high credit ratings and no history of default.
Information regarding financial assets that are either past due or impaired is disclosed in Note 19 (Trade and other receivables).

NOTES TO THE FINANCIAL STATEMENTSFor the financial year ended 31 December 2016
SMART SOCIETY, SMART L IFE | 111
33. Financial risk management objectives and policies (cont’d)
(b) Foreign currency risk
The Group has transactional currency exposures arising from sales and purchases that are denominated in a currency other than the respective functional currencies of the Group entities. Approximately 5% (2015: 30%) of the Group’s sales are denominated in foreign currency.
The Group and the Company also hold cash and cash equivalents denominated in foreign currencies for working capital purposes. At the end of the reporting period, such foreign currency balances (mainly in SGD and RM) amount to $4,743,583 and $529,976 (2015: $2,439,643 and $287,247) for the Group and Company respectively. For trade receivables, foreign currency balances (mainly in SGD) amount to $2,469,375 (2015: $370,126). Included in trade payables are amounts of $691,664 (2015: $1,572,209) denominated in SGD and $12,531 (2015: $13,462) denominated in Chinese Renminbi.
The Group currently does not enter into foreign currency hedging activities to protect against volatility associated with foreign currency sales and purchases. Such risks are managed through matching sales with corresponding purchases, and assets with liabilities of the same currencies and amounts.
Sensitivity analysis for foreign currency risk
The following table demonstrates the sensitivity of the Group’s profit net of tax to a reasonably possible change in the SGD exchange rates against the respective functional currencies of the entities (which is mainly USD) within the Group, with all other variables held constant:
Group
Profit net of tax
2016 2015
$ $
SGD/USD
‑ Strengthened by 3% (2015: 3%) 166,732 9,853
‑ Weakened by 3% (2015: 3%) (166,732) (9,853)
(c) Liquidity risk
Liquidity risk is the risk that the Group or the Company will encounter difficulty in meeting financial obligations due to shortage of funds. The Group’s and the Company’s objective is to maintain a balance between continuity of funding and flexibility through the use of stand‑by credit facilities.
Analysis of financial instruments by remaining contractual maturities
The table below summarises the maturity profile of the Group’s and the Company’s financial assets and liabilities at the end of the reporting period based on contractual undiscounted repayment obligations.

NOTES TO THE FINANCIAL STATEMENTSFor the financial year ended 31 December 2016
112 | Trek 2000 International Ltd • Annual Report 2016
33. Financial risk management objectives and policies (cont’d)
(c) Liquidity risk (cont’d)
2016$’000
2015$’000
GroupOne year
or lessOne to
five yearsOver five
years TotalOne year
or lessOne to
five yearsOver five
years Total
Financial assets:
Quoted investments – 1,476 10,768 12,244 354 2,051 6,344 8,749
Unquoted investments – – 180 180 – – 182 182
Trade and other receivables 17,107 – – 17,107 15,934 – – 15,934
Cash and short‑term deposits 29,234 – – 29,234 24,256 – – 24,256
Total undiscounted financial assets 46,341 1,476 10,948 58,765 40,544 2,051 6,526 49,121
Financial liabilities:
Trade payables and accruals 14,464 – – 14,464 29,476 – – 29,476
Other payables 4,206 – – 4,206 2,328 – – 2,328
Hire purchase payables 151 159 – 310 154 150 – 304
Term loans and overdrafts 1,241 427 540 2,208 1,249 341 159 1,749
Total undiscounted financial liabilities 20,062 586 540 21,188 33,207 491 159 33,857
Total net undiscounted financial assets/(liabilities) 26,279 890 10,408 37,577 7,337 1,560 6,367 15,264
2016$’000
2015$’000
CompanyOne year
or lessOne to
five yearsOver five
years TotalOne year
or lessOne to
five yearsOver five
years Total
Financial assets:
Quoted investments – 1,476 10,768 12,244 354 2,051 6,344 8,749
Trade and other receivables 563 – – 563 26,140 – – 26,140
Cash and short‑term deposits 9,081 – – 9,081 393 – – 393
Total undiscounted financial assets 9,644 1,476 10,768 21,888 26,887 2,051 6,344 35,282
Financial liabilities:
Trade payables and accruals 121 – – 121 81 – – 81
Other payables 963 – – 963 318 – – 318
Amounts due to subsidiaries 106 – – 106 – – – –
Total undiscounted financial liabilities 1,190 – – 1,190 399 – – 399
Total net undiscounted financial assets 8,454 1,476 10,768 20,698 26,488 2,051 6,344 34,883

NOTES TO THE FINANCIAL STATEMENTSFor the financial year ended 31 December 2016
SMART SOCIETY, SMART L IFE | 113
33. Financial risk management objectives and policies (cont’d)
(d) Market price risk
Market price risk is the risk that the fair value of future cash flows of the Group’s and Company’s financial instruments will fluctuate because of changes in market prices (other than interest or exchange rates). The Group and Company are exposed to debt price risk arising from its investment in quoted debt instruments. These instruments are quoted on the stock exchange both within and outside Singapore and are classified as held as available‑for‑sale financial assets. The Group does not have exposure to commodity price risk.
The Group’s policy is to invest in a mix of quoted debt securities from various industries, with the objective of managing market price risk and to derive potential returns from capital appreciation and dividend income streams.
Sensitivity analysis for market price risk
As at end of the reporting period, if the market prices had been 2% (2015: 2%) higher/lower with all other variables held constant, the Group’s and Company’s other reserve in equity would have been $244,886 (2015: $174,978) higher/lower, arising as a result of an increase/decrease in the fair value of quoted investments classified as available‑for‑sale.
(e) Interest rate risk
Interest rate risk is the risk that the fair value or future cash flows of the Group’s financial instruments will fluctuate because of changes in market interest rates. The Group’s exposure to interest rate risk arises primarily from its interest‑bearing loans and quoted investments. The Group’s policy is to manage interest cost using floating rate loans and borrowings, depending on the liquidity needs of the Group, with the objective of ensuring that there is sufficient net cash for the Group’s operations at reasonable interest rates. The Group does not enter into interest rate swaps.
Sensitivity analysis for interest rate risk
At the end of the reporting period, if interest rates had been 75 (2015: 75) basis points lower/higher with all other variables held constant, the Group’s profit before tax would have been $16,558 (2015: loss before tax of $13,119) higher/lower, arising mainly as a result of lower/higher interest expense on floating rate loans and borrowings. The assumed movement in basis points for interest rate sensitivity analysis is based on the currently observable market environment.
34. Capital management
The primary objective of the Group’s capital management is to ensure that it maintains healthy capital ratios in order to support its business and maximise shareholder value.
The Group manages its capital structure and makes adjustments to it, in light of changes in economic conditions. To maintain or adjust the capital structure, the Group may adjust the dividend payment to shareholders, return capital to shareholders or issue new shares. No changes were made in the objectives, policies or processes during the years ended 31 December 2016 and 2015.

NOTES TO THE FINANCIAL STATEMENTSFor the financial year ended 31 December 2016
114 | Trek 2000 International Ltd • Annual Report 2016
34. Capital management (cont’d)
The Group monitors capital using a gearing ratio, which is net debt divided by total capital plus net debt. The Group includes within the net debt, trade payables and accruals, other payables, hire purchase payables, term loans, less cash and short‑term deposits. Capital includes equity attributable to the owners of the Company less the fair value adjustment reserve.
Group
2016 2015
$ $
Trade payables and accruals (Note 22) 14,464,012 29,476,025
Other payables (Note 22) 4,205,958 2,328,481
Hire purchase payables (Note 24) 309,591 304,025
Term loans and overdrafts (Note 25) 2,207,759 1,749,153
Less: Cash and short‑term deposits (Note 21) (29,234,449) (24,256,093)
Net (cash)/debt (8,047,129) 9,601,591
Equity attributable to the owners of the Company 42,173,227 35,936,884
Less: Fair value adjustment reserve (103,039) (112,664)
Total capital 42,070,188 35,824,220
Capital and net debt 34,023,059 45,425,811
Gearing ratio Not meaningful 21.1%
35. Segment information
For management purposes, the Group is organised into business units based on their products and services, and has three reportable operating segments as follows:
(a) The Interactive Consumer Solutions business segment is driven by the creativity, innovativeness and ingenuity from the Group’s core Research and Development division. Serving as the mainstay growth driver for the Group, it offers patented products and solutions covered under the following core technologies:
USB
Wireless
Anti‑piracy
Compression
Security/Encryption
Enterprise Solutions
Portable Storage Solutions encompassing Flash Memory, Hard Disk and Optical Technologies

NOTES TO THE FINANCIAL STATEMENTSFor the financial year ended 31 December 2016
SMART SOCIETY, SMART L IFE | 115
35. Segment information (cont’d)
(a) As a leading external storage solutions provider with a portfolio of innovative and patented products and solutions, the Group continues to leverage on its specialisation in external storage and security solutions to reinvent and develop new product offerings. These include our proprietary inventions such as ThumbDrive™ USB Flash Drive, Flucard® and Ai‑Ball™.
(b) The Customised Solutions segment is driven by customers’ specification, needs and requirements. The Group provides expertise in the area of design solutions that incorporate its software, hardware and firmware. The design solutions are developed specific to customers’ requirements, the customers have the flexibility to purchase either the complete design‑in module or sub‑modules in semi‑customised or customised forms.
(c) The Licensing business segment involves the provision of licensees based on the Group’s library of patented technologies and trademarks
Except as indicated above, no operating segments have been aggregated to form the above reportable operating segments.
Management monitors the operating results of its business units separately for the purpose of making decisions about resource allocation and performance assessment. Segment performance is evaluated based on operating profit or loss which in certain respects, as explained in the table below, is measured differently from operating profit or loss in the consolidated financial statements. Interest income, finance costs and income taxes are managed on a group basis and are not allocated to operating segments.

NOTES TO THE FINANCIAL STATEMENTSFor the financial year ended 31 December 2016
116 | Trek 2000 International Ltd • Annual Report 2016
35.
Seg
men
t in
form
atio
n (
con
t’d
)
Bu
sin
ess
seg
men
ts
Cu
sto
mis
ed S
olu
tio
ns
Inte
ract
ive
Co
nsu
mer
So
luti
on
sLi
cen
sin
g
Ad
just
men
tsN
ote
sC
on
solid
ated
2016
2015
2016
2015
2016
2015
2016
2015
2016
2015
$$
$$
$$
$$
$$
Seg
men
t re
ven
ue
(1)
Sale
s to
ext
ern
al c
ust
om
ers
2,39
9,16
77,
554,
444
163,
111,
513
141,
176,
150
214,
281
105,
168
––
165,
724,
961
148,
835,
762
Res
ult
s:
Dep
reci
atio
n a
nd
am
ort
isat
ion
15,5
1659
,875
2,01
5,23
12,
098,
289
1,24
114
9,76
7–
–2,
031,
988
2,30
7,93
1
Pro
per
ty, p
lan
t an
d e
qu
ipm
ent
wri
tten
‑off
––
2,36
091
5,32
0–
––
–2,
360
915,
320
Inta
ng
ible
ass
ets
wri
tten
‑off
––
810,
546
1,23
7,67
7–
––
–81
0,54
61,
237,
677
Imp
airm
ent
loss
on
pro
per
ty,
pla
nt
and
eq
uip
men
t–
–21
1,94
5–
––
––
211,
945
–
Allo
wan
ce f
or
do
ub
tfu
l deb
ts,
net
796
31,5
8849
,698
582,
214
––
––
50,4
9461
3,80
2
Seg
men
t p
rofi
t/(l
oss
)10
8,34
1(5
21,1
10)
7,36
5,66
1(7
,417
,689
)9,
676
(190
,597
)51
6,67
656
1,33
5A
8,00
0,35
4(7
,568
,061
)
Ass
ets:
Ad
dit
ion
to
no
n‑c
urr
ent
asse
ts
24,7
6745
,624
1,72
1,14
42,
014,
340
––
––
B1,
745,
911
2,05
9,96
4
Seg
men
t as
sets
1,05
9,87
13,
762,
816
66,1
49,0
3269
,353
,362
3,56
5,62
15,
160,
935
12,4
24,6
458,
931,
039
C83
,199
,169
87,2
08,1
52
Seg
men
t lia
bili
ties
308,
614
1,63
6,77
219
,261
,356
30,1
67,7
34–
–4,
458,
965
3,27
8,41
9D
24,0
28,9
3535
,082
,925
(1)
Ther
e w
ere
no
inte
r‑se
gm
ent
sale
s d
uri
ng
th
e ye
ar.

NOTES TO THE FINANCIAL STATEMENTSFor the financial year ended 31 December 2016
SMART SOCIETY, SMART L IFE | 117
35. Segment information (cont’d)
Business segments (cont’d)
Notes Nature of adjustments and eliminations to arrive at amounts reported in the consolidated financial statements
A The following items are added to/(deducted from) segment profit/(loss) to arrive at “Profit/(Loss) before income tax” presented in the consolidated income statement:
Group
2016 2015
$ $
Interest income 661,778 714,394
Finance costs (145,102) (153,059)
516,676 561,335
B Additions to non‑current assets consist of additions to property, plant and equipment, and intangible assets.
C The following items are added to segment assets to arrive at total assets reported in the consolidated balance sheet:
$ $
Unquoted investments 180,364 182,163
Quoted investments 12,244,281 8,748,876
12,424,645 8,931,039
D The following items are added to segment liabilities to arrive at total liabilities reported in the consolidated balance sheet:
$ $
Hire purchase payables (current) 150,748 154,054
Hire purchase payables (non‑current) 158,843 149,971
Income tax payable 1,243,725 768,245
Deferred taxation 697,890 456,996
Term loans and overdrafts (current) 1,241,102 1,249,078
Term loans (non‑current) 966,657 500,075
4,458,965 3,278,419

NOTES TO THE FINANCIAL STATEMENTSFor the financial year ended 31 December 2016
118 | Trek 2000 International Ltd • Annual Report 2016
35. Segment information (cont’d)
Geographical information
Revenue and non‑current assets information based on the geographical location of customers and assets respectively are as follows:
Revenue Non-current assets
2016 2015 2016 2015
$’000 $’000 $’000 $’000
Singapore 22,103 116,669 11,681 13,451
Taiwan 12,113 10,119 – –
United States 4,483 4,695 – –
China/Hong Kong 92,429 3,942 3 4
Japan 1,017 3,256 – –
Europe 1,819 3,251 – –
Malaysia 28,096 2,028 1,061 576
India 1,519 1,130 7 –
Thailand 264 313 – –
Others 1,882 3,433 1,128 1,273
165,725 148,836 13,880 15,304
Non‑current assets information presented above consists of property, plant and equipment and intangible assets as presented in the consolidated balance sheet.
Information about major customers
Revenue from 3 (2015: 1) major customers amounted to $90,749,721 (2015: $102,284,000).
36. Dividends
Group
2016 2015
$ $
Declared and paid during the financial year:
Dividends on ordinary shares:
‑ Final exempt (one‑tier) dividend for 2015 of S$0.005 per ordinary share – 1,123,102

NOTES TO THE FINANCIAL STATEMENTSFor the financial year ended 31 December 2016
SMART SOCIETY, SMART L IFE | 119
37. Restatements to comparative figures
In 2015, Racer entered into an agreement with its chief executive officer (“CEO”) for the subscription of 6,000,000 shares of Racer for S$7,200,000 (the “Subscription Price”). Under the agreement, the subscription price was to be fully settled in cash.
During the preparation of the Group’s financial statements, it came to the Group’s attention that out of the full S$7,200,000 Subscription Price, only S$2,236,796 were settled in cash, leaving an outstanding amount of S$4,964,204 (the “Outstanding Amount”). In 2015, the CEO of Racer transferred certain plant and equipment (the “Fixed Assets Transfer”) for a consideration of S$4,964,204. In the prior year’s financial statements, the consideration payable of S$4,964,204 to the CEO of Racer was treated as a contribution in‑kind towards the Subscription Price and were applied against the Outstanding Amounts. As the Fixed Asset Transfer was executed without the approval of the board of directors of Racer (the “BOD”), the BOD requested:
a) the CEO of Racer to:
i) reverse the Fixed Asset Transfer
ii) to fulfil the payment of the Outstanding Amount in cash
iii) to provide an indemnity to Racer in relation to any loss suffered by Racer in relation to the Fixed Asset Transfer; and
b) the management of Racer to rectify Racer’s fixed assets register and other accounting records to reflect the reversal of the Fixed Asset Transfer and the removal of the associated plant and equipment.
The CEO of Racer have acceded to the BOD’s request by making full payment of the Outstanding Amount in January 2017. The CEO of Racer has also indemnified Racer against any loss suffered by Racer in relation to the Fixed Asset Transfer.
As a result of the abovementioned, the Group restated its financial statements for the year ended 31 December 2015, as follows:
As previously reported
2015 AdjustmentsRestated
2015
$ $ $
Balance sheet
Property, plant and equipment 12,958,761 (2,815,696) 10,143,065
Trade and other receivables 12,414,622 3,519,621 15,934,243
Revenue reserve (2,606,464) 137,761 (2,468,703)
Other reserve 880,915 (21,146) 859,769
Non‑controlling interest 15,601,033 587,310 16,188,343
Profit or loss
Cost of sales (145,480,180) 725,071 (144,755,109)

120 | Trek 2000 International Ltd • Annual Report 2016
37. Restatements to comparative figures (cont’d)
The effects of the above adjustments to the cash flow statement for the financial year ended 31 December 2015 were as follows:
Group
As previously stated
As reported in this set
of financial statements
$ $
Net cash used in investing activities (3,977,888) (458,267)
Net cash generated from financing activities 8,964,712 5,445,091
The effects of the above adjustments to the loss per share for the financial year ended 31 December 2015 were as follows:
Decrease in loss per share (cents per share) 2015
Basic, loss for the year attributable to ordinary equity holders of the Company 0.05
Diluted, loss for the year attributable to ordinary equity holders of the Company 0.05
38. Event occurring after the reporting period
On 14 March 2017, the Company disposed its 19% equity interest in Racer to a director of Racer for a cash consideration of S$3,000,000. The transaction resulted in the Group recording a loss on disposal subsequent to year‑end. At the Company level, the transaction resulted in a gain on disposal of the subsidiary subsequent to year‑end.
39. Authorisation of financial statements
The financial statements for the year ended 31 December 2016 were authorised for issue in accordance with a resolution of the directors on 29 May 2017.
NOTES TO THE FINANCIAL STATEMENTSFor the financial year ended 31 December 2016
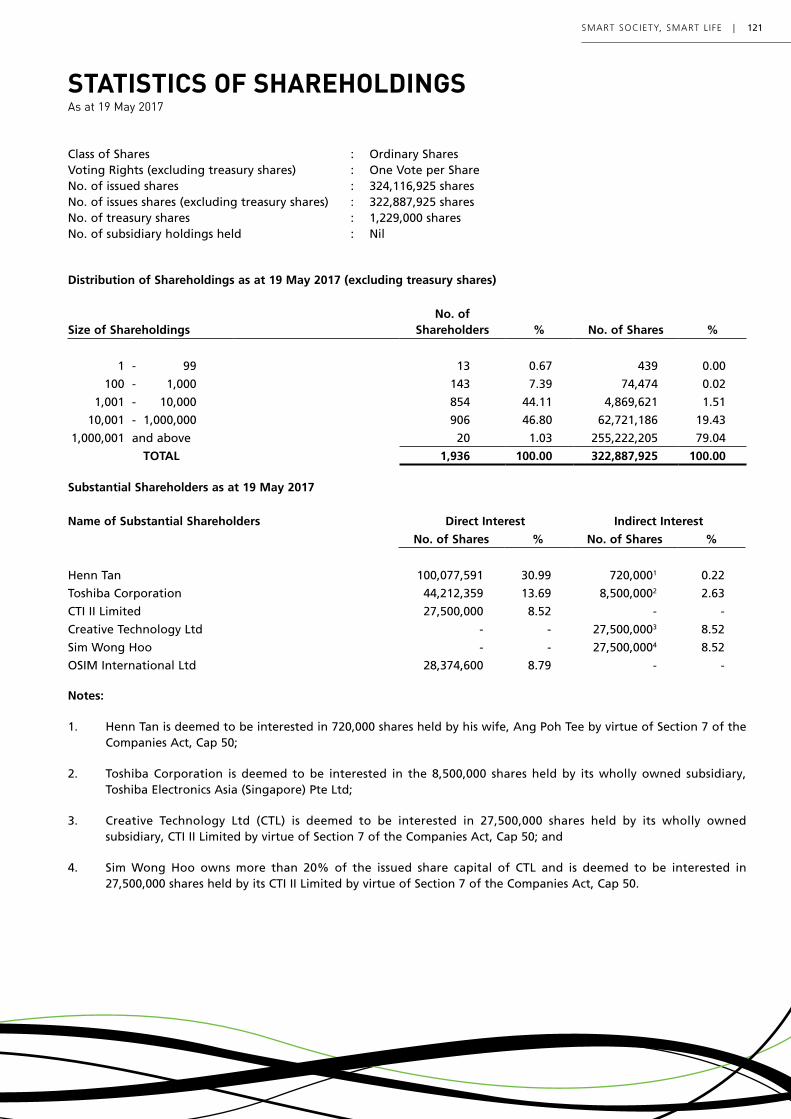
SMART SOCIETY, SMART L IFE | 121
STATISTICS OF SHAREHOLDINGS As at 19 May 2017
Class of Shares : Ordinary Shares Voting Rights (excluding treasury shares) : One Vote per ShareNo. of issued shares : 324,116,925 sharesNo. of issues shares (excluding treasury shares) : 322,887,925 sharesNo. of treasury shares : 1,229,000 sharesNo. of subsidiary holdings held : Nil
Distribution of Shareholdings as at 19 May 2017 (excluding treasury shares)
Size of ShareholdingsNo. of
Shareholders % No. of Shares %
1 ‑ 99 13 0.67 439 0.00
100 ‑ 1,000 143 7.39 74,474 0.02
1,001 ‑ 10,000 854 44.11 4,869,621 1.51
10,001 ‑ 1,000,000 906 46.80 62,721,186 19.43
1,000,001 and above 20 1.03 255,222,205 79.04
TOTAL 1,936 100.00 322,887,925 100.00
Substantial Shareholders as at 19 May 2017
Name of Substantial Shareholders Direct Interest Indirect Interest
No. of Shares % No. of Shares %
Henn Tan 100,077,591 30.99 720,0001 0.22
Toshiba Corporation 44,212,359 13.69 8,500,0002 2.63
CTI II Limited 27,500,000 8.52 ‑ ‑
Creative Technology Ltd ‑ ‑ 27,500,0003 8.52
Sim Wong Hoo ‑ ‑ 27,500,0004 8.52
OSIM International Ltd 28,374,600 8.79 ‑ ‑
Notes:
1. Henn Tan is deemed to be interested in 720,000 shares held by his wife, Ang Poh Tee by virtue of Section 7 of the Companies Act, Cap 50;
2. Toshiba Corporation is deemed to be interested in the 8,500,000 shares held by its wholly owned subsidiary, Toshiba Electronics Asia (Singapore) Pte Ltd;
3. Creative Technology Ltd (CTL) is deemed to be interested in 27,500,000 shares held by its wholly owned subsidiary, CTI II Limited by virtue of Section 7 of the Companies Act, Cap 50; and
4. Sim Wong Hoo owns more than 20% of the issued share capital of CTL and is deemed to be interested in 27,500,000 shares held by its CTI II Limited by virtue of Section 7 of the Companies Act, Cap 50.

122 | Trek 2000 International Ltd • Annual Report 2016
SHAREHOLDERS’ INFORMATIONAs at 19 May 2017
Twenty Largest Shareholders as at 19 May 2017
NO. NAME No. of shares %
1. TAN HENRY 100,077,591 30.99
2. MAYBANK KIM ENG SECURITIES PTE. LTD. 68,083,459 21.09
3. CTI II LIMITED 27,500,000 8.52
4. DBS NOMINEES (PRIVATE) LIMITED 17,822,200 5.52
5. TOSHIBA ELECTRONICS ASIA (SINGAPORE) PTE LTD 8,500,000 2.63
6. HONG LEONG FINANCE NOMINEES PTE LTD 5,565,000 1.72
7. TAN KAY TOH OR YU HEA RYEONG 5,328,000 1.65
8. PHILLIP SECURITIES PTE LTD 2,943,000 0.91
9. CITIBANK NOMINEES SINGAPORE PTE LTD 2,827,200 0.88
10. CHONG GEORGE 2,660,000 0.82
11. TAN JOON YONG WAYNE (CHEN JUNRONG) 2,371,176 0.73
12. CHIA KWOK YUAN 1,839,250 0.57
13. HSBC (SINGAPORE) NOMINEES PTE LTD 1,522,000 0.47
14. CHEW GHIM BOK 1,497,000 0.46
15. UNITED OVERSEAS BANK NOMINEES (PRIVATE) LIMITED 1,233,000 0.38
16. NG GOH HOCK 1,114,000 0.35
17. KHOR TIT HEE 1,107,000 0.34
18. OCBC SECURITIES PRIVATE LIMITED 1,094,329 0.34
19. CHIN KIAM HSUNG 1,093,000 0.34
20. CHIA ENG KOON 1,045,000 0.32
TOTAL 255,222,205 79.03
Based on Shareholders’ Information as at 19 May 2017 approximately 33.86% of the total numbers of issued shares of the Company are held by the public and therefore, Rule 723 of the Listing Manual of the Singapore Exchange Securities Trading Limited is complied with.

SMART SOCIETY, SMART L IFE | 123
NOTICE OF EIGHTEENTH ANNUAL GENERAL MEETING
NOTICE IS HEREBY GIVEN that the Eighteenth Annual General Meeting (the “AGM”) of the Company will be held at 30 Loyang Way, #07‑13/14/15 Loyang Industrial Estate, Singapore 508769 on Thursday, 29 June 2017 at 10:00 a.m., to transact the following businesses:
ORDINARY BUSINESS:
1. To receive and adopt the Directors’ Statement and Audited Financial Statements for the financial year ended 31 December 2016 together with the Auditor’s Report thereon.
Resolution 1
2. To approve the payment of the Directors’ fees of S$92,292 for the financial year ended 31 December 2016 (2015: S$83,250).
Resolution 2
3. To re‑elect Mr. Tan Henry @ Henn Tan, the director retiring by rotation pursuant Article 103 of the Company’s Constitution and who, being eligible, offer himself for re‑election.
[See Explanatory Note (i)]
Resolution 3
4. To re‑elect Ms Celine Cha Mui Hwang, the director retiring by rotation pursuant to Article 103 of the Company’s Constitution and who, being eligible, offer herself for re‑election.
[See Explanatory Note (ii)]
Resolution 4
5. To re‑elect Mr Loh Yih, the director retiring by rotation pursuant to Article 108 of the Company’s Constitution and who, being eligible, offer himself for re‑election.
[See Explanatory Note (iii)]
Resolution 5
6. To note the retirement of Mr Chan Leng Wai as a director of the Company, pursuant to Article 103 of the Company’s Constitution.
[See Explanatory Note (iv)]
7. To appoint Moore Stephens LLP as Auditors of the Company in place of the retiring auditors, Ernst & Young LLP and to authorise the Directors to fix their remuneration.
[See Explanatory Note (v)]
Resolution 6
SPECIAL BUSINESS:
To consider and, if thought fit, to pass the following ordinary resolutions with or without modifications:
8. Authority to allot and issue shares Resolution 7
“THAT pursuant to Section 161 of the Companies Act, Chapter 50, and the Listing Rules of the Singapore Exchange Securities Trading Limited (“SGX‑ST”), authority be and is hereby given for the Directors of the Company at any time to such persons and upon such terms and for such purposes as the Directors may in their absolute discretion deem fit, to:
(i) issue shares in the capital of the Company whether by way of rights, bonus or otherwise;
(ii) make or grant offers, agreements or options that might or would require shares to be issued or other transferable rights to subscribe for or purchase shares (collectively, “Instruments”) including but not limited to the creation and issue of warrants, debentures or other instruments convertible into shares;
(iii) issue additional Instruments arising from adjustments made to the number of Instruments previously issued in the event of rights, bonus or capitalisation issues;

124 | Trek 2000 International Ltd • Annual Report 2016
NOTICE OF EIGHTEENTH ANNUAL GENERAL MEETING
and (notwithstanding the authority conferred by the shareholders may have ceased to be in force) issue shares in pursuant to any Instrument made or granted by the Directors while the authority was in force, provided always that:
(a) the aggregate number of shares to be issued pursuant to this Resolution (including shares to be issued in pursuance of Instruments made or granted pursuant to this Resolution) does not exceed fifty per centum (50%) of the Company’s total number of issued shares (excluding treasury shares and shares (if any) held by a subsidiary), of which the aggregate number of shares (including shares to be issued in pursuance of Instruments made or granted pursuant to this Resolution) to be issued other than on a pro‑rata basis to shareholders of the Company does not exceed twenty per centum (20%) of the total number of issued shares (excluding treasury shares and shares (if any) held by a subsidiary), and for the purpose of this Resolution, the total number of issued shares (excluding treasury shares and shares (if any) held by a subsidiary) shall be the Company’s total number of issued shares (excluding treasury shares and shares (if any) held by a subsidiary) at the time this Resolution is passed, after adjusting for:
(i) new shares arising from the conversion or exercise of convertible securities, or
(ii) new shares arising from exercising share options or vesting of share awards outstanding or subsisting at the time this Resolution is passed, and
(iii) any subsequent bonus issue, consolidation or subdivision of the Company’s shares;
(b) such authority shall, unless revoked or varied by the Company at a general meeting, continue in force until the conclusion of the next Annual General Meeting or the date by which the next Annual General Meeting of the Company is required by law to be held, whichever is earlier.”
[See Explanatory Note (vi)]
9. Authority for Directors to offer and grant options and allot shares pursuant to the Trek 2000 International Ltd Share Option Scheme 2011
“That the Directors be empowered to issue shares to all the holders of options granted by the Company, whether granted during the subsistence of this authority or otherwise, under the approved Trek 2000 International Ltd Share Option Scheme 2011 (the “2011 Scheme”) upon the exercise of such options and in accordance with the terms and conditions of the 2011 Scheme, provided that the aggregate number of shares issued pursuant to the 2011 Scheme shall not exceed 15% of the issued share capital of the Company from time to time and that such authority shall, unless revoked or varied by the Company in general Meeting, continue in force until the conclusion of the next Annual General Meeting of the Company or the date by which the next Annual General Meeting of the Company is required by law to be held, whichever is earlier.”
[See Explanatory Note (vii)]
Resolution 8
10. To transact any other business which may be properly transacted at an Annual General Meeting.
FOR AND ON BEHALF OF THE BOARD
Tan Henry @ Henn TanExecutive Chairman & Chief Executive Officer
14 June 2017

SMART SOCIETY, SMART L IFE | 125
NOTICE OF EIGHTEENTH ANNUAL GENERAL MEETING
Explanatory Notes:
(i) Key information on Mr Tan Henry @ Henn Tan can be found on page 14 of the Annual Report 2016. Mr Tan Henry @ Henn Tan will, upon re‑election as Director of the Company, remain as the Chairman, Chief Executive Officer and Executive Director and a member of the Nominating and Remuneration Committees.
(ii) Key information on Ms Celine Cha Mui Hwang can be found on page 16 of the Annual Report 2016. Ms Celine Cha Mui Hwang will, upon re‑election as Director of the Company, remain as a member of the Remuneration and Risk Review Committees.
(iii) Key information on Mr Loh Yih can be found on page 16 of the Annual Report 2016. Mr. Loh Yih will, upon re‑election as Director of the Company, remain as a member of the Audit Committee.
(iv) Mr Chan Leng Wai has indicated that he will not be seeking re‑election as a Director of the Company and will retire at the conclusion of the AGM. Upon Mr Chan Leng Wai’s retirement, he will cease to be the member of the Audit Committee.
(v) Resolution 6 is to approve the appointment of Moore Stephens LLP as Auditors of the Company in place of retiring Auditors, Ernst & Young LLP and to authorise the Directors to fix their remuneration.
The Company’s existing Auditors, Ernst & Young LLP, have been auditors of the Company since 1999. Ernst & Young LLP had on 3 May 2017 given notice to the Directors of their intention not to seek for re‑appointment as auditors of the Company and will cease to be auditors of the Company at the conclusion of the AGM.
As outgoing auditors of the Company, Ernst & Young LLP will not be seeking for re‑appointment at the AGM, the Board wishes to express their appreciation for the services rendered by Ernst & Young LLP.
The Board and the Audit Committee are of the view that the proposed change of auditors will enable it to benefit from fresh perspectives and views of another professional firm and enhance the value of independent audit.
The Board have determined, in consultation with the Audit committee, that the proposal from Moore Stephens LLP best meets the needs and requirements of the Group. As such, the Board proposes the appointment of Moore Stephens LLP as the new auditors of the Company. Pursuant to Rule 712(3) of the Listing Manual, the proposed change of Auditors must be specifically approved by the Shareholders in general meeting. Accordingly, the appointment of Moore Stephens LLP would take effect upon the approval of the same by Shareholders at the AGM.
Moore Stephens LLP has been established in Singapore for more than 28 years. Since then, they have grown, together with their associate firms, to a leading accountancy and consulting association with 200 partners and staff.
Moore Stephens LLP is a member firm of Moore Stephens International Limited, which is regarded as one of the world’s leading accounting and consulting associations with 626 offices in 108 countries and more than 27,000 partners and professionals.
Moore Stephens LLP provides auditing, consultancy and accountancy services to a diverse range of clients, from large corporations, listed companies to private businesses across a broad array of industries. They are Chartered Accountants of Singapore registered with ACRA and thus have fulfilled the requirements imposed by Rule 712(2) of the Listing Manual.
Mr Neo Keng Jin is the designated Lead Engagement Partner who will be assigned to lead the audit of Trek 2000 International Ltd. Mr Neo holds a Bachelor of Accountancy, Nanyang Technological University, Singapore and is a practicing member, Institute of Singapore Chartered Accountants. Mr Neo has more than 20 years of audit experience in providing audit and assurance services to a variety of clients, including public companies listed on the SGX‑ST. The Audit Committee has also noted that Mr Neo was subject to and passed the Practice Monitoring Programme review by the Accounting and Corporate Authority of Singapore in 2013.
For more information on Moore Stephens LLP, please visit http//www.moorestephens.com.sg
The proposed change of auditors have been reviewed and recommended by the Audit Committee, after taking into consideration of suitability of Moore Stephens LLP as the Company’s external auditors and ensuring compliance with the Listing Manual.
126 | Trek 2000 International Ltd • Annual Report 2016
Explanatory Notes: (cont’d)
The Board, having taken into account the Audit Committee’s recommendation, and various factors, including, inter alia, the following:
(a) the fee structure, the adequacy of the resources and experience of Moore Stephens LLP;(b) the audit engagement partner assigned to the audit;(c) Moore Stephens LLP’s other audit engagements;(d) the size and complexity of the Group’s operations; and(e) the number and experience of supervisory and professional staff assigned to the audit of the Company
and the Group,
are of the opinion that Moore Stephens LLP will be able to meet the audit requirements of the Group and the Rule 712 of the Listing Manual has been complied with.
In this connection, Moore Stephens LLP has on 31 May 2017 given their formal consent to act as Auditors to the directors, subject to the approval of Shareholders at the AGM.
In accordance with Rule 716 of the Listing Manual, the Board confirms that pursuant to the Shareholders’ approval of the proposed change of Auditors, Moore Stephens LLP will become the auditors of the Company, its Singapore‑incorporated principal subsidiaries and significant associated companies. The Board and the Audit Committee are satisfied that the appointment of different auditing firm for its non‑significant subsidiaries and associated companies would not compromise the standard and effectiveness of the audit of the Company.
In accordance with the requirements of Rule 1203(5) of the Listing Manual, the Company confirms the following:
(a) there were no disagreements with Ernst & Young LLP on accounting treatments within the last 12 (twelve) months up to the date of this Notice;
(b) the Company is not aware of any circumstances connected with the proposed change of Auditors, which has not been disclosed, that should be brought to the attention of Shareholders of the Group;
(c) the specific reasons for the proposed change of Auditors are as disclosed; and(d) it is in compliance with Rule 712 and Rule 716 of the Listing Manual in relation to the appointment of
Moore Stephens LLP as auditors of the Company.
Ernst & Young LLP had issued a letter to Moore Stephens LLP stating that as mentioned in the basis of disclaimer section in the audit report dated 29 May 2017, Ernst & Young LLP had informed management of certain inconsistencies in the accounting records maintained by the Company and its subsidiaries during the course of their audit and expressed concerns over the validity of certain transactions recorded by the Company.
The Directors collectively and individually accept full responsibility for the accuracy of the information given in this Notice and confirm after making all reasonable enquiries that, to the best of their knowledge and belief, this Notice constitutes full and true disclosure of all material facts about the proposed change of auditors, the Company and its subsidiaries, and the Directors are not aware of any facts the omission of which would make any statement in this Notice misleading.
Where information in the Notice has been extracted from published or otherwise publicly available sources or obtained from a named source, the sole responsibility of the Directors has been to ensure that such information has been accurately and correctly extracted from those sources and/or reproduced in the Notice in its proper form and context.
Copies of the following documents may be inspected by Shareholders at the registered office of the Company at 30 Loyang Way, #07‑13/14/15 Loyang Industrial Estate, Singapore 508769 during normal business hours from the date of this Notice up to and including the date of the AGM:
(a) letter of Nomination dated 9 May 2017 to Moore Stephens LLP; and(b) the letter of consent to act as Auditors dated 31 May 2017 from Moore Stephens LLP.
NOTICE OF EIGHTEENTH ANNUAL GENERAL MEETING

SMART SOCIETY, SMART L IFE | 127
Explanatory Notes: (cont’d)
(vi) Resolution No. 7, if passed, will empower the Directors from the date of the passing of Ordinary Resolution No. 7 to the date of the next Annual General Meeting, to issue shares in the capital of the Company and to make or grant instruments (such as warrants or debentures) convertible into shares, and to issue shares in pursuance of such instruments, up to an amount not exceeding in total 50% of the issued shares (excluding treasury shares and shares (if any) held by a subsidiary) in the capital of the Company, with a sub‑limit of 20% of the issued shares (excluding treasury shares and shares (if any) held by a subsidiary) for issues other than on a pro‑rata basis to shareholders.
(vii) Resolution 8, if passed, will empower the Directors, from the date of this Meeting until the next Annual General Meeting, or the date by which the next Annual General Meeting is required by law to be held or when varied or revoked by the Company in general meeting, whichever is the earlier, to offer and grant options and allot and issue shares in the Company pursuant to the 2011 Scheme of up to a number not exceeding in total 15% of the issued shares in the capital of the Company from time to time pursuant to the exercise of the options under the 2011 Scheme.
Notes:
(a) A member of the Company shall be entitled to appoint not more than two proxies to attend and vote at the general meeting of the Company. A proxy need not be a member of the Company.
(b) Where a member appoints two proxies, the appointments shall be invalid unless he/she specifies the proportion of his/her shares (expressed as a percentage of the whole) to be represented by each proxy.
(c) Pursuant to Section 181 of the Companies Act, Cap. 50 of Singapore, any member who is a Relevant Intermediary may appoint more than two proxies, but each proxy must be appointed to exercise the rights attached to a different share or shares held by him (which number and class of shares shall be specified).
*Relevant Intermediary is:
i. a banking corporation licensed under the Banking Act (Cap.19) or a wholly-owned subsidiary of such a banking corporation, whose business includes the provision of nominee services and who holds shares in that capacity; or
ii. a person holding a capital markets services license to provide custodial services for securities under the Securities and Futures Act (Cap.289) and who holds shares in that capacity; or
iii. the Central Provident Fund Board established by the Central Provident Fund Act (Cap.36), in respect of shares purchased on behalf of CPF investors.
(d) A corporation which is a member may appoint an authorised representative or representatives in accordance with Section 179 of the Companies Act, Cap. 50 of Singapore to attend and vote for and on behalf of such corporation.
(e) The instrument appointing a proxy or proxies must be under the hand of the appointor or of his attorney duly authorised in writing. Where the instrument appointing a proxy or proxies is executed by a corporation, it must be executed under its common seal or signed on its behalf by an officer or attorney duly authorised in writing.
(f) Where an instrument appointing a proxy is signed on behalf of the appointor by the attorney, the letter or power of attorney or a duly certified copy thereof must (failing previous registration with the Company) be lodged with the instrument of proxy, failing which the instrument may be treated as invalid.
NOTICE OF EIGHTEENTH ANNUAL GENERAL MEETING

128 | Trek 2000 International Ltd • Annual Report 2016
Notes: (cont’d)
(g) The instrument appointing a proxy or proxies must be deposited at the registered office of the Company at 30 Loyang Way, #07-13/14/15 Loyang Industrial Estate, Singapore 508769, not less than seventy-two (72) hours before the time appointed for holding the Annual General Meeting.
(h) A Depositor’s name must appear on the Depository Register maintained by The Central Depository (Pte) Limited not less than 72 hours before the time fixed for holding the AGM in order for the Depositor to be entitled to attend and vote at the AGM.
PERSONAL DATA PRIVACY
By submitting an instrument appointing a proxy(ies) and/or representative(s) to attend, speak and vote at the Annual General Meeting and/or any adjournment thereof, a member of the Company (i) consents to the collection, use and disclosure of the member’s personal data by the Company (or its agents or service providers) for the purpose of the processing, administration and analysis of the Company (or its agents or service providers) of proxies and/or representatives appointed for the Annual General Meeting (including any adjournment thereof) and the preparation and compilation of the attendance lists, minutes and other documents relating to the Annual General Meeting (including any adjournment thereof), and in order for the Company (or its agents or service providers) to comply with any applicable laws, listing rules, regulations and/or guidelines (collectively, the “Purposes”), (ii) warrants that where the member discloses the personal data of the member’s proxy(ies) and/or representative(s) to the Company (or its agents or service providers), the member has obtained the prior consent of such proxy(ies) and/or representative(s) for the collection, use and disclosure by the Company (or its agents or service providers) of the personal data of such proxy(ies) and/or representative(s) for the Purposes, and (iii) agrees that the member will indemnify the Company in respect of any penalties, liabilities, claims, demands, losses and damages as a result of the member’s breach of warranty.
NOTICE OF EIGHTEENTH ANNUAL GENERAL MEETING

TREK 2000 INTERNATIONAL LTD(Company Registration No. 199905744N)(Incorporated in the Republic of Singapore)
EIGHTEENTH ANNUAL GENERAL MEETING
Proxy Form
IMPORTANT:
CPF investors
1. For investors who have used their CPF monies to buy Trek 2000 International Ltd’s shares, the Annual Report is forwarded to them at the request of the CPF Approved Nominees and is sent solely FOR INFORMATION ONLY.
2. This Proxy Form is not valid for use by CPF investors and shall be ineffective for all intents and purposes if used or purported to be used by them.
3. A Relevant Intermediary may appoint more than two proxies to attend the Annual General Meeting and vote. (Please see Note 4 for the definition of Relevant Intermediary)
*I / We, (Name) (NRIC/Passport no.)
of (Address)
being *a member/members of Trek 2000 International Ltd (the “Company”), hereby appoint:
Name NRIC/Passport No. Proportion of Shareholding(s) to be presented by Proxy
No. of Shares %
Address
*and/or
Name NRIC/Passport No. Proportion of Shareholding(s) to be presented by Proxy
No. of Shares %
Address
or failing him/her, the Chairman of the Meeting as *my/our *proxy/proxies to vote for *me/us on *my/our behalf at the Eighteenth Annual General Meeting (“AGM”) of the Company to be held at 30 Loyang Way, #07‑13/14/15 Loyang Industrial Estate, Singapore 508769 on Thursday, 29 June 2017 at 10:00 a.m, and at any adjournment thereof.
*I/We direct *my/our *proxy/proxies to vote for or against the Ordinary Resolutions to be proposed at the AGM as indicated hereunder. If no specific directions as to voting are given, the *proxy/proxies will vote or abstain from voting at *his/her/their discretion.
No. Ordinary Resolutions For# Against#
1. To receive and adopt the Audited Financial Statements for the financial year ended 31 December 2016 and the Directors’ Statement and the Auditors’ Report thereon.
2. To approve the payment of Directors’ fees of S$92,292 for the financial year ended 31 December 2016.
3. Re‑election of Mr. Tan Henry @ Henn Tan as a Director of the Company.4. Re‑election of Ms Celine Cha Mui Hwang as a Director of the Company.5. Re‑elecion of Mr Loh Yih as a Director of the Company.6. To appoint Moore Stephens LLP as Auditors of the Company in place of
the retiring auditors, Ernst & Young LLP and to authorise the Directors to fix their remuneration.
7. Authority for Directors to allot and issue shares.8. Authority for Directors to offer and grant options and allot shares,
pursuant to the Trek 2000 International Ltd Share Option Scheme 2011.
Dated this __________ day of ____________________ , 2017
____________________________________________Signature(s) of Member(s)/ Common Seal
Total number of Shares in: No. of Shares held(a) CDP Register(b) Register of Members
* Delete accordingly # If you wish to use all your votes “For” or “Against”, please indicate with an “X” within the box provided. Otherwise, please
indicate number of votes “For” or “Against” for each resolution within the box provided.
IMPORTANT: Please read notes overleaf

Notes:
1. Please insert the total number of shares held by you. If you have shares entered against your name in the Depository Register (as defined in Section 81SF of the Securities and Futures Act, Chapter 289 of Singapore), you should insert that number of shares. If you have shares registered in your name in the Register of Members of the Company, you should insert that number of shares. If you have shares entered against your name in the Depository Register and shares registered in your name in the Register of Members, you should insert the aggregate number of shares entered against your name in the Depository Register and registered in your name in the Register of Members. If no number is inserted, the instrument appointing a proxy or proxies shall be deemed to relate to all the shares held by you.
2. A member of the Company shall be entitled to appoint not more than two proxies to attend and vote at the general meeting of the Company. A proxy need not be a member of the Company.
3. Where a member appoints two proxies, the appointments shall be invalid unless he/she specifies the proportion of his/her shares (expressed as a percentage of the whole) to be represented by each proxy.
4. A member who is a Relevant Intermediary may appoint more than two proxies, but each proxy must be appointed to exercise the rights attached to a different share or shares held by him (which number and class of shares shall be specified).
*Relevant Intermediary is:
(a) a banking corporation licensed under the Banking Act (Cap.19) or a wholly-owned subsidiary of such a banking corporation, whose business includes the provision of nominee services and who hold shares in that capacity; or
(b) a person holding a capital markets services license to provide a custodial services for securities under the Securities and Futures Act (Cap.289) and who holds shares in that capacity; or
(c) the Central Provident Fund Board established by the Central Provident Fund Act (Cap.36), in respect of shares purchased on behalf of CPF investors.
5. A corporation which is a member may appoint an authorised representative or representatives in accordance with Section 179 of the Companies Act, Cap. 50 of Singapore to attend and vote for and on behalf of such corporation.
6. The instrument appointing a proxy or proxies must be under the hand of the appointor or of his attorney duly authorised in writing. Where the instrument appointing a proxy or proxies is executed by a corporation, it must be executed under its common seal or signed on its behalf by an officer or attorney duly authorised in writing.
7. Where an instrument appointing a proxy is signed on behalf of the appointor by the attorney, the letter or power of attorney or a duly certified copy thereof must (failing previous registration with the Company) be lodged with the instrument of proxy, failing which the instrument may be treated as invalid.
8. The instrument appointing a proxy or proxies must be deposited at the registered office of the Company at 30 Loyang Way, #07-13/14/15 Loyang Industrial Estate, Singapore 508769, not less than seventy-two (72) hours before the time appointed for holding the Annual General Meeting.
9. An investor who buys shares using CPF monies (‘‘CPF Investor”) and/or SRS monies (“SRS Investor”) (as may be applicable) may attend and cast his vote(s) at the Meeting in person. CPF and SRS Investors who are unable to attend the Meeting but would like to vote, may inform their CPF and/or SRS Approved Nominees to appoint the Chairman of the Meeting to act as their proxy, in which case, the CPF and SRS Investors shall be precluded from attending the Meeting.
General:
The Company shall be entitled to reject the instrument appointing a proxy or proxies if it is incomplete, improperly completed or illegible or where the true intentions of the appointor are not ascertainable from the instructions of the appointor specified in the instrument appointing a proxy or proxies. In addition, in the case of members whose shares are deposited with The Central Depository (Pte) Limited, the Company may reject any instrument appointing a proxy or proxies lodged if the member, being the appointor, is not shown to have shares entered against his name in the Depository Register as at seventy-two (72) hours before the time appointed for holding the Annual General Meeting as certified by The Central Depository (Pte) Limited to the Company.
Personal Data Privacy:
By submitting an instrument appointing a proxy(ies) and/or representative(s), the members accept and agree to the personal data privacy terms set out in the Notice of Annual General Meeting dated 14 June 2017.

This page has been intentionally left blank.

This page has been intentionally left blank.

SMART SOCIETY, SMART L IFE | 21
CloudStringers Eco-Solutions
COMPUTERS IMAGING SURVEILLANCE MEDICAL
ThumbDrive® Cloud SSD Flucard® Ultra Ai-Ball Ai-Ball PASSmart Sensor for diapers
Trek Patented Innovations

30 Loyang Way #07-13/14/15 Loyang Industrial Estate Singapore 508769Telephone:(65) 6546 6088 • Fax: (65) 6546 6066
www.trek2000.com.sg
TREK 2000 INTERN
ATION
AL LTD
| AN
NU
AL REPO
RT 2016