Smart nanohydrogels for controlled release of food ... · Smart nanohydrogels for controlled...
184
Smart nanohydrogels for controlled release of food preservatives por Clara Fuciños González Memoria para optar al título de Doctora por la Universidad de Vigo con Mención de Doctora Internacional Ourense 2012 1
Transcript of Smart nanohydrogels for controlled release of food ... · Smart nanohydrogels for controlled...

Smart nanohydrogels for controlled release of food preservatives
por Clara Fuciños González
Memoria para optar al título de Doctora por la Universidad de Vigo con Mención de
Doctora Internacional
Ourense 2012
1


3
Los doctores María Luisa Rúa Rodríguez, Profesora Titular, y Lorenzo Miguel Pas-
trana Castro, Catedrático, del Departamento de Química Analítica y Alimentaria de la
Universidad de Vigo,
CERTIFICAN:
que la memoria titulada: “Smart nanohydrogels for controlled release of food preser-
vatives”,
presentada por Doña Clara Fuciños González para optar al Grado de Doctor Inter-
nacional en Ciencia y Tecnología de Alimentos, fue realizada en el Departamento de
Química Analítica y Alimentaria de la Facultad de Ciencias de Ourense (Universidad de
Vigo) bajo nuetra dirección, y considerando que constituye trabajo de Tesis Doctoral,
autorizamos su presentación en la Universidad de Vigo.
Para que así conste, expedimos y firmamos el siguiente certificado en Ourense, a 3
de Septiembre de 2012.
Fdo. María Luisa Rúa Rodríguez Fdo. Lorenzo Miguel Pastrana Castro


Contents
Enfoque, justificación y objetivos 9
Chapter 1. Introduction 13
1.1. Pimaricin 14
1.2. Active and smart packaging 18
1.3. Food nanotechnology 31
1.3.1. Nanomaterial’s legal regulations 38
1.4. Smart nanohydrogels as active packaging 40
1.4.1. Volume phase transitions of hydrogels 41
1.4.2. N-isopropylacrylamide based hydrogels 42
1.4.2.1. N-isopropylacrylamide based nanohydrogels 44
Chapter 2. Physico-chemical characterization of poly (N-isopropylacrylamide)
nanohydrogels for the pimaricin controlled release 47
2.1. Materials and Methods 47
2.1.1. Materials 47
2.1.2. Synthesis of PNIPA/AA nanohydrogels 47
2.1.3. Measurement of mean particle size and zeta potential 49
2.1.4. Measurement of gel phase transition temperature 49
2.1.5. Statistical analysis 49
2.2. Results and Discussion 49
2.2.1. Mean particle size and zeta potential 49
2.2.2. Thermodynamic properties associated with the nanohydrogel collapse 53
5

6 CONTENTS
2.2.2.1. Temperature-induced collapse 53
2.2.2.2. Simultaneous temperature and pH-induced collapse 59
2.2.2.3. Simultaneous temperature and methanol-induced collapse 62
Chapter 3. Functional characterization of poly (N-isopropylacrylamide)
nanohydrogels for the pimaricin controlled release 65
3.1. Materials and Methods 65
3.1.1. Materials 65
3.1.2. Preparation of pimaricin-loaded PNIPA/AA nanohydrogels 65
3.1.3. Pimaricin loading efficiency in PNIPA/AA nanohydrogels 66
3.1.4. Pimaricin release from PNIPA/AA nanohydrogels 67
3.1.5. Pimaricin detection and quantification 68
3.1.6. Statistical analysis 68
3.2. Results and Discussion 68
3.2.1. Pimaricin loading efficiency in PNIPA/AA nanohydrogels 68
3.2.1.1. Effect of the cross-linking agent content, the incorporation time and the
acrylic acid content 68
3.2.1.2. Effect of solvent 70
3.2.2. Pimaricin release from PNIPA/AA nanohydrogels 71
3.2.2.1. Effect of the cross-linking agent content, the incorporation time and the
acrylic acid content 73
3.2.3. Pimaricin release from the PNIPA(5) nanohydrogel 75
3.2.4. Pimaricin release from the PNIPA-20AA(5) nanohydrogel 77
3.2.5. Release modelling 78
3.2.6. Effect of temperature and pH on the release of pimaricin from
nanohydrogels 81
3.2.7. Sustained Controlled Release 86

CONTENTS 7
Chapter 4. Evaluation of antimicrobial effectiveness of pimaricin-loaded
thermosensitive nanohydrogels in cheeses from Arzúa-Ulloa DOP 89
4.1. Material and Methods 90
4.1.1. Preparation of pimaricin-loaded nanohydrogel 90
4.1.2. Inhibition studies employing a food model system 90
4.1.3. Preparation of Arzúa-Ulloa DOP cheeses coated with pimaricin-loaded
PNIPA nanohydrogels 91
4.1.4. Physico-chemical cheese analysis 92
4.1.5. Microbiological analysis 92
4.1.5.1. DNA extraction 93
4.1.5.2. Sensitivity, detection limit and linearity of the qPCR assay 93
4.1.5.3. qPCR assay 94
4.1.6. Statistical analysis 94
4.2. Results and Discussion 95
4.2.1. Inhibition studies employing food model systems 95
4.2.2. Effect of nanohydrogel coating on cheeses from Arzúa-Ulloa DOP 97
4.2.3. Weight loss studies 98
4.2.4. Water activity studies 101
4.2.5. Colour studies 101
4.2.6. pH evolution 104
4.2.7. Microbiological control of pimaricin-loaded nanohydrogel coating during
cheese storage 104
4.2.8. Microbiological analysis by quantitative polymerase chain reaction (qPCR)
of cheeses from Arzúa-Ulloa DOP coated with pimaricin-loaded
nanohydrogel 108
Chapter 5. Evaluation of antimicrobial effectiveness of pimaricin-loaded
thermosensitive nanohydrogels in grape juice 113

8 CONTENTS
5.1. Material and Methods 113
5.1.1. Materials 113
5.1.2. Pimaricin detection by reverse phase high performance liquid
chromatography (RP-HPLC) 114
5.1.3. Analysis of pimaricin degradation 115
5.1.4. Dose-response curves 116
5.1.5. Inhibition studies 116
5.1.5.1. Preparation of pimaricin-loaded nanohydrogel 116
5.1.5.2. Preparation of indicator microoganism suspension 117
5.1.5.3. Growth inhibition assay 118
5.1.6. Growth modelling 118
5.1.7. Statistical analysis 119
5.2. Results and Discussion 120
5.2.1. Pimaricin stability in different matrices 120
5.2.2. Assessment of efficacy of free pimaricin to control microbial growth
spoilage 122
5.2.3. Efficacy of nanohydrogel-pimaricin system to control microbial growth
spoilage in a food model system 124
5.2.4. Control of grape juice spoilage employing pimaricin-loaded nanohydrogels127
Chapter 6. Sumario y conclusiones finales 131
Chapter 7. Perspectivas 145
Bibliography 149
ANEXO 175

Enfoque, justificación y objetivos
En la actualidad la gran mayoría de los alimentos se comercializan envasados con la
finalidad principal de protegerlos y aislarlos del entorno para que conserven sus carac-
terísticas físicas, químicas y microbiológicas ya que se trata de productos que sufren un
rápido deterioro durante el almacenamiento por causa de la acción de organismos vivos
(principalmente microorganismos) o de condiciones ambientales como la temperatura
y la humedad. Sin embargo, los cambios en las formas de vida de las sociedades in-
dustriales han propiciado que el envase satisfaga también otras necesidades adicionales
relacionadas con la comunicación, el marketing y la conveniencia para el consumidor, de
modo que, hoy en día, los envases son uno de los factores determinantes de la elección
de compra por parte de los consumidores. Estas nuevas necesidades han propiciado
un gran desarrollo tecnológico del envasado de alimentos que ha supuesto cambios pro-
fundos en el diseño, los materiales y los procesos de envasado. Estos avances permiten
que ahora, por ejemplo, el consumidor disponga de productos más naturales, menos pro-
cesados o que puedan ser cocinados o consumidos en el propio envase y en porciones
adaptadas a sus necesidades de consumo.
Este es el contexto en el que en los últimos años el concepto de envasado activo
de alimentos se ha desarrollado e implementado en la práctica. Así, hoy se dispone
de materiales de envasado y dispositivos que interaccionan con el alimento o con la
atmósfera que le rodea induciendo cambios positivos en ellos.
Uno de los aspectos del envasado activo de alimentos en los que con mayor inten-
sidad se ha trabajado es el de los envases antimicrobianos, de los que ya existen incluso
9

10 ENFOQUE, JUSTIFICACIÓN Y OBJETIVOS
aplicaciones comerciales. Se trata de materiales que, al incorporar sustancias antimi-
crobianas de naturaleza muy diversa (plata, etanol, antibióticos) y en algunos casos
liberarlas, son capaces de inhibir el crecimiento microbiano en los alimentos en contacto
con ellos.
A pesar de ello, hasta la fecha, cuando existe liberación de las sustancias antimicro-
bianas al alimento ésta se hace generalmente mediante mecanismos de difusión pasiva,
de modo que no existe un control efectivo real del proceso más que aquel que deter-
mine las constantes de difusión durante las síntesis de los materiales y el gradiente de
concentración del antimicrobiano entre el material y el alimento. Así, en estos sistemas
se da la paradoja de que en el momento en el que el alimento es más seguro desde el
punto de vista microbiológico que es cuando se envasa recién procesado, es cuando el
flujo de antimicrobiano desde el envase al alimento es mayor. Esta poco satisfactoria
circunstancia es particularmente relevante cuando se trata de alimentos refrigerados o
incluso congelados ya que en estos casos el mantenimiento de la cadena de frío suele ser
suficiente para asegurar que el alimento llega al consumidor en condiciones adecuadas
y sólo si se rompe esta cadena y la temperatura del producto alcanza valores adecuados
para el crecimiento microbiano existe un riesgo real. Como no siempre se puede garanti-
zar la integridad de la cadena del frío los productores de alimentos optan por la garantía
adicional que le ofrece el envasado activo aún siendo conscientes que estará en muchos
casos liberando innecesariamente el conservante hacia el alimento.
Por todo ello se hace necesario diseñar sistemas de aplicación en el envasado activo
de alimentos que permitan liberar los antimicrobianos bajo demanda sólo cuando sea
necesario y como respuesta a cambios ambientales que puedan suponer un riesgo para
la seguridad y estabilidad del alimento.
Precisamente y con este enfoque esta memoria explora la posibilidad del uso de nano-
hidrogeles "inteligentes" para la liberación controlada de conservantes alimentarios. Así,
el principal objetivo de esta tesis es el estudio de la capacidad los nanohidrogeles de poli
(N-isopropilacrilamida) (PNIPA) para trasportar y liberar de pimaricina como respuesta

ENFOQUE, JUSTIFICACIÓN Y OBJETIVOS 11
a estímulos externos de temperatura así como el estudio de la efectividad antimicrobi-
ana del sistema propuesto con el fin de evaluar su potencial en el envasado activo de
alimentos.
En el Capitulo 1 el principal objetivo es proporcionar una visión general del es-
tado actual del envasado activo de alimentos y las aportaciones que la nanotecnología
puede hacer dentro de este campo. o de este campo. Asimismo se pretende describir
las principales ventajas e inconvenientes del uso de la pimaricina como substituto de
conservantes químicos usados en el tratamiento de alimentos, así como las principales
características de los nanohidrogeles de poli (N-isopropilacrilamida) que los hacen ade-
cuados para el transporte y liberación de pimaricina y para su posterior aplicación en el
envasado activo de alimentos.
En el Capítulo 2 el principal objetivo es la caracterización de los nanohidrogeles de
PNIPA sintetizados con diferente grado de hidrofilia mediante la adición de ácido acrílico
(AA) como comonómero con el fin de entender mejor los factores que afectan a la libera-
ción de pimaricina desde estos nanohidrogeles. El primer subobjetivo es el estudio del
tamaño de partícula y carga superficial de los nanohidrogeles sintetizados. El segundo
subobjetivo es el estudio de las propiedades termodinámicas de los nanohidrogeles de
PNIPA/AA en función de su composición y bajo diferentes condiciones ambientales.
En el Capítulo 3 el principal objetivo es la evaluación de la capacidad de los na-
nohidrogeles de PNIPA/AA para transportar y liberar pimaricina en función de su com-
posición y de las condiciones ambientales con el fin de evaluar su posible aplicación en
el envasado activo de alimentos. El primer subobjetivo es evaluar la capacidad de los
nanohidrogeles de PNIPA/AA para encapsular pimaricina en función de la composición
del nanohidrogel. El segundo subobjetivo es evaluar la capacidad de los nanohidrogeles
de PNIPA/AA para liberar pimaricina como respuesta a estímulos externos (temperatura
y pH) en función de su composición.
En el Capítulo 4 el principal objetivo es evaluar la efectividad del nanohidrogel car-
gado con pimaricina para controlar la contaminación por hongos en queso. Para ello

12 ENFOQUE, JUSTIFICACIÓN Y OBJETIVOS
el primer subobjetivo es la evaluación de la efectividad antimicrobiana en sistemas mo-
delo basados en placas de agar contaminadas con un microorganismo indicador y al-
macenadas en condiciones favorables y desfavorables para la estabilidad química de la
pimaricina con el fin de evaluar el efecto protector del nanohidrogel. El segundo sub-
objetivo es la evaluación de la efectividad antimicrobiana en un alimento real con el
fin de controlar la contaminación de quesos de la DOP Arzúa-Ulloa almacenados bajo
diferentes condiciones de térmicas simulando una rotura en la cadena de frío. El tercer
subobjetivo es la puesta a punto de un método de cuantificación de los hongos totales
en muestras de queso empleando PCR cuantitativa.
En el Capítulo 5 el principal objetivo es evaluar la efectividad del nanohidrogel car-
gado con pimaricina para controlar la contaminación por hongos en zumo de uva. Para
ello el primer subobjetivo es la puesta a punto de un método para cuantificar pimaricina
mediante cromatografía líquida en medio de cultivo y en zumo de uva. El segundo subob-
jetivo es la construcción de curvas dosis-respuesta para el cálculo de la dosis inhibitoria
50 (IC50) de la pimaricina en medio de cultivo y en zumo de uva. El tercer subobjetivo es
la evaluación de la actividad antimicrobiana en sistemas modelo basados en un medio
de cultivo contaminado con un microorganismo indicador. El cuarto subobjetivo es la
evaluación de la actividad antimicrobiana antimicrobiana en una bebida real con el fin
de controlar la contaminación de zumo de uva almacenados bajo condiciones de abuso
térmico.

CHAPTER 1
Introduction
The global food packaging industry has a lot to contribute not only in addressing food
losses but also in ensuring food safety as well as enhancing global food trade, which is
a key to economic development of varying economies. If there is an industry sector that
is equally, if not more dynamic than the food sector, it is none other than the packaging
industry. Food accounts for 50% of the global consumer packaging industry valued at
US$ 380 billion as of 2009. If the beverage sector is to be added, that will even increase
to 69% [115].
The continued quest for innovation in food and beverage packaging is mostly driven
by consumer needs and demands influenced by changing global trends, such as in-
creased life expectancy, fewer organizations investing in food production and distribu-
tion, and regionally abundant and diverse food supply [22]. All this combined with the
interest of consumers for healthy eating combined with its active lifestyles is the key to
the success of the ready-to-eat food products. However the stability of these products is
compromised due to contamination by moulds and yeasts generating a serious problem
of preservation. Standard thermal treatments do not allow maintaining the organoleptic
characteristics of the product and chemical preservatives like sulphites may cause al-
lergy problems. Therefore, in recent years, the interest in antimicrobials for extending
the shelf life of food products has focused on using natural substances such as essential
oils (allyl isotiocyanate), bacteriocins (nisin) and pimaricin.
13

14 1. INTRODUCTION
1.1. Pimaricin
Pimaricin (natamycin) is a polyene macrolide fungicide produced by submerged ae-
robic fermentation of Streptomyces natalensis and related species. It is widely used in
the food industry as a preservative on the surface of cheese, fruits and other non-sterile
products, such as meat and sausages [61, 17]. Pimaricin presents a broad spectrum of
activity and any development of resistance has not been reported.
Pimaricin (MW = 665.75 g mol-1) forms a cylindrical structure due to the alignment of
the hydroxyl groups of its amphipathic chain towards each other (Figure 1). The exterior
of the cylinder is completely non-polar.
FIGURE 1. Pimaricin molecule
Pimaricin has several advantages to use as food preservative: it is not toxic; it has no
influence on the taste and appearance; it has a favourable consumer perception because
it is a natural ingredient; it is active a low concentrations; and it has no antibacterial
activity so the natural ripening process in fermented products is not influenced in a
negative way for its action [183].
Nevertheless some important technological disadvantages limit its food applications:
pimaricin low solubility reduces its use to surface treatments applications; and the

1.1. PIMARICIN 15
chemical stability in acidic conditions and under light radiation is low. This last disad-
vantage is important in food products that are normally exposed to high-intensity fluo-
rescent lighting in the retail dairy case, until consumer purchase and storage [99, 183].
The mode of action of pimaricin is directly related to the presence of sterols in the
cell membrane of organisms. Polyene antibiotics binds irreversibly to sterol in the cell
membranes, forming a polar pore through which small ions such as K+, H+, amino acids
and other metabolites can pass freely, disrupting the cell’s ionic control and killing the
cell [183]. However, Welscher et al. [204, 205] appointed that pimaricin did not change
the permeability in ergosterol containing membranes as its mode of action are related
to the interference in the process of vacuole fusion in a sterol dependent manner and
the inhibition of the function of the transport proteins preventing the uptake of different
important substrates.
Pimaricin has minimum inhibitory concentration (MIC) value less than 10 ppm and,
in general, yeasts are more sensitive than moulds with MIC values for most yeast even
lower than 3 ppm. Under normal hygienic and processing conditions 30 ppm of dissolved
pimaricin is enough to prevent fungal growth, because the solubility is much higher
than the MIC value [183]. Türe et al. [190] reported a MIC value for pimaricin included
into methyl cellulose and wheat gluten films for A. niger and P. roquefortii of 0.2 mg
and 0.1 mg per g of solution, respectively. Fajardo et al. [59] obtained a minimum
inhibitory concentration of pimaricin included into chitosan films applied in cheeses
of 0.50, 0.50, 0.25 and 0.06 mg mL-1 for A. niger, P. crustosum, P. roquefortii and P.
commune, respectively.
Pimaricin was approved as a GRAS (Generally Recognized As Safe) agent by Food
and Drug Administration (FDA) in the United States [183] and also designated as a
natural preservative by the European Union (E-235). The "Codex General Standard for
Food Additives" (GSFA, Codex STAN 192-1995) sets forth the conditions under which
permitted food additives may be used in all foods. GSFA provisions for Pimaricin are
listed in Table 1 on the next page.

16 1. INTRODUCTION
TABLE 1. «Codex General Standard for Food Additives» (GSFA) provisionsfor pimaricin
Food category Maximum Level Notes
Cheese analogues 40 mg kg-1 1,2
Cured (including salted) and dried non-heat
treated processed comminuted meat, poultry,
and game products
20 mg kg-1 1,3
Cured (including salted) and dried non-heat
treated processed meat, poultry, and game
products in whole pieces or cuts
6 mg kg-1
Processed cheese 40 mg kg-1 1,2
Ripened cheese 40 mg kg-1 1,2
Unripened cheese 40 mg kg-1 1,2
Whey protein cheese 40 mg kg-1 1,2
1Surface treatment.
2Equivalent to 2 mg dm-2 surface application to a maximum depth of 5 mm.
3Equivalent to 1 mg dm-2 surface application to a maximum depth of 5 mm.
Pimaricin is mainly used in cheese, so one of the most important problems for the
quality and shelf life of cheese is mould development on the surface because of the post-
process contamination during handling and packaging of the product [136] leading to

1.1. PIMARICIN 17
economical losses and health problems owing to mycotoxins [219]. Pimaricin is normally
applied in these products as an aqueous suspension by spraying the surface or soaking
the cheese in a solution of pimaricin [192].
At present the sulfur dioxide (SO2) is one of the most widely used substances in
the preservation of beverages such as wine, to prevent rancidity and oxidative deteriora-
tion by spoilage microorganism. However, allergies caused by SO2-derived compounds,
namely the sulfites, are becoming more frequent. Although in the literature are still
few studies about these of pimaricin for preventing contamination of beverages as pi-
maricin is not yet approved for use in drinks in beverages in Spain and the European
Union, its use might be an alternative to prolong the shelf life and improve the quality of
these products. Shirk and Clark [173] use pimaricin in fresh orange juice preventing its
spoilage during 8 weeks. Bärwald [9] use pimaricin in apple juice obtaining the fully in-
hibition of inoculated yeast during 25 days. Medina et al. [122] found that the presence
of pimaricin in grape juice prevented A. carbonarius growth, main fungus responsible
for contaminating wine, grapes, grape juice and vine fruits, when applied to the medium
at a concentration of 20 ng ml-1 and it has also been shown that natamycin is able to
control OTA production as well.
However, pimaricin, like other food preservatives, is usually added at high concen-
trations to food bulk during manufacturing in order to extend the shelf life, keeping
an effective concentration during all the storage, although initial microbial load in a
processed food is usually low. Nevertheless it is possible to reduce preservative concen-
tration (and consequently consumers intake) maintaining suitable levels of food safety by
using a delivery system as proposed in active packaging technologies. In addition, when
there is continuous contact between preservatives and microorganisms, microbial resis-
tance can develop and so the preservative becomes ineffective. This occurs frequently
when antimicrobials are added directly to the food product. Smart active packaging can
reduce this effect.

18 1. INTRODUCTION
1.2. Active and smart packaging
Traditional food packaging are passive and inert barriers designed to protect food
against adverse effects of the environment that acts protecting food from external influ-
ences, like microorganisms, oxygen, off-odours, light etc. and, by doing so, guarantee-
ing convenience in food handling and preserving the food quality for an extended time
period. The key safety objective for these traditional materials in contact with foods is to
be as inert as possible, i.e., there should be a minimum of interaction between food and
packaging [50].
In the last decades, however, one of the most innovative developments in the area of
food packaging is the active and smart packaging based on the interaction of packages
with food and environment playing a dynamic role in food preservation [22, 50].
The purpose of active packaging is the extension of the shelf life of the food and the
maintenance and even the improvement of its quality [197]. On the other hand, smart
packaging responds to environmental conditions or repairs them or alerts the consumers
to contamination and/or the presence of pathogens [165]. However, there is an important
distinction between package functions that are smart, and those that become active in
response to a triggering event, for example, filling, exposure to ultraviolet radiation,
release of pressure etc., and then continue until the process is exhausted [102].
Good examples of smart packaging are the so-called time–temperature indicators
(TTIs) that show an irreversible change in a physical characteristic, usually colour or
shape, in response to temperature changes. These observable changes are expected to
mimic and correlate with the change of a quality parameter of the food that experiences
the same temperature history [102]. Colorimetric indicators can be incorporated into a
food packaging materials or attached to the inside or outside of a package to detect and
monitor changes in the conditions of packed products by visual colour variations [22].

1.2. ACTIVE AND SMART PACKAGING 19T
AB
LE
2.
Ove
rvie
wof
stu
dies
onsm
art
pack
agin
gte
chn
olog
ies
for
food
appl
icat
ion
s(b
ased
onK
usw
andi
etal
.[1
02])
Sm
art
pack
agin
g
syst
em
Tec
hn
olog
yW
orki
ng
prin
cipl
eA
pplic
atio
nR
efer
ence
s
Tim
e-te
mpe
ratu
re
indi
cato
rs
ther
moc
hro
mic
dye
colo
ur
chan
ges
ofa
hea
t-se
nsi
tive
dye
orpi
gmen
tlik
ean
thoc
yan
in
Plas
tic
con
tain
ers
ofpo
uri
ng
syru
p
and
oran
geju
ice
pack
labe
ls
214,
113,
166
mel
tin
gan
ddi
ffu
sion
ofa
safe
dye
(Mon
itor
Mar
kTM
,T
imes
trip
s®)
froz
enor
refr
iger
ated
food
s:fr
esh
seaf
ood,
fres
hpr
odu
ce,ai
rlin
e
cate
rin
g,sc
hoo
lmea
ls,h
ome
deliv
ery
diet
s,fo
odre
taili
ng,
rest
aura
nts
—fr
idge
and
free
zer
chec
kin
gag
ain
stpo
wer
outa
ges—
,
pizz
ado
ugh
deliv
ery
180,
215
ther
moc
hro
mic
poly
mer
s
colo
ur
chan
ges
ofa
poly
mer
diac
etyl
ene
base
d(F
resh
-Ch
eck®
)
pre-
pack
edpe
rish
able
food
s21
0
enzy
mat
icre
acti
ons
colo
ur
chan
gedu
eto
the
reac
tion
of
alip
ase
plu
sa
pHin
dica
tin
gdy
e
and
the
subs
trat
e,co
nsi
stin
g
prim
arily
oftr
igly
ceri
des
(Ch
eckP
oin
t®)
beef
,po
ult
ry,po
rk,se
afoo
d,h
igh
valu
epa
ckag
edfr
uit
s,sa
lad
mix
es,
airl
ine
cate
rin
g,pr
epar
edfo
ods
216

20 1. INTRODUCTION
Sm
art
pack
agin
g
syst
em
Tec
hn
olog
yW
orki
ng
prin
cipl
eA
pplic
atio
nR
efer
ence
s
star
ch-i
odin
ecl
ath
rate
com
pou
nd
wh
ose
colo
rw
asac
cord
ing
toth
e
degr
eeof
poly
mer
izat
ion
inpr
esen
ce
ofam
ylas
e
diff
eren
tfo
odst
uff
s21
8
lact
icac
iddi
ffu
sion
colo
rch
ange
sas
soci
ated
wit
hth
e
pHva
riat
ion
fru
its
and
vege
tabl
es20
2
Mic
robi
algr
owth
indi
cato
rs
CO
2se
nso
rsco
lou
rch
ange
ofa
pH-d
yein
term
edia
te-m
oist
ure
dess
erts
,
pack
edfe
rmen
ted
vege
tabl
e
prod
uct
,sa
usa
gegr
avy
orto
mat
o
sou
p
135,
119,
151,
84
fluor
esce
nt
chan
geof
a
lum
inis
cen
t-dy
e
128
H2S
sen
sors
colo
ur
chan
geof
agar
ose
imm
obili
sed
myo
glob
in
pack
edpo
ult
ry17
8,17
9
Tot
alVol
atile
Bas
ic
Nit
roge
nco
mpo
un
ds
sen
sors
colo
ur
chan
geof
apH
sen
siti
vedy
e
(bro
moc
reso
lgre
en)i
npr
esen
ceof
basi
cvo
lati
lesp
oila
geco
mpo
un
ds
(Fre
shTag
®)
fish
and
seaf
ood
spoi
lage
142,
141,
211

1.2. ACTIVE AND SMART PACKAGING 21
Sm
art
pack
agin
g
syst
em
Tec
hn
olog
yW
orki
ng
prin
cipl
eA
pplic
atio
nR
efer
ence
s
food
born
epa
thog
ens
sen
sors
con
duct
ing
poly
mer
sw
her
eth
e
chan
gein
resi
stan
ceco
rrel
ates
to
the
amou
nt
ofga
sre
leas
eddu
rin
g
mic
robe
met
abol
ism
chic
ken
mea
tsp
oila
ge
7,67
silic
an
anos
pher
esfil
led
wit
ha
fluor
esce
nt
dye
that
ligh
tu
paf
ter
anti
body
-an
tige
nco
nta
ct
E.c
oli
0157
dete
ctio
nin
mea
t14
3
colo
ur
chan
ges
due
toth
em
icro
bial
prot
ein
bin
din
gw
ith
ady
elin
ked
wit
ha
silk
fibri
ls
food
pack
agin
g10
3
spec
ific
path
ogen
dete
ctio
nba
sed
onim
mu
noc
hem
ical
reac
tion
ina
bar
code
raw
mea
tpr
odu
cts,
juic
esan
d
beve
rage
ssp
oila
ge
71
Rip
enes
s
indi
cato
r
arom
ase
nso
rsco
lor
chan
gedu
eto
the
pres
ence
of
arom
asre
leas
eddu
rin
gfr
uit
ripe
nin
g(r
ipeS
ense
®)
fru
itpe
ars,
kiw
ifru
it,m
elon
,m
ango
,
avoc
ado,
and
oth
erst
one
fru
it
200,
213
eth
ylen
ese
nso
rsra
dio
freq
uen
cyid
enti
ficat
ion
tags
for
eth
ylen
ese
nsi
ng
peri
shab
lego
ods
and
food
stu
ffs
92

22 1. INTRODUCTION
Sm
art
pack
agin
g
syst
em
Tec
hn
olog
yW
orki
ng
prin
cipl
eA
pplic
atio
nR
efer
ence
s
Leak
indi
cato
rsO
2se
nso
rsco
lou
rch
ange
sdu
eto
the
oxid
atio
n
ofa
redo
xdy
ein
pres
ence
ofO
2
(Age
less
Eye
)
chill
-sto
red
food
,su
chas
fish
prod
uct
s,m
oist
cake
san
dbi
scu
its,
sau
sage
grav
yor
tom
ato
sou
p
119,
177,
212

1.2. ACTIVE AND SMART PACKAGING 23
Smart packaging systems may also include biosensors, which incorporate integrated
optics, immunoassay or surface chemistry, to detect chemicals, pathogens and toxins
in food [11, 159] , sensors to indicate fruit ripeness, or radio frequency identification
[201]. Table 2 on page 19 list some smart packaging that already exist in the market and
concepts that are under development.
Active packages (AP) are designed to prevent sensorial or toxicological problems and
improve product quality and acceptability, using the possible interactions between food
and package. Based on the nature of the expected spoilage, two categories of active
substances have been used in active packaging systems: scavengers and releasing .
Scavengers systems included those active on O2, ethylene, and moisture, of which
some are currently commercially available.
Within the second category release of active substances such as antimicrobials or
antioxidants are among the most referenced. A number of antimicrobial substances
have been including like organic acids (benzoic acid, sorbates), enzymes (lysozyme, glu-
cose oxidase), bacteriocins (nisin, pediocin), fungicides (benomyl, imazalil), polymers
(predominantly chitosan), natural extracts, antibiotics, triclosan, and silver compounds
[10]. There are commercially available active food packaging systems such as those
containing silver and triclosan as antimicrobial substances but their use in the food
packaging industry is limited, mainly due to concerns about their applicability and safety
[52, 198 from 10].
Examples of scientific studies on active agent delivery devices for food packaging
applications are listed in Table 3 on the next page.
In most of the cited examples active compounds are incorporated into polymeric
films that allow the active principle either to migrate into the food either to act on the
food surface. Synthetic polymers derived from petroleum have thus far dominated the
applications in antimicrobial food-packaging films (Polyethylene (PE), Polypropylene (PP),
Polyethylene terephthalate (PET), Polystyrene (PS), Ethylene-vinyl acetate (EVA), among
others) [10, 93].

24 1. INTRODUCTION
TA
BL
E3
.O
verv
iew
ofst
udi
eson
acti
vepa
ckag
ing
syst
ems
for
food
appl
icat
ion
s
Mat
rix
Bio
acti
veco
mpo
un
dA
pplic
atio
nR
efer
ence
s
Poly
eth
ylen
ela
ctoc
in70
5/la
ctoc
in
AL7
05/n
isin
inh
ibit
ion
ofLi
ster
iagr
owth
inre
ady-
to-e
at
prod
uct
s
118
syn
thet
icpe
ptid
eE
14LK
KE
.col
iin
hib
itio
n18
4
bact
erio
cin
32Y
byLa
ct.
curv
atus
inh
ibit
ion
ofL.
mon
ocyt
ogen
esgr
owth
duri
ng
the
stor
age
ofm
eat
prod
uct
s
120
Poly
eth
ylen
eco
ated
wit
h
hyd
roxy
prop
ylm
eth
ylce
llulo
se
nis
inK
.rhi
zoph
ilain
hib
itio
n43
Low
-den
sity
poly
eth
ylen
ebe
nzo
ican
hyd
ride
con
trol
ofsu
rfac
em
ould
grow
thin
food
ssu
chas
chee
se
207
sodi
um
ben
zoat
eB
.sub
tilis
inh
ibit
ion
info
odst
uff
s(c
hee
se,
sau
sage
,et
c.)
194
pota
ssiu
mso
rbat
eB
.sub
tilis
inh
ibit
ion
info
odst
uff
s(c
hee
se,
sau
sage
,et
c.)
194,
80
sodi
um
nit
rite
A.n
iger
and
B.s
ubtil
isin
hib
itio
nin
food
stu
ffs
(ch
eese
,sa
usa
ge,et
c.)
194
hex
amet
hyl
enet
etra
min
eim
prov
emen
tof
oran
geju
ice
and
cook
edh
amsh
elf
life
53

1.2. ACTIVE AND SMART PACKAGING 25
Mat
rix
Bio
acti
veco
mpo
un
dA
pplic
atio
nR
efer
ence
s
nis
inin
hib
itm
icro
bial
popu
lati
ondu
rin
gth
est
orag
eof
milk
121
Poly
amid
e-co
ated
low
-den
sity
poly
eth
ylen
e
tran
s-ci
nn
amal
deh
yde
anti
mic
robi
alac
tivi
tyin
food
prod
uct
s79
Poly
amid
eal
lyli
soth
iocy
anat
ean
tim
icro
bial
acti
vity
info
odpr
odu
cts
108
Hig
hde
nsi
typo
lyet
hyl
ene
pota
ssiu
mso
rbat
ean
tim
icro
bial
acti
vity
info
odpr
odu
cts
80
Poly
prop
ylen
epo
tass
ium
sorb
ate
anti
mic
robi
alac
tivi
tyin
food
prod
uct
s80
Poly
eth
ylen
ete
reph
thal
ate
sodi
um
ben
zoat
eB
.sub
tilis
inh
ibit
ion
info
odst
uff
s(c
hee
se,
sau
sage
,et
c.)
194
sodi
um
nit
rite
A.n
iger
and
B.s
ubtil
isin
hib
itio
nin
food
stu
ffs
(ch
eese
,sa
usa
ge,et
c.)
194
pota
ssiu
mso
rbat
eB
.sub
tilis
inh
ibit
ion
info
odst
uff
s(c
hee
se,
sau
sage
,et
c.)
194,
80
Poly
styr
ene
sodi
um
ben
zoat
eB
.sub
tilis
inh
ibit
ion
info
odst
uff
s(c
hee
se,
sau
sage
,et
c.)
194
sodi
um
nit
rite
A.n
iger
and
B.s
ubtil
isin
hib
itio
nin
food
stu
ffs
(ch
eese
,sa
usa
ge,et
c.)
194
26 1. INTRODUCTION
Mat
rix
Bio
acti
veco
mpo
un
dA
pplic
atio
nR
efer
ence
s
pota
ssiu
mso
rbat
eB
.sub
tilis
inh
ibit
ion
info
odst
uff
s(c
hee
se,
sau
sage
,et
c.)
194
Su
rfac
e-m
odifi
edpo
lyst
yren
ere
sin
syn
thet
icpe
ptid
e6K
8LE
.col
iO
157:
H7,
L.m
onoc
ytog
enes
,S
.aur
eus,
P.
fluo
resc
ens,
and
K.m
arxi
anus
inh
ibit
ion
5
Vin
ylac
etat
e-et
hyl
ene
nis
in/!
-toc
oph
erol
inh
ibit
ion
ofM
.flav
usgr
owth
and
reta
rdat
ion
lipid
oxid
atio
nin
the
inm
ilkcr
eam
104
Poly
lact
icac
idsi
lver
-bas
edan
tim
icro
bial
inh
ibit
ion
ofG
ram
-neg
ativ
eS
alm
onel
lasp
p.26
Poly
(mal
eic
acid
-co-
olefi
ne)
sodi
um
ben
zoat
eB
.sub
tilis
inh
ibit
ion
info
odst
uff
s(c
hee
se,
sau
sage
,et
c.)
194
sodi
um
nit
rite
A.n
iger
and
B.s
ubtil
isin
hib
itio
nin
food
stu
ffs
(ch
eese
,sa
usa
ge,et
c.)
194
pota
ssiu
mso
rbat
eB
.sub
tilis
inh
ibit
ion
info
odst
uff
s(c
hee
se,
sau
sage
,et
c.)
194
Poly
(eth
ylen
e-co
-met
hac
ryla
teac
id)
ben
zoic
acid
and
sorb
icac
idfu
nga
lgro
wth
inh
ibit
ion
(A.n
iger
and
Peni
cilli
um
sp.)
206
Poly
(vin
ylal
coh
ol)
lem
ongr
ass
esse
nti
aloi
lsE
.col
ian
dS
.aur
eus
inh
ibit
ion
105
lyso
zym
eM
.lys
odei
ktic
usin
hib
itio
n25

1.2. ACTIVE AND SMART PACKAGING 27
Mat
rix
Bio
acti
veco
mpo
un
dA
pplic
atio
nR
efer
ence
s
Eth
ylen
e-vi
nyl
alco
hol
silv
ern
itra
tein
hib
itio
nof
L.m
onoc
ytog
enes
and
Sal
mon
ella
spp.
indi
ffer
ent
food
prod
uct
s
132
Cel
lulo
sen
isin
inh
ibit
ion
ofpa
thog
ens
(Sta
phyl
ococ
cus
sp.
and
psyc
hro
trop
hic
bact
eria
)gro
wth
inch
eese
(slic
ed
moz
zare
lla)a
nd
ham
slic
ed
149,
163
pim
aric
inin
hib
itio
nof
mou
lds
and
yeas
tsin
slic
ed
moz
zare
llach
eese
149
lact
icin
3147
inh
ibit
ion
ofpa
thog
ens
grow
thin
chee
sean
dh
am
slic
ed
163
pedi
ocin
inh
ibit
ion
ofL.
inno
cua
and
Sal
mon
ella
sp.
grow
th
insl
iced
ham
160
Cel
loph
ane
nis
inin
hib
itio
nof
the
tota
laer
obic
bact
eria
grow
thin
fres
hve
alm
eat
74
Cel
lulo
seac
etat
ely
sozy
me
E.c
oli
inh
ibit
ion
70
Sol
idw
axpa
raffi
nci
nn
amon
oil
impr
ove
the
bake
rypr
odu
cts
shel
flif
e15
4
Ch
itos
anpr
opio
nic
acid
incr
ease
the
proc
esse
dm
eats
shel
flif
e13
9
acet
icac
idin
crea
seth
epr
oces
sed
mea
tssh
elflif
e13
9

28 1. INTRODUCTION
Mat
rix
Bio
acti
veco
mpo
un
dA
pplic
atio
nR
efer
ence
s
nis
inin
hib
itin
ggr
owth
ofS
.aur
eus,
L.m
onoc
ytog
enes
and
B.c
ereu
s
150
pota
ssiu
mso
rbat
ein
hib
itin
ggr
owth
ofS
.aur
eus,
L.m
onoc
ytog
enes
and
B.c
ereu
s
150
garl
icoi
lin
hib
itin
ggr
owth
ofS
.aur
eus,
L.m
onoc
ytog
enes
and
B.c
ereu
s
150
Alg
inat
een
tero
cin
sin
hib
itio
nof
L.m
onoc
ytog
enes
grow
thin
cook
ed
ham
116
Gal
acto
man
nan
extr
acts
from
G.t
riac
anth
osan
tiox
idan
tac
tivi
tyin
food
prod
uct
s33
nis
inin
hib
itio
nof
L.m
onoc
ytog
enes
grow
thon
Ric
otta
chee
se
117,
34
Zei
nth
ymol
inh
ibit
ion
ofce
llsan
dsp
ores
ofB
.cer
eus,
C.
lusi
tani
aean
dPs
eud
omon
assp
p.
133
lyso
zym
e/ch
ickp
eaal
bum
in
extr
act/
BS
A/d
isod
ium
ED
TA
inh
ibit
ion
ofE
.col
ian
dB
.sub
tilis
grow
than
d
anti
oxid
ant
acti
vity
69
Soy
prot
ein
grap
ese
ed
extr
act/
nis
in/E
DTA
inh
ibit
ion
ofL.
mon
ocyt
ogen
esgr
owth
in
read
y-to
-eat
food
prod
uct
s
176

1.2. ACTIVE AND SMART PACKAGING 29
Mat
rix
Bio
acti
veco
mpo
un
dA
pplic
atio
nR
efer
ence
s
grap
ese
edex
trac
t/gr
een
tea
extr
act/
nis
in
inh
ibit
ion
ofL.
mon
ocyt
ogen
esgr
owth
in
read
y-to
-eat
mea
tpp
rodu
cts
(full
fat
turk
ey
fran
kfu
rter
s)
188
k-C
arra
geen
anov
otra
nsf
erri
n/
ED
TAin
hib
itio
nof
tota
lmic
robe
san
dE
.col
igr
owth
in
fres
hch
icke
nbr
east
168
pota
ssiu
mso
rbat
eye
ast,
mol
dan
dse
lect
ive
bact
eria
inh
ibit
ion
42
Wh
eypr
otei
nor
egan
oan
dga
rlic
esse
nti
al
oils
inh
ibit
ion
ofS
.aur
eus,
S.e
nter
itid
is,
L.
mon
ocyt
ogen
es,
E.c
oli
and
L.pl
anta
rum
grow
th
170
lyso
zym
ein
crea
seth
esm
oked
salm
onsh
elflif
e13
1,12
5
grap
ese
ed
extr
act/
nis
in/m
alic
acid
/ED
TA
inh
ibit
ion
ofL.
mon
ocyt
ogen
es,
S.t
yphi
mur
ium
and
E.c
oli
O15
7:H
7in
read
y-to
-eat
pou
ltry
prod
uct
s(t
urk
eyfr
ankf
urt
ersy
stem
)
66
p-am
inob
enzo
icac
id/s
orbi
c
acid
inh
ibit
ion
ofL.
mon
ocyt
ogen
es,
E.c
oli
O15
7:H
7
and
Sal
mon
ella
ente
rica
subs
p.en
teri
case
rova
r
Typh
imur
ium
DT1
04in
slic
edbo
logn
aan
d
sum
mer
sau
sage
28,29
Milk
prot
ein
oreg
ano/
pim
ento
esse
nti
al
oils
incr
ease
the
beef
mu
scle
slic
esh
elflif
e14
0

30 1. INTRODUCTION
Mat
rix
Bio
acti
veco
mpo
un
dA
pplic
atio
nR
efer
ence
s
App
lepu
ree
oreg
ano,
cin
nam
on,an
d
lem
ongr
ass
oils
inh
ibit
ion
ofE
.col
iO
157:
H7
in
fres
h-c
ut
fru
itsu
rfac
es15
6

1.3. FOOD NANOTECHNOLOGY 31
A number of coatings and edible films derived from biopolymers or chemically syn-
thesized from bioderived polymers have also been studied for antimicrobial applications.
Among the most used stand cellulose derivatives, alginate, wheat gluten, zein, beeswax,
whey protein, chitosan, soy protein, etc [10]. Table 3 on page 24 also includes a number
of polymers used in active devices for food packaging applications.
In the case of the pimaricin, antimicrobial studied in this work, several approaches to
include it in packaging films to avoid mould spoilage have been reported. For example,
chitosan-based edible films [59], wheat gluten and methyl cellulose biopolymers [192,
191] and polyethylene films coated with commercially available polyvinylchloride (PVC)
lacquer coatings [81], whey protein films [148], alginate-based coatings [134], cellulose-
based films [136].
However, thermosensitive nanohydrogels have never been assayed for this purpose.
1.3. Food nanotechnology
The National Nanotechnology Initiative (Arlington, VA, USA) defines nanotechnology
as "the understanding and control of matter at dimensions of roughly 1-100 nm, where
unique phenomena enable novel applications. Encompassing nanoscale science, en-
gineering and technology, nanotechnology involves imaging, measuring, modelling, and
manipulating matter at this length scale".
Nanotechnology has potential applications in all aspects of food chain including stor-
age, quality monitoring, food processing, and food packaging. Nanotechnology applica-
tions in the food industry range from smart packaging to creation of on-demand inter-
active food that allows consumers to modify food, depending on the nutritional needs
and tastes [131].
Nonetheless, many of the nanotechnological developments might be currently either
too expensive or too impractical to implement on a commercial scale. For this reason, it
is said that nanoscale techniques are most cost-effective in different sectors of the food

32 1. INTRODUCTION
industry, such us development of new functional materials, food formulations, and food
processing at microscale and nanoscale levels, product development, and storage.
Among the emerging applications of nanotechnology in the food industry are the
following [15]:
• Bacteria identification and food-quality monitoring.
• Active and smart food packaging systems.
• Nanoencapsulation of bioactive food compounds (e.g. micelles, liposomes, na-
noemulsions, biopolymeric nanoparticles).
Below are described some relevant general aspects of these three areas and Table 4 on
the next page summarizes some particular promising nanotechnology applications for
food and bioprocessing industries.
Quality assurance and safety of food and bioprocess industry is of utmost impor-
tance because consumers demand safe and wholesome food as well as governments
impose stringent regulations to ensure food safety and feed hygiene. Sensors or sys-
tems for rapid detection of microbial contamination or spoilage of food components, for
food quality control, and for abuse detection at source and during production chain is
possible through nanotechnology [131].
The main purpose of food packaging is to increase food shelf life by avoiding spoil-
age, microbial contamination, or the loss of food nutrient. Nanotechnology offers higher
hopes in food packaging by promising longer shelf life, safer packaging, better traceabili-
ty of food products, and healthier food. Polymer nanocomposite technology holds the key
to future advances in flexible, intelligent, and active packaging [131]. If so, nanotech-
nology can provide solutions for food packaging by modifying the permeation behaviour
of foils, increasing barrier properties (mechanical, chemical, and microbial), providing
antimicrobial properties, and by improving heat-resistance properties [21, 35].

1.3. FOOD NANOTECHNOLOGY 33T
AB
LE
4.
Prom
isin
gn
anot
ech
nol
ogy
appl
icat
ion
sfo
rfo
odan
dbi
opro
cess
ing
indu
stri
es(b
ased
onN
eeth
iraj
anan
dJa
yas
[131
])
Are
aTec
hn
olog
yD
escr
ipti
onB
enefi
tsR
efer
ence
s
Foo
dqu
alit
y
mon
itor
ing
nan
osen
sors
elec
tron
icto
ngu
ese
nsi
tive
to
gase
sre
leas
edu
rin
gfo
od
proc
essi
ng
anti
mic
robi
al;h
ealt
hbe
nefi
ts;
degr
adat
ion
dete
ctio
ndu
rin
g
proc
essi
ng
and
stor
age
158
Bac
teri
a
iden
tific
atio
n
refle
ctve
inte
rfer
omet
ry
usi
ng
nan
otec
hn
olog
y
opti
cald
etec
tion
ofbi
omol
ecu
les
inco
mpl
exm
ixtu
res
food
qual
ity
assu
ran
ce;
dete
ctio
nof
E.c
oli
info
ods
85
silic
on/g
old
nan
orod
arra
yflu
ores
cen
tdy
esar
eat
tach
edto
anti
bodi
esth
atbe
com
evi
sibl
e
un
der
mic
robi
alco
nta
min
atio
n
food
qual
ity
assu
ran
ce;
dete
ctio
nof
Sal
mon
ella
info
ods
64
nan
opar
ticl
esth
atbi
nd
to
cell
surf
aces
anti
biot
ic-f
un
ctio
nin
g
nan
ocar
boh
ydra
tepa
rtic
les
dete
ctio
nan
del
imin
atio
nof
C.
jeju
nith
rou
ghth
ean
imal
’sfe
ces
186
nan
obi
olu
min
esce
nt
spra
yre
acts
wit
hth
epa
thog
ens
on
food
prod
uci
ng
avi
sual
glow
dete
ctio
nof
food
-rel
ated
path
ogen
s(S
alm
onel
laan
dE
.
coli)
91
biof
un
ctio
nal
mag
net
ic
nan
opar
ticl
e
biol
um
ines
cen
cede
tect
ion
of
imm
obili
zed
bact
eria
dete
ctio
nof
E.c
oli
in
past
euri
zed
milk
41
anti
body
-con
juga
ted
silic
a
fluor
esce
nt
nan
opar
ticl
es
imm
un
oass
ayfo
rin
situ
path
ogen
quan
tific
atio
n
path
ogen
icba
cter
iade
tect
ion
such
asE
.col
iO
157:
H7
224

34 1. INTRODUCTION
Are
aTec
hn
olog
yD
escr
ipti
onB
enefi
tsR
efer
ence
s
An
tim
icro
bial
pack
agin
g
nan
osca
ledi
rtre
pele
nt
coat
ing
self-
clea
nin
gsu
rfac
es;ba
rrie
r
prop
erti
es
130
anti
mic
robi
aln
anop
arti
cles
silv
erox
ide
and
zin
cox
ide
nan
opar
ticl
es
anti
mic
robi
al(S
.aur
eus
and
E.
coli
inh
ibit
ion
);h
ealt
hbe
nefi
ts
181,
94
elec
tros
pun
blen
d
nan
ofibe
rsfr
omch
itos
an
the
addi
tion
ofpo
ly(e
thyl
ene
oxid
e)al
low
sto
obta
infib
ers
from
chit
osan
tou
seas
food
pack
agin
g
prov
ides
nat
url
yan
tim
icro
bial
prop
erti
es
100
Impr
oved
food
stor
age
poly
mer
sbo
nde
dw
ith
nan
ocry
stal
s
the
mat
eria
lwor
ksby
intr
odu
cin
gn
anoc
ryst
als
into
the
plas
tic
that
esse
nti
ally
crea
tea
maz
efr
omw
hic
h
oxyg
enm
olec
ule
sfin
dit
diffi
cult
toes
cape
incr
ease
the
shel
flif
ein
pack
aged
beve
rage
s(b
eer,
fru
it
juic
ean
dso
ftdr
inks
)
209

1.3. FOOD NANOTECHNOLOGY 35
Are
aTec
hn
olog
yD
escr
ipti
onB
enefi
tsR
efer
ence
s
biod
egra
dabl
e
bio-
nan
ocom
posi
tes
mad
e
from
nat
ura
lbio
poly
mer
s
bio-
nan
ocom
posi
tes
prep
ared
wit
hst
arch
and
prot
ein
usi
ng
a
mel
tin
terc
alat
ion
ora
solv
ent
inte
rcal
atio
nm
eth
od
enh
ance
dor
gan
olep
tic
char
acte
rist
ics
offo
od,su
chas
appe
aran
ce,od
or,an
dfla
vor;
exte
nde
dsh
elflif
ean
dim
prov
ed
qual
ity
ofu
sual
lyn
on-p
acka
ged
item
s
223
bio-
nan
ocom
posi
tes
prep
ared
wit
hbi
odeg
rada
ble
poly
este
rs
(pol
yhyd
roxy
alka
noa
tes,
poly
(lact
icac
id),
etc.
)
impr
ove
stif
fnes
s,pe
rmea
bilit
y,
crys
talli
nit
yan
dth
erm
al
stab
ility
offo
odpa
ckag
ing
16
enca
psu
lati
onof
aph
ase
chan
gin
gm
ater
iali
na
biop
olym
eric
mat
rix
usi
ng
the
elec
tros
pin
nin
g
tech
niq
ue
dode
can
en
anoe
nca
psu
lati
on
into
aze
inm
atri
x
deve
lopm
ent
ofn
ewsm
art
pack
agin
gm
ater
ials
wit
hth
e
abili
tyto
mai
nta
inte
mpe
ratu
re
con
trol
inth
eco
ldch
ain
147

36 1. INTRODUCTION
Are
aTec
hn
olog
yD
escr
ipti
onB
enefi
tsR
efer
ence
s
Tra
ckin
g,tr
acin
g,
and
bran
d
prot
ecti
on
invi
sibl
en
anob
arco
des
wit
h
batc
hin
form
atio
nw
hic
hca
n
been
cryp
ted
dire
ctly
onto
the
food
prod
uct
san
d
pack
agin
g
use
asc
ann
ing
prob
e
mol
ecu
le-c
oate
dti
pto
depo
sit
a
chem
ical
lyen
gin
eere
din
k
mat
eria
lto
crea
te
nan
olit
hog
raph
icpa
tter
non
to
the
food
surf
ace
(Dip
Pen
Nan
olit
hog
raph
y)
offe
rsfo
odsa
fety
byal
low
ing
the
bran
dow
ner
sto
mon
itor
thei
r
supp
lych
ain
sw
ith
out
hav
ing
to
shar
eco
mpa
ny
info
rmat
ion
to
dist
ribu
tors
and
wh
oles
aler
s
221
nan
odis
ksof
gold
fun
ctio
nal
ized
wit
hdy
em
olec
ule
sth
atem
ita
un
iqu
elig
ht
spec
tru
mw
hen
illu
min
ated
wit
ha
lase
rbe
am
DN
Ade
tect
ion
and
asta
gsfo
r
trac
kin
gfo
odpr
odu
cts.
129
nan
obar
code
dete
ctio
nsy
stem
that
fluor
esce
su
nde
ru
ltra
viol
et
ligh
tin
aco
mbi
nat
ion
ofco
lor
that
can
bere
adby
aco
mpu
ter
scan
ner
path
ogen
dete
ctio
nin
food
and
biol
ogic
alsa
mpl
es
107
En
caps
ula
tion
and
deliv
ery
nan
oen
caps
ula
tion
of
bioa
ctiv
esu
bsta
nce
s
enca
psu
lati
onof
tun
afis
hoi
l
(sou
rce
ofom
ega-
3fa
tty
acid
s)
tast
em
aski
ng;
targ
eted
deliv
ery
ofn
utr
ien
ts;pr
otec
tion
from
degr
adat
ion
ofbr
ead
131

1.3. FOOD NANOTECHNOLOGY 37
Are
aTec
hn
olog
yD
escr
ipti
onB
enefi
tsR
efer
ence
s
nan
onca
psu
lati
onw
ith
calc
ium
algi
nat
e
enca
psu
lati
onof
live
prob
ioti
c
spec
ies
impr
ove
the
yogu
rtas
a
ther
apeu
tic
fun
ctio
nal
food
.
95
nan
onca
psu
lati
onw
ith
star
chby
spra
yco
atin
g
enca
psu
lati
onof
bifid
obac
teri
apr
otec
tion
and
con
trol
led
rele
ase
137
nan
oen
caps
ula
ton
of
supp
lem
ents
enca
psu
lati
onof
lyco
pen
e
(an
tiox
idan
tfr
omto
mat
o)
prot
ecti
onfr
omde
grad
atio
n
duri
ng
proc
essi
ng
8
nan
oen
caps
ula
tion
and
stab
iliza
tion
ofh
ydro
phob
ic
nu
trac
euti
cals
ubs
tan
ces
on
case
inm
icel
les
enca
psu
lati
onof
vita
min
D2
uti
lizin
gth
en
atu
ral
self-
asse
mbl
yte
nde
ncy
ofbo
vin
e
case
ins
enri
chm
ent
ofn
on-f
ator
low
-fat
food
prod
uct
s
167
acti
ven
anofi
bers
prep
ared
byel
ectr
ospi
nn
ing
tech
niq
ue
enca
psu
lati
onof"-
caro
ten
est
abili
zati
onof
ligh
tse
nsi
tive
adde
d-va
lue
food
com
pon
ents
62
self-
asse
mbl
edn
anot
ube
s
from!-
lact
albu
min
enca
psu
lati
onof
bioa
ctiv
e
subs
tan
ces
prot
ecti
onof
sen
siti
ve
hea
lth
-pro
mot
ing
ingr
edie
nts
72

38 1. INTRODUCTION
Nanotechnology has also shown greater potential in improving the efficiency of de-
livery of nutraceuticals and bioactive compounds in functional foods to improve human
health. Nanotechnology can enhance solubility, improve bioavailability, and protect the
stability of micronutrients and bioactive compounds during processing, storage and dis-
tribution [38]. In addition, moisture-triggered controlled release, pH-triggered controlled
release or consecutive delivery of multiple active ingredients might be implemented [171].
The size and the structure of food influence the functionality by providing the taste,
texture, and stability properties. Nanotechnology can help in controlling the size and
structure of food in order to adapt to that consumers want. Scaling down the size of
food molecules to nanosized crystals creates more particles for an overall greater sur-
face area. Smaller particles improve food’s spreadability and stability, and permits to
reduce extra stabilizers and thickeners to achieve a desirable food texture of emulsion
based foods [68]. In this way, it is possible to develop healthier low-fat food products
with desirable sensory properties; ingredients with improved properties or the removal
of certain additives without loss of stability. The later includes, for example, removal of
allergens such as peanut protein in emulsions, and in smart-aids for processing foods
[131].
Nanotechnology can help food industries in providing authentication, and track and
trace features of a food product for avoiding counterfeiting; preventing adulteration and
diversion of products destined for a specific market.
1.3.1. Nanomaterial’s legal regulations. Different countries are trying to include
nanomaterials in their current regulations. Blasco and Picó [15] have listed The European
Union legislation applicable to nanomaterials in food as follows:
• General for chemical compounds (REACH). European Community legislation
concerned with chemicals and their safe use and dealing with the Registration,
Evaluation, Authorisation and restriction of Chemical Substances.

1.3. FOOD NANOTECHNOLOGY 39
• Novel foods regulation (Regulation (EC) No 258/97). Novel foods are foods and
food ingredients that have not been used for human consumption to a signifi-
cant degree in the EC before 15 May 1997, and the Regulation subjects all novel
foods and foods manufactured using novel processes to a mandatory pre-market
approval system. In January 2008, the European Commission published a pro-
posal to revise and update the Novel Foods Regulation. Various proposals have
been discussed by the Commission, Parliament and Council (The draft Regu-
lation is currently going through the co-decision procedure). A definition of
nanomaterials has been introduced at the request of the European Parliament,
and supported by the Council. Discussions are continuing on how to bring
nanotechnologies specifically into the revised Regulation.
• Food additives (Directive 89/107/EC and associated legislation). Only additives
explicitly authorized may be used in food. In December 2008, a new Regulation
was passed (Regulation EC/1333/2008), which set out a common authoriza-
tion procedure for additives, enzymes and flavourings. From early 2010, a list
of approved additives, including vitamins and minerals, came into force. The
Commission on the basis of an Opinion from the EFSA decided inclusion of ad-
ditives on the list. Those included often had limits set on their use, for example,
restrictions on the quantities permitted for use. The new regulations also spe-
cify that, where the starting material used, or the process by which an additive
is produced, is significantly different (for example, through a change in particle
size), it must go through a fresh authorization process, including a new safety
evaluation.
• Food supplements (Directive 2002/46/EC). States that only vitamins and min-
erals on an approved list may be used as food supplements. New substances
may be considered for inclusion on the list, but only after a safety assessment
by EFSA.

40 1. INTRODUCTION
• Food-contact materials (Regulation EC/1935/2004). All materials those are in-
tended to come into contact with foodstuffs, either directly or indirectly. The
Commission or Member States may request the EFSA to conduct a safety evalu-
ation of any substance or compound used in the manufacture of a food contact
material. Certain materials, including plastics, are subject to additional meas-
ures. The Commission has proposed updating the Regulation governing food-
contact plastics to specify that a deliberately-altered particle size should not be
used, even behind a migration barrier, without specific authorization.
1.4. Smart nanohydrogels as active packaging
Hydrogels have been widely studied as drug delivery systems [19, 31, 96, 187] and
they are defined as a three-dimensional network with flexible chains capable of imbibing
high amounts of water (more than 90% wt.) [146]. Its hydrophilicity is due to the
presence in its molecular structure of hydrophilic functional groups such as: OH, COOH,
CONH2, CONH, SO3H, etc. Despite their high water absorbing affinity, hydrogels show a
swelling behaviour instead of being dissolved in the aqueous surrounding environment
due to existence of weak cohesive forces (such van der Waals forces and hydrogen bonds)
and covalent or ionic bonds. The equilibrium state of the swollen hydrogel is the result
of the balance between osmotic forces caused by water entering into the macromolecular
network and cohesive forces exerted by macromolecular chains that make opposition to
this expansion [97, 78].
In the presence of proper functional groups, hydrogels have the property of under-
going reversible volume phase transitions in response to environmental factors, such as
temperature, ionic strength, and pH [6]. Temperature-sensitive (thermoresponsive) and
pH-responsive have gained considerable attention due to their ability for repeated swell-
ing–deswelling conversion in response to the environmental temperature [23, 55 from
78] or pH changes [145, 193, 169, 83, 20, 2, 63, 174, 175, 12 from 78], respectively.

1.4. SMART NANOHYDROGELS AS ACTIVE PACKAGING 41
1.4.1. Volume phase transitions of hydrogels. Many polymer systems in which
the biomolecule release responds to different external stimuli have been developed, such
polymers are known as "smart polymers". Most research works have been focused on the
effect of pH and temperature, due to the importance of these variables on physiological,
biological and chemical systems.
The transitions occurred in polymers owed to external stimulus, result from the
competition between repulsive intermolecular forces, that act to expand the polymer
network, and an attractive force that acts to shrink it. Ilmain et al. [89] described, as
described below, the different types of interactions that take place in these volume phase
transitions:
• Van der Waals interaction: Van der Waals interaction causes a phase transition
in hydrophilic gels in mixed solvents, such as an acrylamide gel in an ace-
tone–water mixture. Van der Waals forces are responsible for polymer-polymer
affinity. Acetone, in this case is a bad non-polar solvent, which added to water
increases the attractive interactions between molecules and causes the collapse
of the gel. This transition is also observed near the threshold concentration by
changing the temperature. At higher temperatures the gel swells and with a
decrease the gel collapses.
• Hydrophobic interaction: because of its low solubility, the hydrophobic groups
dissolution in water is generally associated with an increase in the free energy
of the system (!G > 0). This dissolution is slightly exothermic (!H < 0) and
hence the entropy of the system must decrease (!G = AH - T · !S). This can be
interpreted as a consequence of the greater degree of packing and order adopted
by water molecules (hydration cell) around the dissolved hydrophobic molecules
compared with the structure of pure water. This behaviour is called hydrophobic
effect. When two hydrophobic groups interact to form an aggregate, the release
from the hydration cell of some water molecules to free water was produced,
causing an increase in system entropy (!S > 0). Although heat is needed to

42 1. INTRODUCTION
break the cell hydration (!H> 0), the decrease in free energy of the system (!G
< 0) promotes the aggregation of hydrophobic molecules. This type of interaction
is responsible of the phase transition of poly (N-isopropylacrylamide) gels, which
swell at low temperature and collapse with increasing temperature. This type of
temperature dependence is contrary to the Van der Waals interactions.
• Hydrogen bonding: A hydrogen bond is the attractive force between the hydro-
gen attached to an electronegative atom of one molecule and an electronega-
tive atom of a different molecule. Usually the electronegative atom is O and
N. Moreover, the hydrogen bond has a directional preference, i.e., requires a
particular configuration of either a sequence located in the polymer (intrachain
hydrogen bonding) or sequences of the polymer (interchain links).
• Electrostatic interaction: The electrostatic interaction is inversely proportional to
the dielectric constant of the medium. In synthetic polymers can be introduced
charges in the chain by copolymerization processes or partial ionization, result-
ing in a strong electrostatic repulsion in the system. As the charges cannot be
displaced because they are attached to the chain, the counterions tend to be
located near them to maintain the electroneutrality of the system. As a result,
a Donnan potential is created inside and outside the hydrogel, overriding the
internal osmotic pressure, so that the hydrogel swells.
In any case, we must to take into account that often will be more than one type of
interaction responsible for the behaviour of the gel, although some predominate over the
others [54].
1.4.2. N-isopropylacrylamide based hydrogels. N-isopropylacrylamide (NIPA) is a
neutral monomer derived from acrylic acid resulting thermosensitive hydrogels. The fact
of presenting hydrophilic amide groups and hydrophobic isopropyl side chain in makes
poly (N-isopropylacrylamide) (PNIPA) (Figure 2 on the facing page) a polymer soluble in
both, water at room temperature and in organic solvents of low polarity.
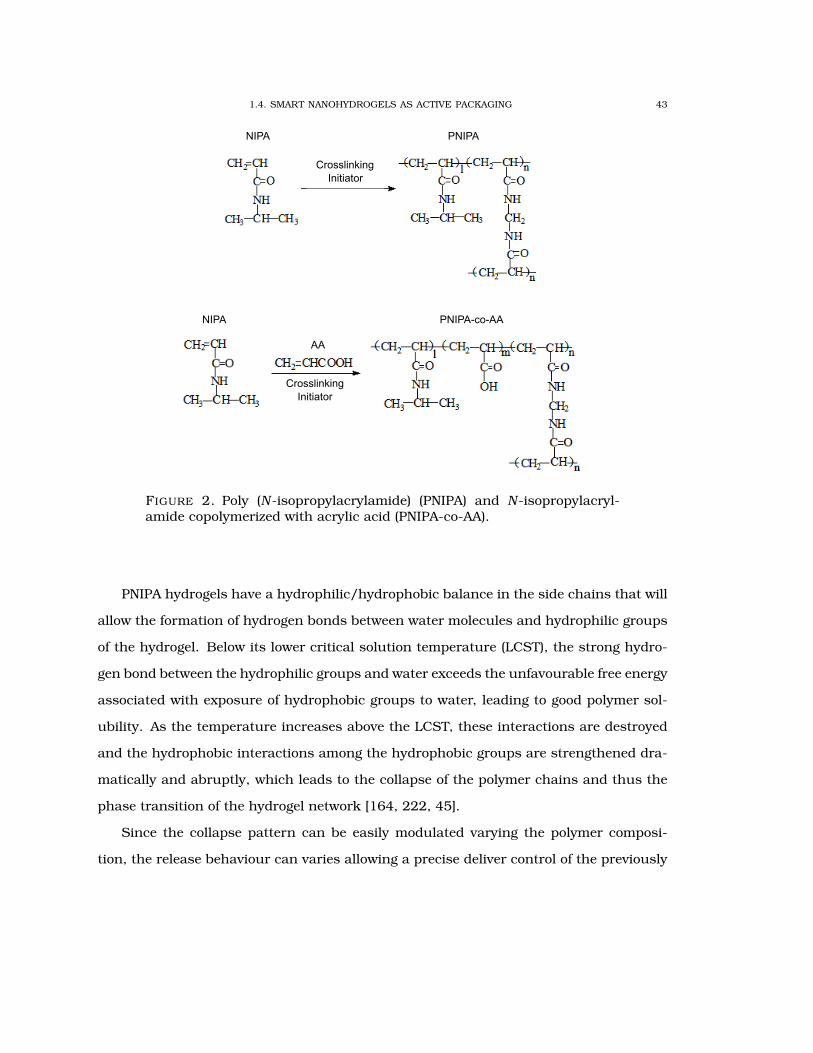
1.4. SMART NANOHYDROGELS AS ACTIVE PACKAGING 43
Crosslinking
Initiator
PNIPA NIPA
NIPA
Crosslinking
Initiator
PNIPA-co-AA
AA
FIGURE 2. Poly (N-isopropylacrylamide) (PNIPA) and N-isopropylacryl-amide copolymerized with acrylic acid (PNIPA-co-AA).
PNIPA hydrogels have a hydrophilic/hydrophobic balance in the side chains that will
allow the formation of hydrogen bonds between water molecules and hydrophilic groups
of the hydrogel. Below its lower critical solution temperature (LCST), the strong hydro-
gen bond between the hydrophilic groups and water exceeds the unfavourable free energy
associated with exposure of hydrophobic groups to water, leading to good polymer sol-
ubility. As the temperature increases above the LCST, these interactions are destroyed
and the hydrophobic interactions among the hydrophobic groups are strengthened dra-
matically and abruptly, which leads to the collapse of the polymer chains and thus the
phase transition of the hydrogel network [164, 222, 45].
Since the collapse pattern can be easily modulated varying the polymer composi-
tion, the release behaviour can varies allowing a precise deliver control of the previously

44 1. INTRODUCTION
loaded active principle. Thus, the addition of hydrophilic ionic comonomers, such as a-
crylic, methacrylic or itaconic acid to the PNIPA polymer led to an increase of the overall
polymer hydrophilicity, strengthening polymer–water interactions and leading to an in-
crease of the LCST [164, 45, 57, 124, 110]. Stile et al. [185] explained as hydrophilic AA
tends to increase the LCST of PNIPA-co-AA polymers because the ionized -COO- groups
are sufficiently soluble to counteract the aggregation of the hydrophobic temperature-
sensitive elements. Also, the repulsion of the -COO- groups or the formation of hydrogen
bonds between the amide groups in NIPAAm and the -COO- groups in AA may impede
the collapse induced by the NIPAAm components, increasing the LCST. In addition ap-
pointed that the PNIPA-co-AA hydrogel exhibited a broader transition than the PNIPA
hydrogel, indicating decreased swelling thermosensitivity, so copolymer hydrogels com-
posed of NIPA and a more hydrophilic monomer have demonstrated decreased swelling
thermosensitivity because the monomer prevents the formation of a compact shrunken
structure.
PNIPA hydrogels have been widely investigated, in relation to its on/off behaviour, in
biomedical applications and many other fields, such as in drug delivery systems [77, 13,
208, 189], immobilization of enzymes [40, 123] and gene carriers [86, 101]. However this
type of hydrogels have not been studied for its application as active packaging of foods.
1.4.2.1. N-isopropylacrylamide based nanohydrogels. PNIPA nanohydrogel is a cross-
linked polymeric network that swell to a particle size ranging from 10 to 1000 nm.
The techniques to synthesize nanoparticle can be divided into physical techniques,
where the nanoparticles are obtained by mechanical division of the material; and chem-
ical techniques, where the nanoparticles are obtained by nucleation and growth of pre-
cursor species [88]. Chemical techniques can be divided into:
• chemical co-precipitation
• electrochemical
• sonochemical
• sol-gel processing

1.4. SMART NANOHYDROGELS AS ACTIVE PACKAGING 45
WATER
SYSTEM
OIL
SYSTEM
SURFACTANT MOLECULE
Hydrophobic tail Hydrophilic head
FIGURE 3. Diagram of micelles in inverse water-in-oil (W/O) microemul-sions [58].
• microemulsions
All these techniques require the presence of a stabilizing agent in order to prevent ag-
gregation of the resultant nanoparticles.
Microemulsions are isotropic, optically transparent, and thermodynamically stable
dispersion systems consisting of water, oil, and suitable surfactants. Microemulsion
polymerization can be divided into oil-in-water (direct), water-in-oil (reverse), and water-
in-oil-in-water (double) according to the precursor microemulsions [58]. Water-in-oil
(W/O) microemulsion polymerization (Figure 3) has been widely used to synthesize hy-
drogel nanoparticles of controlled size and shape [58, 76, 13, 14], due to their ability to
mix reactants efficiently at the molecular level and enable the formation of shell and core
structured nanocatalysts through sequential synthesis [88].
Since PNIPA nanohydrogels are biocompatible and non-toxic , is commonly used as
carrier or deliver device in anticancer applications and therefore suitable for use in food.
Furthermore nanohydrogels have the advantage of having the characteristics of hydro-
gels (flexibility, hydrophilicity, great capacity to absorb water) linked to the advantages
of nanoparticles. Additionally the nanoscale and low hydrophobicity of PNIPA particles

46 1. INTRODUCTION
is compatible with their oral ingestion because they have a low immune response and
are able to glomerular filtration in kidney [203].
PNIPA nanohydrogels can be used to encapsulate functional ingredients with one or
more targets functions such us protect them against degradation during food processing,
storage and usage, carrying it to the site of action, and controlling its release as in
active packaging. In this last application, nanoscale has several advantages which are,
better dispersion of nanoparticles in the food packaging material and the possibility
of controlling the release rate as a response to specific environmental conditions (for
example, pH, ionic strength, or temperature).
Thermally sensitive and nontoxic poly(N-isopropylacrylamide) (PNIPA) hydrogels are
widely used. Some applications include the controlled release of glucose and insulin [3]
and 5-fluorouracil [13] in pharmaceutical applications as well as antifungals and mac-
romolecules such as benzoic acid and its sodium salt [47], and bovine serum albumin
[127, 226].
However applications within the food area are very scarce and practically limited to
the encapsulation and controlled release of pimaricin [65], whose results are included in
this thesis.

CHAPTER 2
Physico-chemical characterization of poly
(N-isopropylacrylamide) nanohydrogels for the pimaricin
controlled release
In this chapter we study the physico-chemical characterization of poly (N-isopropyl-
acrylamide) (PNIPA) nanohydrogels synthesized with different grades of hydrophilicity by
adding acrylic acid (AA) as comonomer in order to gain a better understanding of the
factors that influence the pimaricin release from PNIPA/AA nanohydrogels for further
application in active food packaging.
2.1. Materials and Methods
2.1.1. Materials. N-isopropylacrylamide (NIPA) (99%, stabilized) was from Acros Or-
ganics (Geel, Belgium) and was used as received. Acrylic acid (stabilized with hydroqui-
none monomethyl ether) for synthesis, N,N´-methylenebisacrylamide (NMBA) for syn-
thesis and sodium bisulfite (NaHSO3) for analysis were from Merck (Darmstadt, Ger-
many). Isoparaffinic synthetic hydrocarbon (98%, IsoparTM M) was from Esso Chemie
(Cologne, Germany). Sorbitan sesquiolate (98%, SpanTM 83) and PEG-40 sorbitol hexa-
oleate (98%, AtlasTM G-1086) were from Uniquema (Wilmington, DE, USA). Clorophorm
stabilized with ethanol and diethyl ether (stabilized with ~6 ppm of BHT) were from Pan-
reac (Barcelona, Spain).
2.1.2. Synthesis of PNIPA/AA nanohydrogels. The microemulsion polymerization
experiments were conducted in water-in-oil (W/O) systems. The W/O microemulsion
composition was 58% aqueous phase (AP), 17% oil phase (OP) and 25% surfactant (ST).
47

48 2. PHYSICO-CHEMICAL CHARACTERIZATION OF POLY (N-ISOPROPYLACRYLAMIDE) NANOHYDROGELS
TABLE 5. Composition of the PNIPA/AA nanohydrogels
Nomenclature mPNIPA/mmonomer mAA/mmonomer mCL/mmonomer
PNIPA(3) 1.00 0.00 0.03
PNIPA(5) 1.00 0.00 0.05
PNIPA-5AA(3) 0.95 0.05 0.03
PNIPA-5AA(5) 0.95 0.05 0.05
PNIPA-10AA(3) 0.90 0.10 0.03
PNIPA-10AA(5) 0.90 0.10 0.05
PNIPA-20AA(3) 0.80 0.20 0.03
PNIPA-20AA(5) 0.80 0.20 0.05
NIPA: N-isopropilacrylamide
AA: acrylic acid
CL: cross-linking (N,N’-methylenebisacrylamide)
The AP consisted of 80% water and 20% monomers. Mass ratios of NIPA to AA based on
the monomers are showed in the Table 5. To preserve the shape and size of the particles
during handling we used NMBA as cross-linking agent (CL) in the proportions indicated
in Table 5. The OP consisted entirely of IsoparTM M, which was mixed directly with
surfactants (ST) AtlasTM G-1086 (mAtlas G-1086/mST = 0.97) and SpanTM 83 (mSpan 83/mST
= 0.03).
Both phases were solubilized then mixed in a 100 mL reactor thermostatized at 25
°C, equipped with mechanical stirring and a thermal sensor. To eliminate oxygen, 10
min before the polymerization began (by adding the initiator at a ratio mNaHSO3/mmonomer
= 0.01) and during the entire reaction, the reaction medium was purged by bubbling
nitrogen through it. The polymerization conversion was monitored via the temperature
increase inside the glass reactor. The polymer was purified using selective precipitation

2.2. RESULTS AND DISCUSSION 49
with chloroform and diethyl ether. The pure polymer was dried overnight in an oven (50
°C) and then ground in a colloid mill (IKA®-Werke GmbH & Co. KG, Staufen, Germany).
2.1.3. Measurement of mean particle size and zeta potential. Zeta potential (Zp)
and mean particle size (Z-average) was analysed by a dynamic light scattering (DLS)
measurement technique using Zetasizer Nano ZS (Malvern Instruments, Worcestershire,
UK) at 25 °C. Nanohydrogel samples were prepared dispersing PNIPA powder in distilled
water (0.5 mg mL-1) by agitation during 3 hours at ambient temperature to allow a proper
swelling of the nanoparticles. Each analysis was performed in triplicate.
2.1.4. Measurement of gel phase transition temperature. The phase transition
phenomenon of the polymer suspensions (12.5 mg mL-1) was examined by two methods:
• Optical density (OD). The phase transition was examined by measuring the OD of
polymer suspensions at 500 nm using a spectrophotometer with a Peltier tem-
perature control module (Beckman Coulter Inc., Brea, CA, USA) at temperature
intervals from 15 to 50 °C with increments of 2 °C between each measurement.
• Differential scanning calorimetry (DSC). DSC scans (Micro DCS III, Seratam) of
nanohydrogel suspensions were performed from 10 to 50 °C with the reference
ampule containing distilled water. Scans were run at 0.25 °C min-1.
2.1.5. Statistical analysis. The differences between the results were evaluated by
analysis of variance (ANOVA) followed by Bonferroni post-tests for multiple comparisons
using with GraphPad PrismTM 5 (GraphPad Software Inc., San Diego, CA, USA).
2.2. Results and Discussion
2.2.1. Mean particle size and zeta potential. Since the nanoparticles were allowed
to swell for 3 h in the solvent, the Z-average values could be used as an indicator of their
swelling properties; the swelling degree being a result of the balance between two oppo-
site forces, the osmotic pressure, which tends to expand the gel, and the elasticity of the
polymer, which acts to shrink the gel network. Elasticity is, in turn, strongly influenced

50 2. PHYSICO-CHEMICAL CHARACTERIZATION OF POLY (N-ISOPROPYLACRYLAMIDE) NANOHYDROGELS
0 100 200 300 400 500 600 3000 6000
PNIPA
PNIPA-10AA
PNIPA-20AA
Mean particle size (r. nm)
0 10 200
50
100
150
200
% Acrylic acid
Me
an
pa
rtic
le s
ize
(r.
nm
)
0.29±0.11
0.32±0.07 0.42±0.06
0.19±0.003 0.25±0.10
Polydispersitivity (PDI)
3%CL 5%CL
0.09±0.03
% A
cryl
ic a
cid
FIGURE 4. Mean particle size (Z-average) of PNIPA/AA nanohydrogels with3% (!) and 5% (") of cross-linking agent (CL), in distilled water at 25 °C.
by the cross-linking degree of the gel matrix. According to Otake et al. [138], Inomata
et al. [90], Çaykara et al. [30], the increasing of cross-linking points in the gel matrix will
arrest the formation of any hydration structure near the cosslinking points, which dre-
creases the volume changes assotiated with thermal transitions in PNIPA gels. Therefore,
nanoparticles’ rigidity is expected to increase as the CL-percentage is increased.
Figure 4 shows the Z-average values for nanohydrogel particles synthetized with dif-
ferent percentages of AA and CL. A polydispersity index (PDI) of 1 indicates large vari-
ations in particle size; a reported value of 0 means that size variation is absent. Z-
average of PNIPA/AA nanohydrogels synthesized ranged from 79 to 171 nm with a PDI

2.2. RESULTS AND DISCUSSION 51
below 0.5. Thus, the PDI values indicate limited variation in particle size, especially for
the less cross-linked nanohydrogel without acrylic acid (PNIPA(3)).
In accordance with the theory [138, 90, 30] and previous reports [217, 114, 109],
3% CL gels resulted more elastic than 5% CL gels for all the conditions studied. In
addition, both for 3% and 5% CL nanoparticles, the higher the AA content, the higher
the Z-average (i.e., higher elasticity), which could be due to the increase in repulsive
interactions between moieties with charges of the same sign. In addition, the osmotic
pressure by counter ions would also contribute to the expanding force giving a more
swelled nanoparticle [106]. On the other hand, this behaviour is more intense in 3% CL
gels, which at 20% AA shows a size increment relative to the gel size at 0% AA equal to
1.3-fold the increment for 5% CL gels. In this case, a simultaneous increase in the AA-
content and the CL-degree might have produced a higher attractive interaction between
AA and NIPA chains, yielding a more rigid structure .
A two-way ANOVA analysis (" = 0.05 for a 95% confidence) of the Z-average variation
shows that both CL-percentage and AA-content effects were statistically significant (p <
0.0001). More over, the interaction of these two factors was also significant (p = 0.0093),
i.e., the CL effect on Z-average changed as a function of the AA-content. So, swelling de-
gree differences between 3% and 5% CL nanoparticles become higher as the AA-content
increases.
With regard to the Zp results, the effect of the CL-degree is significant only (p < 0.01)
for the PNIPA homopolymers (Figure 5 on the next page). PNIPA(5) is more negatively
charged than PNIPA(3) gels, despite neither of them having ionized groups. The bottom
of the Figure 5 shows that the PNIPA(5) nanohydrogel showed two Zp peaks, the first
one close to neutrality, as expected for PNIPA, and the second one negatively charged.
Since the cross-linker (NMBA) presents two carbonyl groups, the lower Zp value might
be related to the number of exposed carbonyl oxygen atoms, which possess a partial
negative charge due to the polarity of the carbon-oxygen bond.

52 2. PHYSICO-CHEMICAL CHARACTERIZATION OF POLY (N-ISOPROPYLACRYLAMIDE) NANOHYDROGELS
0 10 20-50
-40
-30
-20
-10
0
% Acrylic acid
Zp
(m
V)
-150 -100 -50 0 50 100 150
PNIPA
PNIPA-10AA
PNIPA-20AA
Zp (mV)
FIGURE 5. Zeta potential (Zp) of PNIPA/AA nanohydrogels with 3% (!)and 5% (") of cross-linking agent (CL), in distilled water at 25 °C.
PNIPA copolimerized with AA (PNIPA-co-AA) nanohydrogels have always a lower Zp
value than PNIPA nanohydrogels without AA. AA incorporation promoted a great increase
in the surface charge of the nanohydrogels. In these cases, the contribution of the CL to

2.2. RESULTS AND DISCUSSION 53
the surface charge is comparatively low and hence can be neglected. As a result, PNIPA-
co-AA nanohydrogels showed a single Zp peak (botton of the Figure 5 on the facing page).
On the other hand, there was a tendency to reduce the Zp value when the AA-content
increased from 10 to 20 (top of the Figure 5 on the preceding page). Although, the Zp
decrease was not significant (p > 0.05) in 3% CL nanohydrogel, the Zp change resulted
significant for 5% CL nanohydrogels. This effect might be a consequence of two factors:
- Ionized carboxyl groups (-COO-) of AA that provide negative charge to the polymer
can interact among themselves trough hydrogen bonds or with the amide groups of NIPA.
These interactions are benefited by increasing the CL-percentage since the polymeric
matrix will be tighter and the reactants will be closer.
- According to the Hendersson-Hasselbach equation the pH of the PNIPA-co-AA sus-
pensions will decrease when we increase the proportion of -COO- from the AA as in this
case the suspension was not buffered. This diminution in pH causes the protonation of
-COO- decreasing the surface charge (Zp) of the polymer.
2.2.2. Thermodynamic properties associated with the nanohydrogel collapse.
2.2.2.1. Temperature-induced collapse. The swelling/collapse behaviour is one of the
most intensely studied aspects of hydrogels as these properties determine their efficiency
as carriers in smart delivery systems. The thermally-induced collapse transitions are
measured either spectroscopically or calorimetrically. However, from thermal transition
curves, critical parameters such as the Tm are often estimated using graphical methods,
which do not provide confidence intervals and give little information on the physical
changes accompanying the collapse.
Nonetheless, the simplicity of the collapse transition and its reversibility allow a de-
tailed thermodynamical description of the collapse process by analogy to the Van’t Hoff
analysis of the unfolding of globular proteins .
A typical collapse curve is shown in Figure 6 on the following page. In this case
the hydrogel collapse was monitored by measuring the molar absortivity, but any spec-
troscopic parameter can be used . To allow an easy comparison of nanohydrogels with

54 2. PHYSICO-CHEMICAL CHARACTERIZATION OF POLY (N-ISOPROPYLACRYLAMIDE) NANOHYDROGELS
Determinación de propiedades termodinámicas asociadas al colapso de nanohidrogeles
Caso 1: Colapso por cambio de temperatura
En el proceso de colapso mediado por temperatura (T) se observa un cambio en la absorbacia del nanogel. Para estandarizar medidas entre nanogeles de distinto tamaño, en lugar de la absorbancia, representamos la absortividad molar media por unidad estructural constituyente del polímero:
! =A "MMU
C "! (Eq. 1)
! : absortividad molar media por unidad estructural constituyente del polímero (M-1 cm-1)
A: absorbancia a 500 nm MMU: masa molecular de la unidad estructural (g/mol de unidad estructural) C: concentración de nanogel (g/L)
! : paso óptico (cm)
Las asíntotas de la curva de colapso mediado por temperatura, nos darán el valor de ! carácterístico del estado hinchado (!h) y colapsado del nanogel (!c).
A una temperatura T cualquiera, cada uno de los nanogeles presentes en la disolución estudiada estará colapsado en un determinado grado.
Dado que tenemos geles homogéneos, sin regiones con estabilidades que difieran sustancialmente entre ellas, es perfectamente asumible que el colapso sigue un esquema de transición en una etapa:
H ⇋ C (Eq. 2)
(Hinchado ⇋ Colapsado)
De este modo, a efectos de la determinación del ! observado, que el gel esté parcialmente colapsado es matemáticamente equivalente a asumir que una fracción gel hinchado (fh) coexiste en equilibrio con una fracción de gel colapsado (fc).
T (K)
!"
#$
!%
FIGURE 6. Typical collapse curve of a PNIPA nanohydrogel exposed toincreasing temperatures. # is the mean molar absortivity of the structuralunit (M-1 cm-1) at collapsed state (#c) and swelled state (#s).
different molecular weights, we considered the mean molar absortivity of the repeat-
ing structural unit, which reports the molar absortivity for individual structural units
instead of whole nanohydrogel molecules:
(1) ! =A ·MMSU
C · l
where # is the mean molar absortivity of the structural unit (M-1 cm-1), A is the
absorbance at 500 nm, MMSU is the molecular mass of the structural unit (g mol-1), C
is the nanohydrogel concentration (g L-1) and l is the optical path length (cm).
Values of # characteristic of the swelled state (#s) and of the collapsed state (#c) can
be obtained from the bottom and top plateaus of the curve. At any temperature (T ) in
the transition the hydrogel would be collapsed at a certain level. Assuming a simple
two-state equilibrium , without stable collapsed intermediates (Swelled ! Collapsed), a
partially collapsed hydrogel is mathematically equivalent to considering the coexistence
of a fraction of swelled hydrogels (fs) in equilibrium with a fraction of collapsed hydrogels
(fc). Therefore, at any point in the collapse curve:

2.2. RESULTS AND DISCUSSION 55
(2) ! = fh · !h + fc · !c
since, fh + fc = 1,
(3) ! = !h + fc (!c ! !h)
and the fraction of nanohydrogel collapsed at any point:
(4) fc =!! !h!c ! !h
Thus, the apparent equilibrium constant of collapse (Kc) is:
(5) Kc =[C]
[H]=
fc1! fc
and from this equation,
(6) fc =Kc
1 +Kc
On the other hand, at equilibrium (when "G = 0), the standard free energy change
("Go) accompanying the collapse at a temperature T is related to the equilibrium con-
stant (Kc) between the swelled and the collapsed states by:
(7) "GoT = !R · T · lnKc =# Kc = e!
!GoT
RT
where R is the gas constant (8.314 J mol-1 K-1) and T is the absolute temperature
(K). In addition, from the Gibbs free energy definition:

56 2. PHYSICO-CHEMICAL CHARACTERIZATION OF POLY (N-ISOPROPYLACRYLAMIDE) NANOHYDROGELS
(8) "GoT = "Ho
T ! T ·"SoT
where "HoT and "So
T are the enthalpy and entropy changes accompanying the col-
lapse at temperature T.
When the hydrogel collapses (i.e., changes its thermodynamic state), a molar heat
capacity change ("Cp) is observed due to restructuring of the solvent molecules around
exposed moieties of the hydrogel . Assuming that "Cp between the swelled and collapsed
states of the gel is independent of the temperature in the experimental domain , the
temperature dependences of "HoT and "So
T can be calculated according to the Kirchhoff’s
law:
(9) "HoT = "Ho
m +"Cp (T ! Tm)
(10) "SoT = "So
m +"Cp · ln!
T
Tm
"
where "Hom and "So
m and are the enthalpy and entropy changes at the midpoint of
the collapse transition (i.e., when T = Tm).
Substituting values of Equations 9 and 10 into Equation 8 we get:
(11) "GoT = "Ho
m +"Cp (T ! Tm)! T ·"Som ! T ·"Cp · ln
!T
Tm
"
At T = Tm we have the same concentration of swelled and collapsed gel, so Kc =[C][S] =
1 (from Equation 5 on the previous page), "GoT=Tm
= !R · T · lnKc = !R · T · ln 1 = 0 (from
Equation 7 on the preceding page), and "GoT=Tm
= 0 = "Hom!Tm ·"So
m (from Equation 8).
Therefore "Som = "Ho
mTm
. Substituting "Som into Equation 11 we get:

2.2. RESULTS AND DISCUSSION 57
(12) "GoT = "Ho
m
!1! T
Tm
"+"Cp
#(T ! Tm)! T · ln
!T
Tm
"$
Finally, rearranging Equations 3, 6, 7 and 12 one obtains:
(13) ! = !c !!c ! !s
1 + e!!
(T"Tm)(Tm·!Cp"!Hom)
R·T ·Tm
" %TTm
&!CpR
The results of fitting the experimental data of # variation with temperature, depicted
graphically in Figure 7 on the next page, show that homopolymer PNIPA nanohydrogels
present a sharp volume phase transition while there is not well defined lower critical
solution temperature (LCST) transition for the PNIPA-co-AA nanohydrogels. It has been
demonstrated that physical properties such as LCST of PNIPA nanohydrogels can be
modulated by copolymerization with hydrophilic monomers [57, 36]. Thus, hydrogen
bonds between water and acrylic acid, in addition to those established with the PNIPA
structure, will be form in PNIPA-co-AA nanohydrogels. As hydrophobic interactions are
greatly responsible for the collapse of the nanohydrogel above the LCST, presence of
acrylic acid might also affect the deswelling rate giving rise to a more hydrated collapse
state. This stronger hydrogen bond interaction also have be suggested for Chen et al.
[39] to explain this change in LCST behaviour with PNIPA-co-AA nanohydrogels. So
the collapsing of polymer nanoparticles happens in higher temperature due to more
energy is required to destroy the hydrogen bonds. This behaviour was also observed with
other hydrophilic copolymers, so Mila!inovic et al. [124] observed a similar behaviour
when increasing the hydrophilicity degree by increasing the percentage of itaconic acid.
Thus, the LCST was situated on 34.2 °C for the PNIPA homopolymer with a sharp phase
transition that became less pronounced for hydrogels with 5 and 10% of itaconic acid,
and practically did not exist with 15% of itaconic acid.

58 2. PHYSICO-CHEMICAL CHARACTERIZATION OF POLY (N-ISOPROPYLACRYLAMIDE) NANOHYDROGELS
Ejemplo 1:
Geles: PNIPA con 3 y 5% de entrecruzante y ácido acrílico 0, 10 y 20%.Barrido de temperatura: 16–50 ºCAjustes: Eq. 17
! ! ! ! !! ! !
! !!!!!!! !
!
296 308 319 330T!K
15
30
45
60
!!"M "1 cm"1# PNIPA "5#
! ! !! !
!!
!
!
!
!! ! !
! ! ! !
296 308 319 330T!K
15
30
45
60
!!"M "1 cm"1# PNIPA "3#
! ! ! ! !! !
! !! ! !
! ! ! ! ! !
296 308 319 330T!K
15
30
45
60
!!"M "1 cm"1# PNIPA"10AA"5#
! ! ! !! !
!!! !
! !! !
! ! !!
296 308 319 330T!K
15
30
45
60
!!"M "1 cm"1# PNIPA"10AA"3#
! ! ! !! !
! !! !
! ! !! ! ! ! !
296 308 319 330T!K
15
30
45
60
!!"M "1 cm"1# PNIPA"20 AA"5#
! !! !
!!!!! !
! ! ! ! ! ! ! !
296 308 319 330T!K
15
30
45
60
!!"M "1 cm"1# PNIPA"20 AA"3#
FIGURE 7. Variation of the mean molar absortivity (#, M-1 cm-1) of thestructural unit of PNIPA/AA nanohydrogel aqueous solutions (12.5 mgmL-1), synthesized with 3% and 5% of cross-linking agent (CL), as func-tion of temperature (T, K). The lines are the fitting curves generated fromEquation 13 on the preceding page.
Respect to the CL effect, as we explained in Section 2.2.1, the nanohydrogels with
low CL-percentages show higher variations between swelled and collapsed state due to
its higher elasticity (Figure 7).
In addition, volume phase transition from swell to collapse state should be an endo-
thermic process involving a greater transition heat due to the formation of hydrophobic
interactions [138] and the disappearance of the polymer–water interactions [138, 46]. So

2.2. RESULTS AND DISCUSSION 59
10 20 30 40 500.00
0.05
0.10
0.15
Temperature (ºC)
He
at
flow
(m
W)
FIGURE 8. Differential scanning calorimetry (DSC) analysis of the nan-ohydrogel aqueous solutions (12.5 mg mL-1) of PNIPA(5) (") and PNIPA-20AA(5) (!) nanohydrogels.
the effect of the AA incorporation as comonomer in the NIPA polymer could be studied by
DSC measurements. In the heat flow curve (Figure 8) of PNIPA homopolymer appears an
endothermic peak, which could be attributed to its LCST (around 33 °C). However, DSC
profile of PNIPA-20AA(5) polymer virtually no peak appears or is less intense, consist-
ent with the results obtained with optical density measurements (Figure 7 on the facing
page).
2.2.2.2. Simultaneous temperature and pH-induced collapse. In this case, the ob-
served accompanying the collapse transition mediated by temperature and pH change
would be the sum of two contributions, a free energy change due to a gel state change
mediated by temperature (Equation 12 on page 57, and a free energy change due to a gel
state change mediated by pH. Assuming that follows a profile similar to that associated
with the temperature change:
(14) "GopH = "Ho
pHm
!1! pH
pHm
"+"Cp
#(pH ! pHm)! pH · ln
!pH
pHm
"$

60 2. PHYSICO-CHEMICAL CHARACTERIZATION OF POLY (N-ISOPROPYLACRYLAMIDE) NANOHYDROGELS
where "HopHm
and "SopHm
are the enthalpy and entropy changes at the midpoint of
the collapse transition (i.e., when pH = pHm).
Thus, the overall "Go would be:
(15) "GT oT,pH = "Go
T +"GopH
and Equation 7 on page 55 would become:
(16) Kc = e!!Go
T,pHR·T
Finally, rearranging Equations 3, 6, 12, 14, 15 and 16 one obtains:
(17)
! = !h + !c!!h
1+e
#
$%!Ho
Tm+!Ho
pHm"!Ho
Tm( TTm )"!Ho
pHm( pHpHm )+!Cp((T"Tm)+(pH"pHm))
R·T
&
'(
·
· 1
( TTm
)"!Cp
R ( pHpHm
)"!Cp·pH
R·T
In Figure 9 on the next page the results of fitting the experimental data of # variation
with temperature and pH, after their fitting with Equation 17, showed how the response
of the gels with or without acrylic to the temperature as a function of pH is very different.
PNIPA-20AA(5) nanohydrogel is more swollen at high pHs where the temperature does
practically not affect. As the pH lower the nanohydrogel collapses, i.e. OD increases,
and also increases the influence of temperature. This occured until the nanohydrogel is
sufficiently collapsed due to the effect of pH decreasing the effect of temperature again.
When the value of pH is increased above the pKa of AA (4.35), the ionization of its
carboxylic group is occurred. This fact will affect the LCST since the ionized -COO-
groups are even more hydrophilic, dissapearing the swelling transition phenomena of
the hydrogel. However, in acidic media the carboxylic groups are not ionized, and can

2.2. RESULTS AND DISCUSSION 61
FIGURE 9. Variation of the mean molar absortivity (#, M-1 cm-1) of thestructural unit of PNIPA/AA nanohydrogel aqueous solutions (12.5 mgmL-1), synthesized with 5% of cross-linking agent (CL), as function of tem-peratures (T, K) and pH. The surface represents the fitting of the experi-mental data with the Equation 17 on the facing page.
also take place an additional physical cross-linking resulting from the dimerization of
the carboxylic groups by hydrogen bonds resulting in the collapse of the gel [37].

62 2. PHYSICO-CHEMICAL CHARACTERIZATION OF POLY (N-ISOPROPYLACRYLAMIDE) NANOHYDROGELS
However the pH has no influence in PNIPA(5) nanohydrogel (Figure 9 on the previous
page) because of the absence of ionizable groups in the homopolymer. Díez-Peña [54]
refleted this bahaviour with PNIPA nanohydrogels copolymerized with methacrylic acid
and Yoo et al. [220] in hydrogels of PNIPA copolymerized with AA.
2.2.2.3. Simultaneous temperature and methanol-induced collapse. Using the same
assumptions as for the temperature and pH-induced collapse, the mean molar absort-
ivity profile associated to a hydrogel collapse mediated by a change on temperature and
methanol concentration would be:
(18)
! = !h + !c!!h
1+e
#
$%!Ho
Tm+!Ho
MeOHm"!Ho
Tm( TTm )"!Ho
MeOHm( MeOHMeOHm )+!Cp((T"Tm)+(MeOH"MeOHm))
R·T
&
'(
·
· 1
( TTm
)"!Cp
R ( MeOHMeOHm
)"!Cp·MeOH
R·T
where MeOH is the methanol concentration and MeOHm is the methanol concentra-
tion at the midpoint of the collapse transition.
The variation of the # as function of the volume fraction of methanol (v/v) and tem-
perature after their fitting with Equation 18, is shown in Figure 10 on the next page. For
both, pure PNIPA and PNIPA-co-AA, the nanohydrogel is more collapsed when the volume
fraction of methanol (v/v) is around 0.4 and then reswelled on increasing the alcohol
concentration further. In the same way that in the previous experiments, PNIPA-20AA(5)
nanohydrogel shows similar behaviour to PNIPA(5) but the collapse is less intense.
This observed behaviour has been referenced in previous studies with PNIPA hydro-
gels where it was related with a phenomenon known as cononsolvency, i.e., pure water
and pure alcohol are both good solvents for PNIPA but are not apparently for mixtures of
the two over a certain concentration range [48]. This phenomenon of cononsolvency is
produced by the formation of clathrate structures, consisting of water molecules which

2.2. RESULTS AND DISCUSSION 63
FIGURE 10. Variation of the mean molar absortivity (#, M-1 cm-1) of thestructural unit of PNIPA/AA nanohydrogel aqueous solutions (12.5 mgmL-1), synthesized with 5% of cross-linking agent (CL), as function ofvolume fraction methanol (v/v) and temperature. The surface representsthe fitting of the experimental data with the Equation 18 on the precedingpage.

64 2. PHYSICO-CHEMICAL CHARACTERIZATION OF POLY (N-ISOPROPYLACRYLAMIDE) NANOHYDROGELS
encapsulate alcohol molecules due to local ordering of the water structure [225, 161].
This clathrate structures are stable up to a critical ratio of alcohol to water (allways in
the water-rich region) from which there is no longer water to provide clathrate struc-
tures and therefore the alcohol molecules may contact with another one [225], allowing
the PNIPA nanohydrogel swelling.

CHAPTER 3
Functional characterization of poly
(N-isopropylacrylamide) nanohydrogels for the pimaricin
controlled release
Once studied the physicochemical characteristics of the poly (N-isopropylacrylamide)
(PNIPA) nanohydrogels synthesized with different grades of hydrophilicity by adding acry-
lic acid (AA) as comonomer (Chapter 2 on page 47), in the present chapter we are going
to study their ability to transport and release pimaricin as function of nanohydrogel
composition and ambient conditions in order to evaluate their possible applications in
food packaging.
3.1. Materials and Methods
3.1.1. Materials. Commercial pimaricin (50% pure pimaricin, 50% lactose) was from
VGP Pharmachem (Barcelona, Spain). Dialysis bags (SnakeSkinTM pleated dialysis tubing)
with a molar mass cut-off of 3500 g mol-1 were from Pierce (Rockford, IL, USA). The nan-
ohydrogels employed inthis work were the same as those employed in Chapter 2 on
page 47 (Table 5 on page 48).
3.1.2. Preparation of pimaricin-loaded PNIPA/AA nanohydrogels. PNIPA/AA na-
nohydrogel powder was dispersed in distilled water by agitation for 3 hours at ambient
temperature to allow the nanoparticles to swell properly. This suspension was then
mixed with a pimaricin water solution to obtain final concentrations of 12.5 mg of nano-
hydrogel per mL and 0.4 mg of commercial pimaricin per mL. The mixture was stirred
overnight at 25 °C (below the LCST) to guarantee that the pimaricin was incorporated
65

66 3. FUNCTIONAL CHARACTERIZATION OF POLY (N-ISOPROPYLACRYLAMIDE) NANOHYDROGELS
into the nanohydrogel particles. This mixture was used in further release studies. A
nanohydrogel sample without pimaricin was processed in the same conditions and used
as a control.
For the studies of pimaricin loading efficiency in PNIPA/AA nanohydrogels employing
methanol, pimaricin-loaded PNIPA/AA nanohydrogels were prepared in the same way as
explained above but replacing distilled water by methanol as the solvent to swell the
nanohydrogels and dissolve the pimaricin. After overnight incubation at 25 °C methanol
was removed from pimaricin-loaded PNIPA/AA nanohydrogels sample by evaporation at
25 °C in a rotavapor until dryness. Dryed samples were resuspended in 3 mL of distilled
water for subsequent loading efficiency studies.
3.1.3. Pimaricin loading efficiency in PNIPA/AA nanohydrogels. We evaluate pi-
maricin loading efficiency (E) in PNIPA/AA nanohydrogels employing different nano-
particle carriers: distilled water and methanol.
For loading efficiency studies, 3 mL of pimaricin-loaded nanohydrogel samples, ob-
tained as explained in Section 3.1.2 on the previous page, were placed in a dialysis tube
(3500 g mol-1 MWCO) and dialyzed against 12 mL of distilled water at 25 °C under shak-
ing. At intervals, 1 mL samples were withdrawn from the solution in order to follow the
change in pimaricin concentration. The volume removed from the probe was returned
after measurement. A nanohydrogel sample without pimaricin was processed in the
same conditions as above and then used as control. The experiment was carried out in
duplicate.
The amount of entrapped pimaricin was calculated following the method proposed
by Chen et al. [39]. So E was defined as:
(19) E =Ci ! CmaxPNIPA!Pim 25 ºC
Ci

3.1. MATERIALS AND METHODS 67
where, Ci is the pimaricin amount ($g) initially added to the nanohydrogel solution
and Cmax PNIPA-Pim 25 ºC is the maximum amount of pimaricin ($g) released from nanohydro-
gels at 25 °C.
To calculate Cmax PNIPA-Pim 25 ºC, experimental data were fitted according to the following
equation, adapted from López et al. [111]:
(20)
Ct PNIPA!Pim 25 ºC = CmaxPNIPA!Pim 25 ºC+(C0PNIPA!Pim 25 ºC ! CmaxPNIPA!Pim 25 ºC) ·e!m·t
where, Ct PNIPA-Pim 25 ºC and C0 PNIPA-Pim 25 ºC are the pimaricin amount ($g) at time t and
0 respectively, released from the nanohydrogels through the dialysis membrane at 25
°C. The parameter m (min-1) is the maximum release rate and t (min) is the sampling
time.
Equation 20 is valid in the entire experimental domain, i.e., it is able to fit the pimari-
cin released at 25 °C in a time interval from t0 (initial time) to teq (equilibrium dialysis
time).
3.1.4. Pimaricin release from PNIPA/AA nanohydrogels. For the release studies,
3 mL of pimaricin-loaded nanohydrogel samples, obtained as explained in Section 3.1.2
on page 65, were placed in a dialysis bag and dialyzed against 12 mL of distilled wa-
ter at a constant temperature while agitating constantly. Samples of 1 mL were taken
at intervals from the solution in order to determine the pimaricin concentration. The
volume removed from the probe was returned after measurements had been made. A
nanohydrogel sample without pimaricin was processed under the same conditions and
used as a control. All experiments were carried out in duplicate. In order to determi-
ne the time required to reach dialysis equilibrium, a pimaricin solution (3 mL) with the
same concentration loaded into the nanohydrogels (0.4 mg powder per mL) was dialyzed
against 12 mL of distilled water, as indicated above.

68 3. FUNCTIONAL CHARACTERIZATION OF POLY (N-ISOPROPYLACRYLAMIDE) NANOHYDROGELS
3.1.5. Pimaricin detection and quantification. The pimaricin concentration in the
dialysis media was determined spectrophotometrically at 319 nm (Beckman Coulter Inc.,
Brea, CA, USA). Pimaricin has maximum absorption at 304 nm; however, the suboptimal
peak (90% of the maximum) observed at 319 nm showed the highest value for the pi-
maricin/dialyzed PNIPA absorbance ratio.
The molar absorption coefficient (#) for pimaricin was extrapolated from the linear
fit of the absorbance measurements of pure aqueous pimaricin solutions with known
concentrations from 0.3 to 30 ppm (within the solubility limit). A value of 0.077±0.006 L
$g-1 cm-1 was obtained.
3.1.6. Statistical analysis. Student’s t-test (" = 0.05) was used to analise differ-
ences between two samples for a single variable. Two way analysis of variance (ANOVA)
followed by Bonferroni post-tests was performed for multiple comparisons. Both ana-
lysis were performed by using GraphPad PrismTM 5 (GraphPad Software Inc., San Diego,
CA, USA).
Fitting data were performed by using GraphPad PrismTM 5 (GraphPad Software Inc.,
San Diego, CA, USA). The significance of the model parameters was assessed with Math-
ematica 7 (Wolfram Research, Inc., Champaign, IL, USA).
3.2. Results and Discussion
3.2.1. Pimaricin loading efficiency in PNIPA/AA nanohydrogels. In order to asses
the suitability of nanohydrogels as deliver device in active packaging it is relevant to de-
termine their loading efficiency of the biomolecule. This functional property is influenced
by the chemical composition of particles but also by the way (environmental variables) of
performing the loading process, i.e., the contact time between the nanoparticles and the
biomolecule.
3.2.1.1. Effect of the cross-linking agent content, the incorporation time and the acrylic
acid content. Figure 11 on the facing page shows that E increases when we reduce the
cross-linking agent (CL) content and increase the incorporation time (IT). Also the effect

3.2. RESULTS AND DISCUSSION 69
40
60
80
100
120
0 10 2040
60
80
100
% Acrylic acid
Pim
aricin
loa
din
g e
fficie
ncy (%
)
3%CL
5%CL
FIGURE 11. Pimaricin loading efficiency (E) in the PNIPA/AA nanohydro-gels at 25 °C as function of the cross-linking agent (CL) content and theacrylic acid (AA) content, after 12 h (!) and 60h (") of incorporation time(IT).
of IT in E seems to be more intense when we increase the CL-content. The ANOVA
analysis at 95% confidence level of E shows that the interaction of the CL-percentage
and the IT is significant (p = 0.0004), not significant (p = 0.1137) and significant (p =
0.0033), for 0%AA, 10%AA and 20%AA, respectively. The absence of significance with
10% AA could be due to a high error in the experimental data with 3% CL.
In Chapter 2 on page 47 (Section 2.2.1 on page 49) we explained how the increase in
the CL-content causes a decrease in the particle size (Z-average) for all the nanohydrogels
studied. As the reduction in the Z-average cause a denser nanohydrogel matrix it could

70 3. FUNCTIONAL CHARACTERIZATION OF POLY (N-ISOPROPYLACRYLAMIDE) NANOHYDROGELS
prevent the pimaricin incorporation into the nanohydrogel. These results were consistent
with those observed in another works with PNIPA hydrogels [208, 60].
Moreover the increase of the IT provides more time for the biomolecule to diffuse
into the polymer matrix so the E increases. On the contrary, with 3% CL nanohydrogel
matrix would be expected to be less dense. So the differences varying the IT are less
pronounced and, therefore, 12 h re enough to obtain good values of E.
However the AA-content practically does not effect the E for both IT tested, suggest-
ing that weak chemical interactions between pimaricin and nanohydrogel occurs. Only
after 60 h of IT the AA-content influences the effect of CL-content in the E, leading to
significant (p < 0.05) differences between nanohydrogels with 3% and 5% CL.
The ANOVA analysis supports the results above mentioned. Thus, at 95% confidence
level of E shows that the effect of the AA-content is not significant (p > 0.05) for both 3%
and 5% CL and also for 12 h and 60 h of IT. In contrast, the effect of CL-grade and IT in
the E remains significant (p < 0.05) during all the analysis.
3.2.1.2. Effect of solvent. As observed in Chapter 2 on page 47 (Section 2.2.2.3 on
page 62), the use methanol as solvent varies the swelling extent of the PNIPA nanohydro-
gel depending on the volume fraction of the alcohol employed. Accordingly, the presence
of methanol should also influence the E.
However, although the E in methanol is lower than in water, there are no significative
(p > 0.05) differences employing both solvents (Figure 12 on the next page). This results
agrees with the fact that PNIPA nanohydrogel is always swelled in pure solvent, water or
methanol (Figure 10 on page 63).
In the same way the ANOVA analysis at 95% confidence level of E shows that the
effect of the solvent is not quite significant (p = 0.0731) and the effect of the AA-content
is not significant (p = 0.4020). Also the interaction of these two factors is not significant
(p = 0.7775), i.e., the type of solvent influenced the E independently from the AA-content.

3.2. RESULTS AND DISCUSSION 71
0 10 2020
40
60
80
100
120
% Acrylic acid
Pim
aric
in lo
ad
ing
eff
icie
ncy (
%)
FIGURE 12. Pimaricin loading efficiency (E) in the PNIPA/AA nanohydro-gels with 5% CL at 25 °C as function of the AA-content, in distilled water(!) and methanol (").
3.2.2. Pimaricin release from PNIPA/AA nanohydrogels. Due to the experimental
difficulties in separating the nanohydrogel from free pimaricin, we placed the loaded nan-
ohydrogel in dialysis bags and determined the free pimaricin concentration over time in
the dialysis media (distilled water). Therefore, during the release process, the pimaricin
needed to diffuse through two release layers: the nanohydrogel matrix and the dialysis
bag (Figure 13 on the next page).
The membrane of the dialysis bag could become a barrier to pimaricin molecules,
either because they adhere to the membrane or because they form aggregates [183]
that are larger than the pores of the dialysis bag. Therefore, we study the diffusion of
free pimaricin through the dialysis bag. The results obtained (data not shown) indicate
that diffusion continued until equilibrium was reached and that the dialysis bag did not
influence the release of pimaricin. Hence, the free pimaricin transition to the release
media would only be governed by the capacity of the molecule to diffuse at the tested
temperature. However, all of the pimaricin that has been loaded could not be released

72 3. FUNCTIONAL CHARACTERIZATION OF POLY (N-ISOPROPYLACRYLAMIDE) NANOHYDROGELS
Incorporation
SWOLLEN
STATE
PNIPA (poly (N-isopropylacrylamide)) ! 32 ºC
LCST: lower critical solution temperature
SHRUNKEN
STATE
Release
T > LCST
Dialysis Medium
Dialysis Bag
FIGURE 13. Scheme of pimaricin incorporation into PNIPA/AA nano-hydrogels and release through the dialysis bag in distilled water.
in the dialysis process because the process stops when it reaches the equilibrium con-
centration. Thus, the amount of pimaricin released in the dialysis experiments with
free pimaricin is considered to be the maximum amount of pimaricin released from the
nanohydrogels.
Thus, the relative fraction of pimaricin released (%F t) is defined by the following ex-
pression:
(21) "Ft =Ct PNIPA!Pim
CmaxPim

3.2. RESULTS AND DISCUSSION 73
where Ct PNIPA-Pim is the amount of pimaricin ($g) released from the nanohydrogel to the
dialysis medium (passing through the dialysis membrane) and Cmax Pim is the amount of
pimaricin ($g) under the steady-state conditions determined in the dialysis experiments
with free pimaricin (without nanohydrogel).
To calculate the maximum relative amount of pimaricin released (%Fmax), experi-
mental data are fitted according to the following equation, adapted from López et al.
[111], in the same way that Equation 20 on page 67:
(22) "Ft = "Fmax + ("F0 ! "Fmax) · e(!m·t)
where %Fmax and %F0 are the maximum relative amount of pimaricin and initial re-
lative amount of pimaricin respectively, released from the nanohydrogels through the
dialysis membrane. The parameter m (min-1) is the maximum release rate and t (min) is
the sampling time.
Equation 22 is valid in the entire experimental domain, i.e., it is able to fit the pi-
maricin released in a time interval from t0 (initial time) to teq (equilibrium dialysis time).
Considering that "Fmax = lim "Ft when t tends to infinity, the time needed to reach %Fmax
would be infinity. For the sake of practicality, we decided to calculate teq as the time to
reach 99% of %Fmax.
3.2.2.1. Effect of the cross-linking agent content, the incorporation time and the acrylic
acid content. Figure 14 on the following page shows the effect of nanohydrogel compo-
sition on %Fmax after different IT. The increasing of the IT resultes in the %Fmax decrease
for both 3% and 5% CL. These results are consistent with those obtained for pimaricin
loading efficiency. They suggest that the increasing of E as consequence of higher IT
(Figure 11 on page 69) will cause a deeper inclusion of pimaricin. So pimaricin remains
more entrapped after 60 h of IT preventing its subsequent release. The ANOVA analysis
at 95% confidence level of %Fmax shows that the effect and the IT are extremely significant
(p < 0.0002), for both 3 and 5% CL. Unlike the results obtained in the study of E the

74 3. FUNCTIONAL CHARACTERIZATION OF POLY (N-ISOPROPYLACRYLAMIDE) NANOHYDROGELS
0.0
0.2
0.4
0.6
0.8
0 10 200.0
0.2
0.4
0.6
% Acrylic acid
!Fm
ax
3%CL
5%CL
FIGURE 14. Variation of the maximum relative fraction of pimaricin re-leased (%Fmax) from PNIPA/AA nanohydrogels through the dialysis bag of3500 g mol-1 in distilled water at 37 °C as function of the cross-linkingagent (CL) content and the acrylic acid (AA) content, after 12 h (!) and 60h (") of incorporation time (IT).
ANOVA analysis at 95% confidence level of %Fmax shows that the effect of the AA-content
is now significant (p < 0.0001) for both 3 and 5% CL. It has been demonstrated that the
introduction of AA in the PNIPA nanohydrogel can modulate the collapse grade (Figure 7
on page 58, Chapter 2). This fact greatly affects the biomolecule release.
Otherwise, the effect of the AA-content is very different depending on the CL-content
in the PNIPA/AA nanohydrogel. %Fmax decreases when the AA-content increases with 3%
CL but the results obtained with 5% CL are just the opposite (Figure 14). Additionally,

3.2. RESULTS AND DISCUSSION 75
the analysis of the effect of AA-content and the CL-grade together, at 12h of IT, shows
that AA-content is extremely significant (p < 0.0001) and the effect of the CL-content is
not significant (p = 0.4735). When we increased the IT the effect of the CL-content is
now significant (p = 0.0006) and the effect of AA-content is not significant (p = 0.1214).
However the interaction of these two factors (CL-content and AA-content) is extremely
significant (p < 0.0001), i.e., the CL-grade influenced extremely the effect of AA-content
in the %Fmax. Hence pimaricin release could be prevented by a greater degree of collapse
due to a decrease in the CL-grade. In addition, AA-content and IT will play an important
role in the collapse degree and loading efficiency, respectively, and consequently in the
release.
The following sections will study in more detail the release profiles of pimaricin from
nanohydrogels with different degrees of hydrophilicity.
3.2.3. Pimaricin release from the PNIPA(5) nanohydrogel. The most characteris-
tic features of the release of pimaricin from PNIPA(5) were the strong burst effect asso-
ciated with the pimaricin release curve of the pimaricin-loaded PNIPA(5) nanohydrogel
and the plateau observed at around 10% release (Figure 15 on the following page).
Data derived from Equation 22 on page 73 (Table 6 on the following page) indicate
that the maximum relative fraction of pimaricin released (%Fmax) from the PNIPA(5) nan-
ohydrogel at 37 °C was only 9%, and most of the antifungal remained trapped in the
collapsed nanogel. The maximum release rate (m) was significantly higher (p = 0.0335)
than that obtained in the dialysis experiments with free pimaricin (data not shown), and
the time necessary to reach equilibrium was 0.13 times shorter.
It is well documented that at 37 °C (above the LCST) hydrophobic interactions among
PNIPA chains strengthen dramatically (Section 1.4 on page 40, Chapter 1), which leads
to the collapse of the polymer and the release of significant amounts of water [222, 87].
It has been reported that loaded molecules can become entrapped in the external
part of PNIPA xerogels. Blanco et al. [13] found that methotrexate was released from
PNIPA over 25 h with a burst effect of 71% at 15 min. It has been suggested that the

76 3. FUNCTIONAL CHARACTERIZATION OF POLY (N-ISOPROPYLACRYLAMIDE) NANOHYDROGELS
! "!! #!! $!! %!!!&!!
!&!'
!&(!
!&('
!&"!
!&"'
)*+,-.+*/0
!1
FIGURE 15. Relative fraction of pimaricin released (%F t) from the PNIPA(5)(") and PNIPA-20AA(5) (!) nanohydrogels through the dialysis bag of3500 g mol-1 in distilled water at 37 °C. The lines are the fitting curvesgenerated from Equation 22 on page 73 (r2
PNIPA(5) = 0.9693; r2PNIPA-20AA(5)
= 0.9833).
TABLE 6. Maximum relative fraction of pimaricin released (%Fmax) fromthe nanohydrogels, maximum release rate (m) and equilibrium dialysistime (teq) at 37 °C
Nanohydrogel %Fmax 37 °C m37 °C (min-1) teq 37 °C (h)
PNIPA(5) 0.09±0.002a 44.27x10⁻³±5.76x10⁻³a 1.72
PNIPA-20AA(5) 0.31±0.06b 1.62x10⁻³±0.48x10⁻³b 47.31
Values reported are the means±standard deviation (n = 2).
Different lower case letters in the same column indicate a statistically significant difference (p < 0.05).
fast release of the externally entrapped methotrexate is the cause of the burst effect. The
large size and hydrophobicity of the methotrexate incorporated into the nanohydrogel
structure might contribute to slowing down their release at 37 °C. Zhang et al. [222]
3.2. RESULTS AND DISCUSSION 77
have described similar effects with 5-Fluorouracil entrapped in PNIPA hydrogels. In this
case, some of the drug became entrapped in the shrunken matrix due to the collapse of
the polymer chains and gel volume shrinkage, which slowed down the drug release.
In addiction, pimaricin release from PNIPA nanohydrogels are greatly influenced by
its high molecular weight following the same behaviour observed previously in the lit-
erature for the use of stimuli-sensitive hydrogels for the release of molecules with high
molecular weight, as is the case of peptides and proteins [3, 208]. This behaviour is
based on the assumption that in collapsed state, biomolecules can not be released to the
release media, because they are trapped and could only be released by diffusion through
the polymer in glassy state, which is a very slow process. In contrast, when the poly-
mer matrix expands passes a rubbery state and takes place the biomolecule release that
diffuses into the system formed by the solvent and the polymer [54].
We suggest that because pimaricin is larger (665.725 g mol-1) than methotrexate
(454.46 g mol-1) and 5-Fluorouracil (130.08 g mL-1) and also due to its amphiphilic
nature, pimaricin could not be released from the PNIPA nanohydrogel (and/or the pi-
maricin was entrapped in the shrunken matrix). The burst effect at the beginning could
be because the pimaricin was in a very exposed location within the nanohydrogel struc-
ture and so it could be released quickly when the water was expelled from the inside,
coinciding with the collapse of the nanogel network.
3.2.4. Pimaricin release from the PNIPA-20AA(5) nanohydrogel. As explained in
Section 1.4 on page 40 (Chapter 1), the physical properties (LCST) of PNIPA nanohydro-
gels can be modulated by copolymerization with hydrophilic monomers [164, 57, 124]. It
is expected that adding AA will promote the formation of new hydrogen bonds with water.
As explained above, PNIPA-20AA(5) nanoparticles are larger than PNIPA(5) nanoparticles
because they are able to capture more water.
The release kinetic from the PNIPA-20AA(5) nanohydrogel showed a very different
profile from that of the PNIPA(5) nanohydrogel (Figure 15 on the preceding page). There

78 3. FUNCTIONAL CHARACTERIZATION OF POLY (N-ISOPROPYLACRYLAMIDE) NANOHYDROGELS
was no burst effect, but rather the pimaricin was released steadily. According to Mil-
a!inovic et al. [124], the absence of the initial burst suggests that the pimaricin is
trapped in the nanogel structure, unlike the previous assayed nanogel in which sig-
nificant amounts of pimaricin seem to remain exposed on the surface of the nanogel
particles.
The maximum amount of pimaricin released from the PNIPA-20AA(5) nanohydrogel
was also significantly higher (p = 0.0309) than that released from the PNIPA(5) nano-
hydrogel (Table 6 on page 76), although it took a very long time to reach the steady state.
The m value was significantly lower than that obtained for the PNIPA(5) nanohydrogel (p
= 0.0272) and the dialysis experiments with free pimaricin (p = 0.0087). This continu-
ous efflux of pimaricin to the medium indicates that the PNIPA-20AA(5) nanohydrogel
imposed less diffusional restrictions than PNIPA(5).
3.2.5. Release modelling. To describe the release profile and choose the paramet-
ers that help to describe and characterize the type of release, the early-time release data
were fitted with different well-known mathematical models [13, 1, 73] as follows:
Zero-order kinetic model
(23) "Ft = k0 · t
First-order model
(24) "Ft = 1! ek1·t
Higuchi model
(25) "Ft = kH · t1/2
3.2. RESULTS AND DISCUSSION 79
Hixson-Crowell cube root model
(26) "Ft = 1! (1! kH!C · t)3
Korsmeyer–Peppas model
(27) "Ft = kK!P · tn
where, %Ft is the fraction of pimaricin released as already explained in Equation 3
on page 55. The terms k0, k1, kH, kH-C and kK-P refer to the release kinetic constants
obtained after fitting with zero-order, first-order, Higuchi, Hixson-Crowell cube root and
Korsmeyer–Peppas models, respectively.
In all equations, k is a constant that depends on the drug-polymer system charac-
teristics, and n is the diffusional exponent that depends on both the geometry of the
delivery system and the physical mechanisms involved [152]. Thus, according to the n
value the release from a spherical particle can be catalogued into one of the following
diffusion mechanisms [73]:
- n $ 0.43: Fickian diffusion (Case I). Drug release is controlled only by diffusion into
the release media.
- n % 0.85: Case II transport. Drug release is controlled by the collapse and swelling
mechanism.
- 0.43 < n < 0.85: Non-Fickian transport or anomalous transport. Drug release is
controlled by both mechanism.
In general, the goodness of fit for the models investigated ranked in the following
order: Korsmeyer-Peppas > Higuchi > first-order > Hixson-Crowell > zero-order (Table 7
on the following page). Thus, Korsmeyer-Peppas model was that best described the
pimaricin release kinetics from nanohydrogels studied.

80 3. FUNCTIONAL CHARACTERIZATION OF POLY (N-ISOPROPYLACRYLAMIDE) NANOHYDROGELS
TABLE 7. Best-fit parameters of the kinetic models proposed (Equations23- 10 on page 56) for pimaricin release from PNIPA nanohydrogels at 37ºC
Kinetic model PNIPA(5) PNIPA-20AA(5)
zero-order k0 23.80x10⁻⁴±3.14x10⁻⁴** 3.50x10⁻⁴±0.15x10⁻⁴***
r2 0.8186 0.9288
first-order k1 24.64x10⁻⁴±3.23x10⁻⁴** 3.84x10⁻⁴±0.15x10⁻⁴***
r2 0.8305 0.9469
Higuchi kH 117.70x10⁻⁴±3.98x10⁻⁴*** 70.64x10⁻⁴±2.58x10⁻⁴***
r2 0.9875 0.9452
Hixson-Crowell
cube root
kH-C 8.12x10⁻⁴±1.07x10⁻⁴** 1.24x10⁻⁴±2.58x10⁻⁴***
r2 0.8266 0.9413
Korsmeyer–Peppas kK-P 162.40x10⁻⁴±34.60x10-4* 22.25x10-4±5.65x10⁻⁴**
n 0.40±0.07* 0.70±0.04***
r2 0.9941 0.9837
Values reported are the means±standard deviation (n = 2).
n.s.(p > 0.05): not significant.
*(p < 0.05): significant.
**(p < 0.01): very significant.
***(p < 0.001): extremely significant.

3.2. RESULTS AND DISCUSSION 81
The values of diffusion exponent n were very different for each drug-polymer system.
The release mechanism from PNIPA(5) nanohydrogel was Fickian diffusion (Case I) and
otherwise from PNIPA-20AA(5) nanohydrogel the release was classified as Non-Fickian
transport. From these results, it can be assumed that the pimaricin released from the
most hydrophobic nanohydrogel probably only corresponds to that encapsulated on the
nanogel particle surface, which probably was thrown out by convective forces generated
by the nanogel collapse and then was released by diffusion through the dialysis tube.
In case of the hydrophilic nanohydrogel, as explained in as explained in the previous
section, the pimaricin was released by diffusion from inside the polymer matrix, appar-
ently with greater difficulty than when it remained in the polymer surface, leading to an
increase in the diffusion coefficient value.
3.2.6. Effect of temperature and pH on the release of pimaricin from nano-
hydrogels. To clarify the processes involved in the release of pimaricin from nanohydro-
gels with and without AA, we conducted a new experiment in which the nanohydrogels
were loaded with pimaricin at 25°C as in the previous assays and then used to obtain
the different kinetic profiles by dialysis at 15, 25, 37 and 47 °C (Figure 16). In the same
way, the effect of the pH was evaluated varying the pH of the release medium from 3 to
8 (Figure 17 on the next page). The effect of the pH was only evaluated in the release of
pimaricin from nanohydrogels with AA since, as we saw in Section 2.2.2.2 on page 59
(Chapter 2).
As the temperature increased, the %Fmax value of the PNIPA-20AA(5) nanohydrogel
increased up to a maximum and then decreased slightly. However, significantly less
pimaricin was released from the PNIPA(5) nanohydrogel as the temperature increased
(Figure 16 on the next page). Therefore, by plotting the maximum relative fractional
release (%Fmax) against temperature (T ), it was possible to observe a well-defined optima,
and thus the following second-order polynomial function was fitted with the experimental
data:

82 3. FUNCTIONAL CHARACTERIZATION OF POLY (N-ISOPROPYLACRYLAMIDE) NANOHYDROGELS
! "! #! $! %! &!!'!
!'#
!'%
!'(
!')
*+,-+./01.+23456
!7,/8
FIGURE 16. Variation of the maximum relative fraction of pimaricin re-leased (%Fmax) from the PNIPA(5) (") and PNIPA-20AA(5) (!) nanohydro-gels through the dialysis bag of 3500 g mol-1 in distilled water in relationto temperature. The lines are the fitting curves generated from Equa-tion 28 on the facing page (r2
PNIPA(5) = 0.9896; r2PNIPA-20AA(5) = 0.9725).
0 2 4 6 8 100.0
0.2
0.4
0.6
0.8
pH
!Fm
ax
pKa AA = 4.35
FIGURE 17. Variation of the maximum relative fraction of pimaricin re-leased (%Fmax) from the PNIPA-20AA(5) nanohydrogels through the dia-lysis bag of 3500 g mol-1 in distilled water at 25 ºC (!) and 37ºC (") inrelation to pH. The lines are the fitting curves generated from Equation 28on the facing page (r2
PNIPA(5) = 1.0000; r2PNIPA-20AA(5) = 1.0000).

3.2. RESULTS AND DISCUSSION 83
(28) "Fmax = a0 + a1 · T + a2 · T 2
By deriving the functions obtained in relation to the temperature and solving the
roots of the resulting functions, the optimal temperature at which the largest amount of
pimaricin was released was calculated to be 40.04 °C for the PNIPA-20AA(5) nanohydro-
gel and -1.25 °C for the PNIPA(5) nanohydrogel. This latter optimum temperature value
is obviously located outside the experimental domain. Even so, the trend predicted by
the model clearly indicates that for the PNIPA(5) nanohydrogel a decrease in temperature
would lead to an increase in the amount of pimaricin released (Figure 16 on the facing
page).
The observed behaviour could be interpreted as resulting from the temperature cau-
sing the nanohydrogel collapse in acordance with the nanohydrogel behaviour observed
in Section 2.2.2 on page 53 (Chapter 2). Hydrophobic interactions are one of the main
factors leading to the collapse of a nanohydrogel above the LCST [57]. The presence of AA
might also affect the deswelling rate, and give rise to a more hydrated collapse state that
facilitates the continuous diffusion of pimaricin to the medium. However, the collapse
of the less hydrated PNIPA(5) nanohydrogel would be more intense, trapping pimaricin
molecules within the shrunken matrix and aborting their release (Figure 16 on the facing
page).
Respect to the pimaricin release from PNIPA-20AA(5) nanohydrogel was very different
above and below the pKa of AA (Figure 17 on the preceding page). The effect is similar to
that explained in the preceding paragraphs when we analysed the effect of temperature
in the pimaricin release from PNIPA/AA nanohydrogels. As we saw in Section 2.2.2.2
on page 59 (Chapter 2), when we decrease the pH of the release medium the collapse of
the PNIPA-co-AA was increased and therefore the pimaricin release was also increased.
However above the pKa of the AA the nanohydrogel collase was too intense avoiding the
pimaricin relase that remain trapped in its matrix. In the same way as in the study

84 3. FUNCTIONAL CHARACTERIZATION OF POLY (N-ISOPROPYLACRYLAMIDE) NANOHYDROGELS
FIGURE 18. Variation of the concentration of pimaricin released (Ct) froma free pimaricin solution (A) and a pimaricin-loaded PNIPA-20AA(5) nano-hydrogel supension (B) through the dialysis bag of 3500 g mol-1 in distilledwater in relation to temperature. The experimental data are representedas ". The responsive surface are the fitting generated from Equation 30on page 86 (r2
Pim (A) = 0.9940; r2PNIPA-20AA(5)-Pim (B) = 0.9796).
of the effect of temperature, by plotting the maximum relative fractional release (%Fmax)
against pH (T ), it was possible to observe a well-defined optima, and thus the following
second-order polynomial function was fitted with the experimental data:
(29) "Fmax = a0 + a1 · pH + a2 · pH2
By deriving the functions obtained in relation to the pH and solving the roots of
the resulting functions, the optimal pH at which the largest amount of pimaricin was
released was calculated to be 5 for the PNIPA-20AA(5) nanohydrogel for both, 25 ºC and
37 ºC (Figure 17 on page 82).
In order to conduct a more complete study, we evaluated the combined effect of tem-
perature and pH on the pimaricin release from the nanohydrogel with acrylic (PNIPA-
20AA(5) throughout the time. That is why we developed an equation that allowed calcu-
late the concentration of pimaricin (Ct) as function of time released through the dialysis

3.2. RESULTS AND DISCUSSION 85
TABLE 8. Variation of the fitting parameters calculated with Equation 30on the next page that allow calculate the concentration of pimaricin re-leased (Ct) from a free pimaricin solution (Pim) and a pimaricin-loadedPNIPA-20AA(5) nanohydrogel supension (PNIPA-20AA(5)-Pim) through thedialysis bag of 3500 g mol-1 in distilled water in relation to temperature
Treatment Pim PNIPA-20AA(5)-Pim
C0 0.179±0.058** 0.063±0.055n.s.
Cmax 4.110±0.136*** 2.445±0.153***
m 0.011±0.001*** 0.021±0.005***
" -0.343±0.893n.s. 7.957±1.935***
& 24.074±2.809*** 35.578±6.322***
Values reported are the means±standard deviation (n = 2).
n.s.(p > 0.05): not significant.
*(p < 0.05): significant.
**(p < 0.01): very significant.
***(p < 0.001): extremely significant.
tube from a free pimaricin solution and from a pimaricin-loaded nanohydrogel suspen-
sion. In this same work we also evaluated the maximum pimaricin released as function
of the temperature of the release media. As the maximum concentration of pimaricin
reached in the release media (Cmax) and the release rate (m) is highly dependent of the
temperature, we could calculate the Ct at each sampling time and temperature in the
grape juice in order to evaluate the specific inhibition:

86 3. FUNCTIONAL CHARACTERIZATION OF POLY (N-ISOPROPYLACRYLAMIDE) NANOHYDROGELS
(30) Ct = Cmax · e! !T +
'C0 ! Cmax · e !
T(· e!m·e"
"T ·t
where C0 is the initial concentration of pimaricin (µg mL-1) in the release media. t is
the sampling time and T the temperature.
The variation of the concentration of pimaricin in the release media with time as
function of temperature in samples treated with free pimaricin and pimaricin-loaded
PNIPA-20AA(5) nanohydrogel are represented in Figure 18 on page 84. When the pimari-
cin was free the Cmax achieved in the release media was the same for all temperatures as
there was nothing that interfere in the pimaricin release this is why " is not significant
(p > 0.05) (Table 8 on the previous page). However the parameter m is significant (p <
0.001) (Table 8 on the preceding page) as the release rate should change as funtion of
the temperature as the diffusion of the molecules increased when the temperature in-
crease. On the other hand, the Cmax is highly afected by the temperature (Table 8 on the
previous page) as we saw in Section 2.2.2 on page 53 (Chapter 2) because of the effect
of the nanohydrogel collapse. In any case the Equation 5 on page 55 provides a high
degree of fit (Figure 18 on page 84) to experimental data that allows us to calculate the
Ct in the grape juice over bioassay taking into account the temperature change from 8
°C to 25 °C.
3.2.7. Sustained Controlled Release. After studying the different capacities of P-
NIPA nanohydrogels to transport and release pimaricin when the temperature is in-
creased above its LCST, we then alternated temperature cycles to determine whether or
not this release is sustained over time. This is important because in the food industry it
may be necessary to release the antifungal in various cycles.
Therefore, we analysed pimaricin release from nanohydrogels with stepwise tempera-
ture changes between 15 and 37 °C. The cumulative pimaricin release profiles as well as

3.2. RESULTS AND DISCUSSION 87
0 200 400 600 8000
10
20
30
0 200 400 6000.00
0.05
0.10
Re
lea
se
ra
te (µ
g m
in-1
)
0.00
0.05
0.10
0.15
0.20!F
accum
ula
ted
0
10
20
30
40
Te
mp
era
ture
(ºC
)
time (min)
PNIPA(5) PNIPA-20AA(5)
FIGURE 19. Relative fraction of accumulated pimaricin released and therelease rate of pimaricin from the PNIPA(5) and PNIPA-20AA(5) nano-hydrogels through the dialysis bag of 3500 g mol-1 in distilled water. Thedashed line shows the temperature cycling of the release medium between37 °C and 15 °C.
the pimaricin release rate as a function of pulsatile temperature are shown in Figure 19
on the next page.
The results for the PNIPA(5) nanohydrogel were consistent with the positive squeez-
ing mechanism reported in the literature [23, 172, 208]. When the temperature was
increased, the release rate peaked rapidly followed by a very slow release process. Pi-
maricin release stopped after two temperature pulses and during these cycles 15% was
released, which indicates that the deswelling process did not help to squeeze more pi-
maricin out of the gel matrix.
However, when AA was added to the PNIPA-20AA(5) nanohydrogel, the temperature
changes did not affect the release rate as dramatically. Although the biggest release peak

88 3. FUNCTIONAL CHARACTERIZATION OF POLY (N-ISOPROPYLACRYLAMIDE) NANOHYDROGELS
occurred in the first cycle at 37 °C, after the third cycle at this temperature the release
rate still remained apparently constant.
Therefore, higher releases were obtained by alternating on/off cycles, and conse-
quently there were larger amounts of pimaricin in the release medium than in a single
cycle at 37 °C, although with the PNIPA-20AA(5) nanohydrogel a more sustained release
over time was achieved.
CHAPTER 4
Evaluation of antimicrobial effectiveness of
pimaricin-loaded thermosensitive nanohydrogels in
cheeses from Arzúa-Ulloa DOP
In Chapter 3 on page 65 we have demonstrate the validity of poly (N-isopropylacrylamide)
(PNIPA) nanohydrogels to transport and release pimaricin, being able to modulate its re-
lease patterns by varying the nanoparticle hydrophilicity and the temperature. Thus,
the more hydrophilic nanohydrogels -PNIPA nanohydrogel copolymerized with acrylic
acid (AA)- lead to a sustained pimaricin controlled release over time.
Taking into account the potential application of the pimaricin-nanohydrogel system
for antimicrobial active packaging, in this Chapter we aimed to evaluate the effectiveness
of the pimaricin-loaded PNIPA nanodevices in controlling mould spoilage employing a
food model system consisting in Potato Dextrose Agar (PDA) plates. In order to assess the
protective effect of nanohydrogels, mould spoilage was evaluated under favourable and
unfavourable conditions for the chemical stability of pimaricin. In addition we evaluate
the ability of pimaricin-loaded PNIPA nanohydrogels to avoid the growth of microbial
spoilage in a real food. For this purpose we assayed the pimaricin-loaded PNIPA-20AA(5)
nanohydrogel system to prevent natural and artificial contamination in cheese samples
from Arzúa-Ulloa DOP stored under different thermal conditions simulating a break in
the cold chain.
89

90 4. ANTIMICROBIAL EFFECTIVENESS OF PIMARICIN-LOADED NANOHYDROGELS IN CHEESES
4.1. Material and Methods
4.1.1. Preparation of pimaricin-loaded nanohydrogel. Commercial pimaricin (50%
pure pimaricin, 50% lactose) was from VGP Pharmachem (Barcelona, Spain) and the
nanohydrogel employed in this work was NIPA copolymerized with 20% AA (PNIPA-
20AA(5)). The nanohydrogel synthesis and preparation of pimaricin-loaded nanohydrogel
were performed as previously described (Section 2.1.2 on page 47, Chapter 2).
4.1.2. Inhibition studies employing a food model system. We designed a food
model system consisting of Petri dishes with 5 mL of PDA (DifcoTM, Detroit, MI, USA).
In order to simulate favourable (A) and unfavourable (B) conditions for the chemical
stability of pimaricin, we considered the following conditions:
A: PDA agar without acidification and plate storage under dark conditions.
B: Acidified PDA agar (pH = 3) with 10% (w/v) L(+)-tartaric acid (Panreac, Bar-
celona, Spain) and plate storage under fluorescent lighting.
The antimicrobial effectiveness of the nanohydrogel-pimaricin system (NP) was evalu-
ated together with control treatments in which the nanohydrogel-pimaricin system was
substituted by distilled water (C), the nanohydrogel (N) and free pimaricin (P). The nan-
ohydrogel and pimaricin concentrations and ratios were the same as those used for the
release studies.
An aliquot of 25 $L of a 12 h-culture of Saccharomyces cerevisiae (Sc 1.02) (30x107
UFC mL-1) was inoculated in triplicate into the Petri dishes. After 1 hour in the fridge
to allow the inoculated culture to be absorbed properly, 100 $L of each antimicrobial
sample (NP, N, C and P) was spread over the plate surface. All plates were incubated at
4 °C for 7 days and then at 25 °C until the end of the experiment (15 days).

4.1. MATERIAL AND METHODS 91
4.1.3. Preparation of Arzúa-Ulloa DOP cheeses coated with pimaricin-loaded
PNIPA nanohydrogels. The antimicrobial effectiveness of the pimaricin-loaded PNIPA-
20AA(5) nanohydrogel system, was assayed both against endogenous and artificial con-
tamination in cheese samples from Arzúa-Ulloa DOP stored under conditions of thermal
abuse, in two different bioassays.
For the first bioassay (cheeses with natutal contamination), 80 pieces of fresh cheese
from Arzúa-Ulloa DOP (3 days of ripening after manufacture) with similar dimensions
and an average weight of 13 g, were randomly distributed among four treatments: un-
treated cheese (C), cheese treated with a 12.5 mg mL-1 nanohydrogel suspension (N),
cheese treated with a 0.4 mg mL-1 commercial pimaricin solutio (P), and cheese treated
with pimaricin-loaded nanohydrogel suspension (at the same concentrations). To apply
the treatments 0.5 mL of each suspension was spread over the cheese surface using a
sterile inoculating loop. Cheeses were incubated at 8 ºC for 7 days in order to ensure
a proper temperature for cheese ripening. After this period, the incubation temperature
was lowered to 4 ºC (typical storage conditions) during 64 days. Then to simulate a break
in the cold chain the temperature was raised to 37 ºC for 12 h on day 16 of storage. Four
cheese samples per treatment were analyzed at 7, 16, 30, 43 and 64 days after cheese
manufacture. Four cheese samples were analyzed at initial time before applying any
treatment.
For the second bioassay (cheeses with artificial contamination), 102 pieces of fresh
cheeses from Arzúa-Ulloa DOP (2 days of ripening after manufacture) were prepared.
After 8 days of storage (after cheese sampling), cheeses were inoculated with a 12-hour
culture (260x105 CFU g-1) of Sc 1.02, obtained after growth in yeast extract-peptone-
glucose (YPD) medium (Panreac, Barcelona, Spain) at 30 ºC. Cheeses were of similar
dimensions and an average weight of 13 g and were distributed and treated in the same
way as in the previous bioassay. However, the total assay duration was 30 days and
the simulation in the broken cold chain was carried out increasing the temperature at
various points of storage time: at 8 (after cheese sampling) and 14 days of storage from 4

92 4. ANTIMICROBIAL EFFECTIVENESS OF PIMARICIN-LOADED NANOHYDROGELS IN CHEESES
to 37 ºC during 80 min and at 17, 21 and 29 days of storage from 4 to 25 ºC during 180
min. Cheese samples were analyzed at 8, 15, 22 and 30 days after cheese manufacture.
At each sampling time, six samples per treatment were analyzed, of which two were used
for water activity analysis and four for the remaining analysis. Six samples of cheese
were analyzed at initial time, before applying any treatment.
4.1.4. Physico-chemical cheese analysis. Weight loss of cheese samples was cal-
culated as the percentage of weight loss from the initial cheese weight after treatment
application.
For determination of the water activity (aw) cheese samples were previously cut into a
grinder. The aw values were obtained at 25 °C using a LabMaster-aw (Novasina, Switzer-
land).
The colour of surface cheese samples was measured with a colorimeter Chroma CR-
400/410 (Konica Minolta, Japan), using CIE L*a*b* coordinates, where L* corresponds
to lightness, a* to red/green chromaticity and b* to yellow/blue chromaticity. The ins-
trument was calibrated with a white standard plate. The cheese colour was expressed
by the total colour difference (!E*), which was calculated according to the following
equation reported by MacDougall [112]:
(31) "E# ='"L#2 +"a#2 +"b#2
(1/2
where, !L*, !a* and !b* are the differences in L*a*b* coordinates between the initial
values (before coating) and the values measured during the experiment.
The pH of cheese samples was measured after homogenizing the samples in a Sto-
macher® 3500 (Seward Medical, UK).
4.1.5. Microbiological analysis. Total fungal and mesophilic counts were determi-
ned using standard plate count (SPC), with PDA acidified to pH 3.5 with 10% (w/v)
L(+)-tartaric acid and Plate Count Agar (PCA, DifcoTM, Detroit, MI, USA) respectively.

4.1. MATERIAL AND METHODS 93
Each sample was homogenized with 100 mL of 0.8% (w/v) sterile saline solution (Pan-
reac, Barcelona, Spain) for 1 minute in a Stomacher® 3500. Tenfold serial dilutions
were performed for each sample and aliquots (100 $L) of the appropriate dilutions were
inoculated in PDA and PCA and incubated at 25 °C for 7 days and 30 ºC for 48 hours
to enumerate total fungal counts and mesophilic counts, respectively. To ensure the
reproducibility of fungal counts, an aliquot of homogenized samples was resuspended in
Tryptic Soy Broth (TSB, Cultimed, Panreac, Barcelona, Spain) for 2 h (0.5 mL/4.5 mL)
to revive the propagules and 10-fold serial dilutions were obtained in 0.8%, w/v sterile
saline solution with 0.01% (w/v) Tween® 80 (Panreac, Barcelona, Spain).
Total fungal counts were also determined by quantitative polymerase chain reaction
(qPCR) whose procedure is described in the following sections.
4.1.5.1. DNA extraction. 10 mL from from the homogenates used for microbiological
analysis were centrifuged (4000 rpm, 10 min) and washed twice with 10 mL and 1 mL
of sterile phosphate buffered saline (PBS, Panreac, Barcelona, Spain), respectively. Pel-
lets were resuspended in 550 µL Buffer BCF from Speedtools Food DNA extraction Kit
(Biotools, B&M Labs. S.A.) and incubated overnight at 65 ºC. Samples were transferred
to a 2-mL sterile tubes containing 0.25 g of 425-600 µm-diameter and 0.25 g of $ 106
µm-diameter glass beads acid washed from Sigma-Aldrich (Munich, Germany). Tubes
were shaken in a Tissuelyser® LT (Qiagen, Venlo, The Netherlands) for 3 min at 50 Hz
and then centrifuged at 10,000 rpm for 10 min. Supernatants were transferred to a new
sterile tube and Genomic DNA extracted with the Speedtools Food DNA extraction Kit
(Biotools, B&M Labs. S.A.). Then DNA was purified with StrataPrep PCR Purification Kit
(Stratagene, Agilent Technologies España, S.L., Madrid).
The concentration and purity of DNA were determined using a Nanodrop 2000c
(ThermoFisher Scientific, Spain).
4.1.5.2. Sensitivity, detection limit and linearity of the qPCR assay. The sensitivity,
detection limit and linearity of the qPCR assay for the total fungal count, was determined
using a 12-hour pure culture of Sc 1.02. Genomic DNA was extracted from as explained

94 4. ANTIMICROBIAL EFFECTIVENESS OF PIMARICIN-LOADED NANOHYDROGELS IN CHEESES
in Section 4.1.5.1 on the preceding page for the cheese samples. A standard curve from
Sc 1.02 genomic DNA was obtained by plotting the cycle threshold (CT) against the Sc
1.02 cell quantity expressed as log (CFU mL-1). Counts were obtained by plating tenfold
serial dilutions of the Sc 1.02 culture in PDA.
The amplification efficiency (E) was estimated from the slope (k) of the standard
curve, using the formula E ='10! 1
k
(! 1. A reaction with E = 1 generated a slope of
-3.32.
Additionally we performed another standard curve employing Arzúa-Ulloa cheese to
evaluate the quantification range, linearity and sensitivity in this food matrix. Sliced
commercial cheese samples (10 g per sample) were sterilized under UV exposure during
75 min. Cheese samples were inoculated with 1 mL of a batch of 10-fold serial dilu-
tions from a 12-hour culture. Then cheese samples were homogenized for 1 min in a
Stomacher® 3500. and the CFU mL-1 determined in PDA plates. The standard curve
in cheese was obtained plotting CT values against the log (CFU mL-1) of Sc 1.02. Four
replicates for each curve were obtained.
4.1.5.3. qPCR assay. Primers NL1, (5’-GCC ATA TCA ATA AGC GGA GGA AAA G-3’)
and LS2 (5’-ATT CCC AAA CAA CTC GAC TC-3’), corresponding to nucleotide positions
266 to 285 on the Saccharomyces cerevisiae 26S RNA gene [44], were used to amplify a
region of approximately 250 nucleotides. qPCR was performed in a final volume of 25 µL
employing Brilliant II SYBR® Green QPCR Master Mix (Stratagene, Agilent Technologies
S.L., Spain), ROX dye reference (final concentration, 30 nM), primers (final concentra-
tion, 400 nM), and 3 µL of template DNA. Thermal cycling conditions were as follows:
95 ºC for 10 min, 40 cycles of 95 ºC for 30 s, 55 ºC for 1 min and 72 ºC for 1 min.
Thermal cycling, fluorescent data collection, and data analysis were carried out with
Mx3000P QPCR system with MxProTM QPCR Software (Stratagene, Agilent Technologies
S.L., Spain).
4.1.6. Statistical analysis. Differences in antimicrobial effectiveness amongst treat-
ments were evaluated by analysis of variance (ANOVA) followed by Bonferroni post-tests

4.2. RESULTS AND DISCUSSION 95
for multiple comparisons by using GraphPad PrismTM 5 (GraphPad Software Inc., San
Diego, CA, USA).
4.2. Results and Discussion
4.2.1. Inhibition studies employing food model systems. To evaluate the anti-
microbial effectiveness of the pimaricin-nanohydrogel system proposed, we conduct ex-
periments using a food model system consisting of PDA plates. In addition, this assay
is used to assess the capacity of nanohydrogels to protect the pimaricin by keeping it
chemically stable under favourable (A) and unfavourable (B) conditions since critical
amounts of pimaricin could be degraded under acidic conditions [183] and fluorescent
lighting. Koontz et al. [99] addressed this problem and studied how forming inclusion
complexes of pimaricin and cyclodextrins increased the stability of pimaricin compared
to free pimaricin in cheese products stored under high-intensity fluorescent lighting in
supermarket freezer showcases.
No growth is observed at 4 °C (Table 9 on the next page) in any of the plates or
storage conditions (A or B) assayed. When the temperature increases up to 25 °C and
under favourable conditions for pimaricin stability (A), growth peaked rapidly and counts
are above the limit (CFU > 75, in 5 mL of medium) for controls without pimaricin (C and
N). Nonetheless, when pimaricin is present, there is much less growth, especially in
those plates containing pimaricin in the nanohydrogel (Table 9 on the following page).
In plates under unfavourable conditions (B: acidic medium and storage under fluo-
rescent lighting), counts are low for all treatments because yeast grows more slowly in
acidic media; however, the poorest growth is again observed on plates with the pimaricin-
loaded nanohydrogel (Table 9 on the next page).
In order to quantify these effects, we calculate the percentage reduction in microbial
growth as follows:

96 4. ANTIMICROBIAL EFFECTIVENESS OF PIMARICIN-LOADED NANOHYDROGELS IN CHEESES
TABLE 9. Counts (CFU) of Saccharomyces cerevisiae (Sc 1.02) on PDAagar plates without acidification stored under dark conditions (A), andacidified PDA agar plates stored under fluorescent lighting (B), treatedwith distilled water (C), nanohydrogel (N), free pimaricin (P) and thenanohydrogel-pimaricin system (NP)
4 ºC 25 ºC
2 days 7 days 9 days 15 days
A B A B A B A B
C - - - - 347.0±33.1 11.7±12.6 327.3±23.8 19.7±13.5
N - - - - 405.7±46.5 54.0±26.1 346.7±37.3 57.0±22.7
P - - - - 65.7±3.8 0.3±0.6 64.0±7.8 4.7±2.1
NP - - - - 29.3±10.0 - 26.3±9.1 0.3±0.6
Values reported are the means±standard deviation (n = 3).
(32) %R =
!N0 !N
N0
"· 100
where, N0 is the mean count on control plates (C) and N is the mean count on plates
with pimaricin (P) and pimaricin-loaded nanohydrogel (NP), both expressed as Log (CFU
mL-1 ).
For plates under (A) conditions, the NP treatment shows a reduction of 27.07±4.15%,
which is higher than that observed on plates with the P treatment, which shows a reduc-
tion of 17.26±1.34%, although the difference between the two treatments is not signific-
ant (p > 0.05). However, under (B) conditions, there is a larger difference between the

4.2. RESULTS AND DISCUSSION 97
NP and P treatments. The reduction on plates with the NP treatment is 80.94±33.02%,
which is significantly higher (p < 0.01) than that observed on plates with the P treat-
ment, 19.91±6.68%. In any case, the ANOVA analysis at a 95% level of confidence the
percentage reduction (%R) shows that the effect of the treatment is very significant (p =
0.0069) and the effect of growth conditions (pH, light) is significant (p = 0.0205). The
interaction between these two factors is also significant (p = 0.0311), i.e., the treatment
does not have the same effect under the two growth conditions assayed.
Therefore, the antifungal effect of pimaricin is potentiated when it is applied loaded
into the PNIPA-20AA(5) nanohydrogel probably because pimaricin is released slowly
when environmental conditions required it. This seems to indicate that the nanohy-
drogel has a protective effect against degrading conditions (pH, light), which thus make
the antifungal effect of pimaricin more intense.
Therefore, the nanohydrogel-pimaricin system proposed in this work would be use-
ful in packaging for food products that are easily spoiled by fungal growth (i.e., which
have low pH and a high moisture content) and that are normally exposed to changes in
storage temperature due to transport and shelf time. As pimaricin is usually used to
prevent moulds and yeasts growing on the surface of cheese we are currently performing
experiments with cheese samples to test PNIPA-nanohydrogel systems. The controlled
release of pimaricin from PNIPA nanohydrogels could reduce the amount of pimaricin on
the surface of the cheese, and therefore reduce the amount that migrates to the cheese
bulk.
4.2.2. Effect of nanohydrogel coating on cheeses from Arzúa-Ulloa DOP. During
cheese ripening microbiological, enzymatic and physico-chemical changes determine the
cheese texture, taste and flavour and, consequently, the final consumer acceptance.
The main physico-chemical changes of cheese ripening, such as weight loss and surface
colour, are related with mass transfer process both inside the cheese and between the
cheese and the atmospheric environment. Thus, properties of cheese out-layer have a
great influence in these physico-chemical changes and can be easily modified by surface

98 4. ANTIMICROBIAL EFFECTIVENESS OF PIMARICIN-LOADED NANOHYDROGELS IN CHEESES
7 16 30 43 640
10
20
30
40
50
7 16 30 43 640
10
20
30
40
50
7 16 30 43 640
10
20
30
40
50
7 16 30 43 640
10
20
30
40
50
Storage time (days)
% W
eig
ht l
oss
C N
NPP
FIGURE 20. Percentage of weight loss throughout storage time for cheesesamples with natural contamination: cheeses without treatment (C),treated with pimaricin solution (P), treated with nanohydrogel suspen-sion (N) and treated with pimaricin-loaded nanohydrogel suspension (NP).Arrows represent the change in the storage temperature from 4 to 37 ºCduring 12 h.
coating with impermeable (wax) or permeable (hydrogel) substances. For these reasons
the effect of nanohydrogel coating in some cheese ripening parameters was studied.
4.2.3. Weight loss studies. Figures 20 and 21 on page 100 show the weight loss of
cheeses treated and stored as explained in Section 4.1.3 on page 91 for the bioassays
with natural and artificial contamination respectively.
In the bioassay with natural contamination (Figure 20), weight loss increases in
all cases until 16 days of storage. Weight loss reaches values of around 10% with no
significant (p < 0.05) differences between treatments except for cheeses treated with a
pimaricin-loaded nanohydrogel suspension (NP), which leads to the highest mean weight

4.2. RESULTS AND DISCUSSION 99
loss (21%; p < 0.05) at this point. This difference may be due to the fact that each
cheese sample constitutes an experimental unit and therefore minor differences in po-
rosity between them can occur. At 30 days, weight loss practically stops and differences
between treatments are not significant (p > 0.05). From this point, cheeses treated with
and without nanohydrogel present two well-differentiated behaviours. Thus, at 43 days
of storage, cheeses without nanohydrogel treatment (C and P) leads to a mean weight
loss (30-33%) significantly higher (p < 0.05) than that found for nanohydrogel treated
cheeses (12%). Finally after 64 days of storage, cheese weight losses are similar between
treatments (30-40%) and only N-treated cheeses show significantly (p < 0.05) higher
weight losses with respect to the P and NP treatments.
With regard to the bioassay with artificial contamination (Figure 21 on the following
page), there are not significant (p > 0.05) differences between cheese weight losses after 8
days of storage. However, after 15 days of storage, NP-treated cheeses lose significantly
(p < 0.001) more weight than the other treatments. At 22 days of storage P-treated
cheeses lose significantly (p < 0.001) less weight than cheeses with nanohydrogel (N and
NP). At the end of the experiment (30 days of storage), the only significant (p < 0.05)
differences appear between cheeses with N and P treatment. In this case, no different
behaviours between cheeses treated with and without nanohydrogel are observed as do
it in the bioassay with natural contamination. Overall, weight loss increases linearly
along sampling time, showing a 35% average weight loss after 30 days of storage. Weight
losses are higher than those previously reported for this type of cheeses. However we
have to take into account that the small size (around 10 g) of cheese samples, favours
higher water losses than in cheeses used in Rodriguez-Alonso et al. [155], with 100-150
g.
On the other hand, we also have to take into account the significant (p < 0.001) di-
fferences between weight losses in bioassays with natural and artificial contamination.
This behaviour could be due to the cheese melting that occurred in the bioassay with
natural contamination during the temperature rise at 16 days of storage. Cheese from

100 4. ANTIMICROBIAL EFFECTIVENESS OF PIMARICIN-LOADED NANOHYDROGELS IN CHEESES
0.85
0.90
0.95
1.00
1.05
0
10
20
30
40
50
8 15 22 300
10
20
30
40
8 15 22 300.85
0.90
0.95
1.00
% W
eig
ht l
oss
C N
NPP
aw
Storage time (days)
FIGURE 21. Percentage of weight loss (!) and water activity (aw) (")throughout storage time for cheese samples with artificial contamination:cheeses without treatment (C), treated with pimaricin solution (P), treatedwith nanohydrogel suspension (N) and treated with pimaricin-loaded na-nohydrogel suspension (NP). Arrows with continuous line represent thechange in the storage temperature from 4 to 37 ºC during 80 min andarrows with dashed line represent the change in the storage temperaturefrom 4 to 25 ºC during 180 min.
Arzúa-Ulloa DOP has % 45% of fat/dry matter content [155] and can be considered a
full-fat cheese. Kim et al. [98] appointed that moisture loss is lower in full-fat cheese
samples due to the fact that large amount of fat inhibit moisture loss by covering the
melted cheese surface. Once the water reaches the surface it can be released again
leading to the rapid increase in weight loss in the last sampling times.
For both bioassays, the ANOVA analysis at 95% confidence level for weight loss shows
that the effect of the interaction between the storage time and the treatment is significant
(p < 0.0001), i.e., treatment does not have the same effect on weight loss during all
storage time.

4.2. RESULTS AND DISCUSSION 101
4.2.4. Water activity studies. The water activity (aw) of cheese samples with arti-
ficial contamination are shown in Figure 21 on the preceding page. aw is an important
physico-chemical parameter which influences the microbiological and the biochemical
evolution during the cheese ripening process. The knowledge of this parameter is useful
for the control of the ripening process and for the control of the final organoleptic prop-
erties and safety standards of cheese [162]. The aw decreases until 30 days of storage,
reaching values around 0.960. However there are no significant (p > 0.05) differences
between treatments. The ANOVA analysis at 95% confidence level of the aw variation
shows that the effect of time is significant (p < 0.0001) although the effect of treatment is
not significant (p = 0.2667). The interaction of these two factors is considered not quite
significant (p = 0.0524), i.e., treatment has practically the same effect during all storage
time. So it seems that the nanohydrogel coating does not have any negative effect respect
to the control samples.
4.2.5. Colour studies. Cheeses from Arzúa-Ulloa DOP only can be marketed if they
retain the external features of its natural ripening, preserving its appearance and natural
colour [27], and therefore the monitoring of colour changes during storage would be an
important issue. In Figures 22 on the following page and 23 on page 103 colour variation
is represented as colour difference (!E*) and variation profile of the L*a*b* coordinates
of cheeses from both bioassays with natural and artificial contamination respectively.
The profiles of !E* along storage agree with those observed above for the weight loss,
presenting two different behaviours in cheeses with and without nanohydrogel coating.
In the bioassay with natural contamination, until 30 days of storage no significant (p >
0.05) differences are observed between treatments and only significant (p < 0.05) differ-
ences between N and NP-treated cheeses are found, at 7 and 16 days of storage. However,
these differences could be due to the porosity differences between cheese samples, in the
same way as explained in Section 4.2.3 on page 98 for the weight loss values. From 30
days of storage, differences between samples with and without nanohydrogel are signi-
ficant (p < 0.05). In addition, differences between C and P treatment and differences

102 4. ANTIMICROBIAL EFFECTIVENESS OF PIMARICIN-LOADED NANOHYDROGELS IN CHEESES
! "# $% &$ #&!%
'%
(%
"%%
""%
")%
!*+,-./
! "# $% &$ #&0$
0)
0"
%
"
"*+,-./
! "# $% &$ #&%
)%
&%
#%
#*+,-./
1234,5/*267/*89,:;<
! "# $% &$ #&%
"%
)%
$%
&%
!=
FIGURE 22. Colour difference (!E*) and CIE L*a*b* coordinates duringstorage time for cheese samples with natural contamination: cheeseswithout treatment (C, ), treated with pimaricin solution (P, ), treatedwith nanohydrogel suspension (N, !) and treated with pimaricin-loadednanohydrogel suspension (NP, "). Arrows represent the change in thestorage temperature from 4 to 37 ºC during 12 h.
between N and NP treatment are not significant (p > 0.05). At the end of the experiment
there are not significant (p > 0.05) differences between treatments.
As in previous works [24, 157], L* value decreased and b* value increased (Figures 22
and 23 on the facing page) as the cheeses aged. However the parameter that best reflects
the colour differences between cheeses with and without nanohydrogel is the yellowness
(b* value). These results agree with visual appreciation of the cheeses. So samples with
nanohydrogel coating (N and NP) show fewer yellow surfaces.
As in the bioassay with natural contamination, it seems cheese colour differences in
the bioassay with artificial are mainly due to yellowness (b* value) changes (Figure 23
on the next page). The b* values are significantly (p < 0.05) higher in NP-treated cheeses

4.2. RESULTS AND DISCUSSION 103
!"
#"
$"
%""
%%"
# %& '' ("
!)*+,-.
/0
/(
/'
/%
"
%
# %& '' ("
")*+,-.
"
'"
0"
1"
# %& '' ("
#)*+,-.
"
%"
'"
("
0"
# %& '' ("
!2
3456+7.)489.):;+<=>
FIGURE 23. Colour difference (!E*) and CIE L*a*b* coordinates duringstorage time for cheese samples with artificial contamination: cheeseswithout treatment (C, ), treated with pimaricin solution (P, ), treatedwith nanohydrogel suspension (N, !) and treated with pimaricin-loadednanohydrogel suspension (NP, "). Arrows with continuous line representthe change in the storage temperature from 4 to 37 ºC during 80 min andarrows with dashed line represent the change in the storage temperatureand from 4 to 25 ºC during 180 min.
respect to the other, after 22 days of storage. As discussed above, NP-treated cheeses
begin to lose weight, i.e. water, earlier than the other and therefore, the yellowness begins
to develop before, although these differences are non visually perceptible, in contrast to
the differences that we observe in the bioassay with natural contamination. In general,
the L* value decreases with time and the b* value increases during all the storage time.
In the same manner as the weight losses (Section 4.2.3 on page 98), the ANOVA
analysis at 95% confidence level of the colour difference (!E*) studied for both bioassays
shows that the interaction of the effect of storage time and the effect of treatment is

104 4. ANTIMICROBIAL EFFECTIVENESS OF PIMARICIN-LOADED NANOHYDROGELS IN CHEESES
significant (p < 0.0001), i.e., treatment does not have the same effect during all storage
time.
4.2.6. pH evolution. During 64 days of storage, pH values in cheeses with natu-
ral contamination do not show significant (p > 0.05) differences between treatments
(Table 10 on the next page). The ANOVA analysis at 95% confidence level of the pH
variation shows that the effect of time is significant (p < 0.0001) whereas the effect of
treatment is not significant (p = 0.6500). The interaction of these two factors is not
significant (p = 0.1717), i.e., the treatments have the same effect during all storage time.
In the bioassay with artificial contamination, the pH values are slightly higher (p >
0.05) in untreated cheeses (Table 11 on page 107) at 8 days of storage respect to the all
treatments and at 22 days only respect to the N treatment. Overall, the variation of pH
during the experiment is not very high. The ANOVA analysis at 95% confidence level of
the pH variation studied shows that the effect of time and the treatment is significant (p <
0.0001). However, the interaction of these two factors is considered not quite significant
(p = 0.0764), i.e., the treatments have practically the same effect during all storage time.
The results suggest that nanohydrogel coating does not influence the cheese natural
ripening.
4.2.7. Microbiological control of pimaricin-loaded nanohydrogel coating during
cheese storage. During storage a risk of an external contamination of cheese by spoilage
microorganisms exists. This risk is higher when a breakdown in the cool chain occurs,
but can be avoided or reduced by using pimaricin-loaded nanohydrogel coatings.
During the first bioassay with natural contamination, mesophilic counts practically
did not show significant (p > 0.05) differences between treatments, which agrees with
the results of the pH variation (Section 4.2.6). Since the main contributor to mesophilic
counts in cheese are lactic acid bacteria it seems that nanohydrogel does not influence
the cheese natural ripening. Only significant (p < 0.05) differences appear between treat-
ments at 43 days of storage in cheeses from the bioassay with natural contamination

4.2. RESULTS AND DISCUSSION 105
TABLE 10. Changes of pH, total mesophiles and fungal counts log (CFUg-1) during storage time for cheese samples with natural contamination(temperature was raised at 16 days of storage after sampling from 4 to 37ºC during 12 h)
pH
Storagetime (days)
C N P NP
3 5.84±0.11a 5.84±0.11a 5.84±0.11a 5.84±0.11a
7 5.82±0.09a 5.89±0.05a 5.92±0.04a 5.84±0.02a
16 5.87±0.06a 5.85±0.10a 5.90±0.08a 5.84±0.06a
30 5.53±0.12a 5.45±0.07a 5.37±0.08a 5.42±0.11a
43 5.72±0.16a 5.58±0.11a 5.54±0.04a 5.63±0.10a
64 5.96±0.29a 6.21±0.18a 6.11±0.19a 6.02±0.06a
Log (Mesophilic CFU/g of cheese)
3 9.10±0.14a 9.10±0.14a 9.10±0.14a 9.10±0.14a
7 9.31±0.10a 9.18±0.17a 9.24±0.06a 9.38±0.06a
16 9.35±0.09a 9.31±0.10a 9.26±0.07a 9.28±0.09a
30 7.69±0.38a 7.44±0.36a 7.76±0.45a 7.67±0.37a
43 6.80±0.51a 7.92±0.12b 7.59±0.34ab 8.15±0.41b
64 7.04±0.62a 7.05±0.57a 7.90±0.66a 7.63±0.33a
Log (Fungal CFU/g of cheese)
3 <1.90 <1.90 <1.90 <1.90
7 <1.90 <1.90 <1.90 <1.90
16 <1.90 <1.90 <1.90 <1.90
30 4.58±0.51a 3.65±0.53a 3.62±0.18a 4.57±0.65a
Values reported are the means±standard deviation (n = 4).
a-bDifferent lower case letters in the same row indicate a statiscally significant difference (p < 0.05).
C: cheeses without treatment.
P: cheeses treated with pimaricin solution.
N: cheeses treated with nanohydrogel suspension.
NP: cheeses treated with pimaricin-loaded nanohydrogel suspension.

106 4. ANTIMICROBIAL EFFECTIVENESS OF PIMARICIN-LOADED NANOHYDROGELS IN CHEESES
(Table 10 on the preceding page) and at 8 days of storage in cheeses from the bioassay
with artificial contamination (Table 11 on the next page). The ANOVA analysis at 95%
confidence level of the variation in mesophilic counts shows that the effect of time is
significant (p < 0.0001), however the effect of treatment is not significant (p = 0.1980).
The interaction of these two factors is significant (p = 0.0258), i.e., treatment doe not
have the same effect during all storage time.
For both bioassays, mesophilic counts are above 9 log units during ripening (Table 10
on the preceding page and 11 on the next page), with similar values to those obtained
in other studies with cheeses from Arzúa-Ulloa DOP [155, 32]. There is a slight increase
in mesophilic counts until 16 and 8 days of storage for the bioassay with natural and
artificial contamination respectively. From this point, in general there is a decrease in
mesohilic counts.
The results agree with the pH variation (Table 10 on the preceding page and 11 on
the next page). Most mesophilic organisms present in the cheese are lactic acid bacteria
that low the pH by producing lactic acid [182]. At the time yeast and mould became to
growth in the cheese surface, they could use the lactic acid [32] increasing the cheese
pH. As the fungal growth begin earlier in the bioassay with artificial contamination, the
pH decrease and the mesophilic growth also stops earlier.
The minimum shelf life for Arzúa-Ulloa cheese is 60 days, but usually sold within one
month, as from this moment the uncoated cheeses begin to show fungal growth at the
surface. Then 30 days is reported as the last sampling time for the total fungal counts
analysis.
In the bioassay with natural contamination, until 30 days of storage there are no
significant (p > 0.05) differences between treatments (Table 10 on the preceding page).
Fajardo et al. [59] appointed that the absence of differences between Saloio cheeses
coated with an edible film containing pimaricin are not to be expected when the counts
are performed in the whole cheese samples and not only at their surface and as in this
work the results are obtained under no inoculation conditions. In the bioassay with

4.2. RESULTS AND DISCUSSION 107
TABLE 11. Changes of pH, total mesophiles and fungal counts Log (CFUg-1) during storage time for cheese samples with artificial contamination(temperature was raised at 8 days of storage after sampling and 14 daysof storage from 4 to 37 ºC during 80 min and from 4 to 25 ºC during 180min at 17, 21 and 29 days of storage)
pH
Storage
time (days)
C N P NP
2 5.60±0.05a 5.60±0.05a 5.60±0.05a 5.60±0.05a
8 5.64±0.04a 5.44±0.07b 5.52±0.04b 5.54±0.02b
15 5.75±0.03a 5.67±0.10a 5.72±0.05a 5.68±0.03a
22 5.75±0.13a 5.59±0.05b 5.68±0.03ab 5.64±0.05ab
30 5.68±0.12a 5.65±0.03a 5.59±0.01a 5.65±0.06a
Log (Mesophilic CFU/g of cheese)
2 9.20±0.13a 9.20±0.13a 9.20±0.13a 9.20±0.13a
8 9.28±0.16a 9.49±0ab 9.53±0.05b 9.48±0.11ab
15 9.24±0.11a 9.17±0.12a 9.19±0.12a 9.25±0.04a
22 9.16±0.13a 9.00±0.27a 8.97±0.29a 8.95±0.26a
30 9.01±0.10a 8.48±0.14a 8.79±0.30a 8.45±0.48a
Log (Fungal CFU/g of cheese)
2 <2.90 <2.90 <2.90 <2.90
8 4.11±0.33a 3.57±0.16a 3.24±0.37a 3.18±0.67a
15 6.28±0.15a 6.11±0.19a 6.07±0.14a 5.51±0.21b
22 6.13±0.24ab 6.41±0.17a 6.40±0.13a 5.83±0.32b
30 5.92±0.14ab 6.28±0.49a 5.83±0.25ab 5.59±0.16b
Values reported are the means±standard deviation (n = 4).
a-bDifferent lower case letters in the same row indicate a statiscally significant difference (p < 0.05).
C: cheeses without treatment.
P: cheeses treated with pimaricin solution.
N: cheeses treated with nanohydrogel suspension.
NP: cheeses treated with pimaricin-loaded nanohydrogel suspension.

108 4. ANTIMICROBIAL EFFECTIVENESS OF PIMARICIN-LOADED NANOHYDROGELS IN CHEESES
artificial contamination the total fungal counts increase from the inoculation at 8 days
of storage for all treatments. Counts in cheeses with NP treatment are significantly
(p < 0.05) lower respect to all other treatments at 15 days of storage, to the N and P
treatments at 22 days of storage and to the N treatment at 30 days of storage. The
ANOVA analysis at 95% confidence level of the total fungal counts variation shows that
the effect of time and the effect of treatment are both significant (p < 0.0001). However
the interaction of these two factors is not significant (p = 0.2380), i.e., treatments have
the same effect during all storage time.
Therefore, despite the antimicrobial effect is not maintained for a long time, as initial
microbial load is very high (169x107 UFC mL-1), the differences founded with respect
to the pimaricin treatment evidence the protective effect of the pimaricin-loaded nano-
hydrogel system observed in the food model system (Section 4.2.1 on page 95) that will
allow maintain an antimicrobial effect of pimaricin for longer.
4.2.8. Microbiological analysis by quantitative polymerase chain reaction (qPCR)
of cheeses from Arzúa-Ulloa DOP coated with pimaricin-loaded nanohydrogel. In
the former paragraphs the suitability of pimaricin-loaded nanohydrogel coating to con-
trol the growth of spoilage microorganism was proved using a yeast as indicator in natu-
rally and artificially contaminated cheeses. However, traditional methods based on SPC
are most commonly used to quantify CFUs, but often cause confusion, as they depend
largely on the physiological state of the organism and its ability to grow. In addition,
hyphal filaments cannot be quantified using these techniques for enumeration of viable
counts that usually reflect the number of spores rather than mycelia. In young colonies
or within the food, mould growth is primarily composed of hyphae and viable counts are
generally low. These inconveniences make reasonable contrast the antimicrobial efficacy
of pimaricin-loaded nanohydrogel coatings by procedures independent of yeast or fungal
cultures.

4.2. RESULTS AND DISCUSSION 109
0 1 2 3 4 5 6 7 80
10
20
30
40
Log(UFC mL-1)
CT
0 1 2 3 4 5 6 7 80
10
20
30
40
Log (UFC mL-1)
CT
CT = -2.559 (Log (UFC mL-1)) + 28.54
r2 = 0.9995
CT = -3.577 (Log (UFC mL-1)) + 36.34
r2 = 0.9987
A B
FIGURE 24. DNA standard curve for total fungal quantification by qPCRin two different matrix: culture broth (A) and cheese (B).
In this sense, several authors have developed methods based on the detection and
quantification of DNA, which avoids the aforementioned problems [4, 56] but not to
quantify the total fungal counts in cheeses so far.
In this paper, we developed a qPCR method that allows quantification of total fungal
counts directly from the cheese samples. For this purpose, first we determine the
sensitivity and detection limits of the qPCR assay to quantify the total fungal counts
in cheeses a standard curve from DNA extracted from pure cultures of Sc 1.02 is de-
termined. The assay is linear over 7 orders of magnitude, being the detection limit of 1
log (CFU mL-1) (Figure 24).
The efficiency of the reaction is 0.91±0.08, which means that the amplification rate is
very efficient and the qPCR assay is highly linear (r2 = 0.9987). The nontemplate samples
used as controls in the qPCR assay shows positive signals (CT values of 36.06±1.89),
probably due to an accumulation of dimers of oligonucleotide primers to which SYBR
Green molecules bound [82]. However, the melting curve obtained for this nonspecific
product is different from that of the correct amplicon (data not shown). Also these CT
values of the nontemplate controls are far enough from the CT values obtained for the
101 CFU mL-1 (32.56±1.70).

110 4. ANTIMICROBIAL EFFECTIVENESS OF PIMARICIN-LOADED NANOHYDROGELS IN CHEESES
TABLE 12. Accuracy of the qPCR assay for the quantification of totalfungal content in cheese
% Accuracy
Storage
time (days)
C N P NP
8 98.10±22.95 124.20±9.06 124.48±26,60 129.93±31.91
15 104.24±8.17 112.54±5.84 110.11±5.93 117.41±7.96
22 111.08±9.59 107.32±5.68 109.23±2.82 117.41±7.56
30 109.99±8.34 108.12±12.04 108.42±8.27 122.89±5.07
Values reported are the means±standard deviation (n = 4).
C: cheeses without treatment.
P: cheeses treated with pimaricin solution.
N: cheeses treated with nanohydrogel suspension.
NP: cheeses treated with pimaricin-loaded nanohydrogel suspension.
The detection limit of total fungal quantification in cheese is nearly 2 logarithmic
units higher (Figure 24 on the previous page) than for pure culture of Sc 1.02. Never-
theless, the assay is linear over 4 orders of magnitude. Even though the amplification in
cheese matrix is highly linear (r2 = 0.9995), the efficiency is high (1.47±0.17), probably
due to the presence of inhibitors from the cheese matrix that have not been removed
during DNA extraction. Another possibility could be that the reaction has too much
target, i.e., presence of large amount of nontarget DNA coming from other cheese mi-
croorganism, as CT values of the negative control samples (cheeses without artificial
contamination) are too low (23.08±0.59).

4.2. RESULTS AND DISCUSSION 111
Cheese samples artifially contaminated with Sc 1.02 are analyzed by qPCR and re-
sults compared with microbiological analysis by SPC (Table 11 on page 107). For com-
parison of these results we evaluate the accuracy of the qPCR assay for the total fungal
quantification in cheeses. The correlation between the enumerations of the bioassay
cheese samples by qPCR and by SPC is good, around 100% of accuracy (Table 12 on
the preceding page). However, for all treatments and sampling time the enumerations
obtained by qPCR are higher than those obtained by SPC as a result of viable but non-
culturable fungi or, as indicated by Hierro et al. [82], more likely due to the presence of
dead cells in the sample.


CHAPTER 5
Evaluation of antimicrobial effectiveness of
pimaricin-loaded thermosensitive nanohydrogels in
grape juice
In previous works we demonstrated the usefulness of PNIPA nanohydrogels with dif-
ferent composition to transport and release pimaricin as response of ambiental triggers
like temperature and pH (Chapter 2 on page 47). Additionally the antimicrobial effect-
iveness of pimaricin-nanohydrogels systems was tested in a solid food model sytem and
in cheeses (Chapter 4 on page 89).
In order to extend the shelf life of fresh fruit juices the use of a smart active packaging
bassed on nanohidrogels as device for controlled release pimaricin was investigated in
this Chapter. Evaluation of the effectiveness to control microbial growth spoilage of these
systems is presented in a liquid food model system as well as in grape juice.
5.1. Material and Methods
5.1.1. Materials. Commercial pimaricin (50% pure pimaricin, 50% lactose) was from
VGP Pharmachem (Barcelona, Spain). Pure pimaricin (M = 665.73 g mol-1) from Strep-
tomyces chattanoogensis (%95%, HPLC) was from Sigma-Aldrich (Munich, Germany).
Dialysis bags (SnakeSkinTM pleated dialysis tubing) with a molar mass cut-off of 3500 g
mol-1 were from Pierce (Rockford, IL, USA).
D(+)-Glucose anhydrous PA-ACS, bacteriological peptone and yeast extract were all
from Panreac (Barcelona, Spain). Acetic acid puriss. p.a. ACS reagent (%99.8%) and
113

114 5. ANTIMICROBIAL EFFECTIVENESS OF PIMARICIN-LOADED NANOHYDROGELS IN GRAPE JUICE
0 2 4 6 8 10 12 140
200
400
600
800
1000
Concn of pimaricin (!g mL-1)
Are
a
A = (86.84±0.91) CPim + (2.70±4.30)
r2 = 0.9996
FIGURE 25. Pimaricin standard curve prepared in a standard diluentsolution (S.D.) for its quantification by RP-HPLC.
methanol CHROMASOLV®, for HPLC (%99.9%) were from Sigma-Aldrich (Munich, Ger-
many). Commercial white grape juice was used as received.
5.1.2. Pimaricin detection by reverse phase high performance liquid chroma-
tography (RP-HPLC). Pimaricin quantification by RP-HPLC was performed following a
modified method from Roberts et al. [153]. RP-HPLC was performed using an Agilent
1200 system (Agilent Technologies, Palo Alto, CA, USA). Separation was performed em-
ploying a ACE® C18 column (4.6 mm x 150 mm, 5 $m) with the column oven maintained
at 30 ºC. The flow rate was 1.0 mL min-1, the injection volume was 20 µL and the detec-
tion wavelength 319 nm. Mobile phase A consisted in MilliQ water/acetic acid (97:3, v/v)
and mobile phase B was methanol/acetic acid (97:3, v/v). Mobile phase A at 90% was
maintained for the first 6 min and decreased linearly to 10% over 25 min. Finally, the
mobile phase A was increased to 90% and the column was reequilibrated for a further 9
min.

5.1. MATERIAL AND METHODS 115
25 26 27 28 290
20
40
60
Grape juice
Culture broth
S.D.
time (min)
mA
U
FIGURE 26. HPLC chromatogram at 319 nm of standard diluent solution(SD), YPD broth and grape juice added with pure pimaricin (5 µg mL-1).
The assay was highly linear (Figure 25 on the facing page) from 0.05 to 10 µg mL-1
of pure pimaricin dissolved in a standard diluent solution (S.D.) of methanol:MilliQ wa-
ter:acetic acid (50:47:3, v/v/v).
Pimaricin quantification accuracy by RP-HPLC was determined by adding culture
broth and grape juice with pure pimaricin solutions in S.D. to obtain final concentrations
of 5 µg mL-1. Figure 26 shows an HPLC chromatogram at 319 nm of S.D., culture broth
and grape juice added with the same amount of pimaricin. The recovery was very high,
98.11% and 97.32% from the culture broth and grape juice respectively. So we can
spare a previous step in which we extract the pimaricin from the matrices evaluated in
this work.
5.1.3. Analysis of pimaricin degradation. We evaluated the pimaricin degradation
in two different matrices: culture broth and grape juice. Culture broth was yeast extract-
peptone-glucose (YPD) broth (Panreac, Barcelona, Spain). Both matrices, YPD broth and
grape juice, were added with a commercial pimaricin aqueous solution (4 µg mL-1) and

116 5. ANTIMICROBIAL EFFECTIVENESS OF PIMARICIN-LOADED NANOHYDROGELS IN GRAPE JUICE
stored at 37 ºC and 25 ºC, for culture broth and grape juice respectively. The pimaricin
concentration was followed daily during 15 days by RP-HPLC.
We also evaluated the pimaricin degradation in grape juice under pasteurization con-
ditions. For these propose grape juice was added with a commercial pimaricin aqueous
solution (3 µg mL-1) and heated at 80 ºC in a thermostatized bath. Aliquots were re-
moved at different time intervals within 1 h and the pimaricin concentration was also
determined by RP-HPLC. All the experiments were carried out in duplicate.
In order to standarise the results, the fraction of pimaricin at each sampling time
was calculated as follows:
(33) Ft = 1! C0 ! Ct
C0
where Ct and C0 are the concentration of pimaricin (µg mL-1) at time t and at initial
time respectively.
5.1.4. Dose-response curves. We performed a dose-response assay in two different
matrices: culture broth and grape juice. Both matrices were inoculated with 830 µL
of a 12-hour culture of the indicator microorganism (6x10⁷ CFU mL-1), Saccharomyces
cerevisiae (Sc 1.02). This matrices were added with a pimaricin solution prepared under
sterile conditions to obtain concentrations of pimaricin ranging from 0 to 10 µg mL-1.
Then, they were incubated at 120 rpm and 37 ºC and 25 ºC, for the culture broth and
grape juice respectively. At selected times, aliquots of 1 mL were removed in duplicate to
follow the Sc 1.02 growth spectophotometrically (Beckman Coulter Inc., Brea, CA, USA)
by optical density (OD) detection at 600 nm.
5.1.5. Inhibition studies.
5.1.5.1. Preparation of pimaricin-loaded nanohydrogel. The nanohydrogels employed
in this work, NIPA homopolymer (PNIPA(5)) and NIPA copolymerized with AA (PNIPA-
20AA(5)), were synthesized as explained in Section 2.1.2 on page 47 (Chapter 2).

5.1. MATERIAL AND METHODS 117
For the inhibition studies employing a liquid food model system the nanohydrogels
samples loaded with pimaricin were prepared as explained in Section 3.1.2 on page 65
(Chapter 3) but using the YPD broth as a solvent to avoid the growing broth dilution with
water in a subsequent step. PNIPA/AA nanohydrogel powder was dispersed in a sterile
YPD broth by agitation using a magnetic stirrer during 3 hours at ambient temperature
to allow a proper swelling of the nanoparticles. Subsequently, this suspension was mixed
with a pimaricin solution prepared also in sterile YPD broth to obtain final concentrations
of 12.5 mg of nanohydrogel per mL and 0.4 mg of pimaricin powder per mL (21.93 µg
mL-1 of solubilized pimaricin). The mixture was stirred overnight at 25 ºC (below LCST)
in order to guarantee the incorporation of the pimaricin into the nanohydrogel particles.
Nanohydrogel samples without pimaricin and free pimaricin samples were processed in
the same conditions as above.
For the inhibition studies employing grape juice we only used the PNIPA-20AA(5)
nanohydrogel. Nanohydrogel loaded with pimaricin, nanohydrogel without pimaricin
and free pimaricin samples were prepared in the same manner as explained above but
replacing the YPD broth by white grape juice. The pH of the grape juice employed at
this point was increased to 8 during the loading step in order to guarantee the correct
swelling of nanohydrogel particles since at the pH of the grape juice (3.5) the PNIPA-
20AA(5) collapses, as we saw in Section 2.2.2 on page 53 (Chapter 2). The experiments
were carried out in duplicate under sterile conditions.
5.1.5.2. Preparation of indicator microoganism suspension. The culture of the indi-
cator microorganism was prepared by inoculating the 12 mL of the YPD broth with a
12-hour Sc 1.02 culture (6x10⁷ CFU mL-1). Its final OD at 600 nm was adjusted to
0.020 (1 mm path length).
The culture of the indicator microorganism for the inhibition studies in grape juice
was prepared in three steps. The stock culture of Sc 1.02 was firstly growth in the YPD
broth. After 12 hours this culture was used as inoculum in a new culture with grape
juice (pH 3.5). Finally, after 12-hours, this last culture (6x10⁷ CFU mL-1) was used as

118 5. ANTIMICROBIAL EFFECTIVENESS OF PIMARICIN-LOADED NANOHYDROGELS IN GRAPE JUICE
inoculum for 12 mL of grape juice. Its final OD at 600 nm was adjusted to 0.010 (1 mm
path length). The experiments were carried out in duplicate under sterile conditions.
5.1.5.3. Growth inhibition assay. The samples, prepared as explained in Section
5.1.5.1 on page 116, were distributed among the following treatments: PNIPA(5) na-
nohydrogel suspension without (NPNIPA(5)) and loaded with pimaricin (NPPNIPA(5)), PNIPA-
20AA(5) nanohydrogel suspension without (NPNIPA-20AA(5)) and loaded with pimaricin (NP-
PNIPA-20AA(5)), samples treated with free pimaricin solution (P) and, finally, untreated
samples (C). 3 mL from these treatments were placed in a dialysis tube and dialyzed
against 12 mL of the suspension with the indicator microorganism obtained as explained
in Section 5.1.5.2 on the preceding page. Incubation temperature was 37 ºC for the
bioassay in culture broth. For the bioassay in grape juice it was 8 ºC during 6 hours and
was raised to 25 °C till the end of the experiment. The experiments were carried out in
duplicate under sterile conditions.
At selected times, aliquots of 2 $L were removed from the dialysate to follow the Sc
1.02 growth by measuring OD at 600 nm using a Thermo Scientific NanoDrop 2000c
(Wilmington, DE, USA) to assume a constant dialysis volume since we can not refund
the sample withdrawn in order to maintain the sterility of the culture.
5.1.6. Growth modelling. Logistic equation is a widely used model to describe mi-
crobial growth as well as for predicting inhibition of microbial growth [227, 18, 199, 196].
However the simple formal description of logistic equation presents drawbacks when we
try to do statistically significant comparisons between parameters of practical interest,
like maximum rate or the lag period. Therefore, Vázquez and Murado [195] defined the
following equation:
(34) ODt =B
1 + e2+4·µB
B ·("B!t)

5.1. MATERIAL AND METHODS 119
where B is maximum growth (expressed as OD units) of the microorganism. µB is the
maximum specific growth rate (h-1) and, 'B and t are the latency and the sampling time,
respectively, both expressed in hours (h).
However this equation only will be useful to fit microbial growth in a single phase.
Previous works have tried to explain microbial growth in two phases [75]. Nevertheless,
in the equation that we propose in this work the maximum microbial growth in the
second phase is calculated as limt$%
ODt that is the real value for this parameter. So the
bilogistic equation is defined as follows:
(35) ODt =A
1 + e!4·µA·t
A ·%!1 + A
A0
& +B !A
1 + e2·(B+A+2·#B ·µB)
B"A ! 4·µB ·tB"A
The first part of the model would be a logistic model, commonly used in the liter-
ature to fit microorganism growth or inactivation [199, 49, 51], which would allow us
to predict the antifungal effect on the first growth phase. A0 and A is the initial and
maximum growth (expressed as OD units), respectively, of the indicator in the presence
of antifungal. µA is the maximum specific growth rate (h-1) in presence of inhibitor and t
(h) is the sampling time.
The second part of the model corresponds with a logistic model reparametrized to
shown latency explicitly [195]. In this case latency would refer to cell regeneration time
required for the yeast to repair membrane damage caused by pimaricin. Thus, B, µB and
'B are the growth parameters described above after the effect of the inhibitor.
5.1.7. Statistical analysis. Antimicrobial effectiveness amongst treatments was e-
valuated by analysis of variance (ANOVA) followed by Bonferroni post-tests for multiple
comparisons by using GraphPad PrismTM 5 (GraphPad Software Inc., San Diego, CA,
USA).
The fitting data and the significance of the model parameters were assessed using
SigmaPlot version 11.0, from Systat Software, Inc. (San Jose California USA).

120 5. ANTIMICROBIAL EFFECTIVENESS OF PIMARICIN-LOADED NANOHYDROGELS IN GRAPE JUICE
5.2. Results and Discussion
5.2.1. Pimaricin stability in different matrices. Degradation kinetics were per-
formed to calculate the pimaricin half-life in the different matrices assayed. Values of
the remaining fraction of pimaricin at each time (Ft), standarised according to Equa-
tion 33 on page 116, are fitted with the following equation:
(36) Ft = (F0 ! Fmin) · e!k·t + Fmin
where Ft and F0 are the fraction of pimaricin at time t and initial time, respectively.
Fmin is the minimum fraction of pimaricin achieved in the different matrices. k is the
pimaricin degradation rate (h-1) and t is the sampling time (h). The half-life (h) is defined
as ln 2k .
The results of monitoring the pimaricin degradation are depicted in Figure 27 on the
facing page and and fitting parameters of the Equation 36 are summarized in Table 13 on
page 122. The rate of pimaricin degradation (k) in grape juice is 2-fold higher (p = 0.0091)
than that observed in YPD broth. There are not significant (p = 0.2393) differences
between the Fmin achieved in culture broth and grape juice. It seems that, regardless of
temperature, the conditions provided by the grape juice (pH 3.5) more importantly affect
the degradation of pimaricin. Because, at low pH values, pimaricin is rapidly degraded,
producing mycosamine by hydrolysis of the glycosidic bond [99].
When we subject the pimaricin-treated juice to pasteurization temperatures (80 ºC)
the pimaricin degradation is significantly increased (Figure 27 on the next page), as
the k value is nearly 50 times higher (p = 0.0021) at 80 ºC than at 25 ºC in grape
juice. Consequently the half-life is also reduced (Table 13 on page 122). There are not
significant (p = 0.1110) differences between the Fmin achieved in grape juice at 25 ºC and
80 ºC.

5.2. RESULTS AND DISCUSSION 121
0 100 200 300 4000.0
0.2
0.4
0.6
0.8
1.0
time (h)
F
0.0 0.2 0.4 0.6 0.8 1.00.0
0.2
0.4
0.6
0.8
1.0
time (h)
F
FIGURE 27. Variation of remaining fraction of pimaricin (F ), standarisedaccording to Equation 33 on page 116, in YPD broth at 37 ºC (!) andgrape juice at 25 ºC (") and 80 ºC ("), the graph inset is an enlarged rep-resentation of these data). The lines are the fitting curves generated fromEquation 36 on the facing page (r2
YPD broth-37 ºC = 0.9813; r2grape juice-25 ºC =
0.9839; r2grape juice-80 ºC = 0.9850).
Pedersen [144] showed losses of 34% at 50 ºC during the preparation of YPD plates,
and then the half-life in these plates was 31 d at 6 ºC under dark conditions. In our case
the half-life is lowered to 27 h (Table 13 on the next page) in YPD broth, as the assay was
performed under light and the storage temperature was 37 ºC. In grape juice half-life of
pimaricin is further reduced to 13 h (Table 13 on the following page). These results show
that pimaricin have a low stability in usual conditions and treatments (heating, acidi-
fication, lighting) for production of fresh (non sterilized) juices reducing potentially their
antimicrobial activity. This suggests that a procedure to protect pimaricin degradation
could be used to improve their antimicrobial activity.

122 5. ANTIMICROBIAL EFFECTIVENESS OF PIMARICIN-LOADED NANOHYDROGELS IN GRAPE JUICE
TABLE 13. Pimaricin degradation parameters in different matrices andtemperatures calculated with Equation 36 on page 120
Matrices T (ºC) Fmin k (h-1) Half-life (h)
YPD broth 37 0.057±0.009*** 0.025±0.002*** 27.290±1.697***
Grape juice 25 0.044±0.006*** 0.053±0.003*** 13.050±0.807***
80 0.129±0.043n.s. 2.551±0.339** 0.272±0.036**
Values reported are the means±standard deviation (n = 2).
n.s.(p > 0.05): not significant.
*(p < 0.05): significant.
**(p < 0.01): very significant.
***(p < 0.001): extremely significant.
5.2.2. Assessment of efficacy of free pimaricin to control microbial growth
spoilage. The response of an indicator microorganism of food spoilage (Sc 1.02) to in-
creasing concentrations of pimaricin was evaluated by dose-response analysis, taking as
response the time of latency obtained from the growth curves of Sc 1.02 in the presence
of different concentrations of pimaricin after fitting with Equation 34 on page 118.
The half maximal inhibitory concentration (IC50, µg mL-1) of pimaricin in both ma-
trices, YPD broth and grape juice, is calculated by fitting the dose-response data to the
Weibull’s equation, reparametrized to make explicit the IC50 as proposed Murado et al.
[126]:
(37) #D = K ·!1! e
! ln 2·)
DIC50
*!"
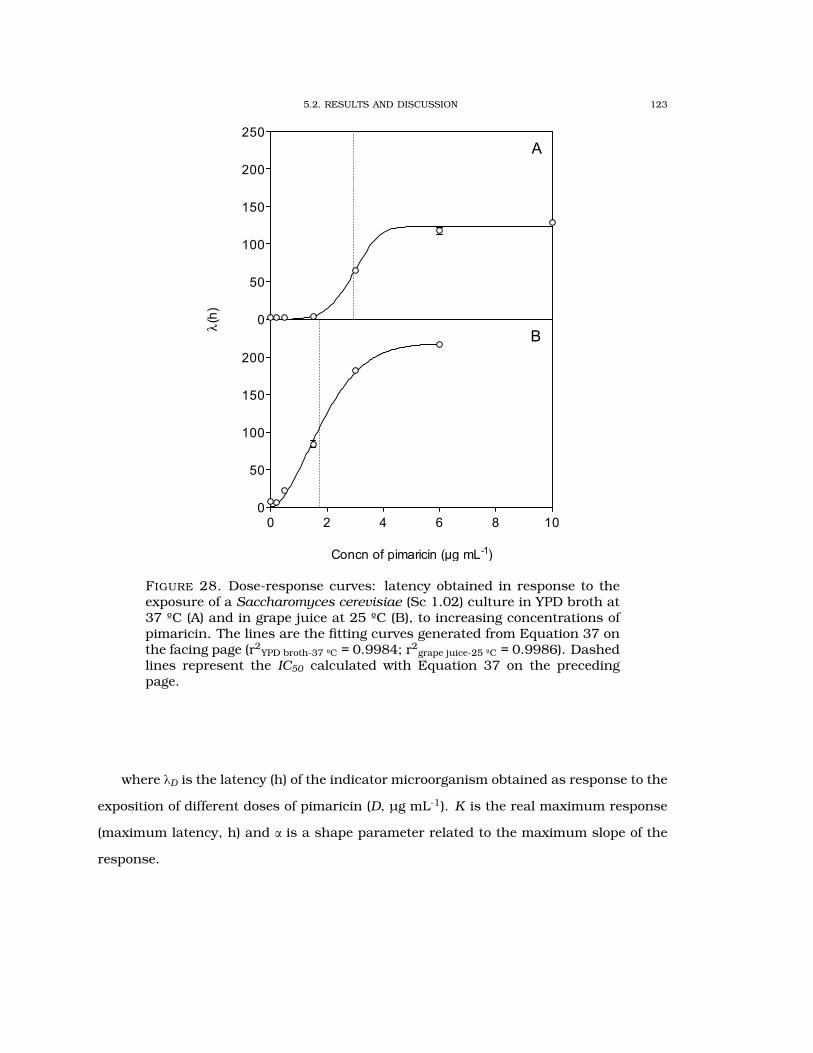
5.2. RESULTS AND DISCUSSION 123
0 2 4 6 8 100
50
100
150
200
Concn of pimaricin (!g mL-1)
0
50
100
150
200
250
A
B
! (h
)
FIGURE 28. Dose-response curves: latency obtained in response to theexposure of a Saccharomyces cerevisiae (Sc 1.02) culture in YPD broth at37 ºC (A) and in grape juice at 25 ºC (B), to increasing concentrations ofpimaricin. The lines are the fitting curves generated from Equation 37 onthe facing page (r2
YPD broth-37 ºC = 0.9984; r2grape juice-25 ºC = 0.9986). Dashed
lines represent the IC50 calculated with Equation 37 on the precedingpage.
where 'D is the latency (h) of the indicator microorganism obtained as response to the
exposition of different doses of pimaricin (D, µg mL-1). K is the real maximum response
(maximum latency, h) and " is a shape parameter related to the maximum slope of the
response.

124 5. ANTIMICROBIAL EFFECTIVENESS OF PIMARICIN-LOADED NANOHYDROGELS IN GRAPE JUICE
In Figure 28 on the preceding page is represented the IC50 obtained for each matrix.
The IC50 for pimaricin in culture broth is 2.95±0.06 µg mL-1 whilst is 1.74±0.09 µg
mL-1 in grape juice. This means that the indicator microorganism is more sensitive to
pimaricin in grape juice than in culture broth. It must be taking into account that in
absence of pimaricin, the latency of Sc 1.02 in grape juice is 4.5 times higher than in
culture broth as it provides a poorer media in nitrogen and proteins. Pimaricin acts
binding with to ergosterol in membrane cells inhibiting important processes involved in
cell regeneration [204], so the absence of an essential nutrient can determine the growth
capacity of the microorganism.
5.2.3. Efficacy of nanohydrogel-pimaricin system to control microbial growth
spoilage in a food model system. To test the antifungal effectiveness of the nano-
hydrogel-pimaricin system in a liquid food model system, a dialysis against a Sc 1.02
culture at 37 ºC of pimaricin released from the nanohydrogel was performed, measuring
the indicator microorganism growth. Thus, experimental growth data (OD) are fitted with
the reparametrized logistic model (Equation 34 on page 118) for series without antifungal
treatment and reparametrized bilogistic model (Equation 35 on page 119) for series with
antifungal treatment.
The results of monitoring the Sc 1.02 growth, depicted in Figure 29 on page 126 and
summarized in Table 14 on the facing page, show that the pimaricin-loaded nanohydro-
gel system was highly effective inhibiting the growth of the indicator strain. Treatments
with pimaricin (P, NPPNIPA(5) and NPPNIPA-20AA(5)) lead to a 2-fold reduction (p < 0.05) in
the yeast growth with regard to samples without pimaricin. Pimaricin-free nanohydro-
gels (NPNIPA(5) and NPNIPA-20AA(5)) seem to have no negative effect on yeast growth as they
do not present significant (p > 0.05) differences in growth parameters respect to control
cultures without nanohydrogel.
Additionally, the combined effect of antifungal and nanohydrogel is able to extent the
latency of Sc 1.02 growth further than the pimaricin alone (Table 14 on the next page).
The 'B is increased significantly (p < 0.05) from 12.39±0.54 to 81.19±0.17 h with P and

5.2. RESULTS AND DISCUSSION 125
TABLE 14. Growth parameters of Saccharomyces cerevisiae (Sc 1.02) inculture broth under different antimicrobial treatments, calculated withEquation 34 on page 118 and Equation 35 on page 119
Tre
atm
ent
A# A
(h-1
)A
0B
# B(h
-1)
$ B(h
)r2
C-
--
0.43
3±0.
009*
**0.
069±
0.00
8***
1.55
4±0.
475*
*0.
9731
NPN
IPA
(5)
--
-0.
458±
0.01
5***
0.10
5±0.
025*
*1.
231±
0.60
7n.s
.0.
9631
NPN
IPA
-20A
A(5
)-
--
0.39
3±0.
008*
**0.
059±
0.00
7***
1.31
3±0.
288*
0.98
65
P0.
049±
0.00
4***
0.01
5±0.
009n
.s.
0.01
9±0.
007*
0.21
9±0.
004*
**0.
033±
0.00
4***
12.3
90±0
.541
***
0.99
46
NP P
NIP
A(5
)0.
088±
0.00
8***
0.01
4±0.
005*
0.02
3±0.
009*
0.29
2±0.
009*
**0.
011±
0.00
2***
14.5
00±2
.230
***
0.98
56
NP P
NIP
A-2
0AA
(5)
0.05
2±0.
002*
**0.
035±
0.02
2n.s
.0.
020±
0.00
8*0.
243±
0.00
8***
0.11
7±0.
272n
.s.
81.1
91±0
.167
***
0.98
60
Val
ues
repo
rted
are
the
mea
ns±
stan
dard
devi
atio
n(n
=2)
.
n.s
. (p>
0.05
):n
otsi
gnifi
can
t.
* (p
<0.
05):
sign
ifica
nt.
**(p
<0.
01):
very
sign
ifica
nt.
*** (
p<
0.00
1):
extr
emel
ysi
gnifi
can
t.

126 5. ANTIMICROBIAL EFFECTIVENESS OF PIMARICIN-LOADED NANOHYDROGELS IN GRAPE JUICE
0 5 10 15 20 25 300.0
0.2
0.4
0.6
100 150
time (h)
1 m
m O
D (
60
0 n
m)
FIGURE 29. Effect of different antimicrobial devices in Saccharomycescerevisiae (Sc 1.02) growth. Control samples without pimaricin: NPNIPA(5)
( ), NPNIPA-20AA(5) ( ) and C ( ). Samples with pimaricin: NPPNIPA(5) ("),NPPNIPA-20AA(5) (!) and P ("). The line is the fitting curve generated fromEquation 34 on page 118 and 35 on page 119. Dotted area correspondsto the 95% prediction band.
NPPNIPA-20AA(5) treatments, respectively. Also, the advantage of the use of nanohydrogels
with acrylic acid is demonstrated when we compare both inhibition curves. NPPNIPA-20AA(5)
is able to stop completely Sc 1.02 growth during 81.19±0.17 h while NPPNIPA(5) only main-
tain the inhibition during 14.50±2.32 hours, after which an exponential growth is ob-
served. In addition there is no significant (p > 0.05) differences between 'B of samples
treated with P and NPPNIPA(5).
These results are consistent with those observed during the release studies in water
(Chapter 3 on page 65), and allow to confirm that nanohydrogels can be used to release
pimaricin in a slow and continuous way maintaining levels of pimaricin enough to control
yeast growth. Additionally the nanohydrogel avoid the pimaricin degradation in the YPD
broth and open the possibility to use these release systems in real foods.

5.2. RESULTS AND DISCUSSION 127
5.2.4. Control of grape juice spoilage employing pimaricin-loaded nanohydro-
gels. Pasteurized refrigerated (fresh) juices are the most accepted among commercial
juice because its flavour is clearly fresher than juices marketed at room temperature.
However the stability of these products depends greatly of limiting the recontamination
by preserving the cold chain and limiting the duration of refrigerated storage after ope-
ning the package. The use of sulphites, which are usually added to juices can reduce this
recontamination. However, allergic disorders associated with this compound suggest the
use of alternatives such as pimaricin. Pimaricin could be added after pasteurization
treatments but, in Section 5.2.1 on page 120 it was demonstrated that degradation of
pimaricin under heat treatments or storage at room temperature in grape juices reduce
significantly the pimaricin initially added compromising their efficacy. Also, addition of
pimaricin after pasteurization is not possible if the aseptic packaging juice is used.
To address this problem, two alternatives are possible. The first one is increase the
initial pimaricin concentration to ensure its stability during prolonged storage times.
This mainly occurs in products that are not continuously stored under cooling and may
suffer a recontamination, such as juices once purchased by consumers. In view of the
good results obtained in the liquid food model system (Section 5.2.3 on page 124) with
NPPNIPA-20AA(5) treatment, the second alternative presented in this work is the use of this
system, which can act as protector against pimaricin degradation, while allowing its
controlled release. Then, this system enables to adjust the pimaricin dosage over time,
reducing the amount of pimaricin present in the juice.
In this sense Figure 30 on the next page shows a comparison of the effect on yeast
growth of pimaricin treatments directly added to a grape juice or included into the nan-
ohydrogel. Control treatments with and without nanohydrogels (C and NPNIPA-20AA(5))
seem to have no effect on Sc 1.02 growth in contrast with pimaricin treatments (P and
NPPNIPA-20AA(5)). Table 15 on page 129 shows the growth parameters of Sc 1.02 in the pres-
ence of different treatments, after fitting the experimental data of growth to Equation 34
on page 118. There are not significant (p > 0.05) differences between Sc 1.02 growths

128 5. ANTIMICROBIAL EFFECTIVENESS OF PIMARICIN-LOADED NANOHYDROGELS IN GRAPE JUICE
0 10 20 30 40 50 60 80 1000.0
0.2
0.4
0.6
time (h)
1 m
m O
.D.
(60
0 n
m)
0 20 40 60 80 1000
3000
6000
9000
12000
15000
time (h)
Sp
ecifi
c in
hib
itio
n
FIGURE 30. Effect of different antimicrobial devices in Saccharomy-ces cerevisiae (Sc 1.02) growth. Control samples without pimaricin:NPNIPA-20AA(5) ( ) and C ( ). Samples with pimaricin: NPPNIPA-20AA(5) (!)and P ("). The line is the fitting curve generated from Equation 34 onpage 118. Dotted area correspond to the 95% prediction band. The figureinset represents the specific inhibition at different times.
in control treatments (C and NPNIPA-20AA(5)). So, these results confirm the above obtained
in liquid food model system (Section 5.2.3 on page 124) because the nanohydrogel does
not interfere with Sc 1.02 growth and, completely inhibiting the pimaricin treatments (P
and NPPNIPA-20AA(5)) the growth of Sc 1.02 through the end of the bioassay (Figure 30).
The Equation proposed in Section (Chapter 3) allow us calculate the pimaricin re-
leased under the conditions (pH and temperature) assayed during the grape juice sto-
rage. So the maximum concentration of pimaricin released during all the experiment
would be equal to 0.35±0.02 µg mL-1. This concentration is significantly lower (p < 0.05)
than the IC50 calculated in Section 5.2.2 on page 122 for free pimaricin in grape juice
(1.74±0.09 µg mL-1). Consequently, it seems that the nanohydrogel acts protecting the

5.2. RESULTS AND DISCUSSION 129
TABLE 15. Growth parameters of Saccharomyces cerevisiae (Sc 1.02)in grape juice under different antimicrobial treatments, calculated withEquation 34 on page 118
Treatment B $B (h-1) 'B (h) r2
C 0.447±0.011*** 0.030±0.002*** 15.440±0.628*** 0.9886
NPNIPA-20AA(5) 0.460±0.032*** 0.021±0.003*** 15.381±1.770*** 0.9415
P - - - -
NPPNIPA-20AA(5) - - - -
Values reported are the means±standard deviation (n = 2).
***(p < 0.001): extremely significant.
pimaricin from the degradation providing a more effective inhibition. In this way we
calculated the specific inhibition as follows:
(38) %Inhibition =OD0 !OD
OD0; Specific inhibition =
%Inhibition
Ct
where, OD0 is the optical density of the samples in control treatments (C and NPNIPA-20AA(5))
and OD is the optical density of samples with pimaricin (P and NPPNIPA-20AA(5)). Ct is de
concentration of pimaricin (µg mL-1) at each sampling time.
The inset in Figure 30 on the preceding page represents the specific inhibition of
Sc 1.02 with P and NP treatment, showing a clearly higher specific inhibition with the
NPPNIPA-20AA(5) treatment compared to P treatment.


CHAPTER 6
Sumario y conclusiones finales
El trabajo presentado en esta tesis describe la caracterización físico-química y fun-
cional de los nanohidrogeles de poli (N-isopropilacrilamida) con (PNIPA) sintetizados con
diferente grado de hidrofilia mediante la incorporación de ácido acrílico (AA), para su
utilización en el envasado activo de alimentos. Para llevar a cabo estos estudios se
han utilizado diversas técnicas de análisis físico-químico, tanto de las nanopartículas
sintetizadas como de los alimentos usados como modelo. Asimismo se han puesto a
punto diversas técnicas espectrofotométricas y cromatográficas con el fin de cuantificar
el agente antimicrobiano usado como modelo (pimaricina), así como diversas técnicas de
microbiología clásica y de biología molecular. El conjunto integrado de todos los estudios
realizados nos ha permitido conocer mejor el funcionamiento de los nanohidrogeles de
PNIPA/AA en función de las condiciones ambientales así como su efectividad en la libe-
ración controlada de antimicrobianos y su aplicación en la conservación de alimentos.
En el Capítulo 1 de esta tesis se da una visión general del estado del arte del envasa-
do activo de alimentos y como la aplicación de la nanotecnología puede aportar nuevas
y prometedoras soluciones dentro de este campo. Asimismo, se han descrito las princi-
pales características de la pimaricina, tanto sus ventajas como antimicrobiano de origen
natural como sus desventajas asociadas con su baja estabilidad en condiciones que fre-
cuentemente encontramos en los alimentos (pH ácido, exposición a la luz, tratamientos
térmicos, . . . ). Hasta el momento en los estudios realizados usando pimaricina como
agente antimicrobiano en alimentos, ésta se ha añadido directamente al alimento o apli-
cado mediante su inclusión en films que permite su liberación únicamente por difusión
por diferencia de concentraciones. Sin embargo, en este trabajo nosotros proponemos el
131

132 6. SUMARIO Y CONCLUSIONES FINALES
uso de nanohidrogeles para el transporte y liberación de pimaricina, capaces de liberarla
como respuesta a la variación de las condiciones ambientales presentes en el alimento
(pH y temperatura).
El Capítulo 2 describe la síntesis de nanohidrogeles de PNIPA/AA mediante sis-
temas agua-aceite. Se estudiaron como variables principales la concentración de AA
y porcentaje de entrecruzante. Una vez sintetizados se llevó a cabo el estudio de las
propiedades físico-químicas de dichos nanohidrogeles (tamaños de partícula, potencial
Z, temperatura crítica de colapso) en función de su composición. Asimismo, se ha mo-
delado el comportamiento de los nanohidrogeles de PNIPA que permite establecer una
relación empírica entre su composición y sus propiedades termodinámicas asociadas
con el grado de colapso en función de pH, la temperatura y el solvente.
Los resultados obtenidos nos muestran como la introducción de más entrecruzante
en el polímero aumenta la rigidez de éste limitando su capacidad para hincharse y
colapsar de manera que los cambios estructurales asociados con el incremento de la
temperatura van a ser más suaves. La introducción de AA en la matriz polimérica tam-
bién da lugar a cambios importantes en el comportamiento de los nanohidrogeles de
PNIPA. El aumento en la carga negativa de las nanopartículas produce una aumento de
la repulsión entre cargas del mismo signo que, junto con el aumento de la presión osmó-
tica debido a la presencia de contraiones, va a contribuir a expandir la matriz polimérica
dando lugar a un gel más hinchado. El efecto conjunto del aumento en el contenido AA
y en el entrecruzante da lugar a interacciones que producen un gel más rígido.
En lo referente al comportamiento de los nanohidrogeles de PNIPA/AA frente a la
temperatura y al pH, vimos como la introducción de un grupo hidrófilo va a suavizar los
cambios debidos a la temperatura, siempre y cuando el pH del solvente en el que se en-
cuentre el gel esté por encima del pKa del AA, de manera que su punto crítico de colapso
se sitúa en temperaturas más elevadas. A pH < pKa los grupos carboxilo aportados por
el AA no están ionizados dando lugar la dimerización de estos grupos mediante puentes

6. SUMARIO Y CONCLUSIONES FINALES 133
de hidrógeno dan lugar al colapso del hidrogel. El pH no tuvo influencia alguna en los
homopolímeros de PNIPA debido a la ausencia de grupos ionizables.
La influencia de los solventes alcohólicos, como el metanol, en el colapso de los na-
nohidrogeles de PNIPA/AA va depender en gran medida del fracción alcohólica presente
en la mezcla. Así los nanohidrogeles de PNIPA van a colapsar a medida que aumentamos
la fracción de metanol en el solvente hasta alcanzar una fracción crítica —en torno a
0,4— a partir de la cual el comportamiento cambia drásticamente de manera que el
nanohidrogel se hincha a medida que aumentamos la proporción de metanol. En los
nanohidrogeles más hidrófilos (con AA), al igual que en los casos anteriores, el colapso
por efecto del metanol es menos intenso. El grado de hinchamiento de los nanohidrogeles
en metanol y en agua puros no ofrece diferencias importantes tanto en los geles con AA
como en los homopolímeros.
Una vez analizadas las características físico-químicas de los nanohidrogeles de PNIPA-
/AA y su comportamiento frente a diferentes condiciones ambientales, en el Capítulo 3
evaluamos la capacidad de estos nanohidrogeles para transportar y liberar pimaricina
en función su composición y de las condiciones ambientales en las que se encuentra con
el fin de evaluar su aplicación en el envasado activo de alimentos.
En primer lugar estudiamos la capacidad de los nanohidrogeles de PNIPA/AA para
encapsular pimaricina. Los resultados mostraron ésta capacidad aumenta a medida
que disminuimos el contenido en entrecruzante en el gel y aumentamos el tiempo de in-
corporación, siendo más intenso el efecto del incremento en el tiempo de incorporación
cuanto mayor es el contenido en entrecruzante. El incremento en el tiempo de incor-
poración proporciona más tiempo para que la pimaricina difunda al interior de la matriz
polimérica.
El contenido en AA prácticamente no afectó a la eficiencia de carga sugiriendo que
las interacciones que se puedan producir entre la pimaricina y el nanohidrogel son de
carácter débil. No hubo diferencias significativas entre la eficiencia de carga obtenida en

134 6. SUMARIO Y CONCLUSIONES FINALES
metanol y en agua destilada, en concordancia con lo descrito en el Capítulo 2 en el que
vimos que el grado de hinchamiento no varía entre ambos solventes puros.
Para el estudio de la liberación pimaricina desde los nanohidrogeles de PNIPA/AA
en primer lugar evaluamos la efectividad del sistema diseñado para tal fin, en el que la
pimaricina tiene que difundir a través de dos barreras: la matriz del nanohidrogel y la
membrana de diálisis. Se ha visto como la membrana de diálisis no limita la difusión de
la pimaricina hacia el medio de liberación, por lo que a la hora de estudiar la difusión
desde los nanohidrogeles serán éstos los únicos que influyan en la cinética de liberación.
Se ha estudiado la influencia de la composición y del tiempo de incorporación en
la liberación de la pimaricina desde los nanohidrogeles de PNIPA/AA. El aumento en el
tiempo de incorporación supuso, para todos los nanohidrogeles estudiados, una dismi-
nución de la fracción máxima de pimaricina liberada (%Fmax) debido a que la pimaricina
tiene más tiempo para difundir al interior de la matriz polimérica, como vimos cuando
estudiamos la eficiencia de carga, de manera que la pimaricina permanece más atrapada
impidiendo su posterior liberación. La influencia del contenido en AA y del entrecruzante
en la liberación de pimaricina desde los nanohidrogeles de PNIPA/AA está directamente
relacionada con la influencia de estos factores sobre las características físico-químicas
del gel. Así una disminución en el contenido en entrecruzante da lugar a un gel más
flexible que colapsa de forma más intensa en el que la pimaricina va a quedar más
atrapada.
Durante el estudio de las cinéticas de liberación en geles con diferente grado de
hidrofilia vemos como la introducción de AA en los nanohidrogeles de PNIPA con un 5%
de entrecruzante permite a una liberación de pimaricina más lenta y continuada frente
al homopolímero de con el mismo contenido en entrecruzante con el cual la liberación se
detiene muy pronto obteniendo valores finales de %Fmax más bajos. Los resultados su-
gieren que la pimaricina puede quedar en una zona más expuesta en los homopolímeros
de PNIPA. Al colapsar éstos con una mayor intensidad debido al aumento de la tempe-
ratura expulsan rápidamente esta pimaricina y la liberación se paraliza pronto. En los

6. SUMARIO Y CONCLUSIONES FINALES 135
homopolímeros con menos entrecruzante el colapso es aún mas intenso aumentando
este efecto burst.
El ajuste de las cinéticas de liberación al modelo de Korsmeyer-Peppas, que fue el
que proporcionó mejores coeficientes de correlación (r2 > 0,98), nos permitió clasificar el
tipo de difusión desde los nanohidrogeles de PNIPA/AA. Así el mecanismo de liberación
desde el homopolímero con un 5% de entrecruzante se clasifica como difusión fickiana
en el que la liberación de la biomolécula está únicamente gobernado por la difusión de
ésta hacia el medio de liberación. Mientras que la liberación desde el nanohidrogel con
AA se clasifica como no-fickiana o transporte anómalo en el cual la liberación de la bio-
molécula está controlada tanto por la difusión de ésta hacia el medio de liberación como
por el propio comportamiento del nanohidrogel (hinchamiento/colapso). Estos resulta-
dos concuerdan con los descritos anteriormente, en los que asumimos que la pimaricina
liberada desde el nanohidrogel más hidrófobo probablemente sólo se corresponda con
aquella que permanece más en la superficie del nanohidrogel y que una vez que el gel
colapsa ésta es liberada debido a las fuerzas convectivas generadas hacia el medio de
liberación. En el caso del nanohidrogel más hidrófilo, la pimaricina tiene que difun-
dir desde el interior de la matriz polimérica, aparentemente con mayor dificultad que
cuando se encuentra en la superficie del nanohidrogel, dando lugar a un incremento en
el coeficiente de difusión que clasifica la liberación como no-fickiana.
Además hemos modelado la liberación de la pimaricina desde los nanohidrogeles
de PNIPA/AA en función de la temperatura y del pH que nos permite calcular la con-
centración de pimaricina liberada a un tiempo determinado y para unas condiciones
ambientales específicas. Los resultados obtenidos cuando estudiamos el efecto de la
temperatura por separado corroboran de nuevo lo explicado anteriormente. El colapso
más intenso en los nanohidrogeles sin AA va a generar un mayor atrapamiento de las
moléculas de pimaricina paralizando su liberación. Mientras que la introducción de AA
reduce el grado de colapso que se produce al aumentar la temperatura de manera que

136 6. SUMARIO Y CONCLUSIONES FINALES
la pimaricina puede difundir mejor a través de la matriz polimérica prolongando la can-
tidad liberada y el tiempo de liberación. La temperatura óptima de liberación con el
nanohidrogel con AA sería 40,04 ºC mientras que con el nanohidrogel sin AA la tem-
peratura óptima calculada mediante el modelo propuesto sería -1,25 ºC que, aunque
obviamente se encuentra fuera del intervalo experimental, indica claramente que la libe-
ración desde este nanohidrogel aumenta a medida que disminuimos la temperatura y el
gel se hincha. El comportamiento de los nanohidrogeles con AA frete al pH es similar la
observado con la temperatura, esto es, que al disminuir el pH el gel colapsa aumentando
la liberación de pimaricina desde el nanohidrogel, pero una vez que el pH disminuye
hasta valores inferiores al pKa del AA el colapso del nanohidrogel es tan intenso que el
atrapamiento físico impide la liberación de la pimaricina de la misma forma que lo hacía
el homopolímero de PNIPA al aumentar la temperatura.
Por último, estudiamos la capacidad de los nanohidrogeles de PNIPA/AA para liberar
la pimaricina cuando alternamos ciclos de temperatura por encima y por debajo del
punto crítico de colapso de los nanohidrogeles de PNIPA. Los resultados obtenidos con
el homopolímero de PNIPA son consistentes con el mecanismo de liberación positiva,
esto es, al aumentar la temperatura la liberación de pimaricina aumenta rápidamente
seguida de un proceso de liberación mucho más lento. Al introducir AA en el polímero
los cambios de temperatura no afectan tanto a la velocidad de liberación y la liberación
continua durante más ciclos que en el caso del homopolímero. En cualquier caso se
obtuvieron liberaciones más elevadas alternando varios ciclos de hinchamiento/colapso
que un único ciclo y con el gel más hidrófilo se obtuvieron liberaciones más sostenidas
en el tiempo. Esto último puede ser de gran utilidad en la industria alimentaria ya que
así el efecto antifúngico puede mantenerse durante tiempos más largos. Si el antifúngico
se libera en un solo ciclo este podría degradarse más fácilmente y por lo tanto no estar
activo para posteriores recontaminaciones.
Teniendo en cuenta entonces el potencial de los nanohidrogeles de PNIPA/AA car-
gados con pimaricina para el envasado activo de alimentos, en el Capítulo 4 evaluamos

6. SUMARIO Y CONCLUSIONES FINALES 137
la efectividad antimicrobiana de estos nanosistemas en el control del crecimiento de
hongos empleando en primer lugar un sistema modelo basado en placas de agar para
levaduras (PDA) para luego aplicarlo directamente sobre un alimento real, en nuestro
caso quesos de la DOP Arzúa-Ulloa.
Con el estudio de la efectividad antimicrobiana de los sistemas nanohidrogel-pima-
ricina empleando sistemas modelo inoculados con un microorganismo indicador (Sac-
charomyces cerevisiae) comprobamos el efecto protector que ejerce el nanosistema pro-
puesto. Así los mejores resultados se obtuvieron cuando las placas de PDA se incubaron
bajo condiciones que comprometían la estabilidad de la pimaricina (pH ácido y almacena-
miento con iluminación fluorescente). La reducción en el crecimiento de microorganismo
indicador con respecto a un control sin tratamiento antifúngico fue de 80,94±33,02%
para el nanohidrogel cargado con pimaricina, que fue significativamente mayor que la
observada en las placas tratadas con pimaricina libre, 19,91±6,68%. Mientras en que
las placas sin acidificar almacenadas a oscuridad, aunque la reducción fue mayor con
el nanohiddrogel cargado con pimaricina (27,07±4,15%), la diferencia con respecto a la
reducción con pimaricina libre no fue significativa (17,26±1,34%).
Por lo tanto, el efecto antifúngico de la pimaricina fue potenciado cuando ésta se
aplica incluida en el nanohidrogel, probablemente debido a que solamente es liberada
cuando las condiciones ambientales lo requieren ralentizando su degradación. Por lo
tanto el sistema nanohidrogel-pimaricina puede ser útil en alimentos que se contaminan
fácilmente por el crecimiento de hongos (esto es, con pHs ácidos y alto contenido en agua)
y que normalmente están expuestos a cambios en la temperatura de almacenamiento
durante su transporte y exposición a la venta.
La pimaricina se usa de forma habitual para la prevención de la contaminación su-
perficial de quesos. Es por esto que elegimos este alimento para evaluar la efectividad
antimicrobiana del sistema nanohidrogel-pimaricina en un alimento real. La liberación

138 6. SUMARIO Y CONCLUSIONES FINALES
controlada de pimaricina desde estos nanosistemas puede reducir la cantidad de pi-
maricina que migra desde la superficie del queso hacia su interior y por tanto reducir la
ingestión de conservantes por el consumidor.
Además de la efectividad antimicrobiana también estudiamos el efecto que los nano-
hidrogeles de PNIPA/AA tienen sobre las características físico-químicas del queso. Los
resultados obtenidos sugirieren que el recubrimiento con nanohidrogeles de PNPA/AA
no tuvo un efecto negativo sobre la maduración natural del queso. En los quesos en los
no se forzó la contaminación no se encontraron diferencias significativas (p > 0.05) entre
los tratamientos ya que es difícil encontrar diferencias cuando realizamos recuentos mi-
crobianos con la muestra entera de queso y no solo en superficie. Es por esto que en el
siguiente experimento forzamos la contaminación de los quesos usando como microor-
ganismo indicador Saccharomyces cerevisiae. Los recuentos en los quesos tratados con
nanohidrogel cargado con pimaricina fueron inferiores a los obtenidos con pimaricina
libre aunque estás diferencias sólo fueron significativas (p < 0.05) hasta los 22 días. Por
lo tanto, a pesar de que el efecto antimicrobiano conseguido no se mantuvo durante
mucho tiempo, quizás por partir de una contaminación inicial muy elevada, las diferen-
cias encontradas con respecto a tratamiento con pimaricina libre evidencian el efecto
protector del nanohidrogel cargado con pimaricina que ya observamos con los sistemas
modelo en placas de PDA y que van a permitir mantener el efecto antimicrobiano durante
más tiempo reduciendo la cantidad de pimaricina presente en el alimento.
Además en este Capítulo llevamos a cabo la puesta a punto de un método para
cuantificar hongos totales mediante PCR cuantitativa o en tiempo real (qPCR) como al-
ternativa a los métodos tradicionales de recuento en placa más tediosos y que además,
en el caso del recuento de hongos, pueden dar lugar a confusión debido a que su re-
cuento depende en gran medida de su estado fisiológico y capacidad para crecer en el
medio de cultivo. El ensayo fue lineal a lo largo de 7 órdenes de magnitud siendo el
límite de detección de 1 unidad logarítmica para el ADN extraído de cultivos puros. La
eficiencia de la reacción fue 0,91±0,08, lo que significa que tasa de amplificación fue

6. SUMARIO Y CONCLUSIONES FINALES 139
muy eficiente, y el ensayo de qPCR fue muy lineal (r2 = 0,9987). El límite de detección
para la cuantificación de hongos totales en queso es de cerca de 2 unidades logarítmicas
más alto que el obtenido con los cultivos puros. A pesar de ello el ensayo es lineal a lo
largo de 4 órdenes de magnitud. Aunque la amplificación en queso es altamente lineal
(r2 = 0,9995), la eficiencia es demasiado alta (1,47±0,17), probablemente debido a la pre-
sencia de inhibidores procedentes del queso que no se eliminaron durante la extracción
del ADN. También podría ser debido a la presencia de gran cantidad de ADN no-objetivo
proveniente otros microorganismos presentes en el queso ya que los valores de CT de las
muestras de control negativo (quesos sin contaminación artificial) son demasiado bajos
(23,08 ± 0,59).
Los recuentos de los quesos contaminados con el microorganismo indicador (Sac-
charomyces cerevisiae) realizados mediante recuento en placa fueron comparados con
los resultados obtenidos en el análisis mediante qPCR. La correlación entre los recuen-
tos mediante qPCR y recuento en placa fue bueno, alrededor de 100% de precisión. Sin
embargo los recuentos obtenidos mediante qPCR fueron más altos que los obtenidos
mediante recuento en placa como resultado de la presencia de hongos viables pero no
cultivables o más probablemente debido a presencia de células muertas en las muestras
de queso.
Por último en el Capítulo 5 evaluamos la capacidad de los sistemas nanohidrogel-
pimaricina para alargar el tiempo de vida útil de zumos de fruta refrigerados (pasteu-
rizados) mediante la liberación controlada del antifúngico. Para ello en primer lugar
probamos el nanosistema en un sistema modelo para luego usarlo en zumo de uva.
En primer lugar se ha evaluado un método para cuantificar pimaricina en medio
de cultivo para levaduras (YPD) y en zumo de uva mediante cromatografía líquida en
fase reversa (RP-HPLC). El ensayo fue altamente lineal (r2 = 0,9996) en el intervalo de
concentraciones evaluado (0,05 a 10 µg mL-1). Las recuperaciones obtenidas empleando
patrones de pimaricina pura fueron bastante altos: 98,11% y 97,32% en el medio de

140 6. SUMARIO Y CONCLUSIONES FINALES
cultivo y en zumo de uva, respectivamente. Por lo que podemos prescindir de un paso
previo de extracción para la detección de pimaricina en las matrices empleadas.
A continuación evaluamos la estabilidad de la pimaricina en medio de cultivo YPD
y en zumo de uva. La velocidad de degradación de la pimaricina en zumo fue 2 veces
más alta que en medio de cultivo probablemente debido al bajo pH del zumo de uva. El
tratamiento de pasteurización también ejerció un efecto importante sobre la degradación
de la pimaricina aumentando cerca de 50 veces la velocidad de degradación en zumo
de uva. Los resultados mostraron la baja estabilidad de la pimaricina en condiciones
que habitualmente podemos encontrar en los alimentos. Por lo tanto, el desarrollo de
sistemas que actúen protegiendo a la pimaricina de la degradación podría contribuir a
mejorar su actividad antimicrobiana.
Por otro lado evaluamos la capacidad inhibitoria de la pimaricina en las matrices em-
pleadas en este capítulo, medio de cultivo YPD y zumo de uva, mediante la construcción
de dosis-respuesta usando Saccharomyces cerevisiae como microorganismo indicador.
Así la dosis inhibitoria 50 (IC50) en medio de cultivo YPD fue 2,95±0,06 µg mL-1 mientras
que en zumo de uva fue 1,74±0,09 µg mL-1. Las condiciones proporcionadas por el zumo
con pHs más bajos y la falta de algún nutriente que se encuentra en mayor proporción
en el medio de cultivo (fuente de N) hacen que concentraciones más bajas de pimaricina
sean más efectivas en esta matriz.
A continuación evaluamos la eficacia del nanohidrogel cargado pimaricina para im-
pedir el deterioro mediante crecimiento microbiano empleando sistemas modelo, que en
este caso se basaron en un medio de cultivo YPD inoculado con un microorganismo in-
dicador (Saccharomyces cerevisiae). Para el modelado de las curvas de crecimiento en
las muestras tratadas con pimaricina, se desarrolló una ecuación bilogística en la que
el crecimiento máximo del microorganismo en la segunda fase se calculó como el limt!$%
,
que es el valor real para este parámetro. La primera parte de la ecuación se corresponde
con un modelo logístico que nos permite predecir el efecto del antifúngico en la primera

6. SUMARIO Y CONCLUSIONES FINALES 141
fase del crecimiento del microorganismo indicador. La segunda parte del modelo se co-
rresponde con un modelo logístico reparametrizado para mostrar la latencia de forma
explícita y que nos permite modelar el crecimiento del microorganismo indicador tras el
efecto del antifúngico, así la latencia se corresponderá con el tiempo necesario para que
la levadura se recupere de los daños que pueda causarle la pimaricina y pueda crecer.
Los resultados mostraron que el sistema nanohidrogel-pimaricina propuesto fue muy
eficaz inhibiendo el crecimiento del microorganismo indicador, especialmente cuando
empleamos el nanohidrogel más hidrófilo. Este nanohidrogel, que como vimos ante-
riormente proporciona una liberación más lenta y sostenida, incrementó el tiempo de
latencia del microorganismo indicador de 12,39±0,54, que proporcionó la pimaricina
libre, a 81,19±0,17 h. Además el nanohidrogel por si solo no afectó al crecimiento del
microorganismo indicador.
Los zumos refrigerados (pasteurizados) presentan una alta aceptación por los con-
sumidores debido a que tiene un sabor y aroma más natural. Sin embargo la estabilidad
de estos productos depende en gran medida de evitar la recontaminación manteniendo
la cadena de frío especialmente una vez abiertos. Además el uso de sulfitos, que se
añaden de forma habitual para evitar este tipo de recontaminaciones, cada vez está
menos aceptado debido a su asociación con problemas de alergia. Una alternativa sería
la substitución de estos conservantes químicos por conservantes de origen natural como
la pimaricina. Sin embargo, como vimos anteriormente, la pimaricina se ve afectada
por el tratamiento térmico de pasteurización por lo que para obtener buenos resulta-
dos habría que aumentar la concentración inicial para asegurar que, aunque se degrade
parte la cantidad activa, ésta sea suficiente para mantener la estabilidad del alimento
durante tiempos prolongados de almacenamiento. Otra posibilidad sería añadirla des-
pués del tratamiento de pasteurización pero esto comprometería el envasado aséptico de
la bebida.

142 6. SUMARIO Y CONCLUSIONES FINALES
A la vista de los buenos resultados obtenidos en el sistema modelo con el nanohidro-
gel cargado con pimaricina en comparación con los obtenidos con la pimaricina libre di-
rectamente añadida a las muestras, evaluamos este sistema en zumos. El nanohidrogel
puede actuar protegiendo a la pimaricina de la degradación durante el almacenamiento,
manteniendo una liberación controlada del antifúngico que permite reducir la cantidad
de pimaricina presente en la bebida.
Los resultados mostraron que, nuevamente, el nanohidrogel por si solo no afecta al
crecimiento del microorganismo indicador. El sistema nanohidrogel-pimaricina actúa
inhibiendo totalmente el crecimiento del microorganismo indicador durante el tiempo
ensayado de la misma manera que la pimaricina libre. Sin embargo cuando calculamos
la inhibición específica respecto a la cantidad de pimaricina presente en el zumo, ésta
resulta claramente más alta para el sistema nanohidrogel-pimaricina que para la pi-
maricina libre. Cuando calculamos la concentración de pimaricina liberada desde el
nanohidrogel en las condiciones presentes en zumo, a partir de los modelo de libera-
ción desarrollado en el Capítulo 3, obtenemos que ésta es de 0,35 ± 0,02 µg mL-1. Esta
concentración es significativamente inferior a la IC50 calculada para esta matriz (1,74 ±
0,09 µg mL-1). Por lo que el nanohidrogel parece actuar protegiendo a la pimaricina de
la degradación proporcionando una inhibición más efectiva.
Por todo ello, en este trabajo de tesis se ha conseguido demostrar la utilidad de
los nanohidrogeles para transportar y liberar pimaricina como respuesta a estímulos
externos y su efectividad para controlar el deterioro de los alimentos por el crecimiento
de microorganismos, mediante la combinación de dos mecanismos: liberación lenta y
controlada y protección frente a la degradación ambiental del antifúngico. Este sistema
de liberación permite además reducir la cantidad de pimaricina presente en el alimento
para alcanzar un efecto inhibitorio.
Estos resultados resaltan la aptitud de los sistemas nanohidrogel-pimaricina en el
envasado activo de alimentos pasteurizados refrigerados mediante su incorporación a

6. SUMARIO Y CONCLUSIONES FINALES 143
los materiales en contacto con alimentos con el fin de extender su vida útil una vez que
abierto el envase.


CHAPTER 7
Perspectivas
Nunca hasta la realización de este trabajo se había abordado el estudio de la utiliza-
ción de nanopartículas de PNIPA como sistemas de liberación controlada de conservantes
alimentarios. Es, por lo tanto, esta tesis una exploración pionera en este ámbito cuyos
resultados permiten vislumbrar con claridad nuevas y diversas líneas de trabajo que han
de ser llevadas a cabo en los próximos años.
La variedad en las vías de investigación que ahora se abren son consecuencia directa
de las también numerosas derivaciones que resultan de los diferentes capítulos de esta
memoria y que previsiblemente generarán conocimientos (algunos de ellos básicos) tan
abundantes como lo son las aplicaciones que, con ánimo enumerativo y no exhaustivo,
se apuntan en los párrafos siguientes.
Así, en primer lugar, será necesario profundizar en los mecanismos moleculares que
subyacen a los procesos de hinchamiento y colapso de las nanopartículas de PNIPA,
particularmente en el caso de los heteropolímeros. Este conocimiento permitirá diseñar y
formular nanohidrogeles con propiedades más ajustadas a la funcionalidad perseguida.
Adicionalmente este conocimiento permitirá construir modelos con los que predecir con
mayor precisión cuál será su comportamiento ante una aplicación determinada.
En este mismo sentido resulta de especial interés estudiar la síntesis de nano-
hidrogeles de PNIPA que respondan a otros estímulos ambientales diferentes a la tempe-
ratura. Diseñar materiales que actúen liberando alguna sustancia, por ejemplo, frente a
cambios en el pH del medio, abre innumerables aplicaciones alimentarias para mantener
la calidad o alargar la vida útil de alimentos cuya acidez bien evoluciona durante el al-
macenamiento o es indicadora de alteración.
145

146 7. PERSPECTIVAS
También en el ámbito de la síntesis, el estudio de polímeros de PNIPA que incor-
poren moléculas direccionadoras es una posibilidad que merece ser explorada. Algunos
avances en esta línea ya se han realizado precisamente en el marco del proyecto de
investigación coordinado que financió esta tesis. Así, nuestros compañeros de la Uni-
versidad del País Vasco y de la Universidad Complutense de Madrid han sintetizado y
aplicado con éxito nanohidrogeles que incorporan ácido fólico con el fin de vectorizar la
liberación de antineoplásicos en el entorno de las células cancerosas. Del mismo modo
podría pensarse en unir a las nanopartículas anticuerpos que reconozcan selectivamente
patógenos alimentarios con el fin de que la liberación del antimicrobiano sólo se realice
cuando existe en el alimento una población tal que pueda suponer un riesgo para el
consumidor. Este ejemplo u otros en la misma línea deberán ser explorados en los pró-
ximos años para explotar todas las potencialidades de estos materiales Pero sin duda es
la aplicación de estos dispositivos de liberación controlada al desarrollo de sistemas y
materiales de envasado activo de alimentos el campo que presenta un mayor recorrido
en términos de I+D. Esta tesis puso de manifiesto que era posible controlar el creci-
miento microbiano durante el almacenamiento de dos alimentos procesados (queso y
zumo), utilizando las nanopartículas de PNIPA cargadas con primaricina. Estos experi-
mentos, realizados poniendo directamente en contacto el conjunto del alimento con las
nanopartículas, demostraron la factibilidad de la idea y abrieron el camino para, por
una parte, evaluar el comportamiento de los dispositivos frente a otros alimentos tanto
frescos como procesados; y por otra, incorporar estas nanopartículas a los materiales
de envasado y contacto alimentario para desarrollar envases activos antimicrobianos e
inteligentes.
Aunque no se incorporaron a esta tesis ya existen resultados y se han dado algunos
avances en esta última dirección en colaboración con el grupo del Dr. Vicente de la Uni-
versidade do Minho en Braga (Portugal) para desarrollar films comestibles a escala nano
o micro que incorporen las nanopartículas de PNIPA como sistemas de liberación. Los
resultados preliminares obtenidos por el momento indican la conveniencia de continuar

7. PERSPECTIVAS 147
las investigaciones mejorando las propiedades tecnológicas (resistencia, integridad, per-
meabilidad, color) de los sistemas conjuntos (film+nanopartícula) para ser utilizados en
alimentos y evaluando su eficacia en alguno de ellos.
Estas investigaciones deberán en un futuro próximo extenderse a otros materiales
de contacto alimentario, particularmente los plásticos, tanto en su forma convencional
como en presentaciones a escala nanométrica (como las nanofibras) o en plásticos bio-
degradables, que multiplican las potencialidades de aplicación de los nanodispositivos
de PNIPA. En este ámbito resultará crucial intensificar la colaboración con el grupo del
Dr. Lagarón del IATA de Valencia (CSIC) con el que ya se mantienen contactos y que
deberían enfocarse a conseguir la compatibilidad de los procesos de fabricación de los
plásticos con las nanopartículas de PNIPA evitando que éstas se degraden y pierdan sus
propiedades durante procesos como la polimerización o la extrusión.
En un apartado de perspectivas no puede dejar de apuntarse el desarrollo de otras
aplicaciones alimentarias de los dispositivos de liberación controlada e inteligente de
nanopartículas de PNIPA. Las posibilidades en este sentido son muy variadas y tan sólo
merece apuntar algunas de ellas para ilustrar la amplitud del campo. Así podrían utili-
zarse como indicadores de proceso (por ejemplo, liberando una sustancia determinada
que provoca un cambio de color cuando se alcanza determinado valor de temperatura o
pH), para proteger moléculas lábiles (aromas, antioxidantes) y liberarlos bajo demanda
o para diseñar sistemas autoesterilizables (por liberación de un agente como el óxido de
titanio) que actúen en una determinada condición ambiental.
Finalmente, todas las posibilidades apuntadas anteriormente implican el desarrollo
y puesta a punto de técnicas para el manejo de los sistemas nanométricos que se vayan
a emplear y de las técnicas de análisis para la evaluación de su eficacia y, junto con ello,
los aspectos toxicológicos y de seguridad. No por ser los últimos citados la importancia
de estas cuestiones es menor, todo lo contrario. En los últimos años se han realizado
significativos esfuerzos en la evaluación de la seguridad de las aplicaciones de la na-
notecnología. Lejos de estar resueltos, el estudio de estos aspectos, cobra más fuerza,

148 7. PERSPECTIVAS
puesto que cada vez es también mayor las exigencias de cara a los consumidores y muy
especialmente al medio ambiente.
Así pues, los estudios iniciados con el grupo del Profesor Teijón de la Universidad
Complutense de Madrid en el que se evaluó la posible toxicidad de las nanopartículas de
PNIPA usadas en esta memoria ha de ampliarse con nuevos ensayos tanto in vitro con
líneas celulares como in vivo con animales de experimentación, con el fin de garantizar
la viabilidad final de todos los estudios señalados en los párrafos precedentes.

Bibliography
[1] N. Ahuja, O. P. Katare, and B. Singh. Studies on dissolution enhancement and
mathematical modeling of drug release of a poorly water-soluble drug using water-
soluble carriers. European Journal of Pharmaceutics and Biopharmaceutics, 65(1):
26–38, 2007.
[2] H. R. Allcock and A. M. A. Ambrosio. Synthesis and characterization of ph-sensitive
poly(organophosphazene) hydrogels. Biomaterials, 17(23):2295–2302, 1996. Cited
By (since 1996): 63.
[3] M. Andersson, A. Axelsson, and G. Zacchi. Diffusion of glucose and insulin in a
swelling n-isopropylacrylamide gel. International journal of pharmaceutics, 157(2):
199–208, 1997.
[4] I. Andorrà, B. Esteve-Zarzoso, J. M. Guillamón, and A. Mas. Determination of
viable wine yeast using dna binding dyes and quantitative pcr. International journal
of food microbiology, 144(2):257–262, 2010.
[5] P. Appendini and J. H. Hotchkiss. Surface modification of poly(styrene) by the
attachment of an antimicrobial peptide. Journal of Applied Polymer Science, 81(3):
609–616, 2001. Cited By (since 1996): 22.
[6] S. Argentiere, L. Blasi, G. Ciccarella, G. Barbarella, R. Cingolani, and G. Gigli.
Nanogels of poly(acrylic acid): Uptake and release behavior with fluorescent
oligothiophene-labeled bovine serum albumin. Journal of Applied Polymer Science,
116(5):2808–2815, 2010. Cited By (since 1996): 4.
[7] K. Arshak, C. Adley, E. Moore, C. Cunniffe, M. Campion, and J. Harris. Character-
isation of polymer nanocomposite sensors for quantification of bacterial cultures.
149

150 Bibliography
Sensors and Actuators, B: Chemical, 126(1):226–231, 2007. Cited By (since 1996):
15.
[8] H. Auweter, H. Bohn, H. Haberkorn, D. Horn, E. Luddecke, and V. Rauschenber-
ger. Production of carotenoid preparations in the form of coldwater-dispersible
powders, and the use of the novel carotenoid preparations, 1999.
[9] G. Bärwald. Über die kaltenkeimung von apfelsaft mit dem fungicid pimaricin. Die
industrielle Obst- und Gemüseverwertung, 61:453–458, 1976.
[10] L. Bastarrachea, S. Dhawan, and S. S. Sablani. Engineering properties of
polymeric-based antimicrobial films for food packaging. Food Engineering Reviews,
3(2):79–93, 2011. Cited By (since 1996): 2.
[11] F. Berti, S. Todros, D. Lakshmi, M. J. Whitcombe, I. Chianella, M. Ferroni, S. A.
Piletsky, A. P. F. Turner, and G. Marrazza. Quasi-monodimensional polyaniline
nanostructures for enhanced molecularly imprinted polymer-based sensing. Bio-
sensors and Bioelectronics, 26(2):497–503, 2010. Cited By (since 1996): 10.
[12] A. Bilia, V. Carelli, G. Di Colo, and E. Nannipieri. In vitro evaluation of a ph-
sensitive hydrogel for control of gi drug delivery from silicone-based matrices. In-
ternational journal of pharmaceutics, 130(1):83–92, 1996. Cited By (since 1996):
25.
[13] M. D. Blanco, S. Guerrero, C. Teijón, R. Olmo, L. Pastrana, I. Katime, and
J. M. Teijón. Preparation and characterization of nanoparticulate poly (n-
isopropylacrylamide) hydrogel for the controlled release of anti-tumour drugs. Poly-
mer International, 57(11):1215–1225, 2008.
[14] M. D. Blanco, M. Benito, R. Olmo, C. Teijón, E. Pérez, I. Katime, and J. M. Teijón.
Synthesis and in vitro biological evaluation as antitumour drug carriers of folate-
targeted n-isopropylacrylamide-based nanohydrogels. Polymer International, 61(7):
1202–1212, 2012.
[15] C. Blasco and Y. Picó. Determining nanomaterials in food. TrAC - Trends in Ana-
lytical Chemistry, 30(1):84–99, 2011.

Bibliography 151
[16] P. Bordes, E. Pollet, and L. Avérous. Nano-biocomposites: Biodegradable polyes-
ter/nanoclay systems. Progress in Polymer Science (Oxford), 34(2):125–155, 2009.
Cited By (since 1996): 120.
[17] H. Vanden Bossche, M. Engelen, and F. Rochette. Antifungal agents of use in
animal health - chemical, biochemical and pharmacological aspects. Journal of
veterinary pharmacology and therapeutics, 26(1):5–29, 2003.
[18] H. Bozkurt and O. Erkmen. Predictive modeling of yersinia enterocolitica inactiv-
ation in turkish feta cheese during storage. Journal of Food Engineering, 47(2):
81–87, 2001.
[19] F. Brandl, F. Kastner, R. M. Gschwind, T. Blunk, J. Teßmar, and A. Göpferich.
Hydrogel-based drug delivery systems: Comparison of drug diffusivity and release
kinetics. Journal of Controlled Release, 142(2):221–228, 2010.
[20] L. Brannon-Peppas and N. A. Peppas. Equilibrium swelling behavior of ph-
sensitive hydrogels. Chemical Engineering Science, 46(3):715–722, 1991. Cited
By (since 1996): 198.
[21] A. L. Brody. "nano, nano" food packaging technology. Food Technology, 57(12):
52–54, 2003. Cited By (since 1996): 18.
[22] A. L. Brody, B. Bugusu, J. H. Han, C. K. Sand, and T. H. McHugh. Innovative food
packaging solutions. Journal of Food Science, 73(8), 2008.
[23] L. E. Bromberg and E. S. Ron. Temperature-responsive gels and thermogelling
polymer matrices for protein and peptide delivery. Advanced Drug Delivery Re-
views, 31(3):197–221, 1998.
[24] M. N. Buffa, A. J. Trujillo, M. Pavia, and B. Guamis. Changes in textural, micro-
structural, and colour characteristics during ripening of cheeses made from raw,
pasteurized or high-pressure-treated goats’ milk. International Dairy Journal, 11
(11-12):927–934, 2001.

152 Bibliography
[25] G. G. Buonocore, A. Conte, M. R. Corbo, M. Sinigaglia, and M. A. Del Nobile. Mono-
and multilayer active films containing lysozyme as antimicrobial agent. Innovat-
ive Food Science and Emerging Technologies, 6(4):459–464, 2005. Cited By (since
1996): 20.
[26] M. A. Busolo, P. Fernandez, M. J. Ocio, and J. M. Lagaron. Novel silver-based
nanoclay as an antimicrobial in polylactic acid food packaging coatings. Food
Additives and Contaminants - Part A Chemistry, Analysis, Control, Exposure and
Risk Assessment, 27(11):1617–1626, 2010. Cited By (since 1996): 5.
[27] CAGPA. Consellería de agricultura, gandería e política agroalimentaria. orden de
26 de diciembre de 1997 por la que se aprueba el reglamento de la denominación
de 641 origen arzúa-ulloa y de su consejo regulador. Diario Oficial de Galicia, 5,
190 - 204, 1998.
[28] A. Cagri, Z. Ustunol, and E. T. Ryser. Antimicrobial, mechanical, and mois-
ture barrier properties of low ph whey protein-based edible films containing p-
aminobenzoic or sorbic acids. Journal of Food Science, 66(6):865–870, 2001. Cited
By (since 1996): 76.
[29] A. Cagri, Z. Ustunol, and E. T. Ryser. Inhibition of three pathogens on bologna
and summer sausage using antimicrobial edible films. Journal of Food Science, 67
(6):2317–2324, 2002. Cited By (since 1996): 24.
[30] T. Çaykara, S. Kiper, and G. Demirel. Network parameters and volume phase
transition behavior of poly(n-isopropylacrylamide) hydrogels. Journal of Applied
Polymer Science, 101(3):1756–1762, 2006.
[31] R. Censi, T. Vermonden, M. J. van Steenbergen, H. Deschout, K. Braeckmans,
S. C. De Smedt, C. F. van Nostrum, P. di Martino, and W. E. Hennink. Photo-
polymerized thermosensitive hydrogels for tailorable diffusion-controlled protein
delivery. Journal of Controlled Release, 140(3):230–236, 2009.
[32] J. A. Centeno, J. L. Rodriguez-Otero, and A. Cepeda. Microbiological study of arzua
cheese (nw spain) throughout cheesemaking and ripening. Journal of Food Safety,

Bibliography 153
14(3):229–241, 1994.
[33] M. A. Cerqueira, B. W. S. Souza, J. T. Martins, J. A. Teixeira, and A. A. Vicente.
Seed extracts of gleditsia triacanthos: Functional properties evaluation and incor-
poration into galactomannan films. Food Research International, 43(8):2031–2038,
2010. Cited By (since 1996): 4.
[34] M. A. Cerqueira, A. I. Bourbon, A. C. Pinheiro, J. T. Martins, B. W. S. Souza, J. A.
Teixeira, and A. A. Vicente. Galactomannans use in the development of edible
films/coatings for food applications. Trends in Food Science and Technology, 22
(12):662–671, 2011. Cited By (since 1996): 2.
[35] Q. Chaudhry, M. Scotter, J. Blackburn, B. Ross, A. Boxall, L. Castle, R. Aitken,
and R. Watkins. Applications and implications of nanotechnologies for the food
sector. Food Additives and Contaminants - Part A Chemistry, Analysis, Control,
Exposure and Risk Assessment, 25(3):241–258, 2008. Cited By (since 1996): 109.
[36] F. N. Chearúil and O. I. Corrigan. Thermosensitivity and release from poly n-
isopropylacrylamide-polylactide copolymers. International journal of pharmaceut-
ics, 366(1-2):21–30, 2009.
[37] G. Chen and A. S. Hoffman. Graft copolymers that exhibit temperature-induced
phase transitions over a wide range of ph. Nature, 373(6509):49–52, 1995.
[38] H. Chen, J. Weiss, and F. Shahidi. Nanotechnology in nutraceuticals and func-
tional foods. Food Technology, 60(3):30–36, 2006. Cited By (since 1996): 57.
[39] H. Chen, Y. Gu, and Y. Hu. Comparison of two polymeric carrier formulations
for controlled release of hydrophilic and hydrophobic drugs. Journal of Materials
Science: Materials in Medicine, 19(2):651–658, 2008.
[40] H. Chen, L. H Liu, L. S Wang, C. B Ching, H. W Yu, and Y. Y Yang. Thermally
responsive reversed micelles for immobilization of enzymes. Advanced Functional
Materials, 18(1):95–102, 2008.
[41] Y. Cheng, Y. Liu, J. Huang, K. Li, W. Zhang, Y. Xian, and L. Jin. Combining
biofunctional magnetic nanoparticles and atp bioluminescence for rapid detection

154 Bibliography
of escherichia coli. Talanta, 77(4):1332–1336, 2009. Cited By (since 1996): 18.
[42] J. H. Choi, W. Y. Choi, D. S. Cha, M. J. Chinnan, H. J. Park, D. S. Lee, and J. M.
Park. Diffusivity of potassium sorbate in îº-carrageenan based antimicrobial film.
LWT - Food Science and Technology, 38(4):417–423, 2005. Cited By (since 1996):
23.
[43] E. Chollet, Y. Swesi, P. Degraeve, and I. Sebti. Monitoring nisin desorption from a
multi-layer polyethylene-based film coated with nisin loaded hpmc film and diffu-
sion in agarose gel by an immunoassay (elisa) method and a numerical modeling.
Innovative Food Science and Emerging Technologies, 10(2):208–214, 2009. Cited
By (since 1996): 12.
[44] L. Cocolin, L. F. Bisson, and D. A. Mills. Direct profiling of the yeast dynamics in
wine fermentations. FEMS microbiology letters, 189(1):81–87, 2000.
[45] A. L. Cordeiro, R. Zimmermann, S. Gramm, M. Nitschke, A. Janke, N. Schäfer,
K. Grundke, and C. Werner. Temperature dependent physicochemical properties
of poly(n- isopropylacrylamide-co-n-(1-phenylethyl) acrylamide) thin films. Soft
Matter, 5(7):1367–1377, 2009.
[46] R. Coronado, S. Pekerar, A. T. Lorenzo, and M. A. Sabino. Characterization of
thermo-sensitive hydrogels based on poly(n-isopropylacrylamide)/hyaluronic acid.
Polymer Bulletin, 67(1):101–124, 2011.
[47] D. C. Coughlan and O. I. Corrigan. Release kinetics of benzoic acid and its sodium
salt from a series of poly(n-isopropylacrylamide) matrices with various percentage
crosslinking. Journal of pharmaceutical sciences, 97(1):318–330, 2008. Cited By
(since 1996): 6.
[48] H. M. Crowther and B. Vincent. Swelling behavior of poly-n-isopropylacrylamide
microgel particles in alcoholic solutions. Colloid and Polymer Science, 276(1):46–
51, 1998. Cited By (since 1996): 96.
[49] Y. Dai, L. A. McLandsborough, J. Weiss, and M. Peleg. Concentration and ap-
plication order effects of sodium benzoate and eugenol mixtures on the growth

Bibliography 155
inhibition of saccharomyces cerevisiae and zygosaccharomyces bailii. Journal of
Food Science, 75(7), 2010.
[50] D. Dainelli, N. Gontard, D. Spyropoulos, E. Zondervan van den Beuken, and
P. Tobback. Active and intelligent food packaging: legal aspects and safety con-
cerns. Trends in Food Science and Technology, 19(SUPPL. 1):S99–S108, 2008.
Cited By (since 1996): 14.
[51] P. Dalgaard and K. Koutsoumanis. Comparison of maximum specific growth rates
and lag times estimated from absorbance and viable count data by different math-
ematical models. Journal of microbiological methods, 43(3):183–196, 2001.
[52] B. P. F. Day. Active packaging, pages 282–302. Food packaging technology. CRC
Press, Boca Raton, FL, 2003.
[53] F. Devlieghere, L. Vermeiren, M. Jacobs, and J. Debevere. Effectiveness of
hexamethylenetetramine-incorporated plastic for the active packaging of foods.
Packaging Technology and Science, 13(3):117–121, 2000. Cited By (since 1996):
15.
[54] E. Díez-Peña. Desarrollo y caracterización de hidrogeles poliméricos con aplicación
en la liberación controlada de fármacos. Phd thesis, Universidad Complutense de
Madrid, Madrid, 2002.
[55] R. Dinarvand and A. D’Emanuele. The use of thermoresponsive hydrogels for on-
off release of molecules. Journal of Controlled Release, 36(3):221–227, 1995. Cited
By (since 1996): 68.
[56] G. Le Dréan, J. Mounier, V. Vasseur, D. Arzur, O. Habrylo, and G. Barbier. Quan-
tification of Penicillium camemberti and P. roqueforti mycelium by real-time pcr to
assess their growth dynamics during ripening cheese. International Journal of Food
Microbiology, 138:100–107, 2010.
[57] F. Eeckman, A. J. Moës, and K. Amighi. Poly (n-isopropylacrylamide) copolymers
for constant temperature controlled drug delivery. International journal of pharma-
ceutics, 273(1-2):109–119, 2004.

156 Bibliography
[58] S. M. Elsaeed, R. K. Farag, and N. S. Maysour. Synthesis and characterization
of ph-sensitive crosslinked (nipa-co-aac) nanohydrogels copolymer. Journal of Ap-
plied Polymer Science, 124(3):1947–1955, 2012.
[59] P. Fajardo, J. T. Martins, C. Fuciños, L. Pastrana, J. A. Teixeira, and A. A. Vicente.
Evaluation of a chitosan-based edible film as carrier of natamycin to improve the
storability of saloio cheese. Journal of Food Engineering, 101(4):349–356, 2010.
[60] C. Fänger, H. Wack, and M. Ulbricht. Macroporous poly(n-isopropylacrylamide) hy-
drogels with adjustable size "cut-off" for the efficient and reversible immobilization
of biomacromolecules. Macromolecular Bioscience, 6(6):393–402, 2006.
[61] M. A. Farid, H. A. El-Enshasy, A. I. El-Diwany, and E. S A. El-Sayed. Optimization
of the cultivation medium for natamycin production by streptomyces natalensis.
Journal of Basic Microbiology, 40(3):157–166, 2000.
[62] A. Fernandez, S. Torres-Giner, and J. M. Lagaron. Novel route to stabilization of
bioactive antioxidants by encapsulation in electrospun fibers of zein prolamine.
Food Hydrocolloids, 23(5):1427–1432, 2009. Cited By (since 1996): 17.
[63] Bruce A. Firestone and Ronald A. Siegel. Dynamic ph-dependent swelling proper-
ties of a hydrophobic polyelectrolyte gel. Polymer communications Guildford, 29(7):
204–208, 1988. Cited By (since 1996): 24.
[64] J. Fu, B. Park, G. Siragusa, L. Jones, R. Tripp, Y. Zhao, and Y. J Cho. An au/si
hetero-nanorod-based biosensor for salmonella detection. Nanotechnology, 19(15),
2008. Cited By (since 1996): 25.
[65] C. Fuciñosos, N. P. Guerra, J. M. Teijón, L. M. Pastrana, M. L. Rúa, and I. Katime.
Use of poly(n-isopropylacrylamide) nanohydrogels for the controlled release of pi-
maricin in active packaging. Journal of Food Science, 77(7):N21–N28, 2012.
[66] V. P. Gadang, N. S. Hettiarachchy, M. G. Johnson, and C. Owens. Evaluation of
antibacterial activity of whey protein isolate coating incorporated with nisin, grape
seed extract, malic acid, and edta on a turkey frankfurter system. Journal of Food
Science, 73(8):M389–M394, 2008. Cited By (since 1996): 17.

Bibliography 157
[67] A. Galdikas, A. Mironas, D. Senuliene, V. Strazdiene, A. Å etkus, and D. Zelenin.
Response time based output of metal oxide gas sensors applied to evaluation of
meat freshness with neural signal analysis. Sensors and Actuators, B: Chemical,
69(3):258–265, 2000. Cited By (since 1996): 19.
[68] N. Garti and A. Benichou. Recent developments in double emulsions for food applic-
ations, pages 353–412. Food emulsions. Marcel Dekker, New York, USA, 2004.
[69] C. M. GÃ΍bilmez, A. Yemenicioǧlu, and A. Arslanoǧlu. Antimicrobial and
antioxidant activity of edible zein films incorporated with lysozyme, albumin pro-
teins and disodium edta. Food Research International, 40(1):80–91, 2007. Cited
By (since 1996): 38.
[70] S. Gemili, A. Yemenicioǧlu, and S. A. Altinkaya. Development of cellulose acetate
based antimicrobial food packaging materials for controlled release of lysozyme.
Journal of Food Engineering, 90(4):453–462, 2009. Cited By (since 1996): 19.
[71] R. M. Goldsmith. Detection of contaminants in food, 1994.
[72] J. F. Graveland-Bikker and C. G. de Kruif. Unique milk protein based nanotubes:
Food and nanotechnology meet. Trends in Food Science and Technology, 17(5):
196–203, 2006. Cited By (since 1996): 65.
[73] S. Green, M. Roldo, D. Douroumis, N. Bouropoulos, D. Lamprou, and D. G. Fa-
touros. Chitosan derivatives alter release profiles of model compounds from cal-
cium phosphate implants. Carbohydrate research, 344(7):901–907, 2009.
[74] N. P. Guerra, C. L. Macías, A. T. Agrasar, and L. P. Castro. Development of a
bioactive packaging cellophane using nisaplin® as biopreservative agent. Letters
in applied microbiology, 40(2):106–110, 2005. Cited By (since 1996): 11.
[75] N. P. Guerra, P. Fajardo, C. Fuciños, I. R. Amado, E. Alonso, A. Torrado, and
L. Pastrana. Modelling the biphasic growth and product formation by enterococ-
cus faecium cect 410 in realkalized fed-batch fermentations in whey. Journal of
Biomedicine and Biotechnology, 2010, 2010.

158 Bibliography
[76] L. G. Guerrero-RamÃ-rez, S. M. Nuño-Donlucas, L. C. Cesteros, and I. Katime.
Smart copolymeric nanohydrogels: Synthesis, characterization and properties.
Materials Chemistry and Physics, 112(3):1088–1092, 2008. Cited By (since 1996):
8.
[77] A. Gutowska, You Han Bae, H. Jacobs, F. Mohammad, D. Mix, J. Feijen, and
Sung Wan Kim. Heparin release from thermosensitive polymer coatings: In vivo
studies. Journal of Biomedical Materials Research, 29(7):811–821, 1995.
[78] M. Hamidi, A. Azadi, and P. Rafiei. Hydrogel nanoparticles in drug delivery. Ad-
vanced Drug Delivery Reviews, 60(15):1638–1649, 2008. Cited By (since 1996):
121.
[79] J. Han, M. E. Castell-Perez, and R. G. Moreira. Effect of food characteristics,
storage conditions, and electron beam irradiation on active agent release from
polyamide-coated ldpe films. Journal of Food Science, 73(2):E37–E43, 2008. Cited
By (since 1996): 5.
[80] J. H. Han and J. D. Floros. Simulating diffusion model and determining diffusivity
of potassium sorbate through plastics to develop antimicrobial packaging films.
Journal of Food Processing and Preservation, 22(2):107–122, 1998. Cited By (since
1996): 28.
[81] K. Hanu!ová, M. "t’astná, L. Votavová, K. Klaudisová, J. Dobiá!, M. Voldrich, and
M. Marek. Polymer films releasing nisin and/or natamycin from polyvinyldichlor-
ide lacquer coating: Nisin and natamycin migration, efficiency in cheese pack-
aging. Journal of Food Engineering, 99(4):491–496, 2010.
[82] N. Hierro, B. Esteve-Zarzoso, A. González, A. Mas, and J. M. Guillamón. Real-
time quantitative pcr (qpcr) and reverse transcription-qpcr for detection and enu-
meration of total yeasts in wine. Applied and Environmental Microbiology, 72(11):
7148–7155, 2006.

Bibliography 159
[83] A. S. Hoffman. Applications of thermally reversible polymers and hydrogels in
therapeutics and diagnostics. Journal of Controlled Release, 6(SPEC.NO.):297–
305, 1987. Cited By (since 1996): 412.
[84] S. I Hong and W. S Park. Development of color indicators for kimchi packaging.
Journal of Food Science, 64(2):255–257, 1999. Cited By (since 1996): 9.
[85] S. R. Horner, C. R. Mace, L. J. Rothberg, and B. L. Miller. A proteomic biosensor
for enteropathogenic e. coli. Biosensors and Bioelectronics, 21(8):1659–1663, 2006.
Cited By (since 1996): 18.
[86] K. A. Howard, M. Dong, D. Oupicky, H. S. Bisht, C. Buss, F. Besenbacher, and
J. Kjems. Nanocarrier stimuli-activated gene delivery. Small, 3(1):54–57, 2007.
[87] X. Huang and T. L. Lowe. Biodegradable thermoresponsive hydrogels for aqueous
encapsulation and controlled release of hydrophilic model drugs. Biomacromolec-
ules, 6(4):2131–2139, 2005.
[88] M. M. Husein and N. N. Nassar. Nanoparticle preparation using the single mi-
croemulsions scheme. Current Nanoscience, 4(4):370–380, 2008. Cited By (since
1996): 19.
[89] F. Ilmain, T. Tanaka, and E. Kokufuta. Volume transition in a gel driven by hydro-
gen bonding. Nature, 349(6308):400–401, 1991.
[90] H. Inomata, K. Nagahama, and S. Saito. Measurement and correlation of the
swelling pressure of n-isopropylacrylamide gel. Macromolecules®, 27(22):6459–
6464, 1994.
[91] Plexus Institute. New nanotechnology food research-if it glows don’t eat it, 2006.
[92] R. Jedermann, C. Behrens, D. Westphal, and W. Lang. Applying autonomous
sensor systems in logistics-combining sensor networks, rfids and software agents.
Sensors and Actuators, A: Physical, 132(1 SPEC. ISS.):370–375, 2006. Cited By
(since 1996): 56.
[93] R. D. Joerger. Antimicrobial films for food applications: A quantitative analysis of
their effectiveness. Packaging Technology and Science, 20(4):231–273, 2007. Cited

160 Bibliography
By (since 1996): 53.
[94] N. Jones, B. Ray, K. T. Ranjit, and A. C. Manna. Antibacterial activity of zno nano-
particle suspensions on a broad spectrum of microorganisms. FEMS microbiology
letters, 279(1):71–76, 2008. Cited By (since 1996): 116.
[95] K. Kailasapathy and S. Rybka. L. acidophilus and bifidobacterium spp. - their
therapeutic potential and survival in yogurt. Australian Journal of Dairy Techno-
logy, 52(1):28–35, 1997. Cited By (since 1996): 126.
[96] I. Katime, R. Novoa, E. D. De Apodaca, and E. Rodríguez. Release of theophylline
and aminophylline from acrylic acid/n-alkyl methacrylate hydrogels. Journal of
Polymer Science, Part A: Polymer Chemistry, 42(11):2756–2765, 2004.
[97] I.A. Katime, O. Katime, and D. Katime. Materiales inteligentes: Hidrogeles mac-
romoleculares. algunas aplicaciones biomédicas. Anales de la Real Sociedad Es-
pañola de Química, (4):35–50, 2005.
[98] S. Y. Kim, S. Lim, and S. Gunasekaran. Protein interactions in reduced-fat and
full-fat cheddar cheeses during melting. LWT - Food Science and Technology, 44
(2):582–587, 2011.
[99] J. L. Koontz, J. E. Marcy, W. E. Barbeau, and S. E. Duncan. Stability of nata-
mycin and its cyclodextrin inclusion complexes in aqueous solution. Journal of
Agricultural and Food Chemistry, 51(24):7111–7114, 2003.
[100] C. Kriegel, K. M. Kit, D. J. McClements, and J. Weiss. Influence of surfactant
type and concentration on electrospinning of chitosan-poly(ethylene oxide) blend
nanofibers. Food Biophysics, 4(3):213–228, 2009. Cited By (since 1996): 15.
[101] M. Kurisawa, M. Yokoyama, and T. Okano. Gene expression control by temperat-
ure with thermo-responsive polymeric gene carriers. Journal of Controlled Release,
69(1):127–137, 2000.
[102] B. Kuswandi, Y. Wicaksono, Jayus, A. Abdullah, L. Y. Heng, and M. Ahmad. Smart
packaging: Sensors for monitoring of food quality and safety. Sensing and Instru-
mentation for Food Quality and Safety, 5(3-4):137–146, 2011.

Bibliography 161
[103] B. D. Lawrence, M. Cronin-Golomb, I. Georgakoudi, D. L. Kaplan, and F. G.
Omenetto. Bioactive silk protein biomaterial systems for optical devices. Biomac-
romolecules, 9(4):1214–1220, 2008. Cited By (since 1996): 49.
[104] C. H. Lee, D. S. An, S. C. Lee, H. J. Park, and D. S. Lee. A coating for use as
an antimicrobial and antioxidative packaging material incorporating nisin and î±-
tocopherol. Journal of Food Engineering, 62(4):323–329, 2004. Cited By (since
1996): 37.
[105] F. V. Leimann, O. H. Gonçalves, R. A. F. Machado, and A. Bolzan. Antimicrobial
activity of microencapsulated lemongrass essential oil and the effect of experi-
mental parameters on microcapsules size and morphology. Materials Science and
Engineering C, 29(2):430–436, 2009. Cited By (since 1996): 10.
[106] Y. Li and T. Tanaka. Phase transitions of gels. Annual Review of Materials Science,
22(1):243–277, 1992.
[107] Y. Li, Y. T. H. Cu, and D. Luo. Multiplexed detection of pathogen dna with dna-
based fluorescence nanobarcodes. Nature biotechnology, 23(7):885–889, 2005.
Cited By (since 1996): 99.
[108] L. T Lim, I. J. Britt, and M. A. Tung. Sorption and permeation of allyl isothiocy-
anate vapor in nylon 6,6 film as affected by relative humidity. Journal of Plastic
Film and Sheeting, 14(3):207–225, 1998. Cited By (since 1996): 5.
[109] C. L Lin, W. Y Chiu, and C. F Lee. Preparation, morphology, and thermoresponsive
properties of poly(n-isopropylacrylamide)-based copolymer microgels. Journal of
Polymer Science, Part A: Polymer Chemistry, 44(1):356–370, 2006.
[110] C. L Lin, W. Y Chiu, and C. F Lee. Preparation, morphology, and thermoresponsive
properties of poly(n-isopropylacrylamide)-based copolymer microgels. Journal of
Polymer Science, Part A: Polymer Chemistry, 44(1):356–370, 2006. Cited By (since
1996): 15.
[111] C. López, A. Torrado, P. Fuciños, N. P. Guerra, and L. Pastrana. Enzymatic hy-
drolysis of chestnut purée: Process optimization using mixtures of $ ! amylase

162 Bibliography
and glucoamylase. Journal of Agricultural and Food Chemistry, 52(10):2907–2914,
2004.
[112] Douglas B. MacDougall. Colour measurement of food, pages 33–63. Colour in
food. Woodhead Publishing Limited and CRC Press LLC, Boca Raton, FL, USA and
Cambridge, England, 2002.
[113] V. B. V. MacIel, C. M. P. Yoshida, and T. T. Franco. Development of a prototype of
a colourimetric temperature indicator for monitoring food quality. Journal of Food
Engineering, 111(1):21–27, 2012.
[114] H. MacKová and D. Horák. Effects of the reaction parameters on the properties
of thermosensitive poly(n-isopropylacrylamide) microspheres prepared by precip-
itation and dispersion polymerization. Journal of Polymer Science, Part A: Polymer
Chemistry, 44(2):968–982, 2006.
[115] N. M. Manalili, M. A. Dorado, and R. van Otterdijk. Appropiate food packaging
solutions for developing countries. In Save Food! Interpack2011, pages 1–28. FAO,
2011.
[116] B. Marcos, T. Aymerich, J. M. Monfort, and M. Garriga. High-pressure processing
and antimicrobial biodegradable packaging to control listeria monocytogenes dur-
ing storage of cooked ham. Food Microbiology, 25(1):177–182, 2008. Cited By
(since 1996): 20.
[117] J. T. Martins, M. A. Cerqueira, B. W. S. Souza, M. D. O. Carmo Avides, and A. A.
Vicente. Shelf life extension of ricotta cheese using coatings of galactomannans
from nonconventional sources incorporating nisin against listeria monocytogenes.
Journal of Agricultural and Food Chemistry, 58(3):1884–1891, 2010. Cited By
(since 1996): 10.
[118] M. Blanco Massani, M. R. Fernandez, A. Ariosti, P. Eisenberg, and G. Vignolo.
Development and characterization of an active polyethylene film containing lacto-
bacillus curvatus crl705 bacteriocins. Food Additives and Contaminants - Part A
Chemistry, Analysis, Control, Exposure and Risk Assessment, 25(11):1424–1430,

Bibliography 163
2008. Cited By (since 1996): 4.
[119] T. Mattila, J. Tawast, and R. Ahvenainen. New possibilities for quality con-
trol of aseptic packages: Microbiological spoilage and seal defect detection using
headspace indicators. Lebensmittel Wissenschaft und Technologie, 23(3):246–251,
1990.
[120] G. Mauriello, D. Ercolini, A. La Storia, A. Casaburi, and F. Villani. Development of
polythene films for food packaging activated with an antilisterial bacteriocin from
lactobacillus curvatus 32y. Journal of applied microbiology, 97(2):314–322, 2004.
Cited By (since 1996): 43.
[121] G. Mauriello, E. De Luca, A. La Storia, F. Villani, and D. Ercolini. Antimicrobial
activity of a nisin-activated plastic film for food packaging. Letters in applied mi-
crobiology, 41(6):464–469, 2005. Cited By (since 1996): 38.
[122] Á. Medina, M. Jiménez, R. Mateo, and N. Magan. Efficacy of natamycin for control
of growth and ochratoxin a production by aspergillus carbonarius strains under
different environmental conditions. Journal of applied microbiology, 103(6):2234–
2239, 2007.
[123] N. Milainovic, N. Milosavljevic, J. Filipovic, Z. Kneevic-Jugovic, and M. K. Kruic.
Synthesis, characterization and application of poly(n-isopropylacrylamide- co-
itaconic acid) hydrogels as supports for lipase immobilization. Reactive and Func-
tional Polymers, 70(10):807–814, 2010.
[124] N. Mila!inovic, M. Kalagasidis Kru!ic, Z. Kne#evic-Jugovic, and J. Filipovic. Hy-
drogels of n-isopropylacrylamide copolymers with controlled release of a model
protein. International journal of pharmaceutics, 383(1-2):53–61, 2010.
[125] S. Min, T. R. Rumsey, and J. M. Krochta. Diffusion of the antimicrobial lysozyme
from a whey protein coating on smoked salmon. Journal of Food Engineering, 84
(1):39–47, 2008. Cited By (since 1996): 7.
[126] M. A. Murado, Ma P. GonzÃ!’lez, and J. A. VÃ!’zquez. Dose-response relationships:
An overview, a generative model and its application to the verification of descriptive

164 Bibliography
models. Enzyme and microbial technology, 31(4):439–455, 2002.
[127] A. A. Naddaf, I. Tsibranska, and H. J Bart. Kinetics of bsa release from poly(n-
isopropylacrylamide) hydrogels. Chemical Engineering and Processing: Process In-
tensification, 49(6):581–588, 2010. Cited By (since 1996): 5.
[128] N. Nakamura and Y. Amao. An optical sensor for co2 using thymol blue and
europium(iii) complex composite film. Sensors and Actuators, B: Chemical, 92(1-
2):98–101, 2003. Cited By (since 1996): 16.
[129] J. M Nam, C. S. Thaxton, and C. A. Mirkin. Nanoparticle-based bio-bar codes
for the ultrasensitive detection of proteins. Science, 301(5641):1884–1886, 2003.
Cited By (since 1996): 1131.
[130] CTC Nanotechnology. Weitec bio cleaner, 2009.
[131] S. Neethirajan and D. S. Jayas. Nanotechnology for the food and bioprocessing
industries. Food and Bioprocess Technology, 4(1):39–47, 2011.
[132] A. Martà nez Abad, J. M. Lagaron, and M. J. Ocio. Development and characteriza-
tion of silver-based antimicrobial ethylene-vinyl alcohol copolymer (evoh) films for
food-packaging applications. Journal of Agricultural and Food Chemistry, 60(21):
5350–5359, 2012.
[133] M. A. Del Nobile, A. Conte, A. L. Incoronato, and O. Panza. Antimicrobial efficacy
and release kinetics of thymol from zein films. Journal of Food Engineering, 89(1):
57–63, 2008. Cited By (since 1996): 19.
[134] M. Alessandro Del Nobile, D. Gammariello, S. Di Giulio, and A. Conte. Active
coating to prolong the shelf life of fior di latte cheese. Journal of Dairy Research,
77(1):50–55, 2010.
[135] A. Nopwinyuwong, S. Trevanich, and P. Suppakul. Development of a novel color-
imetric indicator label for monitoring freshness of intermediate-moisture dessert
spoilage. Talanta, 81(3):1126–1132, 2010. Cited By (since 1996): 6.
[136] T. M. De Oliveira, N. De Fátima Ferreira Soares, R. M. Pereira, and K. De Freitas
Fraga. Development and evaluation of antimicrobial natamycin-incorporated film

Bibliography 165
in gorgonzola cheese conservation. Packaging Technology and Science, 20(2):147–
153, 2007.
[137] K. O’Riordan, D. Andrews, K. Buckle, and P. Conway. Evaluation of microencapsu-
lation of a bifidobacterium strain with starch as an approach to prolonging viability
during storage. Journal of applied microbiology, 91(6):1059–1066, 2001. Cited By
(since 1996): 62.
[138] K. Otake, H. Inomata, M. Konno, and S. Saito. Thermal analysis of the volume
phase transition with n-isopropylacrylamide gels. Macromolecules, 23(1):283–289,
1990.
[139] B. Ouattara, R. E. Simard, G. Piette, A. Bégin, and R. A. Holley. Diffusion
of acetic and propionic acids from chitosan-based antimicrobial packaging films.
Journal of Food Science, 65(5):768–773, 2000. Cited By (since 1996): 78.
[140] M. Oussalah, S. Caillet, S. Salmiéri, L. Saucier, and M. Lacroix. Antimicrobial
and antioxidant effects of milk protein-based film containing essential oils for the
preservation of whole beef muscle. Journal of Agricultural and Food Chemistry, 52
(18):5598–5605, 2004. Cited By (since 1996): 72.
[141] A. Pacquit, K. T. Lau, H. McLaughlin, J. Frisby, B. Quilty, and D. Diamond. De-
velopment of a volatile amine sensor for the monitoring of fish spoilage. Talanta,
69(2 SPEC. ISS.):515–520, 2006. Cited By (since 1996): 40.
[142] A. Pacquit, J. Frisby, D. Diamond, K. T. Lau, A. Farrell, B. Quilty, and D. Dia-
mond. Development of a smart packaging for the monitoring of fish spoilage. Food
Chemistry, 102(2):466–470, 2007. Cited By (since 1996): 30.
[143] V. Parry. Food fight on the tiny scale, October/21 2006.
[144] J. C. Pedersen. Natamycin as a fungicide in agar media. Applied and Environmental
Microbiology, 58(3):1064–1066, 1992.
[145] N. A. Peppas. Physiologically responsive hydrogels. Journal of Bioactive and Com-
patible Polymers, 6(3):241–246, 1991. Cited By (since 1996): 80.

166 Bibliography
[146] N.A. Peppas. Hydrogels in Medicine and Pharmacy, volume 1-3. CRC Press Inc.,
Boca Raton, FL, 1986/1987.
[147] R. Pérez-Masiá, A. López-Rubio, and J. M. Lagarónn. Development of zein-based
heat-management structures for smart food packaging. Food Hydrocolloids, 30(1):
182–191, 2012. Article in Press.
[148] C. M. B. S. Pintado, M. A. S. S. Ferreira, and I. Sousa. Properties of whey protein-
based films containing organic acids and nisin to control listeria monocytogenes.
Journal of food protection, 72(9):1891–1896, 2009.
[149] A. C. Dos Santos Pires, N. De Fátima Ferreira Soares, N. J. De Andrade, L. H.
M. Da Silva, G. P. Camilloto, and P. C. Bernardes. Development and evaluation
of active packaging for sliced mozzarella preservation. Packaging Technology and
Science, 21(7):375–383, 2008. Cited By (since 1996): 10.
[150] Y. Pranoto, S. K. Rakshit, and V. M. Salokhe. Enhancing antimicrobial activity of
chitosan films by incorporating garlic oil, potassium sorbate and nisin. LWT - Food
Science and Technology, 38(8):859–865, 2005. Cited By (since 1996): 90.
[151] P. Puligundla, J. Jung, and S. Ko. Carbon dioxide sensors for intelligent food
packaging applications. Food Control, 25(1):328–333, 2012.
[152] P. L. Ritger and N. A. Peppas. A simple equation for description of solute release
ii. fickian and anomalous release from swellable devices. Journal of Controlled
Release, 5(1):37–42, 1987.
[153] D. P. T. Roberts, M. J. Scotter, M. Godula, M. Dickinson, and A. J. Charlton.
Development and validation of a rapid method for the determination of natamycin
in wine by high-performance liquid chromatography coupled to high resolution
mass spectrometry. Analytical Methods, 3(4):937–943, 2011.
[154] A. RodrÃ-guez, C. NerÃ-n, and R. Batlle. New cinnamon-based active paper pack-
aging against rhizopusstolonifer food spoilage. Journal of Agricultural and Food
Chemistry, 56(15):6364–6369, 2008. Cited By (since 1996): 22.

Bibliography 167
[155] P. Rodriguez-Alonso, J. A. Centeno, and J. I. Garabal. Biochemical study of in-
dustrially produced arzãºa-ulloa semi-soft cows’ milk cheese: Effects of storage
under vacuum and modified atmospheres with high-nitrogen contents. Interna-
tional Dairy Journal, 21(4):261–271, 2011.
[156] M. A. Rojas-GraÃÂŒ, R. J. Avena-Bustillos, M. Friedman, P. R. Henika, O. MartÃ
n Belloso, and T. H. Mchugh. Mechanical, barrier, and antimicrobial properties of
apple puree edible films containing plant essential oils. Journal of Agricultural and
Food Chemistry, 54(24):9262–9267, 2006. Cited By (since 1996): 45.
[157] S. Romani, G. Sacchetti, P. Pittia, G. G. Pinnavaia, and M. Dalla Rosa. Physical,
chemical, textural and sensorial changes of portioned parmigiano reggiano cheese
packed under different conditions. Food Science and Technology International, 8
(4):203–211, 2002.
[158] C. Ruengruglikit, H. Kim, R. D. Miller, and Q. Huang. Fabrication of nanopor-
ous oligonucleotide microarrays for pathogen detection and identification. Polymer
Preprints, 45:526, 2004.
[159] S. Sankaran and S. Panigrahi. Nanoparticulate zinc oxide chemoresistive sensor
for volatile acetic acid detection. Nanoscience and Nanotechnology Letters, 3(6):
755–762, 2011.
[160] P. Santiago-Silva, N. F. F. Soares, J. E. Nóbrega, M. A. W. Júnior, K. B. F. Barbosa,
A. C. P. Volp, E. R. M. A. Zerdas, and N. J. Würlitzer. Antimicrobial efficiency of
film incorporated with pediocin (alta â® 2351) on preservation of sliced ham. Food
Control, 20(1):85–89, 2009. Cited By (since 1996): 16.
[161] B. R. Saunders, H. M. Crowther, and B. Vincent. Poly[(methyl methacrylate)-co-
(methacrylic acid)] microgel particles: Swelling control using ph, cononsolvency,
and osmotic deswelling. Macromolecules, 30(3):482–487, 1997.
[162] R. Saurel, A. Pajonk, and J. Andrieu. Modelling of french emmental cheese water
activity during salting and ripening periods. Journal of Food Engineering, 63(2):
163–170, 2004.

168 Bibliography
[163] A. G. M. Scannell, C. Hill, R. P. Ross, S. Marx, W. Hartmeier, and E. K. Arendt.
Development of bioactive food packaging materials using immobilised bacteriocins
lacticin 3147 and nisaplin(â®). International journal of food microbiology, 60(2-3):
241–249, 2000. Cited By (since 1996): 74.
[164] H. G. Schild. Poly (n-isopropylacrylamide): Experiment, theory and application.
Progress in Polymer Science (Oxford), 17(2):163–249, 1992.
[165] B. S. Sekhon. Food nanotechnology - an overview. Nanotechnology, Science and
Applications, 3:1–15, 2010.
[166] J. D. Seldman. Time-temperature indicators, pages 74–107. Active food packaging.
Chapman and Hall, New York, 1995.
[167] E. Semo, E. Kesselman, D. Danino, and Y. D. Livney. Casein micelle as a natural
nano-capsular vehicle for nutraceuticals. Food Hydrocolloids, 21(5-6):936–942,
2007. Cited By (since 1996): 51.
[168] K. H Seol, D. G Lim, A. Jang, C. Jo, and M. Lee. Antimicrobial effect of îº-
carrageenan-based edible film containing ovotransferrin in fresh chicken breast
stored at 5 â &c. Meat Science, 83(3):479–483, 2009. Cited By (since 1996): 8.
[169] A. Serres, M. BaudyÅ!’, and S. W. Kim. Temperature and ph-sensitive polymers for
human calcitonin delivery. Pharmaceutical research, 13(2):196–201, 1996. Cited
By (since 1996): 89.
[170] A. C. Seydim and G. Sarikus. Antimicrobial activity of whey protein based edible
films incorporated with oregano, rosemary and garlic essential oils. Food Research
International, 39(5):639–644, 2006. Cited By (since 1996): 101.
[171] A. Shefer. The application of nanotechnology in the food industry.
[172] Y. Shin, J. H. Chang, J. Liu, R. Williford, Y. K Shin, and G. J. Exarhos. Hybrid
nanogels for sustainable positive thermosensitive drug release. Journal of Con-
trolled Release, 73(1):1–6, 2001.
[173] R.L. Shirk and W. L. Clark. The effect of pimaricin in retarding the spoilage of fresh
orange juice. Food Technol., 17:108–112, 1963.

Bibliography 169
[174] R. A. Siegel and B. A. Firestone. ph-dependent equilibrium swelling properties of
hydrophobic polyelectrolyte copolymer gels. Macromolecules, 21(11):3254–3259,
1988. Cited By (since 1996): 371.
[175] R. A. Siegel, M. Falamarzian, B. A. Firestone, and B. C. Moxley. ph-controlled re-
lease from hydrophobic/polyelectrolyte copolymer hydrogels. Journal of Controlled
Release, 8(2):179–182, 1988. Cited By (since 1996): 133.
[176] T. Sivarooban, N. S. Hettiarachchy, and M. G. Johnson. Physical and antimicrobial
properties of grape seed extract, nisin, and edta incorporated soy protein edible
films. Food Research International, 41(8):781–785, 2008. Cited By (since 1996):
43.
[177] M. Smolander, E. Hurme, and R. Ahvenainen. Leak indicators for modified-
atmosphere packages. Trends in Food Science and Technology, 8(4):101–106,
1997. Cited By (since 1996): 34.
[178] M. Smolander, E. Hurme, R. Ahvenainen, and M. Siika-aho. Indicators for modified
atmosphere packages. In 24th IAPRI Symposium 22-24 June, Rochester, New York,
USA, 1998.
[179] M. Smolander, E. Hurme, K. Latva-Kala, T. Luoma, H. L Alakomi, and
R. Ahvenainen. Myoglobin-based indicators for the evaluation of freshness of un-
marinated broiler cuts. Innovative Food Science and Emerging Technologies, 3(3):
279–288, 2002. Cited By (since 1996): 9.
[180] solutions.3m.com. (avalilable 7/8/2012).
[181] I. Sondi and B. Salopek-Sondi. Silver nanoparticles as antimicrobial agent: a case
study on e. coli as a model for gram-negative bacteria. Journal of Colloid and
Interface Science, 275:177–182, 2004.
[182] C. F. Volken De Souza, T. Dalla Rosa, and M. A. Zachia Ayub. Changes in the mi-
crobiological and physicochemical characteristics of serrano cheese during manu-
facture and ripening. Brazilian Journal of Microbiology, 34(3):260–266, 2003.

170 Bibliography
[183] J. Stark and H. S. Tan. Natamycin, chapter 9. Food preservatives. Kluwer Aca-
demic/Plenum Publishers, USA, 2 edition, 2003.
[184] M. D. Steven and J. H. Hotchkiss. Covalent immobilization of an antimicrobial
peptide on poly(ethylene) film. Journal of Applied Polymer Science, 110(5):2665–
2670, 2008. Cited By (since 1996): 5.
[185] R. A. Stile, W. R. Burghardt, and K. E. Healy. Synthesis and characterization of
injectable poly(n-isopropylacrylamide)-based hydrogels that support tissue forma-
tion in vitro. Macromolecules, 32(22):7370–7379, 1999.
[186] F. J. Stutzenberger, R. A. Latour, Y. Sun, and T. Tzeng. Adhesin-specific nano-
particles and process for using same, 2007.
[187] C. Teijón, S. Guerrero, R. Olmo, J. M. Teijón, and M. D. Blanco. Swelling properties
of copolymeric hydrogels of poly(ethylene glycol) monomethacrylate and monoes-
ters of itaconic acid for use in drug delivery. Journal of Biomedical Materials Re-
search - Part B Applied Biomaterials, 91(2):716–726, 2009.
[188] S. Theivendran, N. S. Hettiarachchy, and M. G. Johnson. Inhibition of listeria
monocytogens by nisin combined with grape seed extract or green tea extract in
soy protein film coated on turkey frankfurters. Journal of Food Science, 71(2):
M39–M44, 2006. Cited By (since 1996): 26.
[189] H. Tokuyama and Y. Kato. Preparation of poly(n-isopropylacrylamide) emulsion
gels and their drug release behaviors. Colloids and Surfaces B: Biointerfaces, 67
(1):92–98, 2008.
[190] H. Türe, E. Eroglu, F. Soyer, and B. Özen. Antifungal activity of biopolymers con-
taining natamycin and rosemary extract against aspergillus niger and penicillium
roquefortii. International Journal of Food Science and Technology, 43(11):2026–
2032, 2008.
[191] H. Türe, E. Eroglu, B. Özen, and F. Soyer. Physical properties of biopolymers
containing natamycin and rosemary extract. International Journal of Food Science
and Technology, 44(2):402–408, 2009.

Bibliography 171
[192] H. Ture, E. Eroglu, B. Ozen, and F. Soyer. Effect of biopolymers containing nata-
mycin against aspergillus niger and penicillium roquefortii on fresh kashar cheese.
International Journal of Food Science and Technology, 46(1):154–160, 2011.
[193] S. K. Vakkalanka, C. S. Brazel, and N. A. Peppas. Temperature- and ph-sensitive
terpolymers for modulated delivery of streptokinase. Journal of Biomaterials Sci-
ence, Polymer Edition, 8(2):119–129, 1996. Cited By (since 1996): 75.
[194] J. Vartiainen, E. Skytta, J. Enqvist, and R. Ahvenainen. Properties of antimicro-
bial plastics containing traditional food preservatives. Packaging Technology and
Science, 16(6):223–229, 2003. Cited By (since 1996): 16.
[195] J. A. Vázquez and M. A. Murado. Mathematical tools for objective comparison of
microbial cultures. application to evaluation of 15 peptones for lactic acid bacteria
productions. Biochemical engineering journal, 39(2):276–287, 2008.
[196] J. A. Vázquez, S. F. Docasal, M. A. Prieto, Ma P. González, and M. A. Murado.
Growth and metabolic features of lactic acid bacteria in media with hydrolysed fish
viscera. an approach to bio-silage of fishing by-products. Bioresource technology,
99(14):6246–6257, 2008.
[197] L. Vermeiren, F. Devlieghere, M. Van Beest, N. De Kruijf, and J. Debevere. Devel-
opments in the active packaging of foods. Trends in Food Science and Technology,
10(3):77–86, 1999. Cited By (since 1996): 126.
[198] L. Vermeiren, F. Devlieghere, and J. Debevere. Effectiveness of some recent anti-
microbial packaging concepts. Food additives and contaminants, 19(SUPPL.):163–
171, 2002. Cited By (since 1996): 57.
[199] D. E. Wachenheim, J. A. Patterson, and M. R. Ladisch. Analysis of the logistic
function model: Derivation and applications specific to batch cultured microor-
ganisms. Bioresource technology, 86(2):157–164, 2003.
[200] D. F. H. Wallach and A. Novikov. Methods and devices for detecting spoilage in
food products, 1998.

172 Bibliography
[201] F. Wang, J. Yao, M. Russel, H. Chen, K. Chen, Y. Zhou, B. Ceccanti, G. Zaray, and
M. M. F. Choi. Development and analytical application of a glucose biosensor based
on glucose oxidase/o-(2-hydroxyl)propyl-3-trimethylammonium chitosan chloride
nanoparticle-immobilized onion inner epidermis. Biosensors and Bioelectronics, 25
(10):2238–2243, 2010. Cited By (since 1996): 5.
[202] C. Wanihsuksombat, V. Hongtrakul, and P. Suppakul. Development and char-
acterization of a prototype of a lactic acid-based time-temperature indicator for
monitoring food product quality. Journal of Food Engineering, 100(3):427–434,
2010. Cited By (since 1996): 4.
[203] J. Weiss, P. Takhistov, and D. J. McClements. Functional materials in food nano-
technology. Journal of Food Science, 71(9), 2006.
[204] Y. M. Te Welscher, H. H. Ten Napel, M. M. Balagué, C. M. Souza, H. Riezman, B. De
Kruijff, and E. Breukink. Natamycin blocks fungal growth by binding specifically to
ergosterol without permeabilizing the membrane. Journal of Biological Chemistry,
283(10):6393–6401, 2008.
[205] Y. M. Te Welscher, L. Jones, M. R. Van Leeuwen, J. Dijksterhuis, B. De Kruijff,
G. Eitzen, and E. Breukink. Natamycin inhibits vacuole fusion at the priming
phase via a specific interaction with ergosterol. Antimicrobial Agents and Chemo-
therapy, 54(6):2618–2625, 2010.
[206] Y. M Weng, M. J Chen, and C. Wenlung. Antimicrobial food packaging materials
from poly(ethylene-co-methacrylic acid). LWT - Food Science and Technology, 32
(4):191–195, 1999. Cited By (since 1996): 21.
[207] Yih-Ming Weng and Joseph H. Hotchkiss. Anhydrides as antimycotic agents added
to polyethylene films for food packaging. Packaging Technology and Science, 6(3):
123–128, 1993. Cited By (since 1996): 47.
[208] J. Y Wu, S. Q Liu, P. W. S Heng, and Y. Y Yang. Evaluating proteins release from,
and their interactions with, thermosensitive poly (n-isopropylacrylamide) hydro-
gels. Journal of Controlled Release, 102(2):361–372, 2005.

Bibliography 173
[209] www.azonano.com. Nanotechnology and food packaging.
[210] www.fresh check.com. (available 26/8/2012).
[211] www.meatandpoultryonline.com/doc.mvc/FreshTag 0001. (available 26/8/2012).
[212] www.mgc.co.jp/eng/products/abc/ageless/eye.html. (available 26/8/2012).
[213] www.ripesense.com. (available 26/8/2012).
[214] www.tetrapak.com. (available 7/8/2012).
[215] www.timestrip.com. (available 7/8/2012).
[216] www.vitsab.com. (available 7/8/2012).
[217] W. Xue, S. Champ, and M. B. Huglin. Network and swelling parameters of chem-
ically crosslinked thermoreversible hydrogels. Polymer, 42(8):3665–3669, 2001.
[218] S. Yan, C. Huawei, Z. Limin, R. Fazheng, Z. Luda, and Z. Hengtao. Development
and characterization of a new amylase type time-temperature indicator. Food Con-
trol, 19(3):315–319, 2008. Cited By (since 1996): 15.
[219] M. Yildirim, F. Güleç, M. Bayram, and Z. Yildirim. Properties of kashar cheese
coated with casein as a carrier of natamycin. Italian Journal of Food Science, 18
(2):127–138, 2006.
[220] M. K. Yoo, Y. K. Sung, Y. M. Lee, and C. S. Cho. Effect of polyelectrolyte on the lower
critical solution temperature of poly(n-isopropyl acrylamide) in the poly(nipaam-
co-acrylic acid) hydrogel. Polymer, 41(15):5713–5719, 2000.
[221] H. Zhang, R. Elghanian, L. Demers, N. Amro, S. Disawal, and S. Cruchon-
Dupeyrat. Direct-write nanolithography method of transporting ink with an elast-
omeric polymer coated nanoscopic tip to form a structure having internal hollows
on a substrate, 2009.
[222] X. Z Zhang, R. X Zhuo, J. Z Cui, and J. T Zhang. A novel thermo-responsive drug
delivery system with positive controlled release. International journal of pharma-
ceutics, 235(1-2):43–50, 2002.

174 Bibliography
[223] R. Zhao, P. Torley, and P. J. Halley. Emerging biodegradable materials: Starch-
and protein-based bio-nanocomposites. Journal of Materials Science, 43(9):3058–
3071, 2008. Cited By (since 1996): 31.
[224] X. Zhao, L. R. Hilliard, S. J. Mechery, Y. Wang, R. P. Bagwe, S. Jin, and W. Tan.
A rapid bioassay for single bacterial cell quantitation using bioconjugated nano-
particles. Proceedings of the National Academy of Sciences of the United States of
America, 101(42):15027–15032, 2004. Cited By (since 1996): 229.
[225] P. W. Zhu and D. H. Napper. Coil-to-globule type transitions and swelling of poly(n-
isopropylacrylamide) and poly(acrylamide) at latex interfaces in alcohol-water mix-
tures. Journal of colloid and interface science, 177(2):343–352, 1996.
[226] R. X Zhuo and W. Li. Preparation and characterization of macroporous poly(n-
isopropylacrylamide) hydrogels for the controlled release of proteins. Journal of
Polymer Science, Part A: Polymer Chemistry, 41(1):152–159, 2002. Cited By (since
1996): 25.
[227] M. H. Zwietering, I. Jongenburger, F. M. Rombouts, and K. Van’t Riet. Modeling of
the bacterial growth curve. Applied and Environmental Microbiology, 56(6):1875–
1881, 1990. Cited By (since 1996): 709.

ANEXO
C. Fuciños, N. P. Guerra, J. M. Teijón, L. M. Pastrana, M. L. Rúa, and I. Katime. Use
of poly(N-isopropylacrylamide) nanohydrogels for the controlled release of pimaricin in
active packaging. Journal of Food Science. 77(7):N21-N28, 2012.
175

176 ANEXO
N:Na
nosc
aleFo
odSc
ience
Use of Poly(N-isopropylacrylamide)Nanohydrogels for the Controlled Releaseof Pimaricin in Active PackagingC. Fucinos, N.P. Guerra, J.M. Teijon, L.M. Pastrana, M.L. Rua, and I. Katime
Abstract: We propose here a delivery drug-polymer system using poly(N-isopropylacrylamide) (PNIPA) nanohydrogelsthat enables pimaricin to be protected from hostile environments and allows the controlled release of the antifungalthrough environmental stimuli. We synthesized 2 nanohydrogels, 1 with 100% N-isopropylacrylamide (PNIPA(5)) and1 with 80% N-isopropylacrylamide copolymerized and 20% acrylic acid (PNIPA-20AA(5)). Both were then, loadedwith a pimaricin aqueous solution. The pimaricin release profiles of these 2 nanohydrogels were considerably different:PNIPA(5) released 10% and PNIPA-20AA(5) released 30% with respect to the free pimaricin release. Moreover, thediffusion experiments showed that pimaricin was released from the PNIPA-20AA(5) nanohydrogel for up to 3 timeslonger than free pimaricin. Therefore, incorporating acrylic acid as comonomer into the PNIPA nanohydrogel resulted ina slower but more continuous release of pimaricin. The highest pimaricin levels were reached when the most hydrophilicnanohydrogel was used. The bioassay results showed that the pimaricin-nanohydrogel system was highly effective ininhibiting the growth of the indicator strain in conditions of thermal abuse. The spoilage in acidified samples storedunder fluorescent lighting was reduced by 80.94% ± 33.02% in samples treated with a pimaricin-loaded nanohydrogel,but only by 19.91% ± 6.68% in samples treated with free pimaricin. Therefore, 2 conclusions emerge from this study.One is that the nanohydrogel delivery system could impede the degradation of pimaricin. The other is that the inhibitoryeffect of the antifungal on yeast growth is more pronounced when it is added included into the nanohydrogel to the food,especially in an acidic environment.
Keywords: active packaging, controlled release, nanohydrogel, pimaricin, poly(N-isopropylacrylamide)
Practical Application: This article presents relevant results on the use of nanohydrogels in food packaging. Nanohydrogelscould provide protection so that the pimaricin remains active for a longer time. They also allow the controlled release ofpimaricin, which thus regulates the unnecessary presence of the antifungal in the food.
IntroductionIn recent years, the interest in antimicrobials for extending the
shelf life of food products has focused on using natural substancessuch as essential oils (allyl isotiocyanate), bacteriocins (nisin), andpimaricin. Pimaricin (natamycin) is a polyene antifungal producedby Streptomyces natalensis and related species. As it has low toxicityand prevents the growth of mould and yeast, pimaricin is veryuseful in the food industry as a preservative on the surface ofcheese, fruit, and other nonsterile products, such as meat andsausages (Farid and others 2000; Vanden Bossche and others 2003).
There are 2 technological problems associated with pimaricinas a food preservative. They are its low water solubility and its
MS 20111500 Submitted 12/15/2011, Accepted 03/29/2012. Authors Fucinos,Guerra, Pastrana, and Rua are with Biotechnology Group, Dept. of AnalyticalChemistry and Food Science, Univ. of Vigo, 32004, Ourense, Spain. Author Teijonis with Polymeric Materials Group for the Controlled Release of Bioactive Compoundsin Biomedicine, Dept. of Biochemistry and Molecular Biology, Complutense Univ. ofMadrid, 28040 Madrid, Spain. Author Katime is with Group of New Materials andSupramolecular Spectroscopy, Dept. of Physical Chemistry, Univ. of Paıs Vasco, 48940Leioa, Spain. Direct inquiries to author Fucinos (E-mail: [email protected]).
sensitivity to ultraviolet light (Koontz and others 2003; Stark andTan 2003). In addition, when there is continuous contact betweenpreservatives and microorganisms, microbial resistance can developand so the preservative becomes ineffective. This occurs frequentlywhen antimicrobials are added directly to the food product. Activepackaging can reduce, but not eliminate, this effect.
Currently, there is enormous interest in applying nanoscienceto the food industry, particularly for developing new functionalmaterials to improve food safety and quality (Weiss and others2006; Neethirajan and Jayas 2011). Nanoparticles can be used toencapsulate functional ingredients and can perform a number ofdifferent roles, such as protecting the functional ingredient againstdegradation during food processing, storage and usage, carryingit to the site of action, and controlling its release as in activepackaging. In this last application, nanoscale has several advantageswhich are, better dispersion of nanoparticles in the food packagingmaterial and the possibility of controlling the release rate as aresponse to specific environmental conditions (for example, pH,ionic strength, or temperature).
Thermally sensitive and nontoxic poly(N-isopropylacrylamide)(PNIPA) hydrogels are widely used. Some applications includethe controlled release of insulin (Andersson and others 1997) and
C! 2012 Institute of Food Technologists R!
doi: 10.1111/j.1750-3841.2012.02781.x Vol. 77, Nr. 7, 2012 ! Journal of Food Science N21Further reproduction without permission is prohibited

ANEXO 177
N:NanoscaleFoodScience
Nanohydrogels in active packaging . . .
5-fluorouracil (Blanco and others 2008) in pharmaceutical applica-tions as well as antifungals and macromolecules such as benzoatesand bovine serum albumin (Caykara and others 2006). PNIPAhas a hydrophilic/hydrophobic balance in the side chains, andthus hydrogen bonds can form between water molecules and hy-drophilic groups of the hydrogel. These hydrogen bonds act co-operatively to form a stable shell around the hydrophobic groups,which means that the PNIPA hydrogel has good solubility at lowtemperatures. As the temperature increases, these interactions be-come weak and the entrapped water molecules are slowly released.When the hydrogel reaches its lower critical solution temperature(LCST, around 33 !C) or above, these interactions are destroyedand the hydrophobic interactions among the hydrophobic groupsare strengthened dramatically and abruptly, which leads to the col-lapse of the polymer chains and thus the phase transition of thehydrogel network (Zhang and others 2002).
Developing active packages with controlled delivery systems isa promising alternative, particularly if pimaricin is released as aresponse to particular triggers. Several different approaches thatinclude pimaricin in packaging films to avoid mould spoilage havebeen reported, for example, chitosan-based edible films (Fajardoand others 2010), wheat gluten and methyl cellulose biopolymers(Ture and others 2008), and polyethylene films coated with com-mercially available polyvinylchloride (PVC) lacquer (Hanusovaand others 2010). However, thermosensitive hydrogels have neverbeen assayed for this purpose.
Therefore, the aim of this work was to synthesize PNIPAnanohydrogels with different grades of hydrophilicity by addingacrylic acid (AA) as comonomer and evaluating their capacity totransport and release pimaricin under different temperature condi-tions. In addition, the effectiveness of the pimaricin-loaded PNIPAnanodevices in controlling mould spoilage was assayed with a foodmodel system consisting in potato dextrose agar (PDA) plates.In order to assess the protective effect of nanohydrogels, mouldspoilage was evaluated under favorable and unfavorable conditionsfor the chemical stability of pimaricin.
Materials and MethodsThe commercial materials employed in this work are listed in
Table 1.
Synthesis of PNIPA/AA nanohydrogelsThe microemulsion polymerization experiments were pre-
pared using water in oil (W/O) systems. The W/O mi-croemulsion composition was 58% aqueous phase (AP), 17%oil phase (OP), and 25% surfactant (ST). The AP consisted of80% water and 20% monomers. For pure PNIPA nanohydro-gels (PNIPA(5)), the relation (w/w) of N-isopropylacrylamide(NIPA) based on the monomers (mNIPA/mmonomer) was 1. ForNIPA copolymerized with AA (PNIPA-20AA(5)) nanohydrogelsmNIPA/mmonomer was 0.80 and mAA/mmonomer was 0.20. To pre-serve the shape and size of the particles during handling we usedthe cross-linking agent N,N!-methylenebisacrylamide (NMBA)(mNMBA/mmonomer = 0.05). The OP consisted entirely of IsoparTM
M, which was mixed directly with surfactants (ST) AtlasTM G-1086 (mAtlasG"1086/mST = 0.97) and SpanTM 83 (mSpan83/mST =0.03).
The 2 phases were solubilized then mixed in a 100 mLreactor thermostatized at 25 !C, equipped with mechanicalstirring and a thermal sensor. To eliminate oxygen, 10 minbefore the polymerization began (by adding the initiator at a ra-tio mNaHSO3/mmonomer = 0.01) and during the entire reaction, the
reaction medium was purged by bubbling nitrogen through it.The polymerization conversion was monitored via the tempera-ture increase inside the glass reactor. The polymer was purifiedusing selective precipitation with chloroform and diethyl ether.The pure polymer was dried overnight in an oven (50 !C) andthen ground in a colloid mill (IKA
R#-Werke GmbH & Co. KG,
Staufen, Germany).The particle size distribution was analysed with a dynamic
light scattering (DLS) measurement technique using a ZetasizerNano ZS (Malvern Instruments, Worcestershire, U.K.) at 25 !C.Nanohydrogel samples were prepared by dispersing PNIPA pow-der in distilled water (0.5 mg/mL), the samples were agitated for3 h at ambient temperature to allow the nanoparticles to swellproperly. Each analysis was performed in triplicate.
Preparation of pimaricin-loaded PNIPA/AA nanohydrogelsPNIPA/AA nanohydrogel powder was dispersed in distilled
water by agitation for 3 h at ambient temperature to allow thenanoparticles to swell properly. This suspension was then mixedwith a pimaricin water solution to obtain final concentrationsof 12.5 mg of nanohydrogel per mL and 0.4 mg of commercialpimaricin per mL. The mixture was stirred overnight at 25 !C(below the LCST) to guarantee that the pimaricin was incorpo-rated into the nanohydrogel particles. This mixture was used infurther release studies. A nanohydrogel sample without pimaricinwas processed in the same conditions and used as a control. Theexperiments were carried out in duplicate.
Pimaricin release from PNIPA/AA nanohydrogelsFor the release studies, 3 mL of pimaricin-loaded nanohydro-
gel samples, obtained as explained in the previous section, wereplaced in a dialysis bag (the SnakeSkinTM pleated dialysis bag witha molar mass cut-off of 3500 g/mol was obtained from Pierce,Rockford, Ill., U.S.A.) and dialyzed against 12 mL of distilledwater at a constant temperature while agitating constantly. Sam-ples of 1 mL were taken at intervals from the solution in orderto determine the pimaricin concentration. The volume removedfrom the probe was returned after measurements had been made.
Table 1–Commercial materials.
Material Company
N-isopropylacrylamide, stabilized99%
Acros Organics (Geel, Belgium)
Acrylic acid (stabilised withhydroquinone monomethyl ether)for synthesis
Merck (Darmstadt, Germany)
N,N!-methylenebisacrylamide forsynthesis
Merck (Darmstadt, Germany)
Sodium bisulfite for analysis Merck (Darmstadt, Germany)Isoparaffinic synthetic hydrocarbon
(IsoparTM M), 98%Esso Chemie (Cologne, Germany)
Sorbitan sesquiolate (SpanTM 83), 98% Uniquema (Wilmington, Del.,U.S.A.).
PEG-40 Sorbitol Hexaoleate (AtlasTM
G-1086), 98%Uniquema (Wilmington, Del.,
U.S.A.)Chloroform stabilized with ethanol Panreac (Barcelona, Spain)Diethyl ether stabilized with
approximately 6 ppm of BHTPanreac (Barcelona, Spain)
Commercial pimaricin (50% purepimaricin, 50% lactose)
VGP Pharmachem (Barcelona,Spain)
Pure pimaricin from Streptomyceschattanoogensis, $95% (HPLC)
Sigma-Aldrich (Munich, Germany)
Potato dextrose agar (PDA) DifcoTM (Detroit, Mich., U.S.A.)L(+)-tartaric acid PRS Panreac (Barcelona, Spain)
N22 Journal of Food Science ! Vol. 77, Nr. 7, 2012

178 ANEXO
N:Na
nosc
aleFo
odSc
ience
Nanohydrogels in active packaging . . .
A nanohydrogel sample without pimaricin was processed underthe same conditions and used as a control. All experiments werecarried out in duplicate.
In order to determine the time required to reach dialysis equi-librium, a pimaricin solution (3 mL) with the same concentrationloaded into the nanohydrogels (0.4 mg powder per mL) was dia-lyzed against 12 mL of distilled water, as indicated above.
The data were fitted with GraphPad PrismTM 5 (GraphPadSoftware Inc., San Diego, Calif., U.S.A.). The significance of themodel parameters was assessed with Mathematica 7 (Wolfram Re-search, Inc., Champaign, Ill., U.S.A.).
Pimaricin detection and quantificationThe pimaricin concentration in the dialysis media was de-
termined spectrophotometrically at 319 nm (Beckman CoulterInc., Brea, Calif., U.S.A.). Pimaricin has maximum absorptionat 304 nm; however, the suboptimal peak (90% of the maxi-mum) observed at 319 nm showed the highest value for the pi-maricin/dialyzed PNIPA absorbance ratio.
The molar absorption coefficient (!) for pimaricin was ex-trapolated from the linear fit of the absorbance measurements ofpure aqueous pimaricin solutions with known concentrations from0.3 to 30 ppm (within the solubility limit). A value of 0.077 ±0.006 L/µg/cm was obtained.
Measurement of the gel phase transition temperatureThe phase transition was examined by measuring the transmit-
tance of polymer suspensions at 500 nm using a spectrophotome-ter with a Peltier temperature control module (Beckman CoulterInc., Brea, Calif., U.S.A.) at temperature intervals from 15 to50 !C with increments of 2 !C between each measurement.
Inhibition studies employing a food model systemWe designed a food model system consisting of Petri dishes
with 5 mL of PDA agar. In order to simulate favorable (A) andunfavorable (B) conditions for the chemical stability of pimaricin,we considered the following conditions:
A) PDA agar without acidification and plate storage under darkconditions.
B) Acidified PDA agar (pH 3) with 10% l(+)-tartaric acid (w/v)and plate storage under fluorescent lighting.
The antimicrobial effectiveness of the nanohydrogel-pimaricinsystem (NP) was evaluated together with control treatments inwhich the nanohydrogel-pimaricin system was substituted by dis-tilled water (C), the nanohydrogel (N), and free pimaricin (P).The nanohydrogel and pimaricin concentrations and ratios werethe same as those used for the release studies.
An aliquot of 25 µL of a 12 h-culture of Saccharomyces cerevisiae(Sc 1.02) (30 ! 107 UFC/mL) was inoculated in triplicate intothe Petri dishes. After 1 h in the fridge to allow the inoculatedculture to be absorbed properly, 100 µL of each antimicrobialsample (NP, N, C, and P) was spread over the plate surface. Allplates were incubated at 4 !C for 7 d and then at 25 !C until theend of the experiment (15 d).
Statistical treatmentThe results of pimaricin diffusion were analysed with Student’s
t-test (" = 0.05). The antimicrobial effectiveness of the treatmentswas evaluated by analysis of variance (2-way ANOVA) followed
by Bonferroni posttests for multiple comparisons. All the statisticaltests were performed with GraphPad PrismTM 5.
Results and Discussion
Synthesis of PNIPA/AA nanohydrogelsThe mean particle size (r. nm) and polydispersitivity index (PDI)
of the PNIPA(5) and PNIPA-20AA(5) nanohydrogels determinedby DLS at the end of the inverse microemulsion polymerizationwere 79.19 ± 10.06 (PDI = 0.25 ± 0.10) and 114.19 ± 13.80(PDI = 0.29 ± 0.11), respectively.
Pimaricin release from PNIPA/AA nanohydrogelsThe 1st objective of this work was to study the release kinetics of
pimaricin from nanohydrogels. Due to the experimental difficul-ties in separating the nanohydrogel from free pimaricin, we placedthe loaded nanohydrogel in dialysis bags and determined the freepimaricin concentration over time in the dialysis media (distilledwater). Therefore, during the release process, the pimaricin neededto diffuse through 2 release layers: the nanohydrogel matrix andthe dialysis bag (Figure 1).
The membrane of the dialysis bag could become a barrier topimaricin molecules, either because they adhere to the membraneor because they form aggregates (Stark and Tan 2003) that arelarger than the pores of the dialysis bag. Therefore, we studied thediffusion of free pimaricin through the dialysis bag. The resultsobtained (data not shown) indicate that diffusion continued untilequilibrium was reached and that the dialysis bag did not influencethe release of pimaricin. Hence, the free pimaricin transition tothe release media would only be governed by the capacity of themolecule to diffuse at the tested temperature.
However, all of the pimaricin that had been loaded could not bereleased in the dialysis process because the process stopped whenit reached the equilibrium concentration. Thus, the amount ofpimaricin released in the dialysis experiments with free pimaricinwas considered to be the maximum amount of pimaricin releasedfrom the nanohydrogels.
Thus, the relative fraction of pimaricin released (# Ft) was de-fined by the following expression:
# Ft = Ct PNIPA"Pim/Cmax Pim (1)
where Ct PNIPA"Pim is the amount of pimaricin (µg) released fromthe nanohydrogel to the dialysis medium (passing through thedialysis membrane) and Cmax Pim is the amount of pimaricin (µg)under the steady-state conditions determined in the dialysis ex-periments with free pimaricin (without nanohydrogel).
To calculate the maximum relative amount of pimaricin released(# Fmax), experimental data were fitted according to the followingequation, adapted from Lopez and others (2004):
# Ft = # Fmax + (# F0 " # Fmax) ! exp("m ! t ) (2)
where # Fmax and # F0 are the maximum relative amount of pi-maricin and initial relative amount of pimaricin, respectively, re-leased from the nanohydrogels through the dialysis membrane.The parameter m (min"1) is the maximum release rate and t (min)is the sampling time.
Equation 2 is valid in the entire experimental domain, that is,it is able to fit the pimaricin released in a time interval from t0(initial time) to teq (equilibrium dialysis time). Considering that# Fmax = lim # Ft when t tends to infinity, the time needed to
Vol. 77, Nr. 7, 2012 ! Journal of Food Science N23

ANEXO 179
N:NanoscaleFoodScience
Nanohydrogels in active packaging . . .
reach ! Fmax would be infinity. For the sake of practicality, wedecided to calculate teq as the time to reach 99% of ! Fmax.
Pimaricin release from the PNIPA(5) nanohydrogel.The most characteristic features of the release of pimaricinfrom PNIPA(5) were the strong burst effect associated withthe pimaricin release curve of the pimaricin-loaded PNIPA(5)nanohydrogel and the plateau observed at around 10% release(Figure 2).
Data derived from Eq. 2 (Table 2) indicate that the maximumrelative fraction of pimaricin released (! Fmax) from the PNIPA(5)nanohydrogel at 37 !C was only 9%, and most of the antifungalremained trapped in the collapsed nanogel. The maximum releaserate (m) was significantly higher (P = 0.0335) than that obtained inthe dialysis experiments with free pimaricin (data not shown), andthe time necessary to reach equilibrium was 0.13 times shorter.
It is well documented that at 37 !C (above the LCST) hy-drophobic interactions among PNIPA chains strengthen dramati-cally, which leads to the collapse of the polymer and the release ofsignificant amounts of water (Zhang and others 2002; Huang andLowe 2005).
It has been reported that loaded molecules can become en-trapped in the external part of PNIPA xerogels. Blanco and others(2008) found that methotrexate was released from PNIPA over25 h with a burst effect of 71% at 15 min. It has been suggestedthat the fast release of the externally entrapped methotrexate isthe cause of the burst effect. The large size and hydrophobicityof the methotrexate incorporated into the nanohydrogel structuremight contribute to slowing down their release at 37 !C. Zhangand others (2002) have described similar effects with 5-fluorouracilentrapped in PNIPA hydrogels. In this case, some of the drug be-came entrapped in the shrunken matrix due to the collapse of thepolymer chains and gel volume shrinkage, which slowed downthe drug release.
We suggest that because pimaricin is larger (665.725 g/mol) thanmethotrexate (454.46 g/mol) and 5-Fluorouracil (130.08 g/mL)and also due to its amphiphilic nature, pimaricin could not bereleased from the PNIPA nanohydrogel (and/or the pimaricinwas entrapped in the shrunken matrix). The burst effect at the
beginning could be because the pimaricin was in a very exposedlocation within the nanohydrogel structure and so it could bereleased quickly when the water was expelled from the inside,coinciding with the collapse of the nanogel network.
Pimaricin release from the PNIPA-20AA(5) nanohydro-gel. It has been demonstrated that the physical properties (LCST)of PNIPA nanohydrogels can be modulated by copolymerizationwith hydrophilic monomers (Schild 1992; Eeckman and others2004; Milasinovic and others 2010). In this work, we used AAas the hydrophilic monomer to synthesize a PNIPA nanohydro-gel with 20% AA (PNIPA-20AA(5)). It is expected that addingAA will promote the formation of new hydrogen bonds with wa-ter. As explained above, PNIPA-20AA(5) nanoparticles are largerthan PNIPA(5) nanoparticles because they are able to capture morewater.
The release kinetic from the PNIPA-20AA(5) nanohydrogelshowed a very different profile from that of the PNIPA(5) nanohy-drogel (Figure 2). There was no burst effect, but rather the pi-maricin was released steadily. According to Milasinovic and others(2010), the absence of the initial burst suggests that the pimaricinis trapped in the nanogel structure, unlike the previous assayednanogel in which significant amounts of pimaricin seem to re-main exposed on the surface of the nanogel particles.
The maximum amount of pimaricin released from the PNIPA-20AA(5) nanohydrogel was also significantly higher (P = 0.0309)than that released from the PNIPA(5) nanohydrogel (Table 2),although it took a very long time to reach the steady state. The mvalue was significantly lower than that obtained for the PNIPA(5)nanohydrogel (P = 0.0272) and the dialysis experiments withfree pimaricin (P = 0.0087). This continuous efflux of pimaricinto the medium indicates that the PNIPA-20AA(5) nanohydrogelimposed less diffusional restrictions than PNIPA(5).
The effect of temperature on the release of pimaricin fromnanohydrogels
To clarify the processes involved in the release of pimaricin fromnanohydrogels with and without AA, we conducted a new exper-iment in which the nanohydrogels were loaded with pimaricin at
Figure 1–Scheme of pimaricin incorporation into poly(N-isopropylacrylamide) nanohydrogels and releasethrough the dialysis bag in distilled water.
N24 Journal of Food Science ! Vol. 77, Nr. 7, 2012

180 ANEXO
N:Na
nosc
aleFo
odSc
ience
Nanohydrogels in active packaging . . .
25 !C as in the previous assays and then used to obtain the differentkinetic profiles by dialysis at 15, 25, 37, and 47 !C.
As the temperature increased, the ! Fmax value of the PNIPA-20AA(5) nanohydrogel increased up to a maximum and then de-creased slightly. However, significantly less pimaricin was releasedfrom the PNIPA(5) nanohydrogel as the temperature increased(Figure 3). Therefore, by plotting the maximum relative fractionalrelease (! Fmax) against temperature (T ), it was possible to ob-serve a well-defined optima, and thus the following second-orderpolynomial function was fitted to the experimental data:
! Fmax = a0 + a1 ! T + a2 ! T2 (3)
By deriving the functions obtained in relation to the tempera-ture and solving the roots of the resulting functions, the optimaltemperature at which the largest amount of pimaricin was releasedwas calculated to be 40.04 !C for the PNIPA-20AA(5) nanohy-drogel and "1.25 !C for the PNIPA(5) nanohydrogel. This latteroptimum temperature value is obviously located outside the ex-perimental domain. Even so, the trend predicted by the modelclearly indicates that for the PNIPA(5) nanohydrogel a decrease intemperature would lead to an increase in the amount of pimaricinreleased (Figure 3).
The observed behavior could be interpreted as resulting fromthe temperature causing the nanohydrogel collapse. Hydrophobicinteractions are one of the main factors leading to the collapse of ananohydrogel above the LCST (Eeckman and others 2004). Thepresence of AA might also affect the deswelling rate, and give riseto a more hydrated collapse state that facilitates the continuousdiffusion of pimaricin to the medium. However, the collapse of
the less hydrated PNIPA(5) nanohydrogel would be more intense,trapping pimaricin molecules within the shrunken matrix andaborting their release (Figure 3).
In order to verify this hypothesis, we examined the LCST phasetransitions of the nanohydrogels according to the transmittancemeasurements at different temperatures, a methodology widelyused in the literature. To facilitate interpretation, the data obtainedwere transformed to optical density values (Figure 4) with thefollowing equation:
OD500 = " Log10(T500) (4)
where OD500 and T500 are the optical density and the transmit-tance of the nanohydrogel suspension at 500 nm, respectively.
As hypothesized, in Figure 4 we can see a sharp volume phasetransition for the PNIPA(5) nanohydrogel and that the introduc-tion of 20% AA almost completely stopped the LCST transition forthe PNIPA-20AA(5) nanohydrogel. Milasinovic and others (2010)observed similar behavior when they increased the hydrophilicityof the PNIPA homopolymer by increasing the percentage of ita-conic acid. The homopolymer showed a sharp phase transition(34.2 !C) that became less pronounced when 5% or 10% itaconicacid was added, and the transition became practically nonexistentwith 15% itaconic acid.
Sustained controlled releaseAfter studying the different capacities of PNIPA nanohydrogels
to transport and release pimaricin when the temperature is in-creased above its LCST, we then alternated temperature cycles todetermine whether or not this release is sustained over time. This
Figure 2–Relative fraction of pimaricinreleased (! Ft) from the PNIPA(5) ( !) andPNIPA-20AA(5) (!) nanohydrogels throughthe dialysis bag of 3500 g/mol in distilledwater at 37 !C. The lines are the fitting curvesgenerated from Eq. 2 (r2
PNIPA(5) = 0.9693;r2
PNIPA"20AA(5) = 0.9833).
Table 2–Maximum relative fraction of pimaricin released (!Fmax) from the nanohydrogels, maximum release rate (m), andequilibrium dialysis time (teq) at 37 !C.
Nanohydrogel ! Fmax (37 !C) m (37 !C) (min"1) teq (37 !C) (h)
PNIPA(5) 0.09 ± 0.002a 44.27 ! 10"3 ± 5.76 ! 10"3a 1.72PNIPA-20AA(5) 0.31 ± 0.06b 1.62 ! 10"3 ± 0.48 ! 10"3b 47.31
Values reported are the means ± standard deviation (n = 2).a–bDifferent lower case letters in the same column indicate a statistically significant difference (P < 0.05).
Vol. 77, Nr. 7, 2012 ! Journal of Food Science N25

ANEXO 181
N:NanoscaleFoodScience
Nanohydrogels in active packaging . . .
is important because in the food industry it may be necessary torelease the antifungal in various cycles.
Therefore, we analysed pimaricin release from nanohydrogelswith stepwise temperature changes between 15 and 37 !C. Thecumulative pimaricin release profiles as well as the pimaricin releaserate as a function of pulsatile temperature are shown in Figure 5.
The results for the PNIPA(5) nanohydrogel were consistentwith the positive squeezing mechanism reported in the litera-ture (Bromberg and Ron 1998; Shin and others 2001; Wu andothers 2005). When the temperature was increased, the releaserate peaked rapidly followed by a very slow release process. Pi-maricin release stopped after 2 temperature pulses and duringthese cycles 15% was released, which indicates that the deswellingprocess did not help to squeeze more pimaricin out of the gelmatrix.
However, when AA was added to the PNIPA-20AA(5) nanohy-drogel, the temperature changes did not affect the release rate asdramatically. Although the biggest release peak occurred in the 1stcycle at 37 !C, after the 3rd cycle at this temperature the releaserate still remained apparently constant.
Therefore, higher releases were obtained by alternating on/offcycles, and consequently there were larger amounts of pimaricinin the release medium than in a single cycle at 37 !C, althoughwith the PNIPA-20AA(5) nanohydrogel a more sustained releaseover time was achieved.
Inhibition studies employing food model systemsTo evaluate the antimicrobial effectiveness of the pimaricin-
nanohydrogel system proposed, we conducted experiments usinga food model system consisting of PDA plates. In addition, this
Figure 3–Variation of the maximum relativefraction of pimaricin released (! Fmax) from thePNIPA(5) ( !) and PNIPA-20AA(5) (!)nanohydrogels through the dialysis bag of3500 g/mol in distilled water in relation totemperature. The lines are the fitting curvesgenerated from Eq. 3 (r2
PNIPA(5) = 0.9896;r2
PNIPA"20AA(5) = 0.9725).
Figure 4–Optical density (OD) at 500 nm ofthe aqueous solutions (12.5 mg/mL) of thePNIPA(5) ( !) and PNIPA-20AA(5) (!)nanohydrogels.
N26 Journal of Food Science ! Vol. 77, Nr. 7, 2012

182 ANEXO
N:Na
nosc
aleFo
odSc
ience
Nanohydrogels in active packaging . . .
assay was used to assess the capacity of nanohydrogels to pro-tect the pimaricin by keeping it chemically stable under favorable(A) and unfavorable (B) conditions since critical amounts of pi-maricin could be degraded under acidic conditions (Stark andTan 2003) and fluorescent lighting. Koontz and others (2003) ad-dressed this problem and studied how forming inclusion complexesof pimaricin and cyclodextrins increased the stability of pimaricincompared to free pimaricin in cheese products stored under high-intensity fluorescent lighting in supermarket freezer showcases.
No growth was observed at 4 !C (Table 3) in any of the platesor storage conditions (A or B) assayed. When the temperaturewas increased up to 25 !C and under favorable conditions forpimaricin stability (A), growth peaked rapidly and counts wereabove the limit (CFU > 75, in 5 mL of medium) for controlswithout pimaricin (C and N). Nonetheless, when pimaricin waspresent, there was much less growth, especially in those platescontaining pimaricin in the nanohydrogel (Table 3).
In plates under unfavorable conditions (B: acidic medium andstorage under fluorescent lighting), counts were low for all treat-ments because yeast grows more slowly in acidic media; how-ever, the poorest growth was again observed on plates with thepimaricin-loaded nanohydrogel (Table 3).
In order to quantify these effects, we calculated the percentagereduction in microbial growth as follows:
%R = ((N0 ! N)/N0) " 100 (5)
where N0 is the mean count on control plates (C) and N is themean count on plates with pimaricin (P) and pimaricin-loadednanohydrogel (NP), both expressed as Log (CFU/mL).
For plates under (A) conditions, the NP treatment showed areduction of 27.07 ± 4.15%, which was higher than that observedon plates with the P treatment, which showed a reduction of17.26% ± 1.34%, although the difference between the 2 treatmentswas not significant (P > 0.05). However, under (B) conditions,there was a larger difference between the NP and P treatments. Thereduction on plates with the NP treatment was 80.94% ± 33.02%,which was significantly higher (P < 0.01) than that observed onplates with the P treatment, 19.91% ± 6.68%. In any case, theANOVA analysis at a 95% confidence level of the percentagereduction (%R) showed that the effect of the treatment was verysignificant (P = 0.0069) and the effect of growth conditions (pH,light) was significant (P = 0.0205). The interaction between these2 factors was also significant (P = 0.0311), that is, the treatmentdid not have the same effect under the 2 growth conditions assayed.
Therefore, the antifungal effect of pimaricin was potentiatedwhen it was applied loaded into the PNIPA-20AA(5) nanohydro-gel probably because pimaricin was released slowly when envi-ronmental conditions required it. This seems to indicate that thenanohydrogel had a protective effect against degrading conditions(pH, light), which thus made the antifungal effect of pimaricinmore intense.
Therefore, the nanohydrogel-pimaricin system proposed in thiswork would be useful in packaging for food products that are easilyspoiled by fungal growth (that is, which have low pH and a highmoisture content) and that are normally exposed to changes instorage temperature due to transport and shelf time. As pimaricinis usually used to prevent moulds and yeasts growing on the surfaceof cheese we are currently performing experiments with cheesesamples to test PNIPA-nanohydrogel systems. The controlled
Figure 5–Relative fraction of accumulated pimaricinreleased and the release rate of pimaricin from thePNIPA(5) and PNIPA-20AA(5) nanohydrogels throughthe dialysis bag of 3500 g/mol in distilled water. Thedashed line shows the temperature cycling of therelease medium between 37 and 15 !C.
Table 3–Counts (CFU) of Saccharomyces cerevisiae (Sc 1.02) on PDA agar plates without acidification stored under dark conditions(A), and acidified PDA agar plates stored under fluorescent lighting (B), treated with distilled water (C), nanohydrogel (N), freepimaricin (P), and the nanohydrogel-pimaricin system (NP).
4 !C 25 !C
Two days Seven days Nine days Fifteen days
A B A B A B A B
C – – – – 347.0 ± 33.1 11.7 ± 12.6 327.3 ± 23.8 19.7 ± 13.5N – – – – 405.7 ± 46.5 54.0 ± 26.1 346.7 ± 37.3 57.0 ± 22.7P – – – – 65.7 ± 3.8 0.3 ± 0.6 64.0 ± 7.8 4.7 ± 2.1NP – – – – 29.3 ± 10.0 – 26.3 ± 9.1 0.3 ± 0.6
Values reported are the means ± standard deviation (n = 3).
Vol. 77, Nr. 7, 2012 ! Journal of Food Science N27

ANEXO 183
N:NanoscaleFoodScience
Nanohydrogels in active packaging . . .
release of pimaricin from PNIPA nanohydrogels could reduce theamount of pimaricin on the surface of the cheese, and thereforereduce the amount that migrates to the cheese bulk.
ConclusionOur results suggest that the degree of hydrophilicity determines
how the pimaricin is released from PNIPA nanohydrogels, and canlead to a slower but more continuous release of pimaricin, thusincreasing the amount of the antifungal released. Pimaricin-loadedPNIPA-20AA(5) nanohydrogels could be an effective system forcontrolling the release of pimaricin because they protect the an-tifungal against environmental degradation and release it slowly.Pimaricin-loaded nanohydrogels could therefore be used in activepackaging in the future.
AcknowledgmentsThis work was funded by grant (MAT 2006–11662-CO3-
CO2-C01/MAT 2010-21509-C03-01/EUI 2008–00115) fromthe “Ministerio de Educacion y Ciencia” (Spain). Clara Fucinoswas funded by a predoctoral scholarship from Univ. of Vigo(Spain).
ReferencesAndersson M, Axelsson A, Zacchi G. 1997. Diffusion of glucose and insulin in a swelling
N-isopropylacrylamide gel. Intl J Pharm 157(2):199–208.Blanco MD, Guerrero S, Teijon C, Olmo R, Pastrana L, Katime I, Teijon JM. 2008. Prepara-
tion and characterization of nanoparticulate poly(N-isopropylacryl-amide) hydrogel for thecontrolled release of anti-tumour drugs. Polym Intl 57(11):1215–25.
Bromberg LE, Ron ES. 1998. Temperature-responsive gels and thermogelling polymer matricesfor protein and peptide delivery. Adv Drug Deliv Rev 31(3):197–221.
Caykara T, Bulut M, Dilsiz N, Akyuz Y. 2006. Macroporous poly(acrylamide) hydrogels: swellingand shrinking behaviours. J Macromol Sci Pure Appl Chem 43(6):889–97.
Eeckman F, Moes AJ, Amighi K. 2004. Poly(N-isopropylacrylamide) copolymers for constanttemperature controlled drug delivery. Intl J Pharm 273(1–2):109–19.
Fajardo P, Martins JT, Fucinos C, Pastrana L, Teixeira JA, Vicente AA. 2010. Evaluation of achitosan-based edible film as carrier of natamycin to improve the storability of Saloio cheese.J Food Eng 101(4):349–56.
Farid MA, El-Enshasy HA, El-Diwany AI, El-Sayed E-A. 2000. Optimization of the cultiva-tion medium for natamycin production by Streptomyces natalensis. J Basic Microbiol 40(3):157–66.
Hanusova K, Stastna M, Votavova L, Klaudisova K, Dobias J, Voldrich M, Marek M. 2010.Polymer films releasing nisin and/or natamycin from polyvinyldichloride lacquer coat-ing: nisin and natamycin migration, efficiency in cheese packaging. J Food Eng 99(4):491–6.
Huang X, Lowe TL. 2005. Biodegradable thermoresponsive hydrogels for aqueous encapsulationand controlled release of hydrophilic model drugs. Biomacromolecules 6(4):2131–9.
Koontz JL, Marcy JE, Barbeau WE, Duncan SE. 2003. Stability of natamycin and its cyclodextrininclusion complexes in aqueous solution. J Agric Food Chem 51(24):7111–4.
Lopez C, Torrado A, Fucinos P, Guerra NP, Pastrana L. 2004. Enzymatic hydrolysis of chestnutpuree: process optimization using mixtures of !-amylase and glucoamylase. J Agric FoodChem 52(10):2907–14.
Milasinovic N, Kalagasidis Krusic M, Knezevic-Jugovic Z, Filipovic J. 2010. Hydrogels of N-isopropylacrylamide copolymers with controlled release of a model protein. Intl J Pharm383(1–2):53–61.
Neethirajan S, Jayas DS. 2011. Nanotechnology for the food and bioprocessing industries. FoodBioprocess Technol 4(1):39–47.
Schild HG. 1992. Poly(N-isopropylacrylamide): experiment, theory and application. Prog PolymSci 17(2):163–249.
Shin Y, Chang JH, Liu J, Williford R, Shin Y-, Exarhos GJ. 2001. Hybrid nanogels for sustainablepositive thermosensitive drug release. J Control Release 73(1):1–6.
Stark J, Tan HS. 2003. Natamycin. In: Russell NJ, Gould GW, editors. Food preservatives. 2nded. New York, USA: Kluwer Academic/Plenum Publishers. pp. 179–183.
Ture H, Eroglu E, Soyer F, Ozen B. 2008. Antifungal activity of biopolymers containingnatamycin and rosemary extract against Aspergillus niger and Penicillium roquefortii. Intl J FoodSci Technol 43(11):2026–32.
Vanden Bossche H, Engelen M, Rochette F. 2003. Antifungal agents of use in animal health –chemical, biochemical and pharmacological aspects. J Vet Pharmacol Ther 26(1):5–29.
Weiss J, Takhistov P, McClements DJ. 2006. Functional materials in food nanotechnology.J Food Sci 71(9): R107–16.
Wu JY, Liu SQ, Heng PW, Yang YY. 2005. Evaluating proteins release from, and their in-teractions with, thermosensitive poly (N-isopropylacrylamide) hydrogels. J Control Release102(2):361–72.
Zhang X-Z, Zhuo R-X, Cui J-Z, Zhang J-T. 2002. A novel thermo-responsive drug deliverysystem with positive controlled release. Intl J Pharm 235(1–2):43–50.
N28 Journal of Food Science ! Vol. 77, Nr. 7, 2012