SMART METERING PROJECT PHASE 1 INFORMATION PAPER 3 · SMART METERING PROJECT PHASE 1 INFORMATION...
35
SMART METERING PROJECT PHASE 1 INFORMATION PAPER 3 7 th December 2009 CER/09/186
Transcript of SMART METERING PROJECT PHASE 1 INFORMATION PAPER 3 · SMART METERING PROJECT PHASE 1 INFORMATION...

SMART METERING PROJECT PHASE 1
INFORMATION PAPER 3
7th December 2009
CER/09/186

CER Information Paper 3: Smart Metering Project Phase 1 (CER/09/186) Page 1
Table of Contents
1 Introduction .............................................................................................. 2
1.1 Purpose of Information Paper .............................................................. 2 1.2 What is Smart Metering? ..................................................................... 2 1.3 Background to Smart Metering Project ................................................ 3
2 Smart Metering Project Phase 1 Progress Update ....................................... 5 2.1 Electricity Customer Behaviour Trials (CBTs) ...................................... 6
2.1.1 Overview ....................................................................................... 6 2.1.2 Benchmark Data Collection & Group Allocation ............................ 6 2.1.3 Smart Metering Infrastructure for CBT .......................................... 8 2.1.4 Development of Smart Metering Energy Efficiency Initiatives ......... 9 2.1.5 Electricity CBT Timelines ............................................................ 17
2.2 Gas Customer Behaviour Trials (CBTs) .............................................. 18 2.2.1 Overview ..................................................................................... 18 2.2.2 Customer Recruitment ................................................................ 18 2.2.3 Smart Metering Infrastructure for CBT ........................................ 18 2.2.4 Development of Smart Metering Energy Efficiency Initiatives ....... 19 2.2.5 Gas CBT Timeline ....................................................................... 20
2.3 Technology Trials .............................................................................. 21 2.3.1 Background ................................................................................ 21 2.3.2 Technologies being Used in the Trials .......................................... 22 2.3.3 Conclusion on Electricity Technology Trials Update ..................... 25 2.3.4 Note on Gas Technology Trials .................................................... 26 2.3.5 Note on Water Smart Metering .................................................... 26
2.4 Prepayment ....................................................................................... 27 2.5 Micro Generation .............................................................................. 29 2.6 Cost Benefit Analysis (CBA) ............................................................... 30
3 Smart Metering Project Phase 1 Timelines ............................................... 31 4 Further Information ................................................................................ 32 Appendix 1: Gas CBT Recruitment Invite Letter ............................................. 33 Appendix 2: Gas CBT Recruitment FAQ Leaflet .............................................. 34

CER Information Paper 3: Smart Metering Project Phase 1 (CER/09/186) Page 2
1 Introduction
1.1 Purpose of Information Paper This Information Paper 3 on the Smart Metering Project Phase 1 has been prepared by the Commission for Energy Regulation (CER) with the purpose of providing public information on the project & its progress. This paper is a follow up to the information papers published by the CER on 6th February 2009 (Information Paper 1 - CER/09/024) and 31st July 2009 (Information Paper 2 - CER/09/118). The initial Information Paper 1 outlined the background to the project, project governance structure, project deliverables & gave an update on progress of the deliverables as at end of 2008. Information Paper 2 gave an update on progress of the project deliverables as at beginning of July 2009. This paper, Information Paper 3, gives an update on progress of the project deliverables as at end of November 2009.
1.2 What is Smart Metering? Smart meters are the next generation of meters, which can replace existing electro-mechanical meters and offer a range of benefits for both the individual electricity & gas consumer and for the electricity & gas systems in general. The existing standard mechanical meter records the total amount of electricity/gas used over time. These meters are read manually and the information is sent to the network operator and then used to calculate customer bills. If a meter reader does not have access to the customer’s meter, estimated consumption information (or a reading provided by the customer) is used to calculate the bill. If the estimated consumption is higher or lower than the actual meter read, this is corrected for when the meter is next read by the customer or the meter reader. A smart meter is much more sophisticated. It records customers’ actual use of electricity over short intervals (e.g. every 30 minutes). These meters are connected by a system to the network operator providing the operator with automated, up-to-date information on the amounts of electricity used by customers. Access to this information provides opportunities to reduce network operation costs, including reduced costs of technicians visiting customer

CER Information Paper 3: Smart Metering Project Phase 1 (CER/09/186) Page 3
premises to manually read the meter and carrying out any necessary connections and disconnections. There are also savings due to reductions in technical losses and theft. The data collected from smart meters can be used by electricity & gas suppliers to deliver useful information to their customers regarding their electricity & gas consumption and costs. In particular, the installation of smart metering will allow electricity suppliers to create innovative pricing arrangements that can be offered to customers to support the efficient use of electricity, such as time-of-use electricity tariffs. This is where the price of electricity varies at different times of the day to reflect the changes in the costs of producing electricity. This will allow customers to manage their consumption of electricity in line with price movements and demand patterns. The customer behavior trials (CBTs) are being undertaken to understand how the use of smart meters can facilitate improving energy efficiency by helping consumers reduce any unnecessary electricity and/or gas usage & shift any discretionary electricity usage away from peak consumption times.
1.3 Background to Smart Metering Project The National Smart Metering Plan is a commitment in the Government's Energy Policy Framework and in the 2007 Programme for Government. It is a central component of the strategy to radically enhance management of energy demand and to deliver greater energy efficiency. The Commission established the Smart Metering Project Phase 1 in late 2007 with the objective of setting up & running Smart Metering Trials & assessing their costs and benefits, which will inform decisions relating to the full rollout of an optimally designed universal National Smart Metering Plan. In order to draw on the experience and expertise of the electricity and gas market a Steering Group and a Working Group was established by the Commission for the Smart Metering Project Phase 1. Both groups are chaired by the Commission and consist of representatives from the Department of Communications, Energy & Natural Resources (DCENR), Sustainable Energy Ireland (SEI), the Northern Ireland Authority for Utility Regulation (NIAUR) and Irish Gas & Electricity Industry Participants. The illustrations on the next page depict the Project Governance structure & all the Project participants.

CER Information Paper 3: Smart Metering Project Phase 1 (CER/09/186) Page 4
For further details on project background & governance please refer to the CER Smart Metering Information Paper published in February 20091.
Smart Metering Project Phase 1 – Governance Structure
Smart Metering Steering Group
CER
Smart Metering Working Group
CER
Tariffs Work Stream
Billing–DataWork Stream
NetworksWork Stream
Customer Behaviour
Work Stream
Smart Metering Project Phase 1 – Participants
1 Smart Metering Project Phase 1 Information Paper (CER/09/024) – 6th Feb 2009 www.cer.ie/en/information-centre-reports-and-publications.aspx
CER Information Paper 3: Smart Metering Project Phase 1 (CER/09/186) Page 5
2 Smart Metering Project Phase 1 Progress Update
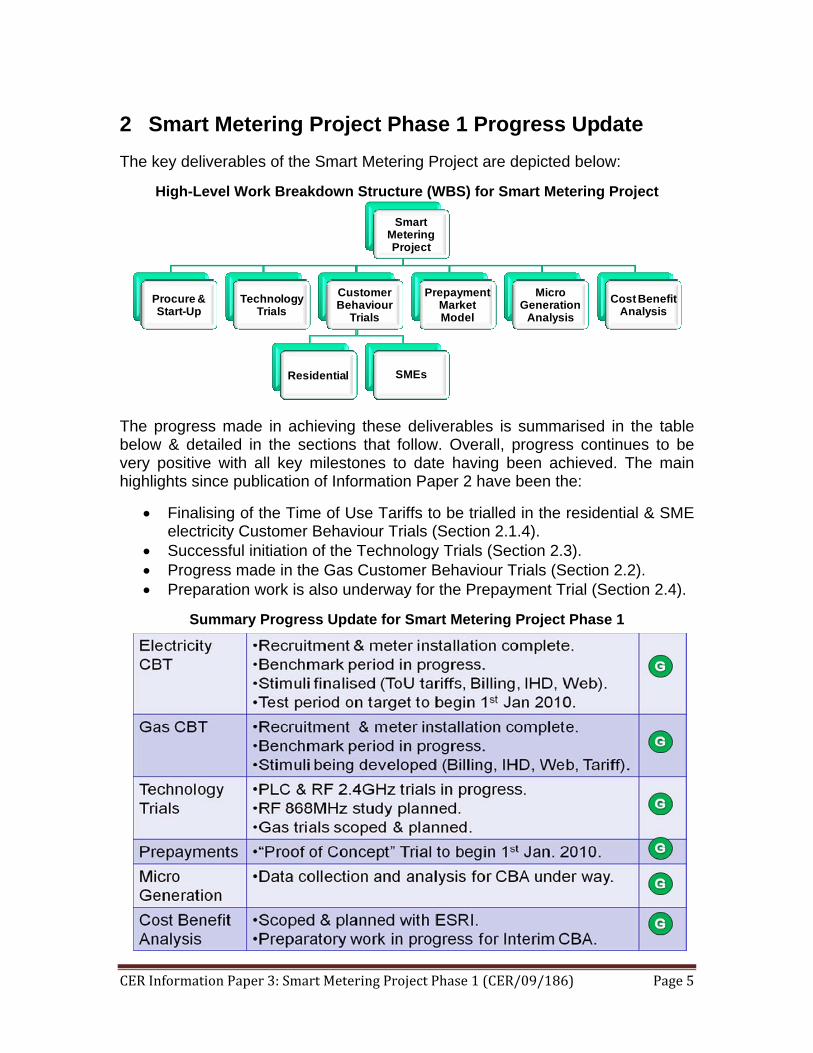
The key deliverables of the Smart Metering Project are depicted below:
High-Level Work Breakdown Structure (WBS) for Smart Metering Project
Smart Metering Project
Procure & Start-Up
Technology Trials
Customer Behaviour
Trials
Residential SMEs
Prepayment Market Model
Micro Generation
AnalysisCost Benefit
Analysis
The progress made in achieving these deliverables is summarised in the table below & detailed in the sections that follow. Overall, progress continues to be very positive with all key milestones to date having been achieved. The main highlights since publication of Information Paper 2 have been the:
• Finalising of the Time of Use Tariffs to be trialled in the residential & SME electricity Customer Behaviour Trials (Section 2.1.4).
• Successful initiation of the Technology Trials (Section 2.3). • Progress made in the Gas Customer Behaviour Trials (Section 2.2). • Preparation work is also underway for the Prepayment Trial (Section 2.4).
Summary Progress Update for Smart Metering Project Phase 1

CER Information Paper 3: Smart Metering Project Phase 1 (CER/09/186) Page 6
2.1 Electricity Customer Behaviour Trials (CBTs)
2.1.1 Overview The overall objective of the Electricity CBTs is to ascertain the potential for smart metering enabled energy efficiency initiatives to effect measurable change in consumer behaviour in terms of reductions in peak electricity demand & overall energy use. The CBTs focus on Residential & SME (small-to-medium enterprise) electricity consumers. The CBTs have been designed to ensure that statistically robust findings will be produced that will give an accurate indication of what would be expected in a national smart metering roll-out scenario and the findings will thus inform the Smart Metering Cost Benefit Analysis. Consumers participating in the CBTs have been allocated to “control” groups & “test” groups. Various energy efficiency initiatives enabled by Smart Metering will be introduced to the “test” groups. These initiatives will take the form of: • Price signals that will encourage consumers to transfer some of their
electricity usage away from times of the day when demand for electricity is at its peak i.e. Time of Use (ToU) Tariffs. The Time of Use tariffs for the trial have been finalized & published. (Section 2.1.4.1)
• Enhanced & more frequent information on electricity usage & costs for consumers – via Billing, Web & Dynamic Display units – so as to enable self regulation of electricity consumption. The systems required to deliver this functionality have been built & are currently being tested. (Sections 2.1.4.2-4)
• A financial incentive that will encourage consumers to reduce their overall
electricity usage by rewarding them for achieving a target for percentage reduction in their usage i.e. overall load reduction (OLR) incentive. The OLR methodology has been finalized and incorporated into the build of the smart billing system. (Section 2.1.4.5)
2.1.2 Benchmark Data Collection & Group Allocation The minimum benchmark data collection period began on 1st July 2009. It was important that all required meters were installed by this date, which was achieved. This will mean that a minimum of 6 months “normal” electricity usage data is available for trial analysis purposes. The Benchmark data collection period serves the purpose of enabling an understanding of electricity usage behaviour & patterns of trial participants before the smart metering enabled energy efficiency initiatives are introduced. This data can then be compared with the electricity usage behaviour & patterns of the same trial participants during the Test Period i.e. after they are exposed to different energy efficiency initiatives facilitated by smart metering.

CER Information Paper 3: Smart Metering Project Phase 1 (CER/09/186) Page 7
The benchmark data also serves another important purpose in that it assists the Project Statisticians in the task of allocating Trial participants across different sample groups so as to ensure that each sample grouping has appropriate & consistent representivity i.e. the correct spread of electricity consumers in terms of their electricity usage amounts & patterns, as well as other socio-economic & demographic factors – as derived from surveys of trial participants conducted throughout August & September 2009. This assists in ensuring that results derived from the trial can be extrapolated up to apply to the national electricity consumer base. (Note – Information Paper 2 outlined details about the representivity of Trial participants). The diagram over page gives an overview of the Trial Design matrix for the Residential CBT & depicts the different sample groups into which Trial consumers have been allocated. These are made up of a number of different test groups & a control group. • Each test group is exposed to a different type of smart metering enabled
energy efficiency initiative during the Test Period (1st Jan – 31st Dec 2010). • The control group do not receive any smart metering enabled energy
efficiency initiative during the Test Period. Instead they continue to receive the standard electricity offering. The control group serves a very important function in that their usage behaviour & patterns during the Test Period can then be compared with that of the Test Groups in order to account for the impact of any variables unrelated to smart metering that may have impacted electricity usage during the Test Period e.g. temperature.
Consumer communications have been developed which will be mailed to trial participants in December 2009 informing them of which sample group they have been allocated to. The Test Period will then begin on 1st January 2010, when the various smart metering energy efficiency initiatives come into effect, & end on 31st December 2010.

CER Information Paper 3: Smart Metering Project Phase 1 (CER/09/186) Page 8
Trial Design Matrix for Residential CBT
2.1.3 Smart Metering Infrastructure for CBT ESB Networks is using smart meters from Elster that have GPRS communications built in. In addition an IT system from Energy ICT was installed by ESB Networks. This system remotely manages the meters and collects and manages their data. Smart meter installations began in December 2008 & were successfully completed by end-June 2009 in time for the beginning of the Benchmark Period. Data collection system continues to perform well and the secure channels that provide data from this system to electricity suppliers & trial statisticians

CER Information Paper 3: Smart Metering Project Phase 1 (CER/09/186) Page 9
(anonymised format) are also functioning well. Half hourly profile data is being collected by this system every day for each consumer. Data protection is always a key consideration in the design of any systems that will have consumer information. The operation of the system complies with all legal data protection requirements. In addition the systems are designed in accordance with best international IT security practices to prevent unauthorised access from third parties.
2.1.4 Development of Smart Metering Energy Efficiency Initiatives The smart metering enabled energy efficiency initiatives that will be tested as part of the trial are currently in the final stages of development & are on target for being ready for the Test Period start on 1st January 2010. 2.1.4.1 Time of Use Tariffs Smart metering facilitates new types of electricity pricing that will encourage consumers to transfer some of their electricity usage away from times of the day when demand for electricity is at its peak i.e. Time of Use Tariffs. Instead of one price per unit (which most consumers pay at the moment), there will be three different prices, depending on the time of day you use electricity. For the purposes of the CBT these time bands have been defined as follows: Price Time Peak Rate 5pm to 7pm (Monday to Friday, excluding Public Holidays) Night Rate 11pm to 8am every night Day Rate All other times The Peak Rate will be the highest and the Night Rate will be the cheapest. Peak Rate is when electricity demand is at its highest, resulting in more expensive generation sources being used to meet demand, this in turn generates higher carbon emissions and electricity is therefore more expensive during these times. If consumers cut down or move some of their electricity usage outside of these peak hours, they could save money and reduce their carbon emissions.

CER Information Paper 3: Smart Metering Project Phase 1 (CER/09/186) Page 10
On the previous page is a sample graphic illustrating the Time of Use bands. This graphic will be included in communication materials to trial participants, including a fridge magnet & appliance stickers. The actual prices to be used in the CBT have been calculated based on the prevailing standard residential tariff as at 1st October 2009. The CER worked with the electricity industry via the Smart Metering forums to develop a methodology & principles to be used in calculating the Time of Use Tariff prices. Feedback on the ToU tariffs emanating from a series of consumer focus groups has also been factored into the final agreed prices. The finalised ToU prices for ESB Customer Supply participating customers are summarised in the tables below - refer to the following published document on www.cer.ie for the detail of these ToU tariffs: Smart Metering CBTs Electricity Time of Use (TOU) Tariffs – published 2nd October 2009. Over the period participants trialling these ToU tariffs will not pay any more for their electricity than they would if they had remained on their normal electricity prices. They will receive a credit on their December 2009 bill. Once their participation in the Trial ends in December 2010 they will receive a further credit in January 2011. If it is calculated at the end of the trial that, even after taking these credits into account, some customers have still paid more than they would have on their normal electricity price, then they will be given a final credit for this amount. Please note that these credits are in addition to the two €25 credits available to trial participants for completing the trial surveys. Bord Gáis Energy & ESBIE will calculate the SME trial ToU tariffs for their participating customers based on the agreed methodology.
Residential Trial Time of Use Tariffs (cents per kWh, excluding VAT)
Tariff Night Day Peak T1 12 14 20 T2 11 13.5 26 T3 10 13 32 T4 9 12.5 38 T5 (W’end)* 10 14 38 *Night rate applies all day Saturday & Sunday for T5
SME Trial Time of Use Tariffs (cents per kWh, excluding VAT)
Tariff Night Day Peak T6 14 15 22 T7 7.5 16 22.5

CER Information Paper 3: Smart Metering Project Phase 1 (CER/09/186) Page 11
These ToU tariffs will apply for trial participants from 1st January 2010 to 31st December 2010. Rates may be subject to change in line with ESB Customer Supply tariff changes. Over page is a copy of the fridge magnet that will be given to consumers on ToU Tariff T1.
Fridge Magnet for Time of Use Tariff T1
2.1.4.2 Smart Billing The electricity CBT will test the effectiveness of enhanced & more frequent information on electricity usage & costs for consumers via billing so as to better enable self regulation of electricity consumption. Information Paper 2 gave an overview of the market research that was conducted with Residential & SME

CER Information Paper 3: Smart Metering Project Phase 1 (CER/09/186) Page 12
electricity consumers in order to assist in the development of the more detailed electricity billing that smart metering can facilitate. Various Smart Billing options were designed on the basis of the findings derived from market research. These Smart Billing options were put into focus group research with consumers & the final versions for residential & SME trials were agreed. These bills contain the following information:
• Financial invoice including line item breakdown of electricity usage costs by time of use.
• Table displaying typical costs of running the main household appliances over a full year at the different time of use rates – see the table below (note costs displayed are for illustration purposes only):
• Graphical displays of electricity usage & cost by ToU band for the billing period. Below is a sample mock-up of a residential bill graph which depicts a consumer’s cumulative time of use costs by day of the week for the billing period.
Use by day of week: Jan/Feb
Night (11pm – 8am)

CER Information Paper 3: Smart Metering Project Phase 1 (CER/09/186) Page 13
Over page is a sample mock-up of SME bill graphs which also depicts a consumer’s cumulative time of use costs by day of the week for the billing period, as well as a weekly breakdown of electricity usage costs by time of use. Also included is tabular information on historic usage costs by time of use for previous billing periods.
• Information panels giving smart energy efficiency tips that highlight to consumers the opportunities for shifting and/or reducing their electricity usage & the costs savings that would result. Individualised motivational messages based on historic usage & peer comparisons will also be included.
ESB Customer Supply is currently finalising the systems to produce Smart Billing for the Residential Electricity CBT & is on target to have these ready for issuing bills during the Test Period. ESB Customer Supply & Bord Gáis Energy Supply are currently developing the systems to produce Smart Billing for the SME Electricity CBT & are on target to have these ready for issuing bills during the Test Period.

CER Information Paper 3: Smart Metering Project Phase 1 (CER/09/186) Page 14
2.1.4.3 Smart Web The Smart Web Access application will provide online access for a subset of Residential & SME consumers on the trial to view their detailed consumption & costs in various graphical & tabular formats. The screenshot below illustrates an example of what a Smart Web view might look like.
Account Overview View Bill View
StatementCost &
ConsumptionPeer
Comparison
6Select View: Daily Weekly Monthly
Cost & Consumption Summary
Cost & Consumption Summary – Detailed table
Year to Date
Eu
ro
Cost (Euro)
5.00
4.50
2.50
The Web has been identified as a key channel through which to communicate smart metering enabled detailed electricity usage & cost information to SME multi-site consumers in particular. Many SME multi-site businesses have specific staff with energy cost management responsibilities who can analyse such information & act on it to implement energy efficiencies & make cost savings for their businesses. Thus a group of SME multi-site customers of ESB Independent Energy (ESBIE), who are broadly representative of the different business sectors, have been engaged to participate in case study trials which will test the effectiveness of such a Smart Web offering for SME multi-sites. ESBIE are currently finalising the system that will be used to provide Smart Web access to their customers who are participating in the trial, which is on target to be ready for the start of the Test Period on 1st January 2010.

CER Information Paper 3: Smart Metering Project Phase 1 (CER/09/186) Page 15
2.1.4.4 Dynamic Display Unit ESB Networks have been working with Elster to ensure a “best of breed” dynamic display unit (also referred to as an electricity monitor or In-Home Display or IHD) to meet the requirements of consumers will be delivered. Testing of this device has been successfully completed & manufacturing is in progress. The dynamic display units will be installed by ESB Networks in relevant trial participant’s homes at the beginning of the Test Period. The dynamic display unit will be trialed with a subset of Residential & SME Trial consumers, & will give them real-time & historical information on their electricity usage & costs. The “home screen” for the dynamic display unit is the key screen that the customer will always see when the device is plugged in and switched on. Refer to the illustration below for a picture of the dynamic display unit showing the home screen (tariffs & costs featured are for illustrative purposes only).
The consumer will be able to view additional information on their electricity usage & cost by navigating through additional screens “behind” the home screen.

CER Information Paper 3: Smart Metering Project Phase 1 (CER/09/186) Page 16
2.1.4.5 Overall Load Reduction (OLR) Incentive As part of the trial a subset of consumers will take part in a test of the effectiveness of an overall load reduction (OLR) incentive. This is a financial incentive that will encourage consumers to reduce their overall electricity usage by rewarding them for achieving targets for percentage reduction in their usage i.e. overall load reduction (OLR) incentive. Personalised targets for demand reduction will form the basis of the OLR incentive – with financial rewards for consumers who achieve & surpass their targets. In effect, there are two rewards available to motivate consumers to change their electricity consumption – a lower bill as a result of reduced usage plus a reward for achieving the target. Consumers testing this initiative will be communicated to with their demand reduction target at the beginning of the trial & receive feedback on progress towards their target via information on their Smart Bills. The OLR period will run from May to December 2010. The OLR panel on the Smart Bill will compare the overall usage during this period with the overall usage from May to December 2009 (benchmark period). The baseline is set at 10% reduction on benchmark consumption. Consumers will be advised by letter in May 2010 of their OLR target. All consumers on the OLR stimulus will be bi-monthly billed. The first bills with the OLR target will issue in July for the May/June period. Each bill will show the actual cumulative usage per consumer and will provide an indication of whether they are above or below the end of year target. This cumulative usage will be derived from the bi-monthly usage and added to usage since 1st May 2010. The calculations showing cumulative usage to date will be consumer specific and will be provided through the billing system. Over page is a mock-up illustration of what the OLR incentive panel on a Smart Bill might look like (Note – all figures used are for illustrative purposes only). ESB Customer Supply is currently finalising the systems to deliver smart billing including the OLR initiative information.

CER Information Paper 3: Smart Metering Project Phase 1 (CER/09/186) Page 17
Example of OLR Panel on Smart Bill
2.1.5 Electricity CBT Timelines • Jul-Dec 2009: 6mth minimum Benchmark Data Collection Period began 1st
July 2009 - collect current electricity usage data for trial consumers before the Smart Metering enabled energy efficiency initiatives are introduced.
• Jan-Dec 2010: 12mth Test Period will begin on 1st January 2010 - measure electricity usage after the introduction of the Smart Metering enabled energy efficiency initiatives.
• Feb 2011: Findings Report - understand effect of the Smart Metering
enabled energy efficiency initiatives on consumer usage via quantitative analysis of the electricity usage data by Statisticians & results of qualitative analysis by Market Researchers (e.g. surveys of trial consumers).
Reduce your Electricity Usage
Your bi-monthly goals help you meet your annual target. If you keep below these goals at the end of the year, you will earn €20 AS WELL AS any savings you make on your bill
2010 Electricity Reduction Target
3,000Your Target :Use less than Units by Dec 31st
599Your Usage :You have used Units since May 1st
Reduce your usage goals
545At the end of This Billing Period:Your goal was to have used less than Units
1,147By the end of the Next Billing Period:Your goal is to have used less than Units
You are within your Goal – Congratulations.
Reduce your Electricity Usage
Your bi-monthly goals help you meet your annual target. If you keep below these goals at the end of the year, you will earn €20 AS WELL AS any savings you make on your bill
2010 Electricity Reduction Target
3,0003,000Your Target :Use less than Units by Dec 31st
599599Your Usage :You have used Units since May 1st
Reduce your usage goals
545545At the end of This Billing Period:Your goal was to have used less than Units
1,1471,147By the end of the Next Billing Period:Your goal is to have used less than Units
You are within your Goal – Congratulations.

CER Information Paper 3: Smart Metering Project Phase 1 (CER/09/186) Page 18
2.2 Gas Customer Behaviour Trials (CBTs)
2.2.1 Overview The overall objective of the Gas Customer Behaviour Trials (CBTs) is to ascertain the potential for smart metering enabled energy efficiency initiatives to effect measurable change in consumer behaviour in terms of reductions in overall energy use. The CBTs, which focus on Residential & SME (small-to-medium enterprise) gas consumers, have been designed to ensure that statistically robust findings will be produced that will give an accurate indication of what would be expected in a national smart metering roll-out scenario and the findings will thus inform the Smart Metering Cost Benefit Analysis. Consumers participating in the CBTs will be allocated to “control” groups & “test” groups. Up to 2,000 smart meters will be installed for the gas trials: • The majority of these (1,925) will be used for an “experimental” trial with
Residential consumers.
• A small subset of the meters (50) will be used for Gas SME case studies – to supplement results from other international SME trials, particularly in Britain.
2.2.2 Customer Recruitment Customer recruitment for the residential CBT began in early August 2009 & was successfully completed by early September 2009. A random selection invite process was undertaken, similar to the Electricity CBT, to ensure that a representative sample of consumers participate in the Gas CBTs. Response rates to the invitation letters sent were very positive with an approx. 25% acceptance rate. Copies of the recruitment materials (letter & FAQ leaflet) are included in Appendix 1 & 2. Recruitment for the SME trial will begin in early 2010.
2.2.3 Smart Metering Infrastructure for CBT After an extensive tendering process, Bord Gáis Networks selected technology vendors for the CBT during August 2009. Each CBT home is equipped with a smart gas meter (which replaces the existing gas meter) and an in-home communications hub. The smart gas meter features solid state ultrasonic measurement technology. Meter read data is transmitted to the in-home hub via low-power radio. The in-home hub then relays the meter read data on a daily basis to the IT management systems via SMS technology. Selected consumers

CER Information Paper 3: Smart Metering Project Phase 1 (CER/09/186) Page 19
in the trial will be provided with an In-Home Display unit allowing them to monitor their gas consumption on a daily basis. The technical architecture is as shown in the diagram below:
Gas CBT Technical Architecture
Low
Pow
er R
adio
Low Power Radio
SmartGas Meter
(BatteryPowered)
IHD(Mains
Powered)
HUB(Mains
Powered)
GSM NetworkGSM Network
SMS SMS Data ManagementService
After agreeing technology integration schedules with the selected vendors and successful evaluation/demonstration of the selected technologies, smart meter installations commenced in late-Sept 2009. Bord Gáis Networks have successfully installed all the required 1,925 residential meters by end-November 2009. This enables the start of the minimum benchmark data collection period on 1st December 2009. The data management system supervises the daily collection of data from the meters over the GSM network and makes this data available for billing and for analysis. End-to-end testing from the meters through to the data management system went well and final integration with Bord Gáis Networks existing IT systems has been completed.
2.2.4 Development of Smart Metering Energy Efficiency Initiatives Various energy efficiency initiatives enabled by Smart Metering will be introduced to the “test” groups. These initiatives will take the form of: • Enhanced & more frequent information on gas usage & costs for consumers –
via Billing, Web & Dynamic Display units (also known as In-home Displays or IHDs) – so as to enable self regulation of gas consumption.
• New tariffs or incentives that may encourage more energy efficient usage of gas.

CER Information Paper 3: Smart Metering Project Phase 1 (CER/09/186) Page 20
Development of the energy efficiency initiatives is being progressed by the Smart Metering industry work streams. Consumer focus groups have been held to better understand residential consumer attitudes to gas usage & the factors influence their usage behaviour. This information is being used in designing of the Smart Bills which is currently underway. The primary focus for the SME trial will be developing a Web based stimulus that will be able to give businesses access to a rich stream of information on their gas usage & costs, which can be in turn used to help them become more energy efficient & reduce their gas costs as a result. Preliminary work on the design of this SME Web stimulus for the trial is currently underway.
2.2.5 Gas CBT Timeline • Residential CBT:
o End- Nov 2009: Meter installations have been successfully completed. o Dec 2009 – May 2010: 6mth Benchmark data collection period occurs
from 1st Dec 2009 to 31st May 2010. o Jun 2010 – May 2011: Smart Metering enabled energy efficiency
initiatives will be introduced from the 1st June 2010 with the 12mth test period due to conclude on 31st May 2011.
• SME Trial: o Oct 2009 – Jan 2010: Procurement activities o Feb 2010: Complete customer recruitment o End-May 2010: Complete meter installations o June 2010 – May 2011: Smart Metering enabled energy efficiency
initiatives will be introduced from the 1st June 2010 with the 12mth test period due to conclude on 31st May 2011.
• Cost Benefit Analysis (CBA): o Q1 2011: A checkpoint will be taken in early 2011 to integrate
preliminary results from the Gas CBT into the Smart Metering Cost Benefit Analysis to be completed at end of Q1 2011.
o Q3 2011: It is envisaged that the full results of the gas trials could be included in an addendum to the CBA in Q3 2011.

CER Information Paper 3: Smart Metering Project Phase 1 (CER/09/186) Page 21
2.3 Technology Trials
2.3.1 Background Smart metering is a new and immature technology with evolving functionality. Initial implementations were focussed on one way communication with the meter to automatically read it. In recent times the requirements for smart metering implementations have been evolving to include areas such as: • Interval and time of use (ToU) Register Data • kW and kVAr – import and export • Events/Tamper Alarms • Firmware Upgrades • Outage Recording on Meter • Basic Power Quality Monitoring • Load Limiting, Variable settings • Remote operation of switch embedded in meter. Smart metering is a hybrid technology consisting of three high level layers:
• Physical meters and associated devices • Communications layer covering data transport and communications
network management • IT systems which manage the data, applications and services
The communications layer is the area where a considerable number of challenges currently are, and as a result this is a key focus of the technology trials. In 2008 ESB Networks selected a number of solutions for the trials that were representative of the currently available communication technologies. As the functional requirements for smart metering in Ireland are likely to be “leading edge” a technology trial is seen as a key learning and risk mitigation project. Researching and trialling different communications technologies is also necessary because the unique nature of Ireland from both the perspective of population density and electricity network design means that substantial number of meters will be using wireless (Radio Frequency) communications. This will be one of the first major deployments of this type of technology in Europe. It is necessary because almost half of Irish electricity consumers live in rural areas where power-line carrier (PLC) would not be viable (analogous to the rural broadband problem). As the technology trials are different than the customer behaviour trials, consumers who have their meters replaced in this trial by smart meters will continue to be billed by their electricity supplier as normal and will not be put on

CER Information Paper 3: Smart Metering Project Phase 1 (CER/09/186) Page 22
new smart energy efficiency initiatives, such as time of use tariffs, like those consumers participating in the electricity CBTs. The design of the technology trials is to allow for three elements of study:
• Bench / Lab • Sandbox • Field
Further to this technical study of features and functionality not readily available in the trial technologies will be carried out by means of technical studies. Field test locations are chosen with the intention of studying the performance of AMI (advanced metering infrastructure) communication technologies in typical situations and also more difficult environments. In addition the technology trials will also facilitate an understanding of:
• The level of technical issues faced in replacing meters in problematic installations e.g. meter boxes needing repairs, unsuitable locations for meters, other remedial work required at the meter.
• Deployment and logistical issues. • Risks and issues for full roll out.
2.3.2 Technologies being Used in the Trials The meters being installed for the trials will incorporate the various communications technologies including GPRS, Power Line Carrier (PLC) and RF (wireless).
2.3.2.1 Meters with GPRS GPRS allows high-speed data services over existing GSM radio networks (which operates in the same way as a mobile phone). This is the technology being installed in the meters for the customer behaviour trials. ESB Networks can study the performance of this technology by using the infrastructure that is being used for the customer behaviour trials. The meters for this trial are all now in place:

CER Information Paper 3: Smart Metering Project Phase 1 (CER/09/186) Page 23
EI ServerMeter
Management,Data
ManagementData Storage
Elster AS230 Smart meter with GPRS
Module
GPRS over Vodafone
Mobile network
2.3.2.2 Meters with Wireless LAN module These meters will have a RF (Radio Frequency) wireless Local Area Network (LAN) module. There are a number of different potential technologies in this area. In North America, smart metering tends to be deployed using multi-hop RF Mesh. The meter collector receives and transmits signals to meters which, in turn, pass these signals on to other meters and eventually via a collector back centrally. The wireless signals will operate in the unlicenced spectrum area. Unlicenced wireless is mainly used in North America. Most of these solutions there are not compatible with available unlicenced spectrum in Ireland. ESB Networks are looking at the wireless in the two key areas of currently available unlicenced spectrum 2.4GHz and 868MHz. They are mainly deploying meters with wireless communications in the 2.4GHz similar to what is being deployed in almost 1,000,000 smart meters in Ontario, Canada. The technology ESB Networks are using is shown over page:

CER Information Paper 3: Smart Metering Project Phase 1 (CER/09/186) Page 24
SerViewCom
Meter Management,
Data Storage
Trilliant Meshgate 2.4ghz radio
repeater
GPRS
The systems to support this trial have been commissioned by ESB Networks. Currently these meters are being rolled out to about 2,500 consumers in the Cork City urban and Bandon rural areas. The meters come from Iskraemeco with the communications and IT systems coming from Trilliant. ESB Networks is also doing an evaluation with Elster on whether the unlicenced 868 MHz spectrum would also be suitable.
2.3.2.3 Meters with Power Line Carrier (PLC) Based LAN Power line carrier (PLC) technology uses signals sent over the low voltage (LV) electricity network downstream of the distribution transformers as the communications medium between meters and data concentrators. The data concentrator is generally connected to the LV busbar at the distribution transformers, i.e. one concentrator per transformer. These also then pass back and forth data via GPRS to the central IT system. The systems to support this

CER Information Paper 3: Smart Metering Project Phase 1 (CER/09/186) Page 25
trial have been commissioned by ESB Networks. This trial is now underway with meters and equipment installed in the Limerick and Ennis Areas. The schematic below shows the power line carrier technology from Sagem which is being trialled:
Ionos Meter
Management,
Data Storage
GPRS over Vodafone
Mobile operators network
Signal over DLC
ESB Networks are also doing a study with Aclara on how low frequency narrow band PLC might be used to meet requirements.
2.3.3 Conclusion on Electricity Technology Trials Update The technology trials are now well underway with ESB Networks targeting to report back on these trials by mid 2010. The total number of meters actually deployed in the electricity technology trials is now likely to be in the order of 4,000 - 5,000, in addition to the approx 6,500 meters in the CBT. However, as smart metering is a technology which continues to develop and as smart metering requirements also emerge ESB Networks will also be reviewing other available options.

CER Information Paper 3: Smart Metering Project Phase 1 (CER/09/186) Page 26
2.3.4 Note on Gas Technology Trials The CER’s initial analysis indicates that gas smart meters are most economic when leveraging off an electricity smart metering infrastructure. The CER is working with Bord Gáis Networks & ESB Networks to ensure any overlapping gas smart metering technical trial requirements are included in the scope of the technology trials outlined above. Bord Gáis Networks will also conduct separate specific gas smart metering technology trials – up to 500 gas smart meters will be installed for this. Details are currently being finalised.
2.3.5 Note on Water Smart Metering The CER have held preliminary discussions with the Department of Environment, Heritage & Local Government to examine if a smart metering infrastructure put in place for electricity could have synergies with any possible future requirements for water smart metering. The CER will continue to keep in touch with the Department to monitor any developments in this area.

CER Information Paper 3: Smart Metering Project Phase 1 (CER/09/186) Page 27
2.4 Prepayment The increased ability for consumers to monitor and adjust their consumption utilising the Smart Meter will also mean that energy supply companies will be able to combine daily consumption with updated payment information to facilitate similar services to the “Pay-As-You-Go” (PAYG) type pre-payment service as is currently available in the mobile telecommunications area. These opportunities are being analysed with the objective of agreeing an appropriate Smart Metering Prepayment Market Model. A small scale pilot will be carried out in 2010 to determine the feasibility of the provision of a service such as this. An outline of the trial is as follows:
Payment Channels
-Over-the-counter-IVR-EFT- Web
Meter Data Management System
A/C Balance
Threshold Balance €SMS/AVT
Daily ReadsNetworks
Payments €
D/E RequestsD/E Requests
Payments €
Meter Readings
De/Re-energisation
Smart Meter (Standard)
• The trial will be comprised of a small number of ESB Customer Supply customers following their agreement to participate.
• Account Balance will be calculated daily for these customers, inclusive of up to date consumption, received payments, and any debt repayment commitments.
• For the purposes of the trial participating customers will be able to determine their daily balance by SMS or by phone
• If outstanding credit runs low, warnings will be issued to the customer to “top-up” their account.
• The “top-up” process will consist of making a payment via any of ESB Customer Supply’s existing payment channels

CER Information Paper 3: Smart Metering Project Phase 1 (CER/09/186) Page 28
• Payments are processed overnight and will be reflected in the following day’s balance (other than laser payments over the phone/web which are immediate and cheque postal which can take longer).
• As with PAYG mobile phones, failure to maintain credit above agreed level will result in disconnection, following warnings. This will be carried out remotely at a pre-notified time.
• If a customer is disconnected, supply will be reconnected remotely once top-up payment is made and confirmed to ESB Customer Supply.

CER Information Paper 3: Smart Metering Project Phase 1 (CER/09/186) Page 29
2.5 Micro Generation Smart Metering offers new opportunities for expanding Micro Generation of electricity. A micro generation scheme was launched in February 2009 through which up to 4,000 interval meters are being made available for micro-generators (further details below). This removes need for a smart meter specific pilot but the Smart Metering Project will ensure required import/export data from this scheme is captured for analysis & input into the Smart Metering Cost Benefit Analysis (CBA). Details of the suite of micro generation measures announced by Minister Eamon Ryan on 26 Feb 2009, the learning’s from which will then inform the development of a long-term micro generation programme, are outlined in the CER’s Smart Metering Information Paper 2.

CER Information Paper 3: Smart Metering Project Phase 1 (CER/09/186) Page 30
2.6 Cost Benefit Analysis (CBA) Using information gathered via the different Trials conducted as part of the Smart Metering Project Phase 1 & from other sources a Cost Benefit Analysis (CBA) will be developed to ascertain the costs & benefits that would be entailed in a full national roll-out of Smart Metering in Ireland.
The CER have engaged the ESRI (Economic & Social Research Institute) to develop the Smart Metering CBA with the CER. High-level timelines have agreed with the ESRI for delivery of an interim CBA in September 2010 & a final CBA in March 2011. The objective of the CBA is to estimate the payoff to society of each
roll-out option, compared to “no action” baseline. “Options” compared in the CBA will be derived from electricity & gas trials findings & other sources. All data from suppliers being analysed will be coded so as to protect consumer identification in line with Data Protection requirements. Preliminary preparation work for the Interim CBA was kicked-off by the CER in October 2009 & is currently ongoing. Further information on the types of costs & benefits attributable to smart metering is available in the following CER paper: Demand Side Management and Smart Metering Consultation Paper (CER/07/038) - March 2007.

CER Information Paper 3: Smart Metering Project Phase 1 (CER/09/186) Page 31
3 Smart Metering Project Phase 1 Timelines
High-Level timelines for the Smart Metering Project Phase 1 are depicted below:

CER Information Paper 3: Smart Metering Project Phase 1 (CER/09/186) Page 32
4 Further Information
Other CER publications on www.cer.ie relating to Smart Metering which may be of interest are: • Smart Metering CBTs Electricity Time of Use (TOU) Tariffs – published 2nd
October 2009 • Smart Metering Project Phase 1 Information Paper 2 (CER/09/118) – 31st July
2009 • Smart Metering Project Phase 1 Information Paper 1 (CER/09/024) – 6th Feb
2009 • Arrangements for Micro Generation Decision and Response to Comments
Received (CER/07/208) – 20th Nov 2007 • Smart Metering - The Next Step in Implementation (CER/07/198) – 5th Nov
2007 • Demand Side Management and Smart Metering Consultation Paper
(CER/07/038) - March 2007 For further information on the Smart Metering Project you can contact Gary Martin at the Commission for Energy Regulation (e-mail: [email protected] or tel.: 01-4000800).

CER Information Paper 3: Smart Metering Project Phase 1 (CER/09/186) Page 33
Appendix 1: Gas CBT Recruitment Invite Letter

CER Information Paper 3: Smart Metering Project Phase 1 (CER/09/186) Page 34
Appendix 2: Gas CBT Recruitment FAQ Leaflet