Smart Metering 2 - Ericsson · smart metering scenario The smart metering scenario includes 30,000...
4
Smart metering in Australia Australia’s largest energy distributors supply electricity to millions of customers in the major metropolitan areas and extensive rural outback. The electricity network powers both large and small businesses, as well as major industries, including mining, shipping, tourism, manufacturing and agriculture. With initiatives in smart grid development, the Australian Government is working closely with electricity companies to keep Australia at the forefront of energy technology.
Transcript of Smart Metering 2 - Ericsson · smart metering scenario The smart metering scenario includes 30,000...
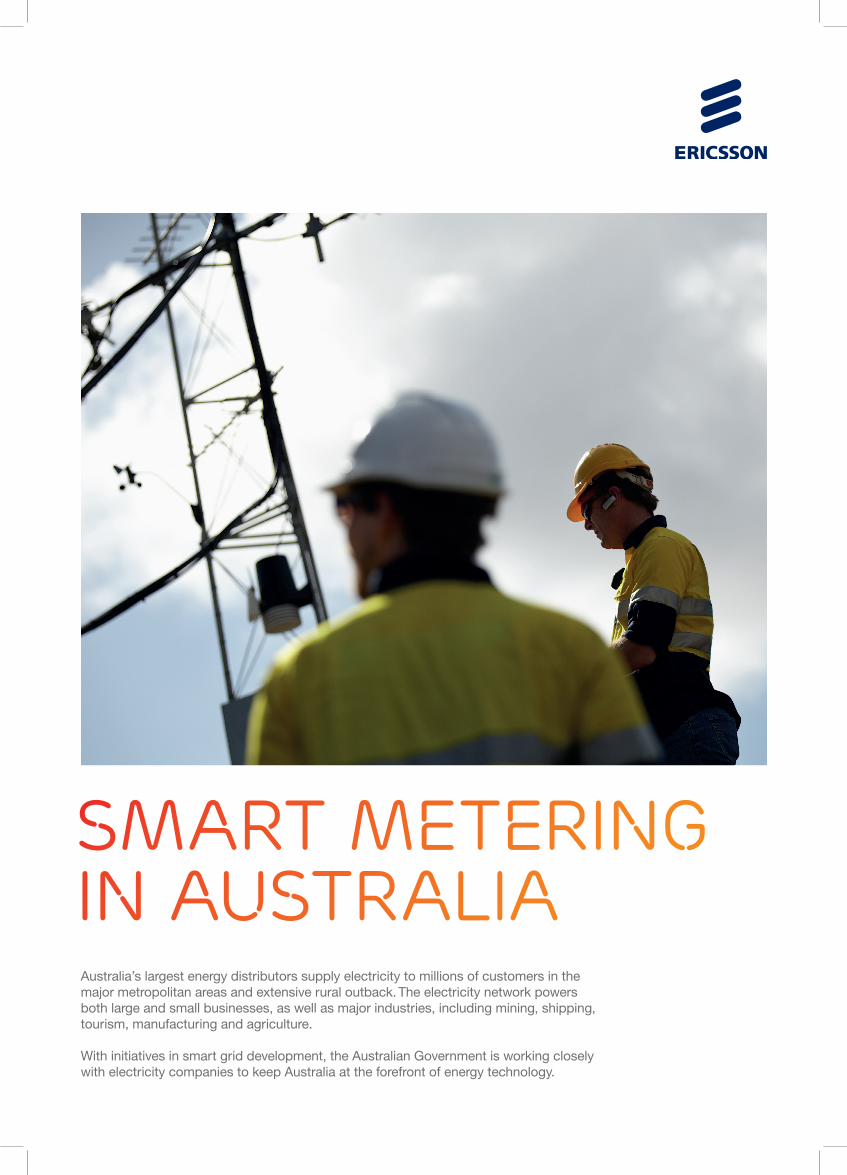
Smart metering in AustraliaAustralia’s largest energy distributors supply electricity to millions of customers in the major metropolitan areas and extensive rural outback. The electricity network powers both large and small businesses, as well as major industries, including mining, shipping, tourism, manufacturing and agriculture.
With initiatives in smart grid development, the Australian Government is working closely with electricity companies to keep Australia at the forefront of energy technology.

Smart meters for emissions control Australia has ambitious goals for developing its electricity grid and reducing its environmental impact. Smart meters are currently being trialed in a number of areas to enable electricity distribution automation and home energy management. This is expected to signifi cantly increase the effi ciency of Australia’s energy consumption and, as a consequence, reduce the impacts of climate change.
smart grid for smarter citiesThe smart grid, which overlays the traditional electrical grid with an ICT network that includes smart meters, is key to help energy utilities reduce CO2 emissions, and help society operate more sustainably.
Building a smart grid involves transforming the traditional electricity network by introducing a chain of new smart technologies. These include smart sensors, new backend IT systems, smart meters and a communications network –the use of ICT is essential to build smartness into the electricity grid.
A smart grid improves the reliability of the electricity network by allowing applications that effect self-healing when a fault occurs, and effective condition-based maintenance to reduce the likelihood of faults. The operations teams are also provided with real-time awareness of the electricity network status, improving both operations and planning.
Smart meters give households the ability to better manage their energy use by enabling information feedback about how much energy is being used and the estimated costs, thus reducing the carbon footprint of utilities and energy users.
our approachAs part of Ericsson’s series of studies exploring ICT solutions and the potential carbon dioxide
equivalent (CO2e) emissions reductions they can achieve, we have conducted a life cycle assessment (LCA) of smart metering for electricity distribution, based on an Australian case, to understand the potential of such solutions. This case focuses on climate change, by modeling CO2e emissions for the total system over a lifetime of 20 years, including both negative impacts from the ICT products and the positive impacts of their usage.
smart metering scenario The smart metering scenario includes 30,000 customers spread between various urban and rural locations. Our assessment model is based on details of the
equipment used for a smart meter trial with a major electricity distributor. For this assessment, it is assumed that all customers are within the city boundary or greater metropolitan area. Studies conducted by the State Government show that the average electricity usage rate for residents is 7,300kWh per year, and this fi gure is used in this study.
The assessed solution offers services that include: remote meter reading, direct load control related to water heating, continuous power consumption monitoring, service connection and disconnection, over-the-air updates, monitoring of power outages and controlled restoration.
System flowchart of LCA models
Meter
Communications module
Switch
Smart meter
AMI backend(Data Center)
Transportsite visits to install
Private utilityLTE network
AMI system installed
at household
Private utilityLTE network
Environmental impact reduction
of AMI system
Environmental impact of
AMI system
Smart meterelectricity
consumption
Data centeroperation
LTE network operation
Transport Communications module
replacement& maintenance
Meter
Communications module
Switch
LTE/core network(1 Sub/year)
Tower
Reduced vehicles kms
manual meter reading
Reduced vehicles dematerialization
Energy savingsfor household

The assessed case is based on a scenario with new meters, and communication to the data center is provided through a dedicated private LTE wireless field area network (FAN).
The assessment targets the meters as well as the communications network, and their overall CO2e emissions from raw material acquisition, production and use are compared with a potential reduction in emissions due to reduced fuel consumption caused by fewer vehicle journeys and lower energy use in the home.
The following components are included in the system model: smart meters, an LTE radio-access network (RAN), an LTE core network, and a dedicated data center.
A single smart meter is assumed to be installed in each household. The smart meter includes a new meter, a communication modem and a remotely operated switch. The private LTE RAN applicable for this case includes an RBS site with radio units, digital units, antennas, peripherals and a cabinet. New antenna towers have been included for half of the RBS sites based on the background information.
In addition, the related LTE core network includes the servers and mechanics used to house the Evolved Packet Core that handles the LTE air interface. The data center houses the servers, mechanics and peripherals used specifically to support the application layer of the smart metering infrastructure.
As stated, the emissions investigated cover both lifetime energy consumption during operation, and embodied emissions associated with production and raw materials acquisition. The assessment also includes emissions related to transportation for installation and maintenance purposes. The assessment does not include end-of-life treatment assessment
for the new meters nor the EoLT recycling of the replaced meters. Previous studies show that the impact from EoLT is marginal.
BenefitsThe smart metering solution is expected to lead to three main benefits: The elimination of manual meter reading; a reduced number of vehicles leased; and a reduction of energy used in the home.
Elimination of manual meter readingVisits to the site by car for manual meter reading are replaced with automatic meter reading by the application. Without smart meters, the method for meter reading is to drive to the site and walk the street. Based on previous research, we estimate that a total distance of 4.35km per year per meter is avoided through automated meter reading.
Fewer vehicles leased The elimination of manual meter reading is assumed to lead to a reduction in the number of vehicles needed for field operations. It is estimated that five vehicles fewer are needed per 30,000 smart meters installed. Given a lifetime of five years per vehicle, a total of 20 vehicles will be saved during the system’s lifetime – that is one vehicle per year.
Reduction of energy used in the homeHome energy management is expected to lead to a decrease in power used by households. As the system is still being rolled out, no measurements of such savings are available; three potential scenarios were therefore used, corresponding to savings of 1 percent, 2 percent and 4 percent in home energy use. Studies from other trials show that the energy savings in the home resulting from smart meter installation are on average 4 percent. ResultsThe results show that the total annual impact per customer – for one meter per household – is about 65kg of CO2e. Of this amount, electricity use during operation accounts for 80 percent, or about 53kg CO2e. The remaining 20 percent is caused by manufacturing and installation. The figures take into account the meter itself and the other components of the technical system described above. Our analysis shows that the largest proportion of the emissions (about 32kg) is associated with the dedicated LTE network followed by the smart meter (about 21kg).Taking into account all three benefits, analysis of the CO2e emissions reductions enabled by

Ericsson AB
SE-126 25 Stockholm, Sweden
Telephone +46 8 719 00 00
Fax +46 8 18 40 85
www.ericsson.com © Ericsson AB 2013
the solution shows that a positive net effect on emissions is achieved already at around 1 percent energy savings in the home (1 percent corresponds to a savings potential of about 80kg of CO2e) and would be substantial at 2 percent and 4 percent (corresponding to about 160kg and 320kg of CO2e). This comparison is relevant for Australia, where the emissions per kilowatt hour are extremely high in this scenario at 1.07kg of CO2e/kWh. The world average emission factor is lower; approximately 0.6kg of CO2e/kWh. Using the world average electricity mix, this smart metering solution would reach emission breakeven at approximately 2 percent home energy savings, which is well below the average savings of 4 percent aggregated from other smart metering trials1.
To put this result in context, the average motor vehicle figures used for this study give fuel combustion emissions of 0.18kg CO2/km. Therefore, the annual impact per customer of the smart metering solution in this scenario has the equivalent impact of driving about 360km by car, which is about 3 percent of the annual average motor vehicle usage in Australia (2010 figures)2.
ConclusionIn this study we have assessed the environmental impact of smart metering in the context of a major metropolitan area in Australia. The results show that the energy savings in the home have the greatest enabling effect that by far outweighs the direct environmental impact of smart metering installation and operation. This is another example of how ICT solutions provide enabling effects that help reduce the environmental impact of other sectors, in this case the energy sector.It should be noted that LCA is a methodology only for evaluating the potential environmental impact of a service or product, and that there are many other benefits to smart metering that are not included in this study.
1. Smart Metering & Infrastructure Program Business Case. BC Hydro. www.bchydro.com2. Australia Bureau of Statistics http://www.abs.gov.au/ausstats/[email protected]/mf/9208.0/
Meter reading &energy savingMeter reading &energy saving
Meter reading &energy savingMeter reading &energy saving
Embodied ICTDirect (operation)Enabling effects
Embodied ICTDirect (operation)Enabling effects
Meter reading &energy savingMeter reading &energy saving
ICT meteringsolutionICT meteringsolution
100100
5050
00
-50-50
-100-100
-150-150
-200-200
-250-250
-300-300
-350-350
Kilo
gram
s of
CO
2e/y
ear p
er h
ouse
hold
Kilo
gram
s of
CO
2e/y
ear p
er h
ouse
hold
Kilograms CO2e/YearKilograms CO2e/Year
Direct andembodiedDirect andembodied
ICT solution 65
-80Reduction scenario 1%
-160Reduction scenario 2%
-315Reduction scenario 4%Reductionscenario 1%Reductionscenario 1%
Reductionscenario 2%Reductionscenario 2%
Reductionscenario 4%Reductionscenario 4%
Breakevenpoint forenabling effects
Breakevenpoint forenabling effects
FoR moRe inFoRmation aBout eRiCsson’s woRk
on enaBling iCt solutions, please visit:
http://www.ericsson.com/thecompany/sustainability_
corporateresponsibility/enabling_a_low_carbon_economy