Smart Appliances -...
13
Smart Appliances Kevin Messner December 1, 2011
Transcript of Smart Appliances -...

Smart Appliances
Kevin Messner
December 1, 2011

Load
Control
1

2
Smart Appliances
+ Customer Participation
- Customer Complaints
High DR Resource
Direct Load Control
- Customer Participation
+ Customer Complaints
Low DR Resource
2

ENERGY STAR
Smart Appliances Will Be a Reality in 2013
3
Product Delay Load Temporary Load
Refrigerator Shift Defrost/Ice Making 50%
Clothes Washer Delay Start 50%
Dryer Delay Start 80%
Room AC 25% 80%
Dishwasher Delay Start 50%

Demand Reduction Yields 24% More
in Capacity Savings
Source: The Brattle Group
15%
(res. margin)
8%
(line loss)
1 W 1.24 W
4

PNNL Study
5

6

Avg., All Hours = 42.24$
Avg., On-Peak = 50.64$
Avg., Off-Peak = 39.45$
Avg., Shift-To Hours = 39.44$
On-Peak / Off-Peak Ratio = 1.28
On-Peak / Shift-To Ratio = 1.28
Price On-Peak
($MWh) Day Hour
01/01/2006 1 35.32$ 1 1 0 2006 7 TRUE FALSE TRUE
01/01/2006 2 31.42$ 1 1 1 2006 7 TRUE FALSE TRUE
01/01/2006 3 32.84$ 1 1 2 2006 7 TRUE FALSE TRUE
01/01/2006 4 27.11$ 1 1 3 2006 7 TRUE FALSE TRUE
01/01/2006 5 27.25$ 1 1 4 2006 7 TRUE FALSE TRUE
01/01/2006 6 26.73$ 1 1 5 2006 7 TRUE FALSE TRUE
01/01/2006 7 27.04$ 1 1 6 2006 7 TRUE FALSE TRUE
01/01/2006 8 28.64$ 1 1 7 2006 7 TRUE FALSE TRUE
01/01/2006 9 28.29$ 1 1 8 2006 7 TRUE FALSE TRUE
01/01/2006 10 29.33$ 1 1 9 2006 7 TRUE FALSE TRUE
01/01/2006 11 31.77$ 1 1 10 2006 7 TRUE FALSE TRUE
01/01/2006 12 32.53$ 1 1 11 2006 7 TRUE FALSE TRUE
01/01/2006 13 33.75$ 1 1 12 2006 7 TRUE TRUE FALSE
01/01/2006 14 33.18$ 1 1 13 2006 7 TRUE TRUE FALSE
01/01/2006 15 31.46$ 1 1 14 2006 7 TRUE TRUE FALSE
01/01/2006 16 30.65$ 1 1 15 2006 7 TRUE TRUE FALSE
01/01/2006 17 29.00$ 1 1 16 2006 7 TRUE TRUE FALSE
01/01/2006 18 31.41$ 1 1 17 2006 7 TRUE TRUE FALSE
01/01/2006 19 38.74$ 1 1 18 2006 7 TRUE FALSE TRUE
01/01/2006 20 37.75$ 1 1 19 2006 7 TRUE FALSE TRUE
01/01/2006 21 37.86$ 1 1 20 2006 7 TRUE FALSE TRUE
01/01/2006 22 45.18$ 1 1 21 2006 7 TRUE FALSE TRUE
01/01/2006 23 34.58$ 1 1 22 2006 7 TRUE FALSE TRUE
01/01/2006 24 32.44$ 1 1 23 2006 7 TRUE FALSE TRUE
01/02/2006 1 28.86$ 1 2 0 2006 1 TRUE FALSE TRUE
01/02/2006 2 27.82$ 1 2 1 2006 1 TRUE FALSE TRUE
Hour
(Starting)Year
Day of
Week
Shift
ToDayDate
DST
HoursMonth
PJM Hourly Wholesale LMP
for NE. Columbus OH (2006)
7

Avg., All Hours = 7.88$
Avg., On-Peak = 7.29$
Avg., Off-Peak = 8.08$
Avg., Shift-To Hours = 8.08$
On-Peak / Off-Peak Ratio = 0.90
On-Peak / Shift-To Ratio = 0.90
RegulationSynchronized
ReserveOn-Peak
($MWh) ($MWh) Day Hour
1/1/2006 1 17.51 7.07 1 1 0 2006 7 TRUE FALSE TRUE
1/1/2006 2 21.88 6.87 1 1 1 2006 7 TRUE FALSE TRUE
1/1/2006 3 24.38 6.78 1 1 2 2006 7 TRUE FALSE TRUE
1/1/2006 4 17.89 0 1 1 3 2006 7 TRUE FALSE TRUE
1/1/2006 5 27.8 0 1 1 4 2006 7 TRUE FALSE TRUE
1/1/2006 6 26.01 7.83 1 1 5 2006 7 TRUE FALSE TRUE
1/1/2006 7 19.95 6.68 1 1 6 2006 7 TRUE FALSE TRUE
1/1/2006 8 22.7 6.76 1 1 7 2006 7 TRUE FALSE TRUE
1/1/2006 9 30.73 6.76 1 1 8 2006 7 TRUE FALSE TRUE
1/1/2006 10 17.33 6.8 1 1 9 2006 7 TRUE FALSE TRUE
1/1/2006 11 26.99 10.37 1 1 10 2006 7 TRUE FALSE TRUE
1/1/2006 12 19.04 10.39 1 1 11 2006 7 TRUE FALSE TRUE
1/1/2006 13 17.09 6.91 1 1 12 2006 7 TRUE TRUE FALSE
Hour
(Starti
ng)
YearDay of
Week
Shift
ToDayDate
DST
HoursMonth
PJM Hourly Ancillary Services
for Mid-Atlantic (2006)
8
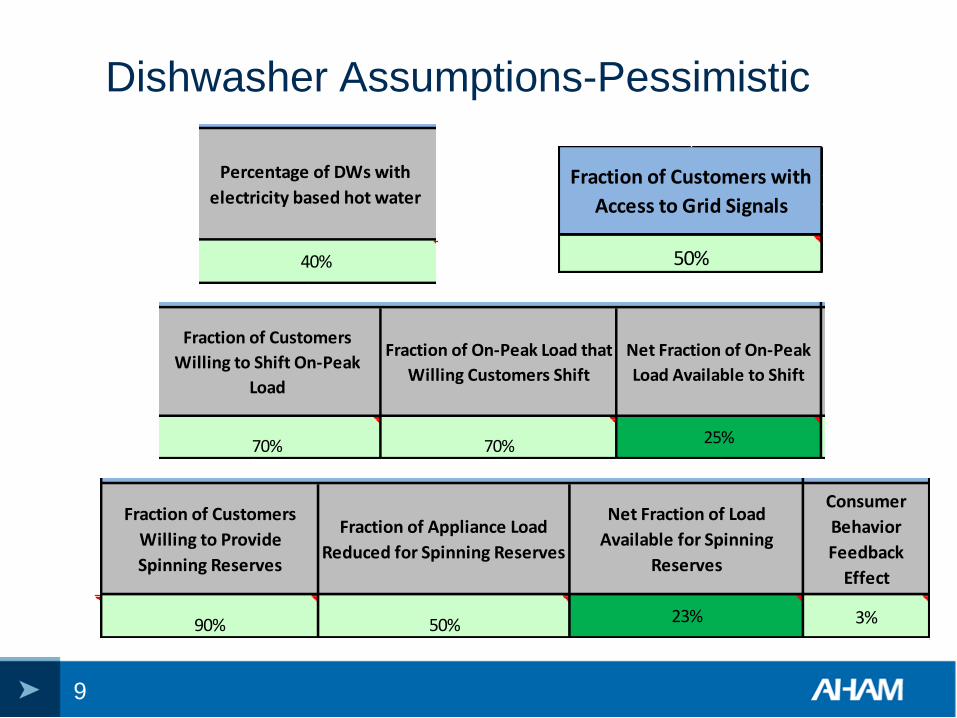
Dishwasher Assumptions-Pessimistic
2010 312 156 156 3%
Net Fraction of On-Peak
Load Available to Shift
Fraction of Customers
Willing to Provide
Spinning Reserves
Fraction of Appliance Load
Reduced for Spinning Reserves
Net Fraction of Load
Available for Spinning
Reserves
Consumer
Behavior
Feedback
Effect
Percentage of DWs with
electricity based hot water
DW Annual
Energy
(kWh/yr)
DW Machine
Only Energy
(kWh/yr)
DW Hot
Water Energy
(kWh/yr)
Fraction of Customers
Willing to Shift On-Peak
Load
Fraction of On-Peak Load that
Willing Customers Shift
50% 23%40% 25%70% 70% 90%
Dishwasher (DW) Assumptions
Peak-Load Shifting Assumptions Spinning Reserves Assumptions
2010 312 156 156 3%
Net Fraction of On-Peak
Load Available to Shift
Fraction of Customers
Willing to Provide
Spinning Reserves
Fraction of Appliance Load
Reduced for Spinning Reserves
Net Fraction of Load
Available for Spinning
Reserves
Consumer
Behavior
Feedback
Effect
Percentage of DWs with
electricity based hot water
DW Annual
Energy
(kWh/yr)
DW Machine
Only Energy
(kWh/yr)
DW Hot
Water Energy
(kWh/yr)
Fraction of Customers
Willing to Shift On-Peak
Load
Fraction of On-Peak Load that
Willing Customers Shift
50% 23%40% 25%70% 70% 90%
Dishwasher (DW) Assumptions
Peak-Load Shifting Assumptions Spinning Reserves Assumptions2010 312 156 156 3%
Net Fraction of On-Peak
Load Available to Shift
Fraction of Customers
Willing to Provide
Spinning Reserves
Fraction of Appliance Load
Reduced for Spinning Reserves
Net Fraction of Load
Available for Spinning
Reserves
Consumer
Behavior
Feedback
Effect
Percentage of DWs with
electricity based hot water
DW Annual
Energy
(kWh/yr)
DW Machine
Only Energy
(kWh/yr)
DW Hot
Water Energy
(kWh/yr)
Fraction of Customers
Willing to Shift On-Peak
Load
Fraction of On-Peak Load that
Willing Customers Shift
50% 23%40% 25%70% 70% 90%
Dishwasher (DW) Assumptions
Peak-Load Shifting Assumptions Spinning Reserves Assumptions
Fraction of Customers with
Access to Grid Signals
50%
9

PNNL Study-Results
10
Shown in Table 1-1 are the highest possible benefit-to-cost ratios (expressed as percentages) of
various appliances based on the “optimistic” set of assumptions.
Table 1-1. Benefit-to-Cost Ratios of Smart Appliances Based on “Optimistic” Assumptions
DW CW RAC Freezer Refrigerator Dryer
PJM 2006 528% 563% 733% 539% 536% 680%
ERCOT 2008 817% 871% 1060% 881% 877% 1054%
NYISO 2008 367% 403% 585% 357% 355% 462%
NYISO 2006 353% 389% 712% 346% 344% 442%
CAISO 2008 319% 356% 554% 313% 312% 396%
Shown in Table 1-2 are the low-end benefit-to-cost ratios of various appliances based on
“pessimistic” set of assumptions.
Table 1-2. Benefit-to-Cost Ratios of Smart Appliances Based on “Pessimistic” Assumptions
DW CW RAC Freezer Refrigerator Dryer
PJM 2006 136% 134% 131% 150% 150% 207%
ERCOT 2008 203% 200% 295% 230% 228% 337%
NYISO 2008 107% 106% 139% 112% 111% 147%
NYISO 2006 112% 112% 160% 119% 118% 160%
CAISO 2008 99% 100% 135% 102% 101% 134%
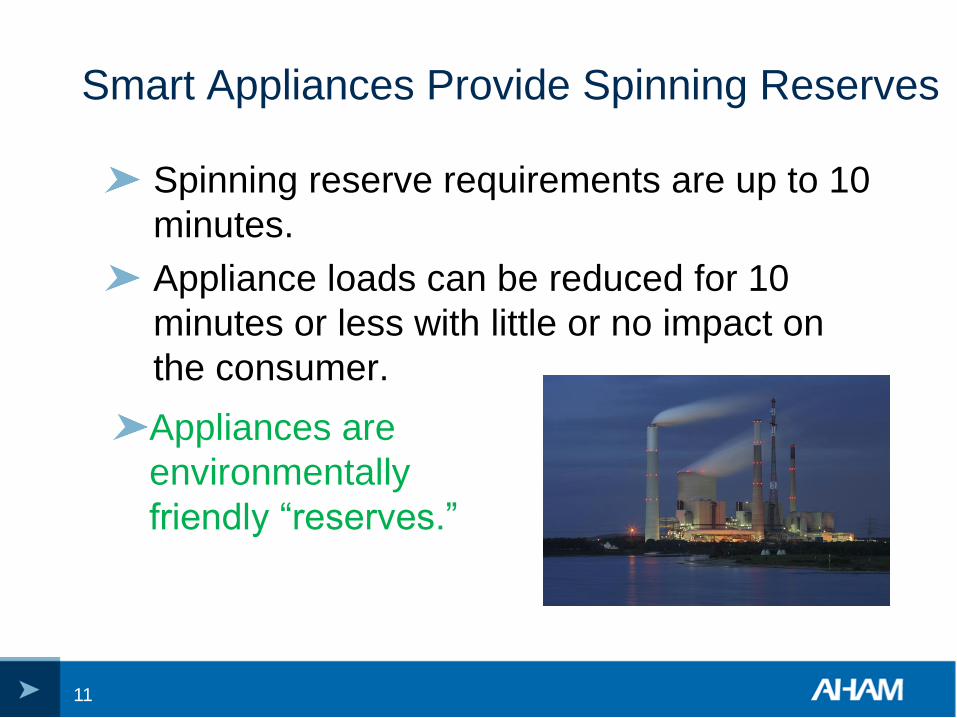
Smart Appliances Provide Spinning Reserves
Spinning reserve requirements are up to 10
minutes.
Appliance loads can be reduced for 10
minutes or less with little or no impact on
the consumer.
11
Appliances are
environmentally
friendly “reserves.”

Contact Information
Kevin Messner VP, Policy & Government Relations
202-872-5955
www.aham.org
12