Smallholder pig production and marketing value chain in Uganda ...

Smallholder Global Value Chain Participation: The Role of Aggregation
by
Eva Szalkai Csaky
Public Policy Studies Duke University
Date:_______________________ Approved:
___________________________ Frederick Mayer, Supervisor
___________________________
Gary Gereffi
_________________________ Anirudh Krishna
_______________________
Phyllis Pomerantz
Dissertation submitted in partial fulfillment of the requirements for the degree of Doctor of Philosophy
in the Graduate School of Duke University Public Policy Studies
2014

ABSTRACT
Smallholder Global Value Chain Participation: The Role of Aggregation
by
Eva Szalkai Csaky
Public Policy Studies Duke University
Date:_______________________ Approved:
___________________________ Frederick Mayer, Supervisor
___________________________
Gary Gereffi
_________________________ Anirudh Krishna
_______________________
Phyllis Pomerantz
An abstract of a dissertation submitted in partial fulfillment of the requirements for the degree of Doctor of Philosophy
in the Graduate School of Duke University Public Policy Studies
2014

Copyright by Eva Szalkai Csaky
2014

iv
Abstract
Smallholder farmers have been at the center of the development discourse
not only because they represent a significant portion of the world’s extreme poor
but because of their potential role in food security, climate change and gender
equality. Smallholders account for 70% of global food production but most of
them in the developing world operate in the informal markets. Market
formalization is accelerating even in the least developed countries, however, and
formal market channels are gradually displacing informal ones. Global value
chain based formal markets may also offer opportunities for smallholders to tap
into fast growing international markets for high value agricultural products.
One of the key challenges policymakers, the development community
and agribusinesses face, however, is smallholders’ limited formal organization
(“producer organizations”) that aggregate their production and demand for
goods and services in order to enable more effective market participation
(“aggregation”). Only 5-10% of farmers globally are estimated to participate in
formal producer organizations. This is despite the fact that such organizations
have been supported by both policymakers and the development field as a way
of tackling poverty and addressing market failures.

v
The shift towards food production being organized based on global value
chains and production networks and the fast dissemination of supermarkets and
other modern food retail outlets around the world is creating increased need for
smallholders to partake in some form of aggregation mechanism in order to
become contributors to the global food system.
Agribusinesses that buy agricultural products have therefore also been
encouraging producer organizations as a way to improve their ability to source
from smallholders. Nonetheless, of the producer organizations that do exist in
emerging economies, only a negligible portion have been able to achieve stable
access to the growing global market of high value agricultural products.
The objective of this dissertation is to contribute to the understanding of
this paradox and to identify factors that may improve the likelihood and
effectiveness of aggregation. The structure of this work is as follows: first the
research problem and the gap in the literature (Chapter 1) will be defined,
followed by the review of existing scholarship on smallholder agricultural
producers, the globalization of agribusiness and global value chains as well as
the literature on the aggregation of smallholder production, producer
organizations and their access to global and modern value chains (Chapter 2).

vi
Next a conceptual framework will be proposed based on which a model
for smallholder global-value-chain-relevant aggregation (Chapter 3) will be
developed that takes into account the producer organization types, the services
offered by the producer organizations, producer organizations’ access to
financing and the requirements of global value chains.
The model will be tested first using the population of Hungarian producer
organizations, and then a sample of Central American and Peruvian producer
organizations (Chapter 4), utilizing the following hypotheses:
1. “Collective identity narratives”, manifesting themselves in Collective
Identity Activities, play an important role in facilitating the growth and
competitiveness of POs.
2. Services, including access to financing for farmers, provided by POs
play an important role in facilitating scaling.
3. Cooperatives are at a disadvantage compared to other producer
organization (PO) forms in achieving the conditions of global value
chain access.
The empirical analysis has five main findings. First, because trust is so
important in enabling farmer participation in collectives, shared narratives that
establish collective identity may play a role in ensuring not only farmer loyalty
but also may help improve producer organizations’ performance, particularly as
organizations grow. Second, organizations that offer more services to farmers

vii
are more likely to scale and hence achieve global value chain access. However,
this study found that considerable variation among services, some having much
more significant relationship to the ability to scale than others. Third,
cooperatives, the producer organization form most often supported by
policymakers and the development field, on average were found less effective
than other forms of producer organizations in their ability to connect farmers to
global value chains. Having said that, it is important to highlight that the study
also identified several cooperatives and some common patterns among them that
outperformed both their cooperative and non-cooperative peers. Fourth, while
this study adds to the evidence that smaller farmers within the smallholder
group are at a disadvantage when it comes to PO participation and may,
therefore, require differentiated support when it comes to interventions, it also
identified several POs that work with some of the smallest farmers and still
outperform their peers. Fifth, the study found that POs’ access to financing is
important for modern market access, in addition to meeting quantity and quality
requirements.
The policy implications of these findings are considerable and
recommendations for interventions conclude the paper (Chapter 6) after the

viii
discussion of this study’s limitations (Chapter 5). The key policy findings
include that cooperatives are not the panacea for development and policymakers
should also consider other forms of producer organizations for support.
Importantly, policymakers should rather consider linking their support to certain
aggregator characteristics and activities, including services offered since some
services appear to have stronger relationships than others with POs’ ability to
succeed. Among these services access to finance for farmers as well as research
and development and innovation play crucial role and therefore deserve
heightened attention from policymakers while access to finance at the PO level
has also been found to be important. In addition, PO activities that help build
collective identity are associated with POs’ productivity and ability to scale.
In terms of the arguable trade-off between sustainability and smallholder
inclusion, a finding of the present work is that smallholders have the potential to
achieve significantly higher productivity than their larger counterparts and their
POs can successfully access modern markets as long as they are provided with
the necessary support related to sustainable intensification of their production
and access to capital for making the necessary investments.

ix
Dedication
As a child I observed my grandmother organizing about a hundred
women into a cooperative to knit baby hats and sweaters in a small Hungarian
village. Groups of women would gather for hours in my grandmother’s veranda
learning new patterns from her, exchanging experiences, testing new yarns or
just simply sharing stories. They all took great pride in the quality of the
products and sewing little “made in Hungary” labels on the finished pieces and
care instructions in several languages. For most of them this was their only
source of independent income not to mention the sole source of formal income
that made them eligible for pension and other benefits later in life. These
experiences were an inspiration for some of my own work as a practitioner and
my choice of dissertation topic.
Organizing the women in my grandmother’s village into a group that
allowed them access to input, information, skills, resources and ultimately a
market to sell their products, is what I will refer to as “aggregation” in this
paper. Aggregation helps small producers overcome the disadvantages of their
small size and, often, remote location. Traditionally aggregation has taken place

x
mainly via cooperatives. Many in the international development field, where I
myself have spent twenty years of my career, hold great hopes for such
cooperatives. But can such cooperatives connect small producers to markets and
improve their livelihoods in our highly globalized world? How can successful
aggregation of small producers be achieved in the era of globalization and global
value chains? In particular in the agri-food sector, which experienced
unprecedented changes over the past 20 years? This paper attempts to shed some
light to these questions.
Narrowing down my interest in this topic into testable research questions
and staying the course was a considerable challenge for me and I would like to
thank first and foremost Fritz Mayer for not giving up on me and guiding me
through this journey with such dedication. His intellect and infallible logic kept
bringing me back to the focus I needed. His recent book “Narrative Politics:
Stories and Collective Action” also helped me recognize some of the less tangible
dynamics observed among the organizations I studied and helped conceptualize
them in this dissertation.
I am also very thankful to my other committee members. Gary Gereffi’s
novel global value chain framework changed forever how I approach

xi
development problems and is a pillar of this dissertation. I am honored to have
him advise my work and his guidance has been invaluable. Phyllis Pomerantz’s
wisdom and compassion helped me through some of the lowest points of this
journey. An international development executive throughout her successful
career, her guidance has been instrumental in keeping this work grounded to not
lose sight of the real world problems. Anirudh Krishna’s work on social capital
has been a model for me in its humanitarian application of social science and
academic rigor. I am very grateful to Greg Dees for inspiring me to come to Duke
and for being a mentor and guide all along. The notes from my discussions with
him miraculously helped guide my work even after he so unexpectedly left us
last December.
I would also like to express my gratitude to James Scriven and Ajay
Narayanan at IFC for giving me the opportunity to lead several projects on
sustainable agri-food value chains and value chain finance over the last four
years, which was not only a rewarding experience professionally but also
allowed me exposures and insights that helped enrich this work.
I met some of the most interesting people and had some of the most
thought provoking conversations of my life in the process of working on this

xii
dissertation. I am indebted to all the people, too many to name, who agreed to
talk to me and offer their thoughts and insights and those who read my various
drafts and offered comments. I am very grateful to the leaders of the producer
organizations and farmers who agreed to take time off from their busy lives to be
interviewed as part of this work. I am especially thankful to Jozsef Csurke, Janos
Szabo, Marianna Molnar, Noemi Perez, Jozsefne Mate, Peter Szucs, Helga
Takacs, Imre Gulyas, Zsuzsanna Toth Nyulne, Dr. Miklos Csikai and Pal Hodi
for their help and input.
This dissertation is dedicated to my mother, without whose help I could
have never completed this work, to my husband Karl, whose optimism and faith
in me kept me going, to my children, Kristof and Katrina, who took on
responsibilities and made sacrifices to allow me the time and space for writing,
and to the memory of my grandmother.

xiii
Table of Contents
Abstract ......................................................................................................................... iv
List of Tables .............................................................................................................. xvi
List of Figures ........................................................................................................... xvii
1. Research Problem and Gap in the Literature ........................................ 1
2. Literature Review ............................................................................................ 9
2.1 Smallholder Agricultural Producers ................................................................... 10
2.2 Globalization of Agribusiness ................................................................................ 14
2.2.1 Global Value Chains ......................................................................................................... 15
2.2.2 Concentration .................................................................................................................... 20
2.2.3 Governance ......................................................................................................................... 24
2.2.4 Private standards and certifications ........................................................................ 27
2.3 Modern markets ........................................................................................................ 31
2.4 Public Policy ................................................................................................................. 35
2.5 Aggregation and Producer Organizations: Definitions ................................ 42
2.6 Global Value Chain Actors and Their Motivation for Engaging with
Smallholders ............................................................................................................... 48
2.6.1 Consumers .......................................................................................................................... 50
2.6.2 Lead firms: Retailers/processors .............................................................................. 52
2.6.3 Traders/Wholesalers ..................................................................................................... 60
2.7 Smallholder Participation in GVCs, Barriers and Benefits of
Participation ............................................................................................................... 62
2.8 Key Aggregation Mechanisms for Smallholder Modern Market Access:
Cooperatives vs. Other Forms of Aggregation ................................................. 71
2.8.1 Contract Farming ............................................................................................................. 72
2.8.2 Agricultural cooperatives ............................................................................................. 76
2.9 Experience with Producer Participation in Aggregation ............................ 90
2.10 PO Formation and Initial Farmer Participation .......................................... 92

xiv
2.11 Farmers’ Continued PO Participation.............................................................. 96
2.11.1 Collective action, social capital, trust and collective identity ..................... 96
2.11.2 Costs and Benefits of Aggregation for Farmers .............................................. 105
2.12 PO Services .............................................................................................................. 109
2.13 Role of Finance ....................................................................................................... 115
2.13.1 History of Smallholder Finance ............................................................................ 115
2.13.2 Forms of Smallholder Finance .............................................................................. 118
3. Model of GVC Relevant Aggregation .................................................... 121
3.1 Farmer Decision about participation ............................................................... 125
3.1.1 Collective action problem .......................................................................................... 125
3.1.2 Collective Identity ......................................................................................................... 127
3.1.3 Bounded rationality ..................................................................................................... 130
3.1.4 Cost-benefit analysis and PO services .................................................................. 131
3.1.5 PO Types ........................................................................................................................... 133
4. Empirical Evidence .................................................................................... 136
4.1 Hungary........................................................................................................................ 138
4.1.1 Background ..................................................................................................................... 139
4.1.2 Data collection and methods .................................................................................... 151
4.1.3 General interview findings ........................................................................................ 152
4.1.4 Case Studies ..................................................................................................................... 155
4.1.5 Study of the 47 Hungarian Producer Organizations ...................................... 180
4.2 Central America and Peru ..................................................................................... 203
4.2.1 Background ..................................................................................................................... 203
4.2.2 Data collection and method ...................................................................................... 204
4.2.3 Analysis and discussion .............................................................................................. 207
4.3 Additional considerations and remarks related to the empirical analysis
........................................................................................................................................ 214
4.3.1 Observations about POs with the smallest average member size. ........... 214
4.3.2 Importance of Access to Finance for Competitiveness, Productivity and
G Global Value Chain Access……………………………………………………………….. 217
5. Limitations of this Research ................................................................... 231
6. Policy Recommendations ........................................................................ 233
7. Conclusions ................................................................................................... 241

xv
Appendix A: Regional Distribution of Farm Size ......................................... 243
Appendix C: Rural Poverty Trends .................................................................. 245
Appendix D: Inequality Indicators by Region .............................................. 246
Appendix E: Oxfam’s Rating of Top Brands ................................................... 247
Appendix F: History of Cooperatives and Distinct Regional
Characteristics ........................................................................................................ 248
Appendix G: Hypothetical Case of Peruvian Coffee Farmer Profit and
Loss Statement with and without Financing ................................................ 255
Appendix H: Agromantaro .................................................................................. 256
Appendix I: Financing Sources for Agriculture in Peru ............................ 258
Appendix J: Hungarian Producer Organization Requirements ............. 259
Appendix K: Map of Hungary ............................................................................. 260
Appendix L. Hungary Vegetable Statistics ..................................................... 261
Appendix M. Morakert Financial Indicators ................................................. 262
Appendix N. DelkerTESZ Financial Indicators ............................................. 263
Appendix O: Data Sources Used on Hungarian POs ................................... 264
Appendix P: FAST Information Sheet .............................................................. 266
References ................................................................................................................. 268
Biography ................................................................................................................ 2988

xvi
List of Tables
1. Waves of supermarket diffusion 33
2. Typology of smallholder aggregators 44
3. Summary of motivations for working with smallholders 50
4. Transaction cost advantages of small vs. large farms 63
5. PO services 112
6. Farmer evaluation of services 114
7. Evolution of Morakert membership and revenues 168
8. Key statistics of PO formation 181
9. Evolution of PO membership in Hungary 183
10. Summary statistics based on collective identity activities offered 190
11. Characteristics of Hungarian POs by PO type 198
12. Summary of statistically significant ANOVA results 199
13. Additional characteristics of Hungarian POs by PO type 200
14. Summary statistics of aggregators in the Central America / Peru sample 207
15. Summary statistics of cooperative and IOF POs in Central America/Peru 213
16. Conditions of market access: results for Hungary 219
17. Conditions of market access: results for Central America/Peru 220

xvii
List of Figures
Figure 1: Agri-food value chain ...................................................................................................... 17
Figure 2. Concentration effect in agri-food value chains……………………………………….23
Figure 3. GVC governance types………………………………………………………………………….26
Figure 4. Regulatory and market requirements…………………………………………………...30
Figure 5. Structure of the agri-food value chain …………………………………………………..67
Figure 6. Model of GVC relevant aggregation……………………………………………………..121
Figure 7. Distribution of farms by land size………...………………………………………….….140
Figure 8. Structure of global value chain lending to POs…………………………………….228

xviii
Dr. Miklos Csikai1: “In the globalized world our only chance
is cooperation.”
1 Quote from interview with Dr. Miklos Csikai, CEO of Arpad Zrt, largest member of DelKertesz Producer Organization.

1
1. Research Problem and Gap in the Literature
Smallholder farmers are gaining attention in the development policy
debate because of their importance in poverty alleviation, food production, food
security, women’s empowerment, conservation and climate change. Effectively
reaching large numbers of smallholders has been a major challenge for the
public, private and not-for-profit sectors alike. Producer organizations are
considered to be an important part of the solution to this challenge by helping
integrate smallholders into the global economy and are therefore widely
supported by policymakers. Nevertheless only 5-10% of farmers are estimated to
participate in formal producer organizations. Furthermore of the producer
organizations that do exist in emerging economies only a small portion has
achieved sustained integration into the growing global market of high value
agricultural products. The objective of this research is to contribute to the
understanding of this paradox.

2
Smallholder agriculture is at the center of policymakers’ attention both at
the local and international level.1 There is no example of mass poverty reduction
in recent history without significant productivity and income gains for small
farmers (Lipton 2005). Agriculture is a major employer and driver of economic
growth, and it is agriculture where growth has the most poverty-reducing
impact (Ravillion et.al, 1996). Agriculture is also major user of natural resources
– such as land, soil and water – and a provider of a variety of ecosystem services.
It is a significant contributor to global greenhouse gas (GHG) emissions, yet it
has great potential for carbon sequestration. Climate change is introducing new
urgency for small-farmer-related policy intervention as climate change induced
extreme natural events pose a disproportionate threat to some of the least
developed countries where smallholder farmers are the most vulnerable to such
events with no access to means of mitigating these risks (Fan et.al. 2013).
1 “In the coming years, agriculture will require profound changes to fulfill its multiple functions against harsher environmental conditions and demographic and market transformations. Smallholder family agriculture, or smallholder agriculture, will be at the center of these changes.” (IFAD, 2013)

3
In least developed countries where working age men migrate to cities and
abroad in the hope of finding better livelihood opportunities, smallholder
agriculture is becoming increasingly feminized (IFAD Rural Poverty report
2011). The feminization of smallholder agriculture creates a new challenge for
policymakers as women have traditionally been at a disadvantage when it comes
to access to education, technology, and financing, as well as the ability
participate in collective action and producer organizations (FAO 2010: Producer
Organisations: Reclaiming Opportunities for Development).
Finally, global food security and nutrition depends on smallholder
agriculture. Small farms currently are estimated to produce four-fifths of the
developing world’s food. Moreover they have the potential for significant
productivity increase and waste reduction (IFPRI From Subsistence to Profit,
2013), which will be essential to meet the estimated 70% increase in food demand
by 20502.
Agriculture is a sector with a history of strong government involvement
including subsidies in various forms, trade protection, and, in many countries,
2 Source: FAO How to Feed the World 2050 (2009).

4
state ownership, usually driven by social and food security concerns (Dicken
2007). In the spirit of the neoliberal economic policies of the past decades,
however, government involvement has been gradually declining (P Hazell et.al.,
2007) with emphasis shifting towards market-oriented solutions for social
problems. Promoting smallholders’ global and modern market access has
become a central objective of market-oriented development policies. Farmers
may indeed have the possibility to considerably improve their incomes by
connecting to modern3 and global value chains as potential gains associated with
increased trade and easier movement of goods and services are becoming
increasingly clear (GHI, 2013). For example in Peru, quinoa, which used to be
produced almost exclusively for domestic consumption and its production is
dominated by smallholder farmers4, has become a significant export product
contributing to improved producer income and livelihood (GHI, 2013).
These trends are greatly influenced by the decline in nation-states’ ability
to lead and enforce in the increasingly globalized economy with their activities
3 Modern markets operate based on global value chain (GVC) standards and specifications but they don’t necessarily involve cross-border trade. Modern markets and global value chains will be used interchangeably in this paper unless otherwise stated.
4 http://www.fao.org/family-farming-2014/news/news/details-press-room/en/c/223319/

5
limited to within national boundaries while social and environmental challenges
have become increasingly transnational, leading to a “governance deficit”
(Gereffi and Mayer, 2004). Therefore society has been demanding new forms of
controls (Barrientos, et.al. 2011) leading to the need for new modes of governance
and policy innovations (Mayer 2010).
The cross-border private governance of the global agri-food sector takes
place primarily in the form of coordination among firms within global value
chains (GVCs) through the use of voluntary standards.
However, modern value chains impose considerable entry barriers
through standards and other prerequisites imposed on suppliers such as
minimum quantity and various specifications. The minimum quantities that
modern buyers require from a single supplier are generally much larger than
smallholders can produce. Quality, attribute, food safety and other unobservable
credence characteristics required represent additional challenges for
smallholders.
Therefore farmer producer organizations (POs) that bulk or aggregate
farmers’ production are considered to be critical for farmers’ market access and
thus have been supported by international organizations, NGOs and

6
policymaker around the world. The importance of POs goes hand in hand with
the increasing role of value chains connecting farmers with consumers (Bijman,
Ton 2008). In many countries farmer producer organizations offer the sole
possibility for farmers to access fast-growing modern agri-food markets.
Nonetheless, successful farmer organizations are rare in less-developed
countries. Significant public funds have been invested in promoting farmer
organizations with mixed results both in terms of the number of beneficiaries
and the sustainability of those organizations (Hellin et.al. 2007).
According to Hazell, et. al (2007), smallholders are yet to find a replicable
institutional solution that helps them meet the demands of modern markets.
Empirical evidence is limited, however, on the relationship between types of
producer organizations and their ability to link farmers to modern markets.
Therefore the first intention of this work is to explore if the form of the
aggregator, in particular whether if it is organized as a cooperative, makes a
difference in aggregators’ ability to access modern markets. For this purpose this
study differentiates cooperatives, investor owned firms and hybrids of these two
forms. Cooperatives are autonomous membership organizations jointly owned

7
and democratically controlled by farmers (one vote per farmer regardless of
farmer’s size or other production characteristics), aiming to maximize the benefit
incurred to members (which can be economic, social or cultural, or any
combination thereof). In contrast, investor owned firms are controlled by their
shareholders/owners pro rata with their ownership of the company. Hybrids of
the two forms are also being discussed. Policy support has generally been
targeted at the cooperative form of aggregation
The existing literature on PO participation focuses on the formation of
farmer groups and farmer decisions about joining. Case studies and farmer
surveys shed light to farmer attitudes regarding PO participation. Some of those
studies offer evidence that services provided by POs positively influence
farmers’ decisions to participate in POs. However, we know very little about
which PO services may be most helpful in enabling POs to achieve sufficient
scale and to meet other GVC requirements, an important question considering
limited PO resources. This is a key policy question since it is common for
governments, development organizations and NGOs to support POs’ service
provision. The second intention of the present work is to add to our
8
understanding of what PO services and activities may be most useful in helping
POs grow and achieve modern market access.
A third objective of this paper is to consider the role of trust, especially as
organizations scale, and whether nonmaterial factors such as identity may be
playing a role. In particular, this study will explore whether “collective identity
narratives” and related activities may have a connection to farmers’ participation
in aggregators and aggregators’ performance.
Finally, a fourth objective is to gain insights whether there is evidence that
very small farms can be viable and whether differentiated support may be
necessary to support their ability to join aggregators and access modern value
chains.

9
2. Literature Review
This literature review will first (2.1-2.4) provide a background on the key
topics that motivate this research: smallholder agricultural producers, the
globalization of agribusiness, global value chains and modern markets and the
public policy implications of those issues. This will be followed by a more in-
depth review of the literature on the aggregation of smallholder production,
producer organizations and producer organizations’ participation in global value
chains and modern markets.

10
2.1 Smallholder Agricultural Producers
Despite considerable progress in reducing poverty during recent decades,
there are still about 1.2 billion extremely poor people in the world surviving on
less than US$1.25 a day. About two-thirds of those people live in rural areas and
largely depend on small-scale agriculture.1 Smallholder farms2 are typically
family owned enterprises producing crops and/or livestock on less than two
hectares (5 acres)3. Family members provide most of the needed labor and derive
their primary means of livelihood from the farm. According to this definition,
approx. 525 million smallholder farms exist worldwide, representing 85% of the
world’s farmers (IFC, 2013), and thought to support a population of approx. 2.2
billion (Murphy 2012).
1 IFAD website 2 The terms “smallholder”, “family”, “subsistence” or “resource poor” farms are
frequently used interchangeably. Small farmers fall into two main categories: farmers who grow food mainly for their own consumption only and rarely have surplus to sell (subsistence) and farmers who produce both for their own consumption as well as for sale (semi commercial). See more detailed segmentation of farmers in Appendices A and B.
3 There are various ways of defining smallholders, based on land size, employment patterns, etc. Land size of two hectares or less is most commonly used in the development literature and is also consistent with the World Bank’s Rural Development Strategy. Since there is no universal definition of “smallholder” farmer, the above paragraph is meant only to illustrate the scale of the problem.

11
Small farms play an important role in world agriculture (J Braun 2008)
accounting for 70 percent of global food production (ETC 2011). With global
population on the rise, demand for food is expected to double by 2030 and the
agri-food industry will need to feed 9 million people by 2050 (World Bank, 2008).
In the meantime arable land available per capita has been declining: from 0.53
hectares per capita available in 1953 to 0.25 in 2000 and an expected 0.18 in 2050.
(PWC 2012) To meet demand, therefore, either there must be an increase in land
devoted to farming or an increase in efficiency. Globally 1.5 billion hectares of
land is used for crop production with another 1.4 billion theoretically available.
In practice, however, the areas theoretically available for agricultural production
expansion are concentrated in 7 developing countries (4 of them in Sub-Saharan
Africa), many of them inaccessible or with terrain unfavorable for agricultural
production. (IFC 2012) Alternatively, given current inefficiencies, there are
opportunities for improving smallholder productivity by as much as tenfold,
through better farming practices and with the use of irrigation, basic
technologies and better seeds and inputs.
While the small farm vs. big farm debate is ongoing, evidence is growing
about smallholders’ competitive advantage in some subsectors (Hazell, et.al.

12
2014), the nonlinear relationship between land size and productivity (S.M.
Helfand, et.al. 2007), and other advantages that small-scale production can offer
such as more reliance on labor than capital, working with the existing knowledge
and skill base, and public goods like controlling out-migration to cities and
improving food security in disadvantaged areas (S. Murphy, 2012).
The importance of agriculture and small producers in particular is also
emphasized in the development field. The World Development Report 2008
called for “a new agriculture” of high-value products as an instrument for
sustainable development and poverty reduction. The report highlights the
importance of “counteracting rapidly mounting anti-smallholder biases in value
chains”, emphasizing the rise of vertical integration, economies of scale in
financing and standards and the importance of supporting smallholders’
competitiveness while pointing to aggregation as an important part of the
solution (World Bank, 2008).
Unskilled labor-intensive sectors such as agriculture have shown to have
the largest contribution to poverty alleviation (Loayza, Raddatz, 2009) with
strong evidence that agricultural growth leads to both lower poverty and
inequality (Ravallion 2010). In fact agricultural growth leads to income growth
13
in the lowest three income deciles in developing countries and is typically the
primary source of poverty reduction (Cleaver, K. 2012).
Supporting smallholders and agricultural growth therefore has risen to
high priority in the development agenda in the last few years after decades of
neglect. The United Nations declared 2014 to be the Year of Family Farms to
draw attention to their importance in poverty alleviation and sustainable
development. The European Commission has been actively supporting small
and family farms across the EU for years and is considering even more
supportive policies under the current EU presidency. FAO, World Bank, UNDP,
UDAID and numerous NGOs, just to mention a few, all have ongoing initiatives
in support of smallholders and their inclusion in modern and global value
chains. The challenges of linking small producers to international markets are
widely documented in the literature and aggregation, in particular cooperatives,
is considered as a key solution (FAO 2013).

14
2.2 Globalization of Agribusiness
Agriculture has gone through two major transformations in the last half
century. First, the mainly public-sector-governed green revolution and food
system transformation between the 1950s and 80s (Reardon, et.al. 2007) brought
about drastic changes in many countries by creating access to agricultural
innovations and technology and thus facilitating a productivity boom while
reducing the need for labor. Second, globalization, “the process of intensification
of cross-area and cross-border social relations between actors from very distant
locations, and of growing transnational interdependence of economic and social
activities” (Scherer, 2009), reorganized the agri-food sector in fundamental ways
since the 1980s. This second transformation involved an unprecedented degree
of international division of labor, consolidation and dissemination of
innovations, facilitated by the economic policies of this period. Perhaps the
greatest innovation was how transnational corporations (“TNCs”) linked
production into cross-border value adding networks while reducing their direct
involvement and engagement in primary production and processing. (Gereffi
1994).

15
While the concept of supply chain reflects material transfer alone related
to a product, value chain track the value created. Value chain “describes the full
range of activities that firms and workers perform to bring a product from its
conception to end use and beyond. This includes activities such as design,
production, marketing, distribution and support to the final consumer. The
activities that comprise a value chain can be contained within a single firm or
divided among different firms.” (globalvaluechains.org, 2011) According to
Sturgeon (2010), value chains represent a subset of production networks, the
latter being a “much more complex and dynamic set of activities” encompassed
by the entire network involved in the process of creating a product.
2.2.1 Global Value Chains
The global agrifood business has become increasingly dominated by
global value chains (GVCs)4. GVCs account for 80% of global trade and
4 Agribusiness value chain is defined by UNCTAD as “the suppliers of inputs (seeds, chemicals and machinery), farmers and other agricultural producers and service providers, processors of agricultural goods (such as manufacturers of foods and beverages), trading companies dealing with agricultural commodities, and retailers (such as supermarket chains).”

16
developing countries’ share in global value-added trade have been increasing;
from 20% in 1990 to over 40% today (UNCTAD, 2013).
In GVCs TNC lead firms5 exercise high degree of coordination
(Humphrey et.al. 2006) without direct financial exposure or ownership in
production, processing, logistics and other key activities in the agrifood value
chain. In parallel, TNCs’ focus has shifted towards marketing and brand
management.
GVCs have a direct economic impact on economic growth, jobs and
income. Domestic value added can be considerable in comparison with the size
of the domestic economy and can be an important source of economic growth
with positive correlation between participation in GVCs and growth rates of
GDP per capita (UNCTAD, 2013). GVCs can also offer an important avenue for
developing countries to build productive capacity, including through technology
dissemination and skill building. However the terms of conditions under which
5 Lead firm is a company with critical marketing, technological, or financial advantage that permits the company to set the standards or specifications for other GVC participants to follow. (Gereffi, Christensen, 2009)

17
developing country firms connect to GVCs will greatly influence the extent to
which their supports poverty alleviation (K. Fernandez-Stark, 2011).
World trade in agricultural products increased more than three-fold
between 1985 and 2005 (FAO). This growth is mainly demand-driven fueled by
affluent consumers and retail chains (J Braun 2008) and the move towards year-
around demand for horticultural products. A generic agri-food value chain is
presented in Figure 1.
Figure 1: Agri-food value chain
Source: UNCTAD, WIR 2009
18
This generic agri-food value illustrates the tightly linked activities and
processes in making food products available to consumers. It also highlights the
typically predominant position of TNCs both upstream, in making agricultural
inputs available, and downstream, in trading/logistics, processing and retailing.
Developing countries and their enterprises play a role in the value chain mainly
in the primary production stage (farming) and in basic processing that typically
happens near the production site.
Increasing demand has also been supported by fast urbanization and
rising income levels in developing countries. With the liberalization of cross-
country investment flows, international retailers have been playing an increasing
role in less developed countries, especially with the rapid diffusion of
supermarkets6, often at the expense of traditional markets (Reardon, et. al. 2007,
Csaki 2007). (See more about supermarket diffusion in Section 2.3 on Modern
Markets.)
The structure of world trade in agricultural goods has changed
considerably since the 1980s through a shift away from traditional tropical
6 For example in Central Eastern Europe, the market share of supermarkets increased from 5 to 50% in less than ten years. (Csaki 2007)

19
products (coffee, cocoa, tea, sugar, spices, nuts) towards nontraditional
agricultural products, especially horticulture (fruits, vegetables and flowers) and
seafood (Humphrey, Memedovic, 2006). Developing countries have
disproportionately taken advantage of this increasing global demand, with
agriculture’s share within the economies of many emerging economies
increasing (Braun 2008). However, most small farmers have been excluded from
these opportunities while the primary beneficiaries have been large agri-food
producers and processors strengthened through considerable consolidation in
the last 15 years (Reardon et.al. 2008).
While primary agriculture’s share in the overall global economy has been
declining, it remains significant for many of the least developed countries with
agriculture’s value added representing between 18-49% of GDP7. Once upstream
agribusiness and food industries are also considered together these agri-food
sectors can account for as much as a third of many even advanced economies
(Townsend 2008) with the upstream growth and development benefitting mostly
7 Source: World Bank Data (http://data.worldbank.org/indicator/NV.AGR.TOTL.ZS)
20
the advanced industrialized countries of the Northern hemisphere. Packaged
foods alone is a $1.4 trillion global industry (ETC 2011).
The key changes that characterize the agri-food sector’s past quarter
century have been the increasing concentration in the sector, the evolution of
buyer-driven value chains and the emergence of standards and specifications to
facilitate long distance food trade (Gereffi, et.al. 2005). The following sections
will discuss those changes.
2.2.2 Concentration
During the past two decades increasing concentration has been a key
characteristic of agribusiness value chains. Post-1970 economic policies,
including deregulation and free trade, created a favorable environment for
corporate consolidation, which was further supported by the opening of
emerging markets. As a result, in 2000, 51 of the world largest economic entities
were corporations and only 49 were countries.8 In other words 51 TNCs
exceeded the economic power of three quarters of all countries globally.
8 http://www.corporations.org/system/top100.html

21
According to the latest figures (2011), 737 firms account for 80% of the value
associated with all transnational corporations (TNCs), linked together in an
entangled web of control (ETC Group, 2011). Seventy five percent of these TNCs
are financial intermediaries such as banks and insurance companies (ETC Group
2011), leaving less than 200 TNCs in control of the bulk of real sector activities in
the global economy.
In the agrifood sector, the top 7 agrochemical companies accounted for
90%, the top 10 animal pharmaceutical companies accounted for 76% and the top
3 seed companies accounted for 53% of global sales (ETC Group 2011), with some
of the key agrochemical companies also holding major interests in seed
companies, reflecting a general trend towards combined interests in seeds,
agrochemicals and pharmaceuticals9 (Humphrey 2006). Innovation has also
become concentrated, for example, in the case of “climate ready” seeds intended
to withstand environmental stresses associated with climate change six TNCs
and their biotech partners control 77% of issued patents and patent applications
(ETC Group 2011).
9 For example Monsanto, the largest seed company in the world, is also the fourth largest pesticide company and controls more than 27% of the global seed market. (ETC 2011)

22
Concentration in processing shows a similar picture partly as a result of a
wave of mergers and acquisitions in the last few years.10 While companies
headquartered in the United States were responsible for most of the M&A
activities, Brazil followed as a close second and most of the acquisitions occurred
in emerging markets. As a result, the three largest grain trader/processors and
the ten largest animal feed producers in the world account for more than half of
their respective markets. The top 100 food and beverage firms accounted for 77%
of the global packaged food market, with the top 3 companies, Nestle, PepsiCo
and Kraft, representing 17% of that figure in 2009 (ETC 2011).
Consumer outlets have been playing an instrumental role in driving
concentration. Grocery retail spending amounted to US$7.18 trillion globally in
2009, exceeding even the size of the global energy sector (ETC 2011). Retail
concentration is linked with the fast diffusion of supermarkets around the world,
the increasing market shares of super- and hypermarkets as well as the
increasing internationalization of large retailers, including mergers and
acquisitions in emerging markets (Dicken 2007). An example of the
10 Year 2009 alone had over a 1,000 mergers in the food and beverage sector valued at $43 billion. (ETC 2011)

23
concentration effect is reflected in Figure 2. Note that in this example11 there are
only 85 “buying desks”, a category that includes the major supermarket groups
and distributors sourcing agrifood products, vis-à-vis 1.7 million producers and
278 million consumers. Some in the literature refers to this phenomenon as
“choke point”, referring to the significant concentration of market power, which
further enhanced by the concentration of ownership and market share among the
relatively few buying desks.
Figure 2. Concentration effect in agri-food value chains
Source: Gereffi, Lee 2012
11 Figure 2 reflects data from seven Western European countries.

24
2.2.3 Governance
In the increasingly concentrated agri-food GVCs, lead firms influence the
behavior of other value chain actors through their market power, without direct
control or ownership in those firms. This is achieved through value chain
governance that can take one of several forms: market, modular, relational,
captive or hierarchical (Gereffi, et. al. 2005). Market governance involves
relatively simple products and transactions and minimal coordination or input
from the buyer with price being the main governance mechanism. Modular
governance occurs when production takes place to the buyer’s specification and
codified requirements or standards become the mechanism of efficient
coordination. Relational governance involves frequent interactions and
information that is not easily transmitted, giving importance to mutual trust and
social ties. Captive governance involves many small suppliers that heavily
depend on one or few buyers and the operations of the suppliers are heavily
influenced by the requirements of the buyers. Hierarchical governance refers to
vertical integration, i.e. the lead firm producing in-house (Gereffi, 2005). These
GVC governance types are illustrated in Figure 3. It is important to note the
differences among the power asymmetry of these governance types that will

25
determine the negotiating power of value chain actors and ultimately the
distribution of rent along the value chain as Milberg (2003) found that profit
tends to gravitate to points of concentration in the value chain.
Market and hierarchical governance are the most frequently emphasized
in cross-border economic activities the former referring to buying goods from
abroad while the latter involving offshore investment in production. However
Gereffi’s framework highlights the increasing prevalence of “network” type
governance structure with considerably less obvious power relations. Network
type governance can take the forms of modular, relational and captive. In the
modular structure products are usually produced according to a costumer’s
specifications but producers take full responsibility for the production process
and knowledge is internalized in the various production modules, ensuring
some degree of power symmetry. Relational governance also has network
characteristics but it is based on trust and mutual dependence between the lead
firm and the producers and therefore the cost of switching partners tends to be
high which helps preserve some power balance. Under the captive governance
structure producers have to follow strict requirements and specifications and are
under careful monitoring and control by the lead firms due to lead firm concern

26
regarding producer competency. Switching cost tends to be high for the
producers and thus the producers’ relationship with the lead firm is
characterized by considerably higher power asymmetry than in the other
network forms.12 Captive governance is common in agrifood value chains, in
particular when small producers are involved.
Figure 3. GVC governance types
Source: Gereffi et. al. 2005
12 http://www.globalvaluechains.org/concepts.html

27
2.2.4 Private standards and certifications
The requirements and specifications imposed by lead firms are frequently
codified in the form of standards and compliance with such standards is
documented through certifications. While the use of standards and certifications
reduces the transaction cost of regulatory compliance and risk management for
lead firms, they can represent a significant barrier to smallholders’ GVC
participation, especially given the considerable up-front cost involved that
disadvantage smaller size producers due to the economies of scale involved.
TNCs have increasingly been focusing their attention on marketing and
brand management, as opposed to primary production and processing. It is
through their purchasing power and the use of standards and codes of conduct
that they govern their value chains and influence the behavior of other entities.
Private standards have proliferated along with the transformation of the global
agrifood system. These standards are developed by retailers and manufacturers
partly for compliance with tightened public food regulations as well as to reduce
the costs and risks of increasingly complex value chains (Lee, et.al 2011).
Consumer anxiety about food safety also elevated the issue of traceability.

28
Private standards are also used by lead firms to differentiate themselves
and their products. In general, retailers’ use of standards tends to be motivated
by risk management objectives while manufacturers’ use by the aim of
differentiation. Both are driven by cost reduction objectives. In addition to lead
firms’ own standards, several international private standards have also emerged.
GlobalGAP13, for example, set by 13 European retailers, is the leading
international voluntary private standard that helps link developing country
farmers to international retailers. Accredited certification bodies also certify
compliant producers.
Such standards and codes used to be mainly focused on quality, safety
and product attributes as well as requirements for suppliers to be in compliance
with applicable local laws. In general, the less product specific (as opposed to
process specific) the requirements, the less their reach is due to limitations for
13 Initiated in 1997 by European retailers (EUREPGAP), establishing a code for good agricultural practices’ (GAP) which has seen been adopted in over 100 countries around the World (GlobalGap website) and was rename GlobalGAP in 2007. Producers have to fulfil a list of technical, handling and managerial practices to guarantee quality, consistency, hygiene and safety. “Through regular inspections and the use of bar codes, a system of tight coordination is installed that enables entire supply channel information and control. Local producers have to make substantial investments for complying with these rules...” (R. Ruben, et.al. 2006)

29
monitoring. For example the size and color of a cucumber is easy to regulate
throughout the entire value chain as monitoring is reasonably easy at all stages.
Regulating permitted pesticides and other credence characteristics that cannot be
easily examined becomes more challenging and monitoring will generally
involve auditing and/or certification. This led to a shift toward process based
standards in global agrifood value chains (Humphrey et.al. 2006). Certification is
an instrument that signals compliance with standards.
Figure 4 summarizes how the move towards higher level modern markets
lead to more stringent market requirements and necessitates upgrades at the
production level. While upgrading into higher value added activities is often a
key component of policy strategies to support smallholders, it is clear that
standards impose increasing requirements at higher levels of upgrades.

30
Figure 4. Regulatory and market requirements
Source: Jaffee 2012

31
2.3 Modern markets
Through standards, GVCs increasingly influence local market dynamics in
emerging economies. With foreign ownership of processors and retail outlets in
many emerging economies, and with increasing cross-border trade and multi-
country distribution practices, local sourcing practices increasingly reflect GVC
standards and requirements. Increasingly, too, farmers need to meet those
requirements not only if they are trying to export but also if they want to supply
domestic modern markets.
The impact of GVCs has been multifaceted when it comes to local
markets. Private governance mechanisms used in GVCs have infiltrate into local
markets via trade relationships whereby lead firms requirements are being
passed on through the supply chain. Local retailers and processors with foreign
ownership often adopt standards similar to their parent company, which in turn
may be adopted by locally owned firms under competitive and other pressures.
For example in Ukraine, producers who wish to sell their products in traditional
open air markets are required to obtain a food quality and safety certificate.
Such requirements represent disproportionate burden on small producers.
Therefore even though transnational food retailers source an increasing part of

32
fresh produce from developing countries, a declining percentage of that trade is
associated with smaller scale producers (Gibbon, P. 2003).
Supermarkets have experienced rapid growth in emerging markets over
the last twenty years, displacing more traditional forms of food retail in many
countries. As Table 1 illustrates, in most of East Asia (other than China),
Northern-Central Europe and South America supermarkets started spreading in
the early 1990s and handled most of food retail by the mid-2000s. The
dissemination started slightly later in Mexico, Central America and much of
Southeast Asia and Southern-Central Europe but supermarkets nonetheless
achieved significant market share by the mid 2000s. Supermarkets are fast
gaining market share even in countries in the third wave of the supermarket
revolution such as India, China, Vietnam and Russia.
For example in India, despite restrictions on foreign direct investments,
the top modern chains had 140-fold sales growth between 2004 and 2012, albeit
from a very low level. The rapid growth of modern retail outlets is expected to
continue fueled by urbanization, rising incomes, women increasingly working
outside the home. In the third wave countries procurement system
modernization and the use of standards have become an integral part of

33
domestic modern retail much faster than observed in the prior waves of
supermarket diffusion. The growth of the modern retail sector in these countries
have also been supported by considerable domestic investment, especially in
India, and by indigenous innovations that allowed supermarkets’ penetration
into fresh produce markets and rural areas.
Sub-Saharan Africa remains the only region in the world where
supermarket diffusion is still limited.
Table 1. Waves of supermarket diffusion
Period Countries/regions Growth of supermarket
market share
First wave started in early
1990s
Much of South America, East Asia
(outside China), Northern-Central
Europe and South Africa.
From about 10 percent around
1990 to about 50–60 percent by
the mid-2000s
Second wave started in mid-
to late 1990s
Mexico, Central America, much of
Southeast Asia and Southern-Central
Europe
From 5–10 percent in 1990 to 30–
50 percent by the mid-2000s
Third wave started in late
1990s and early 2000s
Central and Southern America
(Nicaragua, Peru, Bolivia) China, India,
Russia, Vietnam
Reached about 2–20 percent by
mid-2000s; supermarket sales
growing at 30–50 percent a year
Late third wave Kenya, Zambia, Zimbabwe Share of supermarkets in
large/medium cities is 10-20%,
share of produce around 5%, rate
of growth is uncertain
Anticipated fourth wave Mozambique, Tanzania, Uganda, Angola FDI is just starting
Source: recreated based on Reardon et.al. 2008, revised based on Reardon et.al. 2009

34
The fast dissemination of supermarkets and supermarkets’ emphasis on
standards highlights the challenges faced, or soon to be faced, by many
smallholders even in their domestic markets.

35
2.4 Public Policy
Smallholder agriculture is gaining importance in the policy debate for its
importance in poverty alleviation, food security, women empowerment,
conservation, climate change mitigation and adaptation, among others.
However a key challenge for policymakers is designing and implementing
effective interventions in these areas. This is especially challenging considering
the large number of small farmers that need to be reached in remote areas on one
hand and the cross-border interconnectedness of the agri-food sector and global
character of many of its influential participants on the other.
According to IFAD (2013), agriculture will require profound changes in
the coming years “to fulfill its multiple functions against harsher environmental
conditions and demographic and market transformations, … and smallholder
agriculture will be at the center of these changes.” These anticipated changes
position smallholder agriculture at the center of policymakers attention both at
the local and international level.
Agriculture is a sector with a history of strong government involvement
(including ownership in many countries), subsidies and protectionism, fueled by
social and food security concerns (Dicken 2007). In the spirit of the neoliberal

36
economic policies of the past decades, however, government involvement has
been gradually declining (P Hazell et.al., 2007). Even in countries where
governments tried to slow the retail market reorganization through regulation,
studies have shown that such interventions had neutral or negative impact on
the relationship between producers and retailers (Juhasz et al. 2008).
Furthermore, shrinking public resources and competing priorities have reduced
government ability to directly support disadvantaged social groups. As a result,
governments are increasingly seeking market-oriented solutions to social
problems. The European Union’s Common Agricultural Policy (CAP)
demonstrates well the change in policy approach; large scale subsidies are
largely a thing of the past and the emphasis is increasingly on enabling
producers to survive in the world markets, reducing CAP’s share in the EU
budget from near 70% in the 1970s to 34% over the 2007-2013 period.
These trends are greatly affected by the decline in nation states’ ability to
lead and enforce in the increasingly globalized economy with its activities
limited to within national boundaries. This is occurring while social and
environmental challenges have become increasingly transnational, leading to

37
what Gereffi and Mayer (2004) calls “governance14 deficit”. The global agri-food
sector is governed cross-border, through private governance, via coordination
among firms within GVCs and through the use of voluntary standards. With a
growing share of the global economy organized into GVCs, the public and
private governance institutions that used to promote social upgrading and
regulated downgrading have been facing challenges which led to increasing state
and societal demand for new governance mechanisms (Barrientos, et.al. 2011).
As markets disembed themselves from one set of social control, the state and
society try to re-embed them through new modes of governance (Mayer, et.al.
2010), which has led to significant governance innovations of all kind over the
last two decades (Barrientos, et.al. 2011). Examples of this phenomenon include
government initiated public private partnerships with lead firms that promote
social upgrading in GVCs15 or lead firm initiated environmental and labor
14 Governance is defined by Mayer and Pickles (2008) as “societal institutions that constrain or enable market actor behavior whether these are at the level of the state, civil society actors, or industrial and business groups involved in changing their supply chain dynamics.” 15 Such as the United Nations Development Program (UNDP) facilitated National Platform for the Responsible Production and Trade of Pineapple in Costa Rica. UNDP facilitates such multi-stakeholder efforts, centered around the lead firms of key global value chains, at the request of, and in close coordination with, the member government.

38
requirements in supplier codes of conduct in excess of local government
requirements.
While public governance has weakened, there are limits to the
effectiveness of private governance efforts. Most corporate codes of conduct are
vague and most companies do not comply with the standards of third sector or
international organizations (Mayer et.al. 2010). Mayer et al. proposed that
private governance effectiveness depends on the structure of the GVC involved,
the degree to which brand identity is important for a firm’s products, the
possibilities for collective action to exert pressure on the producer; and the extent
to which the lead firm’s commercial interest is aligned with social or
environmental concerns (Mayer et.al. 2010). Furthermore, Mayer et al predicted
increasing role for government, in particular in the form of multi-stakeholder
institutions, such as the Costa Rican example mentioned in footnote 19.
It is in the midst of this shift in global governance that national
governments, development organizations and NGOs are trying to tackle the
problems of rural poverty, effecting billions of people in mostly remote areas.
Policymakers and the development community face the critical question of how

39
to address the changes faced by small farmers whose already fragile livelihoods
are being further jeopardized due to changes in agri-food markets.
Policymakers and development organizations such as national
governments, OECD, UNDP, ILO, World Bank, USAID as well as NGOs have
identified supporting the formation of producer organizations (POs) as central to
the strategy for improving the lives of small farmers (WIR 2009). The emphasis
by these organizations has been mainly on promoting “marketing cooperatives”
to enhance farmers’ negotiating power with both suppliers of input as well as
buyers and allows the sharing of transaction costs.16 Such policy initiatives
focusing on “making markets work for the poor” involve a shift from
government playing a direct role as buyer or seller in markets to providing rules
for the creation of effective institutions (Ton, 2008).
Outlining recommended public policy interventions with the goal of
promoting farmer collective action for market access, Markelova et al. (2009) of
16 The UN suggests (UN 2012) that one solution to the decades of neglect of the rural economy is to “encourage farmers to mobilize collectively in agricultural and marketing cooperatives that engage in the production, processing and marketing of agricultural products and give them access to markets”.

40
CGIAR CAPRi17 emphasize that farmers need rural infrastructure, extension
services, credit markets accessible for the poor and access to relevant information
in order to compete. In addition, Markelova et al. (2009) recommends that
governments create incentives for farmer collective marketing cooperation along
with technical and human capacity building programs. Another
recommendation was to involve an “enabling facilitator” that facilitates collective
action around marketing through the provision of information, technical
assistance and capacity building. The enabling facilitator may be the state, NGOs
or the private sector as long as it can effectively facilitate farmers’ access to
services.
Neven, Woolverton and Okello (2012) provided a helpful categorization of
the public role in farmer collective action by differentiating the “pull” and
“push” models. The traditional role played by governments and donors is
referred to as the “push” model, whereby government or donors drive the
formation of producer groups and provide most of the management, operational,
strategy and marketing guidance, with strong reliance on subsidies and grants
17 Consultative Group on International Agricultural Research Systemwide Program on Collective Action and Property Rights.

41
and fixed projects terms. The “push” model’s underlying philosophy is to use
public resources to demonstrate to farmers the value of producer organization
and they will eventually adopt it as their own.
Neven, Woolverton and Okello’s “pull” model involves donor or
government as facilitator between producers and agribusiness, whereby the
donor provides basic support like training which may change over time
according to the evolving needs of the farmers. It is primarily the producers and
agribusiness (offtakers) that shape the collective action model.
With the above outlined shift in policy towards more market-based
solutions as opposed to direct interventions, the challenge is how to improve the
workings of the markets for outputs, inputs and financial and other services to
address market failures (Hazell et.al. 2010). According to Hazell et al. this
challenge calls for more innovation in institutions and in multi-stakeholder
collaboration among farmers, the private sector, NGOs and the public sector.
42
2.5 Aggregation and Producer Organizations: Defini tions
There is considerable inconsistency in the literature when it comes to
definitions and typology of aggregation and key related concepts. This chapter
summarizes those ambiguities and outlines the definitions that will be used in
this work.
Schmidt et.al. (2011) define aggregation as “aggregating products from
multiple farms.” According to Ashoka18, as small farmers often struggle to
sustain income because they lack scale and knowledge, the solutions lie in
developing strategies that aggregate information, knowledge, and products in
ways that better equip farmers to compete in a fast-changing marketplace.
Aggregation for some means producer initiated producer organizations, for
others buyer driven contract farming (IFC 2013) and again for others both
(Monitor 2012, KIT 2012).
Vorley, et.al. (2012) takes the latter comprehensive approach (See Table 2),
focusing on the smallholder aggregation aspect regardless of what value chain
entity drives the aggregation. Vorley’s typology distinguishes among producer,
buyer and intermediary driven aggregation. The predominant form of producer
18 Ashoka Aggregation Platform Website: http://farming.ashoka.org/aggregation-1.

43
driven aggregation is cooperatives but Vorley et al. also includes other forms of
democratic farmer driven and owned organizations such as informal associations
and clusters around lead farms (or “nucleus farms” as later referred to in this
paper). Intermediaries can be market actors like traders and wholesalers or
support entities like NGOs or government in his typology. While distinguishing
intermediary driven aggregation efforts is helpful, it is important to highlight
that those usually occur in close collaboration with either the producers or the
buyers and therefore intermediary driven aggregation does not exist in a pure
form.19
19 For example state mechanisms, depending on the design of the intervention, can be either related to buyer-driven or producer driven. For example Cocobod, Ghana’s state-owned marketing monopoly for cocoa or the Kenya Tea Development Agency which by law integrates smallholders, is an example of the state stepping in in a buyer capacity. In the case of the Indian dairy cooperative Amul, the state intervened on the producer side, organizing a multi-tier producer cooperative.

44
Table 2. Typology of smallholder aggregators acccording to Vorlet, et.al.
Source: Vorlet, et. al. 2012
Another classification used in the literature involves cooperatives vs.
“investor owned firms” or “IOFs”. Buyer driven aggregation tends to happen
via IOFs and producer driven aggregation traditionally has been mostly through
cooperatives (or similar producer driven democratic organizations) and therefore
the cooperative-IOF typology used to align well with the producer driven-buyer
driven dichotomy.
However, examples of IOFs becoming more common among producer-
driven models, including as a result of cooperatives changing their legal
structure to IOFs, the IOF-cooperative typology offers an additional lens for
analyzing aggregators. Conversions from cooperative to IOF have been

45
increasingly common over the past 20 years (Kispal-Vitai, 2013) coinciding with
the era of globalization and increased concentration in the agrifood sector. Some
of the existing scholarship focuses on the examination of the financial
performance of cooperatives vs. IOFs mostly in industrialized countries, findings
showing a mixed picture (PWC, 2012, Fulton et.al. 2001, Lerman et.al. 1990)20
However important to highlight that the studies that concluded superior, or at
least not inferior cooperative performance, were based on data from the 1970 and
80s. More recent studies found superior IOF performance.
Some in the literature (IFC 2012) uses “aggregation” synonymously with
contract farming and buyer-driven efforts of sourcing from smallholders in
general (buyer-driven efforts almost always take the form of contract farming).
This reflects the increasing attention on the role that buyers can play through
inclusive sourcing. However, the need to achieve higher level of farmer
organization through farmer groups is one of the key constraints frequently
highlighted in this context (IFC 2012). This is the case in general for contract
farming; contract farming favors larger suppliers or already organized
20 Author found one study that examined something other than financial performance for cooperatives vs. IOFs/buyer driven aggregator; Basurto et.al. (2013) finds cooperatives to be more conducive to conservation behavior among small scale fisheries.

46
smallholders (more on that in Section 2.8.1) Nonetheless, if and when buyer-
driven aggregation of smallholders occurs, it usually takes the form of contract
farming.
Another key concept for this paper, “producer organization” (PO), also
has considerable definitional ambiguity in the literature.
Most in the literature consider POs to be a key form of aggregation.
However, there is inconsistence when it comes to the meaning of POs.
According to the FAO (2007), POs are non-governmental, membership-
based rural organizations of smallholders, family farmers, pastoralists, artisanal
fishers and other small entrepreneurs that range from formal groups, such as
cooperatives, to looser self-help groupings and associations. This definition
represents a subset of Vorlet’s “producer driven” category and falls under
cooperatives in the cooperative-IOF dichotomy. FAO’s definition with its focus
on “membership based” organizations and cooperatives is also echoed by many
NGOs and other intermediary organizations active in supporting the formation
of POs, and often the terms PO and cooperative are used synonymously.
In contrast, the European Commission (EC 2011) defines POs as
organizations formed at the initiative of producers but can take any legal form.

47
Therefore the European Commission PO definition is synonymous with Vorlet’s
“producer-driven” category irrespective of whether POs take the form of
cooperatives or IOFs.
This paper build on both Vorlet’s typology as well as on a modified
version of the cooperative-IOF distinction, proposing a third, “hybrid” category
in addition to cooperatives and IOFs later in this paper. This work will use the
European Commission’s definition of POs, which permit any legal form as long
the organization is producer initiated. This paper considers contract farming a
key mechanism in buyer-driven smallholder engagements and one that can help
create an incentive for smallholder organization due to the market security it
offers, but not necessarily an aggregation mechanism in and of itself. Both
cooperatives and contract farming are discussed in depth in sections 2.8.1 and
2.8.2.

48
2.6 Global Value Chain Actors and Their Motivation for Engaging with Smallholders
What is the motivation for value chain actors to source from smallholders
and their aggregators? The objective with this section is to illustrate that there is
considerable benefit for GVCs to engage smallholders but lack of smallholder
aggregation is a key barrier.
Different stakeholders involved in the agri-food value chain have different
considerations for wanting or not wanting to engage with smallholder. The
structure of a value chain, in particular the degree of concentration along the
chain and the governance characteristics, determine the general conditions faced
by smallholders (Lee, Gereffi 2012). In addition, key value chain actors have
some motivational considerations that will influence their approach towards
smallholder inclusion in the value chain.
Table 3 summarizes the key value chain actors and their considerations for
and against sourcing from smallholders’. Consumers, at the bottom of the value
chain, are increasingly conscious of ethical consumption and demand inclusive21
value chain management from brands and retailers. (Poulton et.al. 2010)
21 “Inclusive” value chain refers to being inclusive of smallholders.

49
Therefore retailers, processors and manufacturers alike are increasingly looking
for ways to achieve inclusive value chain recognition at least on some products
and those are used extensively for the purposes of enhancing brand reputation.
These are the value chain actors that drive changes via their influence in the
value chain governance structures, including shifts in sourcing from
smallholders, even though they rarely source from smallholders directly.
Finally, traders and wholesalers, the value chain actors that directly enter into
transactions with smallholders and their aggregators and therefore bear most of
the associated transaction cost and supply chain risk, may be motivated by a
number of factors. Smallholders and their aggregators often have more limited
marketing options and therefore may be in weaker negotiating position against
traders and wholesalers than their competitors. At times smallholders and their
aggregators may offer the opportunity for diversification away from other
suppliers. In other cases the primary production is dominated by smallholders
(such as coffee, cocoa and milk in some countries) and wholesalers and traders
have no other option but to find a way to purchase from them. The rest of this
section will provide a more in-depth analysis of the value chains actors who
create the demand for smallholders and their POs.

50
Table 3. Summary of motivations for working with smallholders
IN FAVOR OF AGAINST
TRADER/WHOLESALER Higher rent due to information
asymmetry and limited
farmer/aggregator marketing
channels, diversification, no
alternative, community
considerations
Transaction cost
PROCESSOR/ MANUFACTURER
Brand image, reputation, product
differentiation, diversification of
sourcing
Transaction cost, supply
chain risk
RETAILER Brand image, reputation, product
differentiation, public pressure Transaction cost, supply
chain risk
CONSUMER Increasing ethical consumption,
“feel-good” effect Higher price tag,
traceability
2.6.1 Consumers
Consumers, especially in the global North, have been attaching increasing
importance to quality and safety, accompanied by greater willingness to pay for
those attributes (Poulton, et.al. 2010). Food safety standards have become
increasingly important in global agri-food value chains, progressively pervading

51
both domestic and international trade, putting smallholders at a competitive
disadvantage22 (Henson, et. al. 2009).
Globalization has unleashed social pressures that demand greater and
more effective governance (Gereffi, Mayer 2004) and most of the progress in
global retailers’ and brands’ move towards more socially responsible behavior
has come as a response to, or in anticipation of, social pressures (Mayer, Gereffi,
2010). On one hand this trend manifests itself in increasing demand for
sustainably produced and fair trade goods23 and consumers are holding large
brand names (including retailers) responsible for environmental and social
problems in their value chain. On the other hand increasing social interest and
demand for fair trade (and other certified “sustainable” products) also led to
cooptation by corporations with considerable economic interest in the increasing
demand (Jaffee, 2009). The widespread use of cell phones and social media both
22 The smallholder disadvantage is two-fold: first, the “cost of maintaining the integrity of its controls” is higher in value chains involving smallholders and second, some of the costs are imposed on the producers whereby smallholders are at a disadvantage absorbing such cost due
to their size. (Henson, et. al. 2009)
23 Fair trade market averaged growth of over 40% (Jaffee et.al., 2009)

52
in the global North and South have created strong momentum for consumer
advocacy and activism for smallholders.
2.6.2 Lead firms: Retailers/processors
From the perspective of lead firms in GVCs, sourcing from smallholders
involves increased transaction costs and supply chain risks arising from their
small size and the challenges and cost of monitoring compliance with certain
requirements. At the same time sourcing from smallholders can have
considerable benefits both in terms of sourcing diversification and brand
reputation. POs and their services are critical both for reducing transaction cost
and mitigating supply chain risks.
Lead firms in GVCs tend to “prefer fewer, larger and more modern
suppliers” (Swinnen 2009). Reflecting this trend is the observed “scale-dualism”.
This involves the exclusion of small farmers in case companies have the option of
sourcing from large farmers, a phenomenon that has been documented in several
case studies (Reardon et.al. 2009). Small farmers are at a disadvantage because of
transaction cost constraints, limited access to information (USDA, 2008) and
concerns over noncompliance and contract enforceability (Regoverning Markets

53
2008, Bakucs et.al. 2007). As an example, the World Bank’s “Facilitating the
Access of Small-scale Producers to High-Value Market” research program, which
included a survey of fruit and vegetable exporters who together accounted for
about 88% of Sub-Saharan Africa’s trade (outside South Africa), revealed that the
number of smallholders that directly supplied the respondent firms significantly
declined during the period reviewed (2002-2007).
Nonetheless, many lead firms are increasingly looking for ways to at least
partially source from smallholders. For example the above World Bank study
found that many exporters refined their procurement system to better
accommodate direct sourcing from smallholders, in particular for highly labor-
intensive crops (Jaffee, et.al. 2012).
One consideration in favor of sourcing from smallholders is that large
producers tend to have several market options and therefore have stronger
negotiating position and can pursue alternative sales channels more easily, as
case studies found with the tomato value chain in Chile and dairy value chain in
Poland. Another consideration is smallholders’ competitive advantage with
highly labor-intensive crops, which can offset the risks and transactions costs of
sourcing from smallholders. This advantage has been illustrated by several case

54
studies on large Guatemalan exporters who switched from their own production
to contract farming with smallholders (Reardon et.al. 2009).
The findings of a survey of modern retailers in Hungary (Kerteszet
8/30/11) illustrate this dichotomy of sourcing from smallholders. The survey
found that in the buyer driven fresh fruit and vegetable value chain direct
sourcing from small producers24 by multinational retailers represented less than
5% with a single exception of 15%. Domestic retailers’ sourcing rate from small
producers was only slightly higher with one outlier at 40%. The survey also
revealed that retailers only source directly from small producers when (i) crop
involved is of small quantity and value (for example herbs); (ii) crop involved is
highly labor intensive and can be best produced on family farms (for example
raspberries, mushrooms and salads); (iii) product targets special niche (regional
specialties, for example); (iv) there is fragile produce involved where freshness is
key. The survey found that retailers’ needs were not satisfied in these areas
because they could not find enough suppliers who met their requirements. The
survey also revealed that retailers try to encourage small producers to join
24 Direct supplying small producer was defined by retailers as those supplying a value of less than 100,000 Ft (approx. $5,000) per day or less than 10 mio Ft (approx. $200,000) per year.

55
producer organizations as a way of improving the efficiency of the market and
their ability to source from smaller producers via aggregators.
Overall, lead firms have several considerations to evaluate when it comes
to the inclusion of smallholders in their supply chain.
With increasingly stringent food security rules and policies, agri-food lead
firms need to be able to trace the movement of products in their entire supply
chain and need to have systems in place to ensure compliance with rules and
policies at every stage of the supply chain. While many of the traceability related
obligations are pushed up the value chain by lead firms, lead firms need to be
able to monitor compliance. Small farmer often lack the resources and expertise
to implement the necessary systems and the more small farmers are involved in
the value chain, the more challenging and expensive such monitoring can be. In
addition, the cycle of negotiations, contracting, accepting of deliveries, record
keeping and book keeping with smaller suppliers adds to the transaction cost of
lead firms that is why many avoid direct relationship with smallholders.
Smallholders in the value chain can represent supply chain risks. Due to
their small size and often lesser sophistication than their larger counterparts, the

56
risk of their noncompliance with relevant rules or failure to deliver expected
quantities and quality is considered higher than their larger counterparts.
Smallholders’ size and the inherent diversification within a pool of smallholders
suppliers can mitigate some of that risk, however. Relevant PO services can play
an important role in institutionalizing that diversification, reducing the above
transaction costs and mitigating the supply chain risks.
Sourcing strategy and reputational considerations can further offset the
costs of working with smallholders.
With global demand for food increasing, some TNCs face significant
constraints when needing to source increasing quantities. Increasing sourcing
from smallholders is an obvious strategic option for many TNCs: it helps
increase the supply base while achieving even greater increase over time through
significant opportunities for smallholder productivity improvement while
supporting the diversification of the supply. Danone, for example, recognizing
that 80% of the global dairy production is in the hands of smallholders with the
potential to increase capacity several-fold with the appropriate animal
husbandry techniques, was one of the early movers in the area of proactively
developing a smallholder supplier base. Danone’s greatest challenge is that over

57
90% of dairy farmers in less developed countries are not organized into
aggregators. Through the Danone Ecosystem Fund, Danone is seeking to
support dairy production and to improve living conditions and incomes of small
dairy farmers. Danone Ukraine partnered with Heifer (NGO specialized in rural
community development) with the aim of creating 20 dairy cooperatives in order
to strengthen small dairy producers in regions close to Danone production site.
(Danone Ecosystem Fund website). As this example illustrates smallholders can
play an important role in some TNCs strategies’ for meeting their long term
sourcing needs and therefore they are willing to invest in smallholder
aggregation and capacity development. 25
25 While it is the TNCs’ motivation to purchase the smallholders’ production in the long run, it can take years before the smallholders are able to produce the quality and attributes required by TNCs. TNCs’ usually needs to secure alternative offtake in the interim in order to ensure sufficient incentive for farmers to carry through with their commitment. A good example is the Pepsico supported chickpea production in Ethiopia. Ethiopia is one of the world’ leading chickpea producer and Pepsico was looking to secure new supplies for it hummus brand, Sabra. Ethiopian chickpea production is predominantly smallholder based whose production is both highly inefficient and unpredictable. Therefore Pepsico set up a program to help improve the productivity and quality with the aim of sourcing from Ethiopia in the medium term. In the meantime, however, Pepsico Foundation partnered with the World Food Program (WFP) and the United States Agency for International Development (USAID) to set up a factory for manufacture nutrition biscuits for the WFP using chickpeas produced by farmers in the Pepsico initiative.

58
In addition to the supply strategy and diversification benefits of
smallholder engagement, such inclusive value chain strategies are increasingly
desired by consumers and are often part of firms’ corporate social responsibility
strategy and benefit their brand image. Fueled by growing recognition of the
slow progress made in the area of rural poverty alleviation, the increasingly
difficult conditions faced by smallholder farmers who represent a significant
portion of the global poor, and assisted by the fast development in
telecommunication technology and social media as well as NGO strategies
attempting to raise awareness, TNC agri-food brands and retailers have found
themselves at the center of the rural poverty discourse. For example, Oxfam
America decided to focus on some of the largest agrifood TNCs after the 2008
food crisis, to explore what impact these companies’ supply chains had on
farmers who own less than 2 hectares of land. The report (Oxfam, 2013) also
investigated the social and environmental policies of the ten largest food and
beverage companies and stated in a press release that these companies are
“failing millions of people in developing countries who supply land, labor, water
and commodities needed to make their products”; not because of exploitation
but because of their exclusion. The ratings of the Oxfam report are summarized
59
in Annex E along with the latest ratings available on the Oxfam website to
promote heightened consumers awareness around these issues.26
Information technology and social media together with increasing
consumer awareness have enhanced brands’ reputation risk just as brands have
become TNCs’ most valuable assets. In addition, reputation risk may also lead
to legal risk as informed and activist consumers especially in the global north
may pursue legal cases against lead firms and brands as the case of Whole Foods
Market Inc. illustrates (see footnote27).
Aggregation remains a key constraint for lead firms to take advantage of
the opportunities offered by smallholder engagement since sourcing from
farmers organized into groups carried considerably lower transaction cost and
26 Noteworthy is Oxfam’s announcement at the time of the report’s release in February 2013 to focus its first campaign on the cocoa value chain and the treatment of female workers, and the subsequently improved performance of Nestle, Mars and Mondelez (owner of Cadbury) on their “Women” score.
27 In 2011 a judge in Florida allowed a lawsuit by nonprofit Southeast Consumer Alliance to proceed claiming deceptive trade practices based on Whole Foods’ sale of organic frozen vegetables from China. The vegetables were grown by a Chinese state owned company that employed prison labor in a highly polluted region where polluted surface water was used for irrigation, while the organic certification was issued by another Chinese state entity.

60
supply chain risk then sourcing directly from tens if not hundreds of thousands
of smallholders.
2.6.3 Traders/Wholesalers
Local traders and wholesalers often take advantage of information asymmetry,
smallholders’ lack of transportation and lack of access to capital when buying
smallholders’ products at the lowest possible prices, leading to trader margins as
high as 50% in some markets. Most traders and wholesalers are less concerned
about CSR and reputational benefits of smallholder engagement for their own
behalf but rather at the demand of lead firms. However, some GVCs such as
coffee and cocoa (where smallholders are responsible for the majority of global
production and therefore buyers have few alternatives for sourcing) have been
working closely with smallholders in a manner similar to brands and retailers, in
order to help secure stable long-term supply.28 Mujawamarija et.al. (2013)
28 Cacao trees grow in a limited geographical zone, of approximately 20 degrees to the north and south of the Equator. (Wikipedia) Ghana and Ivory Coast together account for 60 per cent of the world’s cocoa supplies. However, poor returns for farmers and declining productivity due to aging cocoa trees and climate change are threatening cocoa supply whereby the industry is predicting a 1 million tons “cocoa deficit” in 2020 while demand is increasing due to growing global demand for chocolate. (FT) Armajaro, an international cocoa trader, is working with other

61
observed preference among coffee farmers in Rwanda to sell to local traders
rather than cooperatives based on established relationships after repeated
transactions of credit and basic consumption items with the traders. Interviews
carried out for this work also revealed strong social ties between smallholders
and traders that belong to the same community.
stakeholders with the help of the Gates Foundation to promote farmer aggregation, capacity building and tree rehabilitation. ECOM, a major international coffee trader, has been managing similar programs with the help of capacity building NGO, Hivos. Similarly, ECOM embarked on the Voice of the Coffee Farmer project with the aim of better understanding farmer behavior and preferences and how ECOM can increase volume, improve quality and reduce volatility in its supply chain.

62
2.7 Smallholder Participation in GVCs, Barriers and Benefits of Participation
GVC participation can have considerable benefits but smallholder farmers
face significant barriers when it comes to supplying modern markets.
Modern market participation can increase smallholder income in several
ways. Participation in high-quality supply chains increases the potential for
surplus to be generated for the producers. Another form of premium may
benefit farmers that buyers may agree to pay in order to prevent side-selling
especially when contracts are difficult to enforce.29 Endogenous technology
transfer in value chains make productivity improving solutions available to
farmers and in turn help increase income. Finally, vertical coordination can help
overcome smallholders’ constrained access to inputs and better quality inputs
lead to better risk management, improved productivity and higher profitability
(Swinnen, et.al. 2009). Therefore linking smallholders to modern value chains
29 In general potential surplus refers to the premium potential of more affluent modern markets and export oriented crops in comparison with crops produced for local and traditional markets. An alternative form of premium relates to what buyers may incorporate in contracts in order to secure the loyalty of producers and prevent side-selling (see Section ? for more detail.)

63
can be an important element of building their resistance to shocks and improving
their productivity and livelihoods (Fan et.al. 2013).
Although small farmers often enjoy quality and productivity advantages,
mainly attributed to motivated and flexible family labor (IFC 2012), they are at a
disadvantage in most other areas important to meet the needs of modern
markets. As Table 4 illustrates, smaller farms are at a disadvantage when it
comes to transaction costs related to skilled labor, market and technical
knowledge, input purchases, obtaining finance and capital, accessing output
markets, compliance with product traceability and quality assurance
requirements and risk management.
Table 4. Transaction cost advantages of small vs. large farms
Source: Poulton, et.al. 2010

64
Unless smallholders can satisfy these modern market requirements they
will be excluded from expanding market opportunities, both domestic and
international (Kaplinsky, et.al, 2008). The fixed costs of adopting and
maintaining compliance with modern market requirements and the related risks
can be considerable and thus can disadvantage smaller producers (Ellis and
Keane 2008).
When it comes to the barriers to modern market access, the limited
existing literature puts primary importance on privately held assets (such as
livestock, soil quality, productive technologies, etc.) ahead of institutional and
infrastructure deficiencies (Barrett 2008, Boughton et al., in press; Cadot et
al.,2006; Minten and Barrett, submitted for publication). Farmers need various
forms of technology and inputs to meet modern market requirements such as
relevant information, agricultural production technology, information
technology, irrigation, fertilizers, herbicides, management, technological and
administrative skills. In addition, because selling to these global value chains
often does not result in immediate payment, unlike traditional wholesale
65
markets, access to credit and the ability to manage credit and financial flows
become important parts of farming (WIR 2009).
These requirements are challenging for individual smallholders to meet.
Compliance with standards usually requires information, financial investment
and access to networks (Lee et.al. 2012). The adoption of standards has
economies of scale that puts smallholders and a disadvantage. Some studies
found that the introduction of standards can discourage smallholders’ GVC
participation. For example the decline of smallholder participation in the
Kenyan green bean industry from 60 to 40% of output is attributed to the
introduction of stringent food safety standards (Narrod et.al. 2009).
Some argue that certification, especially for smallholders and their POs,
can offer the opportunity for value chain inclusion, which is why many
development programs focus on certification (Jaffee et.al. 2012). However
certification is often a considerable economic task for smallholders and can be
challenging to maintain without external support (Jaffee et,al 2012). In fact the
cost of certification can outweigh the benefits for smallholders because auditing
and certification have strong economies of scale (IFPRI, 2008).

66
Modern markets also frequently specify the types of inputs farmers have
to use (seeds, fertilizers, etc.) reducing the bargaining power of farmers with
their suppliers. Therefore the “danger is that the requirements of global value
chain will undermine the cost advantage enjoyed by small farmers and require
capabilities that they cannot offer.” (Humphrey 2006).
There is considerable variation, however, in the requirements of various
value chains, which can significantly influence the benefits of participation for
smallholders. Lee and Gereffi (2012) helped make sense of the variations
through a classification of different value chain structures, which apply both to
global and local value chains. They showed how differences in lead firm and
market concentration characteristics lead to different requirements, incentives
and implementation capacity and thus variations in outcomes for smallholders.
They distinguished between concentrated and fragmented chains on two
dimensions – food retail and food production – to create a two-by-two
classification as shown in Figure 5.

67
Figure 5. Structure of the agri-food value chain (Source: Lee, et. al. 2012)
Supported by case study evidence, Lee et.al. concluded that buyer driven
chains and producer driven chains offer distinct opportunities for smallholders
while bilateral oligopolies are the least beneficial to small farmers because of the
strict requirements and direct control involved. Traditional markets offer
smallholders the greatest autonomy but also the least support for upgrading and
improving profitability according to the authors.
Compared to traditional markets, GVC participation generally involves
contracts that usually lower market risk but the bargaining position of small
farmers tends to be weak considering the large, often multinational, buyers

68
involved. Accordingly, the share of retail revenues passed down to producers
has been declining in many agricultural sectors. For example coffee growers
have seen their share of the retail price shrink from about a third in the early
1990s to 10% in 2002, despite a doubling of sales during the same period (WIR
2009).
Contracts, however, do not always reduce market risk. Case study
evidence suggests (which was also confirmed by interviews carried out as part of
the present work) that in some value chains TNCs breach contracts frequently,
especially related to pricing (Regoverning markets, 2008). Prices in those cases
are either not set until a few days before delivery (or even past the delivery date)
or the price set in the contract is unilaterally modified by the buyers. On the
other side, modern market contracts can also be challenging to enforce against
smallholders. This is a particularly important problem because of the prevalence
of “side-selling” among smallholders.
Side-selling involves the farmer selling crops to a third party in violation
of a preexisting contractual obligation with the buyer. Motivation for side-
selling typically involves either a market price that is more favorable than the
pre-set price or more favorable payment terms, such as immediate payment as

69
opposed to delayed payment that characterize most modern contracts (Fischer
et.al. 2011). Side-selling involves a two-fold problem for buyers. First, it
undermines quantity commitments and ability to plan for the buyer to meet its
own obligations. Second, side-selling typically involves the highest quality
product (that’s where farmer can get highest premium compared to contracted
price), which in turn deteriorates the average quality of the products sold to the
buyer (G. Mujawamariya, et.al. 2013).
Even if opportunities for directly supplying modern markets may arise,
meeting modern market buyers’ quantity, quality (standards) and product
specifications (asset specificity) requirements pose considerable costs and
challenges to small farmers (Reardon, et.al. 2005). As a result many small
farmers find it difficult not only to become but also to remain suppliers of
modern value chains (Poulton et.al. 2010, Reardon, et.al. 2005, Maertens, et.al.
2007).
Due to the above entry barriers, lead firm driven strategies to link large
number of smallholders to standards based markets have been more successful
than producer initiated bottom-up efforts, as evidenced by a survey of fruit and

70
vegetable exporters who accounted for 88% of Sub-Saharan Africa’s fresh
horticulture trade30 (Jaffee et.al. 2012). Lead firm initiated approaches are driven
by the needs of those lead firms and are typically in the form of contract farming
schemes.
Another conclusion drawn by the same study was that producer exclusion
from some standards driven value chains may be preferable to the high financial
risk that accompanies inclusion in those value chains primarily due to the higher
investments required.
To overcome some of the challenges associated with modern market
access, smallholders may participate in some form of aggregation. In fact
production organized based on GVCs and production networks, governed in
part through the use of standards, has increased the need for farmers to be
organized in order to be included in modern market trade.
30 Part of the “Facilitating the Access of Small-scale Producers to High-Value Markets” World Bank study.

71
2.8 Key Aggregation Mechanisms for Smallholder Mode rn Market Access: Cooperatives vs. Other Forms of Aggr egation
Aggregating the production of smallholders can help achieve economies
of scale, meet the standards and requirements of modern markets and address
other barriers of modern market access (IFAD 2009). It is often encouraged by
value chain lead firms for whom the lack of smallholder organization is a key
barrier to sourcing from smallholders31.
Aggregation can take various forms as discussed in Section 2.4.
Cooperatives have represented the predominant form of producer driven
aggregation and are most widely supported by policymakers. Contract farming,
while not necessarily an aggregation mechanism due to its favoring of larger
producers and organized smallholders, is the key form of buyer-driven
smallholder engagement and thus the mechanism used by Investor Owned
Firms (IOFs).
This section of the literature review will focus on contract farming, as the
main means of smallholder value chain integration by IOFs, and cooperatives,
31 Hungarian retail survey results (Kerteszet 8/30/11), conference remarks by Armajaro and ECOM (cocoa and coffee traders) at Rainforest Alliance Sustainable Value Chain Roundtable (2012).

72
the most common form of producer and third party initiated form of
aggregation. The literature on the role of cooperatives vs. IOFs aggregators in
smallholder modern market access is very limited. The author could identify
only a single work that looks at hybrids of cooperatives and IOFs. Ortmann et.al.
2006 concluded based on evidence from 2 case studies in South Africa that both
IOF and cooperative forms of aggregation have considerable strengths and
weaknesses and some hybrid form of the two is best positioned to enable
smallholders’ modern market access32.
2.8.1 Contract Farming
Contract farming can be defined as a system for the production and supply of
agricultural products by producers under advance contracts, the essence of such
arrangements being a commitment to provide an agricultural commodity of a type
(quality/variety), at a specified time, price, and in specified quantity to a known
buyer. The contracts could be of various types ranging from procurement contracts
under which only sale/purchase conditions are specified to contracts under which
32 Other studies comparing IOFs with cooperatives focus mainly on governance and some on productivity considerations.

73
the contracting firm supplies and manages all the inputs for the farm (including
extension services and financing) and the farmer becomes just a supplier of land and
labor (Bijman, 2008).
Production based on advance contracts and specifications is becoming
increasingly common under GVC conditions. Even the well-established Dutch
agricultural auction system is in decline with the shift towards advanced contract
based transactions (Sandor, et.al. 2011). Contract farming is also playing an
increasing role in many developing countries due to the desire of retailers and
manufacturers to establish vertical coordination for control and risk
management. While the welfare impact of contract farming continues to be
highly contested, multiple studies have demonstrated the positive impact effect
of contract farming for smallholders. Bellemare (2012) found 10-16% increase in
income and 15% decrease in income volatility among smallholders that
participated in contract farming in Madagascar. Wainaina (2012) found a 27%
income increase among Kenyan poultry smallholders participating in contract
farming. Others have documented welfare gain from participation in contract
farming as a result of risk reduction and transaction cost savings (Hennessy 1996;
Martin 1997; Gray and Boehlje 2005; Key 2013).

74
On the negative side, the challenges of contract enforcement and unequal
bargaining power between producers and buyers is also widely documented
(Kherallah, 2001).
Barrett et.al. (2010) contributed to a more nuanced understanding on the
subject by demonstrating the importance of geographic placement effects. They
pointed out that farmers might exit or turn down seemingly advantageous
contract farming arrangements when they perceive that participating won’t
resolve or might even aggravate preexisting market failures or introduce new
risks. A Nicaraguan example of horticultural producers was documented by
Barett et.al. In this example farmers exited their contract farming arrangement
with a supermarket while still retaining the income effects of participation thanks
to investments in irrigation and other productive technologies and new market
relationships.
On one end of the spectrum, the potential power asymmetry combined
with the potential for misalignment of incentives increases the risk of farmer
exploitation, in addition to the risk of indebtedness in case production problems
occur and loss of autonomy (and diversification). On the other end of the
spectrum, however, farmers may benefit from stable and long term off-take
75
arrangements based on solid contracts, as well as access to input financing and
technical assistance through contract farming relationships. While smallholders
can greatly benefit from some of these structures, especially if it provides access
to markets, inputs, technical assistance and financing, “smallholder inclusion in
such arrangements is not obvious” (Bijman, 2008) because buyers have been
found to prefer contracting with larger producers for transaction cost
considerations (Ket, et.al. 1999).
Therefore even though some consider contract farming to be a key form
of smallholder aggregation (IFC 2013), and in some cases it certainly may be
when it involves sourcing directly from small scale producers, buyers in general
tend to favor larger and fewer suppliers and in such cases another form of
aggregation becomes necessary in order for smallholders to get access to
particular market channels. Bijman (2008) refers to this as the “intermediary
model” of contract farming. (A common example would be contract farming via
a cooperative.)

76
2.8.2 Agricultural cooperatives
Cooperatives are the most common form of aggregation in agriculture and are
widely supported by domestic and international policy, but they have had mixed
track record especially in emerging economies. Agricultural cooperatives33 have
existed since the middle of the 19th century and count as many as 400 million
members today. Cooperatives are member-owned businesses that generally
operate according to seven international principles with roots in the 19th century
and as adopted by the International Co-operative Alliance: (i) voluntary and
open membership, (ii) democratic member control, (iii) members' economic
participation, (iv) autonomy and independence, (v) education, training and
information, (vi) cooperation among cooperatives, (vii)
concern for community (Birchall 2004).
Cooperatives have played an important role historically in organizing
smallholder farmers and are widely held in great hope to help end poverty,
achieve the Millenium Development Goals (UN Background Paper on
33 This chapter focuses on agricultural cooperatives as opposed to some of the other common forms such as consumer and financial cooperatives. Agricultural cooperatives have three broad categories: marketing (focused on market access on better terms), supply (focused on obtaining inputs on better terms) or service (provides transports, storage, etc. services) cooperatives (Ortmann, et.al. 2007).

77
Cooperatives, 2012), and as a “key to feeding the world” (FAO). However,
while 20-80% of small farmers, depending on the country, are organized into
some form of village or self-help group, only 5% of smallholders globally are
organized into formal producer organizations, mostly cooperatives (IFC 2013).
The first cooperatives were established in Europe in the 18th and 19th
century (see Appendix F for the history of cooperatives and distinct regional
characteristics.) However there is evidence that the top 40 non-cooperative34
agri-food companies in the world have been growing faster than their
cooperative counterparts during the period of 2007-2011 while cooperatives also
had weaker financial results on average (PWC, 2012). There are one hundred
agricultural cooperatives on the list of 300 largest cooperatives globally. Most of
these were established over fifty years ago most around the turn of the 20th
century. Most are based in Western Europe and the United States, with the
exception of one cooperative in China and one in India.
Cooperatives have not always been successful at serving the needs of their
members (Kherallah, 2001). In fact despite considerable government and other
34 Companies organized in legal forms other than cooperatives.
78
forms of support, cooperatives have not been successful in most less developed
countries and cooperatives remain a movement of the advanced countries where
most successful cooperatives operate (Frederico, 2005). Under the current
globalized agri-food market conditions, most of the cooperatives in less
developed countries are not “GVC relevant”; they are unable to do business with
the global value chains and local modern chains that increasingly handle global
and local food trade because they are too small and/or cannot meet the GVC
requirements.
Cooperative principals and how they manifest themselves in practice are
important for a better understanding of the advantages and disadvantages of
cooperatives as aggregators of smallholders and vehicles of their modern market
access favored by many policymakers.
Autonomy and independence. One of the key principles of cooperatives is
autonomy. While public assistance of different forms may be needed and
welcome on many occasions, as well as governments may be genuinely inclined
to support cooperatives as part of social policy, government involvement should
be temporary otherwise it can undermine the operation and effectiveness of the
cooperative entity or sector it is trying to support (Svendsen and Svendsen).

79
Nonetheless, motivated by social objectives or the perception of political threat
associated with the organizing of the poor segments of society, government
intervention remains a reality in many especially developing countries.
Non-governmental third party involvement can also undermine the
independence of cooperatives. Such outside promotion of cooperatives common
and those outside promoters tend to ascribe their own motives to the members of
the cooperative (Harper and Roy, 2000). Gugerty and Kremer (2000) found, in
their study of Kenyan community organizations, that developmental assistance
may change the social capital dynamics of these organizations. According to
Oxfam (2007) cooperatives set up as a result of external involvement are often
perceived by the members as means of accessing external support rather than
their own initiative, thus altogether undermining the reasons for the
cooperative’s existence. Therefore ILO’s 2002 recommendation on cooperatives
highlights the importance of not using cooperatives as “tools” of development in

80
a top-down approach, but rather support the autonomous bottom-up
development of cooperatives through direct support to the members.35
Economic participation vs. concern for community. It is common for cooperatives to
have a combination of economic and social objectives which needs to be carefully
balanced else it can lead to conflict and negatively influence trust and cohesion.
Harper and Roy (2000) in their study of Indian cooperatives found that the
majority of cooperative members they surveyed were primarily interested in
improving their income. Only 6 of the 21 cooperatives surveyed had the
majority of their members expressing the desire to have their cooperative do
more for the group than just increase income. In the case of the rest of the
cooperatives, the majority wanted the cooperative to focus only on financial
benefits. Harper and Roy also found that the more poor the members were, the
less they were interested in nonfinancial benefits from the cooperative. Vorley
et.al (2012) had similar findings and quotes a representative of Peru’s Junta
35 The (ILO) recommendations for the promotion of cooperatives (2002) are based on guidelines issued by the United Nations in 2001 and call for a supportive policy framework for cooperative development while also emphasizing the importance of cooperative autonomy and advocating against governmental intervention.

81
Nacional de Café saying “No one delivers the product simply for love of the
cooperative; we deliver the product to the extent that the cooperative can give a
better value proposition to the member in terms of prices and additional
services”.
Even though “many would be organizers of co-operatives attributed their
failure to the peasants’ stubborn refusal to understand the great advantages to
cooperation ……. and to the lack of mutual trust” (Frederico 2005), the classic
case study of Irish butter cooperatives by O’Grada illustrated that the decline of
those cooperatives had more to do with farmers’ assessment of profitability and
economic conditions as opposed to their “individualism and conservatism” as
previously thought (Frederico 2005).
Farmer income improvement may be associated with various cooperative
activities, including shared equipment use, training and services. For different
value chains the potential for income enhancing cooperative activities as well as
the relative value added of activities may differ. For example dairy cooperatives
have done reasonable well compared to others due to the opportunity to share
costly equipment necessary for preserving the quality of the milk and for higher
value added activities. In fact the first cooperative ever was a dairy cooperative

82
in Denmark that made butter (Frederico, 2005) and several cooperative success
stories are in the dairy sector, including Amul in India and Heifer International’s
more recent efforts (see more details later).
Harper and Roy (2000) nonetheless found that “both income only and
broader motivation can be associated with success.” In fact all the 5 cooperatives
which failed in their sample were mainly income oriented. The authors
concluded that “it may be that when circumstances become difficult, social
objectives provide some “glue” which keeps the group together in hard times.”
One interesting approach to combining financial and social/environmental
objectives is illustrated by the example of Heifer International36. Heifer
International is an NGO that works with small farmers and has successfully
promoted cooperative formation and the ownership of life stock that support
both food security and livelihoods. Organizing into cooperatives can help
smallholders with obtaining access to much needed chillers (without which the
bacteria count of the milk is unacceptable for most processors and modern value
chains). Heifer developed a “chilling hub” based engagement model,
36 Heifer International is a US based NGO with the mission of “working with communities to end poverty and hunger and to care for the Earth.”

83
recognizing the importance of chiller access for farmers. Various income
enhancing services and value chain partners are all linked to the chilling hub,
including quality testing, financing, extension and veterinary services, input and
feed supply, transportation services, etc. along with more socially oriented
activities such as education regarding improved hygiene, water and sanitation,
nutrition, environmentally sustainable agricultural services and resource
management, among others.
Cooperation among cooperatives. Bush and Simi (2001) found farmers from
different countries of the EU were three times more likely to protest against each
other than they were to work against shared antagonists. Nonetheless, the few
examples of cooperation they identified were all framed against a shared
protagonist, globalization and/or multinational corporations. McClintock
observed that farmers considered those outside their own cooperative as
potential competitors.
Democratic control. Democratic control is one of the key cooperative
principles. Oxfam’s experience with cooperatives suggests, however, that
participatory management is feasible only in the case of new or small
cooperatives. As the cooperative grows and the number of members increases,

84
however, the democratic decision making system become increasingly
impractical. In fact many cooperatives end up appointing a board, which in turn
appoints full time management. Management in those cases is often professional
and not from among the membership, for several reasons: first, as the
cooperative grows, it is increasingly difficult for members to manage the
cooperative as well as their own private production; second, cooperative
members often lack the necessary business and management skill; and third,
membership based committees of elected leaders tend to be slow and
bureaucratic in their decision making and thus jeopardizes the success of the
cooperative (Oxfam 2007).
However, a sense of ownership and trust of the leadership is critical for
cooperatives to function effectively, which creates a challenging dichotomy for
cooperatives. The challenge is especially great since professional leadership
tends to lead to conflicts over distribution (Oxfam 2007). Professional
managements usually tries to retain as much of the cooperative’s earnings as
possible for investments or reserves, while the membership tend to prefer
distribution to the members, especially if they do not fully trust the management
(Oxfam 2007). In return, these conflicts further undermine the membership’s

85
trust in management. Harper and Roy in fact found that most of the
cooperatives in their Indian sample did not have participatory management and
that the more simple the cooperative’s operation was the more likely
participatory management was used.
Corporatization. Rosa Luxemburg pointed out 100 years ago that
cooperatives are destined to either disappear, in case they do not succeed
economically, or to otherwise “corporatize” and become like capitalist profit
oriented entities. She portrayed cooperatives as conflicted organizations: trying
to maintain a “socialist” system of production while being subjected to
economies built on capitalist exchange. Since, according to Luxemburg,
exchange dominates production in capitalism due to competition, the
cooperative will either adopt the capitalist principals also in its production or let
the social considerations of its members prevail, in the latter case, however, it is
destined to fail economically. Szabo’s (2013) recent findings are consistent with
the above theory as he found that some cooperatives convert to corporate form
or establish subsidiaries in corporate form as they grow and their operations
become more complex. Skurnik and Vihriala asserted that while homogeneity is
a key determinant of the cost of collective action, cooperative decision makers by

86
nature are less homogeneous than corporate ones, given that sole concern of the
investors in the latter is the maximization of the value of their investment.
Maintaining sufficient alignment of owner interest is a key reason for
cooperatives to constrain their activities to a narrow line of business. They also
suggested that cooperatives find it difficult to cope with change as that causes
tension among members and the risk that preferences might diverge.
Despite the above challenges with cooperatives, there are some very
successful examples of agricultural cooperatives that managed to grow to
significant size and command considerable market shares in their respective
markets. Some of the most frequently referenced include the Danish and Dutch
cooperatives, the dairy cooperatives of India and the Almerian cooperatives in
Spain. It is important to highlight, however, that most of these success stories, in
particular the timing of their significant growth, pre-dates the era of
globalization and the dominance of global value chains. Furthermore, some of
the successfully scaled cooperatives benefitted from very specific and unique
socioeconomic dynamics that encouraged membership and enabled growth.
The successful growth of Dutch cooperatives was originally organized
along Catholic-Protestant religious lines and both groups supporting and
87
building organizations of their own in competition with one another (KIT, 2010),
helping offset the tendency of diluting social cohesion that generally occurs with
the growth of collective action based organizations.
The beginnings of the Almerian cooperative37 dates back to Franco’s
dictatorial regime and its “development” efforts in the 50’s and 60’s and its
exploitive arrangement aimed at increasing agricultural production in the area.
Frustrated by lack of transparency and stymied opportunities for growth,
Almerian farmers formed the credit co-operative Caja Rural Provincial de
Almería in 1963 (now “Cajamar”). Cajamar provided financing to farmers as
well as acted as a catalyst in building organizational strength. This was at least in
part driven by Cajamar’s initially mainly unsecured lending and thus crucial
interest in making sure that the co-operatives were doing well and their activities
were worth financing (Vattamany 2009).
Amul is the largest Indian dairy company, owned by Gujarat Cooperative
Milk Marketing Federation, with revenues in excess of US$3 billion. Amul began
in 1946 when dairy farmers in India's Kaira district went on strike to protest
37 With 13,500 small farmers of average landholding of 1.5 hectares.

88
middlemen and corrupt bureaucrats. The Amul brand and its cooperative model
formed in the years that followed and evolved into a 3 tier federated structure.
India's federal government eventually rolled out the privatized model in other
states. The Indian government was heavily involved with cooperatives and in
fact in 1947 cooperatives became an integral part of the government’s five year
plans. The government also played a key role in promoting consolidation in the
cooperative sector (Munshi, N. 2012).
Several studies have documented the challenges faced by more recently
established cooperatives of smallholders in attracting and retaining members in
order to achieve the necessary growth to do business with modern markets.
Salifu, et.al. (2010) found that in Ghana the most of the cooperatives are fairly
homogeneous (including from gender perspective) and remain small with less
than 70 members. These authors also found that similarly to other Sub-Saharan
African countries (Francesconi, et. al. 2008), the primary reason behind the
creation of the cooperatives and farmers’ decision to participate was to gain
access to governmental or NGO external support (“invasive external
governance”). In a South African study (Van der Walt 2005), the author found
that 65% of registered cooperatives were not operational and 50% of survey

89
respondents indicated that the services provided to members were inadequate.
Ortmann et.al. (2007) found that several large cooperatives had converted to
become “investor owned firms” and conversions were related to the “member-
shareholder conflict”: farmers may receive good service from their cooperative as
members but poor return on their capital. Mujawamariya, et. al. (2013) observed
limited loyalty and commitment to cooperatives among Rwandan coffee farmer
along with what they refer to as “double side-selling”: coffee farmers selling to
local traders instead of the cooperatives and cooperatives purchasing from non-
members.
Therefore it is key to understand what benefits farmers gain from PO
participation what factors might influence PO participation.

90
2.9 Experience with Producer Participation in Aggre gation
While 20-80% of small farmers, depending on the country, participate in
some form of village or self-help group (IFC 2013), most of these groups operate
informally trying to address rural communities’ basic needs (Krishna 2002) such
as health, nutrition, clean water and sanitation.
Agricultural production oriented producer organizations, especially those
that operate formally, are less common. Only about 14% of Asian farmers, 16%
of European farmers, 19% of Latin American farmers and 7% of African farmers
are members of producer organizations, including formal and informal, many of
which are small and have very low capacity (IFC, 2013). The low level of farmer
participation in formal producer organizations is a puzzle in the development
field38, especially given the considerable support for such participation provided
38 As an example, a survey of Hungarian farmers (Horvath, 2010) revealed that over 90% of the farmer believed that cooperation among producers was necessary and important, especially for better marketing opportunities (80% of respondents), to take advantage of support that may be available (39%) and to improve production methods and conditions (31%). Nonetheless, only 16% of respondents participated in some form of producer cooperation, which included informal clubs in addition to formal producer organizations.

91
by international organizations, governments, and non-governmental
organizations.
This puzzle of low participation in producer organizations has been
getting increasing attention among scholars and practitioners alike. This appears
to be especially of concern since farmer aggregation is a key mechanism to enable
agri-food companies to source from smaller producers, for vendors to market
their products to them, for technical assistance providers to transfer know-how
and agricultural best practices to them and for NGOs to reach them with various
forms of assistance.

92
2.10 PO Formation and Initial Farmer Participation
Markelova et al. (2009) describe three factors necessary for the formation
and functioning of farmer groups from the perspective of modern market access:
type of market/product; group characteristics and institutional arrangements.
The type of market and product determines the extent to which group
participation can be beneficial. As far as group dynamics are concerned,
according to Markelova, et al. (2009), smaller groups have stronger cohesion
since members are easier to monitor but groups’ internal composition also play
an important role with homogeneous groups (in terms of socioeconomics, values,
etc.) having been shown to be more stable and effective, while past experience
working together and experienced leaders further increase the likelihood of
success. Finally, in terms of institutional arrangements, simple rules,
accountability and enforcement mechanism, crafted or adapted by groups
members themselves, all help contribute to farmer groups’ effectiveness.
Factors that have been shown to influence farmer willingness to
participate in POs include up-front fees, transaction costs of dealing with POs
(including cost of transportation and of transitioning into the formal sector),

93
group size, price received and payment terms (Fischer et.al 2011, Bakucs,
et.al.,2007).
Dalberg (2012) found based on interviews carried out with global
commodity buyers that farmers do not participate in POs for one or more of the
following reasons39:
• POs provide poor services
• Insufficient access to resources
• Smallholders and women are excluded from POs
• Weak governance and leadership
• Historically state intervened in POs for political gain
A large scale survey (Bernard et.al. 2010) of Ethiopian farmers revealed
that 59% of nonparticipants did not think the effort or fee required for PO
participation was worth the expected benefits. Over 30% of respondents were
interested in PO participation but PO entry rules discriminated against them due
39 Please note that Dahlberg’s interviews focused on the coffee value chain in Peru, cocoa in Indonesia, dairy in Colombia, maize in Kenya and rice in Nigeria, and global conclusions were extrapolated from those findings. However, the list of barriers to aggregate is likely to be biased by the experiences in those 5 countries.

94
to their small size. PO exclusion of the poorest (which in turn are often the ones
with smallest production) was also observed in other studies.
Dudas (2009) found in a survey of Hungarian farmers that the most
important motivation in farmers’ decision to join a PO was security of the off-
take followed by a reduction in production risk and collective input purchase.
Other studies confirmed the same finding showing that the primary motivation
for PO participation was the desire for risk mitigation, which included primarily
market risk but can also include others forms of risk mitigations (for example
weather) via various services that the POs can offer.
Access to modern markets also requires shifting to the formal sector from
the informal sector, where most smallholders operate40. The informal economy
has been growing and it represents nearly 40% of the GDP of developing
countries. The increase of informal economic activities is attributed to increased
40A World Bank study of 162 countries for the period of 1999-2007 (Schneider, Buehn, Montenegro, 2010) used the following definition for the informal sector. “The shadow economy includes all market-based legal production of goods and services that are deliberately concealed from public authorities for any of the following reasons: (1) to avoid payment of income, value added or other taxes, (2) to avoid payment of social security contributions, (3) to avoid having to meet certain legal labor market standards, such as minimum wages, maximum working hours, safety standards, etc., and (4) to avoid complying with certain administrative procedures, such as completing statistical questionnaires or other administrative forms.”

95
tax burden, labor market regulations, quality of public goods and services and
the state of the formal economy (Schneider, Buehn, Montenegro, 2010). The
implication for smallholders, most of whom traditionally operate in the informal
economy, is that the shift from the informal to the formal sector can be a difficult
one, which was confirmed by the interviews carried out for this study. This can
represent a serious challenge for smallholders with considerable financial
implications. The author of this research has not been able to identify any studies
that quantify the impact of transition from the informal to the formal market.

96
2.11 Farmers’ Continued PO Participation
Studies about farmers’ continued participation in aggregation
mechanisms falls into two main strands. First, those focusing on the collective
action aspects of farmer participation and the role of trust in enabling collective
action. Second, scholarship that emphasizes the costs and benefits of
participation in farmers’ decision-making process.
2.11.1 Collective action, social capital, trust and collective identity
This section will review the concepts of collective action, social capital,
trust and collective identity, in particular in how they are applied to farmers’
POs.
There is a wealth of literature on collective action, social capital, collective
identity and trust and this literature review will not attempt to provide a
comprehensive review but rather focus on the application of these concepts in
the existing literature to smallholders and their participation in aggregation
mechanisms.

97
Collective action is an important strategy for increasing small producer
participation in modern markets (Vorley et al. 2008). However, very little
attention has been given to the factors that shape the commitment and
contribution of farmers towards achieving a shared goal. (Fischer et al. 2011)
“Collective action occurs when more than one individual is required to
contribute to an effort in order to achieve an outcome.” (Ostrom 2004).
Scholarship related to natural resource management has highlighted the
importance of collective action, “voluntary action by a group to pursue shared
objectives”, and despite the differences between natural resource management
and smallholder market access, the collective action framework is applied to the
latter because of the importance of cooperation for creating sustainable
livelihood options. In fact scholarship on smallholder market access has been
increasingly using the collective action framework (Markelova et al. 2009, Smith
Lourenzani et al. 2009 , Fischer et al. 2011) and the promotion of farmer collective
action has gained popularity for supporting smallholder market access as a
response to transformation of the agri-food system and emergence of GVCs.
(Narrod et al. 2009)

98
“Social capital refers to the norms and networks that enable collective
action”.41 According to Putnam (2001), the central idea of social capital is that
networks and the norms of reciprocity associated with them, have value. Ostrom
(2007) goes a step further in articulating not only that social capital consists of
networks, but also highlighting trustworthiness and institutions leading to trust
as elements of social capital which together enable collective action. In other
words social capital contribute to collective action through enhanced trust, trust
being the core link. Krishna (2002) suggests that while social capital may
predispose individuals to cooperate and social networks can facilitate
cooperation, certain types of actions, especially those that require the
engagement of the external environment, also require the mediation of issue
specific agencies. According to Krishna (2002) “social capital is an asset that
remains latent until agents activate this stock and use it to produce a flow of
benefits.” Such agency is needed in particular when “middle level institutions”,
such as unions, interest groups, etc., are weak, a common problem in developing
41 World Bank; http://web.worldbank.org/WBSITE/EXTERNAL/TOPICS/EXTSOCIALDEVELOPMENT/EXTTSOCIALCAPITAL/0,,print:Y~isCURL:Y~contentMDK:20642703~menuPK:401023~pagePK:148956~piPK:216618~theSitePK:401015,00.html

99
countries. (Krishna 2002) In addition, according to Mayer (2014), a fundamental
obstacle facing those who are trying to move a community to act collectively is
the construction of a common interest.
Various forms of social capital contribute to successful collective action by
increasing trust. Trust increases when the people involved are trustworthy and
are networked with each other (Ostrom, et.al. 2007). However it has also been
shown that cooperation can be sustained in large networks where individuals do
not have regular face to face contact via the bridging form of social capital,
especially when it is combined with the bonding form that relies on interpersonal
relationships. (Krishna 2002) Furthermore, institutions may create rules that
incentivizes trustworthy behavior by establishing rewards and punishments and
thus have the ability to enhance trust. (Ostrom, et.al. 2007).
When it comes to agricultural POs, a form of institution, it is through
collective action, through PO participation and the collective use of facilities,
equipment and services that farmers can maximize the collective benefits gained
from small-scale farming. (Markelova et al, 2009) But social capital can be fragile
in POs (Svendsen 2004). Case studies from around the world attribute the
success of some cooperatives to the presence of trust and social capital. (Szabo

100
2009, Wambugu 2009, Chloupkova 2003) For example Fischer et.al. (2011)
studied the intensity of smallholder banana producers’ PO participation in
Kenya and found that PO size has a negative influence on the quantity members
sell to the PO, which they attribute to the weakening of social ties and increasing
monitoring challenges (and thus risk of side-selling) as POs grow.
An FAO policy brief found that decline in social capital hinders farmer
groups in Africa and agriculture (FAO, 2010). Some NGOs, such as BRAC and
Heifer International, has used various techniques to foster social capital when
promoting the establishment of producer organizations.42 Nilsson et.al. (2012)
attribute the transformation of many traditional cooperatives over the last 20
years to the weakening trust of cooperative members in each other and in the
cooperative with increasing vertical and horizontal integration.
The existing literature on POs offer several insights on the role of trust.
First, trust and collective action tends to work better in smaller groups in general
(Olson 1965, Ostrom 2007), representing an additional challenge when POs
42 An example is Heifer international’s “Passing on the Gift” program. Heifer helps individuals and families by gifting them livestock and agricultural inputs and by providing training on livestock management. Once those Heifer recipients rear the next generation of livestock, they ceremonially gift one of the livestocks to another family in need. Thus the original gift recipient becomes a donor, offering great dignity and pride and supporting social capital.

101
attempt to grow, which is essential in most cases for their ability to access
modern markets. Trust is key for coordination and control in farmer
organizations (Borgen 2000) and low farmer organization rate is often attributed
to the lack of trust and social cohesion among farmers (FAO/CAPRI 2007, Hellin
et. al. 2009, Markelova 2009, Blandon et. al. 2009, Regoverning Markets 2008,
Fischer et.al. 2011).43 According to Borgen (2001), in the case of cooperatives,
conditions for interpersonal trust-building are no longer in place as cooperatives
grow, especially with increased heterogeneity and information asymmetry.
Borgen’s study of Norwegian cooperatives highlighted that “trust is demanding
to build but can easily vanish”. He also emphasized that the “conditions for
trust-making” are much more demanding in large scale organizations with
heterogeneous mix of members, locations and preferences. In the meantime
maintaining farmers’ trust of the organization is increasingly important because
of the asymmetry between farmers and the organization in terms of access to
information. Schulze et. al. (2008) studies small supplier commitment from the
43 For example, low levels of farmer participation in POs in Central Eastern Europe is in part attributed to the legacy of forced collectivization during the communist era and the low degree of trust and social capital in most farming communities (Regoverning markets 2008, Torok 2009).

102
perspective of cooperative buyers in the German dairy sector, prompted by
concern over the large number of farmer contract cancellations and violations.44
Based on a farmer survey the authors concluded that trust played the most
important role in farmer commitment, more important than satisfaction,
including satisfaction with the price paid by the buyer. One of the authors’ key
recommendations was to invest in trust-building activities even if that will
involve short term sacrifices in the price offered.
Collective identity refers to unique group characteristics based on shared
meanings, experiences and expectations around which group members coalesce
(Mosimane et al. 2012). Collective identity is a widely used concept especially in
the social scientific studies of social movements involving gender,
multiculturalism, sexuality, ethnicity and nationalism, among others. Polletta
et.al. (2001) defined collective identity as “an individual’s cognitive, moral, and
emotional connections to the broader community, category, practice or
institution. It is a perception of a shared status or relation, which may be
imagined rather than experienced directly, and is distinct from personal
44 The examples mentioned in the paper all involved cooperative buyers, including Campina and Nordmilch. The German subsidiary of Campina list 500 of its 2,100 dairy farmer suppliers over the period studied. (Schulze 2008)

103
identities, although it may form part of a personal identity. The collective
identity may have been first constructed by outsiders, …, but it depends on some
acceptance by those to whom it is applied. Collective identities are expressed in
cultural materials – names, narratives, symbols, verbal styles, rituals, clothing
and so on – but not all cultural materials express collective identities… And
unlike ideology, collective identity carries with it positive feelings for other
members of the group”. Mayer (2014) highlights the importance of collective
identity for collective action. He suggests that narrative is the essential human
tool for collective action that helps construct a shared purpose and affirms
identity. According to Zurcher et.al. (1981), the staying power of collective
identity depends on members’ commitment, the extent to which individuals’
interest and world view becomes linked to the requirements and goals of the
collective. According to Blumer (1939), collective identity formulation should
involve both informal interactions and the organizations of formal ceremonies
and rituals. The majority of the collective identity related social movement
literature has been conceptual rather than empirical and most of the latter have
been in the form of case studies. (Hunt, et.al. 2004)

104
“Collective identity is considered as both a necessary precursor and
product of movement collective action”. (Hunt et.al. 2004) Klandersman, et.al.
(2002) demonstrated this empirically. Studying Dutch and Spanish farmer
protest activities they found that a sense of collective identity stimulated a sense
of preparedness, which led to protest participation, which in turn reinforced the
collective identity. A. Desmarais (2010) had consistent findings in a study of Via
Campesina, the international peasant movement advocating family farm based
sustainable agriculture and food sovereignty, showing that protest activities
were driven by strong collective identity.
The application of the “collective identity” concept in other areas have
been more limited with almost no use of the concept in the literature about
smallholder aggregation and producer organizations.
Some studies found the importance of collective identity in the
management of common pool resources. (Wade 1986, Mosimane et al. 2012) As
far as POs are concerned, Bijman, et.al. (2008) suggests that all POs are
characterized by two principals: utility and identity. “Utility” refers to
participation in the PO being useful to farmers. Identity, according to the

105
authors, refers to PO participants sharing a common history, geographical space
and vision of the future for “themselves and for the group”, which in turn
support continued cooperation. Bijman et.al.’s interpretation of PO identity is
thus passive, considered a given once a PO is formed.
The author of this paper was only able to identify a single study on the
application of the concept of collective identity to farmer aggregation. Borgen
(2001) found in his study of Norwegian cooperatives that identification based
trust plays an important role in maintaining member commitment in modern,
large-scale cooperatives, in particular as group cohesion and trust weakens in
growing organizations.
2.11.2 Costs and Benefits of Aggregation for Farmer s
Collective marketing via aggregation improves the likelihood of being
able to access modern markets otherwise unattainable for individual farmers,
including in many cases higher value export markets (Markelova, et.al. 2009).
Aggregation can provide information, knowledge, assets and services that would
otherwise be unavailable to individual farmers. However, participation comes at

106
a cost in terms of investments that need to be made, transaction costs of working
via an aggregator, and the cost of operating in the formal sector rather than in the
informal sector (Vorley et.al. 2012). A key determinant as to whether farmers
decide to participate in POs is whether they expected to receive net benefits from
their participation.
There is limited empirical evidence as to whether farmers experience
income or livelihood improvement as a result of participating in an aggregation
mechanism and that evidence is rather mixed. The only large-scale study the
author of this paper is aware of looked at POs across the EU and found that “On
average, producers in the regions with very high organization rates have higher
income than those in regions with low organization rates, but the results are not
as clear in regions with a medium organization rate. “ (Agrosynergie, 2008).
A survey of Ethiopian farmers found that PO participants achieved 7-9%
higher prices for their crop than non-PO participants (Bernard et.al, 2010).
However farmers raised the cost of participation as a major concern and the
study did not quantify those costs. Nonetheless, it is probably fair to assume that
continued participation by the majority of the farmers was evidence that they
enjoyed net gains. The authors pointed out, however, that the smallest farmers

107
self-excluded from participating because their returns from membership were
lower than their costs.
Nevertheless, there are numerous successful examples of farmer collective
action and sustainable PO operations. Narrod et.al. (2009) documented the cases
of successful farmer collective action in the Kenyan green bean industry and in
the case of the Indian Mahagrapes45, both accessing high value export markets.
Both cases involved cooperatives with considerable buyer as well as government
and/or third party (NGO or donor) involvement that helped reduce the cost of
PO services, consistent with the conclusions of the Monitor study. Please see
section 2.8.2 on cooperatives for additional examples of successful POs
documented in the literature.
The Monitor Group examined several smallholder farmer aggregation
models in Sub-Saharan Africa as part of the “Market Based Solutions to Poverty
in Africa Project (2012)”.46 Monitor found that each of the aggregator models they
45 Maharagrapes is a marketing firm associated with several cooperatives of grape producers. 46 The models included (i)agro-dealers that purchase smallholder output and/or provide
transportation services to smallholders; (ii) grain handling and storage operations that offers warehousing, trade and marketing services to smallholders; (iii) an NGO owned marketing firm that acts as buyer and broker for cash and staple crops and provides market access to
108
analyzed achieved significant income enhancement for participating farmers.
However no model succeeded without the involvement of or stable access to a
strong buyer. Monitor also found that the aggregator models could be
financially sustainable, albeit their margins were very thin and volatile. The
study made a key observation for the field: farmers enjoyed increased net benefit
from participation with additional value-added services received from the
aggregators, however such additional services did not improve aggregators’
profitability. This finding suggests that aggregators may have to carefully chose
the services they offer in order to maintain or grow farmer participation (for
which services are essential in order to ensure net benefit to farmers) on one
hand and keep services to a minimum on the other in order to minimize the
aggregator’s own costs.
smallholders; (iv) industrial maze aggregator that provides inputs as well as advisory services to small farmers and guarantees a market for their products.
109
2.12 PO Services
The previous section highlighted the great importance of services
provided both for the aggregator’s operation as well as for net farmer benefit
from PO participation as PO services can help smallholders overcome some of
the barriers of entry to accessing modern markets. Indicating the importance of
services, one of three criteria for the EU to grant PO status to an aggregator is
that it has to “prove its utility by the scope and efficiency of the services offered
to members.”47 However aggregators’ mixed incentives in providing services to
farmers, on one hand helping ensure farmer participation, on the other wanting
to minimize related expenses in a line of business already characterized by very
thin and volatile margins, highlights the need to better understand what services
may be most important for POs to provide.
Because of the primary importance of privately held assets (such as
livestock, soil quality, productive technologies, etc.) when it comes to barriers to
modern market access (Barrett 2008, Boughton et al., in press; Cadot et al.,2006;
Minten and Barrett, submitted for publication), most POs attempt to serve
47 http://ec.europa.eu/agriculture/fruit-and-vegetables/producer-organisations/index_en.htm
110
farmers with services that primarily support private goods. Table 5 summarizes
the key types of services identified in the literature that fall into nine categories.
Production and marketing related services are the most common among POs.
Production related services help address input purchase and risk management
related disadvantages faced by small farmers and usually involve input
provision, often according to the specific needs of buyers, and the coordination
of production among producers both in terms of crops and timing in order to try
to best harmonize PO members’ collective production with the expected demand
in the market. Marketing services help address the economies of scale related
smallholder disadvantages through collective transports, storage, market
analysis, processing, branding and certification, among others, and thus help
address market knowledge and output markets related small farmer barriers.
Technology services make engineering and scientific solutions available to
farmers that help address technical knowledge, risk management, product
traceability and quality assurance related barriers and improve productivity.
This may involve the research & development, dissemination and training

111
related to new crop varieties and production and marketing related
technologies.48 Financial services involve PO financing to participant farmers,
usually complementing other services offered, in order address the barriers faced
by smallholders in accessing capital. For example PO financing alongside
technology services allow farmer to invest in farm productivity, efficiency or risk
management improvements. Educational services can help address smallholder
barriers in several areas and may include core farm operation related training
and information provision (such as extension services, business or financial
literacy training) as well as non-farming specific training and information such as
those related to health, nutrition, clean water and sanitation. Welfare services
include social safety net services usually focused on the most disadvantaged PO
participants or those suffering some temporary hardship and thus can fulfill a
role in addressing the risk management related disadvantages faced by
smallholders. Resource management services may involve the handling and
coordination of activities related to common goods like water, pasture, fisheries
and forests or farm specific resource management such as services related to soil
48 With climate change this technology dissemination is an increasingly important service that POs can provide even when they include simple technologies like drip irrigation, green houses, tunnels and hail protection.

112
conservation, water and energy use which can also help contribute to improved
smallholder risk management. Organizational services are aimed at building
institutional systems and capacity that supports transparency and thus farmer
collective action and policy advocacy involves awareness raising and lobbying
activities.
Table 5. PO services
TYPES OF SERVICES EXAMPLES OF PO ACTIVITIES
Organizational Organizing farmers, supporting collective action, internal systems, institutional capacity building
Production Input provision, facilitation and coordination of production
Marketing Transport, storage, marketing, processing, market information and analysis, branding, certification
Financial Savings, loans and other forms of credit, financial management
Technology Education, extension, research Education Business skills, health, production Welfare Social safety nets Resource management Water, pasture, fisheries, forests, soil
conservation Policy advocacy
Source: Hellin et.al. 2009, Markelova et.al. 2009, Narrod et al 2009, Rondot and Collion 2007

113
The range and types of services vary considerably across POs. Some POs,
for example the fairly common marketing cooperatives, focus on a single service
type sometimes with as few as one or two specific services (for example sorting
and collective sales activity in case of marketing cooperatives). At the other end
of the spectrum there are POs that offer a wide range of different services and
may even have explicit social and environmental missions in addition to
economic.
The literature on PO services, including several farmer surveys,
appears to confirm the importance of PO services in farmers’ PO participation
decisions. Receiving services have been shown to increase farmer loyalty and
mitigate the side-selling risk (Ecom, 2012). However, the literature is nearly silent
about whether some services may be more important than others. The only
study that the author is aware of that investigated the importance of various
services is Keystone’s “Voice of the Farmer” survey (2012). The study is based
on the survey of approximately 1,000 coffee farmers in Nicaragua that supply
coffee trader ECOM. Among others, farmers were asked to rank the top 3
services they consider most important. The services highest ranked by farmers
were financing, farm visits (extension services) and training. See Table 6 for

114
more detail. However, it is unclear to what extent these findings can be
generalized for other forms of aggregators, sectors and countries.
Table 6: Farmer evaluation of services
As Monitor’s (2012) findings highlight, however, POs need to choose
carefully what services to offer that most benefit their members and the collective
objectives of the organization.

115
2.13 Role of Finance
Historically smallholders’ finance need was met to a great extent by local
informal lenders, often input vendors, who were familiar with the farmers.
(Frederico, 2000) The decline of such informal financial systems has not been
accompanied by the emergence of any systematic alternative, contributing to a
significant market failure in the area of smallholder finance, with only about one
percent of the market need currently met (Dalberg 2012).
2.13.1 History of Smallholder Finance
G. Frederico’s economic history of agriculture about the period between
1800 and 2000 highlights the importance of access to capital in agriculture
throughout the past 200 years. According to Frederico (2000) while capital need
is common for the entire economy, agriculture is different in its seasonality, in
the fact that the same party (farmer) needs capital for both production and
consumption and resorts to the same institutions with those needs. Unlike in
other sectors, demand for capital can vary significantly and unpredictably from
year to year. Frederico also highlights that since few agricultural businesses can
raise money through the capital markets, most have to resort to credit. However,

116
the sources of credit have also differed from other types of enterprises. Larger
and richer farmers have had access to formal financial institutions like banks,
leasing or insurance companies. The vast majority of farmers, however, have
had to raise the capital they need through the informal market. Moneylenders
and pawnshops have historically been common in areas with independent
family farms, according to Frederico. It was also common practice for landlords
to provide financing to tenants in relation to ongoing expenses. Merchants and
vendors pre-financed sales and financed machinery, respectively. The basis of
the informal financial system was familiarity with the borrower. In fact the
informal lender was typically an insider in the community and had much better
information about the “bankability” of the borrower than formal financial
institutions. In the 19th century financial intermediation mechanisms developed
whereby landlords or merchants borrowed funds from formal financial
institutions to onlend the funds at a higher rate to farmers. (Frederico, 2009)
According to a World Bank survey, in 197049 informal credit represented
72% of the total credit extended to agriculture in Asia, 63% in the Middle East,
49 More recent data was not available. While outdated, this information illustrates agriculture’s high degree of reliance on informal credit markets.

117
72% in Africa and 15% in Latin America (but with a note that this last figure may
be underestimated (Wai 1977). Concerns about informal financial markets center
around its high cost and potentially exploitative nature, which is confirmed by
the limited data available and by anecdotal evidence.
As a result, governments around the world set up formal, often state-
owned, financial institutions for financing agriculture or created incentives (and
in some case requirements), for formal private financial institutions to extend
credit to farmers. (To this day this practice continues in many countries). The
results have been mixed at best, with significant leakages, corruption and
inefficiencies as well as nonperforming assets in some cases, in part because such
formal financial institutions did not have the insider familiarity with the farmers
and government involvement in financing created moral hazard. These results
led to the withdrawal of the state from providing subsidized financing to small
farmers in most developing countries which has not been replaced by the private
sector, leading to a market failure in the area of rural finance (Kherallah, 2001).
Most commercial financial intermediaries shy away from agricultural
lending due to a combination of what they consider to be high risk and low
profitability.

118
2.13.2 Forms of Smallholder Finance
KIT/IIRR (2010) differentiated three forms of finance with potential to
benefit smallholders:
1. Chain liquidity involves short-term loans to smallholders from buyers
(advance payment) or suppliers (input purchase on credit).
2. Agricultural finance involves short or long term financing from formal
financial intermediaries directly to farmers or producer organizations or
to a value chain actor that on-lends to farmers. Agriculture finance relies
heavily on hard collateral.
3. Value chain finance has evolved in response to the lack of available
financing sources, leveraging business relationships within a value chain,
building on the value chain’s systemic character. Value chain finance has
several advantages over other forms of agriculture finance when it comes
to smallholders. Value chain actors tend to have better knowledge of
producers, the risks and profitability of their operations and have the
opportunity to bundle financing with other activities (commodity flow,
input supply, extension services, off-take contract, etc.) that can help

119
reduce credit risk and transaction cost. Despite some of these advantages,
value chain finance does face limitations, especially in terms of its ability
to control loan default in the case of side-selling and diversion of the
proceeds to other farmer needs. Therefore financial intermediaries are
generally reluctant to engage in value chain lending and non-financial
players (such as off-takers and input providers) rarely want to take on the
role of the financier and prefer to concentrate on their core business.
(GPFI, et.al. 2011) The global demand for smallholder agriculture finance
is estimated at $450 billion, a significant market. (Dalberg 2012). Value
chain finance has a strong potential to take advantage of this market
opportunity but it also has a significant limitation; it requires farmers to be
aggregated into POs. At current levels of farmer aggregation Dalberg
(2012) estimated the addressable demand for financing at $22 billion,
which is expected to increase by another $11 billion if another 5% of
farmers were to get organized into POs. In addition, Dalberg (2012) found
that many of the key barriers to smallholder financing, namely low levels
of farmer organization, financial literacy, collateral and productivity,
could be addressed through POs.

120
In reality, there is very little financing available in most markets
that benefit smallholders, which is why governments continue to
implement costly special programs that too often do not accomplish their
intentions (Federico, 2009). For example in some rural areas of Mexico as
little as 2.5% of the population has access to formal credit (World Bank,
2010).

121
3. Model of GVC Relevant Aggregation
This chapter proposes a theoretical model of how producer organizations
can help smallholders achieve access to GVCs and thus provide them an
opportunity to supply growing modern markets. The model outlines the
necessary elements of Global Value Chain Relevant Aggregation (GVCRA): the
collective action problem faced by smallholders (Section 3.1.1) and collective
identity considerations (3.1.2), bounded rationality (3.1.3) and farmers’ cost
benefit analysis (3.1.4) and assessment of aggregator types (3.1.5) when
considering PO participation. Figure 6 below outlines the pieces of the model.
Figure 6: Model of GVC Relevant Aggregation
!
!
!
!
!
!
!
!
!
!
!!

122
There is significant empirical evidence in the form of case studies that
suggest that participation in both buyer and producer driven value chains can
benefit smallholders (Lee, et.al. 2012) but that in most cases GVC participation
requires some form of aggregation. However, it is also clear from the literature
that PO participation in and of itself does not guarantee GVC access which, in
turn, contributes to low farmer interest in joining POs. While there is
considerable suggestive evidence, especially from case studies, a theoretical
model that can articulate the link between farmer aggregation and GVC access
has been lacking. Hence is this effort to propose a model of “GVC Relevant
Aggregation” (GVCRA).
The conditions of GVC and modern market access and the motivations of
GVC actors for engaging with smallholders have been outlined in section 2. In
this section a model of GVC relevant aggregation (“GVCRA”) will be proposed
that aims to contribute to an improved understanding of the PO characteristics
that can contribute to smallholders’ GVC access.

123
The model has the following components:
1. Farmer decision about PO participation is modeled based on the
combination of two different conceptual frameworks. First, collective
action theory and the concepts of trust and collective identity are
applied. Second, bounded rationality based cost-benefit analysis is
applied to farmer decision-making in the context established according
to the trust and collective identity based framework. These
considerations will influence farmers’ evaluation of PO types and the
value of services and activities carried out by POs and thus the
ultimate decision of PO participation.
2. A modification is recommended to the cooperative-IOF dichotomy of
PO types by introducing the hybrid type of POs that combine both
cooperative and IOF characteristics. The GVCRA model suggests that
PO structures influence the alignment of incentives between farmers
and POs, farmer decision about participation and farmers’ likelihood
of behavior that can undermine collective action.
3. Based on the conceptual framework outlined, in particular the
bounded rationality based cost-benefit analysis, the GVCRA model

124
suggests that PO services are important for farmers’ continued PO
participation and to mitigate the risk of side-selling and thus for POs to
scale and achieve GVC access.

125
3.1 Farmer Decision about participation
3.1.1 Collective action problem
At the core of this paper’s conceptual framework is the collective action
problem faced by smallholders. It is through collective action, through PO
participation and the collective use of facilities, equipment and services that
farmers can maximize the collective benefits they gain from small-scale farming.
However, farmers face a collective action problem. Their short-term individual
benefit may be maximized via side-selling and free-riding.
Side-selling can be considered an assurance game problem. It involves
farmers side-selling their products to third parties to maximize their income from
a single transaction in violation of their agreement with the PO and therefore
undermining the PO’s ability to meet its contractual obligations, which can have
severe operational and financial consequences for the PO both in the short and
long term, especially when modern or global value chains are involved. The
immediate consequences include financial penalties for not meeting contractual
obligations and finance costs for borrowing funds to purchase needed crops on

126
the spot market while long term implications include undermining relationships
with buyers, losing contracts, deteriorating reputation and weakening
financially, as the case studies will illustrate. These consequences of side-selling
also undermine single farmers’ ability to maximize their income in the long run
via stable collective action. Key to this assurance game problem is the scale of
side-selling. Farmers recognize the positive prospects of stable collective action.
However if they suspect that other farmers will side-sell in large enough
numbers that may undermine the return from stable collective action then they
will side-sell to maximize their individual returns from a given transaction.
Another form of collective action problem in POs involve free-riding. One
form of free-riding involves farmers’ taking advantage of PO services but not
delivering the crops committed in term of quantity (side-selling) or only
delivering poor quality crops. The latter involves farmers selling the poorest
quality products to the PO and selling their best quality produce at the spot
market, thus deteriorating the overall product quality of the PO and
undermining its ability to secure favorable future contracts.
Monitoring and sanctions are an important mitigation strategy for the
above collective action problems but often not feasible in case of smallholders.

127
The PO may lack the technical resources for monitoring, the political will for
sanctions may be weak1 or the problem so widespread that sanctions are no
longer an option.
3.1.2 Collective Identity
Borgen (2001) also found, however, that members’ identification with
their cooperative can be a significant trust-making mechanism (Ole Borgen 2001).
Collective identity is an “individual’s cognitive, moral and emotional connection
with a broader community, category, practice or institution. It is a perception of a
shared status or relation which may be imagined rather than experienced
directly, and it is distinct from personal identities, although it may form part of a
personal identity.” (Polletta, et.al. 2001).
Collective identity is mostly discussed in the literature the context of
social movements. However, based on the interviews carried out for this
research, we hypothesize that collective identity may offer some valuable
insights into the relationship between farmers and POs. “Agriculture is not just
1 Especially in the case of cooperatives where all participants, including free riders, participate with equal vote in the governance.

128
about products, value chains and quantities. It is a way of life”, said Mamadou
Cissokho2 in a recent speech, stressing the importance of collective identity.
In contrast with Bijman et.al.’s assertion that POs possess a shared identity
as a general characteristic and implying that it is a passive PO attribute,
interviews carried out as part of this research reflected a high degree of variation
in collective identity among POs. Nilsson et. al.’s attribution of the success of
Japanese and Norwegian cooperatives in part to their ability to have the
cooperative experience influence farmers’ self-identification also suggests that
collective identity is not a passive characteristic but can be actively influenced.
Examples of collective identity building activities may include sponsorship of
local community events and organizations, including support for youth groups
and sport teams, and projects and activities that elevate the status of food
production and farming.
An important mechanism for influencing the collective identity and
farmers’ identification with that is through narratives.3 Shared narratives are not
2 Honorary President of ROPPA (Network of Farmers’ and Agricultural Producers’ Organisations of West Africa). Source: MEETING THE GROWING DEMAND FOR FOOD IN AFRICA Summary report, 2013)

129
simply the consequence of being in a community but they help constitute a
collective identity that supports collective action (Mayer 2014). Shared narrative
in case of POs focus on elevating the dignity of farming and the rural lifestyle,
and manifest itself in PO projects and initiatives which I will collectively refer to
as “Collective Identity Activities” or “CIA”.
Hypothesis 1: “collective identity narratives”, manifesting themselves in
Collective Identity Activities, play an important role in facilitating the growth
and competitiveness of POs.
3 The process of interviewing POs revealed considerable PO efforts in some cases around improving the dignity of farming and rural livelihoods, with narrative (on PO websites, in media interviews and in the author’s interviews) that supports the creation of a collective identity around the values of high quality production, local traditions, commitment to the development of the local community (including supporting local athletes/teams and youth sports), and elevating the appreciation for and dignity of farming, among others.

130
3.1.3 Bounded rationality
For purposes of this dissertation it is assumed that farmers are bounded
rational, that they assess the costs and benefits of PO participation based on
imperfect information available to them and use heuristics and other processing
shortcuts to make decisions about their participation in POs. Farmers’
assessments of the probability of the benefits materializing will be influenced by
their social networks and trust towards other relevant economic actors.
Bounded rationality as a framework departs from global rationality in that
bounded rational behavior is compatible with the access to information and
assessment capacity possessed by the decision maker (Simon, 1955). According
to Simon (1956), theories of bounded rationality can be generated by relaxing
some of the assumptions of utility theory (Savage 1954); namely that choices are
made (i) among a given, fixed set of alternatives, (ii) with (subjectively) known
probability distributions, and (iii) to maximize the expected value.
In recent years the bounded rationality framework has been applied to
better our understanding of farmer behavior in situations involving change away
from the status quo. In particular, the bounded rationality framework has been
used to explain farmer hesitation to switch to organic production (Brock, et.al.

131
2013) and to change their house bank (Musshoff, et.al 2009), despite seemingly
attractive financial rewards.
This approach recognizes both farmer internal constraints (cognitive
limitations or biases) as well as external constraints (farmers’ lack of access to
complete information, at least partially unpredictable benefits from PO
participation, etc). Accordingly, this work builds on the idea that farmers’
choices and decisions about market channels and behaviors (including side-
selling) exhibit bounded rationality with cognitive biases influenced by their
social networks and limitations of the information available to farmers.
In particular, I propose that farmers’ cost benefit analysis is carried out
within the framework of bounded rationality.
3.1.4 Cost-benefit analysis and PO services
When it comes to the farmers’ assessment of potential PO participation,
the farmer needs to evaluate the likely net benefit of PO participation. This
involves assessing the costs of participation including entry fees, cost of meeting
PO requirements, cost of transitioning into the formal sector and possible delay

132
in receiving payment against the expected benefits of participation, including the
value of services received, savings on inputs and price premium on sales. While
most of the costs of participation are reasonably certain at the time of the
farmer’s decision and many occurs immediately or soon after the farmer decides
to participate. The value of benefits, on the other hand, can be more difficult to
predict. Where the PO will sell the farmers’ products and any price premium is
nearly impossible to estimate and farmers’ cannot be certain of those benefits
until a few days prior, or sometimes even after, the delivery of their harvested
products. Farmers’ assessment is further complicated by the additional layer of
uncertainty related to the likelihood of the PO’s participation in modern
markets/GVCs. Therefore, based on availability heuristics, farmers are likely to
put significant weight on the reasonably tangible and predictable benefits of PO
services in their assessment of PO participation.
Therefore services offered need to go beyond the basic marketing oriented
services (sorting, storage, cold storage, packaging, collective marketing) and also
include one or more of the following:
• information and knowledge services,
• collective input acquisition,

133
• equipment use and other collective services relevant for the aggregator,
• innovation related services such as developing and testing new crop
varieties, technologies, branding, etc.
• access to finance
These services help reduce farmers’ risk and costs, achieve the quality, quantity
and attributes required by modern value chains on an ongoing basis, and
improve both productivity and efficiency and thus the chances that farmers can
collectively find markets and favorable terms for their products.
This leads to hypothesis 2:
Hypothesis 2: Services, including access to financing for farmers,
provided by POs play an important role in facilitating scaling.
3.1.5 PO Types
The existing literature differentiates two predominant types of POs,
cooperatives and IOFs. (See Section 2.8) Cooperatives are organized by
producers to materialize benefits from some collective activity such as
production, input sourcing, marketing, value added activities, information and
know-how acquisition, etc. Cooperative formation may be assisted, or even
initiated, by third parties such as NGOs but cooperative members make

134
decisions based on a democratic process (see section 2.8 for more detail) and thus
by their very structure require significant farmer collective action.
IOFs are typically initiated by offtakers or investors and the relationship
with the majority4 of the smallholders involved usually take the form of contract
farming as buyers of agricultural inputs aggregate smallholder production in
order to meet their specific supply need usually based on strictly defined
requirements and standards. IOFs’ decision-making is motivated by the interest
of their shareholders, which is usually to maximize shareholders’ wealth.
Therefore smallholder collective action has more limited importance in IOFs than
in cooperatives and monitoring and sanctioning of side-selling behavior tends to
be very strict.
A third category of PO types, hybrids, will be proposed in this
dissertation. Hybrid aggregation involves partnership between a group of
formally organized smallholder producers (often organized as a cooperative but
not necessarily) and either a larger farmer or medium size processor/buyer
(organized as an IOF) whereby there is structural alignment of incentives based
4 Smallholders or farmers may also be investors but most smallholders do not have investor relationship with the PO in the case of IOFs.

135
on mutual dependence for market access and competitiveness. Activities and
decisions are driven by the joint interest of the partners and are less dependent
on smallholder collective action.
It is hypothesized that, in line with Borgen’s findings, cooperatives are the
most vulnerable among PO types when it comes to scaling and GVC access.
Hypothesis 3: Cooperatives are at a disadvantage compared to other PO
forms in achieving the conditions necessary for GVC access.

136
4. Empirical Evidence
To evaluate the model developed in the previous chapter, both qualitative
and quantitative methods are used. Much of the evidence is based on material
collected in Hungary during multiple visits between 2008 and 2014 including in-
depth interviews with farmers, producer organizations, officials of the
association of vegetable and fruit producers, interest groups, buyer
organizations, government officials, the head of agriculture lending and
agriculture specialists at the primary financier of producer organizations and
development agency officials. In addition, a database of all Hungarian
recognized POs was assembled for the quantitative analysis from multiple data
and government sources, websites and structured interviews which.
Complementing the quantitative analysis of all Hungarian recognized
POs are two case-studies which are based on in-depth interviews with the
general manager of the producer organizations, interviews with various relevant
stakeholders including PO employees, farmers, financiers and government
officials and existing literature.

137
The hypotheses are also tested on data of aggregators from Honduras,
Costa Rica, Nicaragua and Peru, an analysis that is further informed by
interviews carried out with personnel from cooperative union organization,
NGOs and financiers.

138
4.1 Hungary
There are several considerations that led to the selection of Hungary for
the empirical analysis. First of all, it is very difficult to obtain data on POs,
especially in emerging economies, which is why most PO studies focus on case
studies or sample based approached. In Hungary the Ministry of Rural
Development set up an office dedicated to PO matters, in addition to a recent
change that made the annual reports of all Hungarian economic entities available
via a searchable database, making it possible to obtain information and collect
data on every single recognized PO in Hungary to study the entire population of
recognized POs. This is also supported by the EU’s classification of fruit and
vegetable POs which makes it feasible to track recognized POs.
Second, Hungary’s mix of farm sizes is similar to many of the least
developed countries: a relatively small number of large producers and a large
number of small producers. Third, the PO definition used by the EU policy is
unique in that it is not limited to cooperatives but includes aggregators of
smallholders regardless of their legal structure. This provides a unique
opportunity to study non-cooperative forms of POs and compare their
performance to that of cooperatives.

139
4.1.1 Background
Hungary’s land ownership structure, policy support framework and the
importance of horticulture for the livelihood of the rural poor and for the
country’s overall economy provides an opportunity to study smallholder
aggregation and to test the GVC relevant aggregation model .
Hungary has 158 agricultural producers with land of more than 2,500
hectares1 and over 500,000 small producers of 10 hectares or less, a structure
similar to many least developed countries and unlike most of its peers in the
European Union as illustrated in Figure 7.
1 Source: Agricultural Statistical Yearbook 2012

140
Figure 7. Distribution of farms by land size, 1997.
(Source: Author prepared)
Hungary has favorable natural conditions and a long tradition in fruit and
vegetable production. However, competition from imported fruits and
vegetables have been intensifying. Hungarian fruit and vegetable exports have
0%
10%
20%
30%
40%
50%
60%
70%
80%
90%
100%
Be
lgiu
m
Bu
lga
ria
Cze
ch R
ep
ub
lic
De
nm
ark
Ge
rma
ny
Est
on
ia
Ire
lan
d
Gre
ece
Sp
ain
Fra
nce
Ita
ly
Cy
pru
s
Latv
ia
Lith
ua
nia
Luxe
mb
ou
rg
HU
NG
AR
Y
Ma
lta
Ne
the
rla
nd
s
Au
stri
a
Po
lan
d
Po
rtu
ga
l
Ro
ma
nia
Slo
ven
ia
Slo
vak
ia
Fin
lan
d
Sw
ed
en
Un
ite
d K
ing
do
m
No
rwa
y
> 50 ha 20-50 ha 5-20 ha < 5 ha

141
remained stable over the past 15 years but imports have doubled during the
same period, from imports representing less than half of the export volume in
1997-2000 to more than three quarters in 2007-2010.
Approximately half of the national fruit and vegetable consumption is in
fresh form while the other half is in frozen and processed forms (FruitVeb, 2012).
EU production amounted to 61.3 million tons of fruits and 65.8 million tons of
vegetables while Hungary produced a mere 0.8 million tons of fruit and 1.4
million tons of vegetables2. Despite its seemingly small size in the global context,
in Hungary fruit and vegetables is the third most important agricultural sub-
sector in terms of output and the top one in terms of its exports.
In 2012, fruits were produced on 77,013 hectares while vegetables on
55,233 hectares. The fruit and vegetable sector provided approx. 12% of the
agricultural value produced, on 3% of the land. Approx. two thirds of this value
came from vegetable production and the remainder from fruit production. Based
on 2010 data, ninety nine percent of the 91,731 fruit producers are smallholders,
with average smallholder farm size of 0.62 hectares in comparison with average
2 According to the FAO, global production of fruits was 637.9 million tons and 1,088 tons for vegetables in 2011
142
large holding of 25 hectares. Similarly, 98% of the 25,671 vegetable farmers were
smallholders, in their case with average land size of 1.22 hectares in comparison
with large holding producing on average land size of 51.2 hectares (2012 Report
to the EU by Euriditio).
According to the Hungarian Vegetable-Fruit Sector Strategy by the
Ministry of Rural Development (FruitVeb 2012), the development of the fruit and
vegetable sector is an important national priority driven by sustainable rural
development and employment creation objectives. According to the strategy, the
fruit and vegetable sector has the potential to become the most competitive
among agricultural subsectors in Hungary and thus become well positioned to
take advantage of growing international demand. However, the report also
highlights that one of the key challenges faced is that despite Hungary’s
favorable natural endowments, producers do not produce the quality and
quantity demanded in the international markets. Currently approximately 50%
of the production is exported. The ratio of fresh vs. processed is 60:40 but
demand is shifting toward fresh produce. Modern irrigation is essential for
market driven horticultural production, not to mention irrigation’s importance as
risk mitigation especially with changing weather patterns related to climate

143
change. Only approximately 20% of Hungarian horticultural production is
irrigated despite the country’s favorable conditions both in terms of surface and
ground water resources available, making this one of the key focus areas for
development (FruitVeb 212). Another key area for development is controlled
environment horticulture. Production in green houses and tunnels need to be
increased to facilitate more year-around production capacity and in order to be
able to meet the requirements of modern markets as timely production and
harvest is increasingly difficult with weather related uncertainties. Currently
green house and tunnel production is carried out on 3,500 hectares, 85% of which
are considered outdated. Hungary’s geothermal energy sources offer a cost
effective and sustainable heat source for green houses and tunnels. Even though
Hungary’s conditions for geothermal applications in the fruit and vegetable
sector is considered one of the best in the world (FruitVeb 2012), only 6-8% of
green house and tunnel production uses geothermal heat sources currently.
Access to finance is a key barrier to the expansion of irrigation, controlled
environment horticulture and the use of geothermal energy.
The fruit and vegetable market is dominated by modern retail chains,
accounting for 54% of vegetable and 56% of fruit purchases (Domjan, 2013). The
144
market concentration in the retail sector is significant with the five largest
retailers representing 69% and the ten largest representing 93% of the market
(Domjan, 2013).
A survey of retail chains operating in Hungary (Seres, Kerteszet3 2010a,b),
found that retailers had three related objectives when it came to sourcing fruits
and vegetables: first, to cut out middle-men from their supply chains, increase
margins and reduce the number of suppliers they were sourcing from. The
survey also found that retail chains resort to importing fruits and vegetables if
they cannot source a product domestically in the quantity and quality desired.
The study revealed that retailers considered domestically sourced fruits and
vegetables better tasting and more fresh than import sources, however preferred
imports from the perspectives of easier planning, better reliability and producer
attitude towards side-selling. When it comes to volumes, they reported that
domestic suppliers often struggle to meet larger contracts, especially at times of
advertised “specials” which can involve as much as up to eight times the regular
purchase volumes. In addition, the Hungarian season is relatively short and few
3 The Hungarian horticulture sector’s weekly professional publication.

145
producers have all-year production capacity. Uniformity and high quality on an
ongoing basis was indicated as another concern with domestic suppliers. Many
retailers, especially the foreign owned ones, also highlighted the importance of
suppliers meeting their cleaning, sorting, packaging and labeling requirements.
In terms of side-selling, retailers reported that when the spot market price
exceeds the contractual price, it is not infrequent for domestic suppliers to violate
their contracts with retailers and sell their products on the spot market.
Seres et.al (2010a,b) also found that retail chains have 2-6 suppliers for
each product, driven by the desire to diversify and avoid dependence on any
single supplier. The retailers reportedly do not differentiate between large
producers and POs of smallholders, as long as they are willing and able to meet
the retailers’ requirements. Retailers, however, highlighted the disconnect with
POs in that POs often prefer to trade in multiple fruits and vegetables while
retailers prefer more specialized suppliers which can supply 3-5 products in
large quantities. The survey also highlighted the limited branding undertaken
by POs to help emphasize their products’ attributes and origin.
Some small farmers have succeeded in establishing direct relationships
with buyers in the form of contract farming, in particular in the area of highly

146
perishable and niche products which are sourced in small quantities at a time,
such as herbs (Seres, 2011). However that is the exception rather than the rule.
Beside those few exceptional cases, the only possible opportunity for
smallholders to supply modern markets is through aggregation (Hanf, et.al.).
However, studies observed that POs tend to have more problem meeting
retailers’ quantity requirements in general, which is also influenced by POs’
difficulties dealing with side-selling which in turn can lead to the violation of
their contracts with retailers (Seres et.al 2010a,b).
As far as POs are concerned, the EU’s and thus Hungary’s policy on POs
is unique in that in its definition POs4 include all farmer initiated aggregators of
all legal forms including joint stock companies, limited liability companies and
cooperatives as long as they fulfill certain requirements. (See Appendix J for
details). Fruit and vegetable producers are eligible for some support from the EU
4 POs, are defined by in the European Council regulation (EC) n° 2200/96 and as replaced by the Council regulation (EC) n° 1234/2007 (consolidated version. In order to be registered as a PO under these EC rules, the PO has to have at least 15 members, fruits and vegetables have to account for at least 50% of its sales while total annual sales have to amount to at least HUF 250 million (approx. USD1.1 million). (Sandor et.al. 2011)

147
through their POs, which creates an incentive for participation (Source: Bakucs,
et.al. 2007).
Despite such incentive participation has lagged well behind expectations.
A 2009 study (Nagyne 2009) found that 65% of family farms that do not
participate in any form of aggregation, formal or informal, despite some strong
informal networks that could serve as the basis for more formal collaboration.
Their study also found that 20% of those that participated in POs did not see any
benefit from doing so. The survey of 200 farmers suggested that the reasons for
non-participation in POs were not finding participation beneficial (37% of
respondents), lack of trust (33%), lack of knowledge about POs (26.8%), no POs is
close proximity (22%) and rejection (6.3%). This study also tried to assess the
needs of the farmers and found that the benefit that farmers would like to
achieve from POs are related to joint marketing, professional advice, and
increased security and predictability of sales and input costs.
Despite the European Union’s supportive policies of fruit/vegetable POs;
the market share of POs have not increased over the past several years either in
Hungary or in the EU (Dudas-Juhasz, 2013). In 2011 Hungarian POs coordinated
fewer than 18 thousand producers, representing 42,000 hectares, HUF 32.97

148
billion in sales, representing 18% of the Hungarian fruit and vegetable
production, compared to the target 40% (FruitVeb 2012) while most POs have
remained small (Becz 2012).
It is estimated that approximately a third of the domestic production and
40% of imports exchange hands in the informal market, creating not only lost
revenues but also representing concerns for food safety and traceability. The
value added/consumption tax of 27% is a significant deterrent for producers to
shift to the formal sector.
POs offer a range of services to their members. All POs engage with
collective marketing. However, there is great variation in terms of additional
services provided.
Despite a strong tradition of agricultural excellence and the legacy of
world record agricultural productivity levels in certain crops, agricultural
technical and technological research and development nearly disappeared in
Hungary over the past twenty years and productivity and quality in the fruit and
vegetable sector stagnated at its 1980s level (FruitVeb 2012). A few POs have
invested in own research activities and foreign expert advisors which they have

149
successfully turned into a competitive advantage especially when it comes to
selling their products internationally.
During the past twenty years specialized education and training options
relevant for fruit and vegetable producers have also declined, along with the
quality of extension services available. There are efforts to develop an
independent extension service network which is envisioned to be one of the core
activities of TESZ-ESZ, a secondary producer organization of 29 Hungarian POs,
along with R&D, training, quality assurance and advocacy related activities
(www.teszesz.hu).
However for the time being, according to some of the interviewees, in
order to satisfy the requirements of modern value chains, Hungarian
horticultural producers need to source all of their inputs, even advisory services,
from the global marketplace.
The existing literature on Hungarian POs focuses on the importance of
trust for farmers to join a marketing cooperative, highlighting both the importance
of trust among members and members’ trust of management (Bakucs et al., 2007,
2008). Some studies suggested that Hungarian farmers have low willingness to

150
cooperate, generally explained by low level of social capital and trust (Szabo
2012), but the empirical evidence on this this point is limited.

151
4.1.2 Data collection and methods
The following sources of data is used for the Hungary related empirical
analysis:
1. Two producer organization case studies; Morakert and Delkertesz;
2. Data was assembled from various sources on all the 47 Hungarian
Producer Organizations that were qualified by the Hungarian Ministry of
Rural Development as such as of April 2013 (see Section 4.1.5.1 for more
detail on the sources used);
3. Interviews with experts, practitioners, POs and farmers.
Some general findings about Hungarian POs will be provided in this
section. Next two cases will be analyzed; that of Morakert PO, the first
Hungarian PO to earn the official certified PO status and the largest PO until
2009, and that of Delkertesz PO, the largest PO since 2009. Last, the data
collected about Hungarian certified POs will be analyzed.

152
4.1.3 General interview findings
The purpose of this section is to summarize some of the general interview
findings to help provide the general context for the more detailed analysis that
follows. The findings of the interviews carried out were for the most part
consistent with the existing literature. While the existing literature explains the
low participation rates in POs with lack of trust and weak social capital as a
result of the collective memory of forced collectivization, the interviewees often
portrayed a more nuanced picture. While the interview did confirm concern
about the trustworthiness of POs, especially PO leadership, they also revealed
careful farmer cost-benefit calculation regarding PO participation. In addition,
the interviews revealed strong social networks and social capital among at work,
at least on a small and highly socialized scale5, among farmers, in contradiction
with the assertions of some of the existing literature.
For example both Morakert and DelKERTESZ, the two subjects of the detailed
case studies, had their origins in cooperatives founded in the 1960s and have
5 It was not an objective of this study to assess or measure social capital. Nonetheless, the semi-structured interviews revealed some strong social network and social capital dynamics that the author feels is relevant to point out.

153
successfully motivated producer cooperation even after the political, social and
economic turmoil of the 1980s and 90s. However, some expert interviewees
noted that farmers often do not organize spontaneously, and some form of third
party facilitation or motivation from respected individual is necessary. Farmer
interviews revealed high degree of willingness to cooperate among farmers, but
mostly informally and not in the form of POs despite the significant promotion
policies. Examples of farmer barter arrangements are notable, whereby farmers
specialize within a community both in terms of assets (for example agricultural
equipment) and expertise and they help each other based on the on the
expectation of mutuality, without cash payment. Such willingness to cooperate
did not translate into general trust, in fact some of the same farmers with
willingness to cooperate through such barter arrangements expressed high
degree of suspicion towards 3rd parties from outside their community that
attempts to engage with them. There was considerable skepticism expressed
about POs. Interviewed farmers highlighted the transaction cost of cooperation
via POs (“we don’t have time and energy”), the desire to maintain their
autonomy as opposed to being told what to grow and how (“producers have a
desire for freedom”) and skepticism about the government support available

154
(“we know people who started 14 POs and received related subsidies while
others tried to start one for 3 years and did not succeed”) as barriers to starting or
joining a PO. Others have indicated prior PO membership but discontinued
their memberships due to frustration about the cost of compliance and high crop
rejection rates. Several farmers expressed comfort with selling via traders in
their own communities who were usually well known by them (in several cases
even relatives). According to the farmers such traders would sell the crops to
small shops and stands around the Lake Balaton.
Interviews with PO leaders revealed optimism about the prospects of fruit
and vegetable production in Hungary due to the favorable natural conditions but
also revealed considerable challenges in the areas of (i) market dynamics with
modern market buyers, (ii) coordination of smallholders, especially when it
comes to persuading them to grow the same, especially new varieties, and (iii)
with governmental reporting and other red tape and requirements imposed on
POs.
Retailers sign framework agreements with POs with contract terms being
fixed only a week or two prior to delivery. Even the largest POs have little

155
negotiating power and influence on the terms of the contracts. Contract terms
are determined by the retailers almost unilaterally and it is not uncommon for
retailers to modify even the contractually agreed prices in case products are
subjected to some special promotion. Retailers only source from the larger POs
that can guarantee to deliver the expected quantity and quality of products and
failure to do so results in significant penalties.
4.1.4 Case Studies
Case studies were prepared on two Hungarian aggregators, Morakert
Producer Organization (“Morakert”) and Arpad/Del-Alfoldi Kerteszek Producer
Organization (“Arpad”/”DelkerTESZ”). Both of these POs sell a significant
portion of their production to GVCs, mainly retailers.
Morakert was the largest and most successful PO in Hungary until its
sudden downfall in 2009, after which DelkerTESZ became the largest PO. Both
POs operated in Csongrad district in South-East Hungary, in the Hungarian
plains. They both focused primarily on pepper and tomato production for the
fresh vegetable market, selling to supermarket chains as their primary marketing
channel. However, there are some key differences in the two POs’ business

156
models and strategies which, at least in part, may help explain the different
outcomes.
The case studies were prepared based on extensive literature review and
interviews of the general managers of both producer organizations, industry
experts, representatives of industry membership organizations, peer producer
organization leaders, farmers, development professionals, and financiers active
in assessing and funding POs.
4.1.4.1 Morakert
Morakert Cooperative was the showcase PO for many years, not only in
Hungary but also internationally. Morakert was founded in 1995 with 52
members in Morahalom, a small town in the Great Plains region of Hungary, and
was the first Hungarian cooperative to receive certified PO status in 2002.
However, its predecessor organizations had been in existence since the 1960s.
The number of members at one point reached 792, integrating 2428 hectares.
Morakert operated in an agricultural area of the country where agricultural
production is “more or less the only” source of livelihood for the population
(Bakucs. et.al. 2007). Climate and soil conditions favor vegetable and fruit
157
production and the most important crops cultivated are various types of
tomatoes and peppers, cabbages, onions and potatoes.
After the traditional agricultural cooperatives ceased activity in the early 1990s,
1,500-1,800 smallholders in the Morahalom region (cultivating 3-5 hectares)
attempted independent production. A lose network of producers was
established in 1994 (Common Agricultural and Entrepreneurial Society of
Morahalom) with government support to help strengthen the producers.
However, their greatest problems were not addressed and struggled partly due
to the oligopolistic and monopolistic situation faced in both the input market and
when trying to sell their products (Bakucs. et.al. 2007). As a result, the local
authorities established various programs and organizations for the support of
smallholders. Morakert Purchasing and Service Cooperative was set up in 1995
in this reasonably supportive local policy environment. Members owned their
own land and assets for farming. The cooperative coordinated purchasing and
marketing and had cold storage facilities and trucks. Joint purchasing allowed
members to reduce their costs by 18-20% (Bakucs. et.al. 2007). Morakert, and its
member producers, focused primarily on peppers and tomatoes, while also

158
active in producing and marketing lettuces, carrots, potatoes and parsley.
Morakert purchased produce from both members and non-members6 and carried
our sorting, packaging and storage with the aim of selling most of the aggregated
crops to retail chains.
Morakert made considerable investment in infrastructure that helped enhance
the value of members’ products and meet the food safety, environmental and
hygiene requirements of buyers. This included a sorting and packaging line,
cold storage depot and transport vehicles. The handling, sorting and packaging
line became operational in late 1999. Morakert opened its “agri-logistics
centrum” in 2002 which, among others, included cold storage facilities and was
further expanded in 2006. These investments were partly aimed at, and were
critical for meeting, modern value chains’ food safety and quality requirements.
Similarly to other cooperatives, new members had to purchase ownership
share in Morakert, the value of which increased steadily over time from HUF
25,000 in 1995 to HUF 180,000 in 2006. To be able to make the abovementioned
6 Members, however, had preferential treatment: they had a contract with Morakert while non-members were only called upon when members could not supply the necessary goods.

159
investments, new members also had to make a one time fixed “investment
contribution” of HUF 330,000, a considerable barrier to smaller producers (Szabo
2012). Members also paid 4.6% of their revenues as a membership fee and
contribution towards the operating costs of Morakert (which was then matched
by EU subsidies).
In addition to coordinating joint input purchase and marketing, Morakert
was also actively involved in providing information and advisory services to its
members. Morakert signed framework agreements with its members and
allowed 10% variation from contracted quantities. Morakert did not penalize
contract violations but paid a 2% premium to members who stayed within the
contracted range. Nonetheless, Morakert still experienced very poor contracting
discipline which led to the introduction of pre-financing for those members only
that delivered at least 80% of the volumes they contracted for, as an additional
incentive for compliance.
Purchasing from non-members was key for achieving scale; in fact
Mezokert sourced from 2,000 non-members. PO rules state, however, that the
PO had to source the majority of traded goods from its members, which led to

160
the need to establish a limited liability company in 2005 that was a member of
the PO and was responsible for purchasing from non-members and even
importing, as needed. The retailers Morakert supplied typically require supply
all year around which Morakert was not always able to satisfy from domestic
production, especially in the winter months.
A survey of 44 Morakert members (Bakucs et.al 2007) revealed that
members were selling 59% of their vegetables and 21% of fruit production
through Morakert. 34% of producers sold all of their production to Morakert,
50% to 2-6 buyers and the remainder to more than 6 buyers. The survey also
revealed that what most influenced members’ choice of PO on average were the
(1) volumes the PO was trading, (2) existence of contract, (3) flexibility and (4)
trust.
Prior studies (Bakucs. et.al, 2007) attributed Morakert’s success to the trust
the leadership was able to establish. “The issue of trust is the true secret and key
to the success of the cooperative” (Bakucs, et.al. 2007).
Morakert supplied most of the major retail chains and their share within
Morakert’s sales increased over time while Morakert also exported (approx. 20%
161
of its turnover) to over a dozen European countries. The proportion of
production sold to retailers increased from 5-10% in the earlier years of
operations to 90% by 2006 (Racz 2006), While retailers offered a stable market for
Morakert, even during its years of prosperity the Morakert leadership noted how
challenging it was to meet the exact requirements of retail chains and to work
with their terms of trade, especially payment terms. Morakert used HACCP,
GLOBALGAP and BCR quality assurance systems to meet legal and market
requirements (Szabo 2012).
Morakert put great emphasis on differentiating its products via branding
and anecdotal evidence suggests considerable consumer awareness of the
Morakert products. In particular, Morakert created an image associated with
Hungarian grown fresh tasty food, something that resonated with many
domestic consumers. Morakert also provided basic extension services to its
members on an “as-needed” basis and occasional training courses.

162
Morakert was considered a PO success story internationally for many years. The
Regoverning Markets7 project even published an English language case study in
2007 as an example of successful innovation to connect small producers to
markets and as the most successful Hungarian PO (Bakucs et.al. 2007). The
authors argued that three factors had contributed to Morakert’s success. First,
the screening of potential members. Second, strict rules to enforce the quality
and quantity requirements of the PO…. Third, the trust that the leaders of
Morakert were able to establish with members. These elements helped form the
perspective of a “private contract enforcement mechanism” that played a key
role in preventing side-selling.
However Morakert started experiencing problems in the 2nd half of 2008
which further escalated in 2009. The financial crisis at the time made it more
challenging and costly for Morakert to obtain financing, even for working
capital. The Southern-Eastern part of Hungary was hit by a particularly poor
tomato season and Morakert had to import tomatoes from Spain in order to meet
its contractual obligations with large retailers, which in turn required bank
7 http://www.iied.org/regoverning-markets

163
financing. The cost of bank financing and tight repayment schedule made it
difficult for Morakert to pay its members for the products they delivered.
Morakert’s management called a meeting to explain the situation and asked for
its members’ understanding, trust and patience. Some members initially granted
that trust and continued delivering their crops despite the significant uncertainty
regarding when they would receive payment, but they were in the minority.
Fewer and fewer producers brought their products to Morakert and the PO had
to increasingly rely on purchases from non-members and imports to comply with
its contractual obligations with retailers. At the same time local newspapers
published accusations that members of Morakert’s management were personally
becoming rich from Morakert’s activities.8 Subsequent articles made claims of
business interests and lavish homes having been built across the Hungarian-
Romanian border in Hungarian speaking Transylvania, further undermining
producers’ willingness to supply Morakert. (These accusations have not been
proven to have any foundation according to the author’s research.)
8 I was unable to find written record of those articles; the local newspapers do not have comprehensive online archives. However, these accusations have been mentioned by Morakert management as well as farmers interviewed.

164
One cannot help but wonder how the strong social capital and trust that
Morakert was internationally famous for could so quickly disappear on the basis
of some empty accusations and temporary financial challenges. It is important to
note that the nature and structure of these financial difficulties were not
unprecedented at the time and there were several POs that successfully managed
those challenges. In addition, given Morakert’s stature in the market and it is
region in particular, public support was also promised (even though it is unclear
how much, if any, was delivered).
However, there was another force against Morakert that contributed in
significant ways to the loss of member trust and to the PO’s ultimate demise.
Morakert’s products had a strong Hungarian identity. The packaging reflected
the national colors, advertising and marketing strategies centered around the
Hungarian product identity. Morakert opened two full time stores of its own in
Morahalom and Szeged (fourth largest city in Hungary) in 2007 with the stated
mission of making high quality Hungarian products available directly from POs
to consumers, where in addition to its own products, it was also selling

165
complementary products (eggs, meat, etc.) from several other POs. 9 The success
of those stores was followed by the very public opening of a third store in
downtown Budapest in September 2008 and the declaration of the opening of 7
additional stores in major cities around the country. The publicity around the
store openings repeatedly highlighted the mission of making high quality, fresh
Hungarian food products produced by POs available directly to consumers,
which was were well received. 10
Against this backdrop, it caused considerable shock when a reputable
Hungarian weekly magazine published an article about Jordanian peppers being
labeled as Morakert products (168 Ora, 2010), which in turn led to numerous
news reports, local articles and blog posts on consumer websites. The articles
remarked not only about the misleading practices but also about the poor taste
and aroma of the peppers purchased under the misleading label.11 Morakert did
9 http://www.delmagyar.hu/szeged_hirek/betort_szegedre_a_morakert/2016248/ 10 http://www.elelmiszer.hu/fmcg_szakmai_hirek/cikk/morakert__markabolt_nyilt_budapesten 11 To fully appreciate the sensitivity involved it is important to consider the importance of
peppers in Hungarian life. Peppers is one of the staples and one of the most widely grown vegetables. It is eaten daily by Hungarians in fresh and cooked forms, dried spice form and pickled form, just to mention a few. It became a subject of national pride during the Austrian domination of Hungary (Sasvari, 2005). Its prominence was further strengthened by its

166
offer an official explanation suggesting that during times of limited domestic
production it was unavoidable to source from abroad in order to meet its
contractual obligation with retailers that needed fresh fruit and vegetable
supplies all-year-around. The labeling used was not misleading, according to
Morakert’s explanation, it simply stated that the produce was packaged by
Morakert while it showed Jordan as the country of origin.
Nonetheless, such events were not only detrimental in terms of shaking
public confidence in Morakert that had been successfully tapping the “patriotic
consumer” market. One of the blog posts provides a good reflection of the
change in public sentiment: “I trusted them 100%. It was enough for me to see
their label and so it [the product] went into the shopping basket. After this I will
skip them altogether.”
Producers, who take a lot of pride in growing their Hungarian peppers,
also expressed strong resentment. Farmers expressed anger and humiliation and
nutritional benefits and other applications that built even more national pride such as Hungarian Albert Szent-Gyorgyi’s isolation of vitamin C from peppers which earned him a Noble Prize.

167
rejected the idea of the products they grow with much care and pride under
Morakert’s brand were being subjected to suspicion and rejection from the
public. The fiasco with the Jordanian peppers did not only compromise the
Morakert brand that was built on a Hungarian identity and shook consumer
trust, but it also led to the overnight loss of collective identity that existed among
the producers who had been growing the products sold under the Morakert
brand with considerable dignity and pride.
Morakert went under bankruptcy proceedings in 2011 which has not been
completed to date. Morakert had HUF3.6 billion in debt, a third owed to its
suppliers. Table 7 illustrates the evolution of Morakert’s membership and
revenues and its quick demise following the above chain of events. For more
detailed financial statement and indicators please see Appendix M.
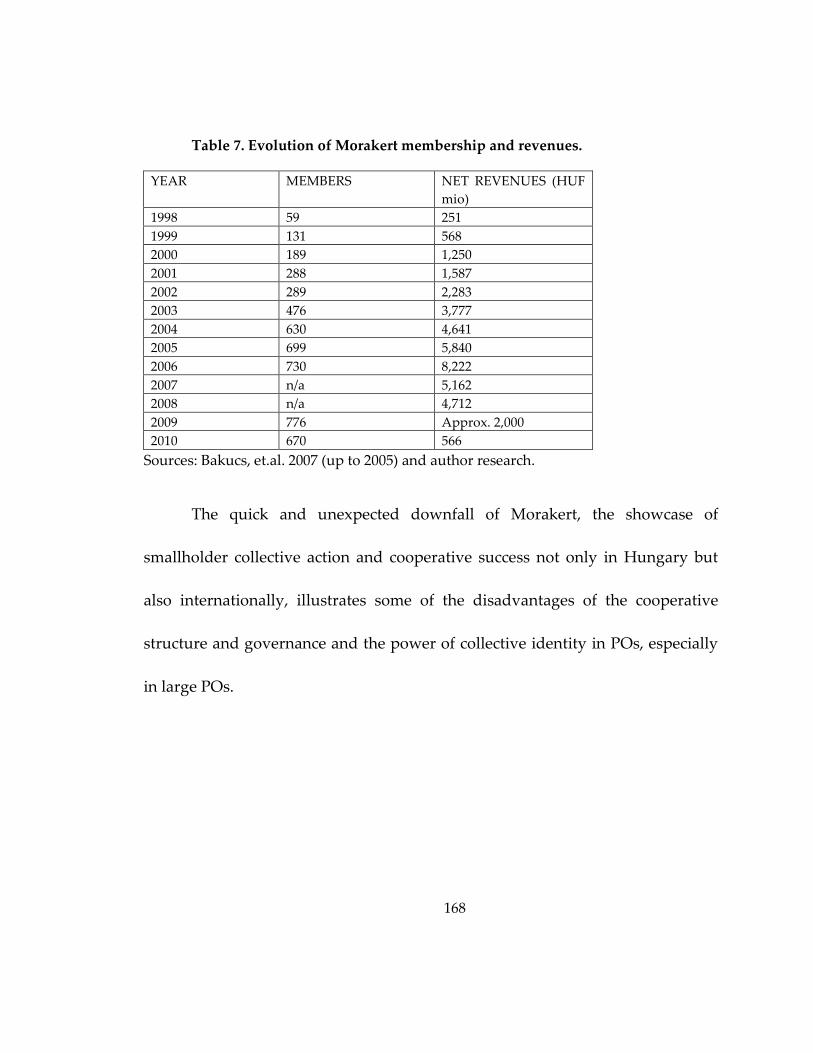
168
Table 7. Evolution of Morakert membership and revenues.
YEAR MEMBERS NET REVENUES (HUF mio)
1998 59 251 1999 131 568 2000 189 1,250 2001 288 1,587 2002 289 2,283 2003 476 3,777 2004 630 4,641 2005 699 5,840 2006 730 8,222 2007 n/a 5,162 2008 n/a 4,712 2009 776 Approx. 2,000 2010 670 566
Sources: Bakucs, et.al. 2007 (up to 2005) and author research.
The quick and unexpected downfall of Morakert, the showcase of
smallholder collective action and cooperative success not only in Hungary but
also internationally, illustrates some of the disadvantages of the cooperative
structure and governance and the power of collective identity in POs, especially
in large POs.

169
4.1.4.2 Del-Alfoldi Kerteszek Cooperative (DelkerTESZ)
DelkerTESZ took over from Morakert as the largest PO in Hungary after
the latter’s decline. DelkerTESZ was founded in 2002 with 237 members,
headquartered in Szentes, 79 kilometers from Morahalom, in the Great Plains
region of Hungary. It integrates 347 hectares, 136 of which covered with green
houses and tunnels where participants carry out sustainable intensive
production in most cases year around.
Delkertesz’ largest member, Arpad Zrt, formerly Arpad Cooperative, had
been involved with aggregating smallholders since 196012. DelkerTESZ achieved
formal PO status in 2004. Most of DelkerTESZ’s members are small, with over
80% of members selling less than 4 million forints (approx. US$18,000) of value
annually to DelkerTESZ, many selling less than 1 million forints in value. About
half of DelkerTESZ’ turnover originates from its largest member, Arpad Zrt13,
which play an important role in DelkerTESZ ability to plan and manage risks.
The partnership with Arpad also plays an important role in providing
12 Arpad used to be a cooperative but it is now a joint stock company; a member of DelkerTESZ, a cooperative, along with hundreds of small farmers.
13 Zrt stands for closed joint stock company.

170
DelkerTESZ’s smaller members advisory, technical and innovation support
leveraging the activities and related research that it would carry out for its own,
larger scale production regardless.
At the end of 2012 it had 504 members and its sales amounted to 5,947
million HUF for 2012 (approx. US$27 million), mostly via member activity. Non-
member related revenues represented approx. 6% of sales. Interested producers
have to deliver products to DelkerTESZ for a one year test period without any
member benefits before they can be considered for membership (Szabo 2012).
DelkerTESZ and it members have focused on the production of
Hungarian peppers 53%, tomatoes 17%, various other types of peppers 17%,
cucumbers, watermelon, cabbages. This production profile has been more or less
consistent with only minor variations over the years, with peppers and tomatoes
being the primary products, representing over 80% of sales. Most of
DelkerTESZ’ members carry out production in glasshouses and plastic tunnels
(Szabo 2012). DelkerTESZ provides various services to its members including
collective input purchases, financing for inputs, extension services and
agronomist advice and support with quality assurance systems and the
171
development of member farms. An industry expert interviewed for this study
highlighted the importance of DelkerTESZ’ relationship with its members as key
to its success, stating that “DelkerTESZ’ approach to its members was
characterized by service and humility”.
Over 50% of sales involved retailers in 2012. While the volume sold to
retailers has been increasing over time (2012 sold 28% more to retailers than year
before), as a ratio within total sales, retailer chains’ share has been stable at
slightly above 50% (2005: 51%). Exports have not been growing at pace of the
cooperative’s growth. Exports represented 18% of sales in 2012 compared to
24.5% in 2005. The balance was sold to other retail outlets and processors, in
other words other modern market value chains. In fact almost 100% of
DelkerTESZ’ products are sold to modern markets, with only a very small
negligible fraction sold to the traditional wholesale market. This is part of a
diversification strategy for DelkerTESZ.
A unique feature of DelkerTESZ’ model is the premium paid to farmers at
the end of the year. Eligibility is determined, among others, based on quality,
whether the farmer delivers 100% of the production to the cooperative,

172
participates in extension services and uses the recommended inputs and
pesticides. This has proven to be a highly effective incentive scheme that led to
biological pest control use rising from 16% to 87% of farmers between 2003 and
2012 (Szabo 2012). DelkerTESZ also takes sanctions seriously: 11 farmers were
excluded in 2012 for non-compliance.
DelkerTESZ was one of the early adopters of technological innovations
among Hungarian POs. In 2007 it introduced a bar code based traceability
system, in addition to 4000 square meters of cold storage, a 2500 m2 climate
controlled packaging area, state of the art sorting and packing lines, and
information management systems.
Research and development has been integral to DelkerTESZ’ history.
Arpad built strong collaborations with relevant professional and research
organizations and universities. It carefully selects the varieties it grows and
instructs farmers to grow. It has been core to its business model to build a strong
advisory team to work with farmers, in fact it is mandatory for DelkerTESZ
members to use the advisory services. In order to comply with the strict
requirements of the retailers, DelkerTESZ also implemented a monitoring system

173
to supervise members’ use of pesticides. A key objective of DelkerTESZ is
ongoing development and accordingly it encourages its members to
continuously modernize and improve their agricultural practices, in particular in
the area of integrated crop management, new varieties and the use of biological
pesticides. Its focus is on minimizing the environmental burden of agriculture
while improving quality, productivity and competitiveness. As part of this effort
it carries out regular soil and water tests and develops the formula for plant
protection to ensure minimal and optimal fertilizer use. It regularly
communicates these recommendations to members and 3-4 times during the
winter it offers classes on better farming practices. The advisory and training
activities also include helping members comply with GlobalGAP.
DelkerTESZ trademarked “Peppers from Szentes” which is added as a
label to the packaging. Over the past decade DelkerTESZ moved from selling
only 10-15% of its products in packaged format to over 75% in 2012. Packaging is
an important value added service that DelkerTESZ provides to its members but
the brand developed helps build pride among members. While DelkerTESZ’s
fixed asset investments are only about a third of what Morakert had in its prime

174
days, it does maintain a community building for member activities. Arpad and
Morakert also support local community events such as sport games. This was in
fact also reinforced by Dr. Miklos Csikai, President of Arpad, in an interview
with a local TV station, where he explained that their priorities were to support
local community events as opposed to national ones.
DelkerTESZ is regularly represented at domestic and international
agricultural and food fairs to stay abreast of the latest market developments and
to promote awareness of its products. It has also been winning awards and
gaining recognition for its products at such events, enhancing the recognition
and reputation of its brand and producers. It also partners with retailers for
special initiatives such as “Tradition and Taste” and others showcasing
traditional Hungarian varieties (Szabo 2012).
DelkerTESZ has its own store where it sells inputs needed by its members.
It also extends interest-free credit for input purchases to all of its members (100
days term).
DelkerTESZ uses contracts with its members. Producers commit to a
minimum amount that they have to supply. Violation of that can lead to the

175
exclusion of a member (a right that DelkerTESZ has been exercising in contrast
with other POs). Other forms of risk mitigation that DelkerTESZ can leverage in
its ability to meet its own obligations to retailers and processors are the
significant production volume from Arpad that is exclusively sold via
DelkerTESZ and the high proportion of intensive and greenhouse/tunnel based
production.
DelkerTESZ’ bookkeeping is very transparent with the intention of
making it easy for members to understand the cooperative’s finances.
DelkerTESZ initiated the establishment of Hortico-Regio Ltd., a secondary
PO, in 2009 in partnership with 3 other POs as well one jointly with Morakert for
export activities. DelkerTESZ was also a founding member of TESZ-ESZ
Nonprofit Ltd, a secondary PO focused on training and research.
DelkerTESZ maintains good relationship with two commercial banks. A sign of
its bankability is the fact that neither bank cut DelkerTESZ credit limits during
the economic crisis which enabled DelkerTESZ to maintain its revenues during
those years (Szabo 2012). Nonetheless, the lack of financing is the most serious
obstacle faced by DelkerTESZ when it comes to its further development,

176
including the ongoing access to value chain finance necessary to pay its members
well before the PO gets paid from its buyers (Szabo 2012). (Please see Appendix
N for Delkertesz’ financial indicators).
The DelkerTESZ case illustrates some of the advantages of non-
cooperative PO structure and governance, in particular from the perspective of
sanctioning free-riding and mitigating market risks. The case further highlights
the importance of services offered by POs, the importance of access to finance
and the power of collective identity supporting PO activities (“Collective identity
activities” or “CIA”).
4.1.4.3 Comparative Analysis of Morakert and DelkerTESZ
Both of the POs covered in the case study analysis had access to GVC,
including retailers and processors. For both POs retailers represented the largest
market channel. Despite the fact that the two POs analyzed are the largest in
Hungary, they nonetheless have little influence on the terms of the contracts.
Retailers sign framework agreements with POs with contract terms being fixed
only a week or two prior to delivery. While Morakert nonetheless sold the

177
majority of its products via retailers, DelkerTESZ had a more careful
diversification strategy which involved various market channels and sales of to
retailers kept at approx. 50%.
Morakert was a cooperative with limited market certainty and strong
alignment of incentives among PO participants. DelkerTESZ is a symbiotic
hybrid with medium degree of market certainty and medium alignment of
incentives since Arpad, a mid size producer, is a producing member of the
cooperative (i.e. nucleus model with one large and many small producers) while
the Arpad group also serves as a partner to the DelkerTESZ cooperative.
Morakert’s heavy reliance on retail contracts that required significant
contract size and on-time delivery, in combination with its cooperative
governance, made it difficult to sanction the side-selling activities that were so
prevalent among Morakert members, especially given the cooperative’s practice
of significant sourcing from non-members (threatening sanctions would have
risked member exit while still able to sell to PO as non-members, an issue several
Hungarian POs are struggling with).

178
DelkerTESZ, jointly with Arpad, provides the full range of PO services to
its members and is selective about taking new members (testing period with no
member benefits), helping to not only ensure the quality and quantity of
production but also reinforcing farmer discipline and minimize opportunistic
behavior and side-selling. Morakert, on the other hand, offered somewhat more
limited services to its members and the significant ongoing sourcing activity
from non-members undermined the value associated with membership. (In fact
based on farmer interviews, farmers considered Morakert as a market option
whereby they would make weekly decisions on whether to sell some of their
crops to Morakert, similar to how they regarded the local traders.) In the case of
DelkerTESZ, in contrast, membership resembles more of a “club good” which is
made possible by its hybrid character and comprehensive sophisticated services
provided.
The combination of DelkerTESZ’s branding, commitment to
environmentally sustainable and high quality production as well as ongoing
innovation, sponsorship of local community events and “club good” approach to
membership created a collective identity that DelkerTESZ and Arpad leaderships

179
reinforce on an ongoing basis through website communication, international
exhibitions, awards, interviews, etc. Morakert, on the other hand, also fostered a
collective identity as the “Hungarian producer” which very much resonated with
both producers and consumers. However this one-prong identity strategy did
not build well on the true strengths of the PO given that it had limited year-
around production capacity and relied on significant imports in its operations.

180
4.1.5 Study of the 47 Hungarian Producer Organizati ons
The purpose of this section is to test the hypothesis outlined using mixed
methods on the population of Hungarian POs.
4.1.5.1 Data on the 47 Hungarian POs
The list of all Producer Organizations (“POs”) that were qualified by the
Hungarian Ministry of Rural Development as such as of April 2013 was obtained
from the Hungarian government’s website. Information about each of these POs
was obtained via interviews and a database that includes financial information
on most POs. Additional interviews were carried out with government officials,
development professionals, NGO representatives, farmers, traders and lead
firms.
4.1.5.2 Background on Hungarian Producer Organizations
Under a supportive policy framework, producer groups have been formed in
Hungary since the late 1990. Those that meet the criteria outlined in Appendix J
are recognized officially as a “producer organization” or PO. Table 8

181
summarizes the evolution of the number of recognized POs in Hungary. The
number of POs have remained relatively stable over the last few years with 42-43
recognized POs in the country.
Table 8. Key statistics of PO formation
Source: Author prepared and updated based on Dudas et.al. 2013 and governmental sources
After early challenges, the EU accession and resulting financial incentives
provided a boost to the formation of POs. A 2008 EU legislation imposed a five
year limit on temporary “producer groups,” farmer groups that were working
towards achieving PO recognition, starting April 2009. This resulted in a wave
of mergers among those smaller producer groups in 2008 and 2009 leading to the
formation of 37 new POs (Dudas et.al. 2013). The number of producers involved
in POs have remained low ranging between the low 4,000s and 14,000s over the
years and have been declining since 2009 even though the number of POs have
slightly increased. According to interviews carried out for this study, this
Approved EOPs 1999 2000 2001 2002 2003 2004 2005 2006 2007 2008 2009 2010 2011 2012 2013
Total 0 0 0 1 1 8 7 7 9 11 33 48 42 43 42
New approval 0 0 1 0 7 0 0 2 3 22 15 1 1 2 n/a
Cancelled approvals 0 0 0 0 0 1 0 0 1 0 0 7 0 2 n/a
EARLY CHALLENGES JOINING EU CONSOLIDATION STAGNATION

182
reduction is widely attributed to the smallest producers withdrawing from POs.
This trend is well reflected in both the average membership declining from its
high of 1,348 member per PO to 285 in 2012 and in the average land size
cultivated by PO members steadily increasing from its low of 0.71 hectares (1.8
acre) per producer in 2005 to 2.34 hectares (5.78 acre) in 2012. Nonetheless, the
average land area per PO has declined considerably from its high of 1,552
hectares in 2004 to 667 in 2012 due to move towards higher intensity production.
These figures underestimate cultivated land size because they do not capture the
non-PO land cultivated alongside the growing number of hybrid POs and non-
member producers that POs purchase from. Nonetheless, the trend is clear that
the average size of PO members is increasing, a fact also highlighted by several
interviews.

183
Table 9. Evolution of PO membership in Hungary
2004 2005 2006 2007 2008 2009 2010 2011 2012
NUMBER OF
RECOGNIZED
POs
4 4 4 6 8 40 40 42 44
TOTAL
MEMBERS
4,513 5,394 4,313 4,191 4,178 14,253 12,984 13,091 12,531
AVERAGE
MEMBER
1,128 1,348 1,078 698 522 356 324 312 285
TOTAL LAND
AREA
6,208 3,856 3,933 6,242 5,538 33,418 27,279 29,634 29,354
AVERAGE LAND
AREA
1,552 964 983 1,040 692 835 682 706 667
TOTAL AREA /
MEMBER
1.38 0.71 0.91 1.49 1.33 2.34 2.10 2.26 2.34
The data collected on the Hungarian aggregators include 20 cooperatives,
14 investor-owned firms (IOFs) and 8 hybrids. 32 of them are certified, i.e. their
compliance with lead firm required food safety and other standards is third
party verified. 14 17 of the POs export at least 10% of their products and 31 sell to
modern value chains.
A database was developed with information about all of the 42 approved
POs with an attempt to collect as much information as possible to enable the
14 As described in more detail in Section ?, certification is costly for producers, especially smallholders due to the fixed cost involved, but it reduces the transaction cost of doing business with smallholders for other value chain actors and thus may enhance smallholders’ ability to access modern markets.

184
analysis of different PO types and their ability to scale and do business with
modern markets and GVCs. The variables available are summarized below.
Age: age of organization, in years
Sector: Subsectors within fruits and vegetables that the PO is operating in
Members09 (number of members in 2009) and members12 (number of
members in 2012)
Corpdummy: dummy variable with value of 1 if organization is IOF
Hybriddummy: dummy variable with value of 1 if hybrid organization
Hectarvfm: land area under cultivation by the members of the
organization
Collective identity: dummy variable for collective identity activities (CIA)
provided.
Rdinnov: dummy variable for research & development and innovation
related services.
Collective services: dummy variable for collective services offered such as
collective input purchase for improved negotiating power, collective equipment
and machinery use, etc..
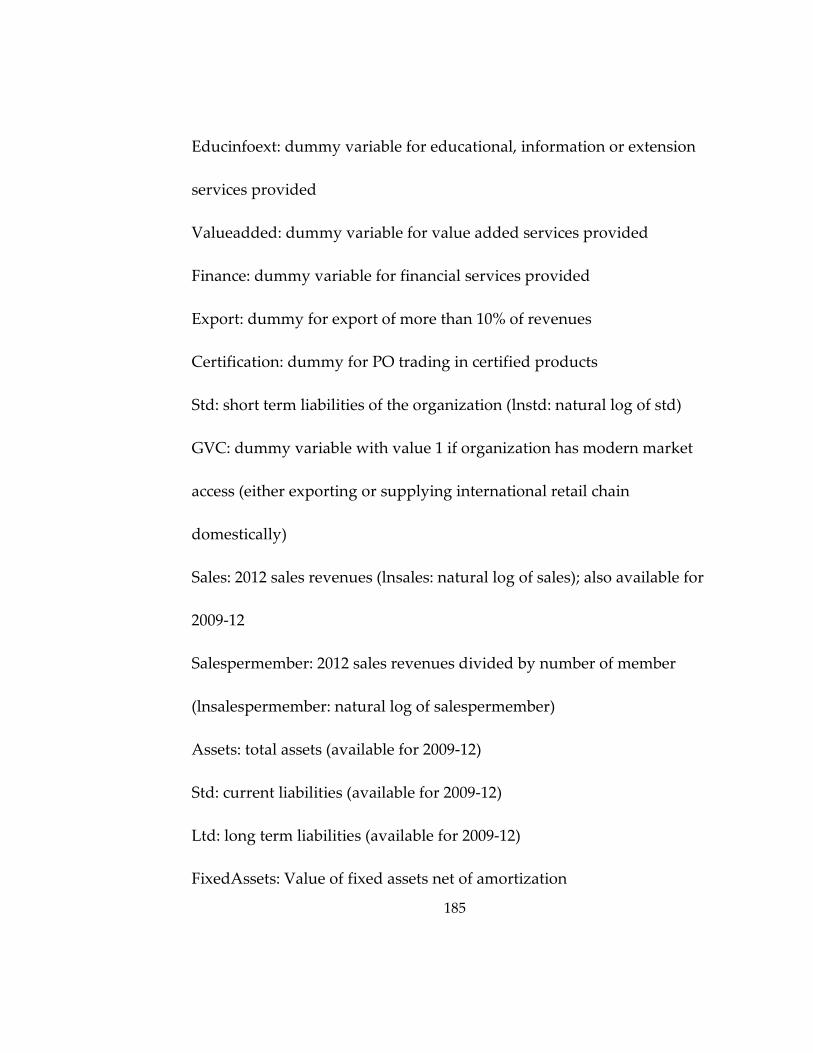
185
Educinfoext: dummy variable for educational, information or extension
services provided
Valueadded: dummy variable for value added services provided
Finance: dummy variable for financial services provided
Export: dummy for export of more than 10% of revenues
Certification: dummy for PO trading in certified products
Std: short term liabilities of the organization (lnstd: natural log of std)
GVC: dummy variable with value 1 if organization has modern market
access (either exporting or supplying international retail chain
domestically)
Sales: 2012 sales revenues (lnsales: natural log of sales); also available for
2009-12
Salespermember: 2012 sales revenues divided by number of member
(lnsalespermember: natural log of salespermember)
Assets: total assets (available for 2009-12)
Std: current liabilities (available for 2009-12)
Ltd: long term liabilities (available for 2009-12)
FixedAssets: Value of fixed assets net of amortization

186
(available for 2009-12)
Member: number of members
Memberch: percentage change in the number of members between 2009
and 2012.
Those used in the analysis are the following:
Highservice: Dummy variable for POs that offer services in 4 or more of
the service categories.
In addition, various ratios were calculated based on the above variables
and tested in the models. For the sources of information and more detail,
please see Appendix O.

187
4.1.5.3 Analysis and discussion.
Hypothesis 1: “collective identity narratives”, manifesting themselves in
Collective Identity Activities, play an important role in facilitating the growth
and competitiveness of POs.
Copy of the GVCRA model proposed in section 3, with the component under
discussion (“Collective Identity Activities”) highlighted
Ten of the Hungarian POs have been found to offer collective identity
activities or CIA’ (see 4.1.4.2). CIAs include activities that foster the PO’s
collective identity and/or members identification with the collective identity.
!
!
!
!
!
!
!
!
!
!
!!

188
Examples of collective identity building activities may include sponsorship of
local community events and organizations, including support for youth groups
and sport teams, projects and activities (including demonstration projects and
awareness raising) that elevate the status of food production and farming and
participation in or organization of professional events that highlight the benefits
of certain production methods practiced by the PO (for example sustainable or
organic, sustainable intensification, use of renewable energy, etc.). PO activities
that help foster members’ identification with the collective identity include
activities and events organized for member such as lectures, study tours and PO
celebrations (harvest, awards, etc).
Table 7 summarizes the key statistics for POs with and without such
services. POs not offering CIA don’t differ considerably from their CIA offering
counterparts in terms of long term financing. Every other indicator, however, is
more favorable for POs with CIA from the perspective of scale.
CIA POs on average have 419 members (median of 317), cultivate on
average 956 hectares, have average sales of $6.5 million (median of $4.8 million),
with average sales per member of $35,000 and sales per hectare of $15,000 and
average fixed asset of $2.3 million. Their sales grew on average by 100% between

189
2008 and 2012 and their assets by 145%. They offer on average 4 services to their
members (median of 5), 90% have certification and 70% export.
This is in contrast with non-CIA POs that have on average 251 members
(median of 90), cultivate on average 615 hectares with average sales of $3.2
million (median of $2.0 million), with average per member sale of $32,000, sales
per hectare of $6,000 and average fixed asset of $1.9 million. Their sales grew on
average by 37% between 2008 and 2012 and their assets by 5%. They offer on
average 3 services to their members (median of 3), 72% have certification and
31% export.
This is despite the fact that the average (and median) size of CIOS POs’
members was slightly smaller than their non-CIOS counterparts’.

190
Table 10. Summary statistics based on collective identity activities offered
To further analyze the role of CIA on scaling, change in the POs’ membership
between 2009 and 2012 was used as independent variable. While the core model
illustrated the importance of high PO services for membership growth while
R&D / innovation related services and collective identity activities (CIA) were
significant in the full model, CIA loses considerably from its significance when
“collective services” are introduced at least in part due to the correlation of these
variables (correlation coefficient of 0.4258). It is not surprising that POs with
emphasis on collective identity also are more likely to provide collective services
COUNT AGE MEMBERS SERVICES
HEKTAR/
MEMBER
TOTAL
HEKTAR EXPORT
CERTIFI-
CATION SALES
SALES
PER
MEMBER
SALES
PER
HECTAR
ASSET
GROWTH
SALES
GROWTH
LONG
TERM
DEBT
SHORT
TERM
DEBT
FIXED
ASSETS
POs WITHOUT COLLECTIVE IDENTITY ENHANCING SERVICES
total 32 8,039 186.95 19,672 10 23
average 11 251 3 5.84 615 31% 72% 3,151 32 6 0.05 0.37 491 1,301 1,878
min 4 20 1 0.21 86 621 2 2 -0.37 -0.72 0 8 5
max 15 2,900 6 16.82 2,592 14,470 151 16 0.86 3.81 1,850 6,861 11,180
median 11 90 3 4.76 520 1,962 26 4 -0.02 0.21 319 796 984
POs WITHOUT COLLECTIVE IDENTITY ENHANCING SERVICES
total 10 16,380 277.26 35,774 7 9
average 11 419 4 4.90 956 70% 90% 6,516 35 15 1.45 1.00 471 2,162 2,318
min 6 23 2 0.17 155 970 2 1 -0.26 -0.72 0 507 0
max 15 1,480 7 11.09 3,271 26,972 84 57 7.60 8.56 1,756 4,585 9,403
median 12 317 5 4.34 601 4,779 30 10 0.26 0.28 324 2,133 1,454

191
to their members, or that POs that provide collective services are more likely to
have CIA. Therefore another model was devised to study CIA. Salesperhectar,
the amount of sales generated by a PO on average for each hectare of land under
its coordination, is being used as an indicator of the PO’s productivity and
competitiveness.
DV: SALESPERHECTAR Coefficient (P>|t|) Coefficient
(P>|t|)
Coefficient
(P>|t|)
High_service 6.277479 (0.02)
Rdinnov 3.010025 (0.106) 4.264453 (0.064)
Valueadded 2.699485 (0.222)
Collective identity (CIA) 7.804794 (0.001) 8.644008 (0.004)
Collective -2.676224 ((0.326)
Educinfoext 0.8878115 (0.747)
Finance 16.74853 (0.000) 16.29008 (0.000)
Members 0.0013813 (0.67)
Lnhectarmember -3.176881 (0.010) -2.088662 (0.014) -1.937501 (0.16)
Hectarvfm -0.0043848 (0.049) -0.0081959 (0.000) -0.0075671 (0.001)
Coopdummy -1.483663 (0.514)
Lnstd 1.759846 (0.114) -0.8748759 (0.59)
Ltd11 -0.0045728 (0.106)
Lnfixa11 1.880414 (0.287)
Constant 0.7896838 (0.918) 11.38897 (0.000) 4.750888 (0.569)
R-squared
(Adjusted R-squared)
0.4020 (0.3374) 0.7419 (0.7060) 0.7805 (0.6748)
The core model reflects a significant positive relationship between PO
services and competitiveness. It also shows a reasonably strong relationship
between short term financing available to the PO and it competitiveness.
Somewhat counterintuitive is the significantly negative relationship between PO

192
competitiveness and the total land area coordinated by the PO and the average
land area cultivated per member. The same variables had significant positive
relationship with level of PO sales but not with modern market access. This
finding suggests that smaller farms and smaller POs have higher productivity.
This may be the case since many of the smaller size producers, and smaller size
POs, that managed to stay in business and maintain their EU PO certification are
engaged in intensive agricultural production involving irrigation and green
houses/tunnels that help both improve productivity and manage risks.
Moving to the full model it becomes clear that once again some PO
services are more closely associated than others with the
productivity/competitiveness of POs. The significant ones are R&D and
innovation, CIA and finance. With PO finance to producers entering the model,
short term debt loses significance since it is short term borrowing at the PO level
that permits the PO’s lending to its members. A similar relationship cannot be
observed in the case of long term finance because it is only one out of the 42 POs
that reported long term lending to its members for the installation of green
houses. PO members need to secure the long term financing necessary for such

193
investment outside the PO and therefore the effect of that won’t be visible in our
data.
CIA has a highly statistically significant relationship with
productivity/competitiveness and in this case continues to be highly significant
even in the full model after the introduction of collective services and other
theoretically relevant variables.
Hypothesis 2: Services, including access to financing for farmers,
provided by POs play an important role in facilitating scaling.
!
!
!
!
!
!
!
!
!
!
!!

194
Copy of the GVCRA model proposed in Section 3, with the component under
discussion (“PO Services”) highlighted.
In this section Hypothesis 2 will be tested; to study the relationship
between the scale of POs and the services they offer using an OLS regression.
Sales revenues of POs are used as a measure of their scale. The model
below illustrates that PO provision of four or more services (Highservice),
coordination of larger production area as a function of farmers aggregated
(members12) and average farm size cultivated by members (hectarmember),
provision of financing to PO members (finance) and PO type (whether it is a
cooperative or not) explain more than half of the variation in POs’ sales. Services
are key to helping farmers improve their productivity, manage their risk and
therefore reduce their losses and meet the standards and other requirements of
modern value chains and achieving relevant certifications. Both high_services
and finance are highly statistically significant in the model with positive
coefficients. In addition, the dummy variable for cooperative PO form is also
significant in the model (at p<=0.1) suggesting that the cooperative form is
associated with lower sales volume.

195
OLS Regression
DV: LN(SALES)
Coefficient
(P>|t|)
Coefficient
(P>|t|)
Highservice 0.4350156
(0.028)
0.3765647
(0.06)
Lnmembers12 0.3229318
(0.007)
0.2739208
(0.03)
Age 0.058754
(0.148)
finance 0.9021322
(0.003)
0.8909062
(0.003)
Lnstd (short term debt) 0.0691608
(0.410)
hectarmember 0.068057
(0.040)
0.0579677
(0.088)
Coopdummy -0.322989
(0.090)
-0.277841
(0.179)
Constant 5.791782
(0.000)
4.961812
(0.000)
R-squared
(Adjusted R-squared)
0.5749
(0.5159)
0.6068 (0.5259)

196
Hypothesis 3: Cooperatives are at a disadvantage compared to other PO
forms in achieving the conditions necessary for GVC access.
Copy of the GVCRA model proposed in Section 3, with the component under
discussion (“Aggregator Type”) highlighted.
Over a half of Hungarian POs operate as cooperatives. This ratio has been
declining. A few years ago most POs were established and operated as pure
cooperatives but in recent years several new POs were established as investor-
owned firms (IOFs) or converted from cooperative to IOF form. In addition,
hybrid POs have been emerging that combine the cooperative and IOF forms
!
!
!
!
!
!
!
!
!
!
!!

197
(often one owning the other or the two operating in close partnership). When
POs that converted from cooperative to IOFs are excluded, IOFs tend to be
younger in terms of their operational history than cooperatives and hybrids.
Table 8 summarizes some of the key statistics for the three PO types. On
average IOFs engage with the least number of farmers while cooperatives with
the largest number. However, this is due to two outliers. The median number of
participants is 90 for cooperatives, compared to 131 for hybrids and 106 for IOFs.
While average farmer size does not differ much by PO type (6 hectares for
cooperatives, 5.3 for IOF and 5 for hybrids), median participant farm size was
largest in the case of cooperatives (6 hectares), followed by hybrids (4.8) and
IOFs (4.5). IOFs, however, did not engage with farmers cultivating less than two
hectares while farmers cultivating as little as 0.17 hectares were members of
some of the cooperatives. In the case of hybrids, the smallest farm size was
around one hectare.
Income and efficiency indicators were the weakest for cooperatives both
in terms of median sales as well as sales per farmer and sales per hectare and
hybrids’ were the strongest among the three groups.

198
Working with larger and more sophisticated producers, IOFs offer fewer
services than their counterparts. IOFs have the highest fixed assets and debt,
both short term and long term, among the 3 PO forms, followed by hybrids.
Cooperatives have the least assets and financing among the three groups.
Table 11. Characteristics of Hungarian POs by PO type
COOPs
(N=20)
Farm
ers
Ag
e
Sa
les
Sa
les/
Farm
er
Fixed
Asse
ts
Sh
ort
Te
rm
De
bt
Lon
g
Te
rm
De
bt
Se
rvice
s
offe
red
He
ctare
s
He
ctare
s
/ farm
er
Average 397 12 3,161 29 994 964 325 3.45 674 6.07
Minimum 27 6 621 2 5 8 0 1 86 0.17
Maximum 2,900 15 9,493 130 3,333 2,955 1,341 5 3,271 16.82
Median 90 11 2,101 18 818 653 156 3.5 479 6
HYBRIDs
(N=8) Fa
rme
rs
Ag
e
Sa
les
Sa
les/
Farm
er
Fixed
Asse
ts
Sh
ort
Te
rm
De
bt
Lon
g
Te
rm
De
bt
Se
rvice
s
offe
red
He
ctare
s
He
ctare
s/
farm
er
Average 204 12 7,592 49 1,537 1,299 389 3.75 740 5.01
Minimum 20 4 1,216 10 564 161 76 1 146 0.94
Maximum 560 15 26,97
2
151 4,056 4,178 948 7 2,592 9.21
Median 131 12 3,558 35 933 791 330 4 492 4.76
IOFs
(N=14)
Farm
ers
Ag
e
Sa
les
Sa
les/
Farm
er
Fixed
Asse
ts
Sh
ort
Te
rm
De
bt
Lon
g
Te
rm
De
bt
Se
rvice
s
offe
red
He
ctare
s
He
ctare
s/
farm
er
Average 190 11 3,002 30 3,650 2,399 772 2.86 703 5.31
Minimum 23 6 825 2 718 481 0 1 155 2.08
Maximum 617 15 6,640 84 11,180 6,1 1850 6 1,715 9.84
Median 106 11 2,447 26 2,829 1,504 652 3 598 4.5

199
The univariate analysis of variance (Anova) confirms the statistical
significance of these relationships, as summarized in the table below.
Table 12. Summary of statistically significant ANOVA results
(statistical significance level of 0.1)
Independent
Variable in
ANOVA test
against PO
form
Prob>F
Pairwise comparison of means:
Contrast (Tukey P>|t|)
Interpretation
Sales 0.0609 hybrid vs. coop: 3,917.6 (0.074) IOE vs. coop: -156.9 (0.994) IOE vs. hybrid: -4,074.5 (0.088)
Hybrids have significantly higher sales than either cooperatives or IOEs. There is no statistically significant difference between the sales of cooperatives and IOEs.
Long term debt
0.0298 hybrid vs. coop: 91.2154 (0.880) IOE vs. coop 457.2053 (0.025) IOE vs. hybrid: 365.9899 (0.185)
Cooperatives have significantly less long term financing than IOEs
Short term debt
0.0087 hybrid vs. coop: 272.319 (0.874) IOE vs. coop 1,563. 3 (0.007) IOE vs. hybrid: 1,290.98 (0.088)
Cooperatives and hybrids have significantly less short term financing than IOEs
Fixed Assets 0.0007 hybrid vs. coop: 511.44 (0.790) IOE vs. coop 2,840.71 (0.001) IOE vs. hybrid: 2,329.27 (0.023)
IOEs have significantly more fixed assets than either cooperatives or hybrids

200
As Table 12 illustrates, hybrids offer the most services to their farmers.
All hybrids have modern value chain access in contrast with 60% of coops, which
is the lowest rate among the PO types, and 79% of IOFs. Coops also have the
lowest rate of certification. This is despite the high rate of services among coops
which is comparable to hybrids, in contrast with IOFs which on average offer
fewer services. Among the services the biggest difference is in financing offered
to farmers; 38% of the hybrids offer such services in contrast with 7% of IOFs and
none of the cooperatives.
Table 13. Additional Characteristics of Hungarian POs by PO type
FOC
U S
CR
OP
SU
ST
AIN
AB
LE P
RO
DU
CT
ION
MA
RK
ET
ING
CO
LLEC
TIV
E S
ER
VIC
ES
(INP
UT
,
SH
AR
ED
EQ
UIP
ME
NT
)
ED
UC
AT
ION
/INFO
RM
AT
ION
/EX
TE
NS
ION
/AD
VIS
OR
Y
RE
SE
AR
CH
/ DE
VE
LOP
ME
NT
/
INN
OV
AT
ION
VA
LUE
AD
DE
D A
CT
IVIT
IES
CO
LLEC
TIV
E ID
EN
TIT
Y FO
RM
ING
AC
TIV
ITIE
S
FINA
NC
E
EX
PO
RT
MO
DE
RN
VA
LUE
CH
AIN
AC
CE
SS
CE
RT
IFICA
TIO
N
COOPs 35% 35% 100% 55% 85% 35% 40% 30% 0% 40% 60% 70%
HYBRIDs 50% 88% 100% 63% 88% 25% 38% 25% 38% 38% 100% 88%
IOFs 36% 21% 100% 29% 43% 36% 57% 14% 7% 43% 79% 79%
It is very hard to tell to what extent the characteristics of Hungarian PO
types are universal as opposed to Hungary specific as the author is not aware of

201
similar analysis in the existing literature nor data to permit such analysis.15
However, some of the patterns observed for the Hungarian POs are similar to
those observed for the Central American and Peruvian POs in Section 4.
Statistical testing was applied on this data to compare the three PO types
in the form of multivariate analysis of variance (MANOVA) since MANOVA can
be used to compare multivariate population means of multiple groups.
A multivariate analysis of variance (MANOVA) results in an outcome
consistent with the findings of the previous section: PO form (i.e. cooperative,
Hybrid and IOE) have a significant impact on the key variables used in this
analysis (sales, sales per member, size of membership, change in membership
between 2009 and 2012, total number of services offered, total hectares cultivated
by PO, average hectares per member, exports, modern value chain access,
certification, sales growth between 2009 and 2012, long term debt, short term
debt and value of fixed assets); with Pr > F values of 0.0906 (Wilks’ Lambda),
15 Even creating a database similar to what was done for Hungary is impossible in most countries in the absence of the policy framework that helps to ensure the identification of IOF and hybrid POs. For example in most databases or countries IOF that source from smallholders are impossible to identify, and would be grouped together with small and medium enterprises (SMEs). Furthermore, for the time being the World Bank enterprise survey, which is one of the few databases that collects information in SMEs, excludes agricultural SMEs. However, the author of this paper has been advised (source: phone discussion with relevant World Bank staff) that a separate database of agricultural SMEs may be planned for the future, in which case it would be highly advisable to include smallholder specific variables.

202
0.0801 (Pillai’s Trace), 0.1110 (Hotelling-Lawley Trace) and 0.0425 (Roy’s Greatest
Root). The statistical significance improves further when comparing only
cooperatives and IOEs with regards to the above key variables, to Pr > F of
0.0546. Comparing cooperatives with the combined groups of hybrids and IOEs
result in Pr>F of 0.1085.
Overall, we can conclude that the form of a PO, and in particular whether
the PO is a cooperatives, have an effect on key variables that directly or indirectly
influence modern market access.

203
4.2 Central America and Peru
4.2.1 Background
The intention of this section is to investigate whether patterns and
relationships observed in the Hungarian empirical analysis, and thus ultimately
the model of GVC relevant aggregation, also holds in other countries. However
data is scarce at best about POs, especially non-cooperative POs. (In fact it was
not possible to identify any systematic data collection about smallholders’ POs).
This section will utilize the best non-EU data on smallholders’ aggregators
available to the author. However, the data has considerable limitations that will
be discussed.
The data analyzed in this chapter involves aggregators of coffee and
horticultural producers in Honduras, Costa Rica, Nicaragua and Peru. This
region is particularly appealing for this analysis because of the stronger tradition
of POs than in Hungary. Coffee is the top export crop in these countries and
smallholders are responsible for a significant portion of the production; thus the
majority of the aggregators are coffee producers but with horticulture rising in
importance and also represented in the data.

204
4.2.2 Data collection and method
Data was provided by the Finance Alliance for Sustainable Trade, an NGO
based in Montreal, Canada that serves as the membership organization for
lenders that extend financing to aggregators of smallholder farmers. FAST’s
members provide financing to aggregators that source from smallholder farmers
in less developed countries. The uniqueness of FAST’s approach that it is not
limited to cooperatives but rather supports all forms of aggregators that source
from smallholder farmers. This is consistent with the aggregator definition used
in the case of the Hungary empirical section.
Data was provided on 60 first level aggregators in Honduras, Costa Rica,
Nicaragua and Peru that attended FAST organized financial marketplaces with
the aim of obtaining financing from FAST members. The data was collected by
FAST staff prior to the marketplaces. Interested aggregators of smallholders fill
out FAST’s form (see Appendix P) based on which FAST invites those to the
marketplace that meet a set of criteria. The criteria includes that the (i)
aggregator has to be formally registered (as opposed to operating informally); (ii)
needs to be willing to have financial statements and able to provide a reasonable

205
amount of background information and (iii) needs to have some minimal level of
operation.
The forms for several of the 60 aggregators lacked some of the basic
information necessary for my analysis (they were only partially filled out), such
as sales, number of members, short term borrowing, and form of aggregator
(company or cooperative) and whether it exports or has contracts with buyers.
As a result, observations with less than 2 of the necessary variables for this
analysis were eliminated, leaving 39 observations.
Similarly to the Hungarian data, this information is unique in that it
includes aggregators based on the primary criteria whether they source from
smallholder farmers and includes different forms of aggregators including
cooperatives and investor owned firms (IOFs).
While this data has serious shortcomings in terms of completeness, the
rationale to nonetheless use this data is to investigate whether it exhibits patterns
similar to aggregators in Hungary and whether the model of GVCRA remains
applicable.

206
Variables available in the dataset:
Members: number of members at the time the form was filled out
Age: Year of establishment
Certification: whether PO is certified and through which certification
scheme
Corpdummy: dummy variable with value of 1 if IOF
Loanhistory: if aggregator has credit history
Sales; available for 3 years. (lnsales: natural log of sales)
Export: dummy to reflect whether the aggregator exports and where.
Contracts: dummy to reflect whether the aggregator has a contract with
any buyer.
Export: dummy for export
clt: short term liabilities of the organization (lnclt: natural log of clt)
Assets: total assets (lnassets: natural log of assets)
Ltl (lnltl): long term liabilities (natural log long term liabilities)
fixassets: fixed assets (lnfixassets: natural log of fixed assets)

207
4.2.3 Analysis and discussion
The Central America/Peru data includes 9 IOFs and 30 cooperatives. 33 of
these organizations are certified and twenty of them export its products. The POs
in the sample have 573 members on average with a median of 200 (in the
Hungarian data these figures are 266 and 93, respectively). The average PO in
the sample is 17 years old with a median age of 15 years (average and median
age of 11 years in the Hungarian sample), has average sales of $3.7 million and
median of $1.5 million (in Hungary, average of $3.7 million and median of $2.1
million), average fixed assets of $2.6 million and median of $0. 5 million (in
Hungary, $2.3 and $1.4 respectively). Please refer to Table 12 for more detail
about the Central America/Peru sample.
Table 14. Summary statistics of aggregators in the Central America / Peru
sample
US$ members age sales fixed assets assets
short term
liabilities
long term
liabilities
average 573 17 3,709,646 2,567,134 5,101,770 1,525,088 812,865
min 3 4 72,439 770 1,933 14,938 0
max 9,000 71 36,740,386 21,198,927 34,195,943 11,336,306 5,715,257
median 200 15 1,555,998 495,128 1,624,230 483,887 230,571

208
This analysis will test hypothesis as close to identical as possible with the
hypothesis tested in the case of Hungary, unless the data is not adequate for a
particular hypothesis test.
Hypothesis 1: “collective identity narratives”, manifesting themselves in
Collective Identity Activities, play an important role in facilitating the growth
and competitiveness of POs.
The Central America/Peru data does not provide enough information to directly
statistically test this hypothesis. However, interviews with PO officials and third
party experts confirmed the importance of PO collective identity, in particular for
fair trade POs. The interviewees indicated that farmers have high commitment
to the ideals of fair trade and due to its origins and history. The fair trade POs in
the Central America / Peru sample have on average nearly five times as many
members as their non fair trade counterparts, significantly higher production,
fixed assets and better net results. Overall, fair trade POs are considerably
larger and have stronger performance than their non fair trade counterparts in
the Central America/Peru sample. While there can be various reasons for that
difference and unfortunately we don’t have sufficient data to statistically test the

209
reasons, according to the interviewees the difference may be at least in part
attributed to the high collective identity of fair trade POs.
Hypothesis 2: Services, including access to financing for farmers,
provided by POs play an important role in facilitating scaling.
Copy of the GVCRA model proposed in Section 3, with the component under
discussion (“PO Services”) highlighted.
In case of the Central America/Peru, we have no information about the services
the POs provide to their members, therefore the focus will be on access to finance
in this analysis.
!
!
!
!
!
!
!
!
!
!
!!

210
OLS Regression
DV: LN(SALES)
Coefficient
(P>|t|)
Coefficient
(P>|t|)
lnclt (short term
funding)*
0.461092
(0.003)
0.7081106 (0.000)
Llnltl (long term
funding)
0.4180409
(0.015)
0.4070858 (0.020)
Age* -0.0235334 (0.159)
Lnmembers* -0.2506824 (0.134)
Certification* -0.1065295 (0.852)
Corpdummy* -0.0315659 (0.96)
Constant 2.717658
(0.205)
1.692153 (0.471)
R-squared
(Adjusted R-squared)
0.6559
(0.6177)
0.789 (0.6916)
*variables in common with Hungarian Lnsales model.
The results show strong statistical significance and positive relationship between
sales and both short term and long term financing; and variation in short term
and long term financing together explain over 60% of the variation in sales.
However, causality cannot be derived from these results and the data does not
facilitate longitudinal analysis or the use of lagged variables. Social lenders,
however, who are frequently the first ever lenders to POs, attest that such access
to financing is crucial for the growth of POs.16
16 Interview evidence with former CEO of Verde Ventures, a social lender very active in financing coffee and horticulture POs in the sample countries.

211
Hypothesis 3: Cooperatives are at a disadvantage compared to other PO
forms in achieving the conditions of global value chain access.
Copy of the GVCRA model proposed in Section 3, with the component under
discussion (“Aggregator Type”) highlighted.
Investor owned firms (IOFs) are younger in the sample and tend to have
fewer farmers than cooperatives, just like in the case of the Hungarian POs.
83% of the cooperatives are involved in coffee production while only 22% of
IOFs. The majority of IOFs are fruit and vegetable producers. While the average
sale of IOFs is $2.2 million compared to $4.2 for cooperatives, once we control for
!
!
!
!
!
!
!
!
!
!
!!

212
the sector difference it becomes clear that coffee producer IOFs have higher sales
than coffee cooperatives just as fruit and vegetable IOF producers have higher
sales than their cooperative counterparts. Furthermore, both IOF’s median sales
and average sale per member are more than twice that of cooperatives. (This
may be due to the average cooperative member being smaller, something
suggested by interviewees, but unfortunately we don’t have sufficient data to
verify.) IOFs in the Central American and Peruvian data also have higher
average net income and assets. Cooperatives, just like in Hungary, may be at a
disadvantage when it comes to generating scale in turnover, despite their larger
membership and longer operating history.

213
Table 15. Summary statistics of cooperative and IOF POs in the Central
America / Peru sample
Source: author’s calculations based on raw data from FAST
members age sales Netincome fixassets Assets Cash clt ltl SE
COOPs
average 691 19 4,186,066 138,225 2,144,884 4,447,359 580,075 1,556,379 943,880 331,187
min 5 4 72,439 -1,268,470 770 0 -10,040 14,938 0 1,106
max 9,000 71 36,740,386 3,465,623 21,198,927 34,195,943 11,559,933 11,336,306 5,715,257 1,996,500
coffee 773 19 4,005,247 208,630 2,075,248 4,282,502 559,814 1,351,470 871,944 277,126
non-coffee 380 13 359,628 -37,632 149,320 383,649 42,408 200,686 196,655 68,641
IOFs
average 145 13 2,161,280 1,813,210 3,886,662 7,146,802 1,607,730 1,422,274 382,390 11,700,192
min 3 4 93,295 -7,045,873 172,235 228,365 104,972 66,334 0 10,000
max 433 21 4,397,320 13,587,950 17,318,000 28,617,130 8,120,177 5,198,827 1,019,753 47,089,532
coffee 240 26 4,624,221 7,259,327 3,341,764 7,908,434 1,825,740 3,434,631 1,151,618 29,836,226
non-coffee 118 12 1,237,775 1,075,870 3,823,052 6,470,609 1,792,636 470,018 169,207 8,472,386

214
4.3 Additional considerations and remarks related t o the empirical analysis
4.3.1 Observations about POs with the smallest aver age member size.
There are 6 POs in the Hungarian population where the average member
size is below 1 hectares.17 They have all successfully scaled in terms of
membership size with memberships ranging between 304 and 2900. The average
land size cultivated by farmers ranges between 0.17 and 0.94 hectares. The total
number of participants in these six POs represents over 50% of all farmers who
participate in the 43 qualifying Hungarian POs while only 6.7% of the land area
cultivated by POs. Five of the six POs have GVC access even though only 3
exports directly. The number of services offered ranges between 3 and 7 with
both average of 4.5, compared to the average of 3.3 for the pool of 42 POs.
The size of this group is too small to study statistically in order to try to
gather some insight into the factors that might be associated with their success
17 One additional PO satisfies the criteria on the governmental list which was excluded from the empirical analysis because it is under liquidation. Further investigation revealed that the PO ran into problems very similar to that of Morakert: it was unable to satisfy its contracts with retailers and therefore had to rely on imports from Ukraine which in turn also made the news and may have contributed to the ultimate downfall of the PO.

215
despite the very small average size of their participating farmers. However, we
can observe some interesting pattern among these POs.
Four of the six POs above carry out sustainable intensive farming at least
on part of the land cultivated. Intensive farming in this context represents
greenhouse, tunnels, drip irrigation and in some cases heated green houses for
year-around production using geothermal energy. Interesting to note that one of
these POs highlighted in the interviews that they work with smaller participants
to carry out intensive production, including through the provision of inputs and
know-how, and in fact all the farmers with less than 1 hectare have intensive
production in that case, cultivating a vertically growing cucumber under thin foil
that is very labor intensive but has high productivity rate per hectare.
Four of the six POs above also have collective identity activities (CIA)
which might explain their ability to overcome the collective action problem to
attract and maintain a large number of participants farmers and coordinate their
production in a predictable way (i.e. mitigate or manage side selling risk) so that
most of them accomplished GVC access.
Important to note that five of the six POs above are cooperatives. The
sixth one is a hybrid, Del-Kertesz. This finding is a critical one for this paper:

216
while cooperatives on average lack behind in performance behind their IOF and
hybrid counterparts, under certain conditions their performance can exceed
others’ on some important counts: their ability to successfully aggregate the
smallest farmers, helping them achieve productivity improvement and access
modern markets. The in-depth study of these six POs will be the subject of
further research.
Unfortunately similar details were not available in the dataset concerning
Central America and Peru to investigate whether similar patterns may also be
observed there. Interview evidence suggests, however, strong collective identity
effect among fair trade POs in Central America and Peru, which have been found
to outperform their non fair trade counterparts based on membership size, sales
and net income. Unfortunately due to the large number of missing observation
on production volume, farmer size related analysis would not be reliable.
Recommendation will be made to FAST to encourage their collection of relevant
data in the future considering the significant implications for smallholder value
chain inclusion and livelihoods.

217
4.3.2 Importance of Access to Finance for Competiti veness, Productivity and Global Value Chain Access
4.3.2.1 Empirical evidence
Existing academic literature dedicates considerable attention to the
quantity and quality/attribute requirements of GVCs with less emphasis on the
importance of financing. Several non-academic papers make reference to the
importance of financing but without providing empirical evidence. As described
in Section 4.2, the results of this research have empirically demonstrated that
both POs’ access to finance as well as POs’ provision of financing to farmers are
closely associated with POs’ sales per hectar, and indicator of productivity and
competitiveness and key to achieving the production volume required to be able
to do business in the modern markets.
The importance of volume and quality/attribute requirements is widely
documented in the literature. The relationship between GVC participation and
access to finance is often suggested by practitioners, including those interviewed
for this work, but with this study wanted to test whether I can empirically
confirm the importance of access to finance as a key condition of GVC access.

218
Copy of the GVCRA model proposed in Section 3, with the component
under discussion (“Finance for POs”) highlighted.
Short-term debt (“std”), obtained from POs’ balance sheets, is used as an
indicator of POs’ ability to access financing. Using the dummy variable GVC,
reflecting whether PO participates in GVC related trade, as dependent variable,
we use a logit model to analyze the relationship between financing and GVC
access, by keeping constant sales of POs (capturing their quantity of production)

219
and certification18 (as an indicator of compliance with quality and attribute
requirements of modern value chains).
Table 16. Conditions of market access logistic regression results for Hungary
Logistic Regression
DV: GVC
Coefficient (P>|z|) Odds Ratio (P>|z|)
Lnsales 1.788322 (0.078) 5.979413 (0.078)
Std 0.0007071 (0.054) 1.000707 (0.054)
Certification 4.26536 (0.002) 71.19057 ((0.002)
Constant -15.78381 (0.053) 1.40e-07 (0.053)
Log Likelihood -11.99444
LR Chi2 (Prob > chi2) 24.31 (0.0000)
Pseudo R-squared 0.5034
Access to short term financing, in addition to the size of a PO’s sales and
certification19 all have positive relationship with the likelihood of GVC access
and are all statistically significant at 90% confidence level. Together they explain
more than 50% of the variation in POs’ GVC access.
18 In the Hungarian example the most common certifications are GlobalGAP for good agricultural practices, and HAACP for food safety, two certifications widely required by European retailers. 19 Certification is an imperfect proxy for “quality and attributes” and includes a more narrow set of requirements than those that apply reality, introducing some bias in the model.

220
In the Central America/Peru data we have information about the contracts the
POs have which we use as proxy for modern market access. Otherwise the same
modern market access model is being applied as the one used in Hungary,
consisting of sales, certification and short term debt as measures of scale,
quality/attributes and access to finance, respectively. The results are summarized
in the table below.
Table 17. Conditions of market access: logistic regression results for Central America
and Peru Logistic
Regression
DV: contracts
Coefficient
(P>|z|)
Coefficient
(P>|z|)
Coefficient
(P>|z|)
Coefficient
(P>|z|)
Coefficient
(P>|z|)
Lnclt (short term
debt)
1.015272
(0.074)
0.2192531
(0.797)
0.8135334
(0.133)
Certification 2.233592
(0.087)
5.95698
(0.153)
1.939249
(0.198)
Sales 4.38e-07
(0.433)
2.033-06
(0.402)
Constant 0.0033103
(0.12)
1.098612
(0.178)
1.559732
(0.064)
-7.129
(0.414)
-8.993352
(0.153)
Log Likelihood -10.1492 -8.8485339 -9.1759858 -4.5687136 -6.2971542
LR Chi2
(Prob > chi2)
5.24 (0.0221) 3.13 (0.0770) 1.75 (0.1854) 10.15
(0.0173)
6.91 (0.0316)
Pseudo R-squared 0.2686 0.1501 0.0872 0.5263 0.3543
Short-term debt and certification are statistically significant explanatory
variables, just as in Hungary. But unlike in Hungary, the relationship is not

221
statistically significant in the case of sales. The reason is likely to be the fact that
many of the POs in the sample are involved with coffee production. Many coffee
POs (15 out of the 27 in the sample) are fair trade certified and sell via fair trade
second and third level POs; thus production and sales volume is less critical for
in those cases for modern market access due to Fair Trade’s dedicated market
channels that aggregate production at several levels in a federated structure.
However, the weakness of the model may be the result of data limitations as the
analysis finds that Fair Trade certified producers have higher sales than their non
Fair Trade peers.
Despite some of the weaknesses of the Central America/Peru empirical
analysis, the importance of financing for GVC and modern market access has
been clearly demonstrated in both the Hungarian and Central America/Peru
datasets.
4.3.2.2 Reflections Based on Qualitative Evidence
The basis of the informal financial system was familiarity with the
borrower. In fact the informal lender was typically an insider in the community

222
and had much better information about the “bankability” of the borrower than
formal financial institutions (Frederico, 2009). Financial intermediation evolved
in the 19th century when landlords and merchants borrowed from FIs and on-lent
to farmers. Such financial solutions had two important merits: first, they built on
the landord’s and merchant’s insider knowledge of the farmers, and it reduced
transaction cost through interlinked transactions (merchant and landlord are in
contact with the farmers and carrying out transactions.) The spread charged
reflected the risk premium and information cost.
Such linkages are especially important when considering the problem of
collateral in agriculture. Land valuation is challenging and land is often illiquid,
not to mention problem with land titles in many countries. Movable assets like
machinery or equipment tend to be very unreliable collateral. Thus conventional
types of formal financing are seldom applicable to farmers, creating considerable
discomfort for most financial intermediaries when it comes to engaging in PO or
farmer finance.

223
Regarding the core forms of farmer finance (KIT/IIRR, 2010), this study found
the following:
1. Chain liquidity: Chain liquidity provided by buyers or input suppliers is
scarce not only in Hungary but in general internationally, and is only
provided by buyers and input suppliers if they have strong business
incentive to do so and if there is stable and ongoing relationship with the
farmers. In addition, even when chain liquidity is offered, it usually comes at
high cost and the finance costs are not transparent as they are packaged into
the pricing of the bought/sold product. This may be in part because due to
increased concentration, TNC input providers and buyers, unlike their
predecessors, do not have insider knowledge of farmers and their
communities. Most interviews carried out as part of this work emphasized
both the scarcity and high cost of chain liquidity financing. The exception
was one interview with a capacity building provider to coffee farmers in
Central America, who felt that some coffee traders who value long terms
relationships with suppliers develop familiarity with the farmers, offer
financing at reasonable cost and in return earn farmer loyalty which helps

224
mitigate the side-selling risk which has both quality and quantity
implications as discussed earlier in this paper (“double side selling”).
2. Agriculture finance: Most financial institutions shy away from financing
agriculture in general given the risks of the sector, lack of collateral and high
transaction cost. Agriculture finance relies heavily on hard collateral and
therefore it is rarely an option for smallholders. The exception is
microfinance, where the group lending structure provides collateral.20
However microfinance institutions (“MFIs”) tend to avoid both less densely
populated areas and long term or seasonal financing and therefore for the
most part have played limited role in smallholder finance. In particular rural
areas that are not densely populated or dependent on a few principal crop or
lifestock activity (as opposed to a local economy with more diversified
sources of income) tend to be avoided by MFIs due to higher transaction cost
and risk (including seasonality and collateral constraints)21. In addition,
driven again by low transaction size and high transaction cost, MFIs lend at
20 In other words if borrower is unable to repay the loans, others in the group are also liable. 21 Most MFIs focus on short-term loans with frequent and regular repayments, a business
model that does not fit well with the needs of seasonal crop or livestock producers. (World Bank MFI website)

225
considerably higher rates than other financial intermediaries (See Annex F for
comparison in Peru where MFI rates for farmers can be as high as 75%22).
Therefore microfinance in its current form is unlikely to offer a systemic
solution to farmers’ finance need. Some interviewees offered optimism that
mobile phone based lending or microfinance, considerably reducing the
transaction cost of rural finance, may offer a solution in the future.
3. Value chain finance. Value chain finance helps overcome some of the
collateral constraints discussed earlier while also reducing transaction costs,
thus using the bankability of some value chain actors for the benefit of
smallholders. It involves a triangulated approach that, at minimum, involves
a PO, the buyer and the financial intermediary. In the basic form of value
chain finance, the financial intermediary lends to the PO, secured by a
contract, whereby the buyer agrees to make the payment directly to the
lender which, in turn, will deduct the amount needed to service the debt and
make the remainder available to the borrower. Contract with a financially
solid buyer, not to mention a TNC, is a strong collateral for the loan and helps
22 Interviews carried out for this research indicated that MFI rates were not affordable for farmers, even when they were available.

226
mitigate the credit risk. In addition, the buyer’s engagement with suppliers
may be leveraged for reducing the transaction cost of financing. Nonetheless,
agriculture remains a sector that most commercial banks perceive to be very
risky to finance and therefore financial intermediaries are generally reluctant
to engage in value chain lending. In addition agriculture, including value
chain, finance does require some industry specific technical skills that most
financial intermediaries lack. The Hungarian bank most active in agriculture
lending has both a technical expert for evaluating potential borrowers
(agronomist who himself used to head up a large PO and has strong
familiarity with the sector) as well as a director in charge of agri-finance who
himself has decades of experience and strong ties in the sector. The
agriculture portfolio, a considerable part of which is related to value chain
finance, has outperformed most other sectors in the bank’s overall portfolio
both in terms of repayment rates and profitability.
Given the reluctance of most commercial banks when it comes to lending
to POs, over the last decade several international social enterprise financial
intermediaries (SEFIs) have emerged trying to serve this market segment for the

227
benefit of smallholders, including Root Capital, Oikocredit, Triodos and
ResponsAbility, to mention some of the more significant ones. These SEFIs,
some of them operating as nonprofit organizations, mostly provide value chain
finance, sometimes in combination with technical assistance.
While value chain finance is still in its early stages, SEFIs have proven the
triangulated structure to be a viable way of financing smallholders in the era of
GVCs despite the lack of hard collateral and thanks to the structure’s ability to
help reduce transaction costs. As illustrated in figure 8, the vast majority of value
chain finance for smallholders is financing coffee and mostly in Latin-America,
which is where farmers are reasonably well organized into POs, partly due to the
influence of Fair Trade on coffee cooperative formation.

Figure 8.
In the ideal situation GVC lead firms take an active role in value chain
finance which can help both mitigate risks and reduce transaction costs, not
unlike in the historical examples of village merchants and traders. Lead firms
increasingly keep computeri
become valuable data for a financier’s risk assessment.
228
. Structure of global value chain lending to POs
Source: Dalberg 2012
In the ideal situation GVC lead firms take an active role in value chain
finance which can help both mitigate risks and reduce transaction costs, not
unlike in the historical examples of village merchants and traders. Lead firms
increasingly keep computerized information about their suppliers, which can
become valuable data for a financier’s risk assessment.
Structure of global value chain lending to POs
In the ideal situation GVC lead firms take an active role in value chain
finance which can help both mitigate risks and reduce transaction costs, not
unlike in the historical examples of village merchants and traders. Lead firms
zed information about their suppliers, which can

229
While value chain finance offers a promising solution for the short term
financing of POs that participate in modern markets, smallholder agriculture also
requires capital to finance household expenditures, investments in land and
machinery and production related expenditures (such as inputs) at the farm
level. POs may on-lend the proceeds of value chain finance to farmers to help
address those needs, an important service that POs may provide but also one
that requires prudent systems and careful procedures. 23
As Oxfam points out (2009), many of the promising efforts that target
aggregator and farmer finance involve a combination of actors, each contributing
in their areas of strengths, with the goal of improving the balance between risk,
23 There are also some rare examples of value chain financing that benefit farmers directly (as opposed to their POs). One example is Starbucks which provided $70 million of financing over 40 years to coffee farmers to promote sustainable practices, mainly through social lenders. Another example is related to Pepsico’s effort to address its growing need for high oleic sunflower oil, whereby PepsiCo partnered with a local financial intermediary to make available $40.4 million for microloans for Mexican sunflower farmers. Pepsico committed to purchase 100 percent of the crop, for an estimated $52 million over seven years. Additionally, PepsiCo is investing $2.6 million to support management of the Mexican sunflower crop and will provide technical training to the small farmers. While these efforts are admirable, they are rare, due to the transaction cost involved in financing farmers directly. Therefore even in the case of Starbucks and Pepsico, the farmers involved in these financing schemes represent a tiny fraction of these firms’ suppliers. Technology based innovations may one day help address the transaction cost problem related to value chain finance that directly benefit farmers. Opportunity International, in partnership with the Gates Foundation and MasterCard Foundation are experimenting with mobile phone based finance for smallholders (Sinha, 2014).

230
cost and return. Value chain finance, leveraging farmer-buyer relationships as
collateral, is offering a still nascent but promising solution.
231
5. Limitations of this Research
Collection of data on POs poses a challenge due to the various legal forms
they can take and to the best knowledge of the author no systematic PO data is
being collected by any of the international development organizations. This
research involved primary data collection of original data in the case of Hungary
and the use of secondary data in the case of Peru and Central America, both of
these having their unique set of the limitations.
While the Hungarian data covers the entire population of accredited POs
and the data collected from various sources is believed to be robust, findings
drawn from the Hungarian data may have limited applicability in other
countries. High level of literacy and good physical infrastructure, in particular,
are characteristics that many less developed countries do not share and may
affect the applicability of the results. Hungary’s historical heritage, especially
forced collectivization and the resulting skepticism about farmer collective
action, may further limit the applicability of the findings.
In addition, as discussed in section 2.3, moderns market retail outlets have
been disseminating in waves and at different speed around the world.

232
Smallholders in some of the third wave countries, for example India, for the most
part do not yet face modern market requirement. However, even in those
markets modern food retail outlets are fast increasing market share, albeit from a
very small base, and the findings of this paper may be helpful to policymakers as
they are preparing for the possible consequences of those changes.
As a result of the above limitation of the Hungarian empirical work, many
of the interviews carried out for this work were of global focus, to identify cross-
regional issues and patters. Furthermore, the Peruvian and Central American
data was sought in order to empirically test the applicability of the model and
the consistency of the key findings. While some of the Hungarian findings were
found to also hold in Peru and Central America, the secondary data that was
available is more limited than the data collected in Hungary and there are a
significant number of missing observations. This weakness in the data limits the
author’s ability to reach definite conclusions about the results.
However, the weaknesses of the quantitative data has at least in part been
compensated for by the richness of contextual information from interviews.

233
6. Policy Recommendations
These policy recommendations cover all actors that may play a role in
promoting development, including development organizations, NGOs and even
private sector organizations, and are not limited to government policy
intervention opportunities. The fast dissemination of modern food retail outlets
in most of the world and the shift toward food production being organized along
global value chains and production networks governed in part through the use
of standards have increased the need for farmers to be organized into POs. This
paper shed some light on aspects of POs that support their modern market access
and therefore might deserve highlighted attention from policymakers.
1. How to target policy support. This study found that cooperatives are not
the panacea for development and policymakers should also consider other
forms of POs, including cooperative-hybrids, for support. In fact the
current bias towards cooperatives carry the risk of creating market

234
distortions by giving artificial advantage to one PO form.1 Nonetheless,
under certain conditions cooperatives performed better than their non-
cooperative peers. Specifically, cooperatives were found to be more likely
to include farmers with less than one hectar land and achieve high
productivity levels and modern market access. Considering the nuanced
picture in terms of the performance of various PO types, PO type should
be less of the selection criteria for policy support but rather the activities
of the PO and the services it offers to smallholders. Policymakers may
want to consider supporting more comprehensive POs as opposed to
marketing or “income only” organizations as the former may be more
likely to achieve modern market access. Policymakers should also
consider linking their support to certain aggregator characteristics, in
particular services. While in general this study found that POs with more
than 4 services offered to their members are significantly more likely to
scale, some services had stronger relationships than others with POs’
1 The United Nation’s High Commissioner for Refugees has been one of the organizations to support cooperatives as a preferred aggregator type. However, they have experienced very high failure rates among the cooperatives supported. (Source: Oxford University Humanitarian Innovation Conference lecture, August 2014.)

235
ability to scale and achieve modern market access. Therefore different
service criteria is likely to be justified when supporting the scaling of
aggregators as opposed to their formation. Most PO services frequently
supported by policy were not found to have significant role in enabling
modern market access. The services that were found to have played a role
across various models were finance and innovation. Differentiated
support and/or capacity building for the provision of access to finance and
for the promotion of innovation may be justified. Finally, the collection of
data about aggregators around the world would be critical to facilitate
analysis that can further inform the design of the policy intervention.
2. Access to finance. Finance plays the most important role among the PO
services not only when it comes to achieving scale and modern market
access but also smallholder productivity. Furthermore, it is primarily PO
financing available to the farmers, as opposed to financing available to the
PO, is what makes a difference for scale, market access and productivity.
However, the limited financing available to POs is mostly short term in
nature backed by contracts to provide liquidity to POs while awaiting
payment from buyers so that they can pay the producers. While such

236
value chain trade financing is essential, it should be a policy priority to
support PO access to finance that can be on-lent to farmers, especially
since direct financing to farmers have traditionally been challenging due
to transaction cost and risk perception concerns. In addition, while value
chain finance has been used successfully in multiple countries for
nonperishable cash crops, its application to perishable and non-cash crops
have been very limited. Therefore the scaling and dissemination of tested
value chain finance business models needs policy support, especially for
perishable goods. A global risk mitigation mechanism that combines a
large number of relatively small exposures with geographic diversification
can be a promising intervention and one that has not been tried.
Therefore enabling policies need to address those concerns via risk
mitigation (risk sharing or guarantees, insurance, etc.) and facilitation to
help reduce transaction cost. Policymakers need to be aware of three sets
of constraints in this regard. First, many POs have limited credit track
record and financial intermediaries are reluctant to lend to them or do so
pricing in the great deal of uncertainty regarding the probability of
default. Therefore policy intervention is desirable to help create such

237
track record via risk mitigation tools for financial intermediaries, so that
their risk becomes more predictable when lending to POs. Second, when
a PO on-lends the proceeds of a loan to member farmers, in effect it
becomes the financial intermediary. The PO therefore becomes the lender
to its members and will need to manage those member loans carefully in
order to fulfill its own obligations to its lenders. Most POs do not have the
capacity to fulfill that role and manage the related risks and thus
considerable policy attention is needed to support the development of
related PO capacity. PO financing to farmers is likely to also contribute to
increased member loyalty and help mitigate the risk of side selling. Third,
many financial intermediaries lack the expertise needed to understand
and assess POs’ operations and its risks. Policymakers can have a strong
role to play in relevant capacity building and in the central provision of
relevant information and expertise. Finally, PO provision of financing to
its members alone is not likely to address the market failure of rural
finance. Therefore policy support is also essential for innovations in the
area of rural access to finance that help address the issues of high

238
perceived risk and the high transaction cost, such as mobile banking and
other technology based solutions.
3. Inclusion of small producers. In general this study found that there can be
a trade-off between sustainability and inclusion. Buyers and therefore
POs tend to prefer fewer and larger producers in order to achieve the
desired production volume, putting small farmers at a disadvantage.
However several exceptions became apparent. This study found that
smaller producers and POs can be considerably more productive (in terms
of sales per hectare) than their larger counterparts. Beyond the classic
family labor productivity dynamics, important drivers of this productivity
differential in the Hungarian empirical analysis are related to intensive
agricultural methods involving green houses/tunnels, irrigation,
renewable energy based heating of greenhouses, etc. These techniques do
not only help ensure year around production but also help manage
agricultural production related risks and improve the predictability of
production. In other words several POs of very small farmers, in many
cases cultivating on considerably smaller total land area than their
counterparts, achieved and maintained EU recognition. Those farmers

239
and POs had significantly higher productivity than their larger
counterparts which, in most cases, was achieved via sustainable
intensification. However, sustainable intensification solutions require
considerable investment that most small farmers cannot afford and have
challenges accessing the necessary long term financing for. Long term
financing to small farmers is nearly nonexistent and is likely to once again
require considerable policy innovation that involves various actors along
the value chain and leveraging the public sector’s ability to overcome
transaction cost concerns by organizing the market and generating a large
pool of diversified smallholder loans that becomes more attractive for
private financial intermediaries.
The collective action problem faced by small farmers is not limited to
agriculture. Other sectors with great importance for the global poor, for
examples the handicraft sector and artisanal fisheries2, face very similar
situations in terms of small scale, highly dispersed and often remote production,
2 Artisanal fisheries employ, directly and indirectly, nearly 150 million people globally. FAO actively promotes the formation of cooperatives in the sector.

240
facing a market dominated by global value chains and having to meet their
standards and other requirements. Aggregation best practices in the agrifood
sector may be replicable in those other sectors.

241
7. Conclusions
Smallholders do not only play a central role when it comes to poverty
alleviation efforts but are also key to production expansion. Improved
production methods and productivity improvements by smallholders can
become an important source of food production while also benefitting poverty
alleviation, climate change adaptation and biodiversity conservation efforts. The
shift towards food production being organized based on global value chains and
production networks and the fast dissemination of supermarkets and other
modern food retail outlets around the world increased the need for smallholders
to partake in some form of aggregation mechanism in order to become
contributors to the global food system.
This research attempted to shed some light to the paradox of aggregation:
few smallholders participating in seemingly beneficial collective efforts with the
potential to connect smallholders to modern markets. We proposed a theory of
GVC relevant aggregation that was empirically tested to identify the key
elements that may help ensure POs’ modern market access. It was found that
cooperatives, traditionally supported by policymakers, may be at a disadvantage
when it comes to modern market access. Nonetheless, under certain conditions

242
some of them performed better than their non-cooperative peers. Specifically,
cooperatives were found to be more likely to include farmers with less than one
hectar land and achieve high productivity levels. It was found that some PO
services play more important role than others for modern market access in the
case of already established POs. Access to finance and innovation has been
found to be of great importance as well as innovation. Collective identity
activities also appear to be associated with the more successful POs. These
findings have important policy implications for the development field.

Appendix A: Regional
(Source: FAO’s Investing in
243
Regional Distribution of Farm S ize
Investing in Smallholder Agriculture)
ize

244
Appendix B: Farmer Characteristics According to Siz e
Source: IFC: Innovative Agricultural SME Finance Models (2012)

245
Appendix C: Rural Poverty Trends
(Source: IFAD 2011 Rural Poverty Report 2011
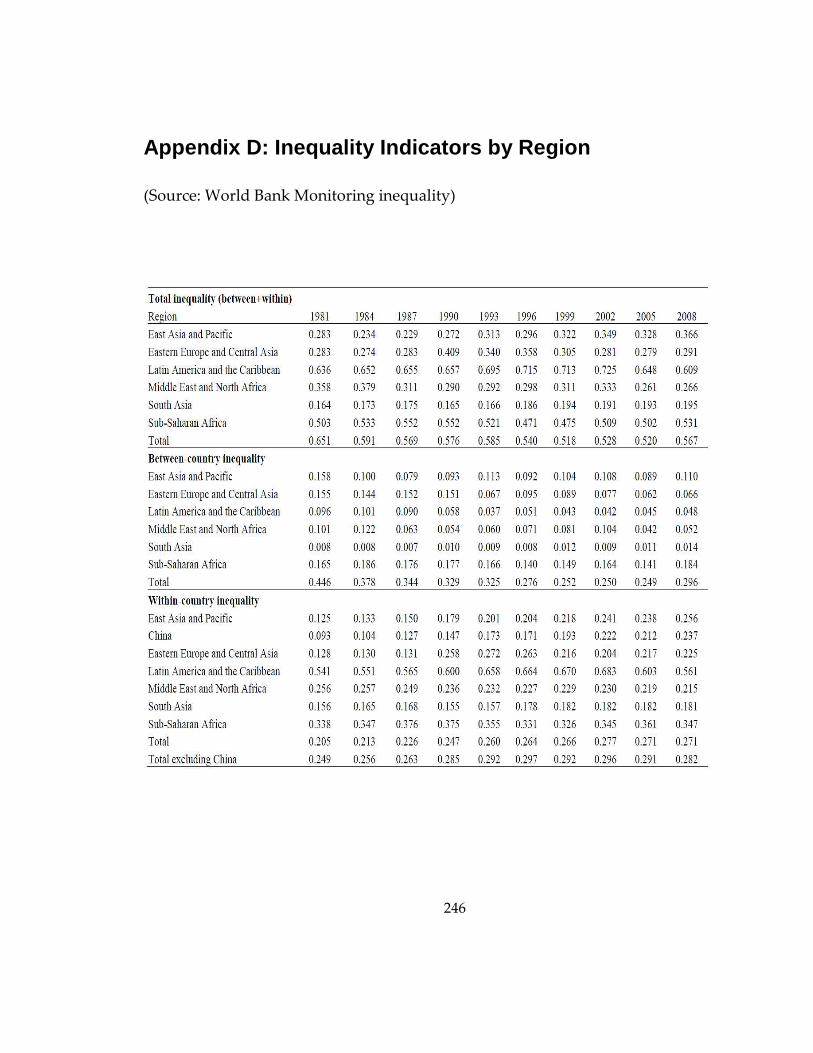
246
Appendix D: Inequality Indicators by Region
(Source: World Bank Monitoring inequality)

Appendix E : Oxfam’s Rating of Top Brands
Source: Author prepared based on Oxfam 2013 report and Oxfam’s behindthebrands.org website.
247
: Oxfam’s Rating of Top Brands
Source: Author prepared based on Oxfam 2013 report and Oxfam’s behindthebrands.org website.
Source: Author prepared based on Oxfam 2013 report and Oxfam’s behindthebrands.org website.

248
Appendix F: History of Cooperatives and Distinct Regional Characteristics United Kingdom. The history of organized cooperatives dates back to the
agricultural and industrial revolutions of the 18th and 19th century in
England. Established in 1844, the Rochdale Society of Equitable Pioneers is
widely considered to be the first successful cooperative and a model for
modern cooperatives. The Rochdale Society of Equitable Pioneers was a
group of 28 weavers and other artisans in Rochdale, England. As the
mechanization of the industrial revolution was forcing more and more skilled
workers into poverty, these tradesmen decided to band together to open their
own store selling food items they could not otherwise afford. With lessons
from prior failed attempts at co-operation in mind, they designed the
Rochdale Principles which served as guidelines for modern cooperatives.
Cooperatives have played an important role in the UK economy since then
and retain a significant market share in a number of industries. Late 19th and
early 20th century farmers’ movements created organizations (such as
National Farmers’ Union) which became incorporated into the policy process
and got considerably de-radicalized (Woods, 2008). Co-operatives formed the

249
Co-operative Party in the early 20th century to represent members of
cooperatives in Parliament. The Co-operative Party now has a permanent
electoral pact with the Labour Party, and some Labour MPs are Co-operative
Party members. (wikipedia.org)
Continental Europe. The Continental European roots of agricultural
cooperatives also go back to the 19th century. Unlike in the UK, the
cooperative movement in Continental Europe initially centered on
cooperative finance, in particular for agriculture.1 Subsequently, decline in
wheat prices driven by less expensive North American wheat led farmers to
forming agricultural cooperatives in order to increase scale and efficiency and
thus reduce cost.2 Denmark is one of the most successful cases of adaptation
to the new circumstances, where many farmers, aided by their cooperatives,
switched to animals husbandry during this period, where the threat of North
1 Cooperative finance was started by the German F.W. Raiffeisen. Cooperative finance was much less expensive than conventional financing but the latter was usually not available at all. Part of the net income at the end of the year was allocated for the social needs of the community: to help orphans, to create employment for the previously incarcerated and to promote cultural preservation, just to mention a few. (Hunyadi based on Raiffeisen F.W: Cooperative Credit as a Tool for Addressing the Ailments of the Rural Population (1885))
2 Interesting to note that North American wheat was considerable less expensive partly because of the organization of North American farmers into cooperatives.

250
American competition was less severe. This transformation from grains to
animal husbandry and the development of the related food industry (in
particular dairy) could not have happened without cooperative organizations
given that the small farmers involved did have neither the know-how nor the
resources to manage this transition.3 As a result, Denmark alone had over
1,500 animal husbandry related cooperatives in 1900.
In the post WWII period cooperatives played an important role in rebuilding.
The Marshall plan limited assistance and required cooperation and sharing of
productive equipment in particular among farmers and producers.
Regulations favorable for cooperatives were adopted and in many cases
cooperatives were eligible for considerable public co-financing.
Simultaneously, the cooperative sector gained considerable policy influence
through institutional arrangements such as the General Committee for
Agricultural Cooperation (established in 1957), which was soon followed by
eight other umbrella institutions representing different cooperative branches.
3 An important part of the Danish transformation was the provision of education, mostly technical but to some extent also cultural, especially to the rural population.

251
In addition, the Coordinating Committee of EEC Co-operative Associations
was formed to, as its name suggests, coordinate among the nine umbrella
organizations and liaise with the European Commission and the European
Parliament. (Hunyadi).
United States. The lifestyle of the settlers required a great deal of cooperation
and collective effort. The first farmer cooperative-like organization was
formed in 1810 but it was not until 1875 that different farmer organizations
started adopting the Rochdale system in carrying out collective activities. By
1900, the United States government began to pass laws that provided a
favorable environment for cooperative development. According to the
United States Department of Agriculture (USDA), the largest number of
agricultural cooperatives existed in 1929-30, about 12,000. The number of
agricultural cooperatives has been decreasing since then, they were estimated
around 3,000 in 2005, reflecting consolidation, often accompanied by
corporatization.

252
China, Cuba, Vietnam, former Soviet Block countries. After some initial influence
from the early European cooperative movement, most cooperatives were
turned into agricultural collectives and became heavily state controlled in
these countries during their communist/socialist rule. Nonetheless,
incorrectly, they continued to be called “cooperatives”. To the best
knowledge of the author of this paper, Cuba remains the only one of these
countries which maintains collectivist farming practices. The other countries
have re-distributed land and have tried to reinstitute cooperatives. However,
“cooperatives” have lost credibility and often continue to be associated with
the old regimes (Valdez 2005, Gorlach, Lotak, Mooney 2007). As a result,
with the exception of Poland, there are few cooperatives operating and they
are poorly organized, though there are ongoing efforts to strengthen the
sector (Szabo 2008).
Former colonies in Asia and Africa. The extensive literature covering India in
particular but also other former British colonies show that the Brits
introduced cooperatives on their colonies early on. Many African countries
have a long history of collective activities and the newfound political

253
assertiveness of farmers was associated with the formation of cooperatives in
Ghana and Uganda (Young, Sherman, Rose 1981). Cooperatives had heavy
government involvement during colonial times and active government
participation in the cooperative sector continues to this day.
Latin America. Mc Clintock (1981) shows that in Latin America the
abolishment of the haciendas and thus the traditional patron/client system
gave rise to cooperatives and often evolved as the organizations to deal with
broader concerns of the farmers and several successful examples of social
movements and protests have been directly linked to cooperatives in Latin
America (Mc Clintock 1981). It is important to highlight that in contrast with
the Asian and African colonies, Latin American cooperatives evolved from
bottom-up, rather than introduced from top-down. This process facilitated by
the emerging cooperatives created new political capacity which now
suddenly represented a threat to the state and led to differing degrees of
government involvement in the sector. However the peasantry’s new
political assertiveness was often accompanied by weak regimes which did not

254
impose such heavy handed involvement in the cooperative sector as did the
Chinese, Tanzanian and Cuban regimes.

Appendix G: H ypothetical Case of Peruvian Coffee Farmer Profit and Loss Statement with and without Financing (source: Dalberg 2012)
255
ypothetical Case of Peruvian Coffee Farmer Profit and Loss Statement with and without
ypothetical Case of Peruvian Coffee Farmer Profit and Loss Statement with and without

256
Appendix H: Agromantaro
Agromantaro, a mid-size Peruvian company that sources artichokes and
jalapenos from Peruvian smallholders and processes and packages them for
European and the US markets, one of them being General Mills. Agromantaro,
General Mills and CARE partnered to provide small farmers with training on
crop management and post-harvest practices, microloans to purchase artichoke
shoots and seeds for farmers who lack collateral or a verifiable credit history,
training on how to form farmer cooperatives and financial planning education
and related information. Agromantaro needs to secure a growing supply of
artichokes and jalapenos that meets the standards and requirements imposed by
General Mills4, creating strong incentive to facilitate aggregation and capacity
building and to develop long term relationship with producers. General Mills is
similarly interested in securing a stable dependable supply but that alone may
not be a sufficient justification for engaging in Agromantaro’s program with
smallholders. However, as an international brand targeting socially conscious
4 Minneapolis based General Mills is one of the world’s leading food companies with annual sales of $17.8 billion in 2013, with brands including Cheerios, Fiber One, Häagen-Dazs,
Nature Valley, Yoplait, Betty Crocker, Pillsbury, Green Giant, among others, and operating in over 100
countries.

257
European customers (General Mills’ Le Géant Vert is France’s top selling brand
in canned artichokes), the publicity around such smallholder programs can help
enhance General Mills’ brand value and can help meet sustainable sourcing
commitments more generally as illustrated by the mention of the above initiative
in the 2013 press release about General Mills’ sustainable sourcing commitment.
CARE International, an international humanitarian organization, will be
providing community development and community governance related support.
(http://www.generalmills.com/ChannelG/NewsReleases/Library/2013/Sep
tember/peru_sourcing.aspx,
http://www.generalmills.com/Home/ChannelG/NewsReleases/Library/20
13/September/sourcing_10

Appendix I : Financing Sources for Agriculture in Peru
(Source: Dalberg 2012)
258
: Financing Sources for Agriculture in Peru
: Financing Sources for Agriculture in Peru

259
Appendix J: Hungarian Producer Organization
Requirements

260
Appendix K: Map of Hungary

261
Appendix L. Hungary Vegetable Statistics
Statistics on the most important vegetables in Hung arian agriculture
2010 2011 2012 2010 2011 2012 2010 2011 2012 2010 2011 2012 2010 2011 2012 2010 2011 2012
Land Area (hectars) 67,835 75,534 76,802 1,695 2,318 2,076 602 1,048 1,055 1,693 1,885 1,963 2,023 2,031 1,896 1,874 1,975 1,280
Total production (tons) 1,144,363 1,475,291 1,363,075 40,895 57,592 57,183 4,171 6,466 6,392 58,532 65,149 74,721 27,641 32,256 32,151 134,274 163,349 108,799
Sold to
trader or processor 397,072 586,323 587,012 6,867 9,079 8,664 1,067 1,261 1,903 9,925 13,458 18,697 5,065 7,658 3,851 39,732 59,277 27,280
traditional market 136,511 174,002 144,615 4,314 6,946 7,529 829 2,029 1,843 11,353 12,506 11,821 6,693 7,351 8,201 10,243 25,218 21,531
direct export 12,131 11,882 9,318 0 0 0 300 0 0 0 0 0 0 0 0 518 1,333 836
processed or used by producer 20,857 29,048 35,283 5,952 6,493 5,766 16 89 138 1,851 1,914 2,921 68 95 72 1,821 1,916 1,990
own consumption 95,378 95,254 87,146 6,885 6,947 7,121 1,259 1,194 1,053 14,354 13,757 13,075 6,209 5,938 5,427 11,761 11,622 8,860
wastage 5,887 8,621 12,568 650 997 1,589 69 40 149 677 1,099 1,685 366 464 429 138 352 328
change in inventory 7,350 27,449 19,665 -685 2,132 2,677 71 113 260 761 2,217 1,985 1,313 1,365 2,257 6 0 -14
TOTAL 1,147,349 1,480,245 1,371,963 41,842 58,468 59,118 4,171 6,471 6,527 58,725 65,308 74,912 27,642 32,297 32,151 134,288 163,399 108,826
Imports
tons x x x 14,125 12,447 9,230 1,026 997 1,485 12,453 11,569 7,787 .. .. .. 18,996 14,921 9,853
million Ft 21,924 20,476 16,811 1,312 1,053 604 637 569 421 1,140 1,078 828 .. .. .. 6,088 4,555 3,424
Exports
tons x x x 1,733 2,189 2,511 417 437 256 1,518 2,398 2,180 .. .. .. 4,355 3,768 2,298
million Ft 25,476 28,478 29,741 210 314 284 297 322 131 103 241 269 .. .. .. 1,481 1,777 1,201
2010 2011 2012 2010 2011 2012 2010 2011 2012 2010 2011 2012 2010 2011 2012 2010 2011 2012
Land Area (hectars) 980 765 798 5,800 6,392 6,083 622 687 665 14,377 15,523 15,607 2,199 1,915 1,925 2,386 2,786 2,587
Total production (tons) 37,989 35,909 33,932 141,086 202,920 182,709 8,593 9,030 11,748 61,075 99,118 92,361 17,034 16,897 17,874 57,127 80,798 65,294
Productivity (ton/hectar) 24,610 31,360 29,460 22,490 30,420 29,350 11,640 11,550 16,150 3,970 6,100 5,620 5,790 6,980 7,380 21,600 26,730 23,010
Sold to
trader or processor 22,317 22,221 19,157 54,661 53,606 62,982 943 787 2,169 37,853 56,246 60,234 7,266 7,302 12,190 10,520 13,610 10,151
traditional market 5,223 3,032 2,602 21,429 25,358 20,678 3,085 2,994 3,347 1,770 3,485 2,877 482 546 857 9,161 10,577 11,779
direct export 170 164 154 2,051 1,831 1,756 0 0 0 0 0 154 0 0 0 514 486 285
processed or used by producer 262 361 329 1,018 853 600 25 35 24 227 811 397 46 71 159 3,449 6,732 5,923
own consumption 9,627 8,600 7,251 4,066 7,191 5,186 649 773 789 2,955 3,113 2,946 2,093 1,659 1,691 7,070 7,739 7,185
wastage 74 232 243 502 785 858 85 103 81 125 140 247 64 174 222 1,146 1,251 1,150
change in inventory 2 0 2 1 2 0 0 0 0 11 -12 0 1 0 1 6,249 19,776 11,314
TOTAL 37,989 35,909 33,961 141,086 202,920 182,709 8,593 9,030 11,748 61,231 99,180 92,361 17,068 16,911 17,874 57,157 81,003 65,436
Imports
tons 14,867 13,560 11,573 12,994 7,023 5,245 3,974 1,341 830 219 72 24 18 85 379 5,583 5,247 3,886
million Ft 2,191 1,777 1,710 1,016 569 479 574 227 158 41 13 10 14 24 75 421 406 261
Exports
tons 10,531 9,915 11,079 58,768 45,788 54,014 56 107 1,433 128 79 312 8 12 99 3,671 3,939 4,040
million Ft 1,623 1,453 2,019 3,947 2,475 3,470 11 26 111 25 9 44 3 2 21 896 848 886
2010 2011 2012 2010 2011 2012 2010 2011 2012 2010 2011 2012 2010 2011 2012 2010 2011 2012
Land Area (hectars) 243 288 351 302 228 245 2,451 2,105 1,999 700 499 595 21,837 26,532 29,366 1,609 2,400 2398
Total production (tons) 7,873 7,627 8,278 7,099 7,397 6,910 109,533 117,511 79,125 11,923 9,741 12,833 302,757 427,290 433,613 14,460 20,792 21864
Productivity (ton/hectar) 18,250 13,950 13,200 14,120 19,350 16,820 33,860 44,780 33,270 15,830 16,970 19,420 13,610 15,860 14,580 8,650 8,450 7,950
Sold to
trader or processor 2,880 3,109 3,581 1,156 1,361 2,632 26,757 30,938 33,121 3,434 4,831 5,904 142,610 268,780 284,403 12,980 15,430 10,934
traditional market 907 935 1,211 983 1,101 1,207 33,441 36,948 21,478 2,106 1,879 1,898 7,938 12,914 7,079 425 1,142 1,091
direct export 283 190 0 0 0 0 3,156 3,082 3,128 174 144 0 0 0 12 0 0 0
processed or used by producer 19 20 18 145 262 243 255 780 699 122 1,180 1,307 969 1,114 6,059 601 542 1,912
own consumption 1,350 1,217 1,251 1,927 1,692 1,538 7,582 7,249 6,410 879 790 785 3,028 3,626 4,566 536 486 487
wastage 27 27 26 39 34 103 226 228 307 33 44 300 737 1,305 3,886 20 24 9
change in inventory 1 -1 -1 0 0 0 32 0 -31 -7 391 0 -1,063 517 -1,033 -102 -45 -19
TOTAL 7,873 7,627 8,278 7,099 7,397 6,910 109,555 117,628 79,220 11,945 10,130 13,830 303,002 427,475 436,812 14,460 20,792 21,864
Imports
tons 2,159 2,711 2,765 .. .. .. 10,490 8,008 4,476 .. .. .. 1 1,157 1,750 1,506 2,389 1,717
million Ft 503 533 595 .. .. .. 3,133 2,487 1,372 .. .. .. 1 32 49 957 1,700 1,099
Exports
tons 1,081 916 1,549 .. .. .. 21,703 23,033 24,739 .. .. .. 919 1,620 1,591 2,388 2,336 1,957
million Ft 267 313 345 .. .. .. 7,223 6,262 6,979 .. .. .. 224 252 283 2,206 2,273 1,968
SPICE PEPPERSSALAD SPAGETTI SQUASH GREEN PEPPERS TOMATO PEPPERS SWEET CORN
TOMATOES
CUCUMBER WATERMELON CANTELOUPE GREEN PEAS GREEN BEANS CABBAGE
TOTAL VEGETABLES ONIONS GARLIC CARROTS PARSLEY ROOT
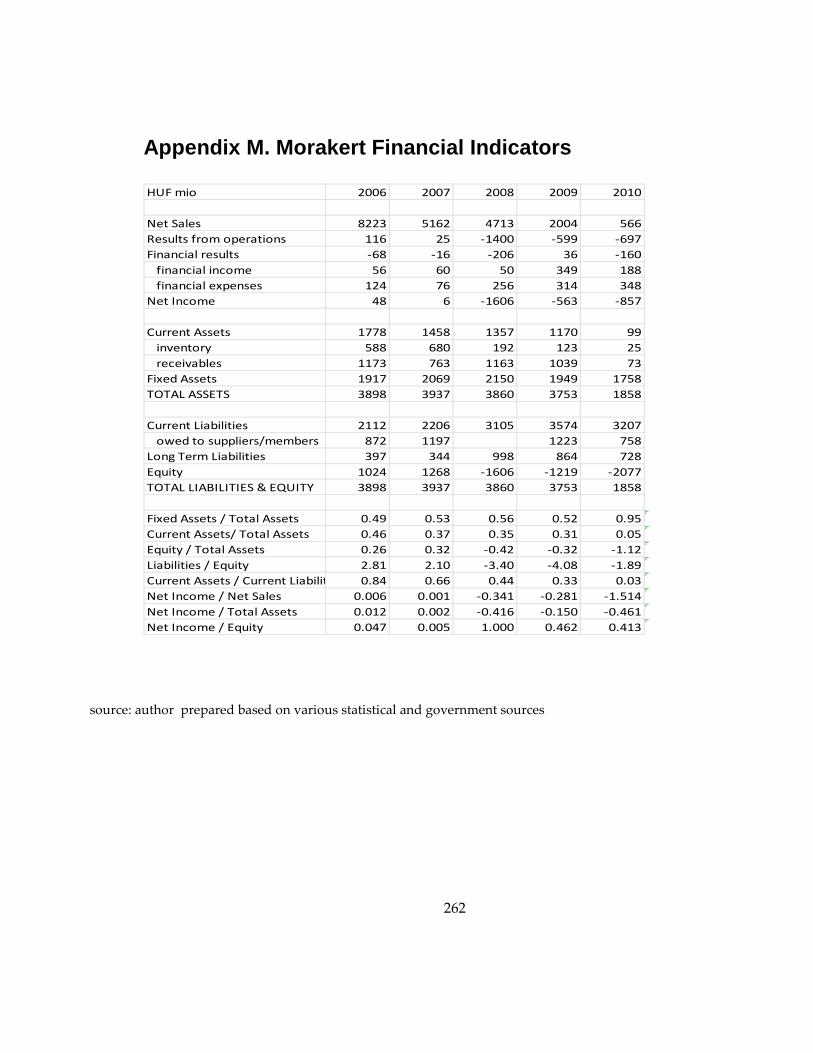
262
Appendix M. Morakert Financial Indicators
source: author prepared based on various statistical and government sources
HUF mio 2006 2007 2008 2009 2010
Net Sales 8223 5162 4713 2004 566
Results from operations 116 25 -1400 -599 -697
Financial results -68 -16 -206 36 -160
financial income 56 60 50 349 188
financial expenses 124 76 256 314 348
Net Income 48 6 -1606 -563 -857
Current Assets 1778 1458 1357 1170 99
inventory 588 680 192 123 25
receivables 1173 763 1163 1039 73
Fixed Assets 1917 2069 2150 1949 1758
TOTAL ASSETS 3898 3937 3860 3753 1858
Current Liabilities 2112 2206 3105 3574 3207
owed to suppliers/members 872 1197 1223 758
Long Term Liabilities 397 344 998 864 728
Equity 1024 1268 -1606 -1219 -2077
TOTAL LIABILITIES & EQUITY 3898 3937 3860 3753 1858
Fixed Assets / Total Assets 0.49 0.53 0.56 0.52 0.95
Current Assets/ Total Assets 0.46 0.37 0.35 0.31 0.05
Equity / Total Assets 0.26 0.32 -0.42 -0.32 -1.12
Liabilities / Equity 2.81 2.10 -3.40 -4.08 -1.89
Current Assets / Current Liabilities 0.84 0.66 0.44 0.33 0.03
Net Income / Net Sales 0.006 0.001 -0.341 -0.281 -1.514
Net Income / Total Assets 0.012 0.002 -0.416 -0.150 -0.461
Net Income / Equity 0.047 0.005 1.000 0.462 0.413

263
Appendix N. DelkerTESZ Financial Indicators
source: author prepared based on various statistical and government sources
HUF mio 2006 2007 2008 2009 2010 2011 2012
Net Sales 4468 4601 5340 5020 5853 5198 5947
Results from operations 180 108 29 77 85 -18 42
Financial results -71 -10 -3 -48 -31 71 20
financial income 18 51 57 25 20 42 56
financial expenses 89 61 60 73 51 29 -36
Net Income 99 90 25 30 51 11 7
Current Assets 714 503 562 708 732 653 836
inventory 69 80 85 136 127 113 157
receivables 295 303 431 427 572 431 633
Fixed Assets 600 619 652 774 778 778 797
TOTAL ASSETS 1317 1130 1217 1483 1648 1591 1724
Current Liabilities 560 345 390 329 468 500 572
owed to suppliers/members 164 168 243 253 276 310 294
Long Term Liabilities 146 40 40 313 259 171 216
Equity 584 687 731 822 885 904 920
TOTAL LIABILITIES & EQUITY 1317 1130 1217 1483 1648 1591 1724
Fixed Assets / Total Assets 0.46 0.55 0.54 0.52 0.47 0.49 0.46
Current Assets/ Total Assets 0.54 0.45 0.46 0.48 0.44 0.41 0.48
Equity / Total Assets 0.44 0.61 0.60 0.55 0.54 0.57 0.53
Liabilities / Equity 1.26 0.64 0.66 0.80 0.86 0.76 0.87
Current Assets / Current Liabilities 1.28 1.46 1.44 2.15 1.56 1.31 1.46
Net Income / Net Sales 0.022 0.020 0.005 0.006 0.009 0.002 0.001
Net Income / Total Assets 0.075 0.080 0.021 0.020 0.031 0.007 0.004
Net Income / Equity 0.170 0.131 0.034 0.036 0.058 0.012 0.008

264
Appendix O: Data Sources Used on Hungarian POs
TESZ number (order in which POs were established): Ministry of Rural
Development
Location: Ministry of Rural Development
Main activity: Ministry of Rural Development
Legal form: Ministry of Rural Development
Year registered: Hungarian Department of Justice records
Number of members aggregated: from ministry of Rural Development official in
charge of overseeing POs
Main products: interviews, PO website, other public information sources (press
releases, etc.) and notes to the financial statements
Value added activities: PO website, other public information sources (press
releases, etc.) and notes to the financial statements
Production area aggregated: PO website, other public information sources (press
releases, etc.) and notes to the financial statements
Contract with supermarket chains: PO website, other public information sources
(press releases, etc.) and notes to the financial statements Export: PO website,

265
other public information sources (press releases, etc.) and notes to the financial
statements
Certification: PO website, other public information sources (press releases, etc.),
notes to the financial statements and interviews
Financial indicators: Hungarian Justice Department database of over 100
different forms have been mined to obtain financial indicators for 2009-2012.
Ratios and composite financial variables were calculated by the author.
Interviews with government officials and market participants were used to
confirm and verify key pieces of information.
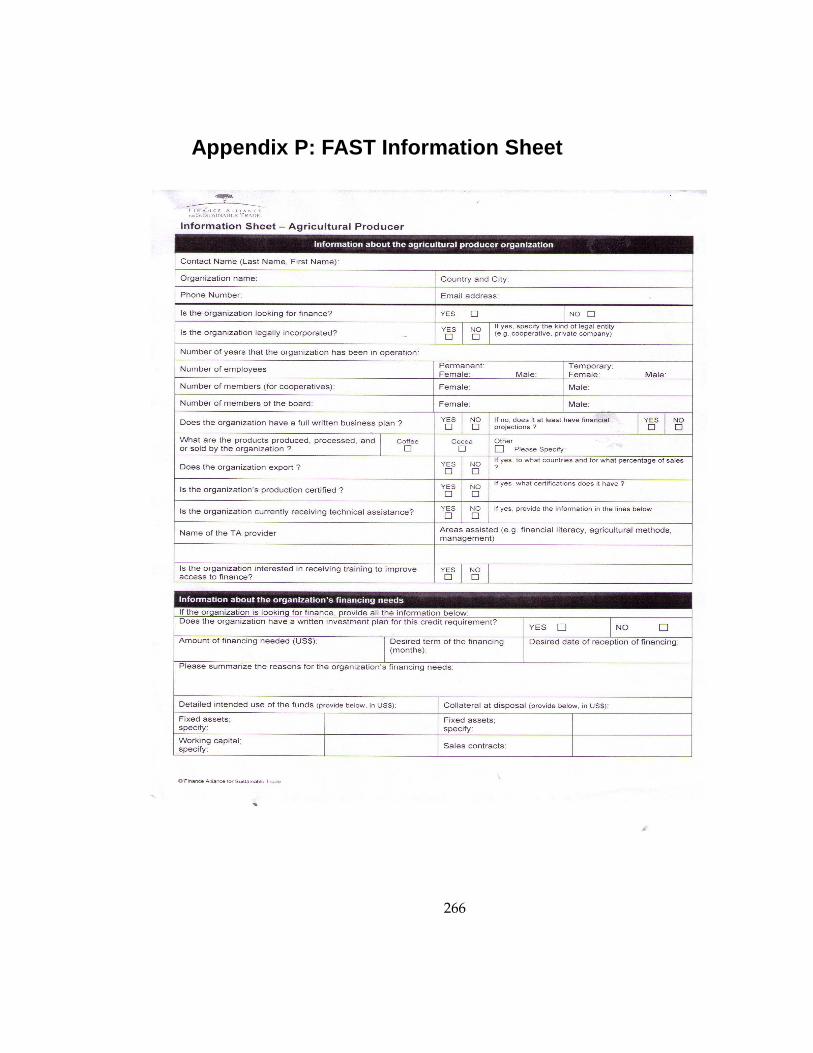
266
Appendix P: FAST Information Sheet

267

268
References
Agriculture for Development. World Development Report. Oxford University Press, 2008. p. 428 Agrifood Industry Transformation and Small Farmers in Developing Countries. Ed by Reardon, T., Barrett, C.B., Berdegué, J.A., Swinnen, J.F.M. (2009) in: World Development, Vol. 37. No 11, pp. 1717-1820. Agrosynergie. Evaluation of Measures Regarding Producer Organisations in the Fruit and Vegetable Sector. Executive Summary. 2008. ec.europa.eu/agriculture/eval/.../producer/ex_sum_en.pdf
Apáti, F.:(2008) Comparative Analysis of the German and Hungarian Apple Production. in: International Journal of Horticultural Science 15 (4) pp. 79-85. Ágoston, B.: (2013) Legyen kert – Magyarország. (Let it be garden – Hungary) in: Demokrata, Dec. 11. Altenburg, T.: (2006) Donor approaches to supporting pro-poor value chains. German Development Istitute. p. 57 Bakucs, L.Z., Ferto, I., Szabo, G.G.: (2007) The Choice of Marketing Cooperative in a Transition Agriculture. Paper prepared for presentation at the I Mediterranean Conference of Agro-Food Social Scientists. 103rd EAAE Seminar Adding Value to the Agro-Food Supply Chain in the Future Euromediterranean Space’. Barcelona, Spain, April 23rd - 25th. p. 17 Bamber, P., Fernandey-Stark, K., Gereffi, G., Guinn, A.: (2013) Connecting local producers in developing countries to regional and global value chains/update OECD Trade Policy Paper No 160. 2013. www.oecd.org/trade p. 51 Barberini, Ivano: The role and the dimension of agricultural co-operatives around the World. ICA VII AIEA2 Congress May 28th 2008 Bologna. p. 28

269
Bargham, J.: (1997) Collective action initiative to improve marketing performance. in: Asian Recorder. K.K. Thomas at Recorder Press. Barrett, C.B.: (2010) Smallholder participation in agricultural value chains: Comparative evidence from three continents http://mpra.ub.uni-muenchen.de/27829/1/MPRA_paper_27829.pdf Barrientos, S., Gereffi, G., Rossi, A.: (2008) What are the Challenges and Opportunities for Economic and Social Upgrading? Capturing the Gains' workshop, University of Manchester, December 2008. p. 25 Barrientos, S., Mayer, F., Pickles, J., Posthuma, A.: (2011) Decent work in global production Networks: Framing the Policy Debate. in: International Labor Review, 2011. 150. 3-4. 297-317. http://r4d.dfid.gov.uk/Output/192827/ Barrientos, S., Visser, M.: (2012) South African Horticulture: Opportunities and Challenges for Economic and Social Upgrading in Value Chains. in: Capturing the Gaines. Working Paper 12, 2012. p. 44 Barrett, C.B.: (2008) Smallholder Market Participation: Concepts and Ecidence from Eastern and Southern Africa. in: Food Policy, Vol 33. pp299-317. Barrett, C.B.: (2012) Smallholder Participation in Contract Farming: Comparative Evidence from Five Countries. in: World Development, Vol 40. No. 4. April, Elsevier, 2012 pp.715-730. Basurto, X., Bennett, A., Weaver A.H., Rodriguez-Van Dyck S., Aceves-Bueno J.S.: (2013) Cooperative and Noncooperative Strategies for Small-scale Fisheries' Self-governance in the Globalization Era: Implications for Conservation. Ecology and Society 18(40): 38. Bebbington, Anthony, Ricardo Abramovay and Manuel Chiriboga (2006): Social movements and the dynamics of rural territorial development in Latin America.

270
(Briefing Paper) Inter-American Development Bank and the International Fund for Agricultural Development. Bellemare, M.F. (2012) As You Sow, So Shall You Reap: The Welfare Impacts of Contract Farming. World Development, Vol 40. No. 7. pp. 1418-1434. Behind the Brands. Food Justice and the "Big 10" Food and Beverage Companies. (2013) Oxfam Briefing Paper Summary. Bernard, T., Collion, M-H., Janvry, de A., Rondot, P., Sadoulet, E.: (2008) Do Village Organizations Make a Difference in African Rural Development? A Study for Senegal and Burkina Faso. in: World Development Vol. 36., No 11. pp 2188-2204, Elsevier. Bernard, T., Spielman, D.J., Taffesse, A.S., Gabre-Madhia, E.Z.: (2010) Cooperatives for Staple Coop Marketing. Evidence from Ethiopia. International Food Policy Research Institute. Sustainable Solutions for Ending Hunger and Poverty. Research Monograph 164. Washington, D.C. Bernard, Tanguy, David J. Spielman (2009): Raching the rural poor through rural producer organizations? A study of agricultural marketing cooperatives in Ethiopia. in: Food Policy 34 Bernard, T., Taffesse, A.S. (2012): Return to Scope? Smallholders Commercialization Through Multipurpose Cooperatives in Ethiopia. International Food Policy Research Institute. Washington, D.C. Bihari, T. (2009): Igy leszünk beszállitók. (This is How We Shall Become Suppliers) in: Haszon-Agrármagazin. Sept. 2009. Bijman, J. (2008): Contract Farming in Developing Countries an overview. Development Cooperation Ministry of Foreign Affairs. The Netherlands. http://www.wageningenur.nl/upload_mm/5/c/b/79333121-6f4b-4f86-9e8e-0a1782e784d6_ReviewContractFarming.pdf
271
Bijman, J., Ton, G.: (2008) Producer organisations and value chains. in: Capacity. org: a gateway for capacity development, 34 (Aug) 2008 http://scholar.google.com/scholar?oi=bibs&hl=en&cluster=16613591816231145386&btnI=1 Birchall, J. (2004): Cooperatives and the millennium development goals. International Labour Organization. Birner, R. (2010): The Political Economy of Policies for Smallholder Agriculture. in: World Development, Vol. 38. 10. Oct. pp 1442-1452. Birner, R., Resnick, D.: (2005) Policy and Politics for Smallholder Agriculture. International Food Policy Research Institute, USA http://www.ifpri.org/sites/default/files/SO7_Birner.pdf A Bizottság 441/2009/EK rendelete (2009. május 27.) a gyümölcs- és zöldségágazatban a 2200/96/EK, a 2201/96/EK és az 1182/2007/EK tanácsi rendeletre vonatkozó végrehajtási szabályok megállapitásáról szóló 1580/2007/EK rendelet módositásáról. EURLEX. 32009R0441. (Commission Regulation 441/2009/EK about the Fruit and Vegetable sector (May 27, 2009.) and its amendments 2200/96/EK, the 2201/96/EK 1182/2007/EK, 1580/2007 No / EC. EUR-LEX. 32009R0441.)
Blandon, J., Henson, S., Islam, T.: (2009) Marketing preferences of small-scale farmers in the context of new agrifood systems: a stated choice model. in: Agribusiness, Vol. 25, No 2, pp 251-267. Blumer, H.: (1962) Collective behavior. New York: The Free Press. Borgen, Svein O.: (2000) Identification as a Trust-generating Mechanism in Cooperatives. in: Annals of Public and Cooperative Economics. 72 (2) 2001. pp. 209-228. Bosc, P-M., Eychenne, D., Hussein, K., Losch, B., Mercoiret, M-R., Roudet, P., Mackintosh-Walker, S.: (2002) The Role of Rural Producer Organizations in the

272
World Bank RuralDevelopment Strategy. Rural Development Strategy Background Paper No 8. p. 171 Brandt, H., Otzen, U.: (2007) Poverty orientated agricultural and rural development. Routledge, London, New York. 342 p. Braun, von J.: (2008) Food and Financial Crises: Implications for Agriculture and the Poor. International Food Policy Research Institute. Britain's Bruising Banana Wars - Media report. (2014) Fair Trade Foundation, London. www.fairtrade.org.uk Brooks, K. Neate, P.: Policies, Institutions and Markets: The First Eighteen Months. International Food Policy Research Institute, Washington D.C. Bush, E., Simi, P.: (2001) European farmers and their protest. in: Contenious Europeans: protest and politics in an emerging polity. ed by Imig, D., Tarrow, S. Cadot, O. at al: (2006) The origin of goods : rules of origin in regional trade agreements. Oxford ; New York : Oxford University Press, 2006. Carroll, T., Stern, A., Zook, D., Funes, R. Rastegar, A., Lien, Y., Bhatia, P.: (2012) Catalyzing Smllholder Agricultural Finance. Dalberg Global Development Advisors, 2012. http://dalberg.com/documents/Catalyzing_Smallholder_Ag_Finance.pdf Celebrating 40 years of the Oxfam Walk Cambridge Oxfam Walk Group, 2007. http://www.oxfam.org/ CGIAR Systemwide Program on Collective Action and Property . www.capri.cgiar.org/

273
Chamala, Sh., Shingi, P.M.: (1997) Establishing and Strengthening Farmer Organization. in: Improving Agricultural Extension. ed. by Swanson, B.E., etc. Chapter 21. FAO, Rome Characterisation of Small Farmer sin Asia and the Pacific. FAO Asia and Pacific Comission on Agricultural Statistics. 23. Session. Cambodia 2010. http://www.fao.org/fileadmin/templates/ess/documents/meetings_and_workshops/APCAS23/documents_OCT10/APCAS-10-28_-Small_farmers.pdf Chen, M.A., Jhabvala, R., Lund, F.:(2001) Supporting Workers in the Informal Economy: a Policy Framework. Paper Prepared for ILO Task Force on the Informal Economy. Chen, S., Ravallion, M.: Absolute Poverty Measures for the Developing World, 1981–2004, PNAS October 23, 2007 vol. 104 no. 43, p. 16757-16762 Cleaver, K.: (2012) Investing in agriculture to reduce poverty and hunger http://www.ifpri.org/publication/investing-agriculture-reduce-poverty-and-hunger Cloupkova, J.: (2003) European cooperative movement : background and common denominators. Royal Veterinary and Agricultural University (Danemark). Department of Economics and Natural Resources. Contentious Europeans: protest and politics in an emerging polity / ed. by Doug Imig and Sidney Tarrow.. Lanham, Md.: Rowman & Littlefield, 2001. Cooperative businesses in the United States…/ A 2005 Snapshot. Prepared by the National Cooperative Month Planning Committee. 2005 Oct. Cooperative Theory. (1987) New Approches. ed by Royer, J.S. U.S. Department of Agriculture. 261 p. Cooperatives and Producers' Organizations. Food, Agriculture and Decent Work. ILO and FAO working together. 2012 http://www.fao-ilo.org/fao-ilo-coop/en/

274
COPA/COGECA: Agricultural Co-operation in the European Union. Fruit and Vegetable Producer Organizations in the EU Overview and Prospects. in: Promoting Farmer Entrepreneurship Through Producer Organizations in Central and Eastern Europe. Institutions for Rural Development. Working Paper. FAO 2006. No 6. Csáki, C., Forgács, C.: (2009) Small Farms in Central and Eastern Europe: Is there a Future for Them? 111th Seminar, June 26-27, 2009, Canterbury, UK. Csáki, C., Forgács, C., Milczarek-Andrzejewska, D.,: (2007) Restructuring Market Relations in Food and Agriculture in Central and Eastern Europe: Impacts upon Small Farmers. in: Global Supply Chains Standards and the Poor. ed. by Swinnen, J.F.M. CAB International. Oxon, UK., Cambridge, MA, USA. Dalberg Global Development Advisors: Catalyzing Smallholder Agricultural Finance. 2012. www.dalberg.com Dees, G.: (1998) The meaning of social entrepreneurship. http://www.caseatduke.org/documents/ Dees, G.: (2009) Social Ventures as Learning Laboratories, Innovations, Davos-Klosters 2009. Dicken, P.: (2007) Global shift - mapping the changing contours of the World Economy. Domjan, E.: (2013) Termelői együttműködések vizsgálata a zöldség-gyümölcs ágazatban. PhD értekezés. Szent István Egyetem Gödöllő. 178 p.( Producer co-operation inspection of the fruit and vegetable sector. PhD thesis. Szent István University, Gödöllő. 178 p. Doran, A., McFayden, N., Vogel, R. C.: (2009) The Missing Middle in Agricultural Finance: Relieving the capital constraint on smallhold groups and

275
other agricultural SMEs. OXFAM GB, Policy and Practice, Oxfam Research Reports. 2009. http://policy-practice.oxfam.org.uk/publications/the-missing-middle-in-agricultural-finance-relieving-the-capital-constraint-on-112348 Dries, L., Reardon, T., Swinnen, J.F.M.: (2004) The Rapid Rise of Supermarkets in Central and. Eastern Europe: Implications for the Agrifood. Sector and Rural Development. in: Development Policy Review. 22(5), pp. 525-556. Dudás, Gy.: (2009) A termelői értékesítő szervezetek (TÉSZ) lehetőségei a zöldség-gyümölcs termelők koordinálásban a Zöldtermék Szövetkezet példáján keresztül. (The producer marketing organizations (POs) in the fruit and vegetable producers, coordinating via the Green Product Co as an example.) PhD értekezés. Szent István Egyetem, Gödöllő. 189 p. Dudás, Gy., Juhász, A.: (2013) A magyarországi TÉSZ-ek gazdasági szerepének vizsgálata számviteli megközelítés alapján Gazdálkodás. 2013 No 3. Desmarais, A.A.: (2002) Peasant speak / The Via Campesina: Consolidating an International Peasant and Farm Movement. The Journal of Peasant Studies, 2002(2)29. pp 91-124. Elismert zöldség-gyümölcs termelői szervezetek. (2013) (Registered fruit and vegetable producer organizations) FVM. Ellis, K., Keane, J.: (2008) A review of ethical standards and labels: Is there a gap in the market for a new ‘Good for Development’ label? Working Paper 297, Overseas Development Institute. Enhancing the Outreach and Sustainability of Financial Services in Rural and Marginal Areas of Mexico. The World Bank. 2011. A fair globalization : the role of the ILO : report of the Director-General on the World Commission on the Social Dimension of Globalization. 2004, Geneva: International Labour Office. vi, 59 p.

276
Fan S, Brzeska J, Keyzer M, Halsema A: From Subsistence to Profit Transforming Smallholder Farms (IFPRI 2013) Fan, S., Brzeska, J.: The Role of Emerging Countries in Global Food Security. in: IFPRI Policy Brief 15., December 2010. http://www.ifpri.org/sites/default/files/publications/bp015.pdf Fan, S, Brzeska J., Keyzer M., Halsema A. (2013) From Subsistence to Profit. Transforming Smallholder Farms. IFPRI Food Polocy Report. A fenntartható működési programokra vonatkozó nemzeti stratégiák értékelése a zöldség-, gyümölcságazatokban. Zárójelentés. (2012) (Assessment of national strategies for sustainable operational programs in the fruit, vegetable sectors. Final report.) Eruditio Oktatási Zrt. Budapest. 108 p. FAO: Producer organizations: Reclaiming opportunities for development. 2010. www.fao.org/docrep/013/am072e/am072e00.pdf FAO Regional Office for Africa. (2010) Producer Organisations: Reclaiming Opportunities for Development. Policy Brief. FAO Regional Workshop on an Integrated Policy Approach to Commercializing Smallholder Maize Production in Eastern Africa. Federico, G.: (2005) Feeding the world : an economic history of agriculture, 1800-2000 Princeton University Press, 2005. Fernandez-Stark, K., Bamber, P., Gereffi, G.: (2011) The Fruit and Vegetables Global Value Chain. Economic Upgrading and Workforce Development. Center on Globalization, Governance & Competitiveness, Duke University Fernandez-Stark, K., Bamber, P., Gereffi, G.: (2012) Inclusion of small - and medium - sized producers in high value agro-food value chains. Center on Globalization, Governance and Competitiveness, Duke University. 2012. p. 38.

277
Fertő, I., Bakucs, Z.: (2012) Szerződéses kapcsolatok az élelmiszer- láncban és a szerződések kikényszeríthetősége. (Contractual relationships in the food chain and to the enforceability of contracts.) in: Gazdálkodás. Vol. 56. No. 6. pp. 488-500. Az FM Logistic lett az Auchan Magyarország Kft zöldség-gyümölcs raktárának logisztikai szolgáltatója. (2013) (FM Logistic has been Auchan Hungary Kft fruit and vegetable logistics service provider.) Interjú. Logportál.hu Fischer, E., Qaim, M.: (2011) Smallholder Farmers and Collective Action: What Determines the Intensity of Participation? Paper prepared for presentation at the EAAE 2011 Congress Change and Uncertainty: Challenges for Agriculture, Food and Natural Resources (August 30-September 2, 2011 ETH Zurich, Zurich, Switzerland) Francesconi, G.N., Ruben, R.: (2008) The life cycle of agricultural cooperatives: implications for management and governance in Ethiopia. The Life Cicle of Agricultural Cooperatives, 2008. 36(2) p. 115-130 Fruit and vegetables: rules on POs. European Commission, Directorate-General for Agriculture and Rural Development – 02/2011 Fukuyama, F.: (2000) Social capital and civil society, International Monetary Fund, IMF Institute, 2000. General Mills Launches $ 1.1 Million Sustainable Sourcing Program in Peru. News releases, September 05, 2013. www.generalmills.com/channelsg/newsreleases/library/2013/september/peru_sourcing.aspx Gereffi, G., Fernandez-Stark, K.: (2011) Global Value Chain Analysis: a Primer. Center on Globalization, Governance and Competitivness. Duke University, Durham, North Carolina, USA. http://www.cggc.duke.edu/pdfs/2011-05-31_GVC_analysis_a_primer.pdf

278
Gereffi, G., Humphrey, J. Sturgeon, T.: (2005) The governance of global value chains. in: Review of International Political Economy, 2005. 12(1): p. 78-104. Gereffi, G., Korzeniewicz, M.: (1994) Commodity Chains and Global Capitalism. Greenwood Publishing Group 1994. Gereffi, G., Mayer, F.W.: (2004) The Demand for Global Governance, Working Papers Series SAN04-02, September 2004. Globalization and Development Strategy. UNCTAD, 2009. Gereffi, G., Lee, J.: (2012) Why the World Suddenly Cares About Global Supply Chains Journal of Supply Chain Management, 48. pp. 24-32, 2012 Gibbon, P.: (2003) The African Growth and Opportunity Act and the global commodity chain for clothing in: World Development, 2003, v. 31, n. 11, November, pp. 1809-1827 Gijselinckx, Caroline, Patrick Develtere: The co-operative trilemma. Co-operatives between market, state and civil society. Working Papers on Social and Co-operative Entrepreneurship. 2008 Gingrich, Chris D., King, Emily J.: (2012) Does Fair Trade Fulfill the Claims of its Proponents? Measuring the Global Impact of Fair Trade on Participating Coffee Farmers. in: Journal of Cooperatives. Vol. 26, 2012. pp 17-39. GHI (2013): International Trade and Agriculture: Supporting Value Chains to Deliver Development and Food Security.” Global Harvest Initiative, Washington, DC. Gorlach, Krzysztof, Michal Losták, Patrick H. Mooney: Agriculture, communities, and new social movements: East European ruralities in the process of restructuring. In: Journal of Rural Studies 24 (2008)

279
Granovetter, M.: (2001) A Theoretical Agenda for Economic Sociology.Economic Sociology at the Millenium, ed. by Mauro F. Guillen, Randall Collins, Paula England, and Marshall Meyer. Russell Sage Foundation, New York. 2001. Gray, A.W., Boehlje, M.D. : (2005) Risk sharing and transactions costs in producer– processor supply chains. Choices, 4th Quarter, pp. 281−286. http:// farmdoc.illinois.edu/policy/choices/20054/theme2/2005-4-13.pdf Gugerty, Mary Kay, Michael Kremer: Outside funding of community organizations: benefiting or displacing the poor? In: NBER Working Paper No. W7896. 2000. Sept. Guidance for Industry: Guide to Minimize Microbial Food Safety Hazards of Leafy Greens; Draft Guidance. (2009) FDA. U.S. Food and Drug Administration. http://www.fda.gov/ForConsumers/ConsumerUpdates/ucm174200.htm Hanf, J., Torok, T.: Are Cooperatives a Way to Integrate Small Farmers in Supply Chain Networks? Harper, Malcolm, A.K. Roy: Co-operative success. What makes group enterprise succeed. Oxford. IBH Publishing Co., New Delhi, 2000. Hazell, P., Dorward, A. (2007): The future of small farms for poverty reduction and growth. International Food Policy Research Institute. Hazell, P., Poulton, C., Wiggins, S., Dorward, A.R.: (2010) The future of small farms: Trajectories and policy priorities. in: World Development, 2010. Vol 38. No 10. pp. 1349-1361. Hechter, M., Kanazawa, S.: (1997) Sociological Rational Choice Theory. Annual Review of Sociology, Vol. 23. 1997. Helfand, S. M., Levine, E. S.: (2004) Farm size and the determinants of productive efficiency in the Brazilian Center-West. in: Elsevier Agricultural Economics. 31(2004) pp. 241-249.

280
Hellin, J., Markelova, H., Meinzen-Dick, R., Dohrn, S.: Collective action for smallholder market access. in: Elsevier, 34(1), 2009. pp. 1-7. Hellina, J., Lundyb, M., Meijerc, M.: (2009) Farmer organization, collective action and market access in Meso-America. Food Policy, Volume 34, Issue 1, Pages 16-22. Helping Poor Farmers Changes Needed to Feed 1 Billion Hungry. Bill and Melinda Gates Foundation http://www.gatesfoundation.org/Media-Center/Press-Releases/2012/02/Helping-Poor-Farmers-Changes-Needed-to-Feed-1-Billion-Hungry Hennessy, D.A., Babcock, B.A.,Hayes, D.J.: ( 1997) Budgetary and Producer Welfare Effects of Revenue Insurance. American Journal of Agricultural Economics, 79, (3), 1997 pp. 1024-1034 www.ajae.oxfordjournals.org
Henson, S. Humphrey, J.: (2009) The Impacts of Private Food Safety Standards on the Food Chain and on the Public Standard-setting processes. Hernandez, R., Reardon, T., Berdegue, J.: (2007) Supermarkets, wholesalers, and tomato growers in Guatemala. in: Agricultural Economics, 36(3), 281–290. Higgins, A.J., Miller, C. J., Archer, A.A., Ton,T., Fletcher, C. S. McAllister, R. R. J.: (2009) Challenges of operations research practice in agricultural value chains. in: Journal of the Operational Research Society (2010) Vol 61, pp. 964–973. published online 20 May 2009. Hilhorst, T., Wennink, B.: (2010) Market Opportunities in Smallholder Agriculture: Strengthening Women`s Livelihoods Through Collective Action. International Advisory Group Meeting, Oxford. Horváth, Z.: (2010) Zöldség-gyümölcs termelők együttműködése, a TÉSZ-ek értékesitési és gazdasági helyzetének vizsgálata. (Fruit and vegetable growers co-
281
operation, examination of POs sales and marketing position ) PhD értekezés. Szent István Egyetem Gödöllő. 178 p. Humphrey, J.: (2006) Global value chains in the agrifood sector. UNIDO p. 68 Humphrey, J., Schmitz, H.: (2004) Governance in global value chains, in Local enterprises in the global economy: issues of governance and upgrading. Institute of Development Studies. Humphrey, J., Memedovic, O.,: (2006) Global Value Chains in the Agrifood Sector Working papers, United Nations Industrial Development Organization UNIDO, 2006. p. 58 Humphrey, J.: The supermarket revolution in developing countries: tidal wave or tough competitive struggle? in: Journal of Economic Geography vol 7 (4): 433-450. 2006. Hunt, S.A., Bendorf R.D.: (2004) Collective identitiy, solidarity, and commitment. The Blackwell Companion to Social Movements. Blackwell Publishing Ltd 2004. http://wiki.zirve.edu.tr/sandbox/groups/economicsandadministrativesciences/wiki/0edb9/attachments/371d5/Hunt%20and%20Benford.pdf Hunyadi, Attila: A különböző szövetkezeti tipusok és a szövetkezeti értékrend kialakulása.( Different types of co-operative and co-operative values formation.) IFAD 2011 Rural Poverty Report www.un.org/en/.../ruralpov/pdf/ifad_rural_poverty.pdf IFAD 2013 Governing Council. The Power of Partnerships: Forging Alliances for Sustainable Smallholder Agriculture. IFC Innovative Agricultural SME Finance Models.pdf - IFC www.ifc.org/.../Innovative+Agricultural+SME+Finance+Models.pdf?.

282
Impacts on the Viability of Rural Communities. EU. 2006. India`s Milk Revolution - Investing in Rural Producer Organizations. Scaling Up Poverty Reduction: A Global Learning Process an Conference. Shanghai, 2004. Institute of Rural Management, India. World Bank, EEC Food Aid. 2004. 24 p. Investing in Smallholder Agriculture for Food Security. A Report by The High Level Panel of Experts on Food Security and Nutrition. HLPE Report 6. June 2013. http://www.fao.org/fileadmin/user_upload/hlpe/hlpe_documents/HLPE_Reports/HLPE-Report-6_Investing_in_smallholder_agriculture.pdf Investing in Smallholder Family Agriculture for Global Food Security and Nutrition. IFAD POST-2015 POLICY BRIEF 3. IFAD Investing in Rural People. International Fund for Agricultural Development, Rome, Italy, 2013. http://www.ifad.org/pub/post2015/english/3.pdf Jack, A.: African Farming. in: Financial Times, March 7, 2014. Jaffee S, Rios LD, Larson G: (2012) Agri-food Standards Compliance and African Smallholders: Lessons Emerging from Implementation Experience. Smart Lessons. James, H.S. Jr., Sykuta, M.: (2004) Farmer Trust in Producer- and Investor- owned Firms: Evidence from Missouri Corn and Soybean Producers. Working Paper No. 2004-14. Contracting and Organizations Research Institute, University of Missouri - Columbia. Juhasz, A., Seres, A., Stauder, M.: (2008) Business concentration in the Hungarian food retail market. Studies in: Agricultural Economics No. 108. p. 67-80. Kaplinsky, R.: (2005) Globalization, poverty and inequality: Between a rock and a hard place. London: Polity.

283
Kaplinsky, R.: (2010) The role of standards in global value chains and their impact on economic and social upgrading. Policy Research Working Paper 5396. World Bank. Kaplinsky, R.: (2004) Spreading the gains from globalization: What can be learned from value-chain analysis? Problems of Economic Transition. Kaplinsky, R.: (2008) What does the rise of China do for industrialization in Sub-Saharan Africa? Review of African Political Economy. 35(115) pp. 7-22. Kherallah, M. et al.: (2001) Impact of agricultural market reforms on smallholder farmers in Benin and Malawi, Volume 2 International Food Policy Research Institute (IFPRI); Washington, D.C.; 2001 Kispál-Vitai Zs.: (2006) Gondolatok a szövetkezetelmélet fejlődéséről. (Reflections on the theory of co-evolution.) in: Közgazdasági Szemle. LIII. Jan. pp. 69-84. Klandermans, B., Sabucedo, J.M., Rodriguez, M., Weerd, M. de: Identity Processes in Collective Action Participation: Farmers' Identity and Farmers' Protest in the Netherlands and Spain http://www.tandfonline.com/doi/pdf/10.1080/714003943 Krishna, A. (2002). Active Social Capital. Tracing the Roots of Development and Democracy. Columbia University Press. Kuria, N.: (2007) The role of co-operatives in the promotion of peace in Kenya. in: Co-peratives and the pursuitof peace. New Rochdale Press. p. 386. Kurien, V.: (2004) India's milk revolution / investing in rural producer organizations. in: Ending Poverty in South Asia - Ideas that work. pp.37-68. Larrea, C., Minteuan, S., Potts, J.: (2013) Investing for Change: An Analysis of the Impacts os Agricultural Investments from Select FAST Canada. https://www.fastinternational.org/files/FAST%202013%20Impact%20Report0.pdf

284
Lee, J., Gereffi, G., Beauvais, J.: (2012) Global value chains and agrifood standards: Challenges and possibilities for smallholders in developing countries. PNAS 109(31) 12326-12331. http://www.pnas.org/content/109/31/12326.full Lee, J., Gereffi, G., Barrientos, S.: (2011) Global value chains, upgrading and poverty reduction. Capturing the Gains. Economic and social upgraing. Briefing note 3 November 2011. Lerman, Z., Csaki, Cs., Feder, G.: (2002) Land policies and evolving farm structures in transition countries. Policy Research Working Paper 2794, The World Bank Development Reseach Group, Rural Development, 2002. p. 35 Lerman, Z., Ruben, R.: (2005) Why Nicaraguan Peasants Remain in Agricultural Production Cooperatives. American Agricultural Economics Association Annual Meeting, Providence, Rhode Island. Leviathans. Multinational Corporations and the New Global History. ed by Chandler, A. D., Mazlish, B. Cambridge University Press. (2005) Linking social and ecological systems: Management Practices and Social Mechanisms for Building Resilience. ed. by Berkes, F., Folke. C., ColdingJ. Cambridge University Press. 1998. Lipton, M.,: (2005) The Family Farm in a Globalizing World. The role of crop science in alleviating poverty. International Food Policy Research Institute. Washington, DC, USA. http://www.ifpri.org/publication/family-farm-globalizing-world Loayza, N., Raddatz, C.: The composition of growth matters for poverty alleviation. in: Journal of Development Economics, vol 93, pg. 137-151. 2009. Local Organizers. Summer Conference University on Information Technology in Agriculture and Rural Development, Debrecen. 2009.

285
Logue, J., Yates, J.: (2005) Productivity in cooperatives and worker-owned enterprises: ownership and participation. Make a difference! International Labor Office, Employment Sector. 2005. p. 78. http://american.coop/sites/default/files/Logue%20and%20Yated%20-%20Productivity%20in%20Cooperatives.pdf Maertens, M. at al.: (2007) Governance, coordination and distribution along commodity value chains : Rome, 4-5 April 2006. FAO UN http://www.worldcat.org/title/governance-coordination-and-distribution-along-commodity-value-chains-rome-4-5-april-2006/oclc/191047936/editions?referer=di&editionsView=true Maertens, M., Swinnen, J.: (2009) Food Standards, Trade and Development. in: Review of Business and Economics. 2009. No 3. pp. 313-326. Maertens, M., Swinnen, J.F.M.: (2009.) Trade, Standards and Poverty: Evidence from Senegal. in: World Development Volume 37, Issue 1, Pg. 161-178. Magyar zöldség-gyümölcs ágazati stratégia 2012. (Hungarian fruit and vegetable sector strategy) FRUITVEB Magyar zöldség-gyümölcs ágazati stratégia megvalósíthatósági tanulmánya. (Feasibility study of the Hungarian fruit and vegetable sector strategy.) FRUITVEB 2012. Markelova, H, Meinzen-Dicka, R., Hellinb J., Dohrn, S.: (2009) Collective action for smallholder market access. in: Food Policy, Volume 34, Issue 1, February 2009, Pages 1-7. Mayer, Frederick W.:(2014) Narrative Politics: stories and collective action. Oxford University Press. Mayer, F., Gereffy, G.: (2010) Regulation and Economic Globalization: Prospects and Limits of Private Governance. Private Regulation in the Global Economy. in: Business and Politics, Vol. 12, No 3.

286
Mayer, F., John, P.: (2008) Governance and Implications for Decent Work in Global Production Networks. McClitock, Cynthia: Peasant cooperatives and political change in Peru. Princeton University Press. 1981. p. 425. Meeting the Growing Demand for Food in Africa: views of African governments and small-scale producers' organizaions. 9 October 2013. http://www.europafrica.info/en/cfs/meeting-the-growing-demand-for-food-in-africa-views-of-african-governments-and-small-scale-producers-organizations Michelson, H., Reardon, T., Perez, F.: (2010) Small Farmers and Big Retail: trade-offs of supplying supermarkets in Nicaragua. in: Staff Paper 2010-02 Department of Agricultural, Food, and Resource Economics Michigan State University. Microfinance Institutions Moving into Rural Finance for Agriculture. Sourcebook: Agriculture Investment. The World Bank. 2011. http://web.worldbank.org/WBSITE/EXTERNAL/TOPICS/EXTARD/EXTAGISOU/0,,contentMDK:20945654~menuPK:2758558~pagePK:64168445~piPK:64168309~theSitePK:2502781,00.html Minten, B., Randrianarison, L., Swinnen, J.F.M.: (2009) Global Retail Chains and Poor Farmers: Evidence from Madagascar. in: World Development, vol. 37, issue 11, pp. 1728-1741. The Missing Middle. Entreprenurial Finance Lab Research Initiative, Center for International Development at Harvard University. http://www.hks.harvard.edu/centers/cid/programs/entrepreneurial-finance-lab-research-initiative/the-missing-middle Monitor (2012): Promise and Progress: Market-Based Solutions to Poverty in Africa http://www.inclusivebusiness.org/2011/05/monitor-market-based-solutions-africa.html

287
Mórakert: márkabolt nyílt Budapesten. http://www.elelmiszer.hu/fmcg szakmai hirek/cikk/morakert markabolt nyilt budapesten Morfi, Ch.: (2014) Switching Behavior of Finnish Farmers Key Elements of Commitment and Loyalty. Master's thesis. Swedish University of Agricultural Sciences. p. 38. Mosimane, A., Breen, C., Nkhata, B.: (2012) Collective identity and serilience in the management of common pool resources. in: International Journal of the Commons, 6(2), 344-362. Mujawamariya, G., D'Haese M., Speelman S. (2013). Exploring Double Side-selling in Cooperatives, Case Study of Four Coffee Cooperatives in Rwanda. Food Policy vol 39 pp. 72-83. Munshi, N.: (2012) A wholly Indian success. Financial Times. July 19, 2012. Murphy, S.: (2012) Changing Perspectives: Small-scale farmers, markets and globalization. Knowledge Programme Small Producer Agency in the Globalized Market. International Institute for Environment and Development. http://ictsd.org/downloads/2012/08/changing-perspectives-small-scale-farmers-markets-and-globalisation-murphy-iied.pdf Musshof, O. et al.: Land markets in agent-based models of agricultural structural change : design, analysis and application. Manuscript. 2009 https://www.worldcat.org/title/land-markets-in-agent-based-models-of-agricultural-structural-change-design-analysis-and application/oclc/837609754?referer=br&ht=edition Nadvi, K.: (2004) Globalization and poverty: How can global value chain research inform the policy debate? Ids Bulletin-Institute of Development Studies, 2004. 35(1): p. 20.
288
Nagyne Demeter, Dora. (2009) Egymassal vagy egymas mellett? (Together or Alongside Each Other). A Falu, XXIV. issue. Fall 2009. Narrod, C. et al.: (2009) Pulic-private partnership and collective action in high value fruit and vegetable supply chains. Food Policy 34(1), 8-15. Neven, D., Woolverton, A., Okello, J.J.: (2012) An Introduction to Collective Marketing by Smallholder Farmers www.fao.org/...2012/.../Neven_Intro_to_Smallholder_Collective_Maize_Marketing.pdf Nilesson, J., Hendrikse, G. (2011): Gemeinschaft and Gesellschaft in Cooperatives. Springer. in: New Developments in the Theory of Networks Contributions to Management Science 2011, pp 339-352 Nilson, J., Svendsen, G.L.H., Svendsen, G.T.: (2012) Are Large and Complex Agricultural Cooperatives Losing Their Social Capital? in: Agribusiness Vol. 28 (2) 187-204. Nordic Association of Agricultural Scientist NJF Report • Risk Assessment of Global Agrifood Product Chain Vol 4 •No 7 •Year 2008 Nye, A.: (1994) Philosophia: the thought of Rosa Luxemburg, Simone Weil, and Hannah Arendt. Routledge, 1994. p. 280. Of the world's 100 largest economic entities, 51 are now corporations and 49 are countries. ed by Anderson, S., Cavanagh, J., in: tt Fortune, July 31, 2000. World Bank, Development Report 2000. http://www.corporations.org/system/top100.html Olson, M.: (1971) The logic of collective action: public goods and the theory of groups. Harvard Economic Studies, p. 186 Ortmann, G.F., King, R.P.: (2007) Agricultural Cooperatives I: History, Theory and Problems. in: Agrekon, Vol. 46. No 1. March 2007. pp 40-68.

289
Ortmann, G.F., King, R.P.:(2006) Small-scale farmers in South Africa: Can agricultural cooperatives Facilitate access to input and product markets? Staff Paper P06-4 Department of Applied Economics College of Agricultural, Food, and Environmental Sciences University of Minnesota. http://ageconsearch.umn.edu/bitstream/13930/1/p06-04.pdf
Papp, J.: (1999) Competitive horticultural sectors in the context of the EU: a concept for development. (Title translated from Hungarian). Hungarian Academy of Science strategic research program. Agroinform Kiadó. Budapest, p. 8–14. Paramasvaran, Kandiah: Slums of cities: globalization and its impact on poverty, housing, slums and sanitation. 22nd international cooperative research conference, Paris. France, 19—22 October 2006. Penrose-Buckley, Chris: Producer Organisations: A guide to developing collective rural enterprises. Oxfam. 2007. p. 200 PepsiCo and Inter-American Development Bank Sign Agreement to Spur Development in Latin America and Caribbean. PEPSICO, 2011. http://www.pepsico.com/PressRelease/PepsiCo-and-Inter-American-Development-Bank-Sign-Agreement-to-Spur-Development-i02222011.html Pietrobelli, C.: (2009) Dualism and Power in Agriculture Scientific and Technological Development. Rivista dell'Associazione Rossi-Doria. Pietrobelli, C.: (2008) Global value chains in the least developed countries of the world: threats and opportunities for local producers. in: International Journal of Technological Learning, Innovation and Development. 1(4), 2008. pp. 459-481. Pollet, I., Develtere, P.: (2004) How Co/operatives Cope. A survey of major co/operative development agencies. Higher Institute for Labour Studies. Leuven-Belgium. 79 p.

290
Polletta, F., Jasper J.M. (2001). Collective Identity and Social Movements. Annual Review of Sociology. Vol 27, pp. 283-305. Pomerantz, P.: (2004) Aid Effectiveness in Africa. Developing Trust Between Donors and Governments. p 151. Potari, D. (2012) Prospects for Small Producers. (A Kistermelo eselyei) Published in Koros Tanulmanyok / Koros Studies 2012, pp. 104-112 Poulton, C., Dorward, A., Kydd, J.: (2010) The Future of Small Farms: New Directions for Services, Institutions, and Intermediation. in: World Development 2010. Vol. 38, No. 10, pp. 1413–1428, Elsevier. Puusa, A., Tolvanen, U.: (2006) Organization identity and trust. in: Electronic Journal of Business Ethics and Organization Studies. 11(2), pp. 29-33. Ravallion, M.: (1996) Issues in Measuring and Modeling Poverty in: Economic Journal, Vol. 106, September 1996, pp. 1328-44. Ravallion, M., Chen, S., Sangraula, P.: (2007) New Evidence on the Urbanization of Global Poverty. in: Population and Development Review, vol 33. pp. 667-701. Reardon, T., Barrett, C.B., Berdegue, J.A., Swinnen, J.F.M.: (2009) Agrifood industry transformation and small farmers in developing countries. in: World Development, 2009, 37(11), 1717-1727 Reardon, T., Berdegué, J.A., Timmer, C. P., Cabot, T., Mainville, D., Flores, L., Hernendez, R., Neven, D., Balsevich, F.: Links among Supermarkets, Wholesalers, and Small Farmers in Developing Countries: Conceptualization and Emerging Evidence. Reardon, T., Henson, S., Berdegue, J.: (2007) Proactive fast-tracking’ diffusion of supermarkets in developing countries: implications for market institutions and trade. in: Journal of Economic Geography 7 (4) pp 399-431.

291
Roy, D., Thorat, A.: Success in High Value Horticultural Export Markets for the Small Farmers: The Case of Mahagrapes in India Special Section, The Volatility of Overseas Aid, pp. 2045-2102 Ruben, E. R., Slingerland, M., Nijhoff, H.: (2006) Agro-food chains and networks for development. Springer, p. 233 Reasserting the Co-operative movement. Published on the occasion of centennial celebration of indian co-operative movement. Ed. by Dr. V. B. Jugale and Dr. P. A Koli. Serials Publications, New Delhi, 2005. p. 281 Regoverning markets: a place for small-scale producers in modern agrifood chains? (2007) ed.by Vorley, W., Fearne, A., Ray D. Gower Sustainable Food Chains Series. p. 248 Réti, Mária: Szövetkezeti jog. (Cooperative law) Rejtjel Kiadó, Budapest, 2002. Rejtjel kiadó. p. 101 Role of cooperative entrepreneurship in the modern market environment: introduction and summary. Ed. by Samuli Skurnik and Vesa Vihriala. Ruben, E. R., Slingerland, M., Nijhoff, H.: (2006) Agro-food chains and networks for development. Springer, p. 233 IFAD: Rural Poverty Report 2011 http://www.ifad.org/rpr2011/ Schneiberg, M., King, M., Smith, T.: Social Movements and organizational form: cooperative alternatives to corporations in the American insurance, dairy, and grain industries. In: American Sociological Review, 2008. Aug. Salifu, A., Francesconi, G.N., Kolavalli, S.: (2010) A Review of Collective Action in Rural Ghana. www.ifpri.org

292
Sasvari, J.: (2005) Paprika: A Spicy Memoir from Hungary. CanWest Books, p. 280 Schneider, F., Buehn, A., Montenegro, C.: (2010) Shadow Economies All Over the World: New Estimates for 162 Countries from 1999 to 2007. World Bank Policy Research Working Paper No. 5356 . Schulze, B., Wocken, C., Spiller, A.: (2008) (Dis)loyalty in the German dairy industry: A supplier relationship management view. Empirical evidence and management implications. Department für Agrarökonomie und Rurale Entwicklung Univ. p. 44. Schwinnen, J.F.M., Demuth, R.H.: The dynamics of vertical coordination in agrifood chains in Eastern Europe and Central Asia: imlications for policy and World Bank operations. Working Paper 64089 http://documents.worldbank.org/curated/en/2011/01/15287604/dynamics-vertical-coordination agrifood-chains-eastern-europe-central-asia-implications-policy-world-bank-operations Scott, J.C.: (1976) The moral economy of the peasant: rebellion and subsistence in Southeast Asia. Yale University. Seres, A., Szabo M.: (2010a) Hogyan es kitol vasarolnak a kereskedelmi lancok? (How and Whom do Retail Chains Source From?). Kerteszet, 01/26/2010 Seres, A.: (2010b) A kisarutermelok es kereskedelmi lancok (Small Producers and Retail Chains). in: Kerteszet, 02/02/2010 SSH.A.: (1955) A Behavioral Model of Rational Choice. in: The Quarterly Journal of Economics, Vol. 69, No. 1. pp. 99-118. http://www.math.mcgill.ca/vetta/CS764.dir/bounded.pdf Skurnik, S., Vihriala, V.: (1999) Role of cooperative Entrepreneurship in the modern market environment: Introduction and Summary. Foreword 1999.

293
Social Economy and Social Entrepreeursip. European Commission. Social Europe. 2013. p. 112. Successful experiences in associative integration of family farm dairy producers: three case studies in Nicaragua, Ecuador an Paraguay. FAO Regional Office for Latin America and the Caribbean. http:www.rec.fao.org/en/about-fao/regional-priorities/family-farming/ baf/2013-03/good-practices/associative-integraion-of-family-farm-dairy-producers/ Svendsen, Gunnar Lind Haase, Gert Tinggaard Svendsen: The creation and destruction of social capital: entrepreneurship, co-operative movements and institutions. Cheltenham. Edward Elgar, 2004. Svendsen, G. Svendsen,T.: The creation and Destruction of Social Capital. Entrepreneurship, Co-operative Movements and Institutions (2004) Swinnen, J.F.M., Vandeplas, A.: (2009) Quality, Rich Consumers, and Small Farmers: Contracting and Rent Distribution in Food Value Chains. LICOS Centre for Institutions & Economic Performance & Department of Economics University of Leuven (KUL). Sykuta, M., Cook, M.L.: (2001) A New Institutional Economics Approach to Contracts and Cooperatives. Working Paper No. 2001-04. Contracting and Organizations Research Institute. University of Missouri - Columbia. Szabó, D., Juhász, A.: (2012) A piacok szerepe és lehetőségei a hazai élelmiszer- ellátási láncban. (The role and possibilities of the domestic food supply chain markets.) in: Gazdálkodás. Vol. 56. No. 3. pp. 217-229. Szabo, G. : (2011) Csaladi gazdasag es szovetkezes. (Family Farms and Cooperation). Szabó, G.: (2002) Gondolatok az agrárökonómia jelenéről és jövőjéről: Egy vita tanulságai. (Thoughts about the present and future of agricultural economics: lessons from a debate.) Gazdálkodás 2002. (46) 5 pp. 75-79

294
Szabó, G. Gábor: (2010) The importance and role of trust in agricultural marketing co-operatives. Studies in Agricultural Economics. Hungarian Academy of Sciences. 2010. (112) pp. 5-22 Szabó, G. Gábor: Interdisciplinary analysis of producers’ organizations in the agri-food sector with special emphasis on human factor considerations. 2008. (www.has.ie.hu) Szabo, G.: Support for Farmers' Cooperatives. Case Study Report. Performance and sustainability of new emerging cooperatives in Hungary. (2012) Szabó, G. Gábor: A szövetkezeti identitás – egy dinamikus megközelités a szövetkezetek fejlődésének gazdasági nézőpontú elemzésére. (The co-operative's identity - a dynamic approach to the economic point of view to analyze the development of cooperatives. )Transition in Agriculture – Agricultural Economics in Transition. 2004. in: Közgazdasági Szemle. 2005 January Szabó, G. Gábor: A szövetkezeti vertikális integráció fejlődése az élelmiszer-gazdaságban. (The development of cooperative vertical integration of the food economy.) in: Közgazdasági Szemle 2002 March Szabó, M.: (2012) Mi változott 10 év alatt? Friss zöldség és gyümölcs a hipermarketekben.( What has changed in 10 years? Fresh vegetables and fruits in hypermarkets) KOPINT-TÁRKI Konjunktúrakutató Intézet. Budapest 2012. in: Élelmiszer Magazin XX. évf. 2012. 3. szám Ton, Giel (2008): Challenges for smallholder market access: a review of literature on institutional arrangements in collective marketing. in: Stewart Postharvest Review , Vol. 5, No. 2008 (1. October 2008): pp. 1-6. Torok, T., Hanf, J.H.: (2009) Is Trust Necessary in Supply Chain Networks? First Impressions of Hungarian Examples. Leibniz Institute of Agricultural Development in Central and Eastern Europe.

295
Townsend, R.: (2008) Agriculture for Development: A Perspective from the 2008 World Development Report. Part of the report titled “Agriculture: The Fuel for Sustainable Economic Development”, issued in relation to the Proceedings of the 2008 AIARD Capitol Hill Forum. Trading up. Building Cooperation Between Farmers and Traders in Africa. IIRR Nairobi, Rozal Tropical Institutes, Amsterdam. 2008. 280 p. Transnational Corporations, Agricultural Production and Development. (2009) WIR (World Investment Report), United Nations Conference on Trade and Development. Tulder, Von R.: (2009) Chains for change. Rotterdam School of Management, Erasmus University. p. 85. Tvorsvik, G.I.: (2000) Social Capital and Economic Development Raionality and Society. Nov. 2000. vol 12(4) 451-476. Uj Magyarország TÉSZ forgóeszköz hitelprogram. (New Hungary POs working capital loan program.) Földhitel Bank. 2009. Uj Magyarország TÉSZ forgóeszköz hitelprogram. (New Hungary POs working capital loan program.) Magyar Fejlesztési Bank. 2009. Uj Magyarország TÉSZ forgóeszköz hitelprogram. (New Hungary POs working capital loan program.) Országos Takarékpénztár. 2009. Uj Magyarország TÉSZ forgóeszköz hitelprogram. (New Hungary POs working capital loan program.) UniCredit Bank. 2009. Valdez, S.: An Organizational Approach to Recent Protest Among Polish Farmers 2005 Vark, van C.: (2014) Making Supply Chains Work for Producers and Consumers. Global Development Professionals Network. The Guardian.
296
http://www.theguardian.com/global-development-professionals-network/2014/feb/21/making-supply-chains-work-for-producers-and-consumers/print Varughese, G., Ostrom, E.: (2001) The Contsted Role of Heterogeneity in Collective Action: Some Evidence from Community Forestry in Nepal. in: World Development. Vol. 29, No. 5, pp 747-765. Vattamany, A.: Egyre No a kozvetlen termeles Almeriaban (Direct Contracting Increasing in Almeria) in: Zoldseg es Gyumocs Piac. 2009 Vol. 11-12. pp. 7. Voice of the farmers. Measuring ECOM's BOP reach and farmer voice in Nicaragua. IFC, ECOM, 2012. p. 16. Vorley, B. et al.: (2012) Tipping the Balance: Policies to shape agriculture investments and markets in favour of small-scale farmers. Kindle Edition 2012. Wade R.H.: (2004) Is Globalization Reducing Poverty and Inequality? in: World Development, IDS Bulletin, vol. 35 (1) pp. 20-30. Wainaina, P.W., Okello, J.J., Nzuma, J.: (2012) Impact of Contract Farming on Smallholder Poultry Farmers Income in Kenya. Department of Agricultural Economics University of Nairobi, Kenya. 2012.p.30. http://ageconsearch.umn.edu/bitstream/126323/2/PRISCILLA~IAAE.pdf Wambugu, S.N. et al.: (2009) Effect of social capital on performance of smallholder producer organizations: the case of groundnut growers in Western Kenya. International Association of Agricultural Economist Conference, Beijing, China August 16-22. 2009 p. 23. http://ageconsearch.umn.edu/bitstream/51466/2/595.pdf Who will control the Green Economy? (2011) Etc Group Ottava, Ontario, Canada. Woods, M.: (2003) Deconstructing rural protest: the emergence of a new social movement. In: Journal of Rural Studies 19
297
World Development Report 2008. http://web.worldbank.org/WBSITE/EXTERNAL/EXTDEC/EXTRESEARCH/EXTWDRS/0,,contentMDK:23062293~pagePK:478093~piPK:477627~theSitePK:477624,00.html World Investment Report 2009 - Transnational Corporations, Agricultural Production and Development (UNCTAD/WIR/2009). 17 Sep 2009, 312 page(s), 6530.0 ... World Investment Report 2013 - Global Value Chains - IMF. UNCTAD 2013. www.imf.org/external/pubs/ft/bop/2013/13-25.pdf Young, C., Sherman, N.P., Rose, T.: (1981) Cooperatives & Development: Agricultural Politics in Ghana and Uganda University of Wisconsin Press, 1981. A zöldség-gyümölcs ágazatban működő termelői csoportokra vonatkozó speciális szabályok. (2007) (Special rules for producer groups in the fruit and vegetable sector.) Földművelési és Vidékfejlesztési Minisztérium. A zöldség-gyümölcs termelői csoportok és termelői szervezetek nemzeti szabályozásáról. 19/2008. FVM rendelet. (National regulation of fruit and vegetable producer groups and producer organizations. 19/2008. FVM.) A zöldség-gyümölcs termelői szervezetek kiegészítő nemzeti támogatásáról. 69/2009. FVM rendelet. (Additional support for the national fruit and vegetable producer organizations. 69/2009. FVM.) Zurcher, L., Snow, D. : (1981) Collective Behaviour. Social Movements. In: Social Pcychology: Sociological Perspectives. ed by M. Rosenberg and R.H. Turner. Basic Book, New York. 168 Ora (June 3, 2010): Jordan Paprika Morakert Cimke Alatt (Jordanian Peppers Under Morakert Label)

298
Biography
Eva Szalkai Csaky was born in Budapest, Hungary on September 4, 1971. She
obtained her BS in Finance and Accounting with specialization on financial
intermediaries from the Budapest Business School (1993). She subsequently obtained
her MS in Finance from George Washington University in Washington D.C. (1995) and
MA in Public Policy from Duke University (2009). Since joining the World Bank Group
in 1996, Eva has been responsible for various investment areas and related financial
innovations covering over two dozen countries around the world, working in the areas
of energy efficiency, renewable energy, energy and clean water access and farmer and
small enterprise productivity and sustainability. Eva is currently responsible for the
areas of sustainable value chains and social entrepreneurship and is leading several
efforts with the aim of reaching smallholder farmers. Eva had a scholarship from the
Hungarian state for outstanding academic performance as well as a corporate
scholarship. IFC has received several awards for her work in international
development, the latest one being IFC’s innovation award for “Enhancing the
Productivity, Efficiency and Profitability of Dairy Farmers through Innovative Cooling
Technologies”. She has also been part of IFC’s Corporate Leadership Program and
Financial Markets Women Leadership Group. Eva has also served on several committees
and roundtables, and spoken at numerous conferences and events. In the summer of

299
2014 Eva joined Southern Methodist University as the Research Professor and Director
of the Hunt Institute for Engineering & Humanity.