Identification of Scatter Sources and Significant Reduction of Scatter Occurrence with DIFFCRASH
Upload
sergio-sacaniCategory
view
498download
1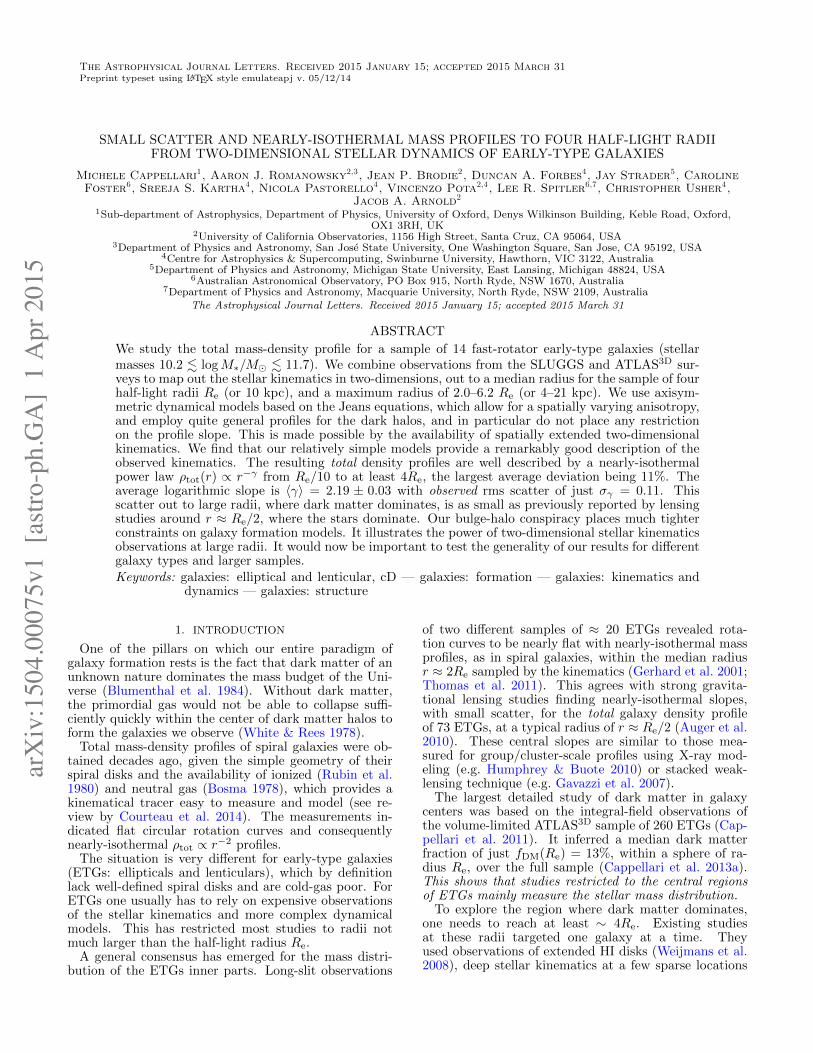
The Astrophysical Journal Letters. Received 2015 January 15; accepted 2015 March 31
Preprint typeset using LATEX style emulateapj v. 05/12/14
SMALL SCATTER AND NEARLY-ISOTHERMAL MASS PROFILES TO FOUR HALF-LIGHT RADIIFROM TWO-DIMENSIONAL STELLAR DYNAMICS OF EARLY-TYPE GALAXIES
Michele Cappellari
1
, Aaron J. Romanowsky
2,3
, Jean P. Brodie
2
, Duncan A. Forbes
4
, Jay Strader
5
, Caroline
Foster
6
, Sreeja S. Kartha
4
, Nicola Pastorello
4
, Vincenzo Pota
2,4
, Lee R. Spitler
6,7
, Christopher Usher
4
,
Jacob A. Arnold
2
1Sub-department of Astrophysics, Department of Physics, University of Oxford, Denys Wilkinson Building, Keble Road, Oxford,OX1 3RH, UK
2University of California Observatories, 1156 High Street, Santa Cruz, CA 95064, USA3Department of Physics and Astronomy, San Jose State University, One Washington Square, San Jose, CA 95192, USA
4Centre for Astrophysics & Supercomputing, Swinburne University, Hawthorn, VIC 3122, Australia5Department of Physics and Astronomy, Michigan State University, East Lansing, Michigan 48824, USA
6Australian Astronomical Observatory, PO Box 915, North Ryde, NSW 1670, Australia7Department of Physics and Astronomy, Macquarie University, North Ryde, NSW 2109, Australia
The Astrophysical Journal Letters. Received 2015 January 15; accepted 2015 March 31
ABSTRACT
We study the total mass-density profile for a sample of 14 fast-rotator early-type galaxies (stellarmasses 10.2 . logM⇤/M� . 11.7). We combine observations from the SLUGGS and ATLAS3D sur-veys to map out the stellar kinematics in two-dimensions, out to a median radius for the sample of fourhalf-light radii Re (or 10 kpc), and a maximum radius of 2.0–6.2 Re (or 4–21 kpc). We use axisym-metric dynamical models based on the Jeans equations, which allow for a spatially varying anisotropy,and employ quite general profiles for the dark halos, and in particular do not place any restrictionon the profile slope. This is made possible by the availability of spatially extended two-dimensionalkinematics. We find that our relatively simple models provide a remarkably good description of theobserved kinematics. The resulting total density profiles are well described by a nearly-isothermalpower law ⇢tot(r) / r
�� from Re/10 to at least 4Re, the largest average deviation being 11%. Theaverage logarithmic slope is h�i = 2.19 ± 0.03 with observed rms scatter of just �� = 0.11. Thisscatter out to large radii, where dark matter dominates, is as small as previously reported by lensingstudies around r ⇡ Re/2, where the stars dominate. Our bulge-halo conspiracy places much tighterconstraints on galaxy formation models. It illustrates the power of two-dimensional stellar kinematicsobservations at large radii. It would now be important to test the generality of our results for di↵erentgalaxy types and larger samples.Keywords: galaxies: elliptical and lenticular, cD — galaxies: formation — galaxies: kinematics and
dynamics — galaxies: structure
1. INTRODUCTION
One of the pillars on which our entire paradigm ofgalaxy formation rests is the fact that dark matter of anunknown nature dominates the mass budget of the Uni-verse (Blumenthal et al. 1984). Without dark matter,the primordial gas would not be able to collapse su�-ciently quickly within the center of dark matter halos toform the galaxies we observe (White & Rees 1978).Total mass-density profiles of spiral galaxies were ob-
tained decades ago, given the simple geometry of theirspiral disks and the availability of ionized (Rubin et al.1980) and neutral gas (Bosma 1978), which provides akinematical tracer easy to measure and model (see re-view by Courteau et al. 2014). The measurements in-dicated flat circular rotation curves and consequentlynearly-isothermal ⇢tot / r
�2 profiles.The situation is very di↵erent for early-type galaxies
(ETGs: ellipticals and lenticulars), which by definitionlack well-defined spiral disks and are cold-gas poor. ForETGs one usually has to rely on expensive observationsof the stellar kinematics and more complex dynamicalmodels. This has restricted most studies to radii notmuch larger than the half-light radius Re.A general consensus has emerged for the mass distri-
bution of the ETGs inner parts. Long-slit observations
of two di↵erent samples of ⇡ 20 ETGs revealed rota-tion curves to be nearly flat with nearly-isothermal massprofiles, as in spiral galaxies, within the median radiusr ⇡ 2Re sampled by the kinematics (Gerhard et al. 2001;Thomas et al. 2011). This agrees with strong gravita-tional lensing studies finding nearly-isothermal slopes,with small scatter, for the total galaxy density profileof 73 ETGs, at a typical radius of r ⇡ Re/2 (Auger et al.2010). These central slopes are similar to those mea-sured for group/cluster-scale profiles using X-ray mod-eling (e.g. Humphrey & Buote 2010) or stacked weak-lensing technique (e.g. Gavazzi et al. 2007).The largest detailed study of dark matter in galaxy
centers was based on the integral-field observations ofthe volume-limited ATLAS3D sample of 260 ETGs (Cap-pellari et al. 2011). It inferred a median dark matterfraction of just fDM(Re) = 13%, within a sphere of ra-dius Re, over the full sample (Cappellari et al. 2013a).This shows that studies restricted to the central regions
of ETGs mainly measure the stellar mass distribution.
To explore the region where dark matter dominates,one needs to reach at least ⇠ 4Re. Existing studiesat these radii targeted one galaxy at a time. Theyused observations of extended HI disks (Weijmans et al.2008), deep stellar kinematics at a few sparse locations
arX
iv:1
504.
0007
5v1
[astr
o-ph
.GA
] 1
Apr
201
5
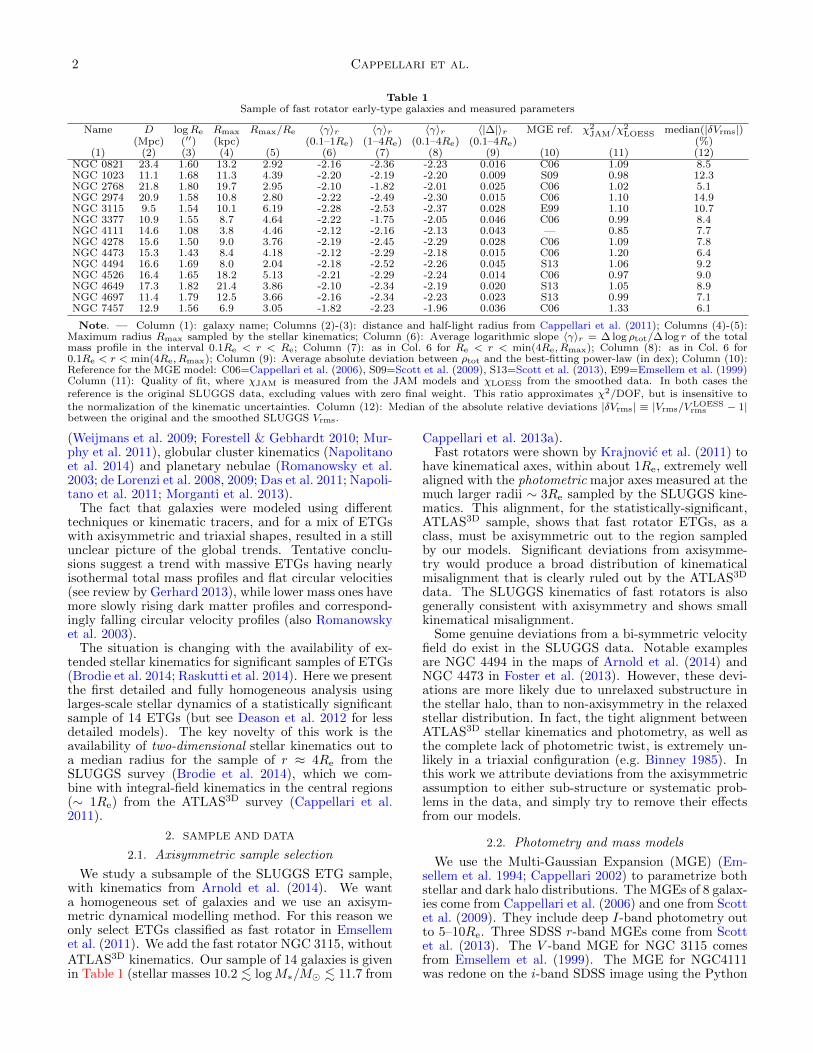
2 Cappellari et al.
Table 1
Sample of fast rotator early-type galaxies and measured parameters
Name D logRe Rmax Rmax/Re h�ir h�ir h�ir h|�|ir MGE ref. �2JAM/�2
LOESS median(|�Vrms|)(Mpc) (00) (kpc) (0.1–1Re) (1–4Re) (0.1–4Re) (0.1–4Re) (%)
(1) (2) (3) (4) (5) (6) (7) (8) (9) (10) (11) (12)NGC 0821 23.4 1.60 13.2 2.92 -2.16 -2.36 -2.23 0.016 C06 1.09 8.5NGC 1023 11.1 1.68 11.3 4.39 -2.20 -2.19 -2.20 0.009 S09 0.98 12.3NGC 2768 21.8 1.80 19.7 2.95 -2.10 -1.82 -2.01 0.025 C06 1.02 5.1NGC 2974 20.9 1.58 10.8 2.80 -2.22 -2.49 -2.30 0.015 C06 1.10 14.9NGC 3115 9.5 1.54 10.1 6.19 -2.28 -2.53 -2.37 0.028 E99 1.10 10.7NGC 3377 10.9 1.55 8.7 4.64 -2.22 -1.75 -2.05 0.046 C06 0.99 8.4NGC 4111 14.6 1.08 3.8 4.46 -2.12 -2.16 -2.13 0.043 — 0.85 7.7NGC 4278 15.6 1.50 9.0 3.76 -2.19 -2.45 -2.29 0.028 C06 1.09 7.8NGC 4473 15.3 1.43 8.4 4.18 -2.12 -2.29 -2.18 0.015 C06 1.20 6.4NGC 4494 16.6 1.69 8.0 2.04 -2.18 -2.52 -2.26 0.045 S13 1.06 9.2NGC 4526 16.4 1.65 18.2 5.13 -2.21 -2.29 -2.24 0.014 C06 0.97 9.0NGC 4649 17.3 1.82 21.4 3.86 -2.10 -2.34 -2.19 0.020 S13 1.05 8.9NGC 4697 11.4 1.79 12.5 3.66 -2.16 -2.34 -2.23 0.023 S13 0.99 7.1NGC 7457 12.9 1.56 6.9 3.05 -1.82 -2.23 -1.96 0.036 C06 1.33 6.1
Note. — Column (1): galaxy name; Columns (2)-(3): distance and half-light radius from Cappellari et al. (2011); Columns (4)-(5):Maximum radius Rmax sampled by the stellar kinematics; Column (6): Average logarithmic slope h�ir = � log ⇢tot/� log r of the totalmass profile in the interval 0.1Re < r < Re; Column (7): as in Col. 6 for Re < r < min(4Re, Rmax); Column (8): as in Col. 6 for0.1Re < r < min(4Re, Rmax); Column (9): Average absolute deviation between ⇢tot and the best-fitting power-law (in dex); Column (10):Reference for the MGE model: C06=Cappellari et al. (2006), S09=Scott et al. (2009), S13=Scott et al. (2013), E99=Emsellem et al. (1999)Column (11): Quality of fit, where �JAM is measured from the JAM models and �LOESS from the smoothed data. In both cases thereference is the original SLUGGS data, excluding values with zero final weight. This ratio approximates �2/DOF, but is insensitive tothe normalization of the kinematic uncertainties. Column (12): Median of the absolute relative deviations |�Vrms| ⌘ |Vrms/V LOESS
rms � 1|between the original and the smoothed SLUGGS Vrms.
(Weijmans et al. 2009; Forestell & Gebhardt 2010; Mur-phy et al. 2011), globular cluster kinematics (Napolitanoet al. 2014) and planetary nebulae (Romanowsky et al.2003; de Lorenzi et al. 2008, 2009; Das et al. 2011; Napoli-tano et al. 2011; Morganti et al. 2013).The fact that galaxies were modeled using di↵erent
techniques or kinematic tracers, and for a mix of ETGswith axisymmetric and triaxial shapes, resulted in a stillunclear picture of the global trends. Tentative conclu-sions suggest a trend with massive ETGs having nearlyisothermal total mass profiles and flat circular velocities(see review by Gerhard 2013), while lower mass ones havemore slowly rising dark matter profiles and correspond-ingly falling circular velocity profiles (also Romanowskyet al. 2003).The situation is changing with the availability of ex-
tended stellar kinematics for significant samples of ETGs(Brodie et al. 2014; Raskutti et al. 2014). Here we presentthe first detailed and fully homogeneous analysis usinglarges-scale stellar dynamics of a statistically significantsample of 14 ETGs (but see Deason et al. 2012 for lessdetailed models). The key novelty of this work is theavailability of two-dimensional stellar kinematics out toa median radius for the sample of r ⇡ 4Re from theSLUGGS survey (Brodie et al. 2014), which we com-bine with integral-field kinematics in the central regions(⇠ 1Re) from the ATLAS3D survey (Cappellari et al.2011).
2. SAMPLE AND DATA
2.1. Axisymmetric sample selection
We study a subsample of the SLUGGS ETG sample,with kinematics from Arnold et al. (2014). We wanta homogeneous set of galaxies and we use an axisym-metric dynamical modelling method. For this reason weonly select ETGs classified as fast rotator in Emsellemet al. (2011). We add the fast rotator NGC 3115, withoutATLAS3D kinematics. Our sample of 14 galaxies is givenin Table 1 (stellar masses 10.2 . logM⇤/M� . 11.7 from
Cappellari et al. 2013a).Fast rotators were shown by Krajnovic et al. (2011) to
have kinematical axes, within about 1Re, extremely wellaligned with the photometric major axes measured at themuch larger radii ⇠ 3Re sampled by the SLUGGS kine-matics. This alignment, for the statistically-significant,ATLAS3D sample, shows that fast rotator ETGs, as aclass, must be axisymmetric out to the region sampledby our models. Significant deviations from axisymme-try would produce a broad distribution of kinematicalmisalignment that is clearly ruled out by the ATLAS3D
data. The SLUGGS kinematics of fast rotators is alsogenerally consistent with axisymmetry and shows smallkinematical misalignment.Some genuine deviations from a bi-symmetric velocity
field do exist in the SLUGGS data. Notable examplesare NGC 4494 in the maps of Arnold et al. (2014) andNGC 4473 in Foster et al. (2013). However, these devi-ations are more likely due to unrelaxed substructure inthe stellar halo, than to non-axisymmetry in the relaxedstellar distribution. In fact, the tight alignment betweenATLAS3D stellar kinematics and photometry, as well asthe complete lack of photometric twist, is extremely un-likely in a triaxial configuration (e.g. Binney 1985). Inthis work we attribute deviations from the axisymmetricassumption to either sub-structure or systematic prob-lems in the data, and simply try to remove their e↵ectsfrom our models.
2.2. Photometry and mass models
We use the Multi-Gaussian Expansion (MGE) (Em-sellem et al. 1994; Cappellari 2002) to parametrize bothstellar and dark halo distributions. The MGEs of 8 galax-ies come from Cappellari et al. (2006) and one from Scottet al. (2009). They include deep I-band photometry outto 5–10Re. Three SDSS r-band MGEs come from Scottet al. (2013). The V -band MGE for NGC 3115 comesfrom Emsellem et al. (1999). The MGE for NGC4111was redone on the i-band SDSS image using the Python
Nearly-isothermal mass profiles to 4Re in ETGs 3
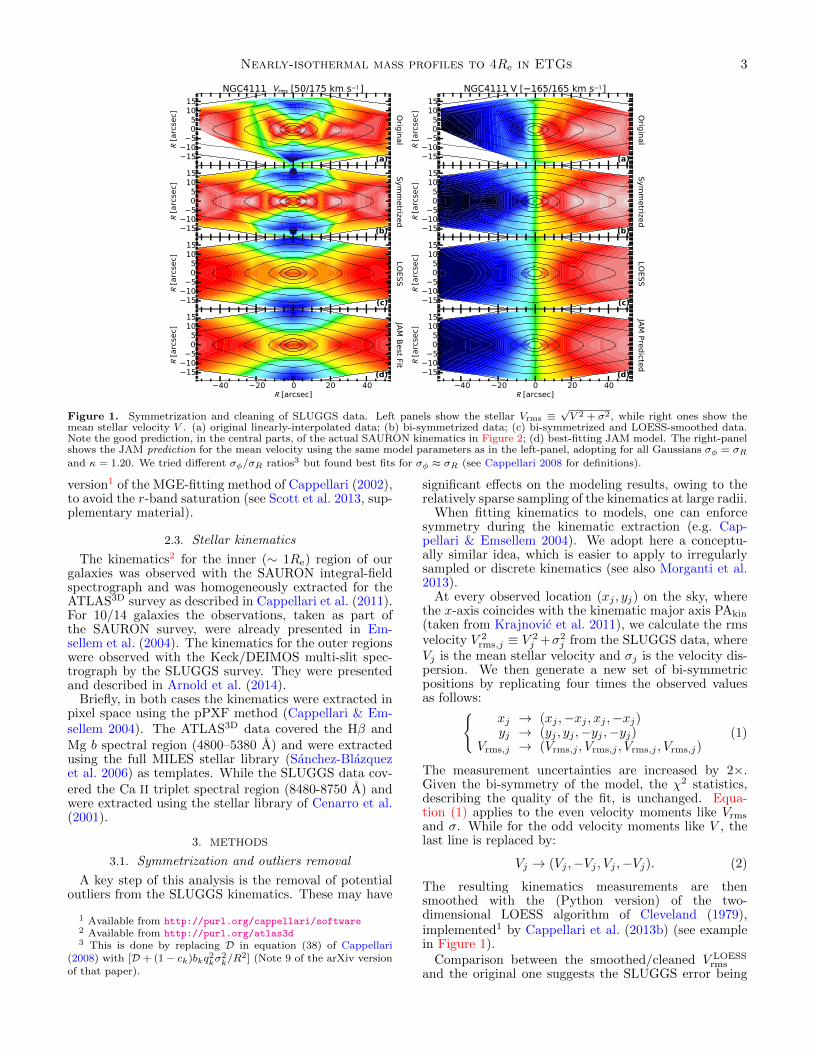
Figure 1. Symmetrization and cleaning of SLUGGS data. Left panels show the stellar Vrms ⌘pV 2 + �2, while right ones show the
mean stellar velocity V . (a) original linearly-interpolated data; (b) bi-symmetrized data; (c) bi-symmetrized and LOESS-smoothed data.Note the good prediction, in the central parts, of the actual SAURON kinematics in Figure 2; (d) best-fitting JAM model. The right-panelshows the JAM prediction for the mean velocity using the same model parameters as in the left-panel, adopting for all Gaussians �� = �R
and = 1.20. We tried di↵erent ��/�R ratios3 but found best fits for �� ⇡ �R (see Cappellari 2008 for definitions).
version1 of the MGE-fitting method of Cappellari (2002),to avoid the r-band saturation (see Scott et al. 2013, sup-plementary material).
2.3. Stellar kinematics
The kinematics2 for the inner (⇠ 1Re) region of ourgalaxies was observed with the SAURON integral-fieldspectrograph and was homogeneously extracted for theATLAS3D survey as described in Cappellari et al. (2011).For 10/14 galaxies the observations, taken as part ofthe SAURON survey, were already presented in Em-sellem et al. (2004). The kinematics for the outer regionswere observed with the Keck/DEIMOS multi-slit spec-trograph by the SLUGGS survey. They were presentedand described in Arnold et al. (2014).Briefly, in both cases the kinematics were extracted in
pixel space using the pPXF method (Cappellari & Em-sellem 2004). The ATLAS3D data covered the H� andMg b spectral region (4800–5380 A) and were extractedusing the full MILES stellar library (Sanchez-Blazquezet al. 2006) as templates. While the SLUGGS data cov-ered the Ca II triplet spectral region (8480-8750 A) andwere extracted using the stellar library of Cenarro et al.(2001).
3. METHODS
3.1. Symmetrization and outliers removal
A key step of this analysis is the removal of potentialoutliers from the SLUGGS kinematics. These may have
1 Available from http://purl.org/cappellari/software
2 Available from http://purl.org/atlas3d
3 This is done by replacing D in equation (38) of Cappellari(2008) with [D + (1� ck)bkq2k�
2k/R
2] (Note 9 of the arXiv versionof that paper).
significant e↵ects on the modeling results, owing to therelatively sparse sampling of the kinematics at large radii.When fitting kinematics to models, one can enforce
symmetry during the kinematic extraction (e.g. Cap-pellari & Emsellem 2004). We adopt here a conceptu-ally similar idea, which is easier to apply to irregularlysampled or discrete kinematics (see also Morganti et al.2013).At every observed location (xj , yj) on the sky, where
the x-axis coincides with the kinematic major axis PAkin
(taken from Krajnovic et al. 2011), we calculate the rmsvelocity V
2rms,j ⌘ V
2j +�
2j from the SLUGGS data, where
Vj is the mean stellar velocity and �j is the velocity dis-persion. We then generate a new set of bi-symmetricpositions by replicating four times the observed valuesas follows:
(xj ! (xj ,�xj , xj ,�xj)yj ! (yj , yj ,�yj ,�yj)
Vrms,j ! (Vrms,j , Vrms,j , Vrms,j , Vrms,j)(1)
The measurement uncertainties are increased by 2⇥.Given the bi-symmetry of the model, the �
2 statistics,describing the quality of the fit, is unchanged. Equa-tion (1) applies to the even velocity moments like Vrms
and �. While for the odd velocity moments like V , thelast line is replaced by:
Vj ! (Vj ,�Vj , Vj ,�Vj). (2)
The resulting kinematics measurements are thensmoothed with the (Python version) of the two-dimensional LOESS algorithm of Cleveland (1979),implemented1 by Cappellari et al. (2013b) (see examplein Figure 1).Comparison between the smoothed/cleaned V
LOESSrms
and the original one suggests the SLUGGS error being
4 Cappellari et al.
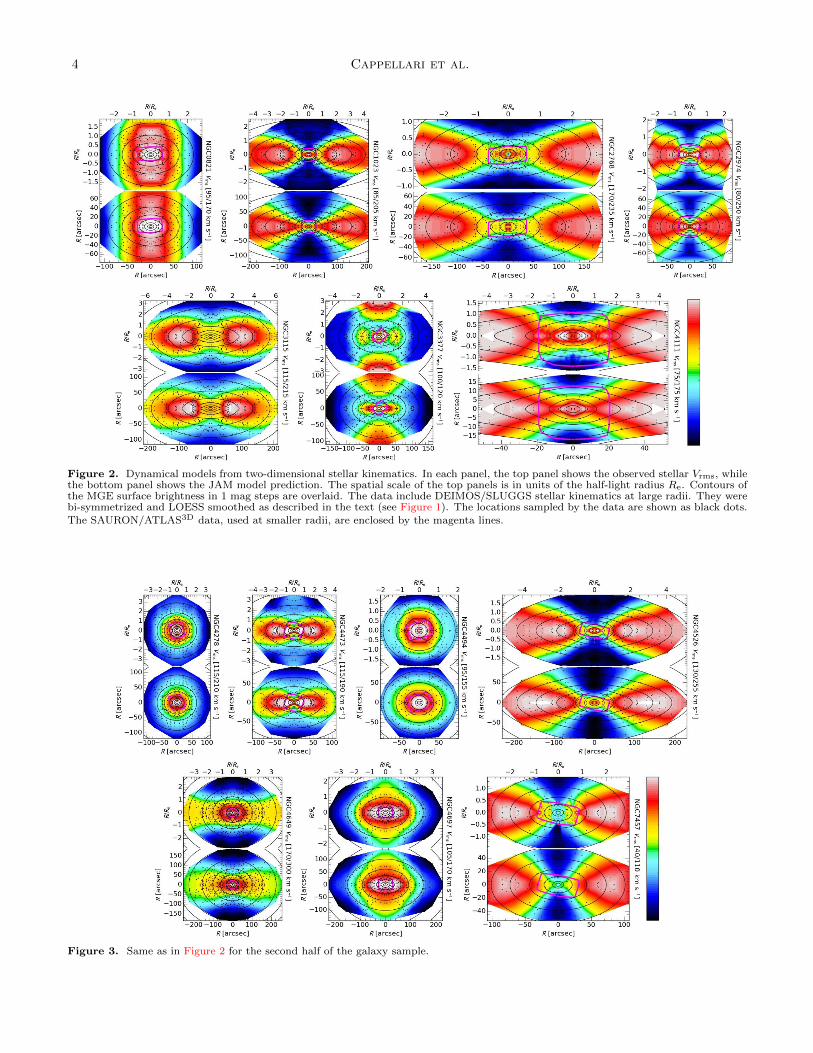
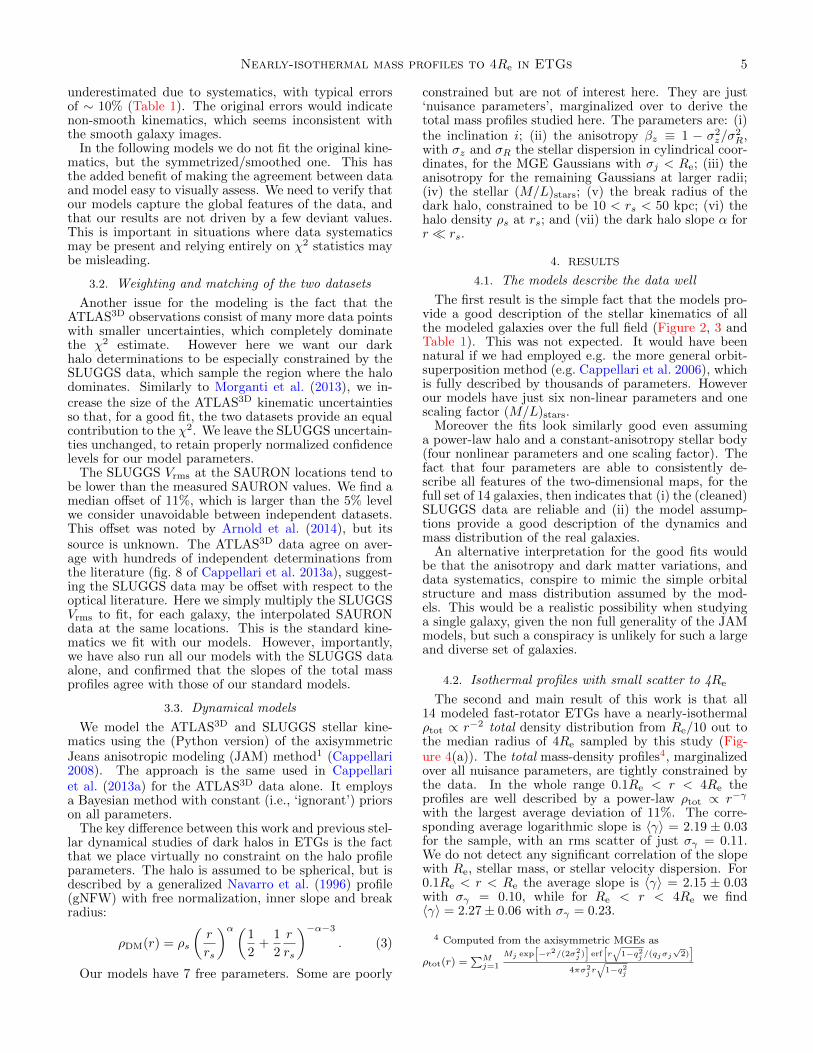
Figure 2. Dynamical models from two-dimensional stellar kinematics. In each panel, the top panel shows the observed stellar Vrms, whilethe bottom panel shows the JAM model prediction. The spatial scale of the top panels is in units of the half-light radius Re. Contours ofthe MGE surface brightness in 1 mag steps are overlaid. The data include DEIMOS/SLUGGS stellar kinematics at large radii. They werebi-symmetrized and LOESS smoothed as described in the text (see Figure 1). The locations sampled by the data are shown as black dots.The SAURON/ATLAS3D data, used at smaller radii, are enclosed by the magenta lines.
Figure 3. Same as in Figure 2 for the second half of the galaxy sample.
Nearly-isothermal mass profiles to 4Re in ETGs 5
underestimated due to systematics, with typical errorsof ⇠ 10% (Table 1). The original errors would indicatenon-smooth kinematics, which seems inconsistent withthe smooth galaxy images.In the following models we do not fit the original kine-
matics, but the symmetrized/smoothed one. This hasthe added benefit of making the agreement between dataand model easy to visually assess. We need to verify thatour models capture the global features of the data, andthat our results are not driven by a few deviant values.This is important in situations where data systematicsmay be present and relying entirely on �
2 statistics maybe misleading.
3.2. Weighting and matching of the two datasets
Another issue for the modeling is the fact that theATLAS3D observations consist of many more data pointswith smaller uncertainties, which completely dominatethe �
2 estimate. However here we want our darkhalo determinations to be especially constrained by theSLUGGS data, which sample the region where the halodominates. Similarly to Morganti et al. (2013), we in-crease the size of the ATLAS3D kinematic uncertaintiesso that, for a good fit, the two datasets provide an equalcontribution to the �2. We leave the SLUGGS uncertain-ties unchanged, to retain properly normalized confidencelevels for our model parameters.The SLUGGS Vrms at the SAURON locations tend to
be lower than the measured SAURON values. We find amedian o↵set of 11%, which is larger than the 5% levelwe consider unavoidable between independent datasets.This o↵set was noted by Arnold et al. (2014), but itssource is unknown. The ATLAS3D data agree on aver-age with hundreds of independent determinations fromthe literature (fig. 8 of Cappellari et al. 2013a), suggest-ing the SLUGGS data may be o↵set with respect to theoptical literature. Here we simply multiply the SLUGGSVrms to fit, for each galaxy, the interpolated SAURONdata at the same locations. This is the standard kine-matics we fit with our models. However, importantly,we have also run all our models with the SLUGGS dataalone, and confirmed that the slopes of the total massprofiles agree with those of our standard models.
3.3. Dynamical models
We model the ATLAS3D and SLUGGS stellar kine-matics using the (Python version) of the axisymmetricJeans anisotropic modeling (JAM) method1 (Cappellari2008). The approach is the same used in Cappellariet al. (2013a) for the ATLAS3D data alone. It employsa Bayesian method with constant (i.e., ‘ignorant’) priorson all parameters.The key di↵erence between this work and previous stel-
lar dynamical studies of dark halos in ETGs is the factthat we place virtually no constraint on the halo profileparameters. The halo is assumed to be spherical, but isdescribed by a generalized Navarro et al. (1996) profile(gNFW) with free normalization, inner slope and breakradius:
⇢DM(r) = ⇢s
✓r
rs
◆↵ ✓1
2+
1
2
r
rs
◆�↵�3
. (3)
Our models have 7 free parameters. Some are poorly
constrained but are not of interest here. They are just‘nuisance parameters’, marginalized over to derive thetotal mass profiles studied here. The parameters are: (i)the inclination i; (ii) the anisotropy �z ⌘ 1 � �
2z/�
2R,
with �z and �R the stellar dispersion in cylindrical coor-dinates, for the MGE Gaussians with �j < Re; (iii) theanisotropy for the remaining Gaussians at larger radii;(iv) the stellar (M/L)stars; (v) the break radius of thedark halo, constrained to be 10 < rs < 50 kpc; (vi) thehalo density ⇢s at rs; and (vii) the dark halo slope ↵ forr ⌧ rs.
4. RESULTS
4.1. The models describe the data well
The first result is the simple fact that the models pro-vide a good description of the stellar kinematics of allthe modeled galaxies over the full field (Figure 2, 3 andTable 1). This was not expected. It would have beennatural if we had employed e.g. the more general orbit-superposition method (e.g. Cappellari et al. 2006), whichis fully described by thousands of parameters. Howeverour models have just six non-linear parameters and onescaling factor (M/L)stars.Moreover the fits look similarly good even assuming
a power-law halo and a constant-anisotropy stellar body(four nonlinear parameters and one scaling factor). Thefact that four parameters are able to consistently de-scribe all features of the two-dimensional maps, for thefull set of 14 galaxies, then indicates that (i) the (cleaned)SLUGGS data are reliable and (ii) the model assump-tions provide a good description of the dynamics andmass distribution of the real galaxies.An alternative interpretation for the good fits would
be that the anisotropy and dark matter variations, anddata systematics, conspire to mimic the simple orbitalstructure and mass distribution assumed by the mod-els. This would be a realistic possibility when studyinga single galaxy, given the non full generality of the JAMmodels, but such a conspiracy is unlikely for such a largeand diverse set of galaxies.
4.2. Isothermal profiles with small scatter to 4Re
The second and main result of this work is that all14 modeled fast-rotator ETGs have a nearly-isothermal⇢tot / r
�2total density distribution from Re/10 out to
the median radius of 4Re sampled by this study (Fig-ure 4(a)). The total mass-density profiles4, marginalizedover all nuisance parameters, are tightly constrained bythe data. In the whole range 0.1Re < r < 4Re theprofiles are well described by a power-law ⇢tot / r
��
with the largest average deviation of 11%. The corre-sponding average logarithmic slope is h�i = 2.19 ± 0.03for the sample, with an rms scatter of just �� = 0.11.We do not detect any significant correlation of the slopewith Re, stellar mass, or stellar velocity dispersion. For0.1Re < r < Re the average slope is h�i = 2.15 ± 0.03with �� = 0.10, while for Re < r < 4Re we findh�i = 2.27± 0.06 with �� = 0.23.
4 Computed from the axisymmetric MGEs as
⇢tot(r) =PM
j=1
Mj exph�r2/(2�2
j )ierf
hrq
1�q2j /(qj�jp2)
i
4⇡�2j r
q1�q2j
6 Cappellari et al.
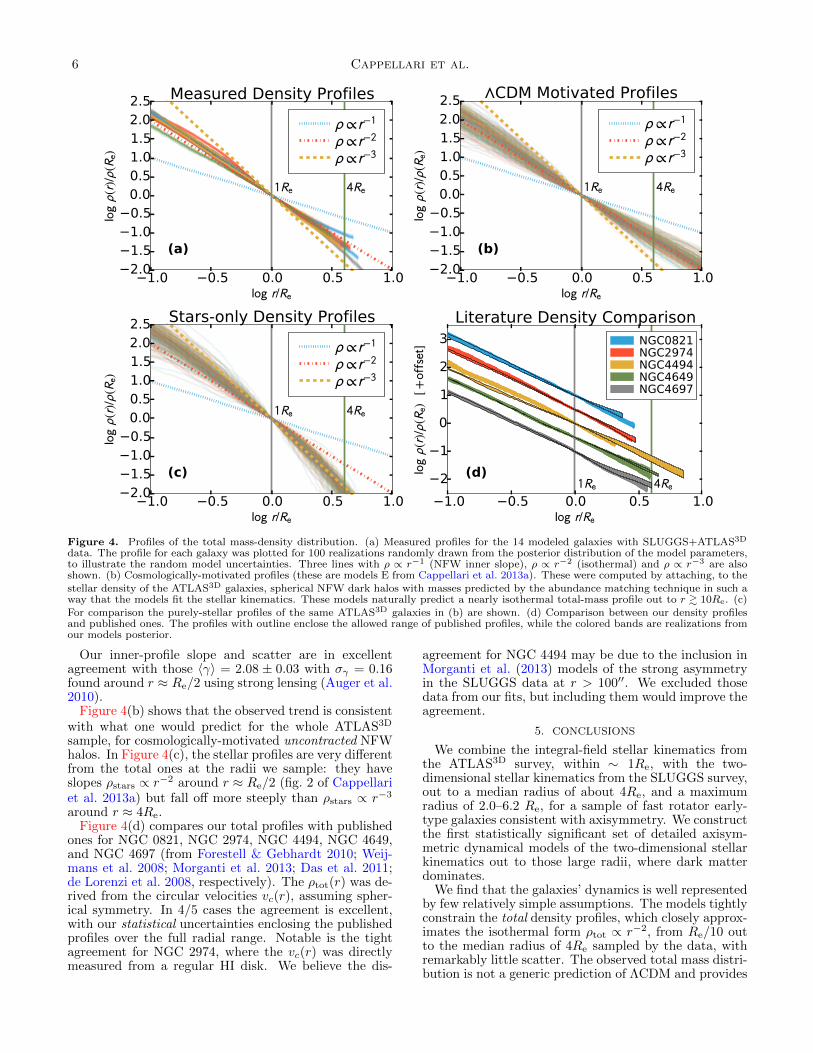
Figure 4. Profiles of the total mass-density distribution. (a) Measured profiles for the 14 modeled galaxies with SLUGGS+ATLAS3D
data. The profile for each galaxy was plotted for 100 realizations randomly drawn from the posterior distribution of the model parameters,to illustrate the random model uncertainties. Three lines with ⇢ / r�1 (NFW inner slope), ⇢ / r�2 (isothermal) and ⇢ / r�3 are alsoshown. (b) Cosmologically-motivated profiles (these are models E from Cappellari et al. 2013a). These were computed by attaching, to thestellar density of the ATLAS3D galaxies, spherical NFW dark halos with masses predicted by the abundance matching technique in such away that the models fit the stellar kinematics. These models naturally predict a nearly isothermal total-mass profile out to r & 10Re. (c)For comparison the purely-stellar profiles of the same ATLAS3D galaxies in (b) are shown. (d) Comparison between our density profilesand published ones. The profiles with outline enclose the allowed range of published profiles, while the colored bands are realizations fromour models posterior.
Our inner-profile slope and scatter are in excellentagreement with those h�i = 2.08 ± 0.03 with �� = 0.16found around r ⇡ Re/2 using strong lensing (Auger et al.2010).Figure 4(b) shows that the observed trend is consistent
with what one would predict for the whole ATLAS3D
sample, for cosmologically-motivated uncontracted NFWhalos. In Figure 4(c), the stellar profiles are very di↵erentfrom the total ones at the radii we sample: they haveslopes ⇢stars / r
�2 around r ⇡ Re/2 (fig. 2 of Cappellariet al. 2013a) but fall o↵ more steeply than ⇢stars / r
�3
around r ⇡ 4Re.Figure 4(d) compares our total profiles with published
ones for NGC 0821, NGC 2974, NGC 4494, NGC 4649,and NGC 4697 (from Forestell & Gebhardt 2010; Weij-mans et al. 2008; Morganti et al. 2013; Das et al. 2011;de Lorenzi et al. 2008, respectively). The ⇢tot(r) was de-rived from the circular velocities vc(r), assuming spher-ical symmetry. In 4/5 cases the agreement is excellent,with our statistical uncertainties enclosing the publishedprofiles over the full radial range. Notable is the tightagreement for NGC 2974, where the vc(r) was directlymeasured from a regular HI disk. We believe the dis-
agreement for NGC 4494 may be due to the inclusion inMorganti et al. (2013) models of the strong asymmetryin the SLUGGS data at r > 10000. We excluded thosedata from our fits, but including them would improve theagreement.
5. CONCLUSIONS
We combine the integral-field stellar kinematics fromthe ATLAS3D survey, within ⇠ 1Re, with the two-dimensional stellar kinematics from the SLUGGS survey,out to a median radius of about 4Re, and a maximumradius of 2.0–6.2 Re, for a sample of fast rotator early-type galaxies consistent with axisymmetry. We constructthe first statistically significant set of detailed axisym-metric dynamical models of the two-dimensional stellarkinematics out to those large radii, where dark matterdominates.We find that the galaxies’ dynamics is well represented
by few relatively simple assumptions. The models tightlyconstrain the total density profiles, which closely approx-imates the isothermal form ⇢tot / r
�2, from Re/10 outto the median radius of 4Re sampled by the data, withremarkably little scatter. The observed total mass distri-bution is not a generic prediction of ⇤CDM and provides
Nearly-isothermal mass profiles to 4Re in ETGs 7
constraints on the models (e.g. Remus et al. 2013; Dutton& Treu 2014).Our sample highlights the importance of similar stud-
ies on larger samples of galaxies, to provide a muchneeded benchmark for galaxy formation models. For this,studies like the present one, using DEIMOS on Keck orMUSE on the VLT, can be complemented with mod-els of shallower data, but for much larger samples likeMaNGA (Bundy et al. 2015). To be most useful, sam-ples need to include both spiral and early-type galaxies.These should be modeled in a fully homogeneous way bydescribing the kinematics of both the stars and the gaswithin the same gravitational potential. Large radio sur-veys of the neutral HI gas like Apertif (Verheijen et al.2008) can complement MaNGA at the largest radii. Thefuture availability of large kinematic datasets indicates abright future for the systematic investigation of the massprofiles in galaxies.
MC acknowledges support from a Royal Society Uni-versity Research Fellowship. Supported by NationalScience Foundation grants AST-0909237 and AST-1211995. DAF thanks the ARC for financial supportvia DP130100388.
REFERENCES
Arnold, J. A., Romanowsky, A. J., Brodie, J. P., et al. 2014, ApJ,791, 80
Auger, M. W., Treu, T., Bolton, A. S., et al. 2010, ApJ, 724, 511Binney, J. 1985, MNRAS, 212, 767Blumenthal, G. R., Faber, S. M., Primack, J. R., & Rees, M. J.
1984, Nature, 311, 517Bosma, A. 1978, PhD thesis, Groningen Univ.Brodie, J. P., Romanowsky, A. J., Strader, J., et al. 2014, ApJ,
796, 52Bundy, K., Bershady, M. A., Law, D. R., et al. 2015, ApJ, 798, 7Cappellari, M. 2002, MNRAS, 333, 400Cappellari, M. 2008, MNRAS, 390, 71Cappellari, M., & Emsellem, E. 2004, PASP, 116, 138Cappellari, M., Bacon, R., Bureau, M., et al. 2006, MNRAS, 366,
1126Cappellari, M., Emsellem, E., Krajnovic, D., et al. 2011,
MNRAS, 413, 813Cappellari, M., Scott, N., Alatalo, K., et al. 2013a, MNRAS, 432,
1709Cappellari, M., McDermid, R. M., Alatalo, K., et al. 2013b,
MNRAS, 432, 1862Cenarro, A. J., Cardiel, N., Gorgas, J., et al. 2001, MNRAS, 326,
959Cleveland, W. 1979, Journal of the American statistical
association, 74, 829Courteau, S., Cappellari, M., de Jong, R. S., et al. 2014, Reviews
of Modern Physics, 86, 47
Das, P., Gerhard, O., Mendez, R. H., Teodorescu, A. M., & deLorenzi, F. 2011, MNRAS, 415, 1244
de Lorenzi, F., Gerhard, O., Saglia, R. P., et al. 2008, MNRAS,385, 1729
de Lorenzi, F., Gerhard, O., Coccato, L., et al. 2009, MNRAS,395, 76
Deason, A. J., Belokurov, V., Evans, N. W., & McCarthy, I. G.2012, ApJ, 748, 2
Dutton, A. A., & Treu, T. 2014, MNRAS, 438, 3594Emsellem, E., Dejonghe, H., & Bacon, R. 1999, MNRAS, 303, 495Emsellem, E., Monnet, G., & Bacon, R. 1994, A&A, 285, 723Emsellem, E., Cappellari, M., Peletier, R. F., et al. 2004,
MNRAS, 352, 721Emsellem, E., Cappellari, M., Krajnovic, D., et al. 2011,
MNRAS, 414, 888Forestell, A. D., & Gebhardt, K. 2010, ApJ, 716, 370Foster, C., Arnold, J. A., Forbes, D. A., et al. 2013, MNRAS, 435,
3587Gavazzi, R., Treu, T., Rhodes, J. D., et al. 2007, ApJ, 667, 176Gerhard, O. 2013, in IAU Symposium, Vol. 295, The Intriguing
Life of Massive Galaxies, ed. D. Thomas, A. Pasquali, &I. Ferreras, 211–220
Gerhard, O., Kronawitter, A., Saglia, R. P., & Bender, R. 2001,AJ, 121, 1936
Humphrey, P. J., & Buote, D. A. 2010, MNRAS, 403, 2143Krajnovic, D., Emsellem, E., Cappellari, M., et al. 2011,
MNRAS, 414, 2923Morganti, L., Gerhard, O., Coccato, L., Martinez-Valpuesta, I., &
Arnaboldi, M. 2013, MNRAS, 431, 3570Murphy, J. D., Gebhardt, K., & Adams, J. J. 2011, ApJ, 729, 129Napolitano, N. R., Pota, V., Romanowsky, A. J., et al. 2014,
MNRAS, 439, 659Napolitano, N. R., Romanowsky, A. J., Capaccioli, M., et al.
2011, MNRAS, 411, 2035Navarro, J. F., Frenk, C. S., & White, S. D. M. 1996, ApJ, 462,
563Raskutti, S., Greene, J. E., & Murphy, J. D. 2014, ApJ, 786, 23Remus, R.-S., Burkert, A., Dolag, K., et al. 2013, ApJ, 766, 71Romanowsky, A. J., Douglas, N. G., Arnaboldi, M., et al. 2003,
Science, 301, 1696Rubin, V. C., Ford, W. K. J., & Thonnard, N. 1980, ApJ, 238,
471Sanchez-Blazquez, P., Peletier, R. F., Jimenez-Vicente, J., et al.
2006, MNRAS, 371, 703Scott, N., Cappellari, M., Davies, R. L., et al. 2009, MNRAS,
398, 1835Scott, N., Cappellari, M., Davies, R. L., et al. 2013, MNRAS,
432, 1894Thomas, J., Saglia, R. P., Bender, R., et al. 2011, MNRAS, 415,
545Verheijen, M. A. W., Oosterloo, T. A., van Cappellen, W. A.,
et al. 2008, in American Institute of Physics Conference Series,Vol. 1035, The Evolution of Galaxies Through the NeutralHydrogen Window, ed. R. Minchin & E. Momjian, 265–271
Weijmans, A.-M., Krajnovic, D., van de Ven, G., et al. 2008,MNRAS, 383, 1343
Weijmans, A.-M., Cappellari, M., Bacon, R., et al. 2009,MNRAS, 398, 561
White, S. D. M., & Rees, M. J. 1978, MNRAS, 183, 341