Small Scale ERP Engine Design - Cal Poly
27
Small Scale ERP Engine Design By: Colyn Dickson Matt Haymond
Transcript of Small Scale ERP Engine Design - Cal Poly

Small Scale ERP Engine Design
By:
Colyn Dickson
Matt Haymond

1
Contents
Abstract ....................................................................................................................................................... 2
Introduction ................................................................................................................................................ 2
Background ................................................................................................................................................. 5
Literature Review ....................................................................................................................................... 7
Design ........................................................................................................................................................ 11
Specifications ........................................................................................................................................ 11
Login & Multiple User Types ......................................................................................................... 11
MRP Table Outputs ......................................................................................................................... 12
Financial Reporting .......................................................................................................................... 13
Engineering Changes of Product Structure .................................................................................. 13
Advisory System for Past Due Orders .......................................................................................... 14
Ergonomics and User-Friendliness ................................................................................................ 15
Data Input and Maintenance .......................................................................................................... 15
Constraints ............................................................................................................................................ 16
Platform Switch .................................................................................................................................... 16
Methodology ............................................................................................................................................. 17
System Walkthrough ............................................................................................................................... 18
Conclusion ................................................................................................................................................ 23
References ................................................................................................................................................. 24
Table of Figures ........................................................................................................................................ 26

2
Abstract
This project set out to create a 1) low-cost, 2) dynamic, and 3) user-friendly small scale
ERP software tool. These three key attributes position this product against complex and
expensive systems such as SAP or Oracle. While the product still retains the dynamic and
financial capabilities any good ERP system should have, the biggest value proposition is its
simple and user-friendly interface. The software has a dual product-market fit: for small
businesses as a low-cost planning tool, and for universities as a teaching tool. In the design
phase, the team kept a primary focus on ergonomic software development while maintaining a
subsidiary focus on bringing the product to customers. Through the rapid prototyping process
and one scope change, the team was able to meet software functional requirements and develop
a go-to-market strategy for this ERP software solution.
Introduction
There is a high demand for a low cost, user-friendly software tool that can be used to
plan and generate orders for small businesses. The goal of this project is to design a small-scale,
dynamic Enterprise Resource Planning (ERP, also referred to as MRP – Manufacturing Resource
Planning) software tool using Microsoft Access, a relational database management system. The
software will be applicable as a resource planning engine in a small business setting, however, it
will also serve as a teaching tool in Dr. Pouraghabagher's IME 410 class and possibly other
teaching environments.
The key features of software include:

3
• Input Data for MRP/ERP System
• Output MRP Tables
• Financial Reports
• Engineering Changes of Product Structure
• Advisory System for Past Dues
• Data Maintenance
• 3 Layers of Security/Passwords
• Ergonomics of User Interface
The main output of an ERP system are manufacturing orders and purchasing orders,
and attaching financials to these orders. Financials calculated include Return on Investment
(ROI) and Net Present Worth (NPW). The three main inputs to the system are the Master
Production Schedule (MPS), Bill of Materials (BOM), and Inventory Master File (IMF). The
“small scale” nature of the software refers to constraints in both the quantity of data stored and
the system horizon. The software is designed to handle roughly 5 – 10 end item products with 3
– 5 product levels each. These are not hard and fast software limitations, but rather a general
guide to limit the magnitude of data within the system. The system planning horizon covers 12-
weeks, or 1 fiscal quarter. This is a strict limitation of the software. Two prominent features of
the software engine are an allowance for engineering change of product structure as well as an
algorithm for past due orders and proceeding corrective actions. Product maintenance is a very
critical feature of any company that wishes to stay current and competitive. This software
allows for impromptu changes to the product structure which correspond to automatic updates
in the output. The algorithm for past dues is implemented in an advisory system that displays
4
warnings whenever a schedule is input that will lead to a late order. These warnings give
possible solution alternatives to the user for how to proceed with the corresponding financial
consequence of each option.
A few other features are built into the engine to give it the robust functioning quality.
The Graphic User Interface (GUI) is highly user friendly with all relevant displays and other
ergonomic factors considered. The user also has the ability to access where-used and pegging
reports. Lead times for orders will have a variable functionality, enabling the user to delay or
expedite orders. The software's functional scope will not include the implementation process of
the tool into the business operations, orders outside of the 12-week horizon, or any Customer
Relations Management (CRM).
The solution approach required modularizing development of the system into four
stages: MRP tables, financials, product configuration change, and finally ergonomics (in that
order). Each of these modules are highly intricate and complex, and a rapid prototyping
solution approach ensured that every element of the system architecture was developed
thoroughly.
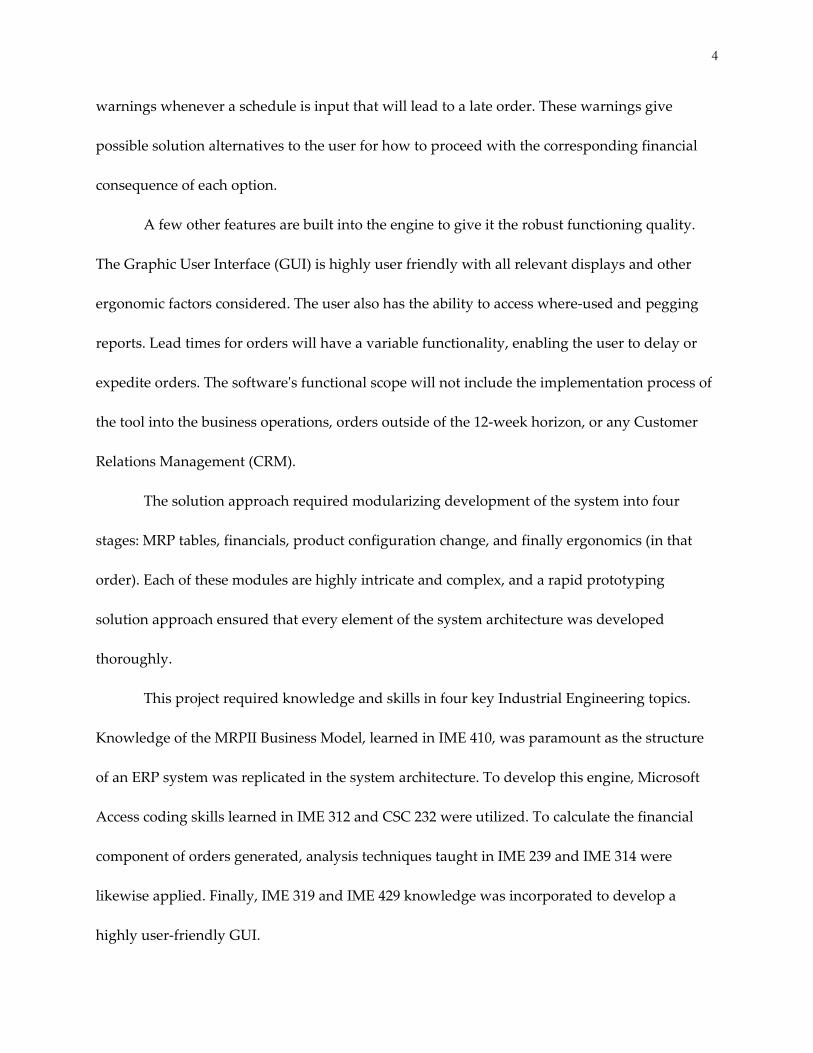
This project required knowledge and skills in four key Industrial Engineering topics.
Knowledge of the MRPII Business Model, learned in IME 410, was paramount as the structure
of an ERP system was replicated in the system architecture. To develop this engine, Microsoft
Access coding skills learned in IME 312 and CSC 232 were utilized. To calculate the financial
component of orders generated, analysis techniques taught in IME 239 and IME 314 were
likewise applied. Finally, IME 319 and IME 429 knowledge was incorporated to develop a
highly user-friendly GUI.

5
Background
To put this project in context, it is necessary to explain the basic knowledge and
terminology regarding the main concepts and tools used in the software. This can be broken
down into three distinct categories: the functionality of a basic MRP system, the key attributes
of a relational database, and the common accounting measures in costing a project.
There are three inputs to an MRP (Manufacturing Resource Planning) system: MPS (Master
Production Schedule), BOM (Bill of Materials), and IMF (Inventory Master File). The MPS is the
production plan at the end-item level. The BOM states the necessary components and
assemblies to manufacture each end item. The IMF lists important attributes of each part such
as on-hand inventory, the lot size the part may be ordered in, and the safety stock required for
the part. All of this information is gathered and utilized by the MRP engine in order to output
the specific manufacturing and purchasing orders for every single part. In doing the calculation,
other useful information is derived such as the various inventory levels across the planning
period.
There are a few common tools used in a relational database management system which
are referred to in discussing the software’s design. Forms are windows in the user interface
which display information and access to functionality for the user. These forms often contain
buttons that perform operations and subforms which report data. Data is stored in Tables much
like Microsoft Excel and this data can be manipulated through queries or directly by coding.
The following graphic illustrates these concepts:

6
Source: Kaminski, 2010
In the financial analysis module of the software, a number of accounting measures are used to
analyze the economic impact of the orders generated in the system. These terms are now
introduced and defined:
• Net Present Worth (NPW): The difference between the present value of cash inflows
and the present value of cash outflows.
• Return on Investment (ROI): A performance measure used to evaluate the efficiency of
an investment or to compare the efficiency of a number of different investments.
• Accounts Receivable (A/R): Money owed by customers (individuals or corporations) to
another entity in exchange for goods or services that have been delivered or used, but
not yet paid for.
• Accounts Payable (A/P): An accounting entry that represents an entity's obligation to
pay off a short-term debt to its creditors.

7
• Inventory Cost: The cost to hold inventory depending on the holding costs per part.
• Direct Labor (DL): Direct Costs related to the production of a product.
• Overhead Costs (OH): All ongoing business expenses not including or related to direct
labor, direct materials or third-party expenses that are billed directly to customers.
These measures are generated in the Financial Analysis section of the software, based upon the
proper given data.
Literature Review
Many times, ERP implementation fails. This is often due to choosing the wrong software
for the business environment. In one study, "A theme often discussed in interviews was the fact
that often users did not understand why the organisation had undertaken the ABC [ERP]
implementation and did not believe that it was necessary. Many wondered why a system that
cost so much was being implemented when it was not providing any greater functionality, and
at times was less efficient than legacy system." (Kemp, Low, 2008) The software developed in
this project is an intuitive, user-friendly database ERP system that is a valuable tool for many
small businesses. It fills a large gap in the market. There is no standard ERP solution that
provides a low cost, user-centered approach. Choosing the right ERP software is crucial:
"Implementing an ERP system is not an inexpensive or risk-free venture. An estimated 40-70%
of ERP implementations experienced some degree of failure. That is why an organization
should select the most appropriated ERP systems for their business needs." (Pacheco-Comer,
González-Castolo, 2012) ERP implementation is especially crucial for small businesses
(Malhotra, Temponi, 2010). Existing software such as SAP and Oracle are designed as

8
powerhouse engines that can handle very large, complex systems. This is great for Fortune 500
companies and even mid-sized ones, but it does not meet the needs of customers who desire a
low-cost, user friendly alternative.
SAP Business One ® Software costs thousands of dollars per user for licensing (How
Much, 1). According to academic research, "There is a direct relation between the size of the
company and the amount of money that it can invest on an ERP system" (Pacheco-Comer,
González-Castolo, 2012). The product provided in this project is designed for the companies at
the small end of the spectrum. For these users, a complex system will decrease its usefulness. In
BooYoung Chung's Ph.D. dissertation, a study was conducted consisting of 281 ERP software
users, most of whom used high-end products like SAP or Oracle. One of the main conclusions
drawn in the dissertation was: “The ERP system should be easy to use. A complex system
decreases its usefulness, which also make users reluctant to use it. The system should be
carefully designed to be user friendly, considering screen design, user interface, page layout,
help facilities, and menus.” (Chung, 2007) This software is not overly complex. It was uniquely
designed with the end user in mind, as is lacking is other alternatives. According to research
regarding ERP integration in small businesses, “Have an ERP package with an intuitive and
easy-to-use interface to minimize training and user support costs. The satisfaction and needs of
the user are usually overlooked; rather, instructions are forced upon them since upper
management's decisions are accepted as efficient work processes” (Malhotra, Temponi, 2010).
"It has become clear that ERP implementation differs from traditional systems development
where the key focus has shifted from a heavy emphasis on technical analysis and programming
towards business process design and human elements." (Matende)

9
There are a number of goals that were set to develop a thoroughly user-friendly
interface. A valuable set of guidelines can be found in the ISO 9241 certification regarding
human-computer interaction. Parts 12-17 are listed below:
Part 12
Presentation of Information. The current draft deals with specific ergonomic issues
involved in presenting information in visual form. Specific topics include
organization of information in areas, windows, groups, tables, and lists; data field,
label, and cursor presentation; textual, graphical, and symbolic codes; and visual
highlighting technique.
Part 13
User Guidance. The current draft contains design guidance and requirements for
various forms of user guidance. Specific topics include prompts, feedback, and status
displays; on-line help; and error prevention, management, explanation, and
recovery.
Part 14
Menu Dialogues. The current draft contains design guidance and requirements for
menu-based dialogues. Specific topics include menu structure, presentation, and
navigation, and menu-option structure, syntax, selection, and execution.
Part 15
Command-language dialogues (CD): The current draft contains design guidance and
requirements for command-based dialogues. specific topics include command
language structure and syntax, command names and abbreviations, function keys
and hot keys, and command input, output, feedback , and help.

10
Part 16
Direct-manipulation dialogues (CD): The current draft contains design guidance and
requirements for direct-manipulation based dialogues. Specific topics include: user
interface metaphors, design and manipulation of objects and attributes, and direct
manipulation of windows, controls, text, graphics, and labels.
Part 17
Form-filling dialogues (WD): The current draft contains design guidance and
requirements for form-based dialogues. Specific topics include form structure and
layout, field formats, text entry, option selection, and feedback methods; and form-
navigation techniques.
Source: Billingsey, 1994
There are also a few general measures that were investigated to evaluate the high level
usability of the software. An AHP-TOPSIS (Analytical Hierarchy Process - Technique for Order
of Preference by Similarity to Ideal Solution) model for ERP software selection was created to
rank these measures:
1. Software Performance and Technical Infrastructure (SPI): Software Security and Software
Reliability ,Software operating speed, software development time, web based application,
customization and deployment time, advanced reporting services, adaptation with current
operating system, hardware and database.
2. Cost: Software development cost , maintenance cost.
3. Flexibility: compatibility with innovation(research and development) , adequacy of answering to
customer requests , user-friendly interface, international flexibility (Language , currency unit
legislation).
4. Service Level: Velocity of support after sale, Online Help After Sale

11
Source: Nurgül et al., 2011
In summary, the ideal ERP system for small businesses is effective, low-cost, and highly
ergonomic. The necessary modules for an effective system include but are not limited to: MRP
table generation, financial reporting, engineering changes of product structure, and an advisory
system for past due orders. All of these features, as well as many more auxiliary features are
included in this project’s software ERP system, and are outlined in the Design section of this
report.
Design
Specifications
System architecture design was divided into several modules, accomplished through
rapid prototyping phases. Their descriptions, functionalities, and user interface are
presented below:
Login & Multiple User Types The system is password protected and configured for three types of users: general user,
master scheduler, and admin. The general user can view and print information, but cannot
edit anything. The master scheduler and admin can edit information, but only the admin
can view and edit the code behind the project. The code is protected by a separate
password, which is not entered at the login screen. Upon login, the user is brought to the
Homepage:
12
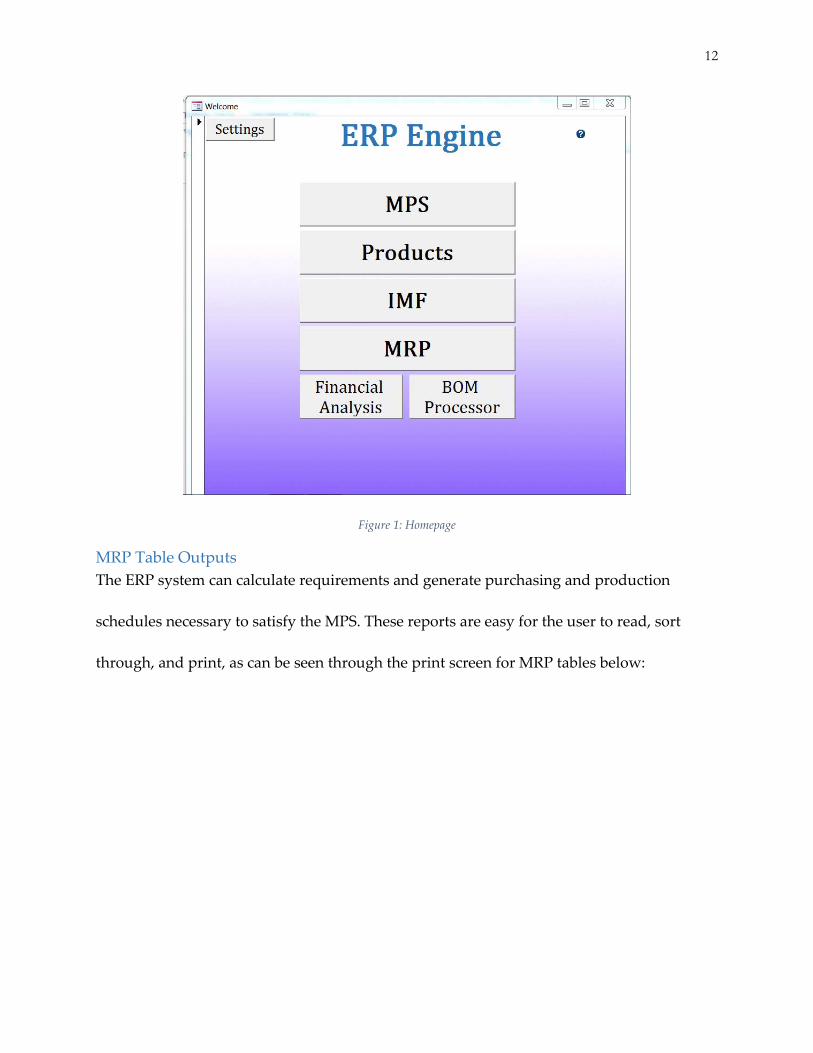
Figure 1: Homepage
MRP Table Outputs The ERP system can calculate requirements and generate purchasing and production
schedules necessary to satisfy the MPS. These reports are easy for the user to read, sort
through, and print, as can be seen through the print screen for MRP tables below:

13
Figure 2: MRP Tables
Financial Reporting This module takes into account all of the cashflows from production and purchasing, as
well as overhead and inventory rates. It uses cost roll-up to calculate the NPW and ROI of
all existing orders. This form allows the user to perform sensitivity analysis, changing the
production schedule, inventory levels, and so on, before they view the corresponding
output in financials.
Engineering Changes of Product Structure BOMs can be quickly and easily edited using the BOM Editor interface. This is only
available for master scheduler and admin users. The form below allows users to quickly
move up and down through product structures, allowing for engineering change
management wherever necessary:

14
Figure 3: BOM Editor
Advisory System for Past Due Orders Orders that cannot be satisfied by MRP because they are past due are reported to the user,
who is presented with multiple options. These options include expediting the order (the
system will reduce the lead time for that order and possibly increase cost) and splitting the
order. The user will be able to define the costs associated with expediting orders depending
on what item is being expedited and by how many weeks the lead time will be shortened.
Figure 4: Inventory Report

15
Ergonomics and User-Friendliness For every form, the design is consistent and intuitive. Help options accompany many of the
controls, and a user guide and global help module are provided. Below are two examples of
ergonomics in action: the easy sorting of the Production schedule based on a user’s
preference, and the physical representation of inventory data in the in the inventory
reports.
Figure 5: Production Schedule
Data Input and Maintenance For higher level users (master scheduler or admin), the master schedule, scheduled receipts,
IMF, BOMs, and other data may be input and edited through various user-friendly and
intuitive interfaces.

16
Constraints
Microsoft Access has many predefined controls and functionalities, allowing for the
creation of almost anything the developers can imagine. What Access lacks is a way to
efficiently process large amounts of data. Although the software meets all of the functional
requirements in the scope of this project, it is fairly slow at processing data. For this reason,
the system may only be able to be used for small-scale schedule generation. If there are too
many BOMs for the system to process, it will take an undesirably long time to process the
data, and may even fail. As will be discussed in the methodology section, load testing will
occur in order to define the limits of the system. Additionally, Access’ weak client-server
architecture inhibits the program from being a legitimate platform option for a larger scale
system where multiple users could use the program and edit information simultaneously.
Platform Switch
In an attempt to increase the efficiency of the MRP table generation, the data was
linked to Microsoft Excel in such a way that raw data was transferred to Excel, processed,
and then sent back to Access during MRP calculations. Unfortunately, the data links
between Access and Excel could not be refreshed while both applications were open at the
same time. Due of this, the only solution was to constantly close and reopen both Access
and Excel during the MRP algorithm. This would require yet another platform switch.
Visual Studio could potentially be used to perform this operation, but the act of opening,
saving, and closing multiple files tens or hundreds of times would only decrease the
efficiency of the system, so the Access-only system remained the best option.

17
Methodology
Once the development phase of the system was complete, the next step was to
properly test the interface and underlying logic to make sure that they operate accurately,
consistently, and with optimal ease of use. This entails beta testing, and subsequently, load
testing.
Beta testing occurred through operating the software from a user perspective. This
initially involved adding in product structures, defining a demand schedule, and verifying
the generated MRP tables. After that, product structures and demand were be altered to
simulate multiple scenarios. In all of these scenarios, the varying financial impact was
verified and analyzed to simulate marketing games. It was also ensured that past due
orders were handled correctly, providing warnings and multiple solution approaches. In all
of this testing, ergonomics was intensely scrutinized to verify minimal complexity. The
product was also be tested by subjects without involvement in design to simulate a brand
new user’s experience.
Load testing entailed testing our software to its limit. Product structures were made
larger and larger and all other inputs will be made as large and complex and possible to
find the limitations of the software. These limits are defined in the software so the user will
understand the scope of its capabilities.
Finally, a strategic roadmap was also brainstormed. This meant investigating phase
2 (go-to-market) plans for the software upon completion of beta testing and load testing.

18
This planning began preliminarily with the help of Ty Lee on the Industrial Advisory Board
(IAB). The team is currently investing a freemium model to compete with existing cloud
ERP solutions. The strategic roadmap was not a necessary requirement for the completion
of the project, but is necessary to decide if/how the product would be marketed.
System Walkthrough
• Here is the HomePage.

19
• First, click the ‘Add New Parts’ button on the HomePage form to view the New Item form seen below. Define all the fields and click ‘Save New Part’. Do this for all parts.
• When done adding items, close that form, and click on BOM on the HomePage. Edit the BOM, adding parent-component relationships.

20
• Now close the form and click MPS on the HomePage.
• Next, click the Edit button, defining demand for end items and service parts.

21
• Next, close that form, return to the HomePage, view the IMF and edit any inventory data by clicking ‘Edit IMF/SR’.
• Close that form, return to the HomePage and press ‘Calculate MRP’.
22
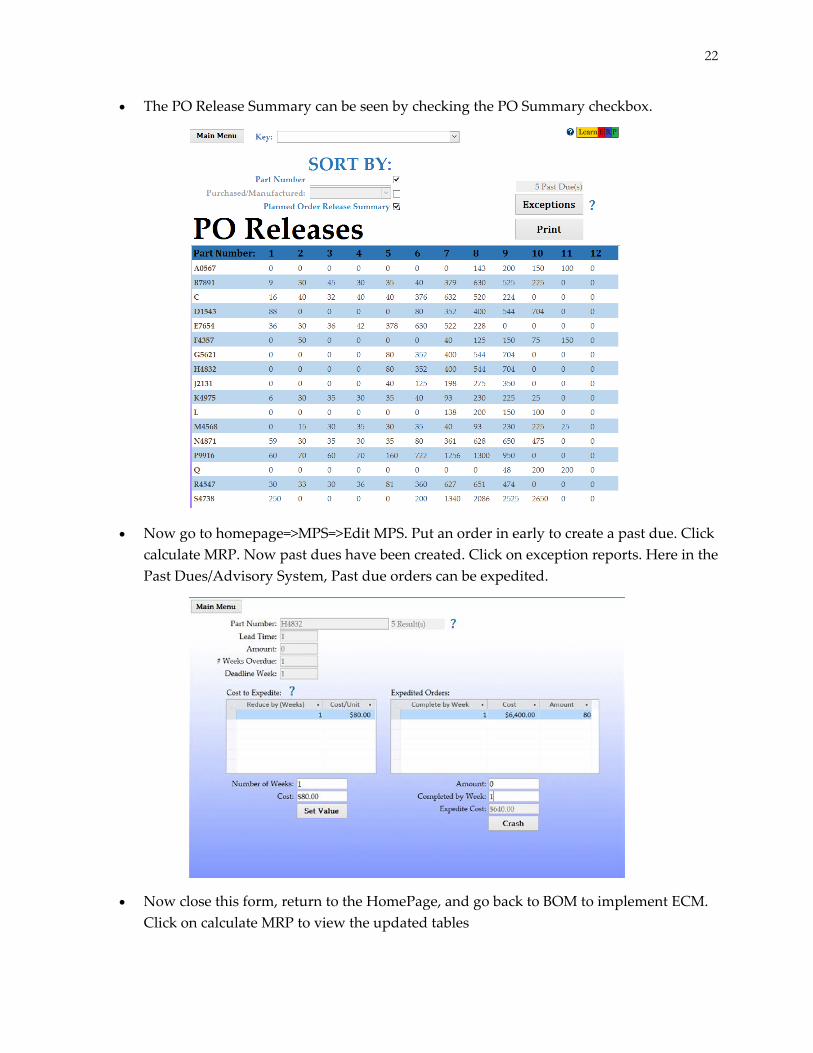
• The PO Release Summary can be seen by checking the PO Summary checkbox.
• Now go to homepage=>MPS=>Edit MPS. Put an order in early to create a past due. Click calculate MRP. Now past dues have been created. Click on exception reports. Here in the Past Dues/Advisory System, Past due orders can be expedited.
• Now close this form, return to the HomePage, and go back to BOM to implement ECM. Click on calculate MRP to view the updated tables

23
Conclusion
This project successfully resulted in a simple, efficient, and user-friendly ERP
software tool. Additionally, a number of other goals were met along the way. The team was
fortunate enough to experience learn by doing with regards to software development
project management. Valuable techniques that were learned include the storyboard
planning method and the rapid prototyping process. Through the physical software
development, the team also enhanced technical VBA coding and MS Access usage
capabilities, as well as gaining a more holistic understanding of the production planning
process. Although the project was successful there are a few things that would have been
done differently if it were to be completed again. Ideally the scope should have been
refined earlier. More work would have been done up front about what is reasonable to
accomplish given the platforms available. Despite that, the team is pleased to deliver a
product that is an effective teaching tool with the ability to be expanded to other domains.

24
References
Billingsey P. (1994). “Ergonomic Standards go Beyond Hardware” Interface
Chung, B. (2007). “An Analysis of Success and Failure Factors for ERP Systems in Engineering
and Construction Firms”, Civil and Environmental Engineering Theses and Dissertations
"How Much Does SAP Business One Cost?" The SAP Ask Engine. N.p., n.d. Web. 12 Mar. 2015.
Kaminski A. (2010). “Computer Integrated Enterprise in the MRP/ERP Software
Implementation” Foundations of Management.
Kemp M, Low G. (2008) “ERP Innovation Implementation Model Incorporating Change
Management” Business Process Management Journal.
Malhotra R, Temponi C. (2010). "Critical Decisions for ERP Integration: Small Business Issues"
International Journal of Information Management.
Matende, Samwel, and Patrick Ogao. "Enterprise Resource Planning (ERP) System
Implementation: A Case for User Participation." Procedia Technology 9 (2013): 518-26. Web. 13
Mar. 2015.
Motwani J, Subramanian R. (2004). “Critical Factors for Successful ERP Implementation:
Exploratory Findings from Four Case Studies” Science Direct.
Nelson, Klara and Somers, Toni, "Exploring ERP Success from an End-User Perspective"
(2001). AMCIS 2001 Proceedings.Paper 206.
Nurgül et al. (2011). "Fuzzy AHP-TOPSIS Two Stages Methodology for ERP Software Selection:
An Application in Passenger Transport Sector" 15th International Research/Expert Conference

25
Pacheco-Comer A, González-Castolo J. (2012). “An Empirical Study in Selecting Enterprise
Resource Planning Systems: The Relation Between Some of the Variables Involve on it. Size and
Investment” SciVerso Science Direct

26
Table of Figures
Figure 1: Homepage ......................................................................................................................... 12
Figure 2: MRP Tables ....................................................................................................................... 13
Figure 3: BOM Editor ....................................................................................................................... 14
Figure 4: Inventory Report .............................................................................................................. 14
Figure 5: Production Schedule ....................................................................................................... 15