Small-Scale Decentralized Energy Systems optimization and ...
137
Small-Scale Decentralized Energy Systems optimization and performance analysis Sara Ghaem Sigarchian Doctoral Thesis 2018 KTH School of Industrial Engineering and Management Division of Heat and Power Technology SE-100 44 STOCKHOLM
Transcript of Small-Scale Decentralized Energy Systems optimization and ...

Small-Scale Decentralized Energy Systems optimization and performance analysis
Sara Ghaem Sigarchian
Doctoral Thesis 2018
KTH School of Industrial Engineering and Management
Division of Heat and Power Technology
SE-100 44 STOCKHOLM

ISBN: 978-91-7729-808-3
TRITA: TRITA-ITM-AVL 2018:20
© Sara Ghaem Sigarchian, 2018

To my family

i
Abstract
Small-scale polygeneration energy systems, providing multiple energy services, such as heating, electricity, cooling, and clean water, using multiple energy sources (renewable and non-renewable) are considered an important component in the energy transition movement. Exploiting locally available energy sources and providing energy services close to the end users have potential environmental, economic, and societal benefits. Furthermore, integration of thermal and electro-chemical storages in the system can decrease fossil fuel consumption, particularly when applying a long-term perspective.
Despite their promising potential, the global share of power generation by these systems, including the combined heat and power (CHP) systems, is relatively low in the current energy market. To investigate the applicability of these systems, their competitiveness in comparison with conventional energy solutions should be carefully analyzed in terms of energy, economy, and the environment. However, determining whether the implementation of a polygeneration system fulfils economic, energetic, and environmental criteria is a challenging process. Additionally, the design of such systems is a complex task, due to a system design with various generation and storage modules, and the continuous interaction between the modules, load demand fluctuations, and the intermittent nature of renewable energy sources.
In this research study, a method to identify the optimal size for small-scale polygeneration systems and suitable operating strategies is proposed. Based on this method, a mathematical model is developed that can optimize the design in terms of energy, economy, and the environment relative to a reference system for a given application. Moreover, the developed model is used to investigate the effects of various parameters on the performance of the system, including, among others, the selected operating strategy and load characteristics as well the climate zones through a number of case studies. It is concluded that the application of a small-scale polygeneration energy system potentially has considerable energetic and environmental benefits. However, its economic feasibility varies from case to case. The concluding remarks are primarily intended to provide a general perception of the potential application of a polygeneration system as an alternative solution. It also provides a general understanding of the effects of various parameters on the design and performance of a complex polygeneration system.
The results from various case studies demonstrate that the developed model can efficiently identify the optimal size of a polygeneration system and its performance relative to a reference system. This can support engineers and researchers as well as investors and other decision makers to realize whether a

ii
polygeneration system is a good choice for a specific case.
Keywords:
Small-scale polygeneration energy systems, techno-economic optimization, renewable energy, operating strategy, particle swarm optimization, optimization algorithm, decentralized energy system

iii
Sammanfattning
Polygeneration-baserade energisystem, det vill säga småskaliga system som simultant tillhandahåller flera energitjänster, såsom uppvärmning, el, kylning och rent vatten, vilka använder flera energikällor (som kan vara förnybara eller icke-förnybara) anses vara en viktig komponent i energiomställningen. Att utnyttja lokalt tillgängliga energikällor och tillhandahålla energitjänster nära slutanvändarna har flera miljöfördelar liksom ekonomiska och samhälleliga fördelar. Vidare kan integrering av termisk och elektrokemisk energilagring i systemet minska förbrukningen av fossila bränslen, särskilt när man tillämpar ett långsiktigt perspektiv.
Trots sin potential är den globala andelen kraftproduktion från dessa system, inklusive system för kombinerad värme och kraft (CHP), relativt låg. För att undersöka tillämpligheten av dessa system bör deras konkurrenskraft jämföras med konventionella energilösningar och analyseras när det gäller energianvändning, ekonomi och miljöpåverkan. Det är emellertid en utmanande process att ta reda på om implementeringen av ett polygeneration-system uppfyller ekonomiska kriterier samt energi- och miljökriterier. Utformningen av sådana system är en komplex uppgift, eftersom det handlar om en systemdesign med flera generations- och lagringsmoduler och med kontinuerlig växelverkan mellan modulerna, belastningsvariationer samt, inte minst, de förnybara energikällornas intermittenta natur.
I denna forskningsstudie föreslås en metod för att identifiera den optimala storleken av småskaliga polygeneration-system och driftstrategier för dem. Baserat på denna metod har ett matematiskt verktyg utvecklats, som kan optimera konstruktionen i fråga om energi, ekonomi och miljö i jämförelse med ett referenssystem för en given applikation. Dessutom har verktyget tillämpats för att undersöka effekten av olika parametrar på systemets prestanda, bland annat vald driftsstrategi och belastningsegenskaper samt inverkan av klimatzoner, genom ett antal fallstudier. En slutsats är att tillämpningen av småskaliga polygeneration-baserade energisystem har betydande energi- och miljömässiga fördelar. Den ekonomiska situationen varierar emellertid från fall till fall. De sammanfattande slutsatserna är i första hand avsedda att ge en allmän uppfattning om tillämpningen av det utvecklade verktyget, men också för att ge en allmän förståelse för effekterna av olika parametrar på utformningen och utförandet av ett komplext polygeneration-system.
Resultaten från de olika fallstudierna visar att det utvecklade verktyget effektivt kan identifiera en optimal dimensionering av ett polygeneration-system och dess prestanda i förhållande till ett referenssystem. Detta kan hjälpa ingenjörer och forskare samt investerare och andra beslutsfattare att förstå om ett

iv
polygeneration-system är ett lämpligt val för ett specifikt fall.
Nyckelord:
Polygeneration-baserade energisystem, Småskaliga energisystem, Tekno-ekonomisk optimering, Förnybar energi, Decentraliserat energisystem, driftsstrategi, Partikelsvarmoptimering, optimeringsalgoritmer

v
Preface
This doctoral thesis was accomplished at the Heat and Power Technology Division at the Department of Energy Technology (EGI), KTH Royal Institute of Technology in Stockholm, Sweden. This research was completed under the supervision of Associate Professor Dr. Anders Malmquist and Professor Dr. Viktoria Martin. The thesis focuses on the techno-economic-environmental evaluation of small-scale decentralized energy systems. A method and a mathematical model for the optimization and performance evaluation of polygeneration energy systems are proposed. As a compilation thesis, the present work comprises a summary of a number of research papers, including the motivation and background, objective of the work, and main key findings. This work was financially supported by the project STandUP for Energy within the Swedish Government’s strategic research area.
Stockholm, May 2018

vi
Acknowledgements
I would like to acknowledge the Swedish Government’s strategic research area STandUP for Energy for providing financial support to this research project. I also would like to express my gratitude to InnoEnergy organization for providing a great platform to foster the innovation and entrepreneurship skills in researcher through the PhD school program. My sincerest thanks are extended to my supervisors, Assoc. Prof. Anders Malmquist, Prof. Viktoria Martin and Prof. Torsten Fransson for the support, encouragement and constructive criticisms. Without their help, dedication, mutual trust and the freedom to explore various paths during my PhD, this research would not be possible. I also would like to thank Prof. Andrew Martin, and Prof. Björn Palm for providing all the supports we are provided at the Energy Technology department (EGI). My special thanks to Prof. Rahmat Khodabandeh, the study director of the PhD program in our department for helping PhD students along the way. I also would like to show appreciation to Prof. Björn Laumert, the internal reviewer whose constructive criticism helped me to improve my thesis.
It is a pleasure to thank my dearest friends Mahrokh Samavati, Saman Nimali Gunasekara, Marjan Nafisi and Mazyar Karampour and Yasaman Saffari who has been always there for me with great compassions and support. I also thank to Justin Chiu for being such a great friend and colleague. I deeply thank all my other colleagues and friends at KTH energy department. Special thanks to Monika, Patri, Jorge, Jose, Chamindie, Maria, Fumi, Eyerusalem, Mauri, Moritz, Trang, Adhemar, Evelyn, Fabi, Jhonny, Luis and all my other friends.
Finally, my deep and sincere gratitude to my family for their love and support. I am grateful to my lovely siblings, Bahareh, Hossein and Hedieh for being part of my life. I feel extremely lucky to have them in my life. My heartfelt appreciation goes to my parents for making me who I am today. They selflessly encouraged me to explore new directions in life and seek my own destiny. Without their continuous and unparalleled love, help and support, I never could experience the joy of life. This journey would not have been possible if not for them, and I dedicate this milestone to them.

vii
Publications
This PhD thesis is based on the following papers. All papers are enclosed as appendices.
I. S. Ghaem Sigarchian, R. Paleta, A. Malmquist, and A. Pina, “Feasibility study of using a biogas engine as backup in a decentralized hybrid (PV/wind/battery) power generation system - Case study Kenya,” Energy, vol. 90, pp. 1830–1841, 2015.
II. S. Ghaem Sigarchian, M. S. Orosz, H. F. Hemond, and A. Malmquist, “Optimum design of a hybrid PV-CSP-LPG microgrid with Particle Swarm Optimization technique,” Applied Thermal Engineering, vol. 109, pp. 1031–1036, 2016.
III. S. Ghaem Sigarchian, A. Malmquist, and V. Martin, “Optimal planning and design method for complex polygeneration systems: A case study for a residential building in Italy,”.Submitted manuscript in Energy Conversion and Management, 2017.
IV. S. Ghaem Sigarchian, A. Malmquist, and V. Martin, “The choice of operating strategy for a complex polygeneration system: A case study for a residential building in Italy,” Energy Conversion and Management, vol. 163, pp. 278–291, 2018.
V. S. Ghaem Sigarchian, A. Malmquist, and V. Martin, “Design Optimization of a Complex Polygeneration System for a Hospital,” Energies, vol. 11, no. 1071, 2018.
VI. S. Ghaem Sigarchian and A. Malmquist, “Design Optimization of a Small-Scale Polygeneration Energy System in Different Climate Zones in Iran,” Energies, vol. 11, no. 1115, 2018.
Contributions to the Appended Papers
The author of this thesis is the corresponding author of the appended Papers I to VI, where method and model development, simulation, analysis, and write up were carried out; all work was done under the advice and guidance of Assoc. Prof Dr. Anders Malmquist and Prof. Dr. Viktoria Martin.
Publications not included in this thesis:
S. G. Fikari, S. Ghaem Sigarchian, and H. R. Chamorro, “Modeling and simulation of an autonomous hybrid power system.” In 52nd International Universities Power Engineering Conference (UPEC), November 2017.

viii
S. Ghaem Sigarchian, A. Malmquist, and T. Fransson, “Modeling and control strategy of a hybrid PV/Wind/Engine/Battery system to provide electricity and drinkable water for remote applications,” Energy Procedia, vol. 57, pp. 1401–1410, 2014.

ix
Thesis Outline
Chapter 1 states the motivation, objective, method, and scope of the work.
Chapter 2 provides a brief background on modeling and optimization of decentralized energy systems, and reviews previous related studies.
Chapter 3 presents the optimization of hybrid power systems in rural applications.
Chapter 4 describes the proposed method and optimization model for design optimization of polygeneration systems.
Chapter 5 deals with the validation and verification of the proposed optimization model described in Chapter 4.
Chapter 6 presents a summary of the substantial results of optimization and performance evaluation of polygeneration systems through a number of case studies.
Chapter 7 presents a general overview and points out the concluding remarks based on the results.

x
Abbreviations and Nomenclature
Symbols
µ Emission factor g/kWh
Efficiency %
ε Loss coefficient %
Δt Time step -
Abbreviations
Ac Acceleration constant (PSO parameter) -
A Area m2
ATC Annualized total cost USD
ATCSR Annualized total cost-saving ratio %
C Cooling kW
CCHP Combined cooling, heating, and power -
CHP Combined heat and power -
CO2ERR CO2 emission reduction ratio %
COP Coefficient of performance -
CRF Capital recovery factor -
CS Cold storage -
CSP Concentrated solar power -
E Stored Energy kWh
F Fuel Energy kWh
FEL Following electric load -
FS Fuel saving USD
FSR Fuel-saving ratio %
FTL Following thermal load -
fr Inflation rate %
G Solar irradiance W/m2

xi
GA Genetic algorithm -
Gbest Global best (PSO variable) -
H Heating kWth
hs Heat storage -
I Nominal discount rate %
ICC Initial capital cost USD
IRR Internal rate of return %
ISR Integrated saving ratio %
Iω Inertia weight (PSO parameter) -
LCOE Levelized cost of electricity USD/kWh
L01 Load type 1 USD/kWh
L02 Load type 2 -
MBL Modified base load -
NCF Net cash flow USD
NPV Net present value USD
NPVSR Net present value-saving ratio %
O&M Operation and maintenance -
ORC Organic Rankine cycle -
P power USD
Pbest Personal best (PSO variable) -
PBP Payback period years
PL Part load facor %
PSO Particle swarm optimization -
PVF Present value factor %
Rand A random number between zero and one -
Scen. Scenario -
T Temperature °C
V Wind speed m/s2
xii
Vel Velocity (PSO parameter) -
W Weight factor(PSO parameter) -
Superscripts
Poly Polygeneration system -
Ref Reference system -
SOC State of charge -
Subscripts
a, b Wind power non-linearity factors -
bat Battery storage -
C Cooling -
cap Capital -
chp Combined heat and power -
Ci Cut-in speed -
Co Cut-out speed -
cs Cold storage -
dem Demand -
dl Distribution line -
Ech Electric chiller -
El Electricity -
Exp Export -
F Fuel -
grid Utility grid -
Hc Heating coil -
HRU Heat recovery unit -
Hs Heat storage -
imp Import -
In Input -

xiii
nom Nominal -
om Operation and maintenance -
out Output -
pv Photovoltaic solar panel -
R Rated power -
rep Replacement -
shu Solar heater unit -
soc State of charge -
sup Supply -
Tch Thermal chiller -
Th Thermal -
tot Total -
wind Wind turbine -

xiv
Table of Contents
ABSTRACT .................................................................................................... I
SAMMANFATTNING ............................................................................... III
PREFACE ...................................................................................................... V
Acknowledgements ............................................................................................... vi
Publications .......................................................................................................... vii
Thesis Outline ........................................................................................................ ix
Abbreviations and Nomenclature ........................................................................... x
TABLE OF CONTENTS ......................................................................... XIV
List of Figures ...................................................................................................... xvii
List of Tables ........................................................................................................ xix
1 INTRODUCTION ................................................................................. 1
1.1 Motivation ................................................................................................. 4
1.2 Objectives .................................................................................................. 5
1.3 Methodology and Scope ............................................................................. 6
2 BACKGROUND .................................................................................... 8
2.1 An Overview of Energy System Modeling ................................................... 8
2.2 Decentralized Energy Systems .................................................................. 10
2.2.1 Hybrid power systems ............................................................................. 12
2.2.2 Optimization of polygeneration systems ................................................. 13

xv
2.3 Operating Strategies ................................................................................ 18
2.3.1 Operating strategies in hybrid power systems ........................................ 18
2.3.2 Operating strategies in polygeneration systems ..................................... 19
2.4 Summary and Contribution to the State of the Art ................................... 20
3 HYBRID POWER SYSTEM OPTIMIZATION ............................. 23
3.1 Feasibility Study of a Hybrid Power System .............................................. 23
3.2 Optimization Algorithm Verification ........................................................ 31
3.2.1 Particle swarm optimization (PSO) .......................................................... 31
3.3 Concluding Remarks ................................................................................. 33
4 POLYGENERATION SYSTEM OPTIMIZATION MODEL ........ 35
4.1 The Main Characteristics of the Model ..................................................... 35
4.2 Reference System ..................................................................................... 36
4.3 Polygeneration System ............................................................................. 38
4.3.1 Components model .................................................................................. 39
4.3.2 Electricity balance .................................................................................... 42
4.3.3 Heating balance ....................................................................................... 43
4.3.4 Cooling balance ........................................................................................ 44
4.3.5 Fuel demand ............................................................................................ 44
4.3.6 CO2 emissions........................................................................................... 45
4.3.7 Operating strategy ................................................................................... 45
4.4 Performance Evaluation Criteria .............................................................. 50
4.4.1 Energy ...................................................................................................... 50
4.4.2 Environment ............................................................................................ 50
4.4.3 Economy .................................................................................................. 51
Net Present Value (NPV) ................................................................................... 51
Annualized Total Cost (ATC) ............................................................................. 52
Internal Rate of Return (IRR) ............................................................................ 52
Payback Period (PBP) ........................................................................................ 53
Annualized Total Cost-Saving Ratio (ATCSR) ..................................................... 53

xvi
4.5 Optimization Problem Formulation .......................................................... 53
4.5.1 Decision variables .................................................................................... 55
4.5.2 Constraints ............................................................................................... 56
5 POLYGENERATION MODEL VERIFICATION .......................... 57
5.1 Scenario Description ................................................................................ 58
5.2 Optimization Model ................................................................................. 58
5.3 Energy Flow Model ................................................................................... 62
5.3.1 Component level ...................................................................................... 62
5.3.2 System level ............................................................................................. 63
5.4 Feasibility evaluation ............................................................................... 66
5.5 Concluding remarks .................................................................................. 67
6 POLYGENERATION SYSTEM EXPLORATION ......................... 68
6.1 The Effect of Operating Strategies ............................................................ 68
6.1.1 Size of the optimal solutions .................................................................... 69
6.1.2 Performance analysis ............................................................................... 70
6.1.3 Economic analysis .................................................................................... 72
6.1.4 Concluding remarks on operating strategy .............................................. 74
6.2 The Effect of Heating Load Profile and Critical Components ..................... 75
6.2.1 Optimal solutions ..................................................................................... 76
6.2.2 Performance analysis ............................................................................... 77
6.2.3 Economic analysis .................................................................................... 80
6.2.4 Concluding remarks on heating load profiles and critical components ... 83
6.3 The Effect of Climate Zone ....................................................................... 84
6.3.1 Component size ....................................................................................... 86
6.3.2 Performance analysis ............................................................................... 87
6.3.3 Economic evaluation ................................................................................ 90
6.3.4 Concluding remarks on the influence of the climate zone ...................... 91
7 CONCLUDING DISCUSSIONS ........................................................ 93

xvii
7.1 A General Overview ................................................................................. 93
7.2 Hybrid Power System in Rural Electrification Application ......................... 95
7.3 Polygeneration Energy System ................................................................. 96
Future Work ......................................................................................................... 99
BIBLIOGRAPHY ..................................................................................... 101
List of Figures
Figure 1 World primary energy consumption by source (2016)[1] ..........................1
Figure 2 World electricity generation by source of energy in 2015 [2] ...................1
Figure 3 Schematic of the hybrid system configuration [42] ................................. 13
Figure 4 A polygeneration energy sysytem in the context of a smart grid .......... 14
Figure 5 A polygeneration energy system with two prime movers ...................... 15
Figure 6 Method schematic ......................................................................................... 24
Figure 7 The hybrid system configuration ............................................................... 25
Figure 8 Cash flow summary of the optimized system by cost type .................... 27
Figure 9 Sensitivity analysis regarding diesel fuel prices; Biogas engine generator set O&M and capital costs; the superimposed numbers on the graph are the NPC ......................................................................................................................................... 28
Figure 10 Surface plot of the cost of electricity ....................................................... 29
Figure 11 Demand load, unmet load, excess power, and generated power by each component during 72 hours (March 20, 21, 22) ...................................................... 30
Figure 12 Demand load, excess power, unmet load, battery input power, and battery state of charge for 72 hours (March 20, 21, 22) ......................................... 30
Figure 13 Particle swarm optimization (PSO) mechanism .................................... 32
Figure 14 Microgrid schematic showing the range of components considered: Battery bank, PV modules, LPG backup generator, Organic Rankine Cycle (ORC), Concentrating solar power (CSP), and Thermal Energy Storage (TES) 33
Figure 15 The reference system configuration ........................................................ 37
Figure 16 The block diagram of the polygeneration system with the energy flow indicators ........................................................................................................................ 39
Figure 17 FEL operating strategy of a 400 kWel CHP unit (a) and MBL operating

xviii
strategy for a 200 kWel CHP unit (b) ......................................................................... 46
Figure 18 Control flow diagram of the FEL operating strategy ........................... 48
Figure 19 Flow diagram of the FTL operating strategy ......................................... 49
Figure 20 Flowchart of interaction between various parts of the model ............ 55
Figure 21 Annual fuel-saving ratio (FSR), CO2 emission reduction ratio (CO2ERR), integrated saving ratio (ISR), and annualized total cost-saving ratio (ATCSR) of the optimization scenarios .................................................................... 61
Figure 22 Excess heat decrease in each scenario in relation to the first scenario ......................................................................................................................................... 61
Figure 23 Power flows for the representative day: power from/to the grid (P_grid_imp/ P_grid_exp), total power demand (P_dem_tot), generated power by the CHP and solar PV (P_chp and P_pv), and utilized excess power for extra cooling production (P_to_Ech_extra) ...................................................................... 64
Figure 24 Heat flow for the representative day: supplied heat by the CHP and solar thermal units (H_chp, H_shu), heating demand (H_dem_h), heat used for cooling purposes (H_for_cooling), and heat flow to/from the storage (H_hs_in, H_hs_out) ...................................................................................................................... 65
Figure 25 Cooling flow for the representative day: cooling demand (C_dem), the cooling to/from the cold storage (C_cs_in, C_cs_out), and supplied cooling by the electric and thermal chiller (C_prod_Ech, C_prod_Tch) ............................... 66
Figure 26 Size of the components for the MBL, FEL, and FTL operating strategies: PV (solar panel), CHP (combined heat and power), Ech (electric chiller), Tch (thermal chiller), SHU (solar heating unit), HS (heat storage) and CS (cold storage) ................................................................................................................. 69
Figure 27 Fuel-saving ratio (FSR), CO2 emission reduction ratio (CO2ERR), annualized total cost-saving ratio (ATCSR), integrated savings ratio (ISR) for the modified base load (MBL), following electric load (FEL), and following thermal load (FTL) operating strategies .................................................................................. 70
Figure 28 Excess heat and imported electricity and exported electricity from/to the grid ........................................................................................................................... 71
Figure 29 Various costs for the operation strategies .............................................. 73
Figure 30 Cost breakdown for each operating strategy .......................................... 73
Figure 31 Excess heat (a) and imported/exported power to/from the grid (b) for the three scenarios and the two load types (L01 & L02) ....................................... 78
Figure 32 Fuel-saving ratio (FSR), CO2 emission reduction ratio (CO2ERR), integrated savings ratio (ISR), and annualized total cost-saving ratio (ATCSR) for the design scenarios (Scen. 1 to 3) and the two load types; L01 (a) and L02 (b) ......................................................................................................................................... 79

xix
Figure 33 Capital cost for the scenarios and the two load types .......................... 80
Figure 34 Payback period (PBP) and internal rate of return (IRR) for the two load types and the scenarios: L01 (a), L02 (b) .................................................................. 81
Figure 35 Levelized cost of electricity for the scenarios and the two load types 82
Figure 36 The effect of natural gas and electricity price on the payback period (PBP) (a) and annualized total cost-saving ratio (ATSCR) (b) .............................. 83
Figure 37 Climate map of Iran [171] ......................................................................... 85
Figure 38 Size of the components; PV (solar panels), CHP (combined heat and power), Ech (electric chiller), Tch (thermal chiller), HS (heat storage), CS (cold storage), and SHU (solar heating unit) ...................................................................... 86
Figure 39 Fuel-saving ratio (FSR), CO2 emission reduction ratio (CO2ERR), integrated savings ratio (ISR), and annualized total cost-saving ratio (ATCSR in Ahvaz, Tehran, and Hamedan .................................................................................... 87
Figure 40 Yearly production (a), excess heat (b) and imported/exported power (c) .................................................................................................................................... 88
Figure 41 Share of solar PV units (a) and specific CO2 emission factor (b) ....... 89
Figure 42 Share of cooling production by the thermal chiller (Tch) (a) and the share of cold storage in cooling demand supply (b) ............................................... 89
Figure 43 Total cost (a) and cost/income breakdown (b) for the polygeneration system in each city ........................................................................................................ 90
List of Tables
Table 1 Outline of the Papers Complying with the Research Objectives ..............5
Table 2 Sensitivity Variables (2015) ........................................................................... 26
Table 3 Share of Annual Power Generation by Each Component during One Year of Operation ........................................................................................................ 27
Table 4 System Configuration for Proposed Scenarios and the Reference System ......................................................................................................................................... 59
Table 5 Optimal Solutions of the Design Scenarios ............................................... 59
Table 6 CHP Heating Model Verification and Validation ..................................... 62
Table 7 Economy of the Design Scenarios .............................................................. 66
Table 8 Economy of the Systems .............................................................................. 72
Table 9 Design Scenarios ............................................................................................ 76
Table 10 Optimal Solution of the Scenario and Load Types ................................ 77

xx
Table 11 Peak Demand and Annual Aggregated Power, Heating, and Cooling Demand of the Building in Each City ....................................................................... 85
Table 12 Economy of the Polygeneration System .................................................. 91
Table 13 Description of the Appended Supplements ............................................ 94

1 Intro duc t io n
1
1 Introduction
In our modern society, we are very dependent on energy in different forms, mainly electricity, heating, and cooling. In many countries, most of the energy demand is met by traditional energy sources, such as fossil fuels, nuclear energy, and hydropower. Statistics from the BP Statistical Review of World Energy June 2017 [1], summarized in Figure 1, estimates that in 2016, 86% of the world’s primary energy demand was met by fossil fuels, 5% from nuclear energy, and 10% from renewable energy, including hydroelectricity which accounts for approximately 7%.
Figure 1 World primary energy consumption by source (2016)[1]
According to Electricity Information 2017 published by the International Energy Agency (IEA), in 2015, approximately 67% of the world’s electricity was generated from fossil fuels (coal and peat, oil, natural gas), 11% from nuclear materials, and 16% from hydropower (Figure 2) [2]. The remaining 7% was produced from other sources of energy, including renewable sources.
Figure 2 World electricity generation by source of energy in 2015 [2]
Naturalgas24.1% Oil
33.3%
Coal28.1%
Nuclear 4.5%
Hydro6.9%
Renewables3.2%
Global Energy Consumption by Source (2016)
Coal39.3%
Oil4.1%
Natural gas22.9%
Nuclear10.6%
Solar, wind, geoth,tid
4.9%
Biofuels, waste, etc.
2.2%
Hydro16.0%
Global Electricity Generation by Source (2015)

1 Intro duc t io n
2
Most of the supplied electricity is produced in centralized power plants, which are located far from the end users, and on average, approximately 10% of the electricity is already lost before the power reaches the consumers. Moreover, on average, one-third of the cost of the delivered electricity is pertinent to the transmission and distribution of the electricity from the centralized power plant to the end users [3], [4]. Additionally, a large fraction of the heat from the power plants is discarded, which otherwise could be used for other purposes. This heat loss represents extra fuel consumption and, consequently, a more negative environmental impact from electricity generation.
In the current energy system infrastructure, especially in urban areas, multiple fuels (biogas, oil, natural gas, etc.) and services (heating, electricity, cooling, clean water, etc.) are delivered to various sectors, including buildings, industries, and tertiary sectors. Due to the low flexibility of existing energy infrastructures, the interactions between various entities in the energy system are very limited. Moreover, in the current approach, most of the energy services are provided by large utilities, and the end users are merely passive consumers who have little or no impact on the energy system.
However, due to global environmental concerns, recent developments in small-scale technologies, and lower cost power generation using renewable energy, a transition in the energy market has started and conventional energy systems are no longer considered the only options. Furthermore, increasing the share of power generation by renewable energy with its intermittent nature requires a new approach in providing energy services to the end users. Therefore, the traditional way of providing energy services is now compared to the decentralized solution suggested by engineers, politicians, and responsible authorities. One of the approaches broadly explored is generating electricity and useful heat, which can be used for both cooling and heating purposes simultaneously in an energy system called polygeneration [5]. Small-scale polygeneration systems are usually flexible systems with a plug-and-play scheme [6]. They consist of a number of integrated generation and storage units, which harvest the energy from various primary energy sources to supply the load demand of an entity.
In such systems, various entities in an energy system interact with each other, resulting in an increased synergy within the system. If optimally designed, this can lead to lower fossil fuel consumption, a higher share of renewable sources, a decrease in negative environmental impacts from energy production, and improved resilience of the energy system. Besides the possibility of integrating various types of technologies in one system to improve its overall performance, several primary energy sources, including renewable and non-renewable energy sources, can be utilized in the system (multi-fuel supply). Locally available energy sources, such as solar, wind, biomass, and urban waste, can be used to fulfill the energy demand of a community at a reasonable price.
Such community-based decentralized energy systems that provide energy services close to the end users have several environmental, economic, and societal benefits

1 Intro duc t io n
3
[7], [8]. A polygeneration system can serve as a community-based energy system under widely varying conditions. Some of the entities that can benefit from such systems includes remote areas with no access to a power grid, enterprises that need a secure power supply and one that is reliable for critical demands, and individuals who want to be self-sufficient with respect to the energy supply [6].
Community-based energy systems provide flexible platforms for consumers to be actively involved in the energy market. Through smart energy management and load shedding, a non-critical load can be curtailed temporarily when the price is high or if a shortfall occurs in the supply [6]. A disruption in the energy supply can cause several problems for society and the end users. While residential consumers can bear a temporary energy shortfall, for many consumers such as hospitals, data centers, and manufacturers, reliability and energy quality is crucial [9][6]. By being self-sufficient in emergencies for a short time, the energy system will be resilient to a temporary shortfall of energy. In addition, by connecting several small plants to each other in a smart network, in the event of one system failing, energy can be supplied by neighboring systems until the problem is resolved.
Furthremore, the community can invest in building a local energy plant and own their energy system. They can be both consumer and producer (called prosumer) in the energy network and decide to sell and/or buy energy when it is more profitable [6]. Prosumer involvement in choosing a mixture of renewable energy sources in their energy system leads to higher awareness about sustainability and negative environmental impact of fossil fuel consumption in the society [10]. Other benefits of a decentralized energy system are presented as: shortening the planning and implementation time; reducing or eliminating the initial cost of the transmission and distribution lines, and/or their operation and maintenance costs; decreasing the negative environmental impact; lowering the distribution and transmission losses; and increasing the resilience of the power network [3],[7].
As stated in the European Commission’s Strategy on Heating and Cooling, the heating and cooling energy demands consume about half of the total energy usage in the European Union (EU). Of this energy, 45% is utilized in the residential sector, 18% in services, and 37% in the industrial sector [11]. In this strategy, increasing efficiency, decreasing demand, and switching to renewable primary energy sources are listed as goals to prioritize achieving higher sustainability in heating and cooling production. Therefore, decentralized polygeneration systems should be considered technologies with great potential.
Some of the most common characteristics of polygeneration systems are the integration of renewable energy sources, the daily and seasonal variation of the load profile, and the interaction of various types of power generation (heat, electric power, and cooling) and storage units (cold, hot, and electro-chemical storage) simultaneously. It is evident that a large number of interrelated endogenous and exogenous variables are involved in such systems. Some of the endogenous variables are system configurations, component sizes, and the
1 Intro duc t io n
4
operating strategies. Some of the exogenous variables include the geographical location of the entity, the availability and price of the energy sources, the demand profile, the electricity tariff, and energy market regulations. Despite all the potential benefits of polygeneration systems, due to their complexity and numerous possible configurations, identifying the optimum design of such systems is not straightforward. Because a large number of variables are involved, whereby the variables may differ from one case to another, the viability of polygeneration systems should be analyzed for each individual case while considering the individual characteristics of the system.
However, determining whether the implementation of a polygeneration system fulfils the economic, energetic, and environmental criteria is a challenging process. The vast number of variables that influence the design of such systems leads to complexities in the mathematical formulation of the energy system as well as in the optimization process. Therefore, dedicated modeling, simulation, and optimization tools for identifying the optimal design of such a system are crucial at the planning stage [10].
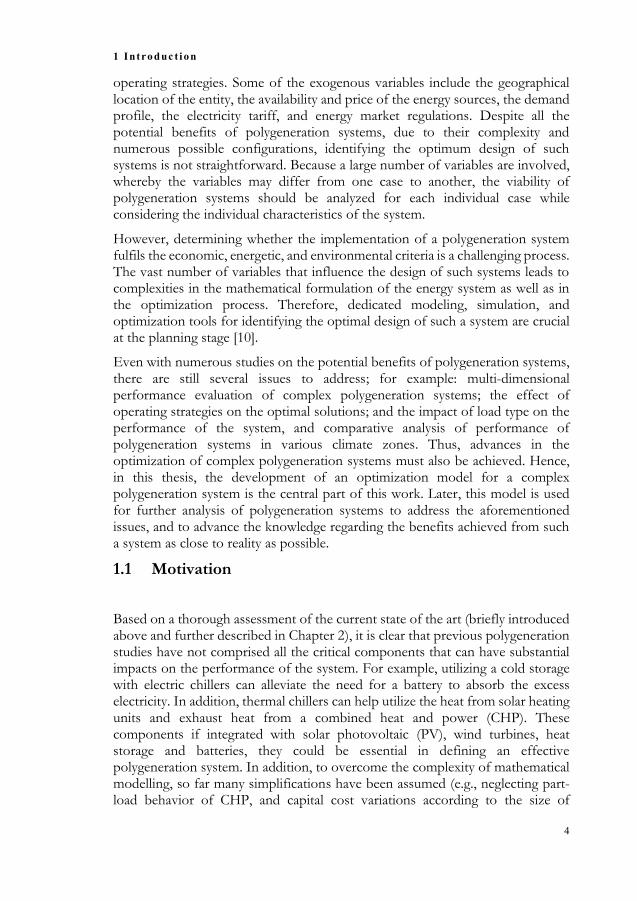
Even with numerous studies on the potential benefits of polygeneration systems, there are still several issues to address; for example: multi-dimensional performance evaluation of complex polygeneration systems; the effect of operating strategies on the optimal solutions; and the impact of load type on the performance of the system, and comparative analysis of performance of polygeneration systems in various climate zones. Thus, advances in the optimization of complex polygeneration systems must also be achieved. Hence, in this thesis, the development of an optimization model for a complex polygeneration system is the central part of this work. Later, this model is used for further analysis of polygeneration systems to address the aforementioned issues, and to advance the knowledge regarding the benefits achieved from such a system as close to reality as possible.
1.1 Motivation
Based on a thorough assessment of the current state of the art (briefly introduced above and further described in Chapter 2), it is clear that previous polygeneration studies have not comprised all the critical components that can have substantial impacts on the performance of the system. For example, utilizing a cold storage with electric chillers can alleviate the need for a battery to absorb the excess electricity. In addition, thermal chillers can help utilize the heat from solar heating units and exhaust heat from a combined heat and power (CHP). These components if integrated with solar photovoltaic (PV), wind turbines, heat storage and batteries, they could be essential in defining an effective polygeneration system. In addition, to overcome the complexity of mathematical modelling, so far many simplifications have been assumed (e.g., neglecting part-load behavior of CHP, and capital cost variations according to the size of

1 Intro duc t io n
5
components). Furthermore, comparative analyses of optimal operating strategies for polygeneration systems have not been adequately addressed in the literature. Lastly, multi-dimensional (environmental, energetic, and economic) optimization and performance evaluations of complex polygeneration systems are crucial to present the viability from all these important perspectives.
With this as the background, this thesis contributes to understanding the planning and design of decentralized polygeneration systems, as well as new knowledge related to key components and conditions, and how such components interact to create synergies, leading the way toward effective operating strategies for polygeneration.
1.2 Objectives
This thesis is dedicated to the performance analysis of complex polygeneration systems in terms of energy, economy, and the environment. The general objective of this work is to advance the knowledge on the potential benefits of decentralized polygeneration systems that sets the basis for realizing the next generation of demonstration projects. Furthermore, the effects of selected variables on the performance of the system are explored. The results can reveal an understanding of conditions under which a small-scale decentralized polygeneration energy system can compete with existing solutions. This thesis aims to address the following particular research objectives:
a) Explore the design optimization of hybrid power systems in rural areas; b) Advance the knowledge on complex polygeneration systems from a
multi-dimensional perspective; c) Evaluate how various components, load profiles, and operating strategies
can affect the design optimization and performance of a polygeneration system; and
d) Investigate how the performance of complex polygeneration systems is dependent on climate zones.
Investigations of the above-mentioned research objectives are published in seven papers. Table 1 lists these papers along with the letter of the objective addressed in them.
Table 1 Outline of the Papers Complying with the Research Objectives
Question Paper(s)
a I, II
b III
c IV, V, VI
d VI

1 Intro duc t io n
6
1.3 Methodology and Scope
The focus of this research is on evaluating the performance of complex polygeneration energy systems in terms of energy, economy, and the environment. Due to the complexity of the design of such systems, the initial stage of this work was dedicated to rural hybrid power systems. A hybrid power system is a subset of a general polygeneration system and is less complex than a full system. This provided the knowledge on techno-economic analysis and optimization techniques for energy systems. The application of hybrid power systems for rural electrification and the provision of electricity and clean water during emergencies is highly important. Roughly, one billion people worldwide do not have access to electricity [12], and providing such access is highly important to improve their quality of life [13]. Another problem is that the grid extension to provide electricity in rural areas in emerging countries is relatively expensive, and requires long-term planning and investments. A hybrid power system using locally available renewable energy sources might be a better solution. Therefore, in this study, the potential benefits of hybrid power systems have been explored through a number of case studies allocated to rural electrification.
The aim of the initial stage was to achieve a better understanding of the importance of the operating strategy and to study the operation of energy buffers in the system. During this stage, a performance analysis of the system was done, and principles of optimization were identified for integrated energy systems that exploit fluctuating renewable energy sources such as wind and solar power. To obtain a detailed evaluation of the system’s operation, the software package “Transient System Simulation” (TRNSYS) was used. In order to identify the optimal rating of the system and its sub-systems, the software “Hybrid Optimization of Multiple Energy Resources” (HOMER) was used for techno-economic optimization as presented in Paper I [14].
TRNSYS is a powerful tool for the simulation of energy systems, but its ability for optimization is limited, and it requires integration with an external optimization algorithm. Conversely, HOMER is a relatively powerful tool for optimization of energy systems, specifically for power generation. However, the integration of cooling systems is not possible, since such devices are not available in its model library nor can they be appended by users. The integration of such units is a necessity in this research work; thus, HOMER is not suitable for detailed studies of polygeneration systems. Therefore, at the second stage, the research was advanced towards developing a comprehensive model for techno-economic optimization and performance analysis of complex polygeneration systems. As a result, a model that can effectively determine the optimal size and operating strategy of a complex polygeneration system was developed. It addresses the shortcomings of polygeneration system studies in the literature and adds knowledge to the results of such studies, for example, by allowing for storage, incorporating part-load behavior of CHP units, and presenting alternative

1 Intro duc t io n
7
operating strategies.
It was necessary to develop a flexible in-house tool for analysis of polygeneration systems, using an efficient and user-friendly algorithm that can find a high-quality optimal solution with reasonable computational expenses. Therefore, the author tested a particle–swarm-based optimization algorithm (PSO) to optimize a hybrid power system simulation model developed at MIT (Paper II). The results verified the implementation of the PSO for further application in the in-house optimization tool.
The polygeneration system can operate in grid-connected or off-grid mode, and the model includes a variety of generation and storage units, such as CHP units, PV units, wind turbines, solar heating units (SHU), electric and thermal chillers, thermal storages (hot and cold), a battery, and a boiler. The exact configuration differs from case to case, depending on the case conditions and the optimization results. Three operating strategies are embedded in the model: following electric load (FEL), following thermal load (FTL), and modified base load (MBL). The optimization problem is formulated to find the optimal size of each component and to identify an optimal operating strategy for a specific case. The details of the model, the proposed method, and its novelties are presented in Chapter 4 as well as in Paper III.
Based on the literature, it was noticed that hybrid power systems could be feasible and practical in rural areas and off-grid applications. However, the application of complex polygeneration systems in rural areas is not attractive mainly due to high capital costs. In addition, a polygeneration system is more beneficial when there is a simultaneous demand for electricity and heating and cooling, which is not the case for many rural applications [12]. Hence, to investigate the full potential of polygeneration, the subsequent studies focused on urban applications at the third stage.
A number of case studies were executed in order to examine the potential of the developed model and to understand the influence of selected parameters on the design and performance of polygeneration systems. Particularly, the influence of operating strategy selection (Paper IV), load characteristics (Paper V), and climate zones (Paper VI) on the energetic, economic, and environmental performance relative to a reference system were analyzed. The outcomes of the studies provide generally applicable insights into the design, performance, and operation of polygeneration energy systems under the identified circumstances. However, due to the large number of variables that can influence its optimal design and performance, the design of any polygeneration system should be done for the specific local conditions and results cannot be easily generalized.

2 Ba ckg ro u nd
8
2 Background
This section provides a general background on the topic of optimization of polygeneration systems. First, an overview of the energy system modeling is given. Afterward, relevant studies on decentralized polygeneration systems regarding their application, optimization, and operating strategies are presented. A summary of the findings and the identified research gaps are discussed.
2.1 An Overview of Energy System Modeling
Depending on the application and objectives of a model, several methods and solutions can be combined resulting in various models each with its own uniqueness, usefulness, and applicability [15]. The aim of a model, the number of variables, and the scope and limitation of projects are extensive; therefore, it is unlikely for one single model to be capable of investigating all aspects of energy systems [15]. Hence, various modeling approaches (for instance top-bottom or bottom-up) at various layers (ranging from a building to a region) are required, depending on the objective and specification of a project. From a spatial perspective, the models can be categorized at the regional and local levels [10]. At the regional level, the focus is on an urban area, for example, to design the infrastructure of energy systems in a city. At the local level, the focus is on distributed multi-generation (DMG), for instance, to design an energy system for a building complex or a small community [10].
Several research studies have been conducted on both levels. Although these studies may seem similar at first glance, there are significant differences between the two categories and their applications, which are briefly explained in this section. The focus of this research is on the design of small-scale energy systems for a building complex, and designing a district or regional energy system is beyond the scope of this work. However, the background about the current research on the modeling of energy systems at the regional level is briefly discussed, which clarifies the difference between the two categories and their applications.
In a study conducted by Connolly et al., the existing modeling tools for investigating integrated energy systems mostly at the regional level were presented [16]. Popular tools such as EnergyPLAN [17][18], BALMOREL [19], and Leap [20] were utilized for national and regional levels. EnergyPLAN was developed at Aalborg University in Denmark and provides a user-friendly analysis of national energy systems with the possibility of performing optimization for both operation and investment [16]. Leap was developed initially in the United States (USA) in 1980, and at the moment, it is maintained by the Stockholm Environment

2 Ba ckg ro u nd
9
Institute [20]. Leap can also be used to analyze national energy systems. Developed in 2000, BALMOREL is a partial-equilibrium tool developed for analyses of electricity and the CHP market in the Baltic Sea region [21].
In another study performed by Weber et al. at École Polytechnique Fédérale de Lausanne (EPFL), a methodology for the design and optimization of large district energy systems in urban areas was proposed [22]. In the study, a mixed integer linear programming (MILP) optimization in combination with a multi-objective optimization based on an evolutionary algorithm was used. The results showed that the proposed method can identify the optimal design of heat and cold distribution networks as well as the conversion technologies in a district energy system [23]. In a study accomplished by Menon et al. at EPFL, an optimal design of a district microgrid that consists of heat pumps and cogeneration units using an optimal predictive control strategy was investigated [24]. Another investigation on modeling of an energy system at the district level was done by Zucker et al. at AIT Austrian Institute of Technology [25]. In this work, a new method using thermal simulation was proposed to optimize the operation of a district consisting of a number of buildings in a neighborhood.
Despite the existing models, development of new tools and/or integrating various models to build comprehensive platforms are still a necessity. This is mainly due to the complexity of energy systems and the purpose and intended use of each model. Therefore, many research institutes and universities are now focused on development, modification, and improvement of energy system models. As an example, CITYOPT is a collaborative project which, with its “Holistic simulation and optimization of energy systems,” facilitates optimization of energy systems in a smart city concept [26]. The CITYOPT project aims to demonstrate how various energy scenarios can be optimized based on social, economic, and environmental criteria [27]. The outcome of the project can assist decision-makers with identifying optimal solutions in city planning. The model has been applied to a number of case studies to investigate the usefulness of the model. Details of the model and specifications of the cases can be found in the provided user guide as well as a detailed study for a case in Vienna [27],[28].
Energy system modeling can be done in various timescales, for example, ranging from one hour to 40 years, for various sectors and technologies. Hence, building a model that can cover all varieties is very challenging. Therefore, to analyze a complicated energy system, it is necessary to incorporate various types of models developed for distinctive purposes. For instance, while grey-box models can describe the functionality of a heating and power system in a short timescale for balancing and storage purposes, an integrated energy system model can be used to analyze the interaction and trade-off between various sectors [29].
The studies mentioned above are focused on national-/regional- or district-level modeling and optimization. This gives a high-level perspective on energy system designs that consider economic, political, technical, and societal impacts. However, modeling at the local level with smaller timescales and higher resolution

2 Ba ckg ro u nd
10
is crucial (e.g., to derive enough data to optimally design a real system based on technological function, economy, and impacts on the environment). The local level of such an infrastructure can be, for example, small-scale multi-energy systems that provide energy to fulfill the demand of a residential building or a hospital complex. Such systems, commonly known as polygeneration systems, use multiple renewable and non-renewable energy sources and provide multiple energy services locally (for instance, heating, cooling, and electricity). Using locally available energy sources and providing energy services close to the end users have environmental, economic, and societal benefits. Several studies have reported significant advantages of polygeneration systems, such as decreasing or eliminating the losses and costs related to the transmission and distribution lines, reducing the planning and construction time, decreasing the harmful environmental effects, and improving the resilience of the grid [7], [8], [30].
In order to allow the end users to be part of the energy market and not merely act as passive consumers, it is necessary to investigate the operation of polygeneration systems at the building level with a high resolution. Furthermore, if the end users demand higher self-sufficiency, the polygeneration system should be able to meet this demand. Most of the energy models at the regional levels are not capable of providing detailed information about the interaction between various generation and storage units as well as loads. This is something that is necessary for balance and storage services at the local level. Therefore, the energy system models at the district level are not sufficient, and tools that are more refined are required for detailed studies. The following sections are devoted to exploring the previous research in polygeneration energy systems, which is the focus of this study.
2.2 Decentralized Energy Systems
In centralized electricity generation, electrical power transmission and distribution mount up to 30% of the electricity costs [4]. This share is the lowest for industrial consumers (medium and high voltage ) and the highest cost for smaller consumers, such as residential or commercial buildings (low voltage electricity) [3]. Furthermore, a considerable amount of heat produced during electrical power generation is released to the environment, which otherwise could be utilized for heating applications. Hence, the conventional power generation systems, as part of the energy transition movement, are now compared to decentralized energy solutions as new alternatives.
One of the most explored alternatives is the concept of decentralized polygeneration for CHP [5] or combined cooling, heat, and power (CCHP) generation, which are also known as trigeneration systems [31]. Implementation of such units in the existing energy system is increasing gradually, owing to their ability to achieve overall efficiencies as high as 80% [32].

2 Ba ckg ro u nd
11
Besides their high efficiency, polygeneration systems have several other advantages, such as: a) reducing or eliminating the initial cost of transmission and distribution lines, and consequently, their operational and maintenance costs; b) decreasing the planning and implementation time[3]; c) reducing the distribution and transmission losses; d) lowering the negative environmental impact; and e) increasing the power network’s resilience [7].
Several studies have investigated the technologies, design, optimization, evaluation criteria, and benefits of polygeneration systems. W. El-Khattam et al. [30] performed a survey on the technologies, definition, and benefits of distributed generation, resulting in a new classification of the technologies, applications, and distributed generation types. In another study, H. Al Moussawi et al. [33] reviewed the design evaluation, decision-making variables, and optimization of trigeneration technologies.
Mancarella et al. [10] performed a comprehensive study on state-of-the-art modeling and assessment techniques that are used for analyzing multi-energy systems (MES). The main goal of this article was to provide a more holistic overview on MES by bridging the gap between various perspectives. In a recent study, Jana et al. [34] presented the current status of polygeneration energy systems and their potential as a future sustainable solution. They suggested integrating proper energy storage systems to tackle the intermittency of renewable sources and incorporating more innovative devices. They also recommended increased research on multi-dimensional performance assessments of polygeneration systems, which are crucial for the further development and implementation of polygeneration energy systems.
Several recent studies have focused on the design and implementation of polygeneration energy systems from technical, economic, and regulatory perspectives, owing to the wide application range of such systems. Romero Rodríguez et al. [5] assessed the performance of a hybrid power generation system consisting of solar thermal collectors, PV units, and internal combustion engines for an identical building placed in different climate zones in Spain. They concluded that the hybrid system performs better from energetic and environmental points of view compared to conventional separate generation systems. Nevertheless, from an economic perspective, a conventional system would be a better choice. Adversely, Rubio-Maya [35] concluded that a higher net present value (NPV), an approximate saving of 18% in primary energy, and a significant reduction of CO2 emissions can be achieved by implementing an optimized polygeneration system in a tourist center in Spain.
Calise et al. [36] considered a solar-powered heating and cooling system (including an absorption chiller and heat pumps), and found that inclusion of an electric storage could supply about 20% of the electricity consumption. A payback period (PBP) of 15 years was achieved for the best configuration. In another study, Ünal et al. [37] showed the economic benefits of using a trigeneration system in a food production industry in Turkey over the separate generation of power, heat, and

2 Ba ckg ro u nd
12
cold.
Torchio et al. [38] considered two scenarios―maximum energy saving and maximum present value saving―to compare the thermo-economic and environmental performance of a distributed generation with a district CHP in Northern Italy. The integration of internal combustion engines, microturbines, and fuel cells in the district heating and distributed generation was investigated under these two scenarios. In the first scenario, although CO2 emission reduction was higher in the case of district heating, higher critical values of local nitrogen oxides (NOx) as well as particulates were detected when internal combustion engines were utilized. In the second case, however, all of the studied options exhibited energetic, environmental, and economic savings. Inclusion of internal combustion engines made the distributed generation a better choice from an economic point of view, while NOx emissions were reduced in cases where microturbines were included.
The other important parameter for a cost-effective polygeneration system is the proper sizing of components. For example, Tichi et al. [39] showed that optimal sizing and operational condition are crucial and have a significant influence on the economic benefits . Ren et al. [40] optimized a CHP system by considering the effect of the electricity tariff and storage size on the optimization of system size. They showed that the optimal design of a CHP system is highly influenced by gas and electricity prices, capital cost, carbon tax, and value of feed-in tariff. The authors also concluded that although the integration of an optimal heat storage may improve the CHP system performance, an oversized storage deteriorates the performance. Moreover, in the case of larger CHP plants, the time-of-use (TOU) electricity tariff structure could make the inclusion of energy storage more attractive. Di Somma et al. [41] performed a comprehensive study of a polygeneration system that includes CHP, a boiler, thermal chillers, heat pumps, thermal and electric storages, PV units, and thermal units utilizing exergy and cost evaluation in a multi-objective optimization problem. The optimized configurations exhibited a rise of 21–36% in the primary exergy input and the total annual cost, compared to the case where electricity, heat, and cooling demands are met using the grid, a gas-fired boiler, and an electric chiller, respectively.
2.2.1 Hybrid power systems
Various applications of decentralized energy systems have been studied and mentioned in the literature. Many of these studies are limited to power generation in a hybrid power system consisting of PV modules, wind turbines, battery unit as storage, and an engine as a backup (see Figure 3). These systems, known as hybrid power systems, are already commercialized and being used in various applications.

2 Ba ckg ro u nd
13
Figure 3 Schematic of the hybrid system configuration [42]
The majority of the research on hybrid power systems is dedicated to power generation in remote and rural areas with the aim of powering villages mainly in developing countries [6], [43]–[55]. Other applications are industrial sectors for self-generation and energy backup in emergency situations [8], communities within a smart grid network [9], and critical loads such as hospital or schools [6].
The advantages of a hybrid power system in rural electrification has been validated by several works [56]–[63]. In a system using solar and wind as the primary energy sources, backup engines and battery banks are used to increase power availability[64], [58],[65],[66]. Various studies have explored the potential benefits of hybrid power systems including solar PV, wind turbines, battery banks, and diesel engines as backup engines [57], [59], [67]–[69]. The optimization of such systems is also explored in numerous studies using the Hybrid Optimization Model for Electric Renewables (HOMER) as the optimization tool [14], [60], [63], [67], [68], [70]. In a hybrid power system, an engine is used as backup and a battery bank as energy storage, while the main energy supply is, for example, solar PV. The main goals are to increase the battery lifetime with a proper battery management system to minimize the engine’s operating hours and maximize the power extraction from renewable energy sources.
2.2.2 Optimization of polygeneration systems
Decentralized polygeneration system configurations can be entirely different from one system to another, depending on the application, the available primary energy sources, and the type of technologies used in the system. To illustrate their complexity, two examples of polygeneration energy systems using a variety of technologies are shown in Figure 4 and Figure 5.

2 Ba ckg ro u nd
14
Figure 4 A polygeneration energy sysytem in the context of a smart grid
Figure 4 shows a polygeneration system that merely consists of two power generation units (solar PV panels, wind turbines), two CHP systems (a gas/diesel generator and a micro gas turbine), an auxiliary boiler to provide heating, and an absorption chiller for cooling purposes. These units are interconnected through the cooling, heating, and electricity grids. The exhaust heat of the engines is recovered in a heat recovery unit (HRU), and the heat is exported to the heating grid to be used for cooling and/or heating purposes.
In the second example, shown in Figure 5, a polygeneration system using two prime movers (a micro gas turbine and a Stirling engine) is illustrated. The hybrid micro gas turbine utilizes solar energy and locally produced syngas from wood pellets in a gasifier. The heat from the exhaust gas is recovered through a gas-water heat exchanger. The Stirling engine burns wood pellets directly and generates electricity. The recovered heat from the exhaust gas is used in a hot water boiler. The hot water provided by the prime movers is then used for heating, cooling, and water purification purposes.

2 Ba ckg ro u nd
15
Figure 5 A polygeneration energy system with two prime movers
From these examples, it is clear that the options in designing a system are many and the complexity can be quite high. Various aspects of polygeneration energy systems, including technologies, design optimization, and performance evaluation, have been reviewed through comprehensive studies [10],[30],[71]. Combined, these studies emphasize the following aspects as important: 1) the necessity of a proper model that can handle the interaction of various components; 2) implementation of a suitable operating strategy for energy flow management through the system; and 3) development of an advanced optimization model for optimal planning of such complex systems. In a recent study, conducting further research on multi-dimensional performance evaluation of polygeneration systems, the utilization of more innovative devices and the incorporation of suitable storage systems to balance the intermittency of renewable energy sources were recommended [34].
Due to the broad application of polygeneration energy systems in residential and commercial buildings, the design and employment of such systems, taking into account several economical, technical, and regulatory issues, were investigated in various studies [5],[35]–[41]. The results of these studies show that in most cases, an optimized polygeneration system has environmental benefits compared to the conventional separate generation of heat and power system. However, it is not always a better choice in terms of economy. The results can be used to select balancing solutions based on the economy and sustainability of the system.
Several studies have focused on the influences of an optimal design, planning, and the operation of polygeneration systems due to their significant effect on the performance improvements of polygeneration systems. As an example, Rong et al. [72] reviewed the currently used optimization approaches in a polygeneration

2 Ba ckg ro u nd
16
energy system for building applications, and determined that system optimization is a crucial step for identifying and exploiting the polygeneration system’s potential. Various mathematical methods, such as linear programming (LP) [73], [37], [41], non-linear programming (NLP) [40], [74], the maximum rectangle method (MR) [75], fuzzy logic [76], and various population-based algorithms [77], [26] for formulating the optimization of polygeneration systems have also been reported in the literature. Piacentino et al. [79] is one example of such studies where an optimization tool utilizing a mixed integer LP algorithm was implemented in the design optimization of a complex polygeneration energy system serving a cluster of buildings. This method was later used in a number of case studies to clarify the full potential of the proposed method [80]. In another study, Ünal et al. [37] suggested a linear programming model to reduce the yearly operating costs of a trigeneration system by optimizing the operating strategy. In a different approach, Shaneb et al. [81] developed a linear program model to optimize the size of a residential CHP system.
Di Somma et al. [82] optimized a polygeneration system using the exergy principles. It showed that the optimized operation of the polygeneration system could not only significantly decrease the energy costs relative to the conventional energy system but also increase the overall exergy efficiency. Particle swarm optimization (PSO) and genetic algorithm (GA) are among the most effective and promising population algorithms to be used for the optimization of complex energy systems. To exemplify, Obara et al. [83] studied the performance of an energy-independent microgrid (consisting of fuel cells, PV modules, water electrolyzers, and heat pumps) using a GA method. Barbieri et al. [84] also used an optimization model based on a GA to identify the optimal sizes of the components in a CCHP energy system and showed that climate has a significant effect on the sizes.
Yousef et al. [85] used the non-dominated sorting genetic algorithm II (NSGA-II) to find the optimal component sizes, so that the net present cost and fossil fuel consumption of a solar-assisted CCHP consisting of PV/thermal panels and an internal combustion engine would be minimal. A similar algorithm approach was also used by Guo et al. [86] to optimize the planning and design of a CCHP microgrid system in a hospital. At the first stage, NSGA-II was used to solve the optimal planning; thereafter, the mixed-integer linear programming (MILP) algorithm was employed to solve the optimal dispatch problem at the second stage. Li et al. [87] developed a model based on a GA algorithm to optimize a CCHP system in a residential building and an office building in Dalian, China. Implementing the CCHP system in the office building exhibited better performance in comparison with its use in a residential building. Nevertheless, forming a building complex (office and residential) can serve as a motivation for the application of the CCHP system in the residential sector.
Soheyli et al. [88] optimized component sizes of a novel CCHP system, which included PV modules, wind turbines, and solid oxide fuel cells as the prime

2 Ba ckg ro u nd
17
movers as well as a thermal storage unit using a co-constrained multi-objective PSO (CC-MOPSO) algorithm to minimize the cost. A substantial reduction in fossil fuel consumption was attained compared to the separated heat and power generation system. Rivarolo et al. [89] investigated the possibility of using a time-dependent thermo-economic hierarchical approach based on a GA to optimize a polygeneration system size. They showed that a trigeneration system not only has a higher economic and energetic performance but also provides a better energy management throughout the year compared to the co-generation system.
A novel method based on the multi-population genetic algorithm (MPGA) was proposed by Zeng et al. [90] for design optimization of a CCHP coupled with a ground source heat pump (GSHP) system. The thermal capacity of the engine, status of the engine’s on-off mode, and the ratio of cooling and heating supplied by the GSHP to the total cooling and heating load was optimized using the developed model. The developed model was applied further in the optimization of the CCHP system in a hotel building, and the results showed fuel and cost savings along with CO2 emissions reduction, compared to a system with the separated generations.
A handful of studies have compared the PSO and GA optimization techniques, and many advantages of the PSO were found [78] and [91]–[95]. To exemplify, Sanaye et al. [91] used both the PSO and GA methods to optimize a CCHP system with the objective function of maximizing the benefits of the trigeneration system in a residential building in southern Iran during one year of operation. The results showed that although the PSO and GA converged to a solution with a maximum 0.6% difference, the PSO identified high-quality solutions with marginally higher benefits and less convergence time and computational effort compared to the GA. Another study performed by Hassan et al. [93] also concluded that compared to the GA, the PSO could converge to high-quality solutions with less computational expenses using a set of benchmark test problems. Wang et al. [78] presented an optimization model for a CCHP system, considering thermo-economic and environmental perspectives using PSO and GA. They concluded that the PSO presents better optimal results with less computational effort, and consequently showed the reliability and effectiveness of this approach.
Moreover, the effectiveness of the PSO and GA in the optimization of an off-grid power system were compared by Tudu et al. [94], who concluded that the PSO requires fewer iterations. Implementation of the PSO for optimization of a polygeneration microgrid was verified with an exhaustive search technique as a benchmark [95]. High-quality solutions were achieved with less computational cost. Given this along with its simpler algorithm compared to the GA, the PSO seems to be a good choice for an optimization algorithm for many researchers who prefer to use the control enabled by in-house coding rather than commercial software for optimization purposes.

2 Ba ckg ro u nd
18
2.3 Operating Strategies
Energy management in a polygeneration system needs advanced control strategies. This is due to the involvement of large numbers of generation and storage devices and the use of renewable energy sources with their intermittent nature. The control can be examined from two standpoints: the dispatch control and the dynamic control [47]. The dynamic control ascertains the power quality, such as frequency and voltage, and it is important for assuring high-quality power. This is usually handled by a power engineer, and it is beyond the scope of this work. In contrast, the dispatch control, also called the operating strategy, takes action on the energy flows within the system [47]. In a dispatch strategy, the interactions between the components are managed through the control algorithm. Since operating strategy is an important issue in an integrated energy system, this section is allocated to discussing the existing approach in the operation of hybrid power systems and polygeneration systems.
2.3.1 Operating strategies in hybrid power systems
The intermittent nature of solar and wind power together with operation of the battery storage and backup engine emphasize the importance of the operating strategy. The lack of a proper operating strategy leads to premature failure of the components, resulting in negative technical, economic, and environmental impacts. Therefore, one part of this work focuses on the operating strategy of a hybrid power system. A short review of the most common operating strategies implemented in various studies is given in this section. The two operating strategies commonly used in hybrid power systems are the load following and cycle charging strategies as defined in HOMER [96], [97].
Load following strategy
In this strategy, batteries are charged whenever the electrical energy produced by renewable sources exceeds the demand load [96],[97]. A backup engine (e.g., diesel or biogas engine) generates enough power to meet the demand load (primary load in some situations), and the battery is never charged by the engine.
Cycle charging strategy
In this strategy, every time the engine is on, it is operated at full load to fulfil the electricity demand [96], [97]. In the case of excess power, the battery will be charged. A battery set point (state of charge (SOC)) can be defined in a charge controller, and the generator will stop charging the battery when it reaches this set point. This operating strategy is beneficial when there is little or no renewable energy available. Many studies, especially the one using HOMER as the optimization tool, have applied this strategy in their design [43], [44], [46], [98]–[104].

2 Ba ckg ro u nd
19
Load shedding strategy
There are usually two different types of load, primary (or critical) and deferrable loads. If the renewable power is not enough to cover the energy demand, either the engine starts or the battery is discharged to cover the load demand. When the cost of starting the engine or discharging the battery is higher than the penalty of covering the deferrable load in another time, a load-shedding strategy can be used. In some energy systems, it is even allowed to cut off some of the unnecessary loads to some extent as defined by the maximum allowable capacity shortage. In this case, the penalty of power shortage should be less than the cost of the engine operation or the battery discharge, which are already charged by the engine. The load shedding strategy has been presented in [105]–[108].
Frugal strategy
The critical discharge load (Ld) is defined as the amount of load that is more cost-effective for an engine to provide, rather than the battery that has previously been charged by the engine-driven generator. In a frugal strategy, the battery will be discharged only to meet the load beneath the critical discharge load [109]. This strategy has been mentioned and used in a few literature references such as [101], [109]–[112].
Combined strategy
In many cases, none of the above control strategies is the optimal strategy in all situations. Therefore, a combination of two or more of these strategies and the application of each of them according to different circumstances can result in a more optimal solution. A combined strategy has been used in [101], [112], [113].
Predictive control strategy
When using a predictive control strategy, the charging of the batteries depends on the prediction of the demand and the energy expected to be generated by means of renewable sources, so there will be a certain degree of uncertainty. With this strategy, the energy loss from conversion of the renewable energy sources tends to decrease [110].
2.3.2 Operating strategies in polygeneration systems
Another important parameter to be considered in the modeling of a polygeneration system in addition to the optimization of energy and generation mix, and component sizing, is the operating strategy. Diangelakis et al. [114] identified the optimal design and operational strategy of CHP units in residential buildings using a systematic approach. Considerable thermos-economic and environmental improvements were observed using the simultaneous analyses of design, operation, and control strategy. In this context, Calise et al. [36] developed a model for performance analysis of a trigeneration energy system and optimization of its operating strategies. The operating strategies included the

2 Ba ckg ro u nd
20
following electric load (FEL), the following thermal load (FTL), and maximum power following thermal load (MPFTL). The objective function was to minimize the cost and to maximize the performance. A trigeneration system for a hospital was evaluated by the model. The results concluded that the FEL offers higher benefits, a lower PBP (four years), and an energy saving of 20% compared to an identified reference system.
A dispatched strategy was optimized with the aim of reducing the daily operating costs through an energy hub configuration by Ma et al. [115]. It was concluded that a substantial efficiency enhancement and a higher share of renewable production could be achieved. Moreover, the benefits of energy storage units as well as demand response implementation for managing the intermittent renewable energy were stated. Luo et al. [116] suggested a two-stage control approach to balance the intermittency of renewable energy sources and load profile as well as improve the economy of a polygeneration system. The proposed control approach offered better economy compared with the FEL and FTL strategies. Hajabdollahi et al. [92] used the PSO technique for design optimization of a CCHP system. A variable electric cooling ratio (VER) and a constant electric cooling ratio (CER) were considered in the performance evaluation for hot, cold, and moderate climates. The results concluded that a VER strategy offered higher benefits in all climates. Moreover, the benefits obtained were the highest in the hot climate. Soheyli et al. [88] further contributed to the implementation of the FEL and FTL in a novel CCHP energy system. From this account, it is clear that operation strategies must be carefully contemplated in the planning and design of any polygeneration system.
2.4 Summary and Contribution to the State of the Art
Despite the existing research, exploring the design optimization of complex polygeneration systems that consist of various critical technologies, which can substantially affect the performance of the system, is required. For instance, utilization of electric and/or thermal chillers together with a cold storage device can provide the opportunity for effective exploitation of excess power and waste heat for cooling production, resulting in higher overall performance. The incorporation of this system with PV modules and solar thermal panels as well as wind turbines make an eminent difference between an effective polygeneration system and traditional CCHP systems. Moreover, multi-dimensional design optimization of a polygeneration system that considers economic, energetic, and environmental criteria requires further investigation. Therefore, the design optimization of such complex polygeneration systems requires additional evaluation to consider various aspects of design and operation.
Moreover, some studies often applied simplifications to overcome the difficulties in the optimization of complex polygeneration systems. Hence, despite the

2 Ba ckg ro u nd
21
valuable contributions of those studies, the real potential of such systems has not been accurately explored. For instance, in several cases, the effect of the part-load operation on the power output and the power output of the CHP system was neglected as it was operated between 0% and 100% of its rated power [81],[77]. In some other studies, the influence of the outdoor temperature on the output power and the efficiency of the CHP units were not taken into account. Additionally, there were several size optimization problems in which, same costs were assumed for the components over the optimization search space, disregarding the effect of size on the costs. These simplifications can conclude with imprecise results, misjudging the advantages of the polygeneration energy systems. Furthermore, additional research on comparative studies concerning the optimum operational strategies in various applications is necessary. With this as a background, this thesis takes into account the aforementioned shortcomings and advances the design optimization of efficient, decentralized, polygeneration systems.
In this research, a model for design optimization and performance evaluation of an effective complex polygeneration system is proposed. Compared with the existing research papers, this model allows for optimal incorporation of several primary energy sources (wind, solar, and natural gas), conversion technologies (solar modules, solar thermal units, wind, boiler, CCHP, absorption chillers, and vapor compression chillers), and the integration of storage devices (electric and thermal). The main novelty of the model is the optimum planning and multi-dimensional optimization of complex polygeneration systems. Additionally, in-depth consideration is given to the evaluation of the most common applicable operating strategies: FEL, FTL, and MBL.
Another unique aspect of this work pertains to the practical operation of the CHP system, which has often been simplified in the design optimization of such systems. This comprises the impact of the outdoor temperature and part-load operation on the efficiency and nominal power output of the prime movers. Here, to avoid the operation at the low load factor, a modular CHP system consisting of several smaller CHP units is chosen as an alternative to a large CHP system. Even though this increases the complexity of the operating strategy, it allows the CHP to operate closer to its rated power, which leads to achieving higher economic, energetic, and environmental advantages. In addition, the impacts of sizes on the initial costs of the CHP units and chiller are considered rather than assuming a constant cost per generation unit for the entire search space.
Given this, the main objective of this thesis is to explore how a semi–self-sufficient energy system can be optimized to increase the utilization of renewable energy sources, and accordingly, reduce fossil fuel consumption. Mitigating the CO2 emissions, minimizing the annualized total costs, and reducing fossil fuel consumption are included in the multi-dimensional objective function. For the advantages described in Section 2.2.2, the PSO is utilized as the optimization technique. The developed model was implemented in a number of case studies

2 Ba ckg ro u nd
22
for design optimization and performance evaluation of complex, decentralized polygeneration systems in the building application. The outcome provides a comprehensive assessment of the potential of decentralized polygeneration in urban applications – new knowledge, which sets the basis for realizing the next generation of demonstration projects.

3 Hy br id Po w er Sy s te m O pt i miza t io n
23
3 Hybrid Power System Optimization1
As explained in the Introduction, the initial part of this Ph.D. work was devoted to hybrid power generation as a sub-system of a polygeneration system. Identifying the optimal solution of hybrid power systems in rural areas was explored initially using a commercial tool (HOMER). Following that, the development of an in-house optimization model was initiated and the optimization algorithm was verified. In this section, a summary of that work is presented.
3.1 Feasibility Study of a Hybrid Power System
HOMER can identify the group of optimized solutions that meet the load demand under certain constraints and assumptions [14]. HOMER performs an exhaustive search to identify the optimal solution. The solutions are ranked based on the net present cost (NPC). Figure 6 illustrates a schematic of the method and the general approach used in the modeling and analysis. In order to determine the group of optimized solutions, HOMER performs simulation and optimization by doing an energy balance for each hour of the year considering the optimization criteria. The optimization objective is to determine the decision variables (size or number of each component) and conclude the systems that satisfy the energy demand within the imposed constraints. The most important constraints are the maximum annual capacity shortage fraction and minimum renewable production fraction. The capacity shortage fraction defines the power reliability. This fraction is the amount of power shortage divided by the total power demand during one year of operation. The user enters these constraints.
Input data includes the selection of primary energy sources, load profiles, technical options, and meteorological data. The control strategies are embedded in the program. To consider the uncertainties, a sensitivity analysis can be performed to identify the impact of different input assumptions on the optimal design and performance of the system. HOMER presents several design scenarios ranked by the NPC. At the post-processing stage, the user makes a choice based on the requirements of the project and the results of the sensitivity analysis. The operation of the system in HOMER is identified by either of two dispatch strategies: a load following strategy and a cycle charging strategy. In a dispatch strategy, a number of rules control the operation of the battery and the generator. The user can select one of the strategies. If both are chosen, HOMER optimizes
1 This chapter is based on Paper I and Paper II.

3 Hy br id P o w er Sy s te m O pt i miza t io n
24
the system following both strategies and shows which one is the optimum [14]. In the load following strategy, the generator follows the electricity demand. This strategy is often optimal in the case of a high share of renewable power production due to the availability of renewable power. In the cycle charging strategy, the generator is operated at full load whenever it is required. The excess power charges the battery bank. This strategy is often optimal in the case of low renewable power generation since the contribution of the battery is crucial in this case. Details of the simulation model, optimization method, and operating strategies are described in the HOMER tool [14].
Figure 6 Method schematic
Grid extension seems to be a good solution for electrification of remote areas. However, the cost of grid extension, the need for long-term planning, and the high amount of capital investment are some of the disadvantages. These are magnified even more in the case of low consumption consumers in remote areas. An alternative solution is to install a small-scale hybrid power system using locally available energy sources. To identify whether a hybrid power system has advantages over the grid extension, its performance should be evaluated. Therefore, the design optimization and performance evaluation of such a system are necessary. HOMER provides a suitable platform for such an evaluation and, hence, it is used in this study. To explore the potential benefits, a hybrid energy system is proposed as an energy solution for a village in Kenya. Furthermore, previous studies described the high potential of biogas production from animal manure in Kenya [117]. Therefore, the possibility of using locally produced biogas from animal manure is investigated in this study.
System Design
Meteorological Data
Technology Choice
Load Profile Primary Energy Sources
Results Post-Processing
Optimization Result
Sensitivity Analysis
HOMER
System Control
System Constraints
Lifecycle Costs
Sensitivity Variables

3 Hy br id Po w er Sy s te m O pt i miza t io n
25
The stand-alone hybrid power system consists of PV panels, wind turbines, a biogas/diesel engine, and a battery bank. A schematic of the system configuration is shown in Figure 7. Solar PV panels, a wind turbine, and a battery bank are connected to a DC-Bus and the diesel/gas engine generator set is connected to an AC-Bus. These two buses are connected to each other using a bi-directional inverter. Load demand can be AC or DC; however, in the presented model, the load is assumed AC.
Figure 7 The hybrid system configuration
This work focuses on optimization of the hybrid energy system with the target of minimizing the NPC. The outcome of the study shows under which circumstances locally produced biogas is more favorable than diesel fuel. The economy of the system and the optimization results are significantly dependent on the diesel fuel price, capital costs, and operation and maintenance (O&M) costs of the biogas engine-generator system and the maximum allowable capacity shortage. To understand the effects of the parameters above, a sensitivity analysis was performed. The sensitivity variables are shown in Table 2. As presented, the costs related to the biogas engine are defined as a multiplier relative to a base cost assumption.
Charge controller
Power Conditioning
DC-Bus AC-Bus
Power Conditioning
Bi-directional inverter
AC/DC Load

3 Hy br id Po w er Sy s te m O pt i miza t io n
26
Table 2 Sensitivity Variables (2015)
Sensitivity Variable Values
Diesel Price (USD/L) 0.5, 0.7, 0.9, 1.1, 1.3, 1.5
Capacity shortage (%) 0,1 ,2 ,3 ,4 ,5 ,6 ,7 ,8 ,9 ,10
Biogas Gen Set with Digester system
Capital Cost Multi-plier
0.5, 1, 1.5, 2, 2.5, 3
Replacement Cost Multiplier
0.5, 1, 1.5, 2, 2.5, 3
O&M Cost Multi-plier
0.5, 1, 1.5, 2, 2.5, 3
The substantial results of the techno-economic optimization are presented in this section. More details can be found in the appended Paper I. The hybrid power system was optimized for a village in Kenya. The optimal solutions and performance of the system with a diesel-driven engine generator is compared with a system with a biogas engine generator. The biogas is produced locally from the animal manure through a digester. Based on literature sources, it was concluded that including a diesel engine in the hybrid power system has many benefits compared to using only a diesel power generator unit [64], [58],[65],[66]. It can increase the lifetime of the engine and decrease the maintenance cost and fuel consumption. Consequently, the negative environmental footprint is reduced. However, the availability of local diesel fuel is low due to the cost of transportation and storage of the fuel. To address this issue, by substituting with a biogas engine using locally produced biogas, the diesel engine is removed. Various studies concluded that biogas can be a viable alternative in such a hybrid power system [118]–[124]. However, these studies are very case dependent. The techno-economic viability of such a system using locally produced biogas from locally available waste or manure requires further investigation, which is one of the motivations of this case study.
Based on the optimization results, the system, including the biogas and wind turbine with the lowest NPC, is identified as the best choice. The levelized cost of electricity (LCOE) is estimated to be 0.25 USD/kWh, which is lower than the LCOE of using only a diesel generator power system (0.56 USD/kWh) or hybrid power system with a diesel engine as a backup (0.31 USD/kWh).The cash flow summary of the cost-based optimal design is presented in Figure 8. The capital cost of the system is relatively high, and approximately 50% of the capital cost refers to the PV system, while the capital cost of the wind turbine (generic 10 kW) and the battery bank account for approximately 17%. The O&M costs of the system are mainly related to the biogas power generation system, including the maintenance of the digester.

3 Hy br id Po w er Sy s te m O pt i miza t io n
27
Figure 8 Cash flow summary of the optimized system by cost type
The share of power generation by each component during one year of operation is presented in Table 3. As shown, 32% of the power is produced by the biogas engine generator set. The remaining power is provided by PV units and the wind turbine, meaning that the share of renewable energy sources, including locally produced biogas, for power generation is 100%.
Table 3 Share of Annual Power Generation by Each Component during One Year of Operation
Component Production (%)
PV array 49
Wind turbine 19
Biogas Gen-set 32
Total 100
The optimization results are based on verified and estimated prices either from different websites or by contacting related companies. Due to the uncertainties related to these cost assumptions, a sensitivity analysis was required. The capital costs and the O&M costs of biogas engine generator sets vary dramatically in the market. Furthermore, diesel fuel prices can vary significantly depending on location and from time to time [125]. Therefore, a sensitivity analysis based on the capital cost and O&M costs of the biogas engine, as well as the price of the diesel fuel, was performed. The result of the sensitivity analysis is shown in Figure 9. The graph shows how variations in diesel fuel prices or the capital costs of the biogas engine power system can influence the optimal results. For example, with the diesel fuel price of 0.8 USD/L and with the capital multiplier of 3 (meaning that the capital cost of the biogas system is tripled), using the diesel engine as a backup is more economical.
Capital Replacement Operating Fuel Salvage-20,000
0
20,000
40,000
60,000
80,000
100,000
120,000
Net
Pre
sen
t C
ost
($)
Cash Flow Summary
PV
Generic 10kW
Biogas Gen Set
Surrette 6CS25P
Converter

3 Hy br id Po w er Sy s te m O pt i miza t io n
28
Biogas Gen Set O&M Multiplier = 1
Diesel Generator set + Wind + PV + Battery bank
Biogas Generator set + Wind + PV + Battery bank Figure 9 Sensitivity analysis regarding diesel fuel prices; Biogas engine generator set O&M and capital
costs; the superimposed numbers on the graph are the NPC
Similarly, how the capital costs and O&M costs of the biogas power system can influence the levelized cost of electricity can be analyzed, as shown in Figure 10. For example, increasing the biogas O&M costs by 50% and doubling the capital cost of the biogas generator set, the NPC becomes 232,571 USD (18% increase) and the LCOE becomes 0.3 (20% increase), approximately. The price of electricity produced by this system is significantly higher in comparison with the electricity provided by the grid. However, considering different factors, such as the number of end users in a remote village, the distance between the grid and the community, long-term planning, and high capital investment for grid extension, the proposed system can offer a more viable solution for remote and rural areas with low-consumption users.
Regarding the environmental impact, the results show that using a biogas engine as a backup in the hybrid power system can lead to an avoidance of 17 tons of CO2 per year in comparison with using the diesel engine as a backup. The avoided CO2 emissions are 48 tons per year if compared with a diesel-based power generation system.
0.5 1.0 1.5 2.0 2.5 3.0
0.6
0.8
1.0
1.2
1.4
Die
sel P
rice (
$/L
)
Optimal System Type
BiGen Capital Multiplier
178,046
178,046
178,046
178,046
178,046
178,046
196,389
196,389
196,389
196,389
196,389
196,389
208,387
214,731
214,731
214,731
214,731
214,731
208,387
222,627
224,694
224,694
224,694
224,694
208,387
222,627
231,455
231,455
231,455
231,455
208,387
222,627
231,753
238,215
238,215
238,215
System Types
Wind/PV/BiGen/Battery
Wind/PV/Gen/Battery
Superimposed
Total NPC ($)
Fixed
BiGen O&M Multiplier = 1
0.6 0.8 1.0 1.2 1.40.5
1.0
1.5
2.0
2.5
3.0
BiG
en
Cap
ital M
ult
iplier
Optimal System Type
Diesel Price ($/L)
System Types
Wind/PV/BiGen/Battery
Wind/PV/Gen/Battery
Fixed
BiGen O&M Multiplier = 0.5
0.6 0.8 1.0 1.2 1.40.5
1.0
1.5
2.0
2.5
3.0
BiG
en
Cap
ital M
ult
iplier
Optimal System Type
Diesel Price ($/L)
System Types
Wind/PV/BiGen/Battery
Wind/PV/Gen/Battery
Fixed
BiGen O&M Multiplier = 0.5

3 Hy br id Po w er Sy s te m O pt i miza t io n
29
Figure 10 Surface plot of the cost of electricity
Another important issue is the operating strategy of the system. As previously described, the user can choose between two operating strategies. A high share of renewable power is desirable in this system; hence, the following load operating strategy is chosen. A maximum power shortage of 3% is imposed as a constraint. A higher capacity shortage results in a lower NPC. In spite of this, the consequences of lower power availability should be examined while assigning the capacity shortage factor. In this case, the electricity is provided for residential buildings in rural areas. Hence, the assigned value (3%) seems reasonable.
The operating strategy influences the power flow inside the system. To investigate the system operation, the power flow and the battery status over three days (March 20, 21, and 22) are depicted in Figure 11 and Figure 12, respectively. The power generated by each component, the demand load, the excess electricity, and the unmet load are presented in Figure 11. The figure shows that the excess power mainly occurs in the event of high solar insolation (e.g., 10:00–16:00). A power shortage can occur in the evening between 19:00 and 21:00 due to the lack of solar radiation. In Figure 12, the battery charge and discharge power as well as the battery SOC are illustrated. These two figures show the importance of the operating strategy in energy management of a hybrid power system. For example, the battery is charged during the hours with high renewable energy and is discharged when there is no renewable power. This reduces the operating hours of the engine.
0.5 1.0 1.5 2.0 2.5 3.00.5
1.0
1.5
2.0
2.5
3.0
BiG
en
Cap
ital M
ult
iplier
Levelized Cost of Energy
BiGen O&M Multiplier
0.180
0.194
0.208
0.222
0.236
0.250
0.264
0.278
0.292
0.306
0.320 $/kWh
Legend
Superimposed
Total NPC ($)
Fixed
Diesel Price = $1.1/L
144,092
172,674
191,017
209,359
223,578
230,338
178,046
196,389
214,731
224,694
231,455
238,215
201,760
219,051
225,811
232,571
239,332
240,878
220,167
226,928
233,688
240,448
240,878
240,878
228,044
234,805
240,878
240,878
240,878
240,878
235,921
240,878
240,878
240,878
240,878
240,878

3 Hy br id Po w er Sy s te m O pt i miza t io n
30
Figure 11 Demand load, unmet load, excess power, and generated power by each component during 72
hours (March 20, 21, 22)
Figure 12 Demand load, excess power, unmet load, battery input power, and battery state of charge for
72 hours (March 20, 21, 22)
From the studies, it is concluded that HOMER is a powerful tool for design optimization of a hybrid power system. However, it is deemed unsuitable for optimization of a polygeneration system due to various limitations. The most important limitations of HOMER are its restricted number of technologies and provided services as well as its lack of flexibility in altering the operating strategy and the objective function. Therefore, to explore the full potential of a complex polygeneration system, a more flexible optimization tool is required. The lesson learned from the case study is used for the development of an in-house optimization model.
0
2
4
6
8
10
12
14
16
18
20
Po
we
r (
KW
)
Time (hours) - March 20, 21, 22
Load Excess Power Unmet LoadPV Array Wind Turbine Biogas Gen Set
40
45
50
55
60
65
-15
-10
-5
0
5
10
15
Bat
tery
SO
C(%
)
Po
we
r (k
W)
Time (hours) - March 20, 21, 22
Load Excess Power Unmet Load
Battery Input Power Battery SOC

3 Hy br id Po w er Sy s te m O pt i miza t io n
31
3.2 Optimization Algorithm Verification
Based on the literature survey, PSO is chosen as the optimization algorithm. In this study, the PSO algorithm is integrated into an existing in-house energy model at Massachusetts Institute of Technology (MIT). The implementation of the PSO and its effectiveness is verified through a benchmark in a case study. In this section, first the PSO algorithm and its search mechanism are explained. Later, its application to a case study is described.
3.2.1 Particle swarm optimization (PSO)
Population-based algorithms are well suited for solving mixed integer nonlinear optimization problems. Among the population-based algorithms, PSO and GA have been investigated for various applications for the optimization of energy systems. PSO, which is a population-based algorithm, invokes the natural behavior of particles. Introduced by Kennedy and Eberhart, it was initially inspired by the social behavior of flocking populations [126]. This method can efficiently solve multidimensional non-linear functions [94].
The PSO algorithm starts with random initial populations within the search space, which are updated at each iteration. The updating process is influenced by the personal experience of each particle (personal experience) as well as its neighbors’ experiences (global experience). Updates based on personal and global experiences are called exploitation and exploration, respectively. Each population is an n-dimensional vector that includes all the decision-making variables (n is the number of the decision variables). In an n-dimensional search space (n is the number of the decision variables), the position of each agent or particle represents a possible solution. For example, in this study, the size of the components and the cooling ratios are included in each population. Each agent is defined as a position and will be updated at each iteration that directs the agent towards the optimal solution. The movement of the particles is shown in Figure 13. The initial position of each agent is completely random and the initial velocity is usually assumed zero. The following equations are used to update the velocity and, accordingly, the position of the particle using the personal best and global best positions[126].
Vel(t+1)=IW.Vel(t) +ac1 * Rand1() * (Pbest–Particle(t)) + ac2 * Rand2() * (Gbest- Particle(t)) (1)
Particle (t+1) =Particle (t) +Vel (t+1) (2)
where
t is a pseudo time increment;

3 Hy br id Po w er Sy s te m O pt i miza t io n
32
Vel(t) and Particle(t) are the velocity and position of the particle, respectively;
Pbest and Gbest are the personal and global best, respectively;
Rand1 and Rand2 are two random numbers in the range [0 1];
ac1 and ac2 are the acceleration constants that signify the personal and global nature of the population; and
IW is the inertia weight, which was added to the original PSO to manage the influence of the velocity of one iteration on the next one [127].
The impact of these parameters on the performance of the optimization is significant. Therefore, they should be identified for each problem individually. Choosing the correct parameters has been the focus of prior research, and the outcome of one research study, “Good parameters for particle swarm optimization” by Pedersen [128], is used as the starting point to adjust the parameters in this study. Figure 13 illustrates how the next generation of each particle is generated by updating each particle’s dimension. As shown, the new velocity is the vector sum of the global velocity factor (Vg), personal velocity factor (Vp), and the inertia weight multiplied by the velocity of the current generation (IW.Vel (t)). More information about the PSO algorithm and its operation can be found in [126], and its application to an energy system optimization is presented in [78].
Figure 13 Particle swarm optimization (PSO) mechanism
The optimization algorithm is integrated into a microgrid simulation program called “u-Grid.” The “u-Grid” was previously developed by Orosz et al. at MIT [129]. Initially, the optimal configuration was identified with an exhaustive search technique. However, because of its low convergence speed and high computational cost, other optimization techniques were explored. Due to the effective exploration and exploitation of the PSO and its effectiveness in finding high quality solutions (Section 2.2.2), the PSO was chosen for further investigation.

3 Hy br id Po w er Sy s te m O pt i miza t io n
33
The integration of the PSO algorithm to the simulation program and its effectiveness in finding the optimal solution is explored in this study. The modified optimization model is tested for the design of a microgrid for a village in Lesotho, including five small businesses, a church, 84 households, health clinics, and a school. The results of the exhaustive search mechanism are used as a benchmark for verification of the model. The system consists of PV modules, an LPG-fueled engine generator as a backup unit, an Organic Rankine Cycle (ORC) based genset, a packed bed thermal storage, concentrating solar power (CSP), and a battery bank (Figure 14).
Figure 14 Microgrid schematic showing the range of components considered: Battery bank, PV modules,
LPG backup generator, Organic Rankine Cycle (ORC), Concentrating solar power (CSP), and
Thermal Energy Storage (TES)
The optimal solution for the presented case study comprised a battery bank of 200 kWh, PV installations of 100 kW, and an annual propane consumption of 1,362 kg for the backup engine. The minimum tariff for maintaining a positive cash flow was calculated at 0.35 USD/kWh for a capital scenario with an interest rate of 5% return over 15 years. The results confirmed that the PSO could achieve a high-quality solution with less computational time compared to an exhaustive search technique. More details of the simulation model and optimization algorithm can be found in Paper II.
3.3 Concluding Remarks
In the first case study, the operation and performance of hybrid power systems in terms of energy, economy, and the environment were analyzed. In such systems, a high share of renewable power can be achieved in a remote hybrid power system. The techno-economic optimization demonstrates that the hybrid

3 Hy br id Po w er Sy s te m O pt i miza t io n
34
system using locally produced biogas is feasible and competitive when compared with a diesel engine as a backup system. The capital cost and the LCOE of generated electricity by the hybrid energy system are lower compared to using a diesel engine as a backup system. In consideration of the lifecycle emissions during the lifetime of the project, the environmental analysis shows that the proposed system can mitigate the CO2 emissions significantly. The sensitivity result demonstrates under which conditions a system using a biogas engine is more economic compared to a system using a diesel engine generator as a backup.
In the second case study, the application of a PSO to a simulation program for designing a microgrid showed the effectiveness of this algorithm in finding high-quality solutions with reasonable computational effort. This work was an initial step in developing an in-house tool for performance analysis of complex polygeneration systems.

4 Po ly g enera t io n Sy s te m Op t i miza t io n Mo de l
35
4 Polygeneration System Optimization Model
At the second stage of this study, using the achieved knowledge from previous stage, a model for design optimization of complex polygeneration systems was developed by the author. In this section, the design optimization and performance evaluation method, model of the energy system, optimization problem formulation, and operating strategies are thoroughly described. To understand whether a polygeneration system is beneficial, its performance in terms of energy, economy, and the environment should be identified. To explore if the system can be used as an alternative or supplementary solution, its advantages over the current solutions (a reference system) should be identified.
One common approach is to determine its performance relative to a reference system. The reference system is usually the separate production of heat and power. This approach has been used frequently in other studies to evaluate the performance of polygeneration energy systems in comparison with a specific reference system in terms of energy, economy, and the environment (3E analysis) [78], [130]–[134]. This method is used in the present study and the performance criteria and the evaluation method are explained thoroughly in Section 4.4.
4.1 The Main Characteristics of the Model2
Compared to previous studies, this model allows for optimal integration of a number of conversion technologies (wind turbines, PV units, solar thermal units, CHP units, boiler units, absorption chillers, and vapor compression chillers), primary energy sources (wind, solar, and natural gas), and the integration of storages (cold, heat, and electric). Moreover, three operating strategies are embedded in the model: FEL, FTL, and MBL. Currently, the operating strategy is selected by the user. However, in future works, the model will automatically use each operating strategy. The user can select the most suitable operating strategy according to the project’s objectives and limitations.
The influence of outdoor temperature and part-load operation on the nominal power of the CHP and its efficiency are also taken into account. Moreover, the effect of the size of the CHP and chiller units on the initial investment cost is also considered, instead of a constant value for the entire search space during the
2 This chapter is based on Paper III.

4 Po ly g enera t io n Sy s te m Op t i miza t io n Mo de l
36
optimization process. These considerations distinguish this work from similar studies, where those effects have not been thoroughly treated or have even been ignored. A more detailed and accurate approach is used to operate and optimize the performance of the CHP system. In order to obtain realistic results, the possibility of adding a CHP efficiency curve based on the manufacturer data is used in the model, rather than using a general efficiency curve.
Here, to minimize the operation of the CHP at low load, several smaller CHP units are chosen rather than one large system. These cause additional complexity in the operating strategy. However, it allows the CHP unit to be operated closer to its rated power, resulting in more economic, energetic, and environmental benefits. A PSO algorithm is used as the optimization technique [135]. The model finds the optimal size of each component, the cooling ratios, and the performance for each operating strategy can be determined. The intention of this model is to optimize a semi–self-sufficient polygeneration system that minimizes the fossil fuel consumption and maximizes the utilization of renewable energy. The optimization problem is not formulated as a daily operational planner; thus, participation in the day-ahead market is out of the scope of this study. The optimization is formulated as a planning problem to optimize the size of the components and to identify the most suitable operating strategy for given conditions.
4.2 Reference System
A schematic of the reference system used in the present study is illustrated in Figure 15. In this system, the power demand is supplied by the utility grid and the heating demand is provided by a boiler. Such an assumption for the reference case is valid for many cases and regions with a conventional fossil fuel driven power generation unit. The total fuel consumption of the system is the summation of the fuel consumption by the grid and the boiler. Cooling and heating coils are used for energy conversion from the cold and hot fluids to the building.
As a default, the reference system is based on a fossil fuel-driven power plant for electricity production and a fossil fuel-driven boiler. Accordingly, the mathematical formulation described in this section is based on these assumptions. However, in the case of another power generation mix, which varies from case to case, the mathematical equations should be changed accordingly. For example, if an electric boiler is used in the reference system, the heating demand is replaced by an equal amount of electricity imported from the grid. If the electricity generation is based on a wind turbine or solar power plant, the equivalent fuel consumption is zero. In general, for each case study, the reference system should be slightly re-formulated correspondingly.

4 Po ly g enera t io n Sy s te m Op t i miza t io n Mo de l
37
Figure 15 The reference system configuration
The cooling demand is provided by an electric chiller and its power demand in
kW (𝑃EchRef) can be determined as follows:
𝑃EchRef =
𝐶dem
𝐶𝑂𝑃Ech
(3)
where 𝐶𝑂𝑃Ech is the coefficient of performance (COP) of the electric chiller and
𝐶dem is the cooling demand of the building in kW. A fossil fuel-driven boiler provides the heating demand, and the equivalent energy of the fuel consumption
(𝐹boilerRef ) in kWh can be determined from the following equation:
𝐹boilerRef =
𝐻dem_dir × Δt
𝜂boilerRef × 𝜂hc
Ref (4)
where 𝜂boilerRef is the efficiency of the boiler, 𝜂ℎ𝑐
𝑅𝑒𝑓 is the efficiency of the heating
coil, 𝐻dem_dir is the heating load of the building (excluding the heating demand
of the thermal chiller), and 𝛥𝑡 is the simulation time step. The electricity demand is provided by the utility grid, which is based on a fossil fuel-driven (coal or natural gas) power plant. The losses in the grid correspond to an additional fuel consumption, which is considered in the calculation. The equivalent energy of the fuel consumption by the grid in kWh is given as follows:
𝑃gridRef = 𝑃dem_dir + 𝑃Ech
Ref (5)
𝐹gridRef =
𝑃gridRef × 𝛥𝑡
𝜂elGrid × 𝜂dl
Grid
(6)
where 𝑃gridRef is the amount of power supplied by the grid, 𝑃dem_dir is the
electricity used directly in the building excluding the electricity demand of the
electric chiller, 𝜂elgrid
is the efficiency of the power plant and, 𝜂dlGrid is the grid
efficiency which takes into consideration the distribution and transmission losses,
and 𝛥𝑡 is the simulation time step. The total equivalent energy of the fuel

4 Po ly g enera t io n Sy s te m Op t i miza t io n Mo de l
38
consumption is the summation of the above equivalent energy of the fuel consumption as follows:
𝐹totRef = 𝐹boiler
Ref + 𝐹gridRef (7)
In the present study, the amount of CO2 emission reduction is used as an environmental index. To approximate the total amount of CO2 emissions of the
reference system ( 𝐶𝑂2totRef ), emission conversion factors are used for the
calculation as follows:
𝐶𝑂2totRef = 𝜇CO2,f
× 𝐹boilerRef + 𝜇CO2,g
× 𝑃gridRef
(8)
where 𝜇CO2,f and 𝜇CO2,g
are the emission conversation factors [136],[137] of the
fuel and utility grid, respectively.
4.3 Polygeneration System
The block diagram of the proposed polygeneration system is illustrated in Figure 16. This system consists of several heating, electricity, and cooling generation units. Wind turbines, PV modules, and CHP are the technologies used for the power generation. The exhaust gas of the CHP is recuperated in the HRU to cover the heating demand along with the SHU and/or a boiler. A heat storage is considered for balancing the load in the case of excess or deficit heat.
The possibility of using both electric and thermal chillers is provided in the model. The heating demand of the thermal chiller is accommodated by SHU, the CHP system, and heat storage. The heat from the boiler is never utilized directly to the thermal chiller, since the main reason for using the thermal chiller is the effective utilization of the excess heat for cooling purposes. The model is flexible to manage both island and grid connected mode with minor changes in the model while switching from one mode to another.

4 Po ly g enera t io n Sy s te m Op t i miza t io n Mo de l
39
Figure 16 The block diagram of the polygeneration system with the energy flow indicators
4.3.1 Components model
In this section, the components model and the mathematical equation of each component is briefly described. More details can be found in the provided references.
PV Modules
The solar power output along the year is calculated through a simple method provided by Duffie et al. [138]. The efficiency of the solar panels is significantly influenced by the cell temperature. To reflect this effect, the Nominal Operating Cell Temperature (NOCT) proposed by Evans in 1981 is used to calculate the cell temperature [139]. The standard condition is assumed for the NOCT
estimation as follows: an irradiance (G) of 800 (W/𝑚2), an ambient temperature
of 20 (C), and a wind speed of 1 m/s [139]. In real conditions, the operating temperature of the solar cell is determined by the following equation:
𝑇cell_real(𝑡) = 𝑇amb(𝑡) +(𝑁𝑂𝐶𝑇 − 𝑇ref) × 𝐺(𝑡)
𝐺ref
, (9)
where 𝑇ref is the standard operating condition (here 20 C), 𝑇amb(𝑡) is the
ambient temperature at time t and 𝐺(𝑡) is the solar radiation (w/m2) at time t and
𝐺ref is the solar radiation (w/m2) at standard condition. The overall efficiency of

4 Po ly g enera t io n Sy s te m Op t i miza t io n M o de l
40
the PV installation in real conditions, 𝜂pv_real(𝑡), is determined by the following
equation:
𝜂𝑝𝑣_𝑟𝑒𝑎𝑙(𝑡) = 𝜂pv_nom × (1 − (𝑇cellreal(𝑡) − 𝑇ref) × 𝑇coef), (10)
where 𝜂pv_nomis the nominal efficiency of the module at the standard condition
and 𝑇coef is the temperature coefficient that considers the effect of temperature
variation on the power output. The value of 𝑇coef varies based on the solar panel type with a common value of 0.5%/degree Celsius for the most common solar
cells in the market [140] . The power output of a solar panel at time t, 𝑃pvPoly
(𝑡),
is determined as follows:
𝑃pvPoly(𝑡) = 𝐴𝑟𝑒𝑎PV × 𝜂pv_real(𝑡) × 𝐺(𝑡) × 𝜂inv (11)
where, 𝐴𝑟𝑒𝑎PV is the area of the PV modules and 𝜂inv is the inverter’s efficiency.
Wind Turbine
The power output of the wind turbine, 𝑃windPoly
, is given by the following equation
[141]–[143]:
𝑃wdPoly(𝑡) = {
( 𝑉(𝑡)3−Vci
3
𝑉r3−𝑉ci
3 ) × 𝑃rated 𝑉ci < 𝑉(𝑡) < 𝑉r
𝑃rated 𝑉𝑟 < 𝑉(𝑡) < 𝑉𝑐𝑜
0 𝑂𝑡ℎ𝑒𝑟𝑤𝑖𝑠𝑒
, (12)
where Prated is the rated power output, 𝑉r is the rated wind speed, 𝑉co is the cut-
off speed, and 𝑉ci is the cut-in speed.
Boiler
A condensing boiler is chosen as an auxiliary heat source due to its higher efficiency compared to conventional boilers [144]. It also performs better at part-load, which makes the assumption of constant efficiency more realistic [145]. The output heat of the boiler is calculated by the following expression:
𝐹boilerPoly
=𝐻dem(t) × 𝛥𝑡
𝜂boilerPoly
× 𝜂hcPoly
(13)
where 𝜂hcPoly
is the heating coil efficiency and 𝜂boilerRef is the boiler’s efficiency.
Later, this parameter is used to calculate the fuel demand for auxiliary heat in the same time step.
Solar Heating Unit (SHU)
The output heating power of the SHU is calculated from the following equation:

4 Po ly g enera t io n Sy s te m Op t i miza t io n Mo de l
41
𝐻shuPoly
(𝑡) = 𝐴𝑟𝑒𝑎shu × 𝜂shu(𝑡) × 𝐺(𝑡) (14)
where 𝐴𝑟𝑒𝑎shu is the area of SHU and 𝐺(𝑡)is the solar insolation on the surface
area and 𝜂shu(𝑡) at time t. This efficiency changes according to the ambient temperature, mean temperature of the solar panels, and the solar insolation. The efficiency of the SHU can be determined by the following equations provided in solar district heating guidelines [146]:
𝜂thshu(t) = 𝜂
nomshu − a1 ×
𝑇mean_shu − 𝑇amb(t)
𝐺(𝑡) × 1000− a2 ×
𝑇mean_shu − 𝑇amb(t)2
𝐺(𝑡) × 1000
(15)
where:
𝑎1 and 𝑎2 are the 1st and 2nd order heat loss coefficient;
𝜂nomshu is the nominal efficiency and 𝜂th
shu(𝑡) is the efficiency of the SHU
at time t; and
𝑇amb(𝑡) and 𝑇mean_shu are the ambient temperature and the mean temperature of the SHU, respectively.
Combined Heat and Power (CHP)
The heat power output at time and the equivalent energy of the fuel consumption in the CHP system during the time step of the model are given as follows:
𝐻chpPoly(𝑡) = 𝑃chp
Poly(𝑡)/𝜂elchp
(𝑡) × (1 − 𝜂elchp
(𝑡)) × 𝜂hruchp
(16)
𝐹chpPoly
= 𝑃chpPoly
(𝑡) × Δ𝑡/ 𝜂elchp
(𝑡) (17)
where 𝜂elchp
(𝑡) is the thermal efficiency of the CHP unit at each time step, 𝜂hcPoly
is the efficiency of the heating coil, and 𝜂hruchp
is the efficiency of the heat HRU.
The 𝜂𝑒𝑙𝑐ℎ𝑝
(𝑡) changes according to the outdoor temperature and the load factor
wherein the CHP system operates. The efficiency changes cause non-linearity in the mathematical model, which makes the optimization process more difficult. However, to achieve results as close to real conditions as possible, these changes should be considered. The heat in the exhaust gas of the CHP units is recovered through the HRU. The HRU is usually a gas to water heat exchanger, which transfers the heat from the gas side to the waterside. These units usually have a bypass unit [147]. On some occasions, such as low heating demand, the recovered heat cannot be utilized or the storage is full and the heat cannot be stored in the heat storage. In this situation, the heat is diverted to the ambient air through a bypass unit rather than passing it through the HRU. Practical examples of CHP systems with bypass units can be found in the data sheets of commercial products [148].
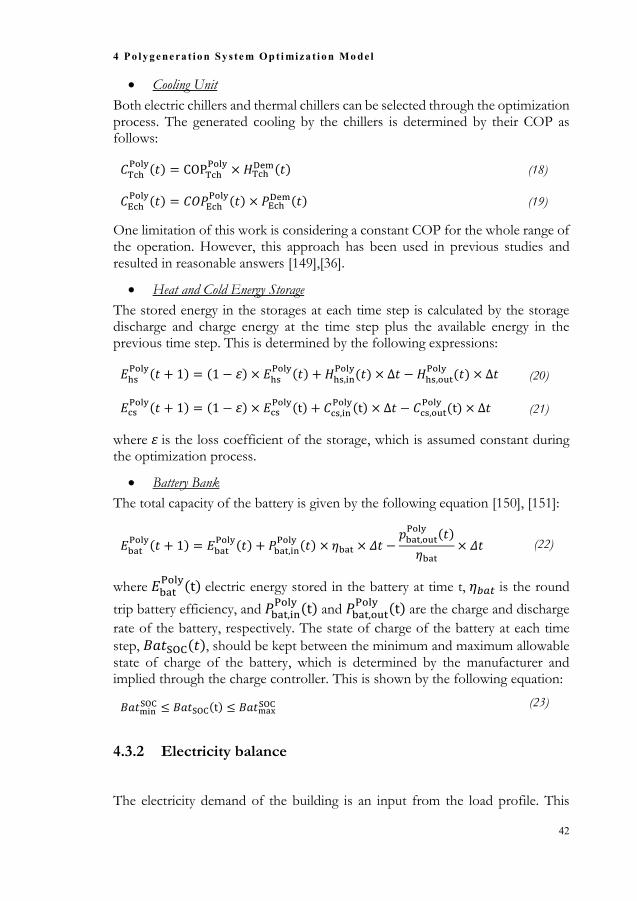
4 Po ly g enera t io n Sy s te m Op t i miza t io n Mo de l
42
Cooling Unit
Both electric chillers and thermal chillers can be selected through the optimization process. The generated cooling by the chillers is determined by their COP as follows:
𝐶TchPoly(𝑡) = COPTch
Poly× 𝐻Tch
Dem(𝑡) (18)
𝐶EchPoly(𝑡) = 𝐶𝑂𝑃Ech
Poly(𝑡) × 𝑃EchDem(𝑡) (19)
One limitation of this work is considering a constant COP for the whole range of the operation. However, this approach has been used in previous studies and resulted in reasonable answers [149],[36].
Heat and Cold Energy Storage
The stored energy in the storages at each time step is calculated by the storage discharge and charge energy at the time step plus the available energy in the previous time step. This is determined by the following expressions:
𝐸hsPoly(𝑡 + 1) = (1 − 𝜀) × 𝐸hs
Poly(𝑡) + 𝐻hs,inPoly
(𝑡) × Δ𝑡 − 𝐻hs,outPoly
(𝑡) × Δ𝑡 (20)
𝐸csPoly(𝑡 + 1) = (1 − 𝜀) × 𝐸cs
Poly(t) + 𝐶cs,inPoly(t) × Δ𝑡 − 𝐶cs,out
Poly(t) × Δ𝑡 (21)
where 𝜀 is the loss coefficient of the storage, which is assumed constant during the optimization process.
Battery Bank
The total capacity of the battery is given by the following equation [150], [151]:
𝐸batPoly(𝑡 + 1) = 𝐸bat
Poly(𝑡) + 𝑃bat,inPoly (𝑡) × 𝜂bat × 𝛥𝑡 −
𝑝bat,outPoly (𝑡)
𝜂bat
× 𝛥𝑡 (22)
where 𝐸batPoly(t) electric energy stored in the battery at time t, 𝜂𝑏𝑎𝑡 is the round
trip battery efficiency, and 𝑃bat,inPoly (t) and 𝑃bat,out
Poly (t) are the charge and discharge
rate of the battery, respectively. The state of charge of the battery at each time
step, 𝐵𝑎𝑡SOC(𝑡), should be kept between the minimum and maximum allowable state of charge of the battery, which is determined by the manufacturer and implied through the charge controller. This is shown by the following equation:
𝐵𝑎𝑡minSOC ≤ 𝐵𝑎𝑡SOC(t) ≤ 𝐵𝑎𝑡max
SOC (23)
4.3.2 Electricity balance
The electricity demand of the building is an input from the load profile. This

4 Po ly g enera t io n Sy s te m Op t i miza t io n Mo de l
43
demand is balanced by the imported/exported power from/to the grid, the generated power by the solar panels, wind turbines, and CHP units, the rate of charged/discharged power in the battery, and the excess power. The formulation of the power balance is given in the below equation:
𝑃dem = 𝑃g,impPoly
+ 𝑃pvPoly
+ 𝑃windPoly
+ 𝑃chpPoly
+ 𝑃bat,outPoly
− 𝑃g,expPoly
− 𝑃bat,inPoly
− 𝑃excessPoly
(24)
where
𝑃g,impPoly
and 𝑃g,expPoly
are the imported and exported electricity from/to the
grid, respectively;
𝑃pvPoly
, 𝑃windPoly
and 𝑃chpPoly
are generated power by the solar PV, wind
turbine, and CHP units, respectively;
𝑃dem is the total power demand including the electric chiller’s electricity demand and the parasitic power consumption in the system, for instance, fans and pumps, as well as the absorption chiller’s pump;
𝑃excessPoly
is the excess electricity if the electricity cannot be stored in the battery or be sold to the grid; and
𝑃bat,inPoly
and 𝑃bat,out Poly
are the battery charge and discharge rate.
4.3.3 Heating balance
The heating load is balanced by the supplied heat from the boiler, the CHP system, SHU, the rate of charged/discharge heat to/from the heat storage, and the excess heat. The formulation of the heat balance is given in the below equation:
𝐻dem = 𝐻boilerPoly
+ 𝐻chpPoly
+ 𝐻hs,outPoly
+ 𝐻shuPoly
− 𝐻hs,inPoly
− 𝐻excessPoly
(25)
where
𝐻boilerPoly
, 𝐻chpPoly
and 𝐻shuPoly
are the heat production by the auxiliary boiler,
CHP, and SHU, respectively;
𝐻dem is the total heating demand, including the thermal chiller’s heating demand; and
𝐻hs,outPoly
and 𝐻hs,inPoly
are the rate of discharge and charge, respectively, and
𝐻excessPoly
is the amount of excess heat.
𝐻dem includes the heating demand of the building and the thermal chiller. The heating demand of the building is provided in the load profile. However, the

4 Po ly g enera t io n Sy s te m Op t i miza t io n Mo de l
44
heating demand of the thermal chiller is based on the cooling demand that should be provided by the thermal chiller. It is calculated at each time step as explained in the operating strategy section (4.3.7).
4.3.4 Cooling balance
The cooling demand is balanced by the cooling production of the thermal and electric chillers and the rate of charge/discharge of the cold storage. The formulation of the cooling balance is given in the below equation:
𝐶dem = 𝐶EchPoly
+ 𝐶TchPoly
+ 𝐶cs,outPoly
− 𝐶cs,inPoly
(26)
where:
𝐶EchPoly
and 𝐶TchPoly
are the cooling production by the electric chiller and
thermal chiller, respectively, and 𝐶dem is the cooling demand of the building; and
𝐶cs,outPoly
and 𝐶cs,inPoly
are the rate of discharge and charge, respectively.
4.3.5 Fuel demand
In the polygeneration system, the total equivalent energy of the fuel consumption
(𝐹totPoly
) is given by the following equation:
𝐹totPoly
= 𝐹boilerPoly
+ 𝐹gridPoly
+ 𝐹chpPoly
(27)
where, 𝐹boilerPoly
and 𝐹chpPoly
are the equivalent energy of the fuel consumption in the
boiler and CHP units, respectively. The equivalent energy of the fuel consumption
of the imported power from the grid 𝑃g,impPoly
is given as follows:
𝐹gridPoly
=𝑃g,imp
Poly(𝑡) × Δ𝑡
𝜂el
grid× 𝜂dl
grid
(28)
where 𝜂dlgrid
is the efficiency of the grid distribution lines, which considers the
distribution and transmission losses, 𝜂elgrid
is the power plant’s efficiency, and
𝛥𝑡 is the simulation’s time step.

4 Po ly g enera t io n Sy s te m Op t i miza t io n Mo de l
45
4.3.6 CO2 emissions
The total emitted CO2 in the polygeneration system includes the CO2 emissions of the consumed fuel in the boiler and the CHP unit, and the CO2 emissions of the imported electricity from the grid. However, exported power to the grid can cause additional or avoided emissions if the generated electricity in the polygeneration system emits more or less CO2 emissions compared to the grid.
Therefore, the total CO2 emissions of the polygeneration system (𝐶𝑂2totPoly) can
be determined by the following equation:
𝐶𝑂2totPoly = 𝜇CO2,f
× (𝐹boilerPoly
+ 𝐹chpPoly
) + 𝜇CO2,g× 𝑃g,imp
Poly× Δt + 𝑃g,exp
Poly× (𝜇CO2,poly
− µCO2,g) × Δ𝑡 (29)
where µ𝐶𝑂2,𝑝𝑜𝑙𝑦is the specific emission factor of the generated electricity in the
polygeneration system, and 𝜇𝐶𝑂2,𝑓 and 𝜇𝐶𝑂2,𝑔
are the emission conversion factors
[136], [137] of the fuel and the grid, respectively.
The CHP unit is the only source of CO2 emissions in the electricity generation of the polygeneration system. Therefore, the specific emission factor of the
polygeneration system (𝜇CO2,poly,el) is the ratio of CO2 emissions linked to the
electricity generated by the CHP, divided by the total amount of power generated in the polygeneration system. In this relationship, the CO2 emissions linked to the electricity generation is the total amount of CHP fuel minus the amount of CHP
fuel accompanying the heat generation ( 𝐹chp,hPoly
). The value of the specific
emission factor can be calculated from the equation below:
𝜇CO2,poly,el= ∑
(𝐹chpPoly
− 𝐹chp,hPoly
) × 𝜇CO2,f
(𝑃pvPoly
+ 𝑃windPoly
+ 𝑃chpPoly
) × Δ𝑡
𝑡=8760
𝑡=1
(30)
Here, the excess heat is excluded in the calculation. Hence, a higher amount of unused heat causes a higher specific emission factor, and accordingly, it has a negative effect on the performance of the polygeneration system.
4.3.7 Operating strategy
The energy flow from various devices, the energy balance between supply and demand, excess power, and charging and discharging of the storage devices are some of the concerns in an operating strategy. In polygeneration systems, the dispatchability of the prime movers provides the possibility to incorporate renewable-based units such as PV modules, wind turbine, and SHU. Prime movers are operated to supply a base load to fulfill the electricity or the heat load, which are the most common operating strategies. Based on this, three main operating strategies are embedded in the model: FTL, FEL, and MBL as described

4 Po ly g enera t io n Sy s te m Op t i miza t io n Mo de l
46
below:
Following thermal load (FTL)
In the FTL, the prime mover will provide the equivalent heating demand, which includes the heating demand of the thermal chiller and other heating demands in the building [48].
Following electric load (FEL)
In the FEL, the prime mover will provide the equivalent electric demand, which includes the electricity demand of the electric chiller and other electric demands in the building [48]. This strategy is shown in Figure 17 (a) which exemplifies a relationship between the electricity demand and prime mover electricity generation. In this figure, the operation of the prime mover, which is a CHP unit with a rated power of 400 kWel, is shown. The only power generation units in this example is a CHP unit.
Modified base load (MBL)
The MBL is a FEL strategy in its nature. In this strategy, the generated electricity by the prime mover is restricted to a base load and the amount of power demand, whichever is the lowest. This implies that if the electricity demand is more than the base load, which is the rated power of the prime movers, the rest of the electricity demand will be supplied from the grid or from other parts of the polygeneration system. However, if the electricity demand is lower than the base load, the prime mover follows the electricity demand. The MBL avoids the excess power and it is useful if the excess power cannot be sold to the grid. In Figure 17(b), the operation of the prime mover, which is a CHP unit with a rated power of 200 kWel, is shown. The only power generation units in this example is the CHP unit. When using the MBL, usually there is an opportunity to work with a smaller installed capacity of the prime mover.
(a) (b) Figure 17 FEL operating strategy of a 400 kWel CHP unit (a) and MBL operating strategy for a
200 kWel CHP unit (b)
The operation of the polygeneration system and the energy flow within the system is managed by the operating strategies. The working principles of the operating
0
50
100
150
200
250
300
350
400
1 3 5 7 9 11 13 15 17 19 21 23
Po
we
r (k
W)
Time (hour)
FEL OPERATING STRATEGY
Electricity demand P_chp
0
50
100
150
200
250
300
350
400
1 3 5 7 9 11 13 15 17 19 21 23
Po
we
r (k
W)
Time (hour)
MBL OPERATING STRATEGY
Electricity demand P_chp

4 Po ly g enera t io n Sy s te m Op t i miza t io n Mo de l
47
strategies are established according to the design objectives. As previously mentioned, the model is aimed for designing a semi–self-sufficient energy system that maximizes the utilization of renewable energy sources and minimizes the fossil fuel consumption in the model. The grid has a balancing role and it is used when the battery is no sufficient or there is no battery in the system. The energy flow model is constrained to the working principles of the operating strategies as described in the following steps:
1 Determine the generated heat and electricity by the renewable sources, which
are 𝑃pvPoly
, 𝑃wdPoly
and 𝐻shuPoly
.
2 In all the operating strategies, the priority is given to the generated heat and power by the renewable inputs. Hence, the generated renewable driven heat and power is deducted from the heat and electricity demands. The remaining demands are provided through the following the steps:
In all the strategies, if there is a cooling demand, first discharge the cold storage. The rest of the cooling load will be supplied by an electric chiller
and/or a thermal chiller based on the cooling demand ratio, 𝐶dem,ratio,
which is one of the decision variables as clarified in Section 4.5.1. This identifies the total heating and electricity demand comprising the demand of the chillers.
FTL strategy: If there is a heating demand, first discharge the heat storage. Next, operate the CHP system to cover the rest of the heating demand. In the case of excess heat, initially utilize it for cooling production to be used directly or to be stored in the storage. In the case of a heat shortage, operate the boiler. In the case of excess power, initially charge the battery, and then export the excess power to the grid. In the case of a power deficit, initially discharge the battery. Afterward, import the remaining demand from the grid.
FEL strategy: If there is electricity demand, first discharge the battery if applicable. Next, operate the CHP system to cover the remaining power demand. In the case of excess power, utilize it for cooling production if applicable. Afterward, charge the battery and export it to the grid if there is excess power. If there is a power deficit, initially discharge the battery. For the remaining power, use the utility grid. Utilize the recovered heat from the CHP units to meet the heating demand. In the case of a heat shortage, initially use the heat storage and then operate the boiler.
MBL strategy: If there is a power demand, use the electric storage if applicable. Then, operate the CHP at full load to generate a base electric load. However, restrict the power production to the electricity demand. In the case of surplus electricity, first utilize it for cooling production and/or charge the cold storage if applicable. Then store the remaining power to the battery. As the last option, send the electricity to the utility grid. If there is a power shortage, first utilize the battery and then use the

4 Po ly g enera t io n Sy s te m Op t i miza t io n Mo de l
48
utility grid. If there is a heat shortage, first use the heat storage and then operate the boiler.
For more clarification, flow diagrams of the FEL and FTL strategies are illustrated in Figure 18 and Figure 19 . Initially, if there is a cooling demand, the cold storage is utilized if applicable. The rest of the cooling demand will be supplied by an electric and/or a thermal chiller. This identifies the total thermal and electricity demand, taking into account of the demand of the chillers.
Figure 18 Control flow diagram of the FEL operating strategy

4 Po ly g enera t io n Sy s te m Op t i miza t io n Mo de l
49
Figure 19 Flow diagram of the FTL operating strategy
To increase the performance of the system and to decrease the excess heat or power during the cooling season, both a thermal and an electrical chiller along with a cold storage have been introduced into the model. Surplus heat will be used for cooling purposes through a thermal chiller. To determine the size of each
chiller, the variable “cooling demand ratio (𝐶dem_ratio),” which is the ratio of
cooling demand provided by the electric chiller to the total cooling demand that should be provided by the chillers at each time step, has been introduced. This variable is explained in Section 4.5.1.

4 Po ly g enera t io n Sy s te m Op t i miza t io n Mo de l
50
4.4 Performance Evaluation Criteria
Performance evaluation of polygeneration systems is frequently carried out by comparing its performance with a reference system in terms of energy, economy, and the environment―the so called 3-E analysis [134]. This method has been used in the present study to evaluate the performance of the proposed polygeneration system.
4.4.1 Energy
The fuel-saving ratio (FSR), also known as the primary energy-saving ratio (PESR) in some studies, is a metric used to perform a comparative analysis between the polygeneration system and the reference system regarding fuel consumption. This is given as follows:
𝐹𝑆𝑅 =𝐹tot
Ref − 𝐹totPoly
𝐹totRef
= 1 −𝐹tot
Poly
𝐹totRef
,
(31)
where, 𝐹totRef and 𝐹tot
Poly are the equivalent energy of the fuel consumption of the
reference and the polygeneration energy system, respectively.
An important issue while using a reference method for fuel saving evaluation is the proper determination of the reference system characteristics. These characteristics, including the power plant’s efficiency, the fuel type utilized in the system (coal, gas, etc.), the efficiency of the distribution, and the transformation network and price of the provided power from the grid, can significantly affect the FSR. Therefore, in each case study, choosing realistic reference characteristics is critical to achieve the correct conclusion. The characteristics should be identified in each case study based on the available energy system and the energy market in the region.
4.4.2 Environment
In this study, CO2 emissions are considered an environmental index, because of their importance in energy system analysis and benefit in the energy market. For example, carbon capturing or carbon trading are already implemented in many countries. However, other emissions can be considered in future studies. The CO2 emission reduction ratio (CO2ERR) has been allocated as an environmental index in this study. An emission conversion factor is utilized to approximate the value of the CO2 emissions of the reference system as given below:

4 Po ly g enera t io n Sy s te m Op t i miza t io n Mo de l
51
CO2ERR =𝐶𝑂2tot
Ref − 𝐶𝑂2totPoly
𝐶𝑂2totRef
= 1 −𝐶𝑂2tot
Poly
𝐶𝑂2totRef
, (32)
where, 𝐶𝑂2totRef and 𝐶𝑂2tot
Poly are the emitted CO2 emissions by the reference and
the polygeneration energy systems, respectively.
4.4.3 Economy
The financial feasibility of a project can be estimated through several methods using various metrics. The most frequently used metrics are internal rate of return (IRR), NPV, annualized total cost (ATC), and PBP [152]. None of these criteria can be used for an investment decision independently, and a combination of two or more metrics is needed for the economic analysis [152],[153]. As an example, the economy of the project after the break-even point is not clear using the PBP, and NPV can provide additional insights. In comparing investments with different initial costs and lifetimes, the IRR is more suitable for competitive analysis since it can be used for ranking the investments [152]. The metrics used in the present work are briefly described in this section. All of these metrics are used in the economic evaluation of the polygeneration system during the post-processing stage. However, the ATC is the only metric implemented in the objective function of the optimization problem as explained in Section 4.5.
Net Present Value (NPV)
NPV is the differentiation between the summation of the discounted annualized cash flow during a project’s lifetime and the total initial capital cost (ICC). All the expenses and revenues during the lifetime of the project are included in the NPV. The NPV can be calculated from the following expression:
𝑁𝑃𝑉 = −𝐼𝐶𝐶 + ∑ 𝑁𝐶𝐹𝑛Poly
× 𝑃𝑉𝐹(𝑛),
𝑁
𝑛=1
(33)
where PVF(n), 𝑁𝐶𝐹𝑛Poly
, and 𝐼𝐶𝐶 are the present value factors at each time period (N), the net cash flow, and the capital investment. PVF is implemented to identify the present value of the cash flow of the project in the future, and it is calculated by the following equation:
𝑃𝑉𝐹(𝑛) =1
(1 + 𝑖)^𝑛 , (34)
where i is the real interest rate.
The real interest rate considers the inflation rate (fr) for a given nominal interest

4 Po ly g enera t io n Sy s te m Op t i miza t io n Mo de l
52
rate (i’) and is given as follows:
𝑖 =𝑖′ − 𝑓𝑟
1 + 𝑓𝑟 (35)
Annualized Total Cost (ATC)
The ATC includes all the expenses during the lifetime of the project as expressed below:
𝐴𝑇𝐶 = Pimp,costgrid
−𝑃exp,cost grid
+ 𝐶𝑜𝑠𝑡cap,a + 𝐶𝑜𝑠𝑡om,a + 𝐶𝑜𝑠𝑡rep,a (36)
where 𝑃imp,costgrid
and 𝑃exp,cost grid
are the annual cost of purchasing/selling electricity
from/to the grid, and 𝐶𝑜𝑠𝑡cap,a, 𝐶𝑜𝑠𝑡om,a, 𝐶𝑜𝑠𝑡rep,a are the annualized capital
cost, O&M costs, and replacement cost, respectively. 𝐶𝑜𝑠𝑡cap,a is determined as
follows:
𝐶cap,a = 𝐶𝑅𝐹 × 𝐼𝐶𝐶 (37)
where 𝐶𝑅𝐹 is the capital recovery factor and is used to determine the annuity for a specific period, such as project lifetime (Nproj). The value of the CRF is given as follows:
𝐶𝑅𝐹 =𝑖 ∗ (1 + 𝑖)𝑁𝑝𝑟𝑜𝑗
(1 + 𝑖)𝑁𝑝𝑟𝑜𝑗 − 1 (38)
Internal Rate of Return (IRR)
IRR is another metric utilized to investigate the economic evaluation of a project. Usually, a project with a higher IRR is more appealing for investors. The value of the IRR should be at least above the real interest rate for its economic feasibility. The IRR is determined by the following equation:
∑𝑁𝐶𝐹𝑛
Poly
(1 + 𝐼𝑅𝑅)𝑛
𝑁
𝑛=1
− 𝐼𝐶𝐶 = 0 (39)
where, 𝑁𝐶𝐹𝑛Poly
is the net cash flow at year number n.

4 Po ly g enera t io n Sy s te m Op t i miza t io n Mo de l
53
Payback Period (PBP)
PBP is the number of the year in which the project attains the breakeven point. Usually, a shorter PBP is more appealing in a project; however, this metric should be used along with the NPV to take into account the cash flows after the breakeven point. To determine the PBP, the NPV equation should be equated to zero as given below:
∑ 𝑁𝐶𝐹𝑛Poly
∗ 𝑃𝑉𝐹(𝑛) − 𝐼𝐶𝐶 = 0
𝑁
𝑛=1
(40)
Annualized Total Cost-Saving Ratio (ATCSR)
For an economic comparison between the polygeneration system and the reference system, the ATCSR is formulated as follows:
𝐴𝑇𝐶𝑆𝑅 = 1 −𝐴𝑇𝐶tot
Poly
𝐴𝑇𝐶totRef
(41)
where 𝐴𝑇𝐶totRef and 𝐴𝑇𝐶tot
Poly are the ATC of the reference and the polygeneration
system during its lifetime.
4.5 Optimization Problem Formulation
The major parts of the optimization tool are presented in Figure 20. The model comprises three main parts: the energy flow model, the performance analysis, and the PSO algorithm. In the energy flow model, the thermodynamic model and operating strategies are included. The energetic, economic, and environmental performance of the system in terms of energy, economy, and the environment relative to a reference system is incorporated into the performance analysis section. The weather and load demand data as well as specifications of the reference and polygeneration system and related costs are the main inputs to the model. The optimization method is based on the PSO algorithm, which is shown as the shaded area in Figure 20. The optimization begins with a number of initial random populations (swarms) of decision variables, which are the components’ sizes and cooling ratio as explained in Section 4.5.1. These random populations will be delivered to the energy flow model for feasibility assessment. The feasible solutions will be determined in the energy flow model and will be sent to the performance analysis part. The value of the cost function (objective function) will be calculated based on the evaluation criteria for each population, and it will be

4 Po ly g enera t io n Sy s te m Op t i miza t io n Mo de l
54
sent to the optimization algorithm.
For each population, the solution will be archived as personal best (Pbest). In each iteration, the best answer of all time, called global best (Gbest), will be saved. These two values will be used to update the populations. This process will recur until the stop criteria are reached. A stop criterion is usually identified by a reasonable deviation of each decision variable from the global minima in all of the populations. In the case studies, all the populations should converge to the global minima with a deviation tolerance of 1% in each decision variable. The search mechanism of the PSO algorithm is presented in Section3.2.1. More details on the PSO algorithm can be found in the original work of Kennedy and Eberhardt [135].
The economy plays a significant role in the energy market, and most of the decisions on whether to invest in a project are based on its economic feasibility. However, during the last decades, environmental issues have been highlighted, and many new regulations in the energy market consider the environmental impact of an energy system an important deciding factor. In order to fulfil the economic as well as the energetic and environmental criteria (3-E analysis), all three are included in the objective function. These three ratios (FSR, CO2ERR, and ATCSR) are included in the cost function using a weighting factor method and formulated an integrated saving criterion (ISR) as defined in equation (42). The objective function is defined as a minimization problem to increase the value of ISR as expressed in equation (43).
𝐼𝑆𝑅 = 𝑤1 ∗ 𝐹𝑆𝑅 + 𝑤2 ∗ 𝐶𝑂2𝐸𝑅𝑅 + 𝑤3 ∗ 𝐴𝑇𝐶𝑆𝑅 (42)
𝑂𝑏𝑗𝑒𝑐𝑡𝑖𝑣𝑒 𝑓𝑢𝑛𝑐𝑡𝑖𝑜𝑛 = 𝑀𝑖𝑛𝑖𝑚𝑖𝑧𝑒 (1
𝐼𝑆𝑅) , (43)
where 𝑤1, 𝑤2, and 𝑤3 are the weighting factor for each criterion.
In the optimization model, by default, a weighting factor of 0.5 is given to the economy since it is an important decision-making criterion and the weighting factor for the other criteria is 0.25. However, to increase the impact of one criterion, a higher weighting factor can be given to that criterion. For example, if a higher weight of FSR is preferred while the others are assumed to have an equal
weight, the value of 𝑤1 could be 0.5 and the other weight factors would then be
0.25.

4 Po ly g enera t io n Sy s te m Op t i miza t io n Mo de l
55
Figure 20 Flowchart of interaction between various parts of the model
4.5.1 Decision variables
The decision-making variables include the number and size of each component
in the polygeneration system and the cooling demand ratio (𝐶𝑑𝑒𝑚,𝑟𝑎𝑡𝑖𝑜). The cooling
demand ratio is the ratio of cooling supplied by the electric chiller to the total cooling demand in the building at each time step. This variable is constant and it varies between zero and one. Assuming a constant cooling demand is ratio is

4 Po ly g enera t io n Sy s te m Op t i miza t io n Mo de l
56
practiced in other studies, ensuring sensible and valid solutions [77], [78]. The surplus power and heat is utilized used for cooling purposes through the electric and thermal chillers, respectively. Hence, there might be extra cooling produced at each time step, which is not used immediately in the building. This produced extra cooling will be stored in the cold storage. Therefore, the ratio of total cooling production by the electric chiller to total cooling production at each time step
might vary. This ratio is called cooling production ratio (𝐶𝑝𝑟𝑜𝑑,𝑟𝑎𝑡𝑖𝑜).
4.5.2 Constraints
The optimization problem has the following constraints:
Considering the energy balance, the system should be able to fulfill the heating, cooling, and power demand at each time step; therefore, the supply energy should be more than the demand at any time step as give below:
𝐻Sup(𝑡) ≥ 𝐻Dem(𝑡)
𝑃Sup(𝑡) ≥ 𝑃Dem(𝑡)
𝐶Sup(𝑡) ≥ 𝐶Dem(𝑡)
(44)
where the subscripts Sup and Dem mean supply and demand.
Since the part-load operation of the CHP can affect its efficiency, emissions, and lifetime, its operation is constrained to the minimum part-load factor according to the manufacturer’s recommendation:
min 𝑃𝐿chp ≤ 𝑃𝐿chpPoly(𝑡) ≤ 1 ,
(45)
where min 𝑃𝐿chp is the minimum allowable part-load factor, and 𝑃𝐿chpPoly(t) is the
part-load factor at time step t.
The optimization is constrained to the specifications of the embedded operating strategies in the energy flow model. The energy flows in the operating strategy are explained in more detail in Section 4.3.7.

5 Po ly g enera t io n Mo de l Ver i f i ca t io n
57
5 Polygeneration Model Verification3
Due to the lack of an experimental setup, validation through comparison of the simulation output and the behavior of a real system was not possible. Furthermore, considering available models in the literature, no exact system was found that was simulated and appropriately validated. Therefore, a combination of appropriate techniques has been used for validation and verification (V&V) purposes. The validation intends to confirm that the conceptual model can resemble a real system. Meanwhile, the aim of the verification is to ensure that the implementation of the computer program is correct and the simulation is performed as intended. V&V of simulation models is broadly explored in various literature sources [154]–[158]. In the present work, some of the applicable techniques mentioned by Sargent [158], for example, have been used to validate and verify the model and its functionality. The simulation output was investigated with consideration of the following:
It should be ensured that the basic assumption of the conceptual model and the equation used in the model are accepted and validated in the scientific field.
It should be investigated whether the logic of the model is correct. This is done by following the behavior of various specific entities during the simulation. In this study, the operational graphic of the power/heat/cooling production by each component over 24 hours is used for better observation during the verification process.
It should be ascertained that simulating extreme conditions results in sensible and valid outputs. In this study, this technique was used for validation of the optimization algorithm. An extreme condition can be, for example, assuming a very high price for a component and observing how the optimization results are affected. By this assumption, the component should not be chosen during the optimization process.
The examination should show that the same relationships occur in the model as in the real world. Throughout the sensitivity analysis (parameter variability), the effects of changing input and internal values on the behavior of the model and the output values are observed. In this study, this technique has been used for validation of the optimization model by performing the optimization for six design scenarios, which are differentiated from each other by their input variables.
3 This chapter is based on Paper III.

5 Po ly g enera t io n Mo de l Ver i f i ca t io n
58
In this section, first the results of the verification and validation of the energy flow model (system level) and component level (sub-models) are presented. Afterward, the validation of the optimization algorithm is investigated through observation of the behavior of the model for the proposed scenarios. In order to perform the V&V systematically, the following matters should be investigated:
Component model (sub-models) - If the output of the model for each component (sub-models) is
as it is expected based on the theory (conceptual model).
Energy flow model (system level) - If the power, heating, and cooling balance is fulfilled at each time
step. - If the operation of each component is aligned with the defined
operating strategy. - If the operation of the system is based on the defined operating
strategy.
Optimization algorithm - If the optimal solution for an extreme conditions test is rational. - If the response of the optimization algorithm to the systematic
alteration of the input variables is sensible and valid.
5.1 Scenario Description
To conduct the validation and verification, a test case was defined and the behavior of the simulation output for a representative day was investigated both quantitatively and qualitatively. The case study is a hypothetical residential building complex comprised of four buildings, each with 40 single-family apartments in the Italian climate zone E [159]. The load demand profile of the building, which is based on a typical European family house in the Italian climate zone E [130], [160] was synthesized using the data available in another study presented by Barbieri et al. [130], Bianchi et al. [160], and the data from the project EURECO [161]. The peak heat, power, and cooling demands of the building are 1,510 kWth, 320 kWel, and 480 kWc, respectively. The model is used for a one-year operation with a one-hour time step (8,760 hours). The amount of aggregated electricity, heating, and cooling demands annually are 1.7 GWhel , 1.9 GWhth, and 346 MWhc, respectively [162]. More details of the case study and its specifications can be found in the appended Paper III.
5.2 Optimization Model
One of the techniques used for V&V of the optimization algorithm is the sensitivity analysis. Systematic changes of the input variables should give valid and sensible solutions, and the direction of the alterations should be as expected in a real system. In order to test the optimization algorithm, six optimization design

5 Po ly g enera t io n Mo de l Ver i f i ca t io n
59
scenarios have been defined. The configurations of the six optimization scenarios and the reference system are shown in Table 4.
Table 4 System Configuration for Proposed Scenarios and the Reference System
Components
Ref
Scenarios
1 2 3 4 5 6
CHP unit (natural gas-driven) - x x x x x x
Boiler (natural gas-driven) x x x x x x x
El from/to grid x x x x x x x
Electric chiller x x x x x x x
Thermal chiller - - - x x x x
Heat storage (HS) - - x x x x x
Cold storage (CS) - - - x x x x
Solar heating unit (SHU) - - - - x x x
Solar PV - - - - - x x
Wind turbine - - - - - - x
Battery - - - - - - x
In the reference scenario, a boiler provides the heating demand, and the electricity from the grid provides the power. Scenario 1 is similar to the reference scenario, but a CHP unit is added to the system. In scenario 2, a heat storage is added to the system, and in scenario 3, both a thermal cooling unit and a cold storage are included. Scenarios 4 to 6 include all the components of scenario 3; however, they differ in terms of the existence of solar PV units and SHU, as indicated in Table 4. The optimal solutions for the scenarios are shown in Table 5.
Table 5 Optimal Solutions of the Design Scenarios
Components Scenarios
1 2 3 4 5 6
PV unit (kWel) - - - - 460 460
Wind (kWel) - - - - - -
CHP (kWel) 200 200 200 200 200 200
Boiler (kWth) 1,245 1,245 1,245 1,245 1,245 1,245
Battery (kWel) - - - - - -
Electric chiller (kWc) 481 481 141 - 182 182
Thermal chiller (kWc) - - 225 253 195 195
Cooling demand ratio (-) 1.0 1.0 0.4 0.0 0.5 0.5
Solar thermal (m2) - - - 137 600 600
Heat storage (kWh) - 1,605 1,618 1,622 1,572 1,572
Cold storage (kWh) - - 1,859 1,726 2,068 2,068
To implement the extreme conditions test, a very large number is assigned to the cost of PV panels, SHU, and the thermal chiller. In theory, using this condition
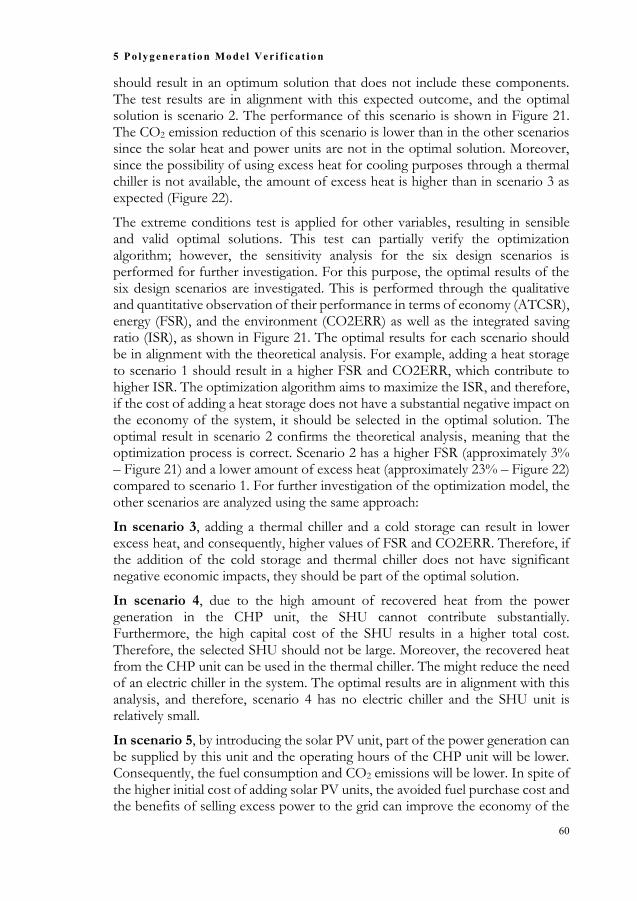
5 Po ly g enera t io n Mo de l Ver i f i ca t io n
60
should result in an optimum solution that does not include these components. The test results are in alignment with this expected outcome, and the optimal solution is scenario 2. The performance of this scenario is shown in Figure 21. The CO2 emission reduction of this scenario is lower than in the other scenarios since the solar heat and power units are not in the optimal solution. Moreover, since the possibility of using excess heat for cooling purposes through a thermal chiller is not available, the amount of excess heat is higher than in scenario 3 as expected (Figure 22).
The extreme conditions test is applied for other variables, resulting in sensible and valid optimal solutions. This test can partially verify the optimization algorithm; however, the sensitivity analysis for the six design scenarios is performed for further investigation. For this purpose, the optimal results of the six design scenarios are investigated. This is performed through the qualitative and quantitative observation of their performance in terms of economy (ATCSR), energy (FSR), and the environment (CO2ERR) as well as the integrated saving ratio (ISR), as shown in Figure 21. The optimal results for each scenario should be in alignment with the theoretical analysis. For example, adding a heat storage to scenario 1 should result in a higher FSR and CO2ERR, which contribute to higher ISR. The optimization algorithm aims to maximize the ISR, and therefore, if the cost of adding a heat storage does not have a substantial negative impact on the economy of the system, it should be selected in the optimal solution. The optimal result in scenario 2 confirms the theoretical analysis, meaning that the optimization process is correct. Scenario 2 has a higher FSR (approximately 3% – Figure 21) and a lower amount of excess heat (approximately 23% – Figure 22) compared to scenario 1. For further investigation of the optimization model, the other scenarios are analyzed using the same approach:
In scenario 3, adding a thermal chiller and a cold storage can result in lower excess heat, and consequently, higher values of FSR and CO2ERR. Therefore, if the addition of the cold storage and thermal chiller does not have significant negative economic impacts, they should be part of the optimal solution.
In scenario 4, due to the high amount of recovered heat from the power generation in the CHP unit, the SHU cannot contribute substantially. Furthermore, the high capital cost of the SHU results in a higher total cost. Therefore, the selected SHU should not be large. Moreover, the recovered heat from the CHP unit can be used in the thermal chiller. The might reduce the need of an electric chiller in the system. The optimal results are in alignment with this analysis, and therefore, scenario 4 has no electric chiller and the SHU unit is relatively small.
In scenario 5, by introducing the solar PV unit, part of the power generation can be supplied by this unit and the operating hours of the CHP unit will be lower. Consequently, the fuel consumption and CO2 emissions will be lower. In spite of the higher initial cost of adding solar PV units, the avoided fuel purchase cost and the benefits of selling excess power to the grid can improve the economy of the

5 Po ly g enera t io n Mo de l Ver i f i ca t io n
61
system. This can maximize the ISR, and therefore, solar PV units are expected to be part of the optimal solution as per the results of this scenario.
In scenario 6, wind turbine and battery do not appear in the optimal solution. This due to the high costs of small wind turbine and the relatively, low wind speed in the region. In case of battery, it is because of its high capital cost as well as the MBL operating strategy. In the MBL operating strategy solar modules are the only sources of excess power and therefore, adding a battery does not increase the ISR.
As a general observation, shifting from scenario 1 to scenario 6 led to a higher value of the FSR (from 11% to 37%), CO2ERR (from 5% and 35%), and ATCSR (from 3-19%) with the lowest and highest values for scenario 1 and scenario 6, respectively.
Figure 21 Annual fuel-saving ratio (FSR), CO2 emission reduction ratio (CO2ERR), integrated
saving ratio (ISR), and annualized total cost-saving ratio (ATCSR) of the optimization scenarios
Figure 22 Excess heat decrease in each scenario in relation to the first scenario
With this approach, the verification of the optimization algorithm was carried out through the extreme conditions test and experimenting with systematic alterations of the optimization variables (six design scenarios). The model output was examined to investigate if the optimization process led to reasonable and expected
0
5
10
15
20
25
30
35
40FSR CO2ERR ISR ATCSR
Savi
ng
rati
o(%
)
Scen. 1 Scen. 2 Scen. 3 Scen. 4 Scen. 5 Scen. 6
0
10
20
30
40
50
60
70
80
Scen. 2 Scen. 3 Scen. 4 Scen. 5 Scen. 6
Exce
ss h
eat
re
du
ctio
n (
%)

5 Po ly g enera t io n Mo de l Ver i f i ca t io n
62
results. For instance, in scenario 2, adding the heat storage resulted in lower fuel consumption (around 3%) compared to scenario 1; in scenario 3, adding a thermal chiller reduced the excess heat (around 34%) compared to scenario 2. Thus, the reduction and escalation led to the correct direction of the optimization process (qualitative validation). However, the mentioned values do not comply with the quantitative validation, since the amount of the increase or decrease cannot be proven correct due to the lack of reference data, which is an essential part of a quantitative validation.
5.3 Energy Flow Model
In this section, the obtained optimal solution from the test case is used to verify the energy flow model at the component and system levels.
5.3.1 Component level
For all of the components in the model, it is shown that the conceptual model is based on valid equations, which are well known in the literature [139], [141], [146], [150], [151], [163], [164]. These equations are described in Section 4.3.1. In order to verify the correct implementation of these equations in the simulation program (verification), the output from the model for each component should be compared with the theoretical output for the heat and power generation units. In this work, an error below 5% is assumed acceptable since very accurate data from the reference units was not available. For the CHP model, the operational behavior of a commercial micro gas turbine (Capstone 200 [54]) was compared with the model output. For other units, the outcome of the model was compared with theoretical calculation, which confirms the correct implementation of the mathematical equations in the simulation program.
CHP verification:
The CHP model is verified by comparing the model output with the Capstone 200 operated in standard conditions [54]. The fuel flow energy rate and efficiency for the CHP operated at 30% and 100% load factors for the model and the real system are shown in Table 6. As shown in this table, the errors are between 2% and 4%, which are in an acceptable range.
Table 6 CHP Heating Model Verification and Validation
Parameter Model output
Capstone data sheet [54]
Error (%)
Load factor (%) 100 30 100 30 100 30
Fuel Flow Energy Rate (kW LHV)
629 221.5 609.3 226.2 3% 2%
Efficiency (%) 31.8 27.1% 33% 26.4 3.6% 2.6%

5 Po ly g enera t io n Mo de l Ver i f i ca t io n
63
Solar PV unit:
In standard conditions (cell temperature of 25 °C and an insolation of 1 kW/m2), the power output of a solar PV panel unit with 16% efficiency should be around 0.16 kWel/m2 in theory. The output of the model for the same specification is 0.154 kWel/m2 (3.7% error), which is within the acceptable range and verifies the implementation of the solar PV panel model. Increasing the ambient temperature and solar radiation increases the cell temperature. This temperature increase has an adverse effect on the efficiency of the solar panels.
Solar heating unit (SHU):
A technology roadmap for thermal heating and cooling was published by the international energy agency (IEA)[165]. In this roadmap, it is mentioned that the Thermal Industry Federation (ESTIF) and the International Energy Agency Solar Heating and Cooling (IEA SHC) Programme decided to use a factor of 0.7 kWth/m2 to calculate the nominal capacity of installed solar heating collectors [165]. The heat output of the model for 1 m2 of the SHU unit at 25 °C and the solar irradiation of 1 kW/m2 is approximately 0.7 kWth, which is similar to the assumption mentioned in the above roadmap.
Boiler unit:
The size of the boiler for the optimal solution is 1,245 kWth. Considering the boiler efficiency of 80% and the heat loss of 10%, the heat output and the equivalent rate of fuel energy consumption of the boiler running at full load should be 1,245 kWth and 1,729 kWh, respectively. The model output of the boiler at full load operation is exactly the same as the theoretical output, which verifies the implementation of the boiler model.
Wind Turbine:
The output of the wind turbine was evaluated at four wind speed ranges: below the cut-in speed, above the cut-in speed, at the rated speed, and above the cutting speed. The results showed the correct implementation of the mathematical model.
The above analysis verifies the correct implementation of the mathematical model of the heat and power generation units in the simulation program.
5.3.2 System level
To verify the system model, the energy flow model is examined through the careful observation of its hourly operational behavior, considering the power, heating, and cooling flow for the test case in a representative day. Since scenario 6 includes more components, it was chosen to perform this analysis. The operation of solar heating and power units, thermal chiller, and cold storage can be shown during the summer, and therefore, June 15 is chosen as the

5 Po ly g enera t io n Mo de l Ver i f i ca t i o n
64
representative day. The power, heating, and cooling flows for the representative day are illustrated in Figure 23, Figure 24, and Figure 25, respectively. At each time step, the fulfillment of the energy balance, operating strategy, and model constraints were checked.
Figure 23 Power flows for the representative day: power from/to the grid (P_grid_imp/ P_grid_exp),
total power demand (P_dem_tot), generated power by the CHP and solar PV (P_chp and P_pv), and
utilized excess power for extra cooling production (P_to_Ech_extra)
As mentioned previously, the model aims to maximize the usage of renewable energy. Therefore, if there is enough power or heat from the solar energy, the CHP will not be operated (e.g., at 10:00 in Figure 23). Furthermore, the operating strategy of the test case is based on the MBL, meaning that the CHP follows the power demand as long as the power demand is below the base load that is equal to the rating power of the CHP, which is 200 kWel in this case study (e.g., at 02:00 and 22:00 in Figure 23). If the electricity demand is above the base load, the remaining power is imported from the grid (e.g., at 22:00 in Figure 23). Based on the operating strategy, the excess power should be used to produce extra cooling that is to be stored in the cold storage (e.g., at 12:00 & 17:00 in Figure 23). As shown in Figure 25, the extra chilling produced by the electric chiller is stored in the cold storage at these hours. If the excess power cannot be used for cooling purposes or is being stored in the battery, it will be exported to the grid (at 11:00–16:00 in Figure 23).
-200
-100
0
100
200
300
400
1 2 3 4 5 6 7 8 9 10 11 12 13 14 15 16 17 18 19 20 21 22 23 24Po
wer
(kW
)
Time (hour)
POWER FLOW - JUNE
P_dem_tot P_chp P_pvP_grid_imp P_grid_exp P_ext_Ech

5 Po ly g enera t io n Mo de l Ver i f i ca t io n
65
Figure 24 Heat flow for the representative day: supplied heat by the CHP and solar thermal units
(H_chp, H_shu), heating demand (H_dem_h), heat used for cooling purposes (H_for_cooling), and
heat flow to/from the storage (H_hs_in, H_hs_out)
The cooling demand is initially supplied by the cold storage. The remaining cooling demand is covered by the electric chiller and the thermal chiller (e.g., at 1:00 & 22:00 in Figure 25). The recovered heat from the CHP is first used for the heating demand, including the heating demand of the building (e.g., at 8:00 in Figure 24) as well as the thermal chiller (e.g., at 01:00 in Figure 25). The surplus heat is utilized for cooling purposes and the extra cooling produced is stored in the cold storage (at 8:00 & 12:00 in Figure 25).
-200
-100
0
100
200
300
400
1 2 3 4 5 6 7 8 9 10 11 12 13 14 15 16 17 18 19 20 21 22 23 24
Hea
t (k
W)
Time (hours)
HEAT FLOW - JUNE
H_chp H_sh H_hs_out H_hs_in H_for_cooling H_dem_h

5 Po ly g enera t io n Mo de l Ver i f i ca t io n
66
Figure 25 Cooling flow for the representative day: cooling demand (C_dem), the cooling to/from the cold
storage (C_cs_in, C_cs_out), and supplied cooling by the electric and thermal chiller (C_prod_Ech,
C_prod_Tch)
5.4 Feasibility evaluation
To demonstrate the reliability of the proposed optimization model and its potential as well as present the economic viability of a small-scale decentralized polygeneration system, the economy of each scenario was evaluated using the PBP and IRR as presented in Table 7. The first scenario achieved a PBP of nine years. Incorporating a heat storage had substantial economic benefits and the payback time was reduced to seven years. Integrating a cold storage and thermal chiller and cold storage (scenario 3) not only had environmental advantages but also improved the economy of the system (PBP of six years). System configuration in scenario 4 is similar to scenario 3 and therefore, the differences between the economy of these two scenarios are negligible.
Table 7 Economy of the Design Scenarios
Economic metrics Scenario
1 2 3 4 5 6
Payback period (year) 9 7 6 6 8 8
Internal rate of return (%) 9.7 14.1 16.4 16.8 10.1 10.1
The PBP of scenario 5 remains close to the PBP of scenarios 1 and 2 while showing substantial environmental benefits in comparison with the previous scenarios. The high initial costs of the PV modules and solar thermal units were almost canceled out by the avoided costs of electricity and fuel purchases, which are comparatively high in Italy. The high price of electricity in the Italian market
C_dem
C_prod_Ech
C_prod_Tch
-500
-300
-100
100
300
500
1 2 3 4 5 6 7 8 9 10 11 12 13 14 15 16 17 18 19 20 21 22 23 24
Co
olin
g kW
)
Time (hours)
COOLING FLOW - JUNE
C_cs_out C_cs_in
C_dem C_prod_Ech
C_prod_Tch Dummy

5 Po ly g enera t io n Mo de l Ver i f i ca t io n
67
[55], is one of the main reasons for the economic viability of solar system installations. The real interest rate is calculated at 4% considering the nominal interest rate and inflation rate of 6% and 2%, respectively. Hence, all the scenarios are economically feasible since the IRR is higher than the real interest rate. Although the capital costs of these scenarios are higher, the avoided costs for electricity and fuel purchases improved the economy of these scenarios. Scenario 3 with a low PBP and higher IRR is an attractive economic option. Scenarios 5 (Scenario 6) presents substantial CO2 emissions reduction with a relatively good economy. The results demonstrate that regardless of the scenario’s characterization, the polygeneration energy systems offer energetic, economic, and environmental benefits.
5.5 Concluding remarks
In this section, the proposed model for optimizing complex polygeneration systems was validated and verified using applicable validation techniques. The results confirm that the proposed model can be utilized for design optimization of polygeneration systems. Application of the model to a residential building in northern Italy revealed that employing the polygeneration system offers economic, energetic, and environmental benefits. The results promote the integration of heat storage devices into the CCHP system since such an integration has reduced the payback while reducing the fuel consumption and CO2 emissions. Moreover, a thermal chiller and a cold storage enhanced the performance of the system. This emphasizes the importance of employing heat storage as well as the thermal chiller in a CCHP system. Integration of solar PV units mitigated the CO2 emissions by approximately 35% in comparison with the reference scenario, while the negative influences on the economy of the system are not substantial in the long term.

6 Po ly g enera t io n Sy s te m Ex plo ra t io n
68
6 Polygeneration System Exploration4
The developed model was used to explore the performance of optimal complex polygeneration systems at the planning stage. Operating strategies, load characteristics, and climate zones can significantly influence the optimal design and performance of a polygeneration system. These effects are explored through three case studies as described in the following sections. First, the optimal solution and performance of the system under various operating strategies are evaluated through a case study, which is a residential building complex in the northern part of Italy. In the second case study, the effect of heat load and the critical components are evaluated for a hospital in the same region. In the third case study, the performance and optimal design of polygeneration systems in various climate zones are assessed for building complexes in Iran. The analysis aims to evaluate how these parameters can affect the optimal size of the components and the performance of the system regarding energy, economy, and the environment.
6.1 The Effect of Operating Strategies
To investigate the effect of operating strategies on the system performance, a specific polygeneration system configuration was optimized for each of the three strategies: MBL, FEL, and FTL. The same configuration was used as in the case described in Chapter 5, which is a residential building complex in the northern part of Italy. The energy demands of the building correspond to a typical European family house in the Italian climate zone E [159]. The load profiles were synthesized using the data available in other studies previously performed by Barbieri et al. [130], Bianchi et al. [160], and the data provided by the project EURECO [148]. The peak electricity, heating, and cooling demands are 320 kWel, 1,510 kWth, and 480 kWc, respectively. The annual aggregated electricity load is 1,682 MWhel, the heating load is 1,996 MWhth, and the cooling load is 346 MWhc, respectively [162]. In the present work, the simulation is carried out for a one-year operation with an hourly time step (= 8,760 hours; Paper IV).
For the economic analysis, an interest rate of 6%, an inflation rate of 2%, and a lifetime of 20 years are assumed for the project. An annual increase of 1% for the electricity and gas prices is anticipated. More details of the case study and its specification and input parameters can be found in Paper IV. A comparative analysis of the optimal solutions is conducted considering the following:
Size of components
4This chapter is based on Paper IV, Paper V, and Paper VI.

6 Po ly g enera t io n Sy s te m Ex plo ra t io n
69
Performance of the system using 3-E analysis (4.4)
Economic analysis
6.1.1 Size of the optimal solutions
The sizes of the components, identified by the optimization process for each operating strategy, are presented in Figure 26. As shown, the wind turbine and battery bank are not chosen for any of the operating strategies. This is primarily because of the high capital cost of the wind turbine and the high capital and replacement costs of the battery. However, in the case of the wind turbine, it is also due to the relatively low wind speed in the region. Even though adding the solar panels to the system increases the initial cost, the avoided cost of the electricity purchase from the grid and the benefits from the excess power sold to the grid have positive impacts on the economy of the system. Therefore, the solar panels are selected for all the operating strategies. For the FTL strategy, the size of the CHP is larger since it is responsible for covering the heating demand. Accordingly, the boiler is significantly smaller in the system with the FTL.
The electric and thermal chiller appeared in all the strategies except for the FTL. A thermal chiller increases the heating demand and, consequently, increases the size of the CHP. Hence, adding a thermal chiller to the system with the FTL can increase the capital cost, fuel consumption, and fuel cost, which all deteriorate the performance of the system. Therefore, in the FTL, the thermal chiller is excluded from the optimal solution during the optimization process.
Figure 26 Size of the components for the MBL, FEL, and FTL operating strategies: PV (solar
panel), CHP (combined heat and power), Ech (electric chiller), Tch (thermal chiller), SHU (solar
heating unit), HS (heat storage) and CS (cold storage)
For the FTL, the size of the heat storage is smaller than for the other strategies since the CHP follows the thermal demand, resulting in little or no excess heat. Therefore, the sizes of the SHU and heat storage are smaller in this strategy. The
0
250
500
750
1,000
1,250
PV CHP Boiler Ech Tch SHU
Size
* (k
W)
MBL FEL FTL
*PV & CHP (kWel), boiler & SHU (kWh), Ech & Tch (kWc)
0
500
1,000
1,500
2,000
2,500
3,000
HS CS
Size
* (k
Wh
)
MBL FEL FTL
*HS (kWhh), CS (kWhc)

6 Po ly g enera t io n Sy s te m Ex plo ra t io n
70
capacity of the cold storage for the FTL is higher than that of the other strategies due to the availability of the excess power and, consequently, higher extra cooling production potential by the electric chillers.
6.1.2 Performance analysis
The performance of the optimal solutions is evaluated through the economic, environmental, and energetic analysis of the system. The fuel saving (FS), CO2 emission reduction (CO2ER), annualized total cost saving (ATCS), and integrated saving ratio (ISR) relative to the reference system are presented in Figure 27. The results indicate that the polygeneration system demonstrates energetic, economic, and environmental benefits regardless of the operating strategy, and the differences between the values of the ISR are not significant.
Figure 27 Fuel-saving ratio (FSR), CO2 emission reduction ratio (CO2ERR), annualized total cost-
saving ratio (ATCSR), integrated savings ratio (ISR) for the modified base load (MBL), following
electric load (FEL), and following thermal load (FTL) operating strategies
The FSR is highest for the FEL and lowest for the FTL. This is mainly due to the larger capacity of the CHP system that is required to fulfill the heating of the system. The values of the saving ratios are essential decision-making factors. However, the amount of excess heat and excess power, as well as the amount of imported and exported electricity from/to the grid, are also crucial for selecting the most suitable strategy. In a system following the FTL, the heating demand should be fulfilled by the CHP system. During the heating period, this causes higher excess power, resulting in a larger amount of exported power to the grid. During the cooling seasons, the heating demand is low, which results in a higher amount of imported power from the grid. Therefore, for the FTL, the imported/exported power from/to the grid is relatively high, as shown in Figure 28.
0.0
10.0
20.0
30.0
40.0
50.0
FSR CO2ERR ATCSR ISR
Savi
ng
rati
o (
%)
MBL FEL FTL

6 Po ly g enera t io n Sy s te m Ex p lo ra t io n
71
Figure 28 Excess heat and imported electricity and exported electricity from/to the grid
Despite the fact that the value of the FSR for the FTL is lower than that of the other strategies, the CO2 emissions reduction is the highest for the FTL (43%), and the other two strategies have similar CO2ERR (35%). From a theoretical point of view, this is an expected outcome since the exported power to the grid is highest in the FTL while the specific CO2 emission factor of the generated electricity by the polygeneration (refer to Section 4.3.6) is lower compared to the utility grid. The specific CO2 emission factor of the polygeneration system has the highest value in the system with the FEL (260 g/kWhel) and the lowest value in the system with the FTL (188 g/kWhel). As shown in Figure 28, for the FTL, the annual amounts of imported and exported electricity are nearly the same. However, the specific CO2 emission factor of the generated electricity by the polygeneration system is lower than in the utility grid for the case study (Italian grid [166] with 485 g CO2/kWhel). This results in a higher value of CO2ERR in the system with the FTL. The values of excess heat for the FEL and MBL are relatively high. This could be a drawback in the system. However, if there is a possibility of utilizing the excess heat for other purposes, such as water purification or heating a swimming pool, the performance of the system can be improved.
In all the operating strategies, the share of power generation by the PV units is approximately 40% and by the CHP unit is approximately 60%. The high share of solar power production implies the environmental benefits of the system. For the MBL and FEL, the share of self-consumption (the ratio of the consumed power in the building to the total generated power by the polygeneration system) is approximately 95%, and the shares of imported and exported power from/to the grid are comparatively low. The shares of self-production (the ratio of the generated power relative to the power demand) are 92% for the MBL and 99% for the FEL. This shows a high share of self-sufficiency regarding the power
0
100
200
300
400
500
600
700
800
Excess HeatImportedelectricity
Exportedelectricity
He
at &
Ele
ctri
cty
(MW
h)
MBL FEL FTL

6 Po ly g enera t io n Sy s te m Ex plo ra t io n
72
demand. For the FTL, however, the share of self-consumption is approximately 61%, and the remaining power is exported to the grid mainly during the heating season. The share of self-production is only 60%, and the remaining power is imported from the grid primarily during the cooling season. This shows a high dependency on the grid for the system with the FTL and a lower degree of self-sufficiency in terms of power.
6.1.3 Economic analysis
The standard metrics, PBP, IRR, and NPV, are used for the financial feasibility assessment. The economy of the system, considering the PBP and IRR, and NPV, are presented in Table 8 and Figure 29. As shown, the differences between the values are not significant, meaning that all of the strategies can be equally attractive in terms of economy. However, an analysis of the various costs (Figure 29) and the cost breakdown (Figure 30) are useful for choosing the right operating strategy. As an example, if the CO2 emissions reduction has a high priority in a project, the system with the FTL is a better choice since it has a higher CO2ERR (Figure 27). Conversely, the capital cost of this system is higher than the capital cost of the system with the MBL. Therefore, in a project with a limited investment budget, the FTL is not an attractive choice. Another metric in evaluation of the energy system can be evaluation of the LCOE. Because of the co-production of electricity and useful heat in a polygeneration system, the LCOE is not counted as an accurate or suitable metric for economic evaluation of the system. Nevertheless, since the LCOE is frequently used in the economic assessment of power systems, it is estimated to facilitate the comparison between the polygeneration system and other power systems. The LCOE has the highest value for the FTL (0.23 USD/kWel) and the lowest for the FEL and MBL (0.19 USD/kWel), as shown in Table 8.
Table 8 Economy of the Systems
Operating strategy MBL FEL FTL
Payback period (year) 8 9 10
Internal rate of return (%) 10.1 8.3 7
LCOE (USD/kWel) 0.19 0.19 0.23

6 Po ly g enera t io n Sy s te m Ex plo ra t io n
73
Figure 29 Various costs for the operation strategies
Further investigations can be performed by analyzing the cost breakdown of each system. As shown in Figure 30, the fuel purchase cost has the highest share in all the operating strategies. The share of the capital cost for the FTL is higher than the other strategies. Moreover, for the FTL, the costs and benefits from the purchased and sold electricity are considerably higher than for the other strategies. This can be considered negative or positive, depending on the limitations of the project and the regulatory issues. For example, in a liberalized power market with a fair feed-in-tariff rate for the exported electricity to the grid, the FTL is a proper choice. However, if selling back to the grid is not allowed, it might not be considered a suitable option.
Figure 30 Cost breakdown for each operating strategy
0
1
2
3
4
5
6
CapitalCost Fuel cost
Purchasedpower
Soldpower NPV
Co
st (
USD
)
Mill
ion
s
MBL FEL FTL
3.0 3.2 2.6
23.2 25.1 33.3
70.2 73.0
55.8
5.6 1.0
26.6
-2.0 -2.3
-18.3-30
-10
10
30
50
70
90
MBL FEL FTL
Co
st S
ha
re (
%)
Maintenance Cost Capital Cost Fuel Cost
Purchased power Sold power
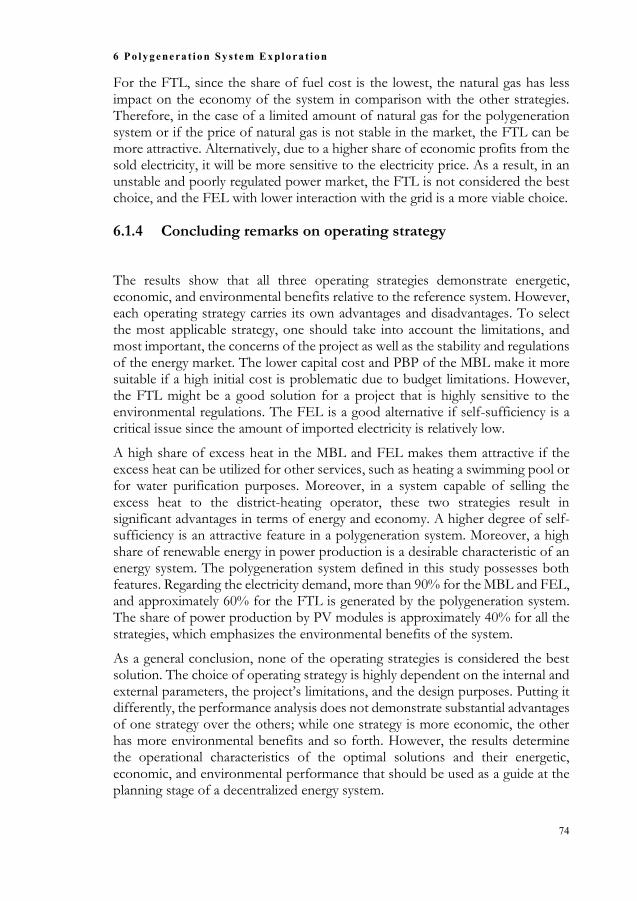
6 Po ly g enera t io n Sy s te m Ex plo ra t io n
74
For the FTL, since the share of fuel cost is the lowest, the natural gas has less impact on the economy of the system in comparison with the other strategies. Therefore, in the case of a limited amount of natural gas for the polygeneration system or if the price of natural gas is not stable in the market, the FTL can be more attractive. Alternatively, due to a higher share of economic profits from the sold electricity, it will be more sensitive to the electricity price. As a result, in an unstable and poorly regulated power market, the FTL is not considered the best choice, and the FEL with lower interaction with the grid is a more viable choice.
6.1.4 Concluding remarks on operating strategy
The results show that all three operating strategies demonstrate energetic, economic, and environmental benefits relative to the reference system. However, each operating strategy carries its own advantages and disadvantages. To select the most applicable strategy, one should take into account the limitations, and most important, the concerns of the project as well as the stability and regulations of the energy market. The lower capital cost and PBP of the MBL make it more suitable if a high initial cost is problematic due to budget limitations. However, the FTL might be a good solution for a project that is highly sensitive to the environmental regulations. The FEL is a good alternative if self-sufficiency is a critical issue since the amount of imported electricity is relatively low.
A high share of excess heat in the MBL and FEL makes them attractive if the excess heat can be utilized for other services, such as heating a swimming pool or for water purification purposes. Moreover, in a system capable of selling the excess heat to the district-heating operator, these two strategies result in significant advantages in terms of energy and economy. A higher degree of self-sufficiency is an attractive feature in a polygeneration system. Moreover, a high share of renewable energy in power production is a desirable characteristic of an energy system. The polygeneration system defined in this study possesses both features. Regarding the electricity demand, more than 90% for the MBL and FEL, and approximately 60% for the FTL is generated by the polygeneration system. The share of power production by PV modules is approximately 40% for all the strategies, which emphasizes the environmental benefits of the system.
As a general conclusion, none of the operating strategies is considered the best solution. The choice of operating strategy is highly dependent on the internal and external parameters, the project’s limitations, and the design purposes. Putting it differently, the performance analysis does not demonstrate substantial advantages of one strategy over the others; while one strategy is more economic, the other has more environmental benefits and so forth. However, the results determine the operational characteristics of the optimal solutions and their energetic, economic, and environmental performance that should be used as a guide at the planning stage of a decentralized energy system.

6 Po ly g enera t io n Sy s te m Ex plo ra t io n
75
6.2 The Effect of Heating Load Profile and Critical Components5
The load demand profile and its characteristics have a significant effect on the optimal solution and performance of polygeneration energy systems. The building application can influence the load pattern and, therefore, the optimal solution. As an example, the load demand of residential buildings fluctuates highly on a daily and seasonal basis. In public buildings, such as schools, hotels, and hospitals, the seasonal and daily load fluctuations are smaller and the load is usually characterized as a smooth load. This means that the hourly load fluctuations during a one-day operation as well as the seasonal load fluctuations during a one-year operation are comparatively lower than the residential buildings. In the previous chapter, the optimization of a polygeneration system in a residential building was investigated. In this chapter, optimal design of a hospital with a smoother load characteristic is explored.
The case study is a hypothetical 930-bed hospital complex located in the northern part of Italy. The demand load profiles are based on another study performed by P. Arcuri et al. [167]. The simulation is carried out for a one-year operation with a one-hour time step (8,760 hours). To investigate the effect of heating load, two load types denominated as L01 and L02 are investigated. For both load types, the electricity and cooling demands are similar and constant during the year. The heating demand profile is constant throughout the year in L01, while in L02, it changes on a monthly basis, resulting in a lower heating demand for L02. The peak power, heat, and cooling demands of the hospital complex are 625 kWel, 3,650 kWth, and 1,075 kWc, respectively. The annual accumulated electricity and cooling demand are 4 GWhth and 1.3 GWhc for both load types. The aggregated heating demands are 13.1 GWhth and 8.9 GWhth for L01 and L02, respectively. The ratios of heating to power demand are 3.3 and 2.2 for L01 and L02, respectively. The ratios of heating to cooling demand are 10.0 and 6.8 for L01 and L02, respectively.
Since self-sufficiency in terms of power is an important issue for hospitals in the event of power failure, the FEL has been chosen as the operating strategy [168]. Details of the load characteristics and specifications of the case study can be found in the appended Paper V [169]. A sensitivity analysis is performed to evaluate the impact of gas and electricity prices on the feasibility and performance of the system. Moreover, to investigate the effect of integrating critical components such as the thermal chiller, cold storage, PV modules, and SHU, the design optimization is performed for three design scenarios as shown in Table 9.
5 This section is based on Paper V.

6 Po ly g enera t io n Sy s te m Ex plo ra t io n
76
Scenario 1 includes the basic components of a polygeneration system. It consists of a CHP unit, an electric chiller, a boiler, and a heat storage. In scenario 2, the possibility of having a thermal chiller and a cold storage is added. In scenario 3, PV modules, SHU, wind turbine, and battery banks are added to scenario 2.
Table 9 Design Scenarios
Components Scenarios
Ref 1 2 3
CHP unit _ x x x
Boiler x x x x
El from/to grid x x x x
Electric chiller x x x x
Thermal chiller _ _ x x
Heat storage _ x x x
Cold storage _ _ x x
Solar PV _ _ _ x
Solar heating unit _ _ _ x
Battery _ _ _ x
Wind Turbine _ _ _ x
A possible polygeneration system for the hospital has been optimized for the two load types L01 and L02. Considering these two load types, a comparative analysis has been performed for the design scenarios taking into account the size of the components, performance and economy of the system.
6.2.1 Optimal solutions
In Table 10, the optimal solutions for both load types and the three design scenarios are shown. No wind turbines appear in the optimal solutions. This is due to the high capital cost of wind turbines and the lack of enough wind energy in the region. Scenario 3 with L01 is the only system with a small battery. This is because of the high initial cost of the battery and the lack of excess power in the system. Based on the FEL, the CHP follows the electric load. In scenario 1, the sizes of the heat storage and boiler are smaller in L02 compared to L01. This is mainly because of the lower heating demand in L02. In scenario 2, owing to the lower heating load in L02, a higher amount of heat can be exploited by the thermal chiller. Hence, the size of the electric chiller is smaller in L02. Due to the existence of cold storage in scenarios 2 and 3, and the lower heating demand in L02, the thermal chiller can contribute to cooling production, and therefore, the cooling ratios in these two scenarios are 0.29 and 0.49, respectively. Regarding L02, due to the excess power from the PV units in scenario 3, the cooling ratio in scenario 3 is higher than scenario 2. The presence of a thermal chiller (scenarios 2 and 3) and the availability of the excess heat (L02) can decrease the electric demand for

6 Po ly g enera t io n Sy s te m Ex plo ra t io n
77
cooling purposes. This results in a smaller CHP. Moreover, in scenario 3, which includes solar panels, the electricity is partially supplied by PV units. Therefore, the size of the CHP is smaller in this scenario.
Table 10 Optimal Solution of the Scenario and Load Types
Components Load type L01 Load type L02
Scenarios Scenarios
1 2 3 1 2 3
Solar PV (kWel) 0 0 920 0 0 920
Wind 0 0 0 0 0 0
CHP (kWel) 1,000 1,000 800 1,000 800 600
Auxiliary boiler(kWth) 2,721 2,721 3,130 2,694 2,708 3,002
Battery (kWhel) 0 0 20 0 0 0
Electric chiller (kWc) 1,101 1,101 1,101 1,101 312 613
Thermal chiller (kWc) 0 689 519 0 777 542
Cooling ratio (-) 1 1 1 1 0.29 0.49
Solar heating unit (kWth) 0 0 1,400 0 0 1,400
Heat storage (kWhth) 3,000 3,000 3,000 2,992 3,000 3,000
Cold storage( kWc) 0 3,000 3,000 0 2,815 3,000
Even though the existence of SHU, PV panels, and thermal storages can enhance the performance of the system, their sizes are limited to the maximum values presented in the search space, which is related to the available space or area for the installations (Paper V). Scenario 1 with L02 is the only exception in which the heat storage is slightly smaller due to lower heating demand in L02.
6.2.2 Performance analysis
The performance of the polygeneration system pertinent to the identified reference system is presented in this section. A comparative analysis based on the ATC, FSR, and CO2 emissions reduction is performed. The effect of load types and critical components on the optimal design and performance of the system are investigated. In addition, the amount of exported/imported power to/from the grid and excess heat are also examined. Exploring these values is essential for a careful selection of the most suitable scenario. For example, to increase the performance of the system, the excess heat can be utilized for deferrable loads, such as a heat-driven water purification system or heating a swimming pool. Because of the lower heating demand in L02, the amount of excess heat is higher in this load type (Figure 31). In both load types, scenarios 1 and 3 have the highest and lowest excess heat, respectively.
Based on the FEL, the CHP follows the power demand. Hence, in scenarios 1 and 2, there is little or no excess power that is exported to the grid. In scenario 3,

6 Po ly g enera t io n Sy s te m Ex plo ra t io n
78
however, because of the existence of solar panels, there is excess power, which can be sent to the grid. In load type L02 (scenario 3), the amount of exported power is higher because of the smaller size of the electric chiller, and accordingly, the lower electricity demand. For each scenario, the imported power is approximately the same in both load types. Because of the presence of solar panels in scenario 3, the imported power is considerably smaller than the other scenarios.
(a) (b)
Figure 31 Excess heat (a) and imported/exported power to/from the grid (b) for the three scenarios and
the two load types (L01 & L02)
In Figure 32, the performances of the optimal design for the design scenarios and load types are presented. The results indicate that, irrespective of the load type and scenario, there are economic, environmental, and energetic advantages in comparison with the reference system. Considering each load type, scenarios 1 and 3 offer the lowest and highest benefits in terms of economy, energy, and the environment, respectively.
0
1
2
3
4
Scen.1 Scen.2 Scen.3
He
at
en
erg
y (
GW
h/y
r)
Excess heat
L01 L02
0
20
40
60
80
100
120
Ele
ctri
c e
ne
rgy
(MW
h/y
r) Imported Exported

6 Po ly g enera t io n Sy s te m Ex plo ra t io n
79
(a)
(b)
Figure 32 Fuel-saving ratio (FSR), CO2 emission reduction ratio (CO2ERR), integrated savings
ratio (ISR), and annualized total cost-saving ratio (ATCSR) for the design scenarios (Scen. 1 to 3)
and the two load types; L01 (a) and L02 (b)
The system with a higher heating demand (L01) offers higher benefits in scenarios 1 and 2. In scenario 03, however, both load types offer approximately the same benefits while the benefits in L02 are slightly higher. In scenarios 2 and 3, the performance of the system is enhanced by the effective exploitation of the excess heat and power for cooling purposes using the cold storage and thermal and electric chiller. The existence of solar panels and solar thermal panels (scenario 3) reduces the fuel consumption and, consequently, raises the energetic and environmental performance of the system. This reduces the influence of heating demand on the performance. In scenario 3, the amount of excess power from the PV units increases if the solar radiation is high. A cold storage offers the opportunity to generate extra cooling through the electric chiller in the event of
0
5
10
15
20
25
30
35
FSR CO2ERR ISR ATCSR
Savi
ng
rati
o (
%)
L01_Scen.1 L01_Scen.2 L01_Scen.3
0
5
10
15
20
25
30
35
FSR CO2ERR ISR ATCSR
Savi
ng
rati
o (
%)
L02_Scen.1 L02_Scen.2 L02_Scen.3

6 Po ly g enera t io n Sy s te m Ex plo ra t io n
80
high solar radiation. This can reduce the peak cooling demand, smooth the load profile, and stabilize the operation by exploiting the excess power within the system instead of exporting it to the utility grid. In addition, the heating provided by the solar heating devices can be used in the thermal chiller, which reduces the CO2 emissions. These components improve the economy of the system by avoiding the costs of electricity and fuel purchases. Hence, scenario 3 has considerably higher performance compared to the other scenarios. The results exhibit the positive effect of the combination of thermal storage devices, thermal chiller, solar panels, and SHU on the fuel, costs, and emissions reduction. Mitigating CO2 emissions is regarded as one of the key features of a polygeneration energy system.
6.2.3 Economic analysis
Implementation of an energy system is highly dependent on its economic viability. Hence, various economic criteria should be used for an in-depth economic analysis. The initial cost of a project plays a vital role. A project can be excluded due to its high initial cost in spite of its long-term economic benefits. Apart from the capital cost, the NPV, IRR, and PBP are the most commonly used measures in economic evaluations of projects. Generally , none of the economic indicators are faultless, and two or more figures of merit should be used to understand the economic gains and losses [152]. A system with a shorter PBP does not necessarily show a better economy, and evaluating the cash flows after the breakeven point is crucial. Hence, the NPV should also be evaluated in an economic analysis.
Figure 33 Capital cost for the scenarios and the two load types
In Figure 33, the initial cost of each scenario is given. Scenario 3 possesses the highest cost of capital in each load type. Hence, in the case of a limited budget, this scenario is less attractive in terms of economy. The IRR is a good metric for investment ranking while choosing between projects with different initial costs [152]. In Figure 34, the PBP and IRR of each scenario and load type are shown.
0
1
2
3
4
5
L01 L02
Co
st (
MU
SD)
Capital cost
Scen.1 Scen.2 Scen.3
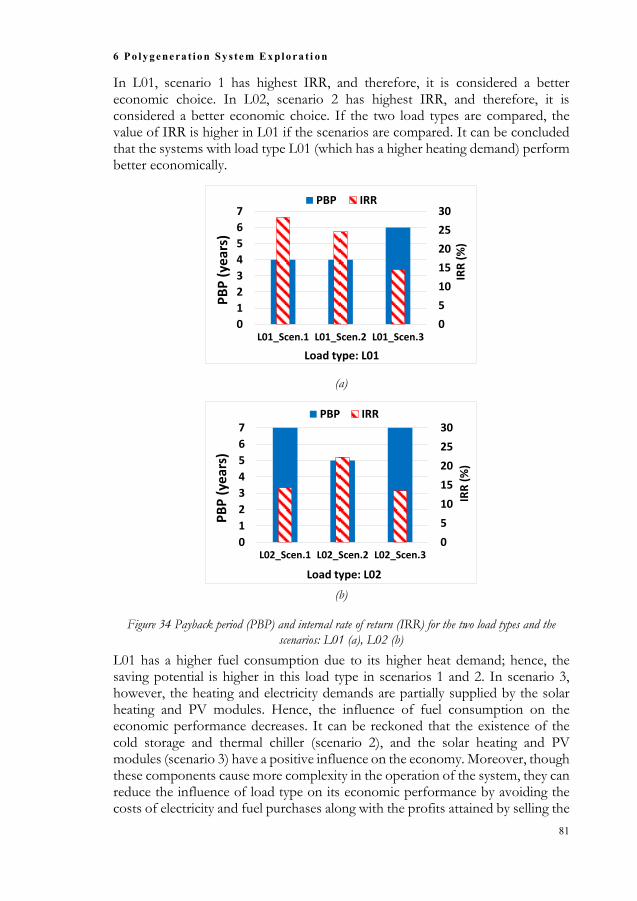
6 Po ly g enera t io n Sy s te m Ex plo ra t i o n
81
In L01, scenario 1 has highest IRR, and therefore, it is considered a better economic choice. In L02, scenario 2 has highest IRR, and therefore, it is considered a better economic choice. If the two load types are compared, the value of IRR is higher in L01 if the scenarios are compared. It can be concluded that the systems with load type L01 (which has a higher heating demand) perform better economically.
(a)
(b)
Figure 34 Payback period (PBP) and internal rate of return (IRR) for the two load types and the
scenarios: L01 (a), L02 (b)
L01 has a higher fuel consumption due to its higher heat demand; hence, the saving potential is higher in this load type in scenarios 1 and 2. In scenario 3, however, the heating and electricity demands are partially supplied by the solar heating and PV modules. Hence, the influence of fuel consumption on the economic performance decreases. It can be reckoned that the existence of the cold storage and thermal chiller (scenario 2), and the solar heating and PV modules (scenario 3) have a positive influence on the economy. Moreover, though these components cause more complexity in the operation of the system, they can reduce the influence of load type on its economic performance by avoiding the costs of electricity and fuel purchases along with the profits attained by selling the
0
5
10
15
20
25
30
0
1
2
3
4
5
6
7
L01_Scen.1 L01_Scen.2 L01_Scen.3
IRR
(%
)
PB
P (
year
s)
Load type: L01
PBP IRR
0
5
10
15
20
25
30
0
1
2
3
4
5
6
7
L02_Scen.1 L02_Scen.2 L02_Scen.3
IRR
(%
)
PB
P (
year
s)
Load type: L02
PBP IRR

6 Po ly g enera t io n Sy s te m Ex plo ra t io n
82
surplus power to the utility grid.
Due to the co-production of heating, cooling, and electricity, the LCOE is not an accurate indicator in a polygeneration energy system. In spite of this, given that it is commonly used in the assessment of electric power generation systems, it is examined for comparative analysis. To approximate the LCOE, the electricity is assumed as the main commodity, and the heat produced by the CHP and the generated cooling by the thermal chiller are counted as by-products. The influence of these by-products is considered revenue, as if they could be retailed in the energy market. The cost of heat is valued based on the cost of an equal amount of heat produced by a boiler. The cost of the electricity purchase from the grid for the same amount of cooling production in an electric chiller is used for valuing the cooling as a by-product. The values are estimated at 0.08 USD/kWth and 0.07 USD/kWc for the produced heating and cooling in the polygeneration system. In Figure 35, the LCOE for each load type and scenario is presented. The values are between 0.09–0.13 USD/kWel, which are competitive with the price of electricity in the energy market (0.12–0.24 USD/kWel). In L01, the differences between the values are not considerable. In L02, however, the value of the LCOE for scenario 1 is higher than the other scenarios. It can be concluded that the higher heating load in L01 decreases the cost of electricity production in scenario 1.
Figure 35 Levelized cost of electricity for the scenarios and the two load types
The results are extremely sensitive to the characteristics of the energy market and reference system. One of the reasons for the economic feasibility of this case study is the high electricity price in the Italian energy market and the assumptions related to the reference system. Investigation of a system located in another region with different assumptions results in a different outcome. Electricity and gas prices have a considerable influence on the economic feasibility of the polygeneration system. Scenario 3 with L02 has the highest ISR; therefore, the performance of this case is evaluated further to investigate the impact of electricity and gas prices. In order to comprehend the effects, the electricity and gas prices are augmented or reduced by a multiplier. As shown in Figure 36, a higher gas
0.00
0.04
0.08
0.12
0.16
L01 L02
Co
st (
USD
/kW
h)
LCOE
Scen. 1 Scen. 2 Scen. 3
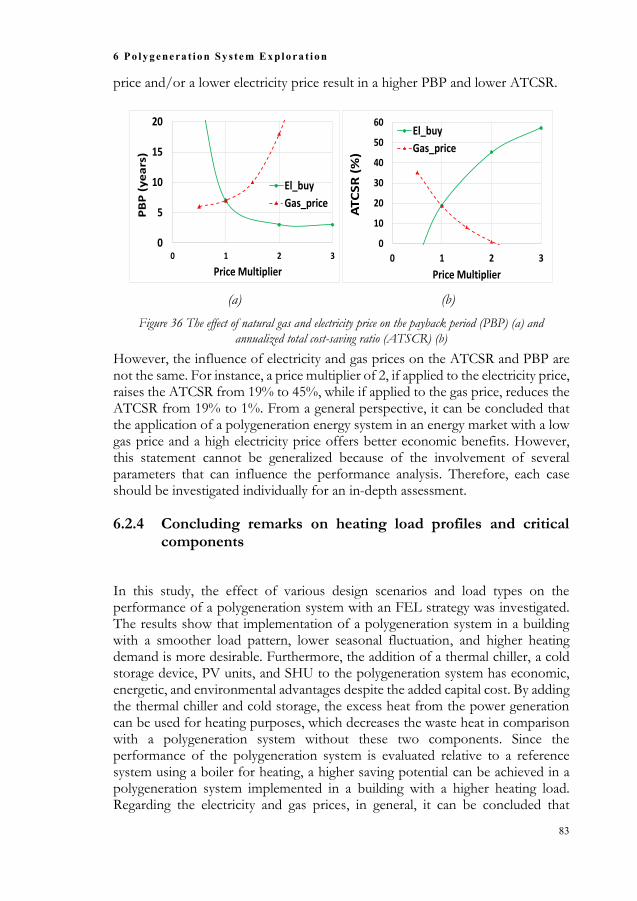
6 Po ly g enera t io n Sy s te m Ex plo ra t io n
83
price and/or a lower electricity price result in a higher PBP and lower ATCSR.
(a) (b)
Figure 36 The effect of natural gas and electricity price on the payback period (PBP) (a) and
annualized total cost-saving ratio (ATSCR) (b)
However, the influence of electricity and gas prices on the ATCSR and PBP are not the same. For instance, a price multiplier of 2, if applied to the electricity price, raises the ATCSR from 19% to 45%, while if applied to the gas price, reduces the ATCSR from 19% to 1%. From a general perspective, it can be concluded that the application of a polygeneration energy system in an energy market with a low gas price and a high electricity price offers better economic benefits. However, this statement cannot be generalized because of the involvement of several parameters that can influence the performance analysis. Therefore, each case should be investigated individually for an in-depth assessment.
6.2.4 Concluding remarks on heating load profiles and critical components
In this study, the effect of various design scenarios and load types on the performance of a polygeneration system with an FEL strategy was investigated. The results show that implementation of a polygeneration system in a building with a smoother load pattern, lower seasonal fluctuation, and higher heating demand is more desirable. Furthermore, the addition of a thermal chiller, a cold storage device, PV units, and SHU to the polygeneration system has economic, energetic, and environmental advantages despite the added capital cost. By adding the thermal chiller and cold storage, the excess heat from the power generation can be used for heating purposes, which decreases the waste heat in comparison with a polygeneration system without these two components. Since the performance of the polygeneration system is evaluated relative to a reference system using a boiler for heating, a higher saving potential can be achieved in a polygeneration system implemented in a building with a higher heating load. Regarding the electricity and gas prices, in general, it can be concluded that
0
5
10
15
20
0 1 2 3
PB
P (
ye
ars
)
Price Multiplier
El_buy
Gas_price
0
10
20
30
40
50
60
0 1 2 3
AT
CS
R (
%)
Price Multiplier
El_buy
Gas_price

6 Po ly g enera t io n Sy s te m Ex plo ra t io n
84
polygeneration systems in an energy market with a lower gas price and higher electricity price are more appealing. However, each case should be studied individually for detailed evaluation, and for this purpose, the detailed optimization model presented herein is useful.
6.3 The Effect of Climate Zone
To investigate the influence of climate zones on the optimal solution of the system and its performance, the design optimization of polygeneration systems of identical residential buildings located in three climate zones in Iran is evaluated. Determination of the load demands of the buildings is beyond the scope of this work, and therefore, the data from another study conducted by Ehyaei and Bahador [170] is used. These data are based on simulation of a hypothetical 10-story residential building with four apartments in each. Each apartment has an average floor area of 200 m2 [170]. In the mentioned study, Ehyaei and Bahadori identified the load demands of identical residential buildings located in three cities with different climate specifications in Iran [171]. The cities are: Ahvaz in the south of Iran with a desert climate, and very hot summers and mild, short winters; Tehran in the north of Iran with a cold semi-arid climate and moderate winters; and Hamedan in the northwest of Iran with a cold climate and very cold winters, as shown in Figure 37. The average solar radiation in Ahvaz, Tehran, and Hamedan are 5.4, 4.7, and 4.6 kWh/m2/day, respectively. More details can be found in Paper VI.
In [170], a detailed study considering the electrical and thermal energy needs of a residential building located in Tehran is carried out. Then the study is carried out for the same building, assuming it was located in Ahvaz and Hamedan. The system was simulated for a one-year operation with a one-hour time step (8,760 hours). The peak power, heating, and cooling demands of the buildings and the aggregate electricity, heating, and cooling demands during a one-year operation are shown in Table 11. More information about the building specifications, their load demands, and specifications of the case study, including various parameters, can be found in the original work [170].
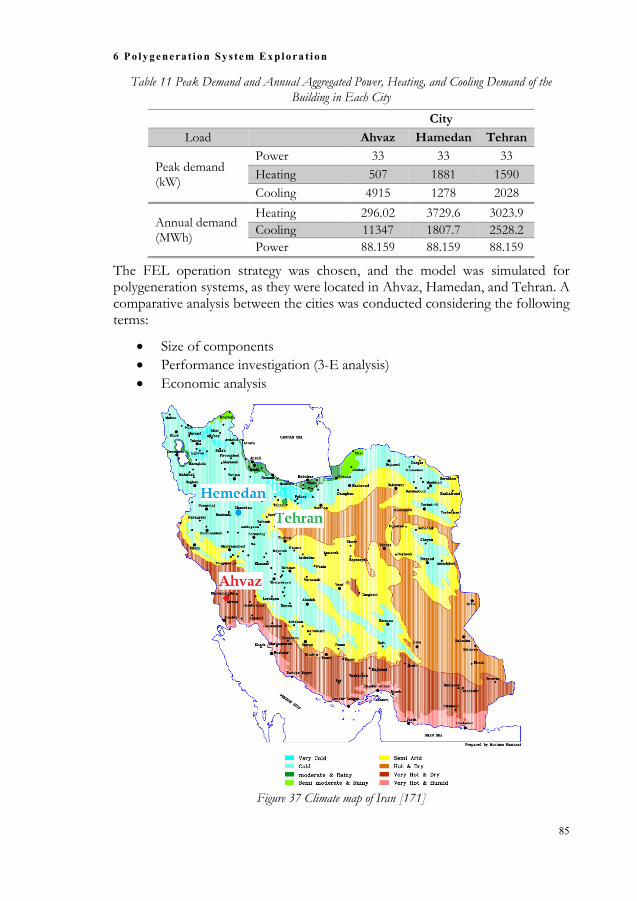
6 Po ly g enera t io n Sy s te m Ex plo ra t io n
85
Table 11 Peak Demand and Annual Aggregated Power, Heating, and Cooling Demand of the
Building in Each City
City
Load Ahvaz Hamedan Tehran
Peak demand (kW)
Power 33 33 33
Heating 507 1881 1590
Cooling 4915 1278 2028
Annual demand (MWh)
Heating 296.02 3729.6 3023.9
Cooling 11347 1807.7 2528.2
Power 88.159 88.159 88.159
The FEL operation strategy was chosen, and the model was simulated for polygeneration systems, as they were located in Ahvaz, Hamedan, and Tehran. A comparative analysis between the cities was conducted considering the following terms:
Size of components
Performance investigation (3-E analysis)
Economic analysis
Figure 37 Climate map of Iran [171]

6 Po ly g enera t io n Sy s te m Ex plo ra t io n
86
6.3.1 Component size
In Figure 38, the sizes of the components for the optimal design of the polygeneration systems in each city are shown. There are no wind turbines, batteries, or solar heating panels in the optimal design. This is partially related to the high capital cost of these components. Low electricity and natural gas prices in Iran is another reason. The avoided electricity and fuel purchases compensate for the capital cost of the solar panels. Moreover, PV modules reduce the CO2 emissions, which have positive impacts on the ISR of the system. Hence, the size of the PV units is the maximum value of the search space. The cooling demand is the lowest in Hamedan and the highest in Ahvaz. Hence, the capacity of the thermal and electric chillers is lowest in Hamedan and highest in Ahvaz. Based on the FEL strategy, the electricity demand is provided by the CHP. In this case study, the load demand is highly dependent on the cooling demand. Therefore, the size of the CHP is lowest in Hamedan and highest in Ahvaz.
The cold storage is chosen in all the cities with the largest capacity in Ahvaz due to its high cooling demand. The recovered heat from the CHP system is utilized directly for heating the building, or in the thermal chiller for cooling production in Ahvaz and Hamedan. Hence, there is no need for a heat storage. In Ahvaz, however, in spite of the larger amount of excess heat (Figure 40), the size of heat storage is very small. A larger heat storage cannot contribute in the heating demand due to the limited capacity of the thermal chiller and cold storage. A larger thermal chiller will add extra costs to the systems, resulting in a lower ISR.
(a) (b)
Figure 38 Size of the components; PV (solar panels), CHP (combined heat and power), Ech (electric
chiller), Tch (thermal chiller), HS (heat storage), CS (cold storage), and SHU (solar heating unit)
0
500
1000
1500
2000
2500
3000
3500
4000
PV CHP Boiler Ech Tch
Size
(kW
)*
Ahvaz Tehran Hamedan
*PV & CHP (kWel), boiler & SHU (kWh), Ech & Tch (kWc)
0
500
1000
1500
2000
2500
HS CS
Size
(kW
h)*
Ahvaz Tehran Hamedan
*CS (kWhc) & HS (kWhh)

6 Po ly g enera t io n Sy s te m Ex plo ra t io n
87
6.3.2 Performance analysis
In Figure 39, the performance of the polygeneration systems regarding energy, the environment, and economy are presented. The performance of the systems regarding all the criteria is lowest in Hamedan and highest in Ahvaz, which are the coldest and hottest cities, respectively. The CO2ERR in Hamedan, Tehran, and Ahvaz are approximately 27%, 34%, and 41%, respectively. This indicates the substantial environmental advantages of the polygeneration systems in all of the cases. In spite of this, the low ATCSR indicates that the implementation of the systems is not economic. This is considered a major hurdle in promoting the polygeneration systems in Iran. The economy of the system is discussed in Section 6.3.3.
Figure 39 Fuel-saving ratio (FSR), CO2 emission reduction ratio (CO2ERR), integrated savings
ratio (ISR), and annualized total cost-saving ratio (ATCSR in Ahvaz, Tehran, and Hamedan
In Figure 40, the annual electricity, heating, and cooling production, excess heat, and imported and exported electricity from/to the grid in each city are presented. In Ahvaz, due to the high cooling demand, the capacity of the CHP and, consequently, the amount of exhaust heat from the CHP is the highest. However, the capacity of the thermal chiller and cold storage is limited and not all of the exhaust heat can be used for cooling purposes. In addition, the heating demand in this city is relatively low. Consequently, not all of the exhaust heat can be utilized in the system; hence, the excess heat in Ahvaz is higher than the other two cities.
The exported electricity is mainly from the solar panels. The capacity of the PV installations is the same in all of the cities, while the electricity demand is the lowest in Hamedan. Therefore, the value of the exported power in Hamedan is the highest. Moreover, the power demand during the heating season, which is
-10
0
10
20
30
40
50
FSR CO2ERR ISR ATCSR
Savi
ng
rati
os
(%)
Ahvaz Tehran Hamedan

6 Po ly g enera t io n Sy s te m Ex p lo ra t io n
88
long in Hamedan, is relatively low, and the required electricity is imported from the grid rather than operating the CHP at low load (FEL). Hence, the amount of imported power is comparatively high in Hamedan.
(a)
(b) (c) Figure 40 Yearly production (a), excess heat (b) and imported/exported power (c)
The specific CO2 emission factor is defined as the amount of CO2 emissions per kWh of generated electricity by the polygeneration system. As presented in Figure 41, this value is the lowest (0.1 kg CO2/kWhel) in Hamedan and the highest (0.24 kg CO2/kWhel). This is primarily caused by the high solar share in power production in Hamedan. As shown in Figure 41, the share of PV modules in power generation is lowest (17%) in Ahvaz and highest (65%) in Hamedan. This is evident as the capacity of the solar installations is the same in all cities while the electricity demand is lowest in Hamedan and highest in Ahvaz.
0
2
4
6
8
10
12
Electricity Heating Cooling
Pro
du
ctio
n (
GW
h/y
r)
Ahvaz Tehran Hamedan
0
50
100
150
200
Excess_heat
Hea
tin
g en
ergy
(M
Wh
/yr)
Ahvaz Tehran Hamedan
-10
10
30
50
70
90
110
130
150
Imported Exported
Ele
ctri
c En
erg
y (M
Wh
/yr)
Ahvaz Tehran Hamedan

6 Po ly g enera t io n Sy s te m Ex plo ra t io n
89
(a) (b) Figure 41 Share of solar PV units (a) and specific CO2 emission factor (b)
The power self-consumption factor is the share of power produced by the polygeneration system that is used in the building. This value is lowest in Hamedan (81%) and highest in Ahvaz (98%). The excess power is exported to the grid. The power self-production factor is the share of power demand that is provided by the polygeneration system. This factor has the highest value in Ahvaz (99%) and the lowest value in Hamedan (93%). This factor presents a high degree of self-sufficiency of the polygeneration systems.
As shown in Figure 42, the share of cooling production by the thermal chiller is lowest in Hamedan (15%) and highest in Ahvaz (26%). The share of the cold storage in the cooling-demand supply is approximately 30% in Tehran and Ahvaz and 24% in Hamedan. These figures indicate the substantial role of the cold storage and thermal chiller in enhancing the performance of the polygeneration system, since these devices offer an effective exploitation of excess heat and power for cooling purposes.
(a) (b) Figure 42 Share of cooling production by the thermal chiller (Tch) (a) and the share of cold storage in
cooling demand supply (b)
0
20
40
60
80
PV
sh
are
(%)
Ahvaz Tehran Hamedan
0.00
0.05
0.10
0.15
0.20
0.25
kg C
O2
/kW
h
Ahvaz Tehran Hamedan
0
10
20
30
Tch
Pro
du
ctio
n S
har
e (
%)
Ahvaz Tehran Hamedan
0
10
20
30
CES
Sup
ply
Sh
are
(%
)
Ahvaz Tehran Hamedan

6 Po ly g enera t io n Sy s te m Ex plo ra t io n
90
6.3.3 Economic evaluation
The cost share and cost breakdown of the systems are illustrated in Figure 43. The initial cost is lowest in Hamedan and highest in Ahvaz, and is mainly related to the capital cost of the CHP system, which fulfills the electricity demand of the electric chiller. The capital cost has the highest share cost, with the highest in Tehran (59%) and the lowest in Hamedan (54%). The differences between the shares of capital cost in the different cities are not substantial. However, the fuel cost share is lowest in Ahvaz (26%) and highest in Hamedan (40%). The fuel consumption in Ahvaz mostly pertains to the CHP fuel consumption, while in Hamedan, it is largely related to the boiler fuel consumption. The imported and exported electricity are considered costs and revenues in the system, respectively.
(a)
(b)
Figure 43 Total cost (a) and cost/income breakdown (b) for the polygeneration system in each city
The PBP and LCOE are other measures used in the economic analysis. The LCOE is commonly used in the economic assessment of power systems. Due to the concurrent generation of heating, power, and electricity in a polygeneration system, it can be misinforming, and hence, it is only provided for a comparative
0.0
0.5
1.0
1.5
2.0
2.5
3.0
Capital Fuel Importedpower
Exportedpower
Co
st (
MU
SD)
Ahvaz Tehran Hamedan
0
10
20
30
40
50
60
70
OM Capital Fuel Importedpower
Exportedpower
Co
st s
har
e (
%) Ahvaz Tehran Hamedan

6 Po ly g enera t io n Sy s te m Ex plo ra t io n
91
analysis. To estimate the LCOE, the electricity is considered the main product, and the heating and cooling produced by the thermal chiller are assumed by-products, which can produce revenue in the system. To appoint a price for the recovered heat from the CHP unit, the cost of producing the same amount of heat by a boiler is replaced. For the cooling production of the thermal chiller, the cost of cooling production by an electric chiller is utilized. As shown in Table 12, the LCOE is lowest in Ahvaz and highest in Hamedan. The estimated LCOE in all of the cases are higher than the price of electricity in the Iranian energy market (0.06 USD/kWhel). This along with the high PBP (more than 19 years) and the low ATCSR indicate that the implementation of polygeneration systems in Iran is not economical.
Table 12 Economy of the Polygeneration System
City LCOE (USD/kWhel) Payback period (years)
Ahvaz 0.07 19
Tehran 0.10 >20
Hamedan 0.11 >20
The results indicate that the implementation of the polygeneration system for the case study offers more benefits in the hot climate zone. Effective exploitation of excess heat and power from the CHP and PV modules through the thermal chiller and cold storage increases the performance of the system. This shows the importance of integrating innovative components in a polygeneration system. These results can be used to give direction at the planning stage of a polygeneration system. However, because of the large number of parameters involved, the results cannot be generalized, and every case should be explored on its own merits.
6.3.4 Concluding remarks on the influence of the climate zone
In this study, the performance of polygeneration systems designed for identical buildings located in three cities in Iran with cold, moderate, and hot climates were investigated. The results show that for the defined case study, the polygeneration system has higher integrated performance in a hot climate with a high cooling demand in the building, which can promote the implementation of polygeneration systems in hot climates in Iran. Furthermore, the CO2 emission reduction potential in a building located in Ahvaz with a hot climate is higher than in the other two cities. However, the capital cost of the system is also higher for such a system, which can be an obstacle. Finally, the PBP of all the polygeneration systems is very long, which is discouraging for investors. This is mainly due to the low price of electricity in Iran. As a general conclusion, irrespective of the environmental and energetic advantages of the polygeneration system in the presented cases, considering the current electricity tariff in residential buildings in Iran, the application of a polygeneration system is not economical. Various

6 Po ly g enera t io n Sy s te m Ex plo ra t io n
92
financial mechanisms such as feed-in tariffs, tax reductions, and subsidies can promote these systems for residential buildings.

7 Co nc luding Di sc uss io n s
93
7 Concluding Discussions
In this chapter, first a general overview of the research is given. Descriptions of the appended papers are summarized in
Table 13, in which the objective of each study, the approach, and the main conclusions are listed. Later, the concluding remarks are further discussed and the substantial results are pointed out.
7.1 A General Overview
Modelling and optimization of small-scale polygeneration energy systems have been the focus of many studies. However, several shortcomings exist in the literature that require further investigation. In this research, to overcome a few of these shortcomings and to supplement the previous research in this field, a method for the design optimization of small-scale polygeneration systems was proposed. Due to the complexity of polygeneration energy systems, the initial stage of this research was devoted to hybrid power systems in order to simplify the research process. A hybrid power system is a sub-set of a general polygeneration system, which has a lower complexity than a full system. This part focused on understanding the important parameters in the design, optimization, and operation of integrated hybrid power systems in rural areas. The interactions between various components, the role of the operating strategy, the benefits achieved, and the operational characteristics of the systems were studied (Paper I). Next, the implementation of an optimization algorithm for size optimization of a hybrid system was practiced through its application to a hybrid power system in rural areas (Paper II). The outcome of the first stage served as inspiration to develop an optimization model that can identify the optimal design of complex polygeneration systems. In the second stage, a method for design optimization and performance evaluation of a polygeneration energy system relative to a specific reference system was proposed. Based on this method, an optimization model was developed and verified, using applicable verification techniques (Paper III). Further, the impacts of various parameters were investigated through a number of case studies (Papers IV, V, and VI). To provide an overview of the contributions of this thesis, the objectives, research approaches, and main conclusions of each paper are briefly listed in Table 13.

7 Co nc luding Di sc uss io n s
94
Table 13 Description of the Appended Supplements
Paper I Feasibility study of using a biogas engine as backup in a
decentralized hybrid power system
Objective Feasibility study of a remote power system using locally produced biogas in a rural area
Approach Techno-economic optimization of a hybrid power system was evaluated using HOMER as an optimization tool.
Main
conclusions
Fossil fuel consumption can be reduced by using locally produced biogas in remote areas while also achieving considerable economic and environmental benefits
Paper II Optimum design of a hybrid PV-CSP-LPG microgrid with
particle swarm optimization technique
Objective Investigating the effectiveness of using a PSO algorithm in size optimization of a hybrid power system
Approach
An optimization algorithm (PSO) was embedded in a dynamic microgrid simulation model previously developed at MIT and its operation was verified.
Main
conclusions
A high-quality solution can be achieved by using the PSO algorithm with a relatively low computational cost
Paper III
Optimal planning and design method for complex
polygeneration systems: A case study for a residential building in
Italy
Objective Development of an optimization model in MATLAB for design optimization of complex polygeneration systems
Approach
Mathematical formulation of the energy system and optimization objective function, integration of a PSO algorithm, and model verification through a test case were performed.
Main
conclusions
The developed model can effectively identify the optimal design of a polygeneration energy system and its performance in terms of energy, economy and environment
Paper IV The choice of operating strategy for a complex polygeneration
system: A case study for a residential building in Italy
Objective Investigating the effect of operating strategies on the optimal solution and the benefits achieved
Approach
The operating strategies were evaluated through a case study – a comparative analysis between the performances of the polygeneration systems using various operating strategies was carried out.
Main
conclusions
Each operating strategy has its own advantages and disadvantages, and the choice of operating strategy is dependent on the limitations and main concerns of the project as well as the stability and regulations of the energy market

7 Co nc luding Di sc uss io n s
95
Paper V Design optimization of a complex polygeneration system for a
hospital
Objective
Investigating the effect of heat load characteristics and the presence of the thermal chiller, cold storage, PV modules, and solar heating units on the optimal design and performance of a polygeneration energy system
Approach Three design scenarios for two load types were investigated through a case study.
Main
conclusions
A polygeneration system can be a promising solution for buildings with a high heating demand and low seasonal heat fluctuation (such as hospitals). Moreover, the innovative components play an important role in realizing the potential benefits and balancing out the impact of heating load
Paper VI Design optimization of a polygeneration system in three climate
zones in Iran
Objective Identifying the effect of climate zone on the optimal design performance of polygeneration energy systems
Approach The optimization model was applied to identical buildings in three cities located in substantially different climate zones.
Main
conclusions A polygeneration energy system can be a suitable choice for a building located in a hot climate with high cooling and low heating demand
7.2 Hybrid Power System in Rural Electrification Application
The results show that the application of hybrid renewable power systems for electrification in remote areas can be promoted in terms of energy and the environment by identifying the optimal design. The LCOE of the generated power by a hybrid system, including a biogas generator as a backup engine, was estimated at 0.25 USD/kWh. This value is below the LCOE of using only a diesel generator power system (0.56 USD/kWh) or a hybrid power system using a diesel engine as a backup (0.31 USD/kWh). The LCOE of the generated power by the hybrid power systems are significantly higher in comparison with the price of electricity, which could be provided by the grid if it were to be installed. However, bearing in mind other factors, such as the number of consumers in a remote village, the distance between the community and grid, long-term planning, and high investment for grid extension, the proposed hybrid power systems can offer a more viable solution. Apart from solar and wind energy, locally produced biogas can be used as the primary energy source in a hybrid power system. Producing biogas locally from available waste material in rural areas, such as cattle manure, is an alternative to fossil fuels. A diesel-powered internal combustion engine

7 Co nc luding Di sc uss io n s
96
genset is the normal and simple solution to generate electric power in remote areas. However, this work shows that a hybrid power system, using renewable energy, is a promising solution to mitigate the lifecycle and standard CO2 emissions of electricity production.
7.3 Polygeneration Energy System
Polygeneration technologies have the potential to play a crucial role in transitioning energy from centralized energy solutions towards decentralization and energy market liberalization. Such systems have broad applications ranging from a single-family house to a community or an industry, and the capacity can be scaled to fit the different applications. In theory, numerous configurations of several generation and storage units can form a polygeneration system. In such systems, a large number of endogenous and exogenous variables are involved. Therefore, the “one size fits all” approach that is common in centralized energy designs and operations is not practical in designing a polygeneration system.
To identify if a polygeneration system is competitive with the existing solutions, its performance in terms of energy, economy, and the environment relative to the existing solutions should be identified. In this research, to overcome the identified shortcomings and to supplement the previous research in this field, a method for design optimization of small-scale polygeneration systems was proposed. Furthermore, the influence of selected parameters on the performance of the system was evaluated. The demand profiles, system application, climate zones, and operating strategies are some of the most important parameters that can influence the performance of a polygeneration system. Therefore, in order to identify the competitiveness of an optimal polygeneration system, its performance was explored through a number of case studies. The case studies also showed the ability of the model to find the optimal solutions.
In the first polygeneration case study (Paper IV), the choice of operating strategy and its effect on the performance of the polygeneration energy system were investigated for a residential building located in the northern part of Italy. More precisely, the effect of three operating strategies, namely the MBL, FEL, and FTL were investigated. The performed case studies and analyses showed that the operating strategy plays a crucial role on the optimal design and performance of the system. All three operating strategies demonstrated considerable energy, economic, and environmental benefits. However, each of these operating strategies has its advantages and disadvantages. In order to choose the most suitable strategy, one should consider the limitations and main concerns of that particular application as well as the stability and regulations of the existing energy market. For example, a lower capital cost and shorter PBP of the MBL make it more suitable in a project with a limited budget. However, in a project with significant environmental concerns, the FTL might be a good solution. Due to high degree of independency from the grid, the FEL is a good alternative if a high

7 Co nc luding Di sc uss io n s
97
degree of self-sufficiency is an important issue. Furthermore, a high share of excess heat when using the MBL or FEL makes them more attractive if the excess heat can be used for other services, such as water purification or heating a swimming pool. Moreover, if selling the excess heat to a district-heating operator is possible, these two strategies might be advantageous, depending on the amount of excess heat and selling price. A higher degree of self-sufficiency is an attractive feature in a polygeneration system. In addition, a high share of renewable energy in power production is advantageous for future solutions. The polygeneration system defined in the study investigating the operating strategies possessed both features. Regarding the power demand, more than 90% in the MBL and FEL strategies and approximately 60% in the FTL strategy was generated by the polygeneration system. Approximately 40% of this power was generated by PV units. In other words, approximately 36% in the MBL and FEL, and approximately 24% in the FTL of the total power demand was provided by PV units.
In another case study (Paper V), the effect of heating demand characteristics on the performance of an optimal polygeneration system implemented in a hospital was explored. Here, a hospital application was an attractive case due to its critical load and relatively stable load profile compared to a residential application. Two load types were studied: one with a higher heating demand but no seasonal fluctuation (L01), and the second with monthly heat fluctuations and a lower heating demand (L02). Moreover, the effect of adding a thermal chiller and a cold storage unit as well as solar power and heating units were investigated through three design scenarios. The results showed that the implementation of a polygeneration system without solar power and solar heating in a hospital with load type L01 offered higher performance in comparison with a building with load type L02. Therefore, a polygeneration energy system can be a good choice for a building with a high heating demand. Since the performance of the polygeneration system was investigated relative to a reference system that used a boiler for heating, there was a higher saving potential in a hospital with a higher heating demand. Moreover, the exhaust heat of CHP units can be exploited more effectively in a system with a higher heating demand.
Adding a thermal chiller along with a cold storage can provide the possibility of exploiting excess heat for cooling purposes, which can increase the performance of the system. The existence of the solar PV units can increase the excess power during hours with high solar radiation. However, adding a cold storage to the system provides the possibility of producing extra chilling in the case of excess power, which can balance the operation of the system by using the excess power in the system rather than exporting it to the grid. Furthermore, the presence of solar PV and SHU decreases the fuel consumption and, consequently, increases the energetic and environmental performance of the system, which can decrease the effect of the heat load profile on the performance criteria. An economic evaluation of the system showed that the presence of the thermal chiller and cold storage (scenario 2) and the presence of solar heating and power units (scenario

7 Co nc luding Di sc uss io n s
98
3) have positive impacts on the economy of the system. Furthermore, even though the added components in scenarios 2 and 3 increased the complexity of the system, their presence can minimize the effect of the heat load profile on the performance of the system by balancing the heat and power with the storage device and the usage of renewable heat and power.
The climate zone can change the ambient air characteristics and the availability of renewable energy sources, such as wind and solar energy. This can consequently affect the heating, cooling, and power demand of the building, the operational performance of components, such as CHP systems and the produced heat and power by the renewable sources. This, consequently, can influence the performance of the polygeneration system. The effect of climate on the optimal design of polygeneration systems and their performance was explored through another case study (Paper VI). In this study, the model was applied to identical reference buildings located in three cities in Iran with cold, moderate, and hot climates. The results showed that for the defined cases, the polygeneration system had a higher integrated savings ratio (ISR) in a hot climate with a high amount of cooling load. Moreover, the CO2 emission mitigation potential in a building located in a city with a hot climate such as Ahvaz was higher than in the other cities. These can promote the application of polygeneration systems in hot climates in Iran. However, the capital cost of all the system was also higher there, mainly due to the larger CHP and chillers’ capacity, which can be an obstacle. Moreover, the PBP of all the investigated polygeneration systems was very long, which is discouraging. This was mainly due to the low price of electricity in Iran, giving a low value of self-produced electricity.
From the above discussion, it is concluded that an optimized polygeneration system shows significant energy and environmental benefits; however, it may or may not be economically feasible depending on the conditions under which the reference system operates. For example, the technical characteristics of a reference system, such as the efficiency of the power plant, the efficiency of the grid, and the availability of a district heating system, influence the comparative performance in terms of energy, economy, and the environment. However, if the polygeneration system is connected to a district heating system, the excess heat can be sold, which improves the economy of the polygeneration system. A polygeneration system might not be competitive in comparison with a reference system that uses a grid with a high renewable mix or highly efficient power plants. The influence of the district heating system depends on its technical design, the geographical location, and the types of energy sources for the district heating system.
The energy market in general and the prices of electricity and natural gas specifically, have a significant influence on the performance of the system. The feasibility of a polygeneration system using natural gas as the main fuel is highly sensitive to the electricity and natural gas prices. The case studies within this work were selected because the locations have relatively high or low electricity and gas

7 Co nc luding Di sc uss io n s
99
prices for the purpose of detailed analyses. Specifically, the Italian cases were chosen due to the high price of electricity the Italian power market, while the case study in Iran was chosen due to the very low price of electricity and the low price of natural gas. It is concluded that, regardless of the energetic and environmental benefits of the polygeneration system, a relatively low price of electricity in the energy market can be an obstacle for implementation of polygeneration energy systems. In general, polygeneration systems are shown to have energetic and environmental benefits according to many studies, although, in spite of these benefits, many of the systems are not economically feasible relative to the existing conventional energy solutions in the same region. Therefore, various financial mechanisms, such as tax reductions, feed-in tariffs, and subsidies, can promote the application of these systems.
The outcomes of this research provide general insights into the design, performance, and operation of polygeneration energy systems. The present study has contributed to advance knowledge on the design optimization of polygeneration energy systems. The importance of thermal chillers, cold storage devices, and solar heat and power units in enhancing the techno-economic performance of the system was evaluated. Moreover, it provided general knowledge on the potential benefits of polygeneration systems in various applications and different climate zones. The general results of this research align with many studies previously done by other researchers, can be used as guidance while investigating a polygeneration system. However, due to a large number of variables that can affect the optimal design and performance of the system, the design of a specific polygeneration system should be performed individually and the results cannot be generalized.
Future Work
The developed optimization model can effectively identify the optimal design for a polygeneration energy system. The potential of the model has not been fully exploited in this thesis due to the limited scope and the defined limitations of the research study. Its full potential can be exploited in future studies. For example, due to the high importance of self-sufficiency in the power supply, the FEL strategy was used in the case studies, where the effects of load type and climate zone on the optimal design and performance of the system were explored. In future studies, other operating strategies, such as FTL and MBL, can be applied for further investigations. In this study, the objective function of the optimization was to maximize the integrated saving ratio (ISR) in which energy, economy, and the environment were assigned specific weights. However, a further optimized design can be investigated by considering other combinations of energetic, economic, and environmental criteria through a slight modification of the objective function by giving other distributions of the weighting factors.

7 Co nc luding Di sc uss io n s
100
Furthermore, by modifying the model and designing a user-friendly interface, the proposed model can be used as an optimization tool. This tool allows stakeholders in the energy market to facilitate the identification of the optimal design of complex polygeneration systems. An engineering development task for the future could then be to format the developed model into a commercial software for planning and exploring polygeneration.

101
Bibliography
[1] BP, “BP Statistical Review of World Energy 2017,” British Petroleum, no. 66, pp. 1–52, 2017.
[2] International Energy Agency, “Electricity Information 2017: Overview,” IEA Statistics, 2017. [Online]. Available: https://www.iea.org/publications/freepublications/publication/ElectricityInformation2017Overview.pdf.
[3] J. Martin, “Distributed vs. centralized electricity generation: are we witnessing a change of paradigm? An introduction to distributed generation,” [online]: http://www.vernimmen.net/ftp/An_introduction_to_distributed_generation.pdf. Paris HEC, 2009.
[4] P. Fraser (principal author) and International Energy Agency (IEA), Distributed Generation in Liberalised Electricity Markets. Paris, France: OCEA/IEA, 2002.
[5] L. Romero Rodríguez, J. M. Salmerón Lissén, J. Sánchez Ramos, E. Á. Rodríguez Jara, and S. Álvarez Domínguez, “Analysis of the economic feasibility and reduction of a building’s energy consumption and emissions when integrating hybrid solar thermal/PV/micro-CHP systems,” Applied Energy, vol. 165, pp. 828–838, Mar. 2016.
[6] N. Hatziargyriou, Microgrids: Architectures and Control. Chichester, United Kingdom: John Wiley and Sons Ltd, 2013.
[7] G. Pepermans, J. Driesen, D. Haeseldonckx, R. Belmans, and W. D’haeseleer, “Distributed generation: Definition, benefits and issues,” Energy Policy, vol. 33, no. 6, pp. 787–798, Apr. 2005.
[8] G. Chicco and P. Mancarella, “Distributed multi-generation: A comprehensive view,” Renewable and Sustainable Energy Reviews, vol. 13, no. 3, pp. 535–551, Apr. 2009.
[9] U.S. Department of Energy, “DOE Microgrid Workshop Report,” San Diego, California, 2011.
[10] P. Mancarella, “MES (multi-energy systems): An overview of concepts and evaluation models,” Energy, vol. 65, pp. 1–17, Feb. 2014.
[11] European Commission Directorate-General for Energy, “Communication from the commission to the European parliament, the council, the European economic and social committee and the committee of the regions: an EU strategy on heating and cooling,” European

102
Commission, Directorate General for Energy, Brussels, 2016.
[12] International Energy Agency, “Energy Access Outlook 2017: From poverty to prosperity,” International Energy Agency, 2017.
[13] F. J. Ardakani and M. M. Ardehali, “Long-term electrical energy consumption forecasting for developing and developed economies based on different optimized models and historical data types,” Energy, vol. 65, pp. 452–461, Feb. 2014.
[14] T. Lambert, P. Gilman, and P. Lilienthal, “Micropower System Modeling with HOMER,” in Integration of Alternative Sources of Energy, 2006, pp. 379–418.
[15] L. M. H. Hall and A. R. Buckley, “A review of energy systems models in the UK: Prevalent usage and categorisation,” Applied Energy, vol. 169, pp. 607–628, 2016.
[16] D. Connolly, H. Lund, B. V. Mathiesen, and M. Leahy, “A review of computer tools for analysing the integration of renewable energy into various energy systems,” Applied Energy, vol. 87, no. 4, pp. 1059–1082, Apr. 2010.
[17] H. Lund, “EnergyPLAN - Advanced Energy Systems Analysis Computer Model. Documentation Version 11.4,” no. June. p. 180, 2014.
[18] Aalborg University, “EnergyPlan,” 2014. [Online]. Available: http://www.energyplan.eu/.
[19] H. Rav, “Balmorel.” [Online]. Available: http://www.balmorel.com/index.php. [Accessed: 01-Aug-2017].
[20] Stockholm Environment Institute, “Leap.” [Online]. Available: https://www.energycommunity.org/Default.asp. [Accessed: 01-Aug-2017].
[21] Risø National Laboratory Denmark, Elkraft System, AKF Institute of Local Government Studies, Stockholm Environment Institute, Institute of Physical Energetics, Lithuanian Energy Institute, PSE International, and Kaliningrad State University, Balmorel: A Model for Analyses of the Electricity and CHP Markets in the Baltic Sea Region, no. March. 2001.
[22] C. Weber, F. Marechal, and D. Favrat, “Design and optimization of district energy systems,” 17th European Symposium on Computer Aided Process Engineering, vol. 24, pp. 1127–1132, 2007.
[23] F. Marechal, C. Weber, and D. Favrat, “Multiobjective design and optimization of urban energy systems,” in Energy systems engineering, vol. 5, E. S. K. and E. N. P. Michael C. Georgiadis, Ed. Weinheim: WILEY-VCH Verlag GmbH & Co., 2008.
[24] R. P. Menon, M. Paolone, and F. Maréchal, “Study of optimal design of

103
polygeneration systems in optimal control strategies,” Energy, vol. 55, pp. 134–141, Jun. 2013.
[25] C. Brandoni, M. Renzi, F. Caresana, and F. Polonara, “Simulation of hybrid renewable microgeneration systems for variable electricity prices,” Applied Thermal Engineering, vol. 71, no. 2, pp. 667–676, Oct. 2014.
[26] CityOpt Consortium, “CITYOPT.” [Online]. Available: http://cityopt.eu/index.html. [Accessed: 20-Aug-2017].
[27] T. Korvola, O. Stenlund, and H. Rummukainen, “CITYOPT Application tools: Userguid deliverable 2.5,” 2017.
[28] N. Pardo, F. Nadler, C. Margueritte, and B. Kelly, “CITYOPT – Holistic Simulation and Optimisation of Energy in Smart Cities – Vienna Study Case,” no. c, pp. 51–55, 2015.
[29] H. Karlsson, Kenneth Bernard; Skytte, Klaus; Morthorst, Poul Erik; Bacher, Peder; Madsen, “Integrated energy systems modelling,” Technical University of Denmark, Denmark, Report, 2015.
[30] W. El-Khattam and M. M. A. Salama, “Distributed generation technologies, definitions and benefits,” Electric Power Systems Research, vol. 71, no. 2, pp. 119–128, Oct. 2004.
[31] U. Sahoo, R. Kumar, P. C. Pant, and R. Chaudhary, “Development of an innovative polygeneration process in hybrid solar-biomass system for combined power, cooling and desalination,” Applied Thermal Engineering, vol. 120, pp. 560–567, 2017.
[32] P. K. Adhvaryyu, P. K. Chattopadhyay, and A. Bhattacharya, “Dynamic optimal power flow of combined heat and power system with Valve-point effect using Krill Herd algorithm,” Energy, vol. 127, pp. 756–767, 2017.
[33] H. Al Moussawi, F. Fardoun, and H. Louahlia-Gualous, “Review of tri-generation technologies: Design evaluation, optimization, decision-making, and selection approach,” Energy Conversion and Management, vol. 120, pp. 157–196, 2016.
[34] K. Jana, A. Ray, M. M. Majoumerd, M. Assadi, and S. De, “Polygeneration as a future sustainable energy solution – A comprehensive review,” Applied Energy, vol. 202, pp. 88–111, 2017.
[35] C. Rubio-Maya, J. Uche, and A. Martínez, “Sequential optimization of a polygeneration plant,” Energy Conversion and Management, vol. 52, no. 8–9, pp. 2861–2869, 2011.
[36] F. Calise, M. Dentice d’Accadia, L. Libertini, E. Quiriti, and M. Vicidomini, “A novel tool for thermoeconomic analysis and optimization of trigeneration systems: A case study for a hospital building in Italy,” Energy, vol. 126, pp. 64–87, 2017.

104
[37] A. N. Ünal, İ. Ersöz, and G. Kayakutlu, “Operational optimization in simple tri-generation systems,” Applied Thermal Engineering, vol. 107, pp. 175–183, 2016.
[38] M. F. Torchio, “Comparison of district heating CHP and distributed generation CHP with energy, environmental and economic criteria for Northern Italy,” Energy Conversion and Management, vol. 92, pp. 114–128, 2015.
[39] S. G. Tichi, M. M. Ardehali, and M. E. Nazari, “Examination of energy price policies in Iran for optimal configuration of CHP and CCHP systems based on particle swarm optimization algorithm,” Energy Policy, vol. 38, no. 10, pp. 6240–6250, 2010.
[40] H. Ren, W. Gao, and Y. Ruan, “Optimal sizing for residential CHP system,” Applied Thermal Engineering, vol. 28, no. 5–6, pp. 514–523, Apr. 2008.
[41] M. Di Somma, B. Yan, N. Bianco, G. Graditi, P. B. Luh, L. Mongibello, and V. Naso, “Multi-objective design optimization of distributed energy systems through cost and exergy assessments,” Applied Energy, vol. 204, pp. 1299–1316, 2017.
[42] C. V. Nayar, S. M. Islam, H. Dehbonei, K. Tan, and H. Sharma, “Power Electronics for Renewable Energy Sources,” in Power Electronics Handbook, Third Edit., Elsevier, 2011, pp. 723–766.
[43] A. H. Mondal and M. Denich, “Hybrid systems for decentralized power generation in Bangladesh,” Energy for Sustainable Development, vol. 14, no. 1, pp. 48–55, Mar. 2010.
[44] A. Ghasemi, A. Asrari, M. Zarif, and S. Abdelwahed, “Techno-economic analysis of stand-alone hybrid photovoltaic-diesel-battery systems for rural electrification in eastern part of Iran - A step toward sustainable rural development,” Renewable and Sustainable Energy Reviews, vol. 28, pp. 456–462, Dec. 2013.
[45] A. Asrari, A. Ghasemi, and M. H. Javidi, “Economic evaluation of hybrid renewable energy systems for rural electrification in Iran - A case study,” Renewable and Sustainable Energy Reviews, vol. 16, no. 5, pp. 3123–3130, Jun. 2012.
[46] M. S. Adaramola, S. S. Paul, and O. M. Oyewola, “Assessment of decentralized hybrid PV solar-diesel power system for applications in Northern part of Nigeria,” Energy for Sustainable Development, vol. 19, no. 1, pp. 72–82, Jan. 2014.
[47] O. Hafez and K. Bhattacharya, “Optimal planning and design of a renewable energy based supply system for microgrids,” Renewable Energy, vol. 45, pp. 7–15, Sep. 2012.

105
[48] R. Sen and S. C. Bhattacharyya, “Off-grid electricity generation with renewable energy technologies inIndia: An application of HOMER,” Renewable Energy, vol. 62, pp. 388–398, Feb. 2014.
[49] N. El Bassam, P. Maegaard, and M. L. Schlichting, Front Matter, vol. 7, no. 2. Elsevier, 2015.
[50] S. Bhattacharyya, Green Energy and Technology. Bentham Science Publishers, 2006.
[51] O. Palizban and K. Kauhaniemi, “Microgrid control principles in island mode operation,” 2013 IEEE Grenoble Conference PowerTech, POWERTECH 2013, pp. 1–6, Jun. 2013.
[52] Y. S. Mohammed, M. W. Mustafa, and N. Bashir, “Hybrid renewable energy systems for off-grid electric power: Review of substantial issues,” Renewable and Sustainable Energy Reviews, vol. 35, pp. 527–539, Jul. 2014.
[53] L. Grégoire, Rural Electrification with PV Hybrid Systems Rural Electrification with PV Hybrid Systems. 2013.
[54] A. A. Lahimer, M. A. Alghoul, F. Yousif, T. M. Razykov, N. Amin, and K. Sopian, “Research and development aspects on decentralized electrification options for rural household,” Renewable and Sustainable Energy Reviews, vol. 24, pp. 314–324, Aug. 2013.
[55] H. Zerriffi, Rural Electrfication: Strategies for Distributed Generation. Spromger, 2011.
[56] a. a. Lahimer, M. a. Alghoul, F. Yousif, T. M. Razykov, N. Amin, and K. Sopian, “Research and development aspects on decentralized electrification options for rural household,” Renewable and Sustainable Energy Reviews, vol. 24, pp. 314–324, Aug. 2013.
[57] R. K. Akikur, R. Saidur, H. W. Ping, and K. R. Ullah, “Comparative study of stand-alone and hybrid solar energy systems suitable for off-grid rural electrification: A review,” Renewable and Sustainable Energy Reviews, vol. 27, pp. 738–752, Nov. 2013.
[58] S. Bhattacharyya, Ed., Rural Electrification Through Decentralised Off-grid Systems in Developing Countries. Leicester: Springer-Verlag London, 2013.
[59] Alliance for Rural Electrification, “Hybrid Mini-Grids for Rural Electrification: Lessons Learned,” Brussels, 2011.
[60] M. S. Adaramola, S. S. Paul, and O. M. Oyewola, “Assessment of decentralized hybrid PV solar-diesel power system for applications in Northern part of Nigeria,” Energy for Sustainable Development, vol. 19, pp. 72–82, Apr. 2014.
[61] M. A. Elhadidy and S. M. Shaahid, “Parametric study of hybrid (wind + solar + diesel) power generating systems,” Renewable Energy, vol. 21, pp.

106
129–139, Oct. 2000.
[62] M. Ranaboldo, A. García-Villoria, L. Ferrer-Martí, and R. Pastor Moreno, “A heuristic method to design autonomous village electrification projects with renewable energies,” Energy, vol. 73, pp. 96–109, Aug. 2014.
[63] K. Kusakana, “Techno-economic analysis of off-grid hydrokinetic-based hybrid energy systems for onshore/remote area in South Africa,” Energy, vol. 68, pp. 947–957, Apr. 2014.
[64] G. Léna, “Rural Electrification with PV Hybrid Systems,” 2013.
[65] S. M. Shaahid, I. El-Amin, S. Rehman, a. Al-Shehri, F. Ahmad, J. Bakashwain, and L. M. Al-Hadhrami, “Techno-Economic Potential of Retrofitting Diesel Power Systems with Hybrid Wind-Photovoltaic-Diesel Systems for Off-Grid Electrification of Remote Villages of Saudi Arabia,” International Journal of Green Energy, vol. 7, no. 6, pp. 632–646, 2010.
[66] S. M. Shaahid, L. M. Al-Hadhrami, and M. K. Rahman, “Review of economic assessment of hybrid photovoltaic-diesel-battery power systems for residential loads for different provinces of Saudi Arabia,” Renewable and Sustainable Energy Reviews, vol. 31, pp. 174–181, Mar. 2014.
[67] R. Paleta, A. Pina, and C. a. Silva, “Remote Autonomous Energy Systems Project: Towards sustainability in developing countries,” Energy, vol. 48, no. 1, pp. 431–439, Dec. 2012.
[68] G. Bekele and B. Palm, “Feasibility study for a standalone solar–wind-based hybrid energy system for application in Ethiopia,” Applied Energy, vol. 87, no. 2, pp. 487–495, Feb. 2010.
[69] D. Saheb-Koussa, M. Haddadi, and M. Belhamel, “Economic and technical study of a hybrid system (wind–photovoltaic–diesel) for rural electrification in Algeria,” Applied Energy, vol. 86, no. 7–8, pp. 1024–1030, Jul. 2009.
[70] E. M. Nfah, “Evaluation of optimal photovoltaic hybrid systems for remote villages in Far North Cameroon,” Renewable Energy, vol. 51, pp. 482–488, Mar. 2013.
[71] H. Al Moussawi, F. Fardoun, and H. Louahlia-Gualous, “Review of tri-generation technologies: Design evaluation, optimization, decision-making, and selection approach,” Energy Conversion and Management, vol. 120, pp. 157–196, 2016.
[72] A. Rong and Y. Su, “Polygeneration systems in buildings: A survey on optimization approaches,” Energy and Buildings, vol. 151, pp. 439–454, 2017.
[73] E. Merkel, R. McKenna, and W. Fichtner, “Optimisation of the capacity and the dispatch of decentralised micro-CHP systems: A case study for

107
the UK,” Applied Energy, vol. 140, pp. 120–134, 2015.
[74] J. Y. Wu, J. L. Wang, and S. Li, “Multi-objective optimal operation strategy study of micro-CCHP system,” Energy, vol. 48, no. 1, pp. 472–483, 2012.
[75] S. Sanaye and N. Khakpaay, “Simultaneous use of MRM (maximum rectangle method) and optimization methods in determining nominal capacity of gas engines in CCHP (combined cooling, heating and power) systems,” Energy, vol. 72, pp. 145–158, 2014.
[76] P. García, J. P. Torreglosa, L. M. Fernández, and F. Jurado, “Optimal energy management system for stand-alone wind turbine/photovoltaic/ hydrogen/battery hybrid system with supervisory control based on fuzzy logic,” International Journal of Hydrogen Energy, vol. 38, no. 33, pp. 14146–14158, Nov. 2013.
[77] J. J. Wang, Y. Y. Jing, and C. F. Zhang, “Optimization of capacity and operation for CCHP system by genetic algorithm,” Applied Energy, vol. 87, no. 4, pp. 1325–1335, Apr. 2010.
[78] J. Wang, Z. J. Zhai, Y. Jing, and C. Zhang, “Particle swarm optimization for redundant building cooling heating and power system,” Applied Energy, vol. 87, no. 12, pp. 3668–3679, Dec. 2010.
[79] A. Piacentino and C. Barbaro, “A comprehensive tool for efficient design and operation of polygeneration-based energy lgrids serving a cluster of buildings. Part I: Description of the method,” Applied Energy, vol. 111, pp. 1204–1221, 2013.
[80] A. Piacentino and C. Barbaro, “A comprehensive tool for efficient design and operation of polygeneration-based energy μgrids serving a cluster of buildings. Part II: Analysis of the applicative potential,” Applied Energy, vol. 111, pp. 1222–1238, 2013.
[81] O. A. Shaneb, G. Coates, and P. C. Taylor, “Sizing of residential MCHP systems,” Energy and Buildings, vol. 43, no. 8, pp. 1991–2001, Aug. 2011.
[82] M. Di Somma, B. Yan, N. Bianco, G. Graditi, P. B. Luh, L. Mongibello, and V. Naso, “Operation optimization of a distributed energy system considering energy costs and exergy efficiency,” Energy Conversion and Management, vol. 103, pp. 739–751, 2015.
[83] S. Obara, S. Watanabe, and B. Rengarajan, “Operation method study based on the energy balance of an independent microgrid using solar-powered water electrolyzer and an electric heat pump,” Energy, vol. 36, no. 8, pp. 5200–5213, 2011.
[84] E. S. Barbieri, Y. J. Dai, M. Morini, M. Pinelli, P. R. Spina, P. Sun, and R. Z. Wang, “Optimal sizing of a multi-source energy plant for power heat and cooling generation,” Applied Thermal Engineering, vol. 71, no. 2, pp. 736–750, 2014.

108
[85] H. Yousefi, M. H. Ghodusinejad, and A. Kasaeian, “Multi-objective optimal component sizing of a hybrid ICE + PV/T driven CCHP microgrid,” Applied Thermal Engineering, vol. 122, pp. 126–138, 2017.
[86] L. Guo, W. Liu, J. Cai, B. Hong, and C. Wang, “A two-stage optimal planning and design method for combined cooling, heat and power microgrid system,” Energy Conversion and Management, vol. 74, pp. 433–445, 2013.
[87] L. Li, H. Mu, W. Gao, and M. Li, “Optimization and analysis of CCHP system based on energy loads coupling of residential and office buildings,” Applied Energy, vol. 136, pp. 206–216, 2014.
[88] S. Soheyli, M. H. Shafiei Mayam, and M. Mehrjoo, “Modeling a novel CCHP system including solar and wind renewable energy resources and sizing by a CC-MOPSO algorithm,” Applied Energy, vol. 184, pp. 375–395, 2016.
[89] M. Rivarolo, A. Cuneo, A. Traverso, and A. F. Massardo, “Design optimisation of smart poly-generation energy districts through a model based approach,” Applied Thermal Engineering, vol. 99, pp. 291–301, 2016.
[90] R. Zeng, H. Li, L. Liu, X. Zhang, and G. Zhang, “A novel method based on multi-population genetic algorithm for CCHP-GSHP coupling system optimization,” Energy Conversion and Management, vol. 105, pp. 1138–1148, 2015.
[91] S. Sanaye and H. Hajabdollahi, “Thermo-Economic Optimization of Solar CCHP Using Both Genetic and Particle Swarm Algorithms,” Journal of Solar Energy Engineering, vol. 137, no. 1, p. 11001, Feb. 2014.
[92] H. Hajabdollahi, A. Ganjehkaviri, and M. N. M. Jaafar, “Assessment of new operational strategy in optimization of CCHP plant for different climates using evolutionary algorithms,” Applied Thermal Engineering, vol. 75, pp. 468–480, 2015.
[93] R. Hassan, B. Cohanim, O. de Weck, and G. Venter, “A Comparison of Particle Swarm Optimization and the Genetic Algorithm,” in 46th AIAA/ASME/ASCE/AHS/ASC Structures, Structural Dynamics and Materials Conference,Austin, Texas, 2005, pp. 1–13.
[94] B. Tudu, S. Majumder, K. K. Mandal, and N. Chakraborty, “Comparative performance study of genetic algorithm and particle swarm optimization applied on off-grid renewable hybrid energy system,” in SEMCCO 2011: Swarm, Evolutionary, and Memetic Computing, Lecture Notes in Computer Science , vol 7076. Springer, Berlin, Heidelberg.
[95] S. Ghaem Sigarchian, M. S. Orosz, H. F. Hemond, and A. Malmquist, “Optimum design of a hybrid PV-CSP-LPG microgrid with Particle Swarm Optimization technique,” Applied Thermal Engineering, vol. 109, pp.
109
1031–1036, 2016.
[96] T. Lambert, P. Gilman, and P. Lilienthal, “Micropower System Modeling with Homer,” in Integration of Alternative Sources of Energy, John Wiley & Sons, Inc., 2006, pp. 379–418.
[97] P. Lilienthal, “HOMER: The Micropower Optimization Model,” in Presented at the 2004 DOE Solar Energy Technologies, 2004, no. January.
[98] R. Kumar, R. A. Gupta, and A. K. Bansal, “Economic analysis and power management of a stand-alone wind/photovoltaic hybrid energy system using biogeography based optimization algorithm,” Swarm and Evolutionary Computation, vol. 8, pp. 33–43, Feb. 2013.
[99] G. Bekele and B. Palm, “Feasibility study for a standalone solar-wind-based hybrid energy system for application in Ethiopia,” Applied Energy, vol. 87, no. 2, pp. 487–495, Feb. 2010.
[100] T. Givler and P. Lilienthal, “Using HOMER® Software , NREL’s Micropower Optimization Model, to Explore the Role of Gen-sets in Small Solar Power Systems Case Study: Sri Lanka,” 2005.
[101] A. T. D. Perera, R. A. Attalage, K. K. C. K. Perera, and V. P. C. Dassanayake, “A hybrid tool to combine multi-objective optimization and multi-criterion decision making in designing standalone hybrid energy systems,” Applied Energy, vol. 107, pp. 412–425, Jul. 2013.
[102] C. D. Barley, C. B. Winn, L. Flowers, and H. J. Green, “Optimal Control
Remote Hybrid Part 1 : Simplifi Systems ode I Prepared for,” 1995.
[103] P. J. Mago, L. M. Chamra, and J. Ramsay, “Micro-combined cooling, heating and power systems hybrid electric-thermal load following operation,” Applied Thermal Engineering, vol. 30, no. 8–9, pp. 800–806, Jun. 2010.
[104] J. L. Bernal-Agustín and R. Dufo-López, “Hourly energy management for grid-connected wind-hydrogen systems,” International Journal of Hydrogen Energy, vol. 33, no. 22, pp. 6401–6413, Nov. 2008.
[105] J. A. P. Lopes, C. L. Moreira, and A. G. Madureira, “Defining Control Strategies for MicroGrids Islanded Operation,” IEEE Transactions on Power Systems, vol. 21, no. 2, pp. 916–924, 2006.
[106] S. Puranik, “Demand Side Management Potential in Swedish Households,” p. 45, 2014.
[107] T. H. E. Environmentaleconomical, B. Of, and T. H. E. Microgrid, “Microgrids Management,” IEEE power and, no. june, pp. 54–65, 2008.
[108] M. Sechilariu, B. C. Wang, and F. Locment, “Supervision control for optimal energy cost management in DC microgrid: Design and

110
simulation,” International Journal of Electrical Power and Energy Systems, vol. 58, pp. 140–149, Jun. 2014.
[109] F. Gonçalves and G. Mesquita, “Design Optimization of Stand-Alone Hybrid Energy Systems,” p. 120, 2010.
[110] J. L. Bernal-Agustín and R. Dufo-López, “Simulation and optimization of stand-alone hybrid renewable energy systems,” Renewable and Sustainable Energy Reviews, vol. 13, no. 8, pp. 2111–2118, Oct. 2009.
[111] C. D. Barley and C. B. Winn, “Optimal dispatch strategy in remote hybrid power systems,” Solar Energy, vol. 58, no. 4–6, pp. 165–179, Oct. 1996.
[112] R. Dufo-Lopez and J. L. Bernal-Agustin, “Design and control strategies of PV-diesel systems using genetic algorithms,” Solar Energy, vol. 79, no. 1, pp. 33–46, Jul. 2005.
[113] A. Gupta, R. P. Saini, and M. P. Sharma, “Modelling of hybrid energy system-Part II: Combined dispatch strategies and solution algorithm,” Renewable Energy, vol. 36, no. 2, pp. 466–473, Feb. 2011.
[114] N. A. Diangelakis and E. N. Pistikopoulos, “A multi-scale energy systems engineering approach to residential combined heat and power systems,” Computers & Chemical Engineering, vol. 102, pp. 128–138, 2017.
[115] T. Ma, J. Wu, and L. Hao, “Energy flow modeling and optimal operation analysis of the micro energy grid based on energy hub,” Energy Conversion and Management, vol. 133, pp. 292–306, 2017.
[116] Z. Luo, Z. Wu, Z. Li, H. Y. Cai, B. J. Li, and W. Gu, “A two-stage optimization and control for CCHP microgrid energy management,” Applied Thermal Engineering, vol. 125, pp. 513–522, 2017.
[117] F. ter Heegde and K. Sonder, “Biogas for better life : an African initiative,” 2007. [Online]. Available: http://www.snvworld.org/en/publications/biogas-for-a-better-life-an-african-initiative-0.
[118] S. Bhardwaj and S. K. Garg, “Rural Electrification by Effective Mini Hybrid PV Solar , Wind & Biogas Energy System for Rural and Remote Areas of Uttar Pradesh,” International Journal of Computer Science and Electronics Engineering (IJCSEE), vol. 2, no. 4, pp. 178–181, 2014.
[119] M. R. Borges Neto, P. C. M. Carvalho, J. O. B. Carioca, and F. J. F. Canafístula, “Biogas/photovoltaic hybrid power system for decentralized energy supply of rural areas,” Energy Policy, vol. 38, no. 8, pp. 4497–4506, Aug. 2010.
[120] M. Garfí, L. Ferrer-Martí, E. Velo, and I. Ferrer, “Evaluating benefits of low-cost household digesters for rural Andean communities,” Renewable and Sustainable Energy Reviews, vol. 16, no. 1, pp. 575–581, Jan. 2012.

111
[121] C. Nzila, J. Dewulf, H. Spanjers, D. Tuigong, H. Kiriamiti, and H. van Langenhove, “Multi criteria sustainability assessment of biogas production in Kenya,” Applied Energy, vol. 93, pp. 496–506, May 2012.
[122] I. Pérez, M. Garfí, E. Cadena, and I. Ferrer, “Technical, economic and environmental assessment of household biogas digesters for rural communities,” Renewable Energy, vol. 62, pp. 313–318, Feb. 2014.
[123] M. M. Rahman, M. M. Hasan, J. V. Paatero, and R. Lahdelma, “Hybrid application of biogas and solar resources to fulfill household energy needs: A potentially viable option in rural areas of developing countries,” Renewable Energy, vol. 68, pp. 35–45, Aug. 2014.
[124] S. Salehin, A. K. M. S. Islam, R. Hoque, M. Rahman, A. Hoque, and E. Manna, “Optimized Model of a Solar PV-Biogas-Diesel Hybrid Energy System for Adorsho Char Island ,” 3rd International Conference on the Developments in Renewable Energy Technology (ICDRET). 2014.
[125] “Energypedia - Fuel Prices Kenya,” 2013. [Online]. Available: https://energypedia.info/wiki/Fuel_Prices_Kenya#Fuel_Prices_and_Trends.
[126] X. Hu, “Particle Swarm Optimization,” Humanities Diliman, 2006. [Online]. Available: http://www.swarmintelligence.org. [Accessed: 15-May-2015].
[127] Y. Shi and R. Eberhart, “A modified particle swarm optimizer,” in 1998 IEEE International Conference on Evolutionary Computation Proceedings. IEEE World Congress on Computational Intelligence (Cat. No.98TH8360), 1998, pp. 69–73.
[128] M. Erik, H. Pedersen, and M. E. H. Pedersen, “Good parameters for particle swarm optimization,” Hvass Laboratories, 2010.
[129] M. S. Orosz and A. V. Mueller, “Dynamic Simulation of Performance and Cost of Hybrid PV-CSP-LPG Generator Micro Grids With Applications to Remote Communities in Developing Countries,” in Proceeding of the ASME 2015 Power & Energy , Power Energy 2015, 2015, no. June.
[130] E. S. Barbieri, P. R. Spina, and M. Venturini, “Analysis of innovative micro-CHP systems to meet household energy demands,” Applied Energy, vol. 97, pp. 723–733, Sep. 2012.
[131] M. A. Ehyaei and A. Mozafari, “Energy, economic and environmental (3E) analysis of a micro gas turbine employed for on-site combined heat and power production,” Energy and Buildings, vol. 42, no. 2, pp. 259–264, Feb. 2010.
[132] M. Bianchi, A. De Pascale, and P. R. Spina, “Guidelines for residential micro-CHP systems design,” Applied Energy, vol. 97, pp. 673–685, Sep. 2012.

112
[133] W. Jiang-Jiang, Z. Chun-Fa, and J. You-Yin, “Multi-criteria analysis of combined cooling, heating and power systems in different climate zones in China,” Applied Energy, vol. 87, no. 4, pp. 1247–1259, Apr. 2010.
[134] IEA EBC Annex 54, “Methodologies for the Performance Assessment of Micro Hybrid Polygeneration Systems,” IEA EBC Annex 54 Integration of Micro-Generation and Related Energy Technologies in Buildings, Technische Universität München, München, Germany, 2014.
[135] J. Kennedy and R. Eberhart, “Particle Sawrm Optimization,” in Neural Networks Proceedings., IEEE International Conference, 1995, pp. 1943–1948.
[136] Ministry for the Environment, “Summary of Emissions Factors for the Guidance for Voluntary Corporate Greenhouse Gas Reporting,” Ministry for the Environment, Manatū Mō Te Taiao, New Zealand, 2015.
[137] M. Brander, A. Sood, C. Wylie, A. Haughton, J. Lovell, and G. Davis, “Electricity-specific emission factors for grid electricity,” 2011.
[138] J. A. Duffie and W. A. Beckman, “Design of Photovoltaic Systems,” in Solar Engineering of Thermal Processes, Fourth Edi., John Wiley & Sons, Inc., Hoboken, NJ, USA., 2013, pp. 745–773.
[139] D. L. Evans, “Simplified method for predicting photovoltaic array output,” Solar Energy, vol. 27, no. 6, pp. 555–560, 1981.
[140] S. A. Kalogirou, “Photovoltaic Systems,” in Solar Energy Engineering, Elsevier, 2014, pp. 481–540.
[141] R. Pallabazzer, “Evaluation of wind-generator potentiality,” Solar energy, vol. 55, no. 1, pp. 49–59, Jul. 1995.
[142] B. Ould Bilal, C. M. F. Kébé, V. Sambou, P. A. Ndiaye, and M. Ndongo, “Economic analysis of wind electricity generation in the northern coast of Senegal,” Int. J. Metrol. Qual. Eng. EDP Sciences, vol. 5, no. 302, 2014.
[143] S. A. Kalogirou, “Wind Energy Systems,” in Solar Energy Engineering, Elsevier, 2014, pp. 735–762.
[144] Dennis Jones, “Principals of Condensing Boiler System Design,” ASHRAE Conference, vol. 120, no. 1, ASHRAE Transactions, New York, USA, 2014.
[145] R. M. Lazzarin, “Condensing boilers in buildings and plants refurbishment,” Energy and Buildings, vol. 47, pp. 61–67, Apr. 2012.
[146] D. Trier, “Solar collectors,” Solar District Heating, Fact sheet Version id: 7.1-3, 2012.
[147] Clarke Energy, “Clarke Energy,” 2018. [Online]. Available: https://www.clarke-energy.com/gas-engines/exhaust-gas-heat-exchangers/.

113
[148] Bomat.se, “Flue and exhaust gas heat exchangers,” 2018. [Online]. Available: http://www.bomat.de/fileadmin/templates/_media/download/produktinfos/BOMAT-Imagebrochure_en.pdf.
[149] P. J. Mago and L. M. Chamra, “Analysis and optimization of CCHP systems based on energy, economical, and environmental considerations,” Energy and Buildings, vol. 41, no. 10, pp. 1099–1106, 2009.
[150] I. Tegani, A. Aboubou, M. Becherif, M. Y. Ayad, O. Kraa, M. Bahri, and O. Akhrif, “Optimal sizing study of hybrid wind/PV/diesel power generation unit using genetic algorithm,” International Conference on Power Engineering, Energy and Electrical Drives, vol. 85, pp. 134–140, Jan. 2013.
[151] E. Koutroulis, D. Kolokotsa, A. Potirakis, and K. Kalaitzakis, “Methodology for optimal sizing of stand-alone photovoltaic/wind-generator systems using genetic algorithms,” Solar Energy, vol. 80, pp. 1072–1088, Sep. 2006.
[152] J. Berk and D. Peter, Corporate Finance, Global Edition, Third. Pearson, 2013.
[153] A. Nábrádi and L. Szôllôsi, “Key aspects of investment analysis,” APSTRACT (Applied Studies in Agribusiness and Commerce), vol. 1, no. APSTRACT Issue, Jan. 2007.
[154] H. S. Jagdev, J. Browne, and P. Jordan, “Verification and validation issues in manufacturing models,” Computers in Industry, vol. 25, no. 3, pp. 331–353, 1995.
[155] R. Sargent, “Verification, validation, and accreditation: Verification, validation, and accreditation of simulation models,” Proceedings of the 32nd Conference on Winter Simulation, vol. 82, pp. 50–59, 2000.
[156] J. P. C. Kleijnen, “An overview of the design and analysis of simulation experiments for sensitivity analysis,” European Journal of Operational Research, vol. 164, no. 2, pp. 287–300, 2005.
[157] D. J. Murray-Smith, Testing and Validation of Computer Simulation Models. 2015.
[158] R. G. Sargent, “Verification and validation of simulation models,” in Journal of Simulation, 2013, vol. 7, no. 1, pp. 12–24.
[159] Nautica Editrice Srl, “Italian Climatic Zone,” EuroMETEO, Nautica Online. [Online]. Available: http://www.eurometeo.com/english/read/doc_zone-climatiche.
[160] M. Bianchi, A. De Pascale, and F. Melino, “Performance analysis of an integrated CHP system with thermal and Electric Energy Storage for residential application,” Applied Energy, vol. 112, pp. 928–938, Dec. 2013.
[161] ADEME, CCE, and CRES, “DEMAND-SIDE MANAGEMENT End-

114
use metering campaign in 400 households of the European Community Assessment of the Potential Electricity Savings Project EURECO,” Odense Elforsyning Net A/S, Politecnico di Milano, Servizi Territorio, ENERTECH, 2002.
[162] S. Ghaem Sigarchian, A. Malmquist, and V. Martin, “Optimal planning and design method for complex polygeneration systems: A case study for a residential building in Italy,” Energy Conversion and Management, vol. under revi.
[163] Capstone Technical Support, “Technical Reference Capstone C30 Microturbine,” 2006. [Online]. Available: http://www.wmrc.edu/projects/bar-energy/manuals/c-30-manuals/410004_Model_C30_Performance.pdf. [Accessed: 15-Jun-2015].
[164] Capstone Technical Support, “Technical Reference Capstone C200 Microturbine,” Jun-2009. .
[165] International Energy Agency (IEA) and M. Beerepoot (lead author), “Technology Roadmap: Solar Heating and Cooling,” OECD/IEA International Energy Agency IEA Publishing, Paris, France, 2012.
[166] European Union, “How to develop a Sustainable Energy Action Plan (SEAP) - Guidebook,” European Commission,Covenant of mayors, Publications Office of the European Union, Luxembourg, 2010.
[167] P. Arcuri, G. Florio, and P. Fragiacomo, “A mixed integer programming model for optimal design of trigeneration in a hospital complex,” Energy, vol. 32, no. 8, pp. 1430–1447, Aug. 2007.
[168] S. Ghaem Sigarchian, A. Malmquist, and V. Martin, “The choice of operating strategy for a complex polygeneration system: A case study for a residential building in Italy,” Energy Conversion and Management, vol. 163, pp. 278–291, 2018.
[169] S. Ghaem Sigarchian, A. Malmquist, and V. Martin, “Design Optimization of a Complex Polygeneration System for a Hospital,” Energies, vol. 11, no. 1071, 2018.
[170] M. A. Ehyaei and M. N. Bahadori, “Selection of micro turbines to meet electrical and thermal energy needs of residential buildings in Iran,” Energy and Buildings, vol. 39, no. 12, pp. 1227–1234, Dec. 2007.
[171] M. Kasmaei, “Building and Housing Research Center affiliated to the ministry of housing and Urban Development,” Building and Housing Research Center, Tehran, 151, 1992.