Open access Childcheckpoint series: Research Lung function ...
Small rodent lung function plethysmograph
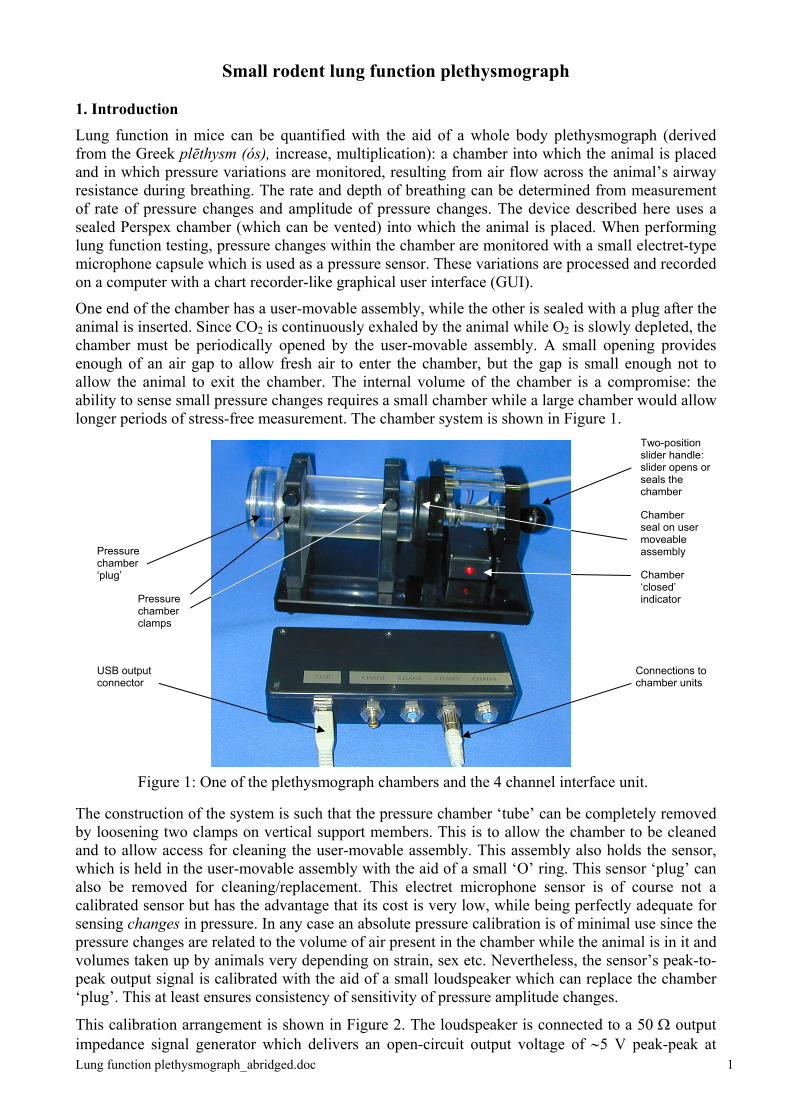
1. Introduction Lung function in mice can be quantified with the aid of a whole body plethysmograph (derived from the Greek plēthysm (ós), increase, multiplication): a chamber into which the animal is placed and in which pressure variations are monitored, resulting from air flow across the animal’s airway resistance during breathing. The rate and depth of breathing can be determined from measurement of rate of pressure changes and amplitude of pressure changes. The device described here uses a sealed Perspex chamber (which can be vented) into which the animal is placed. When performing lung function testing, pressure changes within the chamber are monitored with a small electret-type microphone capsule which is used as a pressure sensor. These variations are processed and recorded on a computer with a chart recorder-like graphical user interface (GUI).
One end of the chamber has a user-movable assembly, while the other is sealed with a plug after the animal is inserted. Since CO2 is continuously exhaled by the animal while O2 is slowly depleted, the chamber must be periodically opened by the user-movable assembly. A small opening provides enough of an air gap to allow fresh air to enter the chamber, but the gap is small enough not to allow the animal to exit the chamber. The internal volume of the chamber is a compromise: the ability to sense small pressure changes requires a small chamber while a large chamber would allow longer periods of stress-free measurement. The chamber system is shown in Figure 1.
USB output connector
Connections to chamber units
Chamber ‘closed’ indicator
Pressure chamber ‘plug’
Pressurechclamps
amber
Chamber seal on user moveable assembly
Two-position slider handle: slider opens or seals the chamber
Figure 1: One of the plethysmograph chambers and the 4 channel interface unit.
The construction of the system is such that the pressure chamber ‘tube’ can be completely removed by loosening two clamps on vertical support members. This is to allow the chamber to be cleaned and to allow access for cleaning the user-movable assembly. This assembly also holds the sensor, which is held in the user-movable assembly with the aid of a small ‘O’ ring. This sensor ‘plug’ can also be removed for cleaning/replacement. This electret microphone sensor is of course not a calibrated sensor but has the advantage that its cost is very low, while being perfectly adequate for sensing changes in pressure. In any case an absolute pressure calibration is of minimal use since the pressure changes are related to the volume of air present in the chamber while the animal is in it and volumes taken up by animals very depending on strain, sex etc. Nevertheless, the sensor’s peak-to-peak output signal is calibrated with the aid of a small loudspeaker which can replace the chamber ‘plug’. This at least ensures consistency of sensitivity of pressure amplitude changes.
This calibration arrangement is shown in Figure 2. The loudspeaker is connected to a 50 Ω output impedance signal generator which delivers an open-circuit output voltage of ∼5 V peak-peak at Lung function plethysmograph_abridged.doc 1
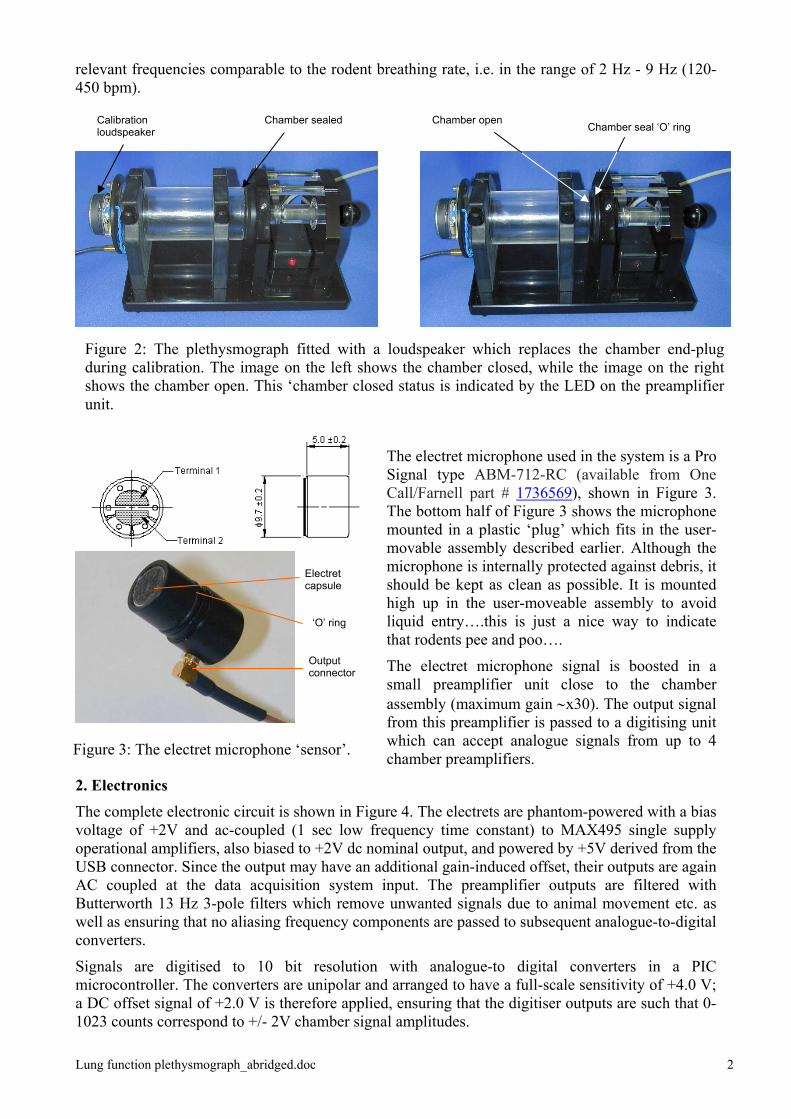
relevant frequencies comparable to the rodent breathing rate, i.e. in the range of 2 Hz - 9 Hz (120-450 bpm).
Calibration loudspeaker
Chamber sealed Chamber open Chamber seal ‘O’ ring
Figure 2: The plethysmograph fitted with a loudspeaker which replaces the chamber end-plug during calibration. The image on the left shows the chamber closed, while the image on the right shows the chamber open. This ‘chamber closed status is indicated by the LED on the preamplifier unit.
Output connector
Electret capsule
‘O’ ring
Figure 3: The electret microphone ‘sensor’.
The electret microphone used in the system is a Pro Signal type ABM-712-RC (available from One Call/Farnell part # 1736569), shown in Figure 3. The bottom half of Figure 3 shows the microphone mounted in a plastic ‘plug’ which fits in the user-movable assembly described earlier. Although the microphone is internally protected against debris, it should be kept as clean as possible. It is mounted high up in the user-moveable assembly to avoid liquid entry….this is just a nice way to indicate that rodents pee and poo….
The electret microphone signal is boosted in a small preamplifier unit close to the chamber assembly (maximum gain ∼x30). The output signal from this preamplifier is passed to a digitising unit which can accept analogue signals from up to 4 chamber preamplifiers.
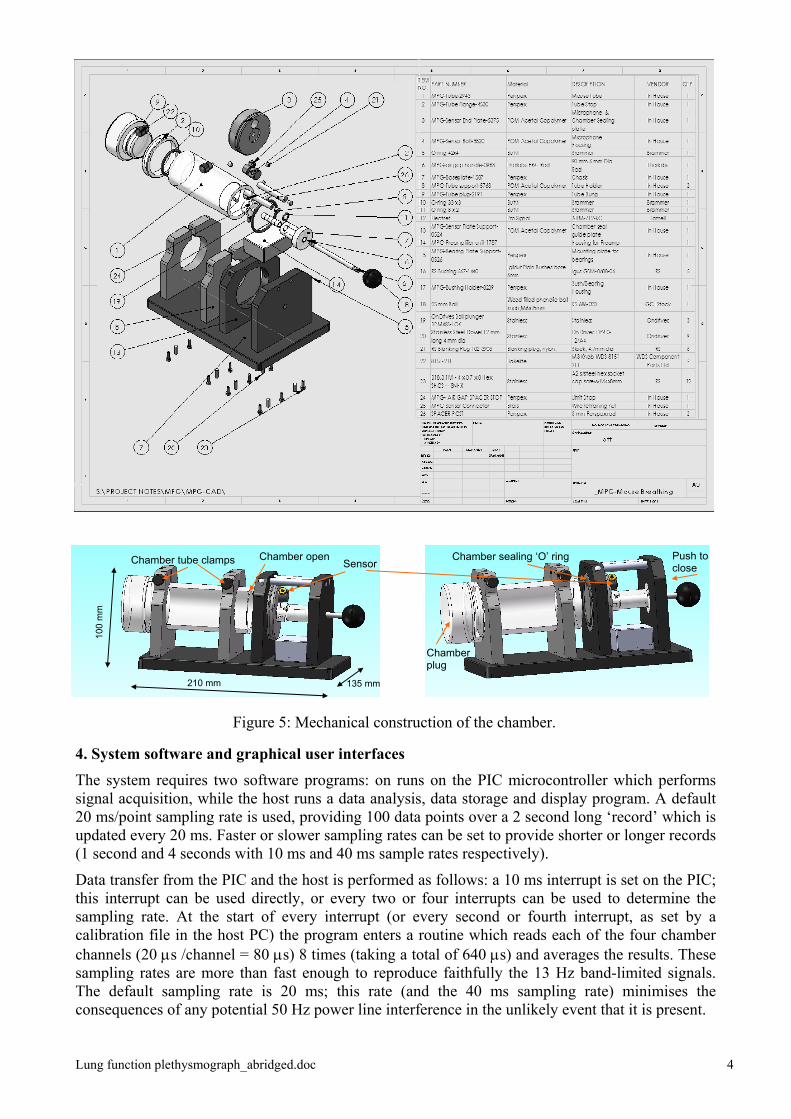
2. Electronics
The complete electronic circuit is shown in Figure 4. The electrets are phantom-powered with a bias voltage of +2V and ac-coupled (1 sec low frequency time constant) to MAX495 single supply operational amplifiers, also biased to +2V dc nominal output, and powered by +5V derived from the USB connector. Since the output may have an additional gain-induced offset, their outputs are again AC coupled at the data acquisition system input. The preamplifier outputs are filtered with Butterworth 13 Hz 3-pole filters which remove unwanted signals due to animal movement etc. as well as ensuring that no aliasing frequency components are passed to subsequent analogue-to-digital converters.
Signals are digitised to 10 bit resolution with analogue-to digital converters in a PIC microcontroller. The converters are unipolar and arranged to have a full-scale sensitivity of +4.0 V; a DC offset signal of +2.0 V is therefore applied, ensuring that the digitiser outputs are such that 0-1023 counts correspond to +/- 2V chamber signal amplitudes.
Lung function plethysmograph_abridged.doc 2
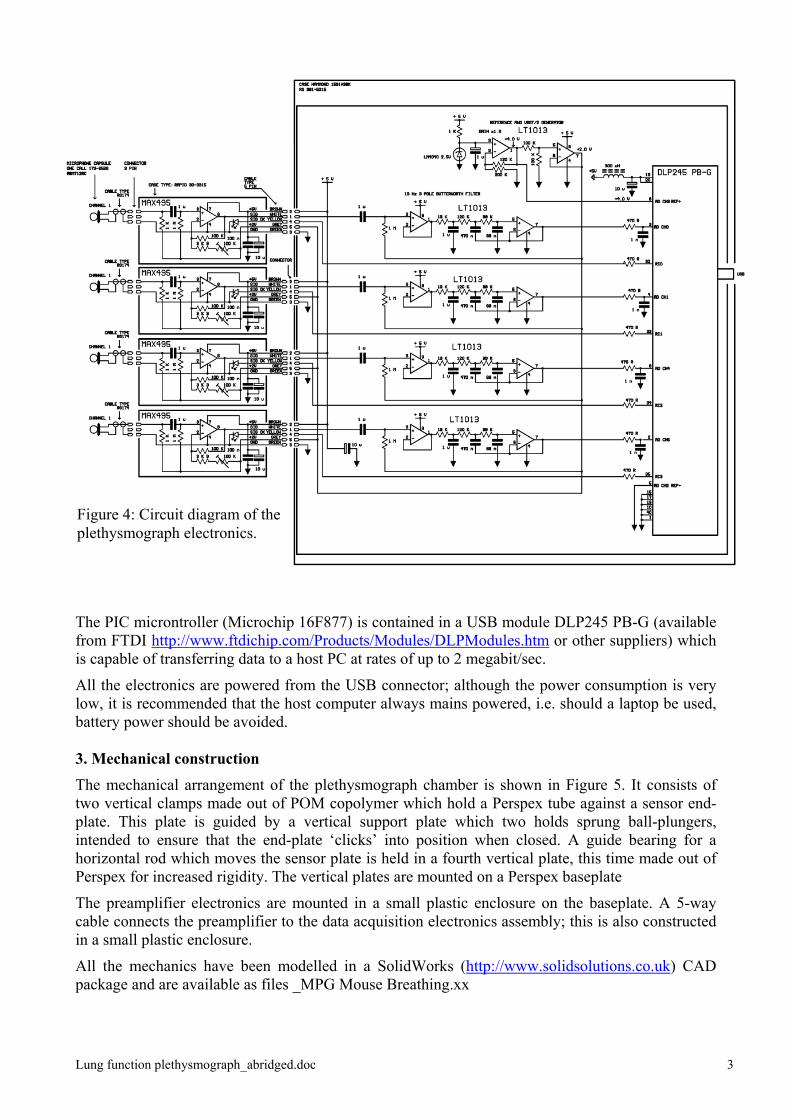
Figure 4: Circuit diagram of the plethysmograph electronics.
The PIC microntroller (Microchip 16F877) is contained in a USB module DLP245 PB-G (available from FTDI http://www.ftdichip.com/Products/Modules/DLPModules.htm or other suppliers) which is capable of transferring data to a host PC at rates of up to 2 megabit/sec.
All the electronics are powered from the USB connector; although the power consumption is very low, it is recommended that the host computer always mains powered, i.e. should a laptop be used, battery power should be avoided. 3. Mechanical construction The mechanical arrangement of the plethysmograph chamber is shown in Figure 5. It consists of two vertical clamps made out of POM copolymer which hold a Perspex tube against a sensor end-plate. This plate is guided by a vertical support plate which two holds sprung ball-plungers, intended to ensure that the end-plate ‘clicks’ into position when closed. A guide bearing for a horizontal rod which moves the sensor plate is held in a fourth vertical plate, this time made out of Perspex for increased rigidity. The vertical plates are mounted on a Perspex baseplate
The preamplifier electronics are mounted in a small plastic enclosure on the baseplate. A 5-way cable connects the preamplifier to the data acquisition electronics assembly; this is also constructed in a small plastic enclosure.
All the mechanics have been modelled in a SolidWorks (http://www.solidsolutions.co.uk) CAD package and are available as files _MPG Mouse Breathing.xx
Lung function plethysmograph_abridged.doc 3
Chamber plug
Chamber sealing ‘O’ ring
210 mm 135 mm
Chamber open Sensor Chamber tube clamps Push to
close
100
mm
Figure 5: Mechanical construction of the chamber.
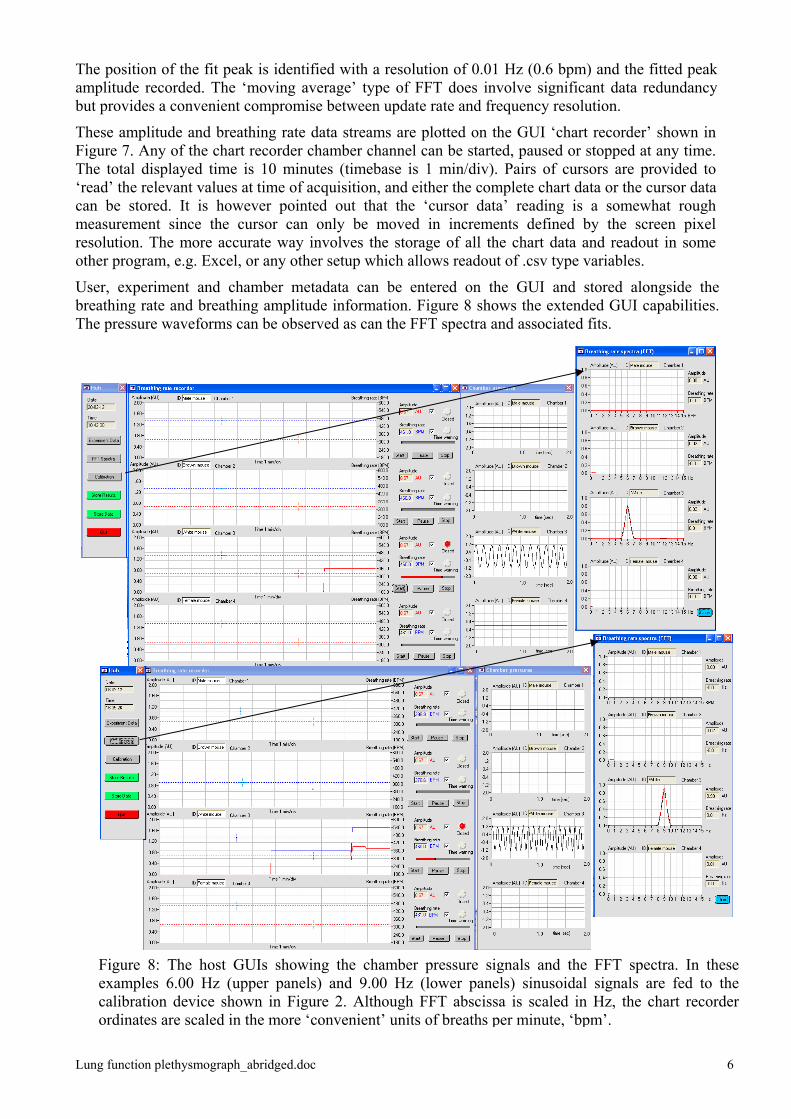
4. System software and graphical user interfaces The system requires two software programs: on runs on the PIC microcontroller which performs signal acquisition, while the host runs a data analysis, data storage and display program. A default 20 ms/point sampling rate is used, providing 100 data points over a 2 second long ‘record’ which is updated every 20 ms. Faster or slower sampling rates can be set to provide shorter or longer records (1 second and 4 seconds with 10 ms and 40 ms sample rates respectively).
Data transfer from the PIC and the host is performed as follows: a 10 ms interrupt is set on the PIC; this interrupt can be used directly, or every two or four interrupts can be used to determine the sampling rate. At the start of every interrupt (or every second or fourth interrupt, as set by a calibration file in the host PC) the program enters a routine which reads each of the four chamber channels (20 µs /channel = 80 µs) 8 times (taking a total of 640 µs) and averages the results. These sampling rates are more than fast enough to reproduce faithfully the 13 Hz band-limited signals. The default sampling rate is 20 ms; this rate (and the 40 ms sampling rate) minimises the consequences of any potential 50 Hz power line interference in the unlikely event that it is present.
Lung function plethysmograph_abridged.doc 4
After exiting the interrupt routine the measured value of each channel, which consists of 2 bytes per channel is written to a USB interface chip buffer, where it waits to be read by the host computer. The computer requests data every 100 ms and thus 5 readings per channel (20 values) are transferred when the default 20 ms sampling rate is used. A further counter in the PIC interrupt routine is used to store readings from each channel every 400 ms. This slower sampling rate is used to determine whether the chamber is closed or not. The last 4 channel readings are added together and if the result is less than a value set on the host PC, a ‘no-signal’ condition is assumed, resulting from an ‘open’ chamber. This condition turns on a logic level which is fed back to the appropriate chamber preamplifier, turning off the LED indicator on the relevant chamber assembly. This arrangement overcomes any potential reliability problems that would have been caused by fitting, for example, a microswitch to the user-movable assembly. Such arrangements, or detection with a reflective opto-sensor, had been tried in the past but were found to be unreliable in the longer term. The state of the ‘chamber closed’ signal is also used by the host to control a software LED. Furthermore, this signal is used to start a timer on the host software. A value for the maximum time allowed is preset on the calibration panel, shown in Figure 7. When this time has been reached, a warning message is displayed and an audible alarm sounded. At this point, the user must open the chamber for a certain time, again as defined on the calibration panel.
Lung function plethysmograph_abridged.doc 5
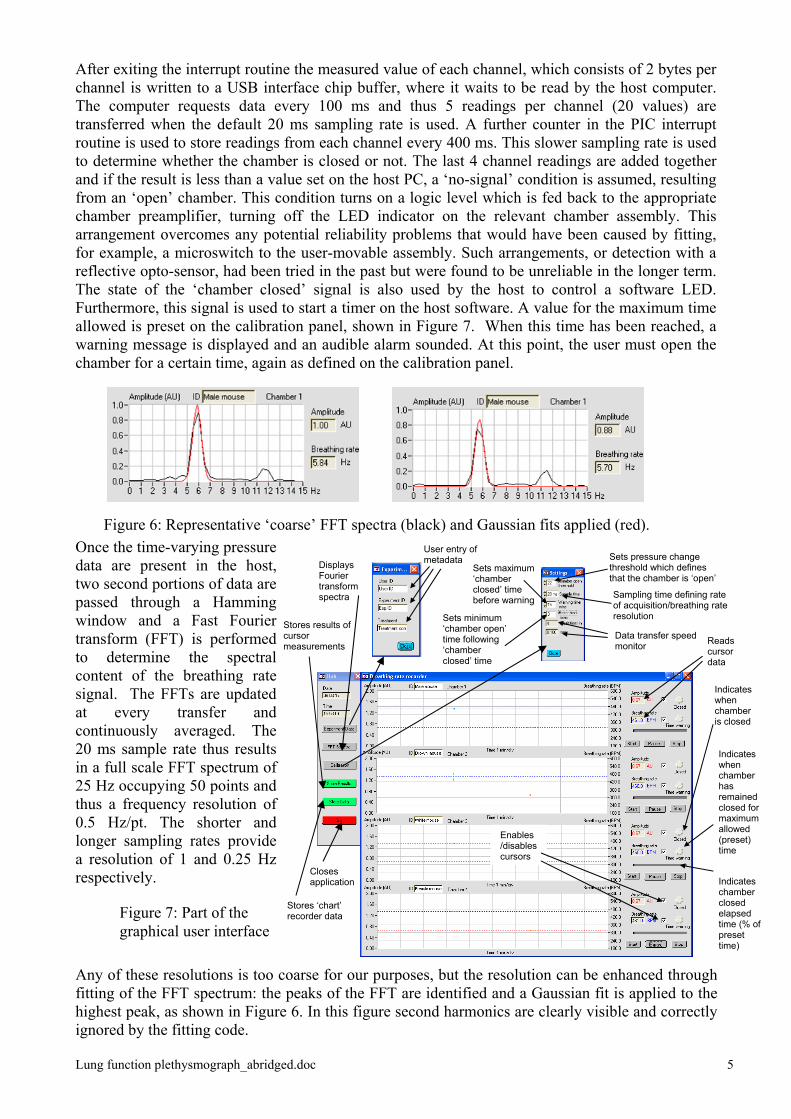
Once the time-varying pressure data are present in the host, two second portions of data are passed through a Hamming window and a Fast Fourier transform (FFT) is performed to determine the spectral content of the breathing rate signal. The FFTs are updated at every transfer and continuously averaged. The 20 ms sample rate thus results in a full scale FFT spectrum of 25 Hz occupying 50 points and thus a frequency resolution of 0.5 Hz/pt. The shorter and longer sampling rates provide a resolution of 1 and 0.25 Hz respectively.
Figure 6: Representative ‘coarse’ FFT spectra (black) and Gaussian fits applied (red). User entry of metadata Sets pressure change
threshold which defines that the chamber is ‘open’
Sampling time defining rate of acquisition/breathing rate resolution
Sets maximum ‘chamber closed’ time before warning
Data transfer speed monitor
Stores results ocursor measurements
f
Stores ‘chart’ recorder data
Closes application
Sets minimum ‘chamber otime following ‘chamber closed’ tim
pen’
e
Reads cursor data
Enables /disablescu
rsors
Displays Fourier transform spectra
Indicates when chamber is closed
Indicates when chamber has remained closed for maximum allowed (preset) time
Indicates chamber closed elapsed time (% of preset time)
Figure 7: Part of the graphical user interface
Any of these resolutions is too coarse for our purposes, but the resolution can be enhanced through fitting of the FFT spectrum: the peaks of the FFT are identified and a Gaussian fit is applied to the highest peak, as shown in Figure 6. In this figure second harmonics are clearly visible and correctly ignored by the fitting code.
The position of the fit peak is identified with a resolution of 0.01 Hz (0.6 bpm) and the fitted peak amplitude recorded. The ‘moving average’ type of FFT does involve significant data redundancy but provides a convenient compromise between update rate and frequency resolution.
These amplitude and breathing rate data streams are plotted on the GUI ‘chart recorder’ shown in Figure 7. Any of the chart recorder chamber channel can be started, paused or stopped at any time. The total displayed time is 10 minutes (timebase is 1 min/div). Pairs of cursors are provided to ‘read’ the relevant values at time of acquisition, and either the complete chart data or the cursor data can be stored. It is however pointed out that the ‘cursor data’ reading is a somewhat rough measurement since the cursor can only be moved in increments defined by the screen pixel resolution. The more accurate way involves the storage of all the chart data and readout in some other program, e.g. Excel, or any other setup which allows readout of .csv type variables.
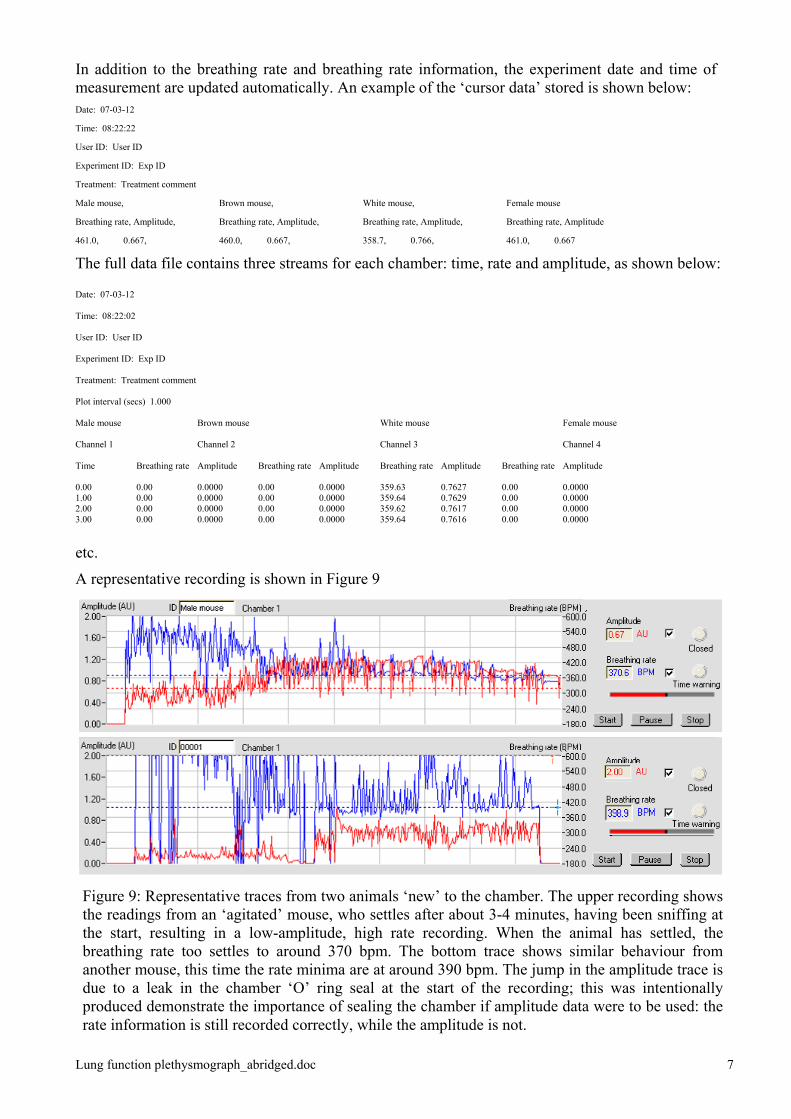
User, experiment and chamber metadata can be entered on the GUI and stored alongside the breathing rate and breathing amplitude information. Figure 8 shows the extended GUI capabilities. The pressure waveforms can be observed as can the FFT spectra and associated fits.
Lu
Figure 8: The host GUIs showing the chamber pressure signals and the FFT spectra. In these examples 6.00 Hz (upper panels) and 9.00 Hz (lower panels) sinusoidal signals are fed to the calibration device shown in Figure 2. Although FFT abscissa is scaled in Hz, the chart recorder ordinates are scaled in the more ‘convenient’ units of breaths per minute, ‘bpm’.
ng function plethysmograph_abridged.doc 6
In addition to the breathing rate and breathing rate information, the experiment date and time of measurement are updated automatically. An example of the ‘cursor data’ stored is shown below: Date: 07-03-12
Time: 08:22:22
User ID: User ID
Experiment ID: Exp ID
Treatment: Treatment comment
Male mouse, Brown mouse, White mouse, Female mouse
Breathing rate, Amplitude, Breathing rate, Amplitude, Breathing rate, Amplitude, Breathing rate, Amplitude
461.0, 0.667, 460.0, 0.667, 358.7, 0.766, 461.0, 0.667
The full data file contains three streams for each chamber: time, rate and amplitude, as shown below: Date: 07-03-12 Time: 08:22:02 User ID: User ID Experiment ID: Exp ID Treatment: Treatment comment Plot interval (secs) 1.000 Male mouse Brown mouse White mouse Female mouse Channel 1 Channel 2 Channel 3 Channel 4 Time Breathing rate Amplitude Breathing rate Amplitude Breathing rate Amplitude Breathing rate Amplitude 0.00 0.00 0.0000 0.00 0.0000 359.63 0.7627 0.00 0.0000 1.00 0.00 0.0000 0.00 0.0000 359.64 0.7629 0.00 0.0000 2.00 0.00 0.0000 0.00 0.0000 359.62 0.7617 0.00 0.0000 3.00 0.00 0.0000 0.00 0.0000 359.64 0.7616 0.00 0.0000
etc.
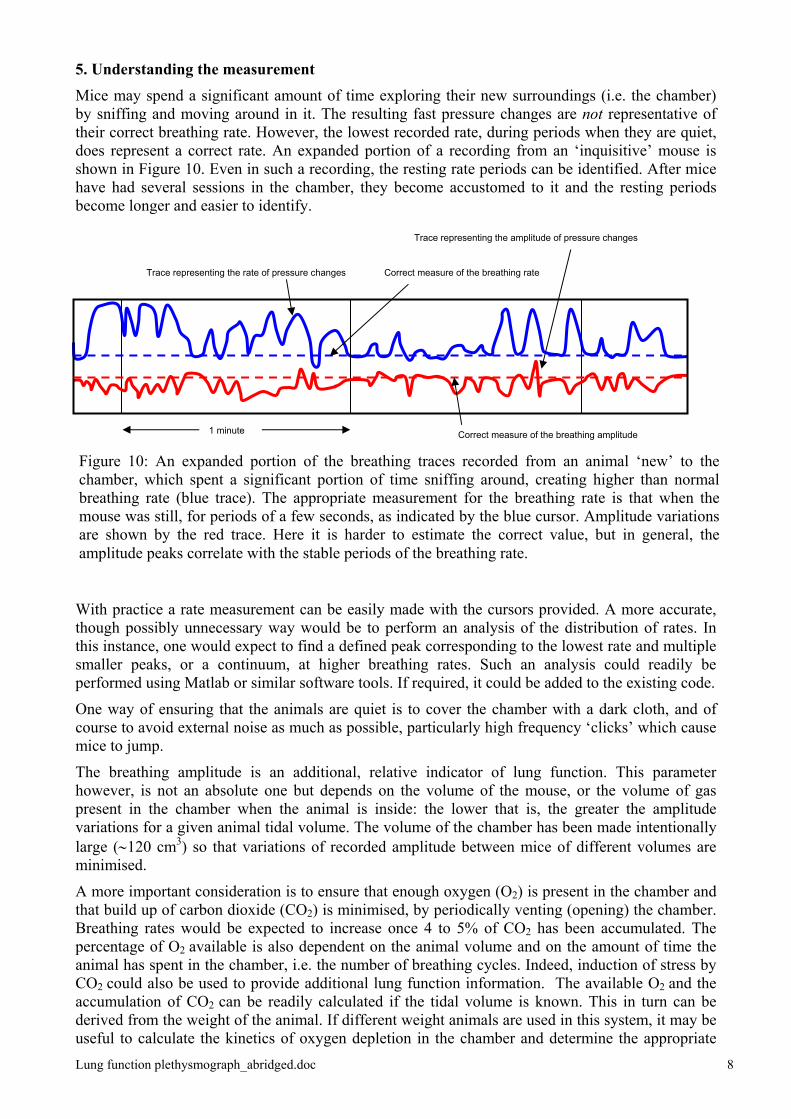
A representative recording is shown in Figure 9
Figure 9: Representative traces from two animals ‘new’ to the chamber. The upper recording shows the readings from an ‘agitated’ mouse, who settles after about 3-4 minutes, having been sniffing at the start, resulting in a low-amplitude, high rate recording. When the animal has settled, the breathing rate too settles to around 370 bpm. The bottom trace shows similar behaviour from another mouse, this time the rate minima are at around 390 bpm. The jump in the amplitude trace is due to a leak in the chamber ‘O’ ring seal at the start of the recording; this was intentionally produced demonstrate the importance of sealing the chamber if amplitude data were to be used: the rate information is still recorded correctly, while the amplitude is not.
Lung function plethysmograph_abridged.doc 7
5. Understanding the measurement Mice may spend a significant amount of time exploring their new surroundings (i.e. the chamber) by sniffing and moving around in it. The resulting fast pressure changes are not representative of their correct breathing rate. However, the lowest recorded rate, during periods when they are quiet, does represent a correct rate. An expanded portion of a recording from an ‘inquisitive’ mouse is shown in Figure 10. Even in such a recording, the resting rate periods can be identified. After mice have had several sessions in the chamber, they become accustomed to it and the resting periods become longer and easier to identify.
1 minute
Correct measure of the breathing rate Trace representing the rate of pressure changes
Trace representing the amplitude of pressure changes
Correct measure of the breathing amplitude
Figure 10: An expanded portion of the breathing traces recorded from an animal ‘new’ to the chamber, which spent a significant portion of time sniffing around, creating higher than normal breathing rate (blue trace). The appropriate measurement for the breathing rate is that when the mouse was still, for periods of a few seconds, as indicated by the blue cursor. Amplitude variations are shown by the red trace. Here it is harder to estimate the correct value, but in general, the amplitude peaks correlate with the stable periods of the breathing rate.
With practice a rate measurement can be easily made with the cursors provided. A more accurate, though possibly unnecessary way would be to perform an analysis of the distribution of rates. In this instance, one would expect to find a defined peak corresponding to the lowest rate and multiple smaller peaks, or a continuum, at higher breathing rates. Such an analysis could readily be performed using Matlab or similar software tools. If required, it could be added to the existing code.
One way of ensuring that the animals are quiet is to cover the chamber with a dark cloth, and of course to avoid external noise as much as possible, particularly high frequency ‘clicks’ which cause mice to jump.
The breathing amplitude is an additional, relative indicator of lung function. This parameter however, is not an absolute one but depends on the volume of the mouse, or the volume of gas present in the chamber when the animal is inside: the lower that is, the greater the amplitude variations for a given animal tidal volume. The volume of the chamber has been made intentionally large (∼120 cm3) so that variations of recorded amplitude between mice of different volumes are minimised.
A more important consideration is to ensure that enough oxygen (O2) is present in the chamber and that build up of carbon dioxide (CO2) is minimised, by periodically venting (opening) the chamber. Breathing rates would be expected to increase once 4 to 5% of CO2 has been accumulated. The percentage of O2 available is also dependent on the animal volume and on the amount of time the animal has spent in the chamber, i.e. the number of breathing cycles. Indeed, induction of stress by CO2 could also be used to provide additional lung function information. The available O2 and the accumulation of CO2 can be readily calculated if the tidal volume is known. This in turn can be derived from the weight of the animal. If different weight animals are used in this system, it may be useful to calculate the kinetics of oxygen depletion in the chamber and determine the appropriate Lung function plethysmograph_abridged.doc 8
Lung function plethysmograph_abridged.doc 9
length of time that the animals could be kept in the closed chamber, particularly if this time will be significantly more than ten minutes. This is one of the reasons why the chart recorder timebase has been set to 1 min/div, 10 divisions.
The following equations can be used to calculate O2 depletion and CO2 production in the chamber after various periods of respiration. nz(O2) = no(O2) 1 – ((Vt/Vc)(1-f))Z
where: Z= number of breaths nz(O2) = amount of O2 (or CO2) in chamber after Z breaths no(O2) = amount of O2 (or CO2) in chamber at the start, i.e. at Z = 0 Vt = tidal volume (volume of air exhaled) by the mouse Vc = volume of chamber less the volume occupied by the mouse f = ratio of exhaled to inhaled O2 (i.e. 16%/21% = 0.762) The volume available for respiration, Vc, is ∼100 cm3 but the exact value of course depends on the volume taken up by the animal.
The tidal volume, Vt, can be calculated as follows:
Vt = [Minute volume (cm3 air/min)] / [Breathing rate (mean observed bpm value)]
The minute volume can be determined using a semi-empirical relation derived by Guyton (Guyton, AC (1947) Measurement of the respiratory volumes of laboratory animals. American Journal of Physiology, 150, 10-11):
Minute volume = 2.10 x animal weight (gm)0.75.
The minute volume, for a 30 gram mouse is ∼ 27 cm3/min. If the mean bpm is 390 bpm (6.5 Hz) The tidal volume Vt ≈ 0.07 cm3. This system was developed in early 2011 as part of a collaborative project with Ms C. Eccles and Prof. K. Vallis. Most of the construction was performed by R.G. Newman who also wrote the software. J. Prentice and B. Vojnovic designed the mechanics and electronics respectively while R.G. Newman was also involved in the project design. This note was prepared by B Vojnovic and R.G. Newman in March 2012, shortly after preliminary animal testing, once Home Office approval had been obtained.
We acknowledge the financial support of Cancer Research UK.
© Gray Institute, Department of Oncology, University of Oxford, 2012. This work is licensed under the Creative Commons Attribution-NonCommercial-NoDerivs 3.0 Unported License. To view a copy of this license, visit http://creativecommons.org/licenses/by-nc-nd/3.0/ or send a letter to Creative Commons, 444 Castro Street, Suite 900, Mountain View, California, 94041, USA.