SLUDGE SOLIDIFICATION PIT INTERIM REMEDIATION PROJECT JOB ... · sludge solidification methods for...
69
SLUDGE SOLIDIFICATION PIT 5 INTERIM REMEDIATION PROJECT JOB NO. 1.1.3.1.02 03/01/89
Transcript of SLUDGE SOLIDIFICATION PIT INTERIM REMEDIATION PROJECT JOB ... · sludge solidification methods for...
SLUDGE SOLIDIFICATION PIT 5 INTERIM REMEDIATION PROJECT JOB NO. 1.1.3.1.02
03/01/89

p - 1 - 4 i I
i- \ I
THE RALPH M. PARSONS COMPANY
STUDY NO. P130011 SLUDGE SOLIDIFICATION
Pit 5 Interim Remediation Project Job NO. 1.1.3..1.02
f o r Uestinghouse Materials Company of Ohio
March, 1989
I - I

I
THE RALPH H. PARSONS COMPANY
STUDY NO. P130011 SLUDGE SOLIDIFICATION
Pit 5 Interim Remediation Project Job No. 1.1.3.1.02
for Westinghouse Materials Company of Ohio
March, 1989
31 4
I 1 I i
SECTION
1.0
1.1
1.2
1.3
2.0
3.0
4.0
4.1
4.2
5.0
6.0
7.0
7.1
7.1.1
7.1.2
7.. 1. 3
7.1.4
7.1.5
7.1.6
7.2
7.2.1
7.2.2
7.2.3
8.0
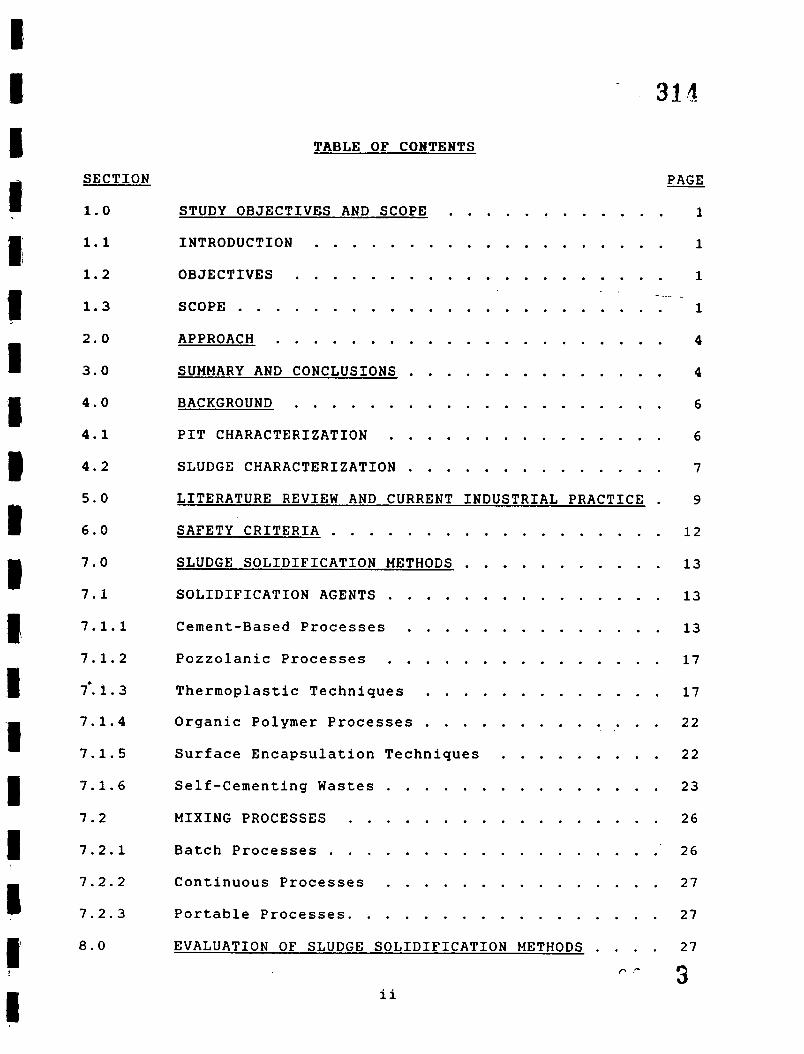
TABLE OF CONTENTS
PAGE
STUDY OBJECTIVES AND SCOPE 1
INTRODUCTION . . . . . . . . . . . . . . . . . . . 1
. . . . . . . . . . . .
OBJECTIVES . . . . . . . . . . . . . . . . . . . . 1
SCOPE . . . . . . . . . . . . . . . . . . . . . . . 1 . . .......
APPROACH . . . . . . . . . . . . . . . . . . . . . 4
SUMMARY AND CONCLUSIONS 4
BACKGROUND . . . . . . . . . . . . . . . . . . . . 6
PIT CHARACTERIZATION 6
. . . . . . . . . . . . . .
. . . . . . . . . . . . . . . . . . . . . . . . . . . . . SLUDGE CHARACTERIZATION 7
LITERATURE REVIEW AND CURRENT INDUSTRIAL PRACTICE . 9
SAFETY CRITERIA . . . . . . . . . . . . . . . . . . 12 SLUDGE SOLIDIFICATION METHODS . . . . . . . . . . . 13 SOLIDIFICATION AGENTS . . . . . . . . . . . . . . . 13 Cement-Based Processes . . . . . . . . . . . . . . 13 Pozzolanic Processes . . . . . . . . . . . . . . . 17 Thermoplastic Techniques . . . . . . . . . . . . . 17 Organic Polymer Processes . . . . . . . . . . . . . 22 . .
Surface Encapsulation Techniques . . . . . . . . . 22 Self-cementing Wastes . . . . . . . . . . . . . . . 23 MIXING PROCESSES . . . . . . . . . . . . . . . . . 26 Batch Processes . . . . . . . . . . . . . . . . . . 26 Continuous Processes . . . . . . . . . . . . . . . 27 Portable Processes. . . . . . . . . . . . . . . . . 27 EVALUATION OF SLUDGE SOLIDIFICATION METHODS . . . . 27
3 P .-
ii

i
I TABLE OF CONTENTS
( C o n t i n u e d )
i
1
SECTION PAGE
8.1 TECHNICAL FEASIBILITY . . . . . . . . . . . . . . . 27
a. 2 WORKER SAFETY AND HEALTH . . . . . . . . . . . . . 29
9.1
9.2
9.3
9.4
'9.0 - - . DESCRIPTION OF SELECTED SLUDGE SOLIDIFICATION PROCESS (BASED ON CEMENT & FLY ASH) . . . . . . . . 30
G E N E R A L . . . . . . . . . . . . . . . . . . . . . . 30
MIX FOR SOLIDIFICATION . . . . . . . . . . . . . . 34
PROCESSING RATE . . . . . . . . . . . . . . . . . . 35
REQUIREMENTS OF CEMENT AND FLY ASH A-ND GROUT PRODUCTION . . . . . . . . . . . . . . . . . . . . 37
9.5
9.6
9.7
9.8
9.9
9.10
9.11
10.0
11.0
SLUDGE THICKENING . . . . . . . . . . . . . . . . . 38
WATER REQUIREMENTS . . . . . . . . . . . . . . . . 40
SLUDGE STORAGE . . . . . . . . . . . . . . . . . . 41
CEMENT AND FLY ASH HANDLING AND STORAGE . . . . . . 42
SLUDGE AND GROUT PUMPING . . . . . . . . . . . . . 42
GROUT MIXING . . . . . . . . . . . . . . . . . . . 43
FLUSH WATER RECEIPT TANK . . . . . . . . . . . . . 44
REFERENCES . . . . . . . . . . . . . . . . . . . . 44
APPENDIX. . . . :. . . . . . . . . . . . . . . . . 47
a 1
I f c .- 4'
iii

.-
LIST OF FIGURES
F I G U R E
324
PAGE
Figure 1.1 Interaction Of Project Studies With Design Approach . . . . . . . . . . . . . . . . . . . 2
Figure 1.2 Solidification Study Screening Process . . . . 3
Figure 4.1 Pit 5 Sample Points . . . . . . . . . . . . . 8
Figure 7.1 Typical Cement-Based Solidification System Flow Diagram . . . . . . . . . . . . . . . . . . . 15
Figure 7.2 Typical Pozzolanic Solidification Process Flow Diagram . . . . . . . . . . . . . . . . . . . 18
Figure 7.3 Block Flow Diagram F o r Typical Thermoplastic . Process . . . . . . . . . . . . . . . . . . . 20
Figure 7.4 Block Flow Diagram For Typical Organic Polymer Process . . . . . . . . . . . . . . . . . . . 21
Figure 7.5 Block Flow Diagram For A Typical Surface Encapsulation Technique . . . . . . . . . . . 24
Figure 7.6 Block Flow Diagram For A Typical Self-cementing Process . . . . . . . . . . . . . . . . . . . 25
Figure 9.1 Sludge Solidification Block Diagram . . . . . 31 F i g u r e 9.2 Cement/Fly A s h Handling Flow Diagram . . . . . 32 Figure 9.3 Sludge Mixing Flow Diagram . . . . . . . . . . 33
. P - C 3
iv

8 I I a I 1 I
I 1 I 2 u 1:
I I t 1
i
i
314
LIST OF TABLES
TABLE PAGE
Table 8.1: Comparison of Solidification Alternatives . . 29
Table 9.1: Time Schedules for Different Sludge Pumping Rates . . . . . . . . . . . . . . . . . . . . 36
Table 9.2: Requirements Cf Cement Acd.Fly.Ash And Grout Production . . . . . . . . . . . . . . . . . 38
Table 9.3: Thickener lnput/Output Data. . . . . . . . . . 40
Table 9.4: Water Requirements For Sludge Solidification . 41
G r - ”
V

'\ 314
1.0
1.1
1.2
1.3
STUDY OBJECTIVES AND SCOPE
INTRODUCTION
The Feed Materials Production Center (FMPC) is a uranium metal processing facility occupying a 1,050 - acre site northwest of Cincinnati, Ohio. The FMPC is owned by the U . S . Department of Energy (DOE) and operated under contract by Westinghouse Materials Company of Ohio (WMCO). .-
Pit 5 is one of the many candidates for remedial action on the FMPC site. The Pit 5 Interim Remediation Project bid was awarded to The Ralph M . Parsons Company (Parsons); Charlotte, North Carolina. Parson's charter is to develop a Design Criteria for the interim remediation of Pit 5. This study covers the solidification of sludge from Pit 5.
OBJECTIVES
The objective of this study is to select the most feasible solidification method for stabilizing sludge from Pit 5. This study will describe and evaluate sludge solidification methods for the Pit 5 Interim Remediation Project. The ultimate goal is to define a sludge solidification method that will become part of the Design Criteria Report. To this end, the available waste solidification techniques that are currently in
recommended sludge solidification process is developed, and an evaluation has been performed to rate the various processes.
use or under development have been examined. A
SCOPE
This Sludge .Solidification Study is one in a series of studies being prepared for the Pit 5 Interim Remediation Project. As shown in Figure 1.1, several studies are being prepared in conjunction with the Sludge Solidification Study. After all studies are completed, the Sludge Solidification Study will become part of the system recommended to treat the sludge and convert it into a solid form for final disposal.
An overview of the sludge solidification processes examined in this study are illustrated in Figure 1.2. An initial evaluation was performed to consider the major interactive factors impacting the choice of a process for sludge solidification. It was evident that solidification techniques other than cement or pozzolanic based processes lack the potential f o f '. 7
1

8 I I I i 1 II I I I U 1 1 E I - I I R I
m E
II)
I I
. n rn c d
* - v,
c 0
8 .. P. -
2

4 - .-- . . - - - - c ' C . z T - - I -{?E. -- OUALITATIVE : , !'L!dL a-1
ANALYSIS SOLIDIFICATION METHODS
-- I
THIS DRAWING PREPARED BY
THE RALPH M.PARSONS COMPANY
ORA%WB'
ARCHITECTS - ENGINEERS SCALE NONE
d 3-21-89
CHARLOTTE , N. C
REVISED DATE ,
VEAY FLEXIBLE .LOY VOLUME TH3OUWWT 0 VERY COSTLY 0 FAIFLY FLEXIBLE 0 HlGH VOLUME THROffiHPUT .LOU COST
FAIRLY FLEXIBLE 0 MEDIUM VOLUME THROUGHPUT *MEDIUM COST
\
314 BATCH
CONTINUOUS
PORTABLE
0 RAM WTERlN-S ARE INEXPENSIVE 0 WELL ESTABLISH0 TECHNOLOGY
FLEXIBLE . LO'd ENERGY CONSUMPTION
CEMENT-BASED s HIGH VOLUME INCREASE 0 SOMEWHAT SUSCEPTIBLE TO LEACHING
0 RAU MATERICLS ARE INEXPENSIVE 0 E L L ESTA8LlSHED TECHNOLOGY
POZZOLANIC 0 NOT ENERGY INTENSIVE 0 HIGH VOLUME INCREASE 0 SUSCEPTIBLE TO LEACHIM;
1 a I 8 1
VERY FLEXIBLE LOW VOLUME THROUGHPUT
e VERY COSTLY BATCH :
CONTINUOUS
PORTABLE
FAIRLY FLEXIBLE HIGH VOLUME THROUGHPUT
e LOW COST FAIRLY FLEXIBLE
0 MEDIUM V O L M THROUGHPUT 4 MEDIUM COST
VERY FLEXIBLE LOW VOLUME TI-ROUGHP~
*VERY COSTLY FAIRLY FLEXIBLE
0 HIGH VOLUME THROUGHPUT e LOW COST
0 RAU MATERIALS ARE EXPENSIVE FEU INDUSTNAL INSTALLA'IIDNS
0 VERY ENERGY INTENSlVE 0 HEATER AND HEATER-YER REOUIRED 0 LOU VOLUME INCREASE
LESS SUSCEPTIBLE TO LEACHING
BATCH
CONTINUOUS THERMOPLASTIC
ORGANIC POLYMER
SURFACE ENCAPSULATION
0 FAIRLY FLEXIBLE 0 MEDIUM VOLUME THROUGHWT *MEDIUM COST
- PORTABLE T 5 S IDGE OLIDIFICATION
ID I
VERY FLEXIBLE LOW VOLUME THROUGHPUT
@VERY COSTLY
0 RAW MATERIALS ARE EXPENSIVE 0 FEU INDUSTRIAL INSTALLATIONS 0 FAlF&Y ENERGY INTEt61VE .DRYER REQUIRED 0pEDILM VOLUFIE INCREASE 0 POTENTIfLLY HIGH LEACHlNj
BATCH
CONTINUOUS --€ PORTABLE
e FAIRLY FLEXIBLE *HIGH VDLLME THROUGHPUT 0 LOW COST 0 FAIRLY FLEXIBLE 0 MEOIUM V O L M THROUGHPUT *MEDIUM COST
0 R A W MATERIALS ARE EXPENSIVE 0 F E W ItrlOUSTRIAL INSTALLATIONS 0 VERY ENERGY INTENSIVE 0 DRYER A N D PRESSURE HEATER REOURED 0 COMPLEX EOUPMENT REOUIRED 0 LOW VOLUME INCREASE 0 LOW LEACHING POTENTlAL
VERY FLEXIBLE * L O W VOLUME TWOUGHPUT
VERY COSTLY 0 FAIRLY FLEXIBLE *HIGH VOLUME THROUGHPUT
LOW COST FAIRLY FLEXIBLE
0 MEDIUM VOLUME THROUGHPUT *MEDIUM COST
VERY FLEXIBLE LOW VOLUME THROUGHPUT
*VERY COSTLY 0 FAIRLY FLEXIBLE oHlGH V O L M THROLGHPUT .LOW COST 0 FAIRLY FLEXIBLE 0 MEDIUM VOLWE THROUGHPUT .MEDIUM COST
. RAW MATERIALS ARE INEXPENSIVE 0 FEW INDUSTRIAL INSTALLATIONS 0 SOMEWHAT ENERGY INTENSIVE 0 DEWATERER AND FURNACE REOUIRED 0 LOW VOLUME INCREASE 0 SUSCEPTIBLE TO LEACHING
BATCH
CONTINUOUS
PORTABLE ! ! !
!
! I
I
I
! I
i MAJOR OPERATIONAL FACTORS 0 RELIABILITY 0 SIMPLICITY
ENERGY CONSUMPTION *PROCESS TYPE 0 VOLUME INCREASE f 0 RAW MATERIALS I SOLIDIFICATION STUDY SCREENING PROCES'
C FrCUR3i.2 c1
DRAWING NUM_BER 0 COST 0 ENVIRONMENTAL PROTECTION
1 4 44438A J1

314
3.0
competing with cementation processes since they are inherently more expensive, more complex and more energy intensive.
This study will only consider the solidification of the sludge.
2.0 APPROACH
- -This study was performed as follows:
1. Literature on various waste solidification processes and available technical data on current industrial waste solidification practices were reviewed.
2. A functional flow diagram for each method of sludge solidification was developed.
3. The relative merits and demerits of each sludge solidification process was evaluated.
4. A recommendation was made for the most feasible Pit 5 sludge solidification process.
SUMMARY AND CONCLUSIONS
The six solidification methods and three process types (batch, continuous, portable) shown in Figure 1.2 were investigated. The pros and cons of each system are discussed in detail in Section 7.0 and are summarized below. Considerations for the solidification process include: simplicity, energy consumption, volume change, raw materials, and environmental protection. In addition, the available process types were examined for flexibility, throughput capacity, and cost.
Cement-based processes have been used the longest and, with the exception of wastes containing impurities such as borates and sulfates, they work wi’th all kinds of wastes. Their main advantages are that the raw materials are plentiful and inexpensive, and these processes tie up any free water in the waste. Their main disadvantage is that the volume of waste to be disposed of may be greatly increased.
Lime-based pozzolanic processes are similar to cement- based processes, except that sulfates do not cause spalling or cracking of the solidified waste.
Thermoplastic techniques use bitumen, paraffin and polyethylene additives. These techniques have the
4 IO

314
a d v a n t a g e o f lower l e a c h i n g r a t e s t h a n c e m e n t - b a s e d and p o z z o l a n i c systems. A l s o , by d i s p o s i n g o f t h e waste i n a d r y c o n d i t i o n , a much lower volume o f waste r e s u l t s .
more T h e i r p r i n c i p l e d i s a d v a n t a g e s a r e t h a t s o p h i s t i c a t e d e q u i p m e n t i s r e q u i r e d , a n d t h e y a r e much more e n e r g y i n t e n s i v e t h a n o t h e r s y s t e m s .
O r g a n i c p o l y m e r p r o c e s s e s e n c a s e t h e waste i n a s p o n g y m a t r i x . They h a v e t h e a d v a n t a g e o f h a v i n g a h i g h e r w a s t e - t o - r e a g e n t r a t i o t h a n cemen t . h a s e d processes . However , s i n c e t h e waste i s n o t bound t o t h e p o l y m e r , t h e p o t e n t i a l f o r waste m o b i l i z a t i o n ( i . e . l e a c h i n g ) i s h i g h e r .
S u r f a c e e n c a p s u l a t i o n t e c h n i q u e s a r e t h o s e i n wh ich a waste t h a t h a s b e e n bonded o r p r e s s e d t o g e t h e r i s e n c l o s e d i n a j a c k e t o r c o a t i n g o f i n e r t ma te r i a l .
, T h i s h a s t h e a d v a n t a g e o f p r e v e n t i n g t h e waste f r o m coming i n t o c o n t a c t w i t h water f o r sometime. T h e i r major d i s a d v a n t a g e s a r e t h a t t h e y a r e r e l a t i v e l y e x p e n s i v e a n d r e q u i r e a l a r g e amount o f e n e r g y .
Waste t h a t i s h i g h i n c a l c i u m s u l f a t e o r c a l c i u m s u l f i t e c a n b e p r o c e s s e d t o become s e l f - c e m e n t i n g . When d i s p o s i n g of t h i s t y p e o f waste , t h i s p r o c e s s h a s major a d v a n t a g e s o v e r t h e o t h e r me thods d i s c u s s e d h e r e . However, t h i s p r o c e s s i s e n e r g y i n t e n s i v e a n d l i t t l e w a s t e f a l l s i n t o t h i s c a t e g o r y .
B a t c h p r o c e s s e s mi’x t h e waste and r e a g e n t s i n d i s c r e t e b a t c h e s . T h i s p r o v i d e s f o r a g r e a t d e a l o f f l e x i b i l i t y i n d e a l i n g w i t h waste v a r i a t i o n s , b u t i t i s v e r y c o s t l y , and l i m i t s t h e s y s t e m t h r o u g h p u t .
C o n t i n u o u s p r o c e s s e s b l e n d a c o n t i n u o u s stream o f r e a g e n t s and waste i n a n o p e r a t i o n a t a f i x e d l o c a t i o n . W h i l e t h i s r e s u l t s i n l e s s f l e x i b i l i t y , t h e r e a r e b r o a d l i m i t s on s y s t e m t h r o u g h p u t , and it is f a i r l y i n e x p e n s i v e .
P o r t a b l e p r o c e s s e s a r e small c o n t i n u o u s p r o c e s s s y s t e m s t h a t a r e mounted on s k i d s o r t r a i l e r s f o r p o r t a b i l i t y . They a re f a i r l y f l e x i b l e , b u t d u e t o t h e s i z e l i m i t a t i o n s of t h e t r a i l e r o r s k i d , t h e i r t h r o u g h p u t i s l i m i t e d .
S e c t i o n 8 compares t h e r e l a t i v e a d v a n t a g e s and d i s a d v a n t a g e s o f e a c h p r o c e s s . Based on t h i s e v a l u a t i o n , a c e m e n t - b a s e d p r o c e s s e m p l o y i n g c e m e n t and f l y a s h h a s b e e n c h o s e n f o r t h e s o l i d i f i c a t i o n o f P i t 5 s l u d g e . Cement i s a n i n e x p e n s i v e a d d i t i v e wh ich :
”̂ 11 5

314
4.0
4.1
1. provides good resistance to leaching, 2. is not energy intensive, 3. uses well established technology, and 4. provides for process flexibility.
In addition, a continuous type treatment scheme has been chosen due to its higher throughput capacity which is necessary to meet the tight-schedule for Pit 5 and its lower cost.
The details of the solidification process selected are described in Sections 9.0 through 9.11. The process flow diagrams shown there will form the basis for the Design Criteria Report to be developed.
All of the details presented in this report are based on the assumptions stated in the various sections. Before actual design begins, several factors must be confirmed. It is assumed that sludge with 30% solids by weight can be pumped; this must be confirmed by a pumping test. Another assumption is the proposed mix formulation; a solidification testing program must be performed to determine the mix formulation and permissible variability of sludge, water content, cement, fly ash, and other additives to achieve the required solidified form.
BACKGROUND
PIT CHARACTERIZATION
Pit 5 is a lined waste.disposa1 pit that covers 3.8 acres. It has a maximum depth of 30 feet, and its length and width are approximately 820 and 240 feet, respectively. It contains approximately 102,500 cubic yards of sludge.
The pit was used as a settling and storage basin for low-level radioactive sludge produced in Plant 8. The sludge depth varies between 25 and 30 feet. The water depth varies between 0 and 3 feet with the sludge in the east end of the pit exposed to the air.
Borings indicate that the pit is stratified from surface to bottom. Since the pit was filled from the east end, it is believed that east to west stratification also exists.
The material contained in Pit 5 was originally pumped as a slurry and consequently contains very little solids or debris. There is a decantation tower and access bridge at the southwest end of the pit.
6 12

32%
SLUDGE CHARACTERIZATION
The two major solid constituents of the sludge are magnesium fluoride and an iron-based precipitate. The sludge was pumped from Plant 8 to Pit 5 so both major constituents were pumpable. A pumping test was run in the mid-70's and the iron-based precipitate was still readily pumpable; however, the magnesium fluoride was not readily pumpable. Care was taken to put the material into suspension by mechanical means. Proper velocities were maintained to keep the material in suspension. If a power loss occurred during the pumping operation, it was noted that the magnesium fluoride would fall out of suspension and jam the pumping unit. During the mid-70's pump test, the magnesium fluoride pumped at a notably slower rate than did the iron-based precipitate.
Figure 4.1 shows the sampling point locations used in the Pit 5 characterization by Weston for their report entitled "Geotechnical Evaluation of Material Properties of Waste Pit Materials". The results are listed below.
The volume of sludge is estimated at 102,500 cubic yards. The approximate sludge contents, per IT Corporation, 1988, are as follows:
0 0 0
0
0 0 0 0 0
0
0
0
0 0
Sludge volume Sludge solids Bulk density of sludge (oven dry) Specific gravity of solids Entrained sludge water Arsenic (As) Barium (Ba) Mercury (Hg) Technetium (Tc-99)
Uranium Total
Thorium Total
Total radionuclides
Organics EP Toxicity for arsenic, barium, mercury
102,500 cubic yards 75 x lo6 lbs. 57.3 lb/ft'
2.43
142 x 10' lbs. 139 to 2800 mg/kg 15,700 to 36,940 mg/kg 0.39 to 1.8 mg/kg 423 to 2990 pCi/g (dry basis) 50,309 kg at 510 ppm (sludge basis) 16,965 kg at 172 ppm (sludge basis) 4527 to 27,200 pCi/g (dry basis) 900 to 2700 ug/kg
Below limits
1 3 7

I- I ?
r 8 I i
14
8
314
5 . 0
! t
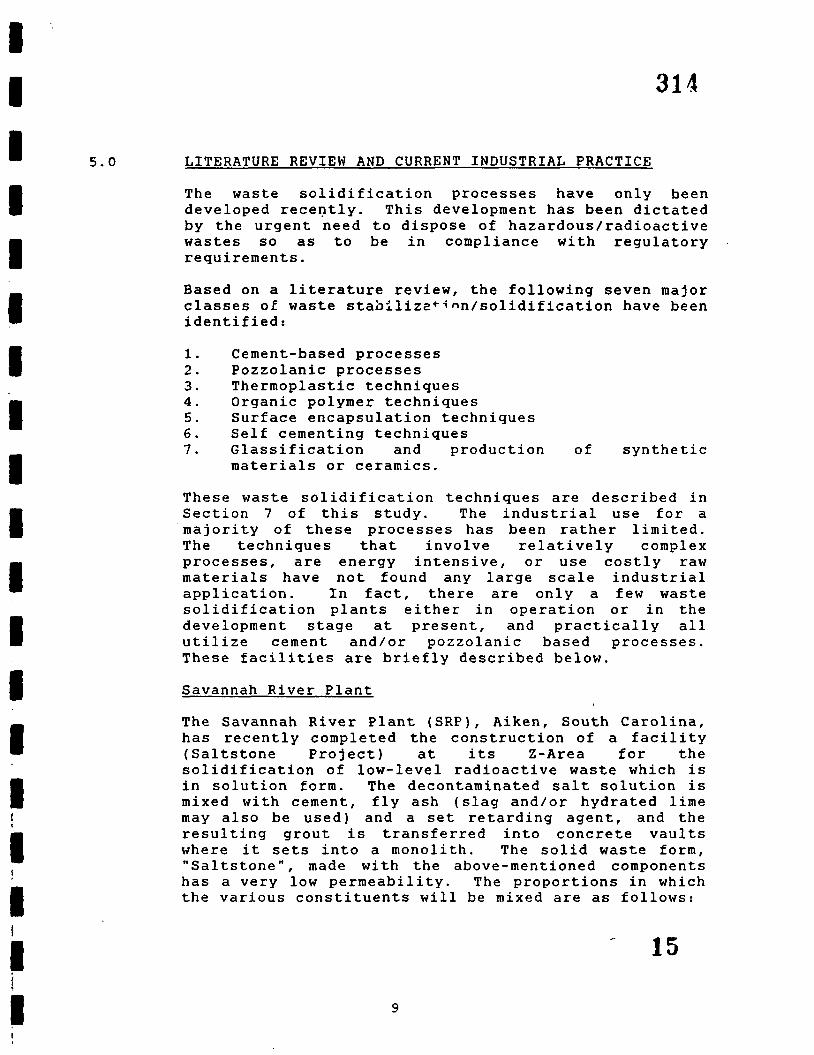
LITERATURE REVIEW AND CURRENT INDUSTRIAL PRACTICE
The waste solidification processes have only been developed recently. This development has been dictated by the urgent need to dispose of hazardous/radioactive wastes so as to be in compliance with regulatory .
requirements.
Based on a literature review, the following seven major classes o l waste stabflizz+ion/solidification have been identified:
1. Cement-based processes 2. Pozzolanic processes 3. Thermoplastic techniques 4. Organic polymer techniques 5. Surface encapsulation techniques 6. Self cementing techniques 7. Glassification and production of synthetic
materials or ceramics.
These waste solidification techniques are described in Section 7 of this study. The industrial use for a majority of these processes has been rather limited. The techniques that involve relatively complex processes, are energy intensive, or use costly raw materials have not found any large scale industrial application. In fact, there are only a few waste solidification plants either in operation or in the development stage at present, and practically all utilize cement and/or pozzolanic based processes. These facilities are briefly described below.
Savannah River Plant
The Savannah River Plant (SRP), Aiken, South Carolina, has recently completed the construction of a facility (Saltstone Project) at its Z-Area for the solidification of low-level radioactive waste which is in solution form. The decontaminated salt solution is mixed with cement, fly ash (slag and/or hydrated lime may also be used) and a set retarding agent, and the resulting grout is transferred into concrete vaults where it sets into a monolith. The solid waste form, "Saltstone", made with the above-mentioned components has a very low permeability. The proportions in which the various constituents will be mixed are as follows:
9
!

314
Decontaminated Salt Solution : 40% by weight Cement : 12% by weight Fly Ash : 48% by weight Set Retarding Agent (Pozzolith 122-R or equal) : Up to 0.5% by weight,
if required
This is equal to 15.5 lbs. of cement and fly ash mix per gallon of the decontaminated salt solution. The
- grout production rate will be approximately 180 gallons per minute.
Apart from the saltstone project in 2-Area, another solidification facility is now in the design and development stage for the Y-Area. The waste treatment process will be based on the use of a mixture of cement and fly ash for solidification of liquid waste. The process and equipment used will be similar to that used for the Saltstone Project in 2-Area.
Oak Ridae Gaseous Diffusion Pl'ant
The treatment facility at the Oak Ridge Gaseous Diffusion Plant (ORGDP), Oak Ridge, Tennessee handles solidification of sludges and high salt containing liquids. As at SRP, this facility also uses cement and fly ash for solidification of the wastes, but the proportion of cement used is comparatively higher. The sludge solidification at ORGDP (as described by Earl W. McDaniel of MMES-ORNL during the meeting at FMPC, Fernald, Ohio on February 17, 1989) has the following aspects:
1) The treatment rate is two hundred 55-gallon drums per 8 hour day ( 3 0 , 0 0 0 drums have been prepared).
2) The sludge is removed by backhoe, dumped into a hopper, screened to remove large objects, mixed in 5,000 gallon batches to assure sludge uniformity and mobility and to characterize the sludge. Dry mix is proportioned according to total suspended solids (TSS) of sludge. The components are batched in a conventional batch plant, mixed in a Lilliford high shear mixer (4 to 6 cubic yards mixed in approximately 2 minutes), discharged into concrete trucks that take the mixed sludge to a pouring yard and placed into 55-gallon drums.
3) The sludge is a clay/silt with a consistency of creamy peanut butter having 30 to 35% solids.
16 10

314
A 5 0 / 5 0 mixture of Type I cement to Kingston steam plant Class F Fly Ash (Class F fly ash conforming to ASTM C 618) is used.
8 to 10 pounds of the .cement/fly ash mixture are used for each gallon of sludge (1 gallon of sludge weighs 12 to 13 pounds).
The mix contains 6 to 8% entrained air (using Master Builders additive).
Each batch is marked, sampled, and tested for "delisting". If a batch fails the EP Toxicity test for delisting, the batch is returned to the plant for further processing.
is desirable to keep the water content of sludge as low as possible in order to keep the additives to a minimum, thereby reducing the amount of treated waste to be disposed. A minimum amount of solids for a sludge to be treated should be 18 to 20%. Sludge may have to be thickened to increase the solids content to a desirable 30 to 35%.
The waste needs to be characterized to a level of confidence such that the full range of characteristics has been determined. Constituents of concern for obtaining good cement grout are lead, NaC1, and NaNO,.
Grout Disposal Facility, Hanford Reservation
The grout disposal program at Hanford Reservation, Richland, Washington involves the disposal of phosphate/sulfate waste (PSW) estimated at one million gallons from N Reactor operations and the low-level fraction from double-shell tank (DST) wastes. The first campaign for disposal of PSW in grout form commenced August, 1988, and DST waste disposal is scheduled to start in 1990. Liquid waste will be converted into an environmentally stable solid form by mixing the wastes with Types 1 and 2 portland cement and pozzolanic materials such as Class F fly ash and blast furnace slag. The proportion of cement in the blend is lower than that used at SRP. The selected reference blend ratio is as follows:
Blast Furnace Slag : 47% by weight Class F Fly Ash : 47% by weight Types 1-2 Port'land Cement : 6% by weight Mix Ratio : 9 lbs. solids
blend/gallon of
11
waste - 17

6 . 0
314
Blend formulations will differ for different wastes and is selected on the basis of actual solidification test data for a particular waste. Different types of clays such as Red Indian pottery clay or attapulgite clay may also be used for blend formulations.
The grout slurry will be pumped to disposal vaults for final disposal. High pressure pumps will be used for cleaning the grout pipeline. Grout production rate will vary from 30-70 gallons per minute.
The references used for this study are listed in Section 10.
SAFETY CRITERIA
The solidification process will be similar to a standard concrete mixing facility and as such will only require standard industrial safety practices. Even though the sludge being solidified is slightly radioactive, there is no need for additional protective features, such as HEPA filters on the facilities ventilation system or double walled piping. Process areas will have secondary containment for tanks and other primary containers. This is due to the very low radioactivity level of the sludge (Weston CIS, 1988).
Since the sludge is processed in a liquid state, any breach of the solidification equipment will not cause a significant amount of material to become airborne. A leak or rupture of a storage tank or a pipe would obviously cause a localized increase in airborne radionuclide concentration, but this would be at low levels and would not lead to a significant release to the environment. Any leaks or spills of the sludge can be easily identified and cleaned up before the situation becomes a hazard to the workers or to the environment.
In order to ensure personnel safety during the solidification operations, all work will be performed in accordance with the site Environmental, Safety and Health (ES6rH) Procedures, as well as the FMPC Radiation Control Manual. Among other requirements, these procedures identify the maximum permissible radionuclide concentrations in the air and the types of protective clothing required.
The DOE Orders require radiation exposures to be kept below 1 rem/yr and that exposures be further reduced by maintaining them as low as reasonably achievable
12 18

I I I I I I I I I I I I I I I 1 I u I
7 . 0
7.1
314
(ALARA). In DOE/EV/1830-T5, (Kathren and Selby, 1980) occupational dose equivalent limits are recommended for various types of operations. This guide recommends a maximum dose rate of 0.125 mrem/hr for continuously occupied work areas, such as the control room.
SLUDGE SOLIDIFICATION METHODS
There are a number of factors to consider when choosing a solidification/stabilization process. The most important factor is compatibility between the waste and the process chosen. Secondary factors include costs, reliability, simplicity, energy consumption, process type, handling characteristics, and bulking of the resulting product. It is also important to match the process type to the disposal conditions.
SOLIDIFICATION AGENTS
The EPA (Malone, Jones and Larson, 1980) has identified seven major types of solidification processes. They are:
1. Cement-based processes 2. Pozzolanic processes 3. Thermoplastic techniques 4. Organic polymer techniques 5. Surface encapsulation techniques 6. Self-cementing techniques 7. Glassification and production of synthetic
materials or ceramics (vitrification)
Since vitrification is being considered as a separate option (IT Corp., 1988), it will not be included here. The other six options are discussed below.
7.1.1 Cement-Based Processes
Cement-based processes have been used the longest and have successfully solidified a wide range of wastes. These processes require the addition of portland cement to a waste slurry. This causes the suspended solids to become part of the hardening concrete matrix and ties up free water in the process. The resulting mixture hardens to a solid mass over several hours to a few days. Before setting, it can be pumped as needed.
Based on chemical composition and physical properties, portland cements are generally classified into the following five types:
19 13
1.
2.
3 .
4 .
5 .
314 Type I
This type of cement is used in the building trade and constitutes over 90% of the cement manuf actur-ed.
Type I1
This type is meant for use in the presence of moderate sulfate concentrations in the range of 150-1,500 mg/kg or where the requirements for heat of hydration are moderate.
Type I11
This type is characterized by high initial strength and is used where rapid set is required.
Type IV
This type has long set time .and low heat of hydration and is usually used for large-mass concrete work.
Type V
This type has low aluminum content and is sulfate resistant. It is used where sulfate concentrations of more than 1,500 mg/kg are involved.
Types I, I1 and V have been used for waste solidification.
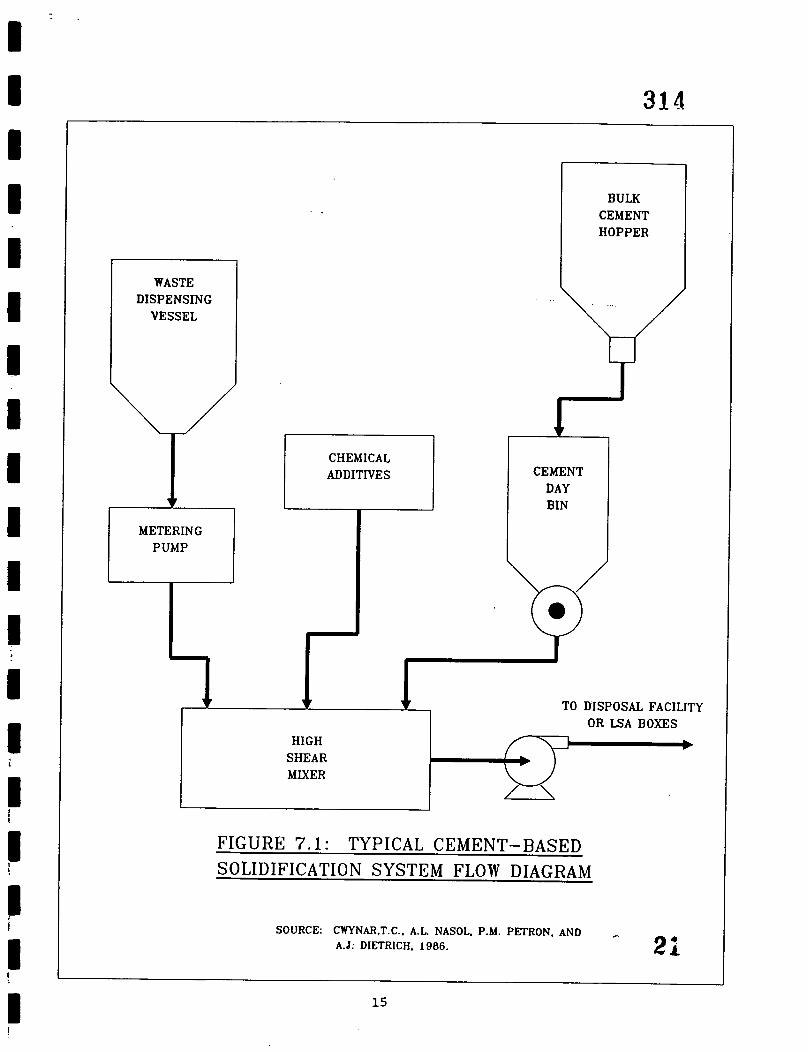
Figure 7.1 shows a flow diagram for a typical cement- based solidification system. Basically, the waste, the cement and any additives are all combined in a high shear mixer for blending. The free water in the waste is used to hydrate the cement, thus tying it up in the final product. The general reaction that occurs is as follows. Initially, the lime in the cement hydrates and the dissolution of other constituents occurs. This results in a supersaturation of the solution, which leads to the precipitation of metastable hydration products. Within 1/2 to 2 hours, this reaction gradually decreases as gelatinous hydration products coat the cement particles. Eventually, osmotic pressure breaks down this coating and hydration continues, but at a slower rate. At this point, the cement starts to harden, as the colloidal gel of
20 14
i I I I I I I I I I I I I
I
I
I
i
I !
: I I I
r'
314
WASTE DISPENSING
VESSEL
METERING PUMP
CHEMICAL ADDITIVES
r HIGH
SHEAR MIXER
I CEMENT BULK I
CEMENT DAY BIN
TO DISPOSAL FACILITY OR LSA BOXES
HIGH b SHEAR MIXER
TO DISPOSAL FACILITY OR LSA BOXES
b
I
F I G U R E 7.1: TYPICAL C E M E N T - B A S E D SOLIDIFICATION S Y S T E M FLOW DIAGRAM
SOURCE: CWYNAR.T.C., A.L. NASOL. P.M. PETRON. AND ~
21 A.d: DIETRICH. 1986.
15

1 I I I I I I I I I I I I I I 1 I
I
314
metastable hydration products between cement grains begin to crystalize. This forms densely packed fibrils of calcium silicate hydrate. Finally, the fibril network continues to grow and consolidate, which binds together crystalline hydration products, unreacted cement, and the suspended solids initially present in the waste (Neilson and Dole, 1986).
The main advantages of cement-based processes are: - _.__
The raw materials are plentiful and inexpensive.
These processes tie up any free water in the waste.
Through the use of different additives such as clay or vermiculite, the properties of the resulting concrete can be tailored to the waste to be disposed.
A well established technology is used.
Specialized labor is not required.
Ease and flexibility of handling is provided.
The process is not energy intensive.
The process produces a nonbiodegradable, nonflammable, and stable product.
main disadvantages are:
The volume of waste to be disposed of may be greatly increased (by up to twice the original volume for some wastes).
The products formed are somewhat susceptible to leaching, especially when in contact with mildly acidic solutions.
Impurities such as borates and sulfates adversely affect the ability of the mixture to cure or set.
use of cement based processes has been extensively \
documented. They have been used at the Savannah River Plant (Schuler et. al., 1986,) and for low-level waste at the closed reprocessing plant at West Valley, New York (Grant, 1985, and Cwynar, 1986). Similar processes are being used at Hanford and the Oak Ridge Gaseous Diffusion Plant. Concrete-based processes have also been successfully tested for stabilization of PCB
16 22
314
? I-
contaminated soils (Buckingham and Peacock, 1987.) In addition, a combination of cement and organic polymer called syncrete has been tested (Cohen and Crouzet, 1986. )
7.1.2 Pozzolanic Processes
Lime-based pozzolanic processes are similar to cement- based processes, except that sulfates do not cause the product to spa11 or crack and they do not form as strong a solid. They use lime and fine-grained silicaceous (pozzolanic) material which react to form a concrete-like solid. Like cement, water is required for the reaction, so that free water in the waste is bound up in the resulting solid. Fly-ash, cement-kiln dust, or ground blast-furnace slag are the most commonly used pozzolanic materials.
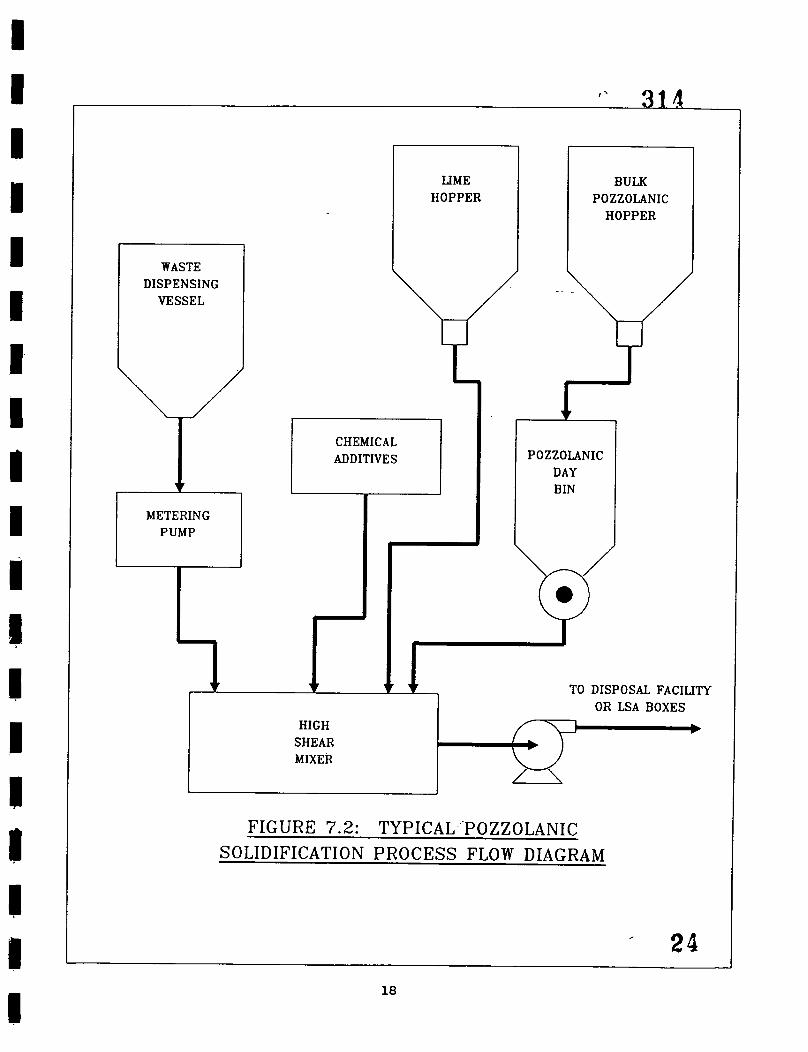
Figure 7.2 illustrates the flow diagram of a typical pozzolanic process. As this figure shows, and as stated above, these processes are very similar to the cement-based processes. The lime, the pozzolanic material, and the waste, as well as any chemical additives, are added to a high shear mixer for blending. This mixture can then be pumped into containers or to a disposal facility.
For the most part, the advantages and disadvantages of these processes are the same as those for the cement- based processes.
Environstone, which is an organic polymer/fly ash mixture, has been tested in Japan and Sweden (Sjoblom, Forsstrom, and Shingleton, 1985), and has been used in Rancho Seco among other sites in this country to solidify low-level radioactive waste (McMahon, 1989.) According to its manufacturer, it has been tested to ensure compliance with 10 CFR 61 requirements for waste stabilization (Rosenstiel, Bodett, and Lange, 1984.) In addition, a mixture of clay, fly ash and hydrated lime was found to successfully solidify an acidic hydrocarbon sludge in a study conducted at Drexel University (Martin, Robinson, and Van Keuren, 1987). An important note is that most of the cement-based processes mentioned in Section 7.1.1 use a blend of cement and pozzolanic materials.
7.1.3 Thermoplastic Techniques
Thermoplastic techniques use bitumen, paraffin and polyethylene additives. In these processes, the waste is dried, heated, and mixed with the heated plastic
17 23
I I I I I I I I I I I I I I I I I I I
WASTE DISPENSING
METERING PUMP
LIME HOPPER
CHEMIC A L ADDITIVES
HIGH SHEAR MIXER
POZZOLANIC DAY BIN
W I
TO DISPOSAL FACILITY OR LSA BOXES
b
FIGURE 7.2: TYPICAL POZZOLANIC SOLIDIFICATION P R O C E S S FLOW DIAGRAM
24 18
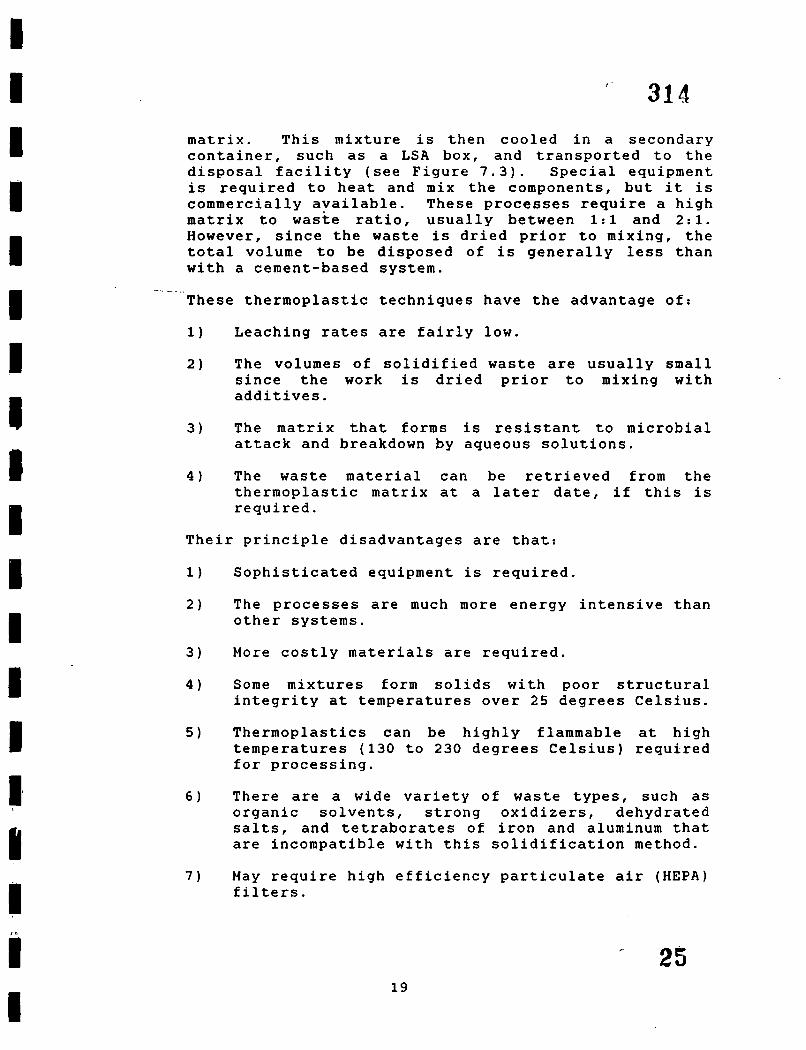
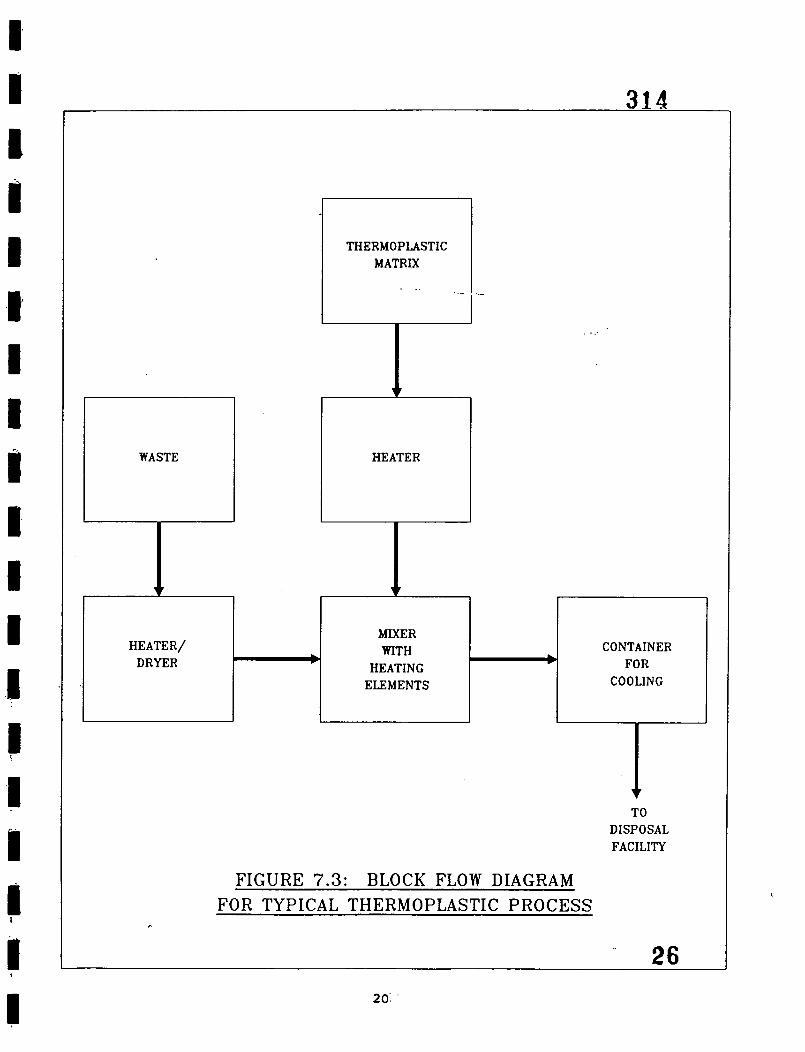
matrix. This mixture is then cooled in a secondary container, such as a LSA box, and transported to the disposal facility (see Figure 7.3). Special equipment is required to heat and mix the components, but it is commercially available. These processes require a high matrix to waste ratio, usually between 1:l and 2 : l . However, since the waste is dried prior to mixing, the total volume to be disposed of is generally less than with a cement-based system.
.- .. _. . . . These thermoplastic techniques have the advantage of:
1) Leaching rates are fairly low.
2 ) The volumes of solidified waste are usually small since the work is dried prior to mixing with additives.
3) The matrix that forms is resistant to microbial attack and breakdown by aqueous solutions.
4 ) The waste material can be retrieved from the thermoplastic matrix at a later date, if this is required.
Their principle disadvantages are that:
1 ) Sophisticated equipment is required.
2) The processes are much more energy intensive than other systems.
3) More costly materials are required.
4) Some mixtures form solids with poor structural integrity at temperatures over 2 5 degrees Celsius.
5) Thermoplastics can be highly flammable at high temperatures (130 to 230 degrees Celsius) required for processing.
6 ) There are a wide variety of waste types, such as organic solvents, strong oxidizers, dehydrated salts, and tetraborates of iron and aluminum that are incompatible with this solidification method.
7) May require high efficiency particulate air (HEPA) filters.
25 19
I I
MIXER WITH
HEATING ELEMENTS
b
I CONTAINER
FOR COOLING
i
I
WASTE HEATER
FIGURE 7.3: BLOCK FLOW DIAGRAM FOR TYPICAL THERMOPLASTIC P R O C E S S
" 26 2 0:

MIXER WASTE
TO CONTAINERS OR DISPOSAL
FACILITY
FIGURE 7.4: BLOCK FLOW DIAGRAM FOR TYPICAL ORGANIC POLYMER P R O C E S S
27 21 -

314
7.1.4 Organic Polymer Processes
Organic polymer processes encase the waste in a spongy matrix. In these type of processes, a prepolymer such as vinyl esters or urea-formaldehyde, is mixed with the dewatered waste until it is completely dispersed. Then a catalyst is added, and mixing is continued (see Figure 7.4). After the catalyst has been dispersed throughout the mixture, but before the polymer has forTed, . _ t h e waste is transferred to a storage container, such as a low specific activity (LSA) box.
These organic polymer processes have the following advantages:
1) They have a high waste-to-reagent ratio, typically about 3: 1.
2) They produce a material that is not very dense, which reduces transportation costs.
3) They do not require high temperatures to form the final product.
These processes have several disadvantages, which are:
1) The waste is not bound to the polymer, therefore, the potential' for waste mobilization (i.e. leaching) is higher than with other systems.
2) Free water is not bound up in the waste and must be removed through dewatering and/or drying.
3) For polymerization to occur, a pH of between 1.0 and 2.0 must be maintained.
4) These wastes can produce highly acidic, highly polluted weep water as they age, the disposal of which can be difficult.
5) May require HEPA filters.
Organic polymers have been tested successfully in Japan (Suzuki, et. al., 1982, and Hayashi, 1982) where their lower bulking factor gives them a significant advantage over other processes.
7.1.5 Surface Encapsulation Techniques
Surface encapsulation techniques are those in which a waste that has been bonded or pressed together is enclosed in a coating of inert material. For these
22 28

314
a I I I 6
c I B 1 I I I I li E
7.1.6
techniques to work, the waste must be completely dried. This dry waste is then mixed with a setting agent, such as 1,2 polybutadiene-acetone, which also helps bind the coating to the waste. After the mixture has set, it is heated under slight pressure to between 120 and 200 degrees Celsius to fuse the waste into a solid form. This is then covered with a layer of polyethylene (see Figure 7.5). Typically, the admixture would be between 3 and 4 percent of the material to be solidified, and the coating (typically 3-5 mm thick) would add an additional 4 percent by weight.
This technique has the advantages of:
1) Preventing the waste from ever coming into contact with water.
2) Preventing all leaching of the contaminates for as long as the impervious coating remains intact.
Their major disadvantages are:
1 ) The resins required are relatively expensive.
2 ) These processes are very energy intensive.
3) These systems require a large expenditure for the required equipment.
4) A skilled labor pool is required to operate the equipment.
5 ) May require HEPA filters.
Self-cementing Wastes
Wastes that are high in calcium sulfate or calcium sulfite can be processed to become self-cementing. Typically, after the waste has been dewatered, a small portion is calcined. This produces a partially dehydrated cementitious calcium sulfite or sulfate, which is mixed back into the remaining waste along with other additives such as fly ash (see Figure 7.6).
2 3 29

I I
.I E t t I
c
E 1 I
I 1
I
314
- ..
!- W
l
2 D
t
30
24

W E c D
p: W p: W t-r * r
E n
31 25

7.2
When disposing of this type of waste, this self- cementing process has the following advantages:
1) The process produces a nonbiodegradable, nonflammable, and stable product.
2) A completely dry waste is not required, since water is used up in hydration reactions.
3) This method produces a waste form with the same characteristics as cement but the increase in volume is much less than cement-based processes.
Their disadvantages are that:
1 ) They are fairly energy intensive.
2) Skilled labor is required.
3) Expensive machinery is required.
4) May require HEPA filters.
MIXING PROCESSES
The EPA (Cullinane, Jones and Malone, 1986) has identified four different mixing processes. They are:
1. Batch processes 2. Continuous processes 3. Portable processes 4. In-situ processes
In-situ processes were not considered since the perception of release problems and the suitability of the current site to act as the final repository for the wastes is questionable.
7.2.1 Batch Processes
In these processes, the reagents and the waste are added to a container, such as a 55-gallon drum or LSA box. Mixing is then performed using either a rotary mixing element, or a system designed to roll or tumble the entire sealed container. This simplifies handling and transportation, and limits worker exposure. However, the cost of the containers limit these processes to small scale operations (Wiles, 1987).
32
26

7 . 2 . 2 C o n t i n u o u s P r o c e s s e s
I n t h e s e p r o c e s s e s , t h e r e a g e n t s a n d t h e w a s t e a re f e d i n t o a s p e c i a l l y d e s i g n e d d e v i c e f o r m i x i n g . T h i s d e v i c e c o u l d be a h e l i c a l r i b b o n m i x e r , a c o n e o r s c r e w - t y p e m i x e r , a s i n g l e o r t w i n screw e x t r u d e r , a s t a t i c mixe r o r a pug m i l l . T h i s p r o v i d e s a r a n g e of c a p a c i t i e s o f o p e r a t i o n a n d t h e a b i l i t y t o p r o v i d e f o r a n y n e e d e d c h a n g e i n t r e a t m e n t c a p a c i t y w i t h a d d i t i o n o r d e l e t i o n of p a r a l l e l p r o c e s s i n g l i n e s .
7.2.3 P o r t a b l e P r o c e s s e s
T h e s e p r o c e s s e s a r e b a s i c a l l y sma l l e r s ca l e c o n t i n u o u s p r o c e s s e s e m p l o y i n g s k i d o r t r a i l e r mounted e q u i p m e n t . T h i s i n c r e a s e s f l e x i b i l i t y s i n c e t h e e q u i p m e n t c a n b e moved f rom s i t e t o s i t e . However, t h e c o s t p e r t o n o f p r o c e s s e d waste i s h i g h b e c a u s e o f economy o f s c a l e . I n a d d i t i o n , t h e n e e d f o r a c o m p a c t s i z e l i m i t s t h e i r t h r o u g h p u t .
8.0
8.1
EVALUATION OF SLUDGE SOLIDIFICATION METHODS
TECHNICAL FEASIBILITY
T o make a f i n a l s e l e c t i o n o f t h e s o l i d i f i c a t i o n p r o c e s s f o r P i t 5 , t h e d i f f e r e n t o p t i o n s a r e compared . The c r i t e r i a t h a t w i l l - b e u s e d f o l l o w s :
1.
2 .
3 .
4 .
5 .
6 .
7.
C o s t - l e a s t . cos t .
R a w Mater ia ls - t h e y s h o u l d b e p l e n t i f u l , w i t h a r e l i a b l e s u p p l y s o u r c e , and n o t i n t r o d u c e c o m p l i c a t i o n s i n t o t h e p r o c e s s .
E x p e r i e n c e - t h e p rocess t o b e u s e d s h o u l d be o n e w i t h a e s t a b l i s h e d t r a c k r e c o r d a t o t h e r s i t e s , so t h a t o n e c a n be c o n f i d e n t t h a t it w i l l p e r f o r m a d e q u a t e l y .
E n e r g y Usage - t h e lower t h e e n e r g y n e e d s o f t h e p r o c e s s , t h e b e t t e r .
Volume I n c r e a s e - t h e i d e a l p r o c e s s is o n e w i t h l i t t l e o r n o i n c r e a s e i n volume.
L e a c h a b i l i t y - r e s i s t a n c e of t h e f i n a l waste form t o t h e r e l e a s e o f u n d e s i r a b l e c o n s t i t u e n t s .
C o m p l e x i t y - s i m p l e r , more r e l i a b l e s y s t e m s a r e p r e f e r a b l e t o more complex s y s t e m s . 33
2 7

314
It is recognized that there is some overlap between these categories and that several others could be added. However, it is felt that these seven give a sufficiently detailed analysis to allow the final judgement to be made. Table 8.1 shows the overall comparison of 'all six options. A detailed discussion of each option was presented in Section 7. Based on Table 8.1, a cement-based process is the best available method of solidifying Pit 5 sludge.
A full cement-based process would be expensive. All operating or soon to be operating cement-based solidification processes use a combination of cement and pozzolanic materials. Based on experience at Oak Ridge, the Savannah River Plant, and Hanford, indications are that fly ash is a good pozzolanic material to use with the cement-based process. Fly ash '
reacts with any free calcium hydroxide, which improves the chemical resistance and strength of the final product. Also, fly ash can act as an adsorbent, helping to trap waste material in the concrete matrix (Cullinane, Jones, and Malone, 1986). The proposed process for solidification of Pit 5 wastes is presented in Section 9.
34 2 8

I' 314 Table 8.1: Comparison of Solidification Alternatives
Raw Process Cost Materials
Cement-Based +1 +1
Pozzolanic +1 +1
Thermoplastic -1 -1
Organic Polymer 0 -1
Surf ace Encapsulation -1 0
Self-cementing +1 0
Energy Volume Experience Use Increase Leachability Complexity Score
+1 +1 -1 0 +1 4
+1 +1 -1 -1 +1 3
0 -1 +1 +1 -1 -2
0 0 +1 -1 0 -1
-1 -1 +1 +1 -1 -2
+1 0 +1 0 -1 2
+1 Better or more desirable.
-1 Worse or less desirable. 0 Neutral
8.2 WORKER SAFETY AND HEALTH
As mentioned in Section 6, the ES&H Procedures and the Radiation Control Manual will be the guiding safety documents for the solidification of the Pit 5 sludge. It should be noted that during previous sludge sampling efforts [Characterization Investigation Study - Geotechnical Evaluation of Waste Pit Material Properties and Boring Logs, Weston, 19881 irritating odors were encountered that forced the workers to wear Level B protective clothing.
The solidification of the sludge from Pit 5 is not expected to be a labor intensive effort. In fact, only 4 to 8 employees will be needed to operate and maintain the solidification equipment. The specific number of employees and their responsibilities will depend on the equipment selected. 35
2 9

9.0
9.1
314
Data from the sludge sampling tests show dose rates ranging from 0.17 to 2.38 mR/hr for mixed Beta/Gamma fields and from 0.68 to 0.58 mR/hr for Gamma only. The referenced study does not indicate at what distance from the sludge the measurements were made, however, it is implied that the radiation detector was positioned very close to the samples. These measured dose rates are greater than the recommended maximum dose rates of 0.125 mrem/hr for continuously occupied areas. The equipment selection will affect 'the solidification procedures, the positioning of the workers and the dose rates to which the operators will be exposed. BY positioning the control room operators away from the sludge storage tanks their radiation exposures will be in accordance with as low as reasonably achievable (ALARA) philosophy.
All of the solidification methods discussed in Section 7 involve similar safety issues and there are no unique concerns for any one method. The safety of the workers can be ensured with similar procedures for each of the methods.
DESCRIPTION OF SELECTED SLUDGE SOLIDIFICATION PROCESS (BASED ON CEMENT 61 FLY ASH)
GENERAL
This process involves the solidification of Pit 5 sludges with cement, fly ash and certain admixtures to control the setting time of the grout slurry. Certain other cementitious materials such as ground blast furnace slag or some types of clays could also be used as solidification agents, if found suitable. The grout slurry may be pumped to a specially prepared on-site facility for solidification and final disposal. Alternatively, the grout slurry may be packaged into containers (LSA boxes, 55-gallon drums, etc.) for solidification and transported to an on-site facility for final disposal. The solidification of sludge will produce a stable, nonleachable waste form suitable for on-site disposal. The details of the waste disposal facility will be covered under a separate study report.
Figures 9.1, 9.2 and 9.3 illustrate the general process envisioned for Pit 5 sludge solidification.
As illustrated on the attached process flow diagrams (SK-P-001, SK-P-002 and SK-P-003), the sludge is mixed in the pit prior to pumping to increase its homogeneity. This sludge is then pumped to the sludge thickener at about 20 wt. 0 (20% by weight) solids
36

i
- 37 3 1

0 I
I
R
u 1 I I I
8
e
P
3 1 4
38 32
314
9 33
31 4 \
I
1 i
9 . 2
1 I
I
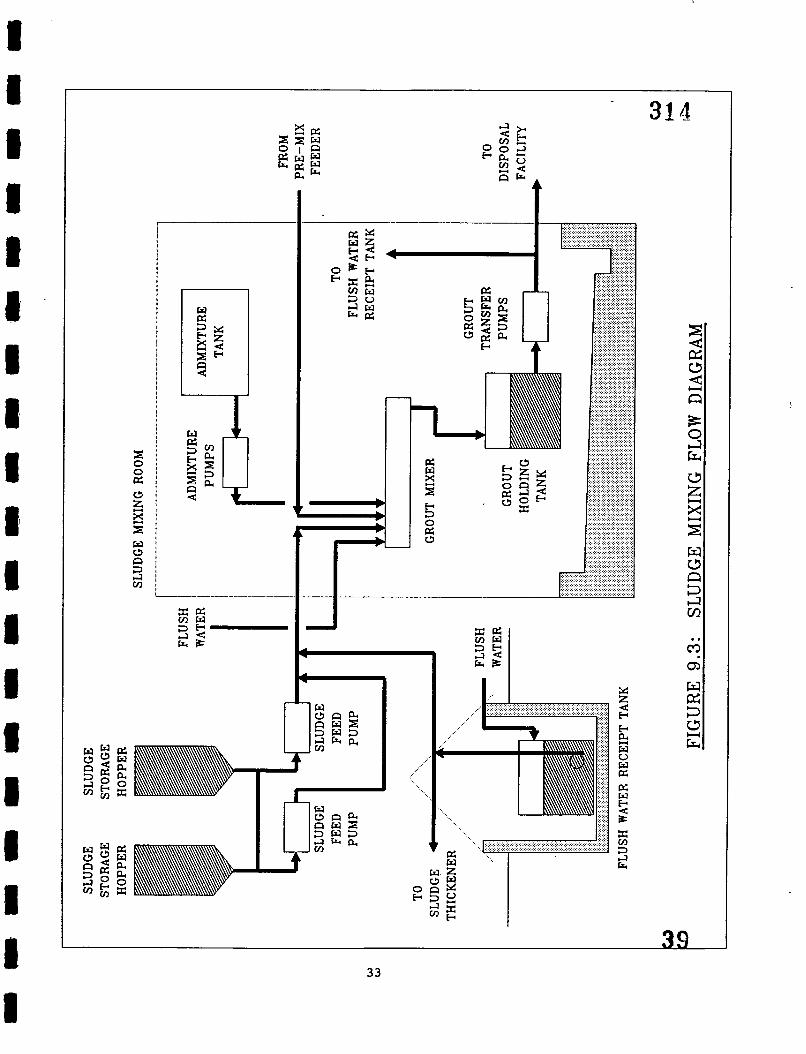
The s l u d g e t h i c k e n e r , c o n t r o l l e d by a gamma g a g e , produces s l u d g e w i t h about 30 w t . % s o l i d s . The c l e a r w a t e r from t h e t h i c k e n e r o,verflows t o t h e wet sump. From t h e r e , i t can be returned t o P i t 5 o r used t o f l u s h t h e s l u d g e l i n e s .
The t h i c k e n e d s l u d g e i s t r a n s p o r t e d v i a t h e s l u d g e t r a n s f e r pumps t o t h e s l u d g e s t o r a g e hoppers. From t h e r e , t h e s l u d g e f e e d pumps t r a n s f e r t h e s l u d g e t o t h e g r o u t mixer.
Cement and f l y ash can be brought i n t o t h e system by t a n k e r truck o r r a i l c a r and unloaded i n t o t h e cement o r f l y ash b i n s . F e e d e r s t h e n t r a n s f e r measured p o r t i o n s o f both s o l i d i f i c a t i o n a g e n t s t o t h e f l y ash/cement c o n t i n u o u s b l e n d e r . T h i s produces a c o n t r o l l e d b l e n d o f m a t e r i a l t h a t i s moved i n t o t h e premix hopper v i a t h e f l y ash/cement pneumatic c o n v e y o r . The premix f e e d e r t h e n t r a n s f e r s t h i s blend t o t h e g r o u t mixer.
The s e t r e t a r d e r i s d e l i v e r e d by t r u c k t o t h e admixture t a n k . From w h i c h , t h e admixture m e t e r i n g pumps add i t t o t h e g r o u t m i x e r .
A t t h e g r o u t mixer, t h e s l u d g e , cement, f l y ash, and admixture a r e blended t o form g r o u t . T h i s g r o u t f l o w s by g r a v i t y i n t o t h e g r o u t h o l d i n g t a n k , w h i c h s e r v e s a s a r e s e r v o i r f o r t h e g r o u t t r a n s f e r pumps. These pumps t r a n s f e r t h e g r o u t from t h e g r o u t h o l d i n g tank t o t h e d i s p o s a l f a c i l i t y .
A t t h e end o f each d a y ' s o p e r a t i o n s , a l l o f t h e l i n e s must be f l u s h e d t o p r e v e n t s o l i d s from s e t t l i n g o u t o r t h e g r o u t from hardening i n t h e l i n e s . B o o s t e r pumps s u p p l y h i g h p r e s s u r e water f o r f l u s h i n g . P r o c e s s water can a l s o be added t o t h e system a t t h e g r o u t mixer o r a f t e r t h e g r o u t t r a n s f e r pumps. A l l f l u s h water i s returned t o t h e f l u s h water r e c e i p t tank (FWRT). T h i s w a t e r , i f low i n s o l i d s , can be used i n s t e a d o f p r o c e s s water f o r f l u s h i n g t h e g r o u t mixer, g r o u t h o l d i n g t a n k , and g r o u t t r a n s f e r pump. I f h i g h i n s o l i d s , t h e water from the FWRT can be returned t o t h e s l u d g e t h i c k e n e r .
M I X FOR SOLIDIFICATION
The d e s i g n o f a s u i t a b l e mix f o r m u l a t i o n should be based upon t h e r e s u l t s o f l a b o r a t o r y / p i l o t p l a n t t r e a t a b i l i t y s t u d i e s u s i n g P i t 5 s l u d g e . Such t e s t s a r e r e q u i r e d . I n t h e absence o f t e s t d a t a on s l u d g e s o l i d i f i c a t i o n , t h i s s t u d y has based i t s mix f o r m u l a t i o n on a s i m i l a r e x i s t i n g p r o j e c t . The Z-Area
34 40

9.3
314
Saltstone Project at Savannah River Plant has been selected for this purpose. The mix for the Saltstone Project is as follows:
Decontaminated Salt Solution - 40% by weight Cement - 12% by weight Fly Ash - 48% by weight
The above mix contains 40 wt. % liquid and 60 wt. %
be maintained for Pit 5 sludge. No extra water other than that associated with sludge will be used. Pit 5 sludge containing 30% solids by weight will be used in the solidification process. This is based on the assumption that 30 wt. % solids sludge is pumpable. The proportion of cement in the mix will be maintained at 12 wt. % and the combined proportion of fly ash and sludge solids will be 48 wt. 8 . The water component, 40% by weight, will be provided by the 30 wt. 8 solids sludge. Based on the above considerations, the following mix has been established for Pit 5:
solids. The same proportion of liquid and solids will -
Components Product
Water from sludge - 40% by weight Solids from sludge (30 wt% solids) - 178 by weight Cement - 12% by weight Fly Ash (48%-17%) - 31% by weight
Total 100% by weight
It should be noted that in a 30 wt. % solids sludge (70 parts water: 30 parts of solids), 40 parts of water are associated with about 17 parts of solids. The above formulation is tentative and will probably have to be revised after the actual test results on Pit 5 sludge solidification are available. The possibility of adding some other solidification agents such as blast furnace slag or clay to the mix cannot be ruled out.
PROCESSING RATE
As per Parsons letter (P-WP-lo), 18 months are available for the removal and processing of sludge from Pit 5. For the purpose of this study, it will be assumed that 375 working days (260 available week days per year less 10 days per year for holidays and bad weather) are available for sludge processing. Also, given daily start up and shutdown requirements, it is assumed that 6 hours per day are available for sludge processing. This necessitates a sludge removal rate of 300 gpm at 20% by weight solids. This corresponds to
35 4P
314
120
180
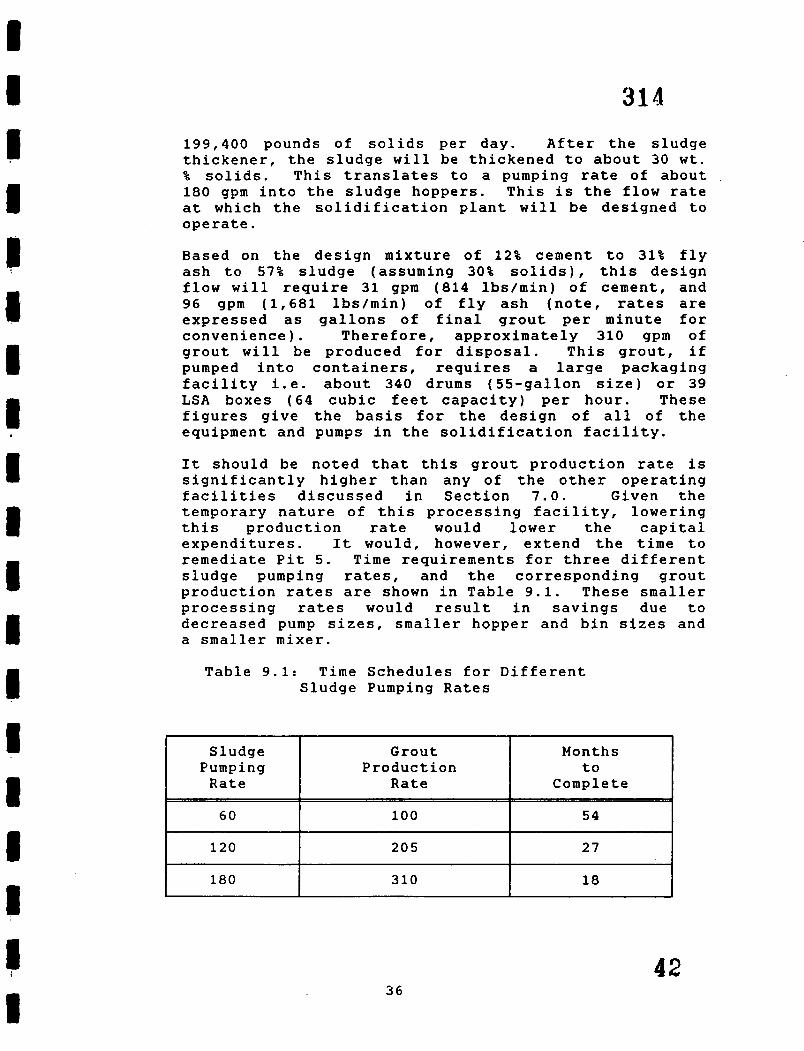
199,400 pounds of solids per day. After the sludge thickener, the sludge will be thickened to about 30 wt. % solids. This translates to a pumping rate of about ,
180 gpm into the sludge hoppers. This is the flow rate at which the solidification plant will be designed to operate.
205
310
Based on the design mixture of 12% cement to 31% fly ash to 57% sludge (assuming 30% solids), this design flow will require 31 gpm (814 lbs/min) of cement, and 96 gpm (1,681 lbs/min) of fly ash (note, rates are expressed as gallons of final grout per minute for convenience). Therefore, approximately 310 gpm of grout will be produced for disposal. This grout, if pumped into containers, requires a large packaging facility i.e. about 340 drums (55-gallon size) or 39 L S A boxes (64 cubic feet capacity) per hour. These figures give the basis for the design of all of the equipment and pumps in the solidification facility.
It should be noted that this grout production rate is significantly higher than any of the other operating facilities discussed in Section 7.0. Given the temporary nature of this processing facility, lowering this production rate would lower the capital expenditures. It would, however, extend the time to remediate Pit 5. Time requirements for three different sludge pumping rates, and the corresponding grout production rates are shown in Table 9.1. These smaller processing rates would result in savings due decreased pump sizes, smaller hopper and bin sizes a smaller mixer.
Table 9.1: Time Schedules for Different Sludge Pumping Rates
Sludge Pumping Rate
-
Grout Production
Rate
Months to
Complete
54 I 100 I 60 I
to and
42 36
9 . 4
314
REQUIREMENTS OF CEMENT AND FLY ASH AND GROUT PRODUCTION
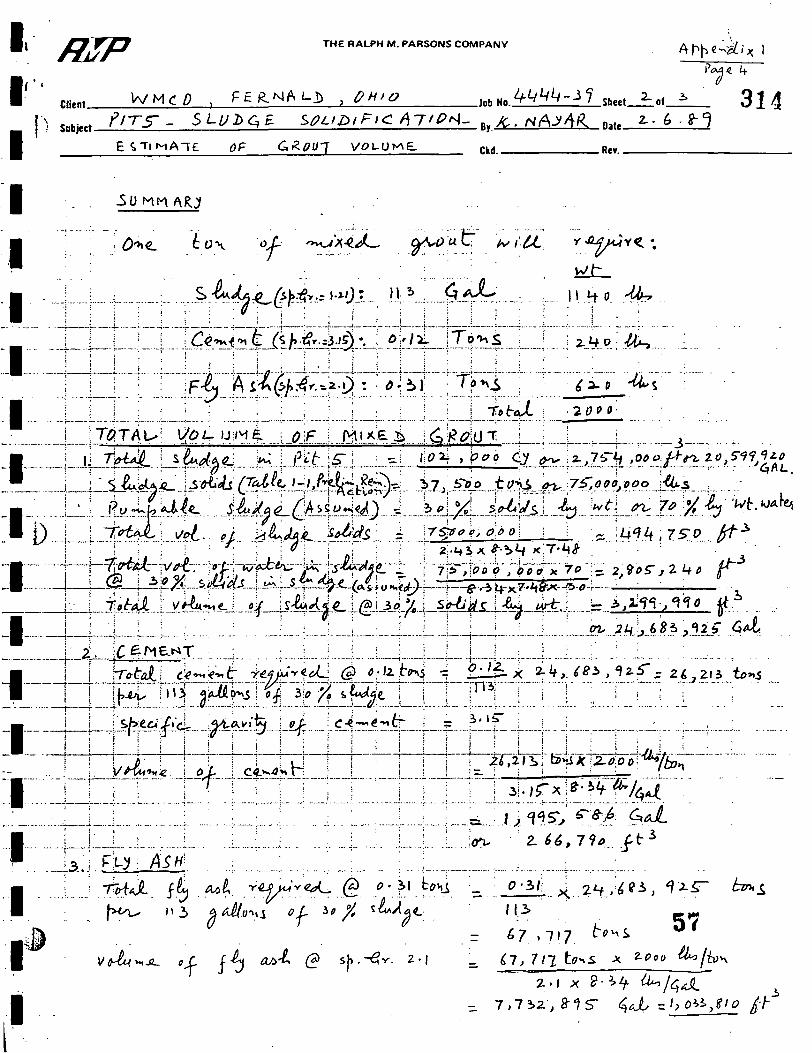
Based on t h e a b o v e mix, t h e f o l l o w i n g q u a n t i t i e s of d i f f e r e n t c o n s t i t u e n t s w i l l be r e q u i r e d f o r one t o n of g r o u t ( s e e Append ix 1 ) :
S l u d g e Cement F l y Ash
1 1 3 G a l l o n s 0 . 1 2 Tons 0 . 3 1 Tons
The t o t a l s o l i d s i n s l u d g e a r e e s t i m a t e d a t 3 7 , 5 0 0 t o n s , which c o r r e s p o n d s t o 2 4 , 6 8 3 , 9 2 5 g a l l o n s o f 3 0 w t . % s o l i d s s l u d g e . G i v e n t h e t ime c o n s t r a i n t o f 18 m o n t h s , assume 3 7 5 w o r k i n g d a y s a re a v a i l a b l e for s l u d g e p r o c e s s i n g . T h i s l e a d s t o a s l u d g e t r e a t m e n t r a t e of 6 5 , 8 2 4 g a l l o n s p e r d a y . Based on a b o v e f o r m u l a t i o n , d a i l y r e q u i r e m e n t s f o r c e m e n t and f l y a s h w i l l be 7 0 a n d 1 8 0 t o n s r e s p e c t i v e l y . T o t a l r e q u i r e m e n t s f o r cemen t and f l y a s h w i l l b e 2 6 , 2 5 0 and 6 7 , 5 0 0 t o n s r e s p e c t i v e l y . T o t a l g r o u t p r o d u c t i o n w i l l b e a p p r o x i m a t e l y 4 . 6 m i l l i o n c u b i c f e e t . S e e T a b l e 9 . 2 and Appendix f o r d e t a i l s .
43 37

Table 9.2 Requirements Of Cement And Fly Ash
And Grout Production
3. Time schedule (6 hrs/day ef fec t ive , 250 days/year)
Description Quantity
375 days 2250 hours
~ ~~~
1. T o t a l sludge so l id s (sp. gr. 2.43)
4. Requirements Per Day Sludge Cement Fly Ash
5. Total cement requirement (sp. gr. 3.15)
37,500 tons 75,000,000 lbs . 494,750 cu. f t .
65,824 gal . 70 tons 180 tons
26,250 tons 266,790 cu. f t .
3,299,990 cu. f t . 24,683,925 gal. I 2 . Sludge volume @ 30 w t . % s o l i d s
~ ~~
6. Total f l y ash requirement (sp. gr. 2.1)
7. Total volume of grout produced
67,500 tons 1,033,810 cu. f t .
4,600,590 cu. f t . say 4,600,000 cu. f t .
4. Design Basis (1 ton of grout) Sludge (30 w t . % so l id s ) Cement Fly Ash
113 gal. 0.12 tons 0.31 tons
9.5 SLUDGE T H I C K E N I N G
It i s p l a n n e d t h a t t h e s l u d g e w i l l be pumped from P i t 5 a t a b o u t 20 w t . % s o l i d s . However, i n a c t u a l p r a c t i c e , it w i l l b e d i f f i c u l t t o c o n t r o l t h e s o l i d s c o n t e n t of t h e s l u d g e ; t h e r e f o r e , it i s e x p e c t e d t h a t t h e s o l i d s c o n t e n t o f t h e pumped s l u d g e c o u l d v a r y w i d e l y . A l l f l u c t u a t i o n s i n s o l i d s c o n t e n t of t h e s l u d g e c o u l d be c o n t r o l l e d by p r o p e r o p e r a t i o n of t h e t h i c k e n e r . A n u c l e a r d e n s i t y gage i n s t a l l e d a t t h e t h i c k e n e r o u t l e t
38 44
314 w i l l m o n i t o r t h e s l u d g e d e n s i t y and w i l l s h u t o f f t h e s l u d g e t r a n s f e r pumps i f t h e s l u d g e d e n s i t y f a l l s b e l o w a p r e s e t l i m i t .
The d e n s i t y c o n t r o l on t h e t h i c k e n e d s l u d g e i s v i t a l as t h e p r o c e s s i n g of d i l u t e s l u d g e w i l l r e s u l t i n u n d u l y l a r g e q u a n t i t i e s o f t h e f i n a l s o l i d waste form f o r d i s p o s a l . T h i s i s d u e t o l a r g e r volume o f s l u d g e t o be h a n d l e d c o u p l e d w i t h i n c r e a s e d r e q u i r e m e n t s f o r c e m e n t a n d f l y a s h . A p a r t from incze.ss ina,-- the s i z e of t h e waste d i s p o s a l f a c i l i t y , it w i l l h a v e a n impact on c o s t . A l t h o u g h a 30 w t . % s l u d g e h a s b e e n t e n t a t i v e l y s e l ec t ed f o r s o l i d i f i c a t i o n , a t tempts have t o b e made i n a c t u a l o p e r a t i o n s t o work w i t h s l u d g e , c o n t a i n i n g more t h a n 30 w t . % s o l i d s . However, t h i s r e q u i r e s more d a t a as t o t h e pumping cha rac t e r i s t i c s of s l u d g e and t h e g r o u t p r o d u c e d . I t is l i k e l y t h a t g r o u t p r o d u c e d by 35 w t . % o r more s o l i d s i n s l u d g e may p r e s e n t p r o b l e m s i n h a n d l i n g o r pumping. However, t h i s n e e d s t o be d e t e r m i n e d by a c t u a l t e s t i n g / o p e r a t i o n s . F o r t h e p u r p o s e s o f t h i s s t u d y , a 30 w t . % s o l i d s s l u d g e w i l l f o rm t h e basis f o r d e s i g n .
The t h i c k e n e r o v e r f l o w w i l l e x i t t o a n a b o v e g r o u n d c a r b o n s t e e l sump. Two r e t u r n water pumps w i l l pump t h e water back t o P i t 5 f o r p r e p a r i n g t h e s l u d g e s l u r r y . N o r m a l l y , o n e pump w i l l be i n o p e r a t i o n and t h e o t h e r w i l l be on s t a n d b y . However, u n d e r h i g h l e v e l c o n d i t i o n s i n t h e sump, t h e s t a n d b y pump w i l l be a u t o m a t i c a l l y s t a r t e d a n d b o t h pumps w i l l o p e r a t e s i m u l t a n e o u s l y . t h i c k e n e r w i l l be b o t h pumps. T h i s t a k e care o f a n y s l u d g e s a re pumped o p e r a t e w i t h l e v e l
The r e t u r n w a t e r - l i n e from t h e d e s i g n e d f o r t h e f u l l c apac i ty of c o n t i n g e n c y h a s t o be p r o v i d e d t o u p s e t c o n d i t i o n s when v e r y d i l u t e t o t h e t h i c k e n e r . These pumps w i l l c o n t r o l l e r s .
S l u d g e t r a n s f e r pumps a n d t h i c k e n e r r e t u r n water pumps w i l l be i n s t a l l e d away f rom t h e t h i c k e n e r so t h a t e x p o s u r e t o o p e r a t i o n s a n d m a i n t e n a n c e p e r s o n n e l i s k e p t t o t h e minimum. Table 9,3 g i v e s t h e t h i c k e n e r i n p u t / o u t p u t da t a .
45 39

314
1. Total sludge solids (sp. gr. 2.43)
2. Sludge volume @ 30 wt. % solids
Table 9 . 3 Thickener Input/Output Data
37,500 tons 494,750 cu. ft.
3,299,990 cu. ft. 24,683,925 gal.
Description
5. Thickener input @ 20 w t . % solids in sludge
6. Water recovered from thickener
I Quantity I
290 GPM approx. (say 300 GPM)
110 GPM approx.
~~
3. Time schedule (6 hrs/day effective) 375 days 2250 hours I
4. Sludge processing/thicker output I ' ( 30 wt. % solids) 64,824 gal/day 180 GPM approx.
L 1 I
9 . 6 WATER REQUIREMENTS
Water requirements for solidification of Pit 5 sludge will depend upon the solids content of the sludge used for processing. Based on the limited data available on sludge pumpability, it is assumed that 30-35 wt. % solids sludge will be processed.
Pit 5 has 1 0 2 , 5 0 0 cubic yards of sludge ( 2 , 7 6 7 , 5 0 0 ftJ) with a solids content of 3 7 , 5 0 0 tons ( 4 9 4 , 7 5 0 ft] @ 2 . 4 3 sp. gr.). Based on this data, the water associated with sludge is 2 , 2 7 2 , 7 5 0 ftl ( 2 , 7 6 7 , 5 0 0 ft' - 4 9 4 , 7 5 0 ft'). In addition, 7 5 0 , 0 0 0 gallons ( 1 0 , 2 7 0 ft') of surface water is available in Pit 5 . All of this will be available for sludge solidification.
It is shown in Table 9 . 4 that an extra 3 , 2 3 3 , 0 0 0 gallons of water will be required to p,rocess the sludge at 30 wt. % solids, whereas processing of sludge at 35 wt. % solid will leave an excess of lh43-,=0 gallons of water. If feasible, the best approach would be to process the sludge at more than 30 wt. % solids so that the extra requirements of water and ultimately the project costs are kept to a minimum.
46 4 0

3 2 4 Table 9.4
Water Requirements For Sludge Solidification
I tem Description
1.
2.
3.
a.
5 .
3 .
7 .
Total solids in Pit 5 sludg?
Volume of sludge (solids+water)
Water content of sludge (Item 2-1)
Surface water (750,000 gal.)
Water associated with sludge (see Paragraph 9.6)
Total water available in Pit 5 (Item 4+5)
Additional water required for sludge (Item 3-6)
30 wt. % Solids Sludge
37,500 tons ’
75,000,000 lbs. 494,750 ft’
3,299,990 f t’
2,805,240 ft’
100,270 ft’
2,272,750 ft’
2,373,020 ft’
432,220 ft’ 3,233,000 gal.
35 wt. % Solids Sludge
37,500 tons 75,000,000 lbs. 494,750 ft’
2,727,500 ft’
2,232,750 ft3
100,270 ft’
2,272,750 ft’
2,373,020 ft’
140,270 ft’ 1,049,220 gal.
9.7 SLUDGE STORAGE
Sludge storage capacity will be provided for (2) days (Total of 16 available hours on one shift per day basis) supply for the solidification facility to take care of inclement weather. Two equal sized carbon steel sludge storage tanks will be provided, each holding 90,000 gallons. In order to maintain fluidity and nearly uniform consistency of the sludge for solidification, these tanks will be equipped with paddle-type, slow speed mixers. During normal operations, one tank will be receiving the sludge from the thickener and the other will be feeding the grout mixer.
Sludge storage tanks will be“-..equipped with level sensing devices to indicate the level of the sludge in each tank. High and low level alarms will be provided.
41 47
I I I I I
9 . 0
9.9
314
Flow to each tank will be directed through automatic inlet valves at the option of the operator.
The sludge tanks will be installed outdoors adjacent to the sludge mixing building. Concrete containment will be provided to-meet the DOE regulatory requirements. A sump pump will be provided to pump any sludge leaks or spillages back to the thickener.
CEMENT AND FLY ASH HANDLING AND STORAGE
Cement and fly ash, the two primary sludge solidification agents, will be received by railcars or tank trucks. These will be pneumatically unloaded and stored in bins. Cement storage capacity will be provided for 6 days, the cement bin will have a nominal capacity of 450 tons. Fly ash storage capacity will be provided for 4 days with 2 bins of 360 tons capacity each. All the cement and fly ash bins will be of the same physical size.
All the bins will be provided with bin vent filters. All transfer points with potential for dust emissions will be connected to dust collection system(s).
The mode of transport for cement and fly ash will depend upon the source of supply. Particularly, the source of supply for fly ash should be considered in advance before using any fly ash for solidification testing. In case the supply sources are near, truck transport is likely to be more economical, as the capital expenditure for the railcar unloading system will be eliminated. However, this could be a separate study after the requirements for various raw materials have been established by actual tests. Cement and ash storage bins will be equipped with level instruments for operational control.
Depending upon actual requirements, separate bins for clay and/or blast furnace slag could also be installed. Details of the material handling equipment will be established only after the mix and its constituents have been determined. The conceptual design as shown in the process flow diagram has enough flexibility to meet the requirements of any specific mix.
SLUDGE AND GROUT PUMPING
Pumping of sludge and grout (slurries) has to take into consideration many aspects such as the slurry density, viscosity, particle size, specific gravity of solids, fluid velocity and pipe wear. The fluid velocity must
4 2 48

314
9.10
provide enough turbulence to keep the solids in suspension. Homogenous slurries provide enough turbulence to keep the solids in suspension at relatively low velocities, less than 6 feet per second. In case of heterogenous slurries, where the solids have a tendency t o settle quickly, relatively high velocities above 7 feet per second are necessary. A velocity of 4-7 feet per second is normally practical and economical. Pipe wear becomes a concern at velocities above 8-10 feet per second.
The sludge in Pit 5 is comprised of very fine solids (approximately 80% minus 200 mesh) and for the purpose of this study it is assumed to be pumpable at 30 wt. % solids in sludge. It is quite likely that sludge may be pumpable at 3 5 wt. % or higher solids: But this needs to be confirmed by further testing.
Slurry pumping is usually handled by rubber-lined centrifugal pumps, positive displacement piston pumps, diaphragm pumps and "advancing cavity" pumps. Submersible centrifugal type pumps were successfully used for pumping Pit 5 sludge during the test in 1976. Piston type positive-displacement Pumps are particularly suitable where pumping pressures above 600 psi are required. Such high pressures are not attainable by multiple centrifugal pumps in series. Diaphragm pumps are suitable for low-volume, low-head system and use compressed air as the motive force. Progressive cavity type pumps are very useful for slurries at moderate flows and pressures, and are well suited to very thick slurries such as cement grout. Considering the general characteristics of grout, it is proposed to use Moyno, or equal, progressive cavity type pumps for this service. Sludge at 30 wt. % or more solids can be handled by both the centrifugal or progressive cavity type pumps. However, it is preferred to use progressive cavity type pumps for handling thickener underflow and for feeding the sludge to grout mixer as these pumps can handle easily thick slurries or even pastes with very high viscosities. This is not true for the centrifugal pumps.
After the day's work all lines carrying sludge and grout will be flushed with high pressure water.
GROUT MIXING
The Pit 5 sludge, cement and fly ash will be mixed in a continuous mixer (Readco Continuous Processor, or equivalent). This mixer is equipped with two parallel shafts of agitators that rotate in the same direction.
43 49

314
:. 11 I3 13 I1 -13 13 13 11 11 17 13
9.11
10.0
The blades of one agitator assembly maintain close clearances with the second assembly as well as with the walls of the barrel. The agitator assemblies move the ingredients forward and backward, assuring a continual mixing and reymixing within any given section of the mixer. This type of continuous mixer is in operation at Savannah River Plant, Aiken, SC, and at Hanford, Washington for waste solidification and is considered appropriate for Pit 5 sludge solidification as well. The mixer will have enough capacity to process 180 gpm of sludge along with the required quantities of cement and fly ash to produce about 310 gpm of grout. A set retarding agent, if required, will also be metered into the continuous mixer.
The grout slurry will be discharged into a holding tank equipped with a center mounted mixer. The grout transfer pumps will transfer the grout through a pipeline to the disposal facility. Grout pumping will have to be started soon after mixing, as the grout has a tendency to set if allowed to become static.
FLUSH WATER RECEIPT TANK
The FWRT having a capacity of 5,000 gallons, will receive wastewater from several sources including process area floor drains, the sump pump in the FWRT's secondary containment and flush water from transfer lines flushing.
The flush water pump can transfer flush 'water to the grout mixer, if needed. Normally, it will return the water in the FWRT to the sludge thickener. In addition, the FWRT is equipped with an agitator to prevent any suspended solids contained in the flush water from settling.
REFERENCES
1) Malone, P.G., L.W. Jones, and R.J. Carson. (1980). Guide to the Disposal of Chemically Stabilized and Solidified Waste, Municipal Environmental Research Laboratory, EPA, Cincinnati, OH, EPA-lAG-D4-0569, 114 p.
2) Neilson, R.M., Jr., and L.R. Dole. (1986). "Chemical Considerations for the Immobilization of Low-Level Radioactive Waste, "Radioactive Waste Technoloqy", (Ed. A.A. Moghiss, H.W. Codbee and S.A. Hubart), American Society of Mechanical Engineers, New York, pp. 317-349.
50 4 4

I ' I I I I I I I I I 1 I I
I 1 I I I
3)
4)
. _ .
5)
7)
3 2 4
Schuler, T.F. and D.L. Charlesworth. (1986). "Solidification of Radioactive Incinerator Ash", Waste Manaqement, Vol. 1, Arizona Board of Regents, pp. 489 -493.
Grant, D.-C., E.E. Smeltzer, M.C. Skriba, J.C. Cwynar and L.R. Eisenstatt. (1985). "Cement Encapsulation of Low Level Radwast Streams", Waste Management, Vol. 3, Arizona Board of .- Reqents, __c pp. 435 -439.
Cwynar, J.C., A.L. Nesal, P.M. Petron and A.J. Dietrich. (1986). "Retrofit and Operation of Low-Level Radwaste Solidification System", Waste Manaqement, Vol. 1, Arizona Board of Regents, pp. 575 -579.
Buckingham, W.F. and E.B. Peacock. (1987). "Large Scale Stabilization of Hydrocarbon Waste with Spent Clays and Pozzolans", Waste Manaqehent Initiative, The Oak Ridqe Model, Oak Ridqe Model Conference Proceedinas, Vol. 1, Waste Manaqement, Part 2, Martin Marietta Energy Systems, Inc., Oak Ridge, TN, Conf-871075-V.l-PT-2, p. 85.
Cohen, S. and P. Crouzet. (1986). "Syncrete: A High Efficient Cement Embedding Matrix for Waste Processing", Waste Management, Vol. 1, Arizona Board of Regents, pp. 583 - 588.
Sjoblom, R., H. Forsstrom, and R. Shingleton. (1985). "Equipment and Procedures for Concrete Solidification of Radioactive Waste from System Decontamination", Waste Hanaqement, Vol. 3, Arizona Board of Regents, pp. 381 - 386.
McMahon, T. (1989). Personal Correspondence.
Rosenstiel, T.L., S.P. Bodett, and R.G. Lange. (1985). Environstone Gysum Cement, 10 CFR 61 Compliance Testing, Topical Report, United States Gysum Company, Libertyville, Xllinois, 73 p.
IT Corporation. (1988). Preliminary Remediation Action Alternatives for Pit 5 at the Feed Materials Production Center, Fernald, Ohio, IT Corporation, Monroeville, PA.
Roy F. Weston, Inc. (1988). Characterization Investiqation Study: Geotechnical Evaluation of Waste Pit Material Properties and Borinq Loqs, Roy F. Weston, Inc., Albuquerque, NM. 5 1
45
I I I I I I I I I I I 1 I I 1 I I I I
314
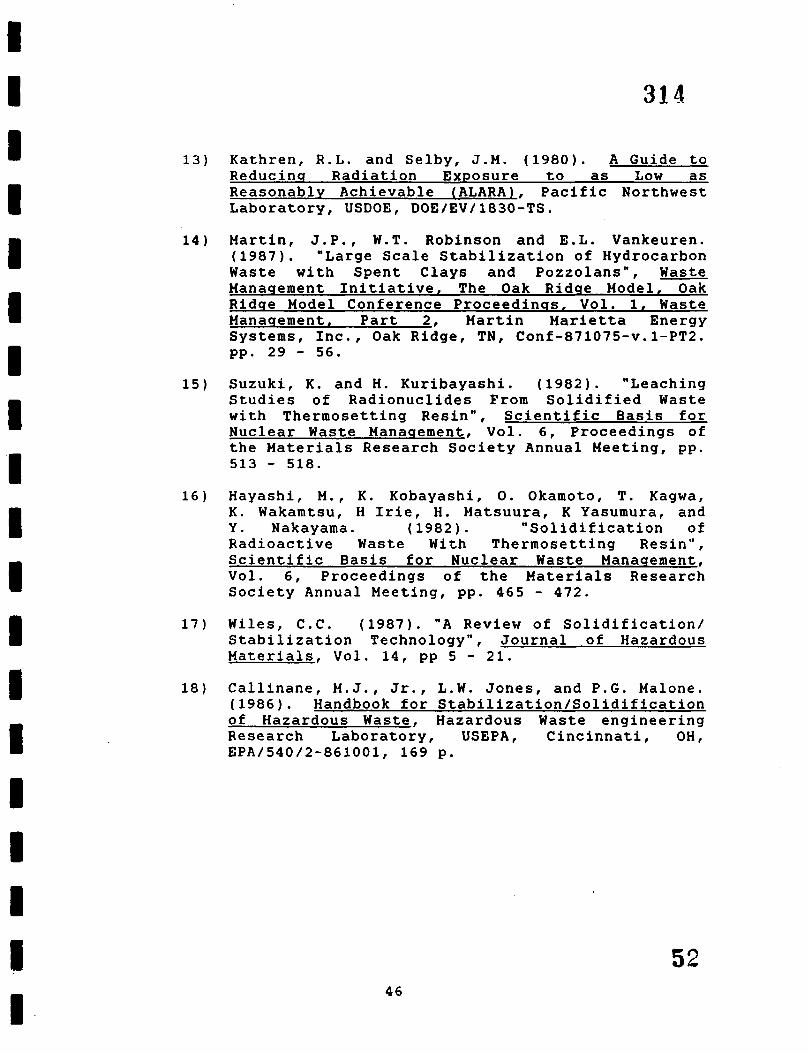
13) Kathren, R.L. and Selby, J.M. (1980). A Guide to Reducinq Radiation Exposure to as Low as Reasonably Achievable (ALARA), Pacific Northwest Laboratory, USDOE, DOE/EV/1830-TS.
14) Martin, J.P., W.T. Robinson and E.L. Vankeuren. (1987). "Large Scale Stabilization of Hydrocarbon Waste with Spent Clays and Pozzolans", Waste Manaqement Initiative, The Oak Ridse Model, Oak Ridqe Model Conference Proceedinqs, Vol. 1. Waste Manaqement, Part 2, Martin Marietta Energy Systems, Inc., Oak Ridge, TN, Conf-871075-v.1-PT2. pp. 29 - 56.
15) Suzuki, K. and H. Kuribayashi. (1982). "Leaching Studies of Radionuclides From Solidified Waste with Thermosetting Resin", Scientific Basis for Nuclear Waste Management, Vol. 6, Proceedings of the Materials Research Society Annual Meeting, pp. 513 - 518.
16) Hayashi, M . , K. Kobayashi, 0. Okamoto, T. Kagwa, K. Wakamtsu, H Irie, H. Matsuura, K Yasumura, and Y. Nakayama. (1982). "Solidification of Radioactive Waste With Thermosetting Resin", Scientific Basis for Nuclear Waste Manaqement, Vol. 6, Proceedings of the Materials Research Society Annual Meeting, pp. 465 - 472.
17) Wiles, C.C. (1987). "A Review of Solidification/ Stabilization Technology", Journal of Hazardous Materials, Vol. 14, pp 5 - 21.
18) Callinane, M.J., Jr., L.W. Jones, and P.G. Malone. (1986). Handbook for Stabilization/Solidification of Hazardous Waste, Hazardous Waste engineering Research Laboratory, USEPA, Cincinnati, OH, EPA/540/2-861001, 169 p.
52 46

314
11.0 APPENDIX
Calculations
I I I I
I I 1 I - 53
4 7

I I &T THE RALPH M. PARSONS COMPANY

THE RALPH M. PARSONS COMPANY
.... .,___ ... . . . . .
! 2 7 4h-a + . . . . . . .
. . * . 55

/
THE RALPH M. PARSONS COMPANY
.......
. . .
. I ; :
' 2 6 6 , 7 9 0 . . f t 3 j ! . . . . . . . .
. . .L ...... 1 __.... ..... . :. ... :_ . . . . . . . _ I ...... 4% . .
. <
. r . . ......................... .. __- ._ . . . . - .. _..- ....... ...
.... _.__ . .
... -
57 11.3
6 7 , 7 1 7 . .
L
L

I I I 1 I I 1 I
THE RALPH M. PARSONS COMPANY
- 3 314 -.
Job No. 4 4 4 4 - Sheet of Client w r y c o , / = E l l AlhLb , O H r g
. . . . . . . . . . - . - - . . . . .̂ . . . . . . . j . . . ; . ; . . : . .
. . . i i i ! i ' ' . . : : . ; ; . : . :
' - -_ i DA\kyi - f?RDbUiTJbHj . . ; ~. i
. . . . . . . . . . . . . . . . . . .... ..... ... . .............. ... ...... . . . . . . . -- -. :... _ :
I
. , : . . , : . * . . . . .
., :
j ! . .
. , . . , . .
.. ............................... . ... . . . . . .. .- . I ! . !
. . ! : : . , . . ! i . f i . : . .
i t : : ! . . : . . . . . . . .... ........ ..... . . . . . . . . . . . . . . . . . . . . . . . . . . . . . . . . . . . . . . ....... . . . .
% .
. . . .
. . . . . .
;-
. . . . . .
._r..- ~ . .
. ! , I . ' i .
. . . I . . ' . , . . . . . . . . . . . . . . . . . . . . . . . . . . . I ....... -.--- ..... . .-: ....... . .. . 2 . - L .
. . ; , . . . . . . .
, . : . . , I
. . .
i j . . -
: 1s ....... : ..... n29,. . . .... ..i . .... .. - ... :-. .... . 0% . . 2 y UTA.
. . . . . .
. . . .. ... ..........
. . .... ........ . . . . . ...... . . . . . . . . . . . . . . . .
. / I . . _____~___ .___ . . .~_____ . .C_ . , . .
. - -1 : . . - .- ___- 1 :. . .
.---; i--? .. .:. . . . . . . . . . . . . . . . ._ . , . . . . . .
i r_. .
, . . . . . . . . . . . . . . . . . . . , . . . . . . . / L .
: ! / . I . ! . . , , , s : 7 6'7 ..... A ' L _ j ....... .: . . . -.. ...................... .......... 4.2 !?!i,.64..E- . . .:
. . . - ? . . . 2 4 , 6 O v , 0 0 0 i . . : ;
. .
... . , . . . . # . . . ! . : . . . ' t . . . . . . . . . . . . >
. . . . . . . . . . . . . . . . . . . . . . . . . . . . .
. . -
i : : . . : .
3 - . . * . . .
. . . . . . . . . . . . . . . . . . . . . .. - .. 58

& . .
THE RALPH M. PARSONS COMPANY

I -I
I -I I
THE RALPH M. PARSONS COMPANY
s; 2, 2 5 2 , 7 5 0
. .
. . .
. . .
. -
. . .
...
- . . . . .
_ . : ............. . . . . . . . . . . . . . .. - . . . . . . . . ._ .. ............. __I
, . . I . . . . . , _ . .
- . . . . . . /
. : . : . . . . . . . . . . . ". . . . . . . . . . . . . . . . . . . . . . . . . . . .
60
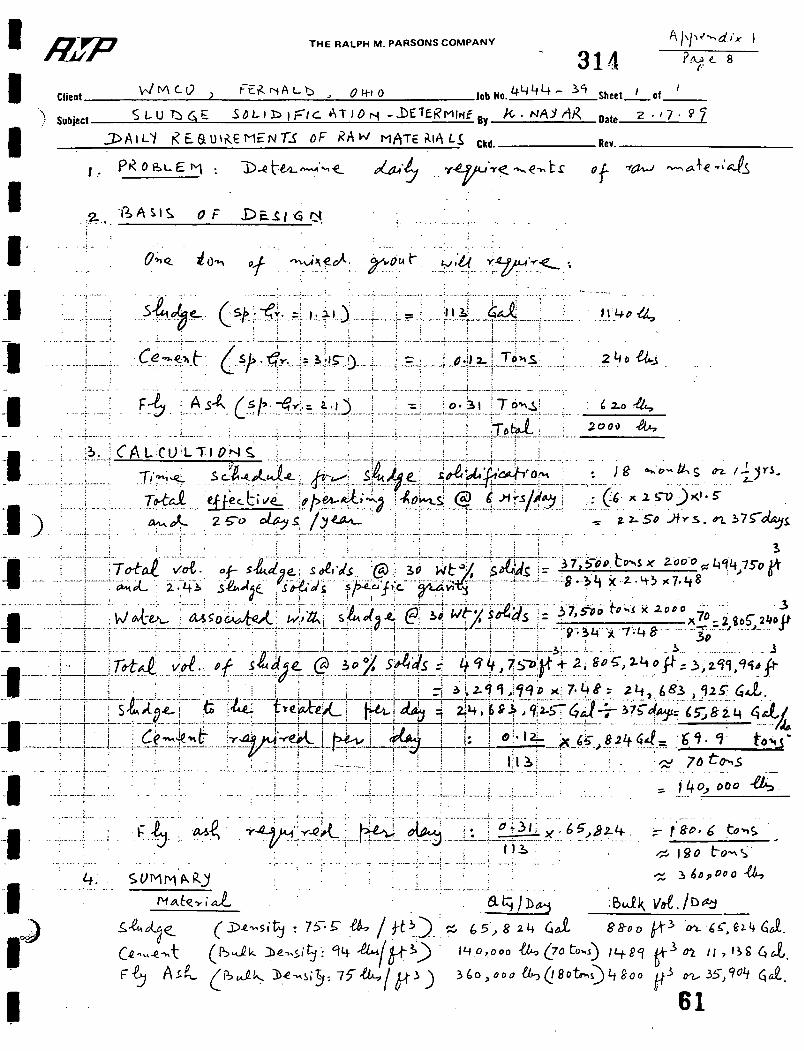
. . -
........... .......... . .
. ; .
: I .i3. ~ C A L I C L ) ~ L T ~ O ~ J ~ j , . ) g n k o - k s PT / 1 j * J , . . I . .
L. . . . . . . . . . . . . I .
. : . .. x . 3 5-->4*5
: : .
........ ..... ... ......... ... .. . . . . . . ;.-- I . . i. . . . _ _ . . . .. : ,
65,824. = 1'80. 6 , b v S . .
. . . . . . . . . . . . . . - . . . . . - 113: 45 190 t o - 4 ' ! : > ;
. . . . . . . . . . . . . . . . . . . . . . . . . . . . . . . . . . . . . . . - ............ ....... 1 ........................
3 6 0 p O 0 0 -& . . . . . . . . _ : .
. . . .
I . . '
* ! . : . . . . . . . . . . . .............. ~ . . . . . . . . . . . . . . . . 4 ; . S O ~ ~ A k y
MdtQY i &L : B J j ( v d . l w
I' I . .
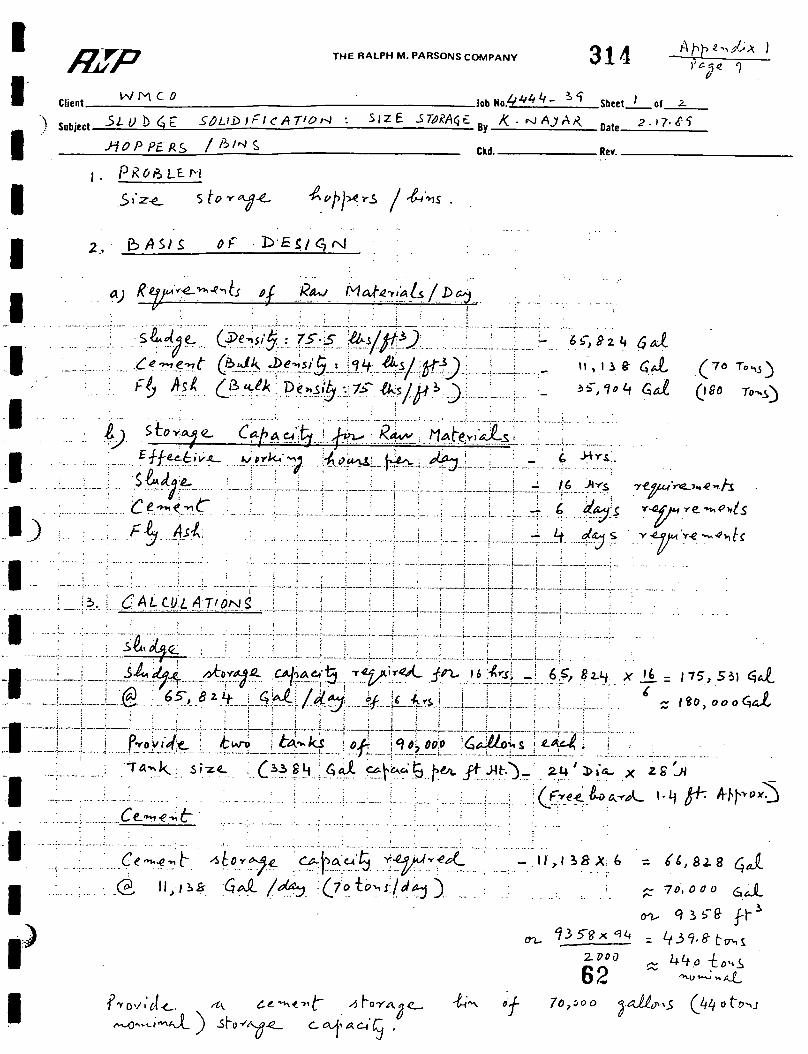
THE RALPH M. PARSONS COMPANY AEF I I' I I I I -I I B

THE RALPH M. PARSONS COMPANY
. . - . . . . ! : . : . L .- ; - :. I. ...- ._? ..A L. - ~ - . _.__,_.._A i
. , , ! : : : , : . . :
. . , j . j
....... . . . . . . ............. ...... . . . . . . . . ...... ..... . ...... .......... ................. . . ; ' '
i ! . , : , : ! !
. . . : .
. , : I . . , I
. .
... .. . . . ................. .......... . . . . . . . . . -. i ' 7 2 , 0 0 0 . . G ~ ~ C J - ' . . )+u . I i i. 1. L..-.i -.: I . . . .
I . .
. . . . . . . . . .


. . . . . . . . . . . . . . . . . . .
... . . . . . ... ~ - . ..... d . . . . . . . . . . . . . . . . . . - I * V & 3 e o f
:
........ .... . - . . .... ... ..... ......
..... .; .... . . . .... ...................... . . . . .
. . : ........ - : :. ....... ........
. . . . . . . ...
. .
-
. . . . . . . . . . . . . . . . . . . . . . . . . . . . . . . . . . . . . . . . . . . . . . . . . . . . . . . . . . . . .- ............. .... !. ._ . . . -.: . . . . . .
3 , .
-,
. .
. .
j * l q L 'K ' U i / O ' . . . . - i . .>5.,! .A: 8 . 66 , = 2'26.75, &r. . . - . : . .
, . - I . . . . . . . . . . . . . . . . . . . . . . . . . . . . . . . . . . . . . . . . . . . . I .
. . . . . . . . . . . . . . . . . . . . . . . . . . . . . . . . ......... . .............. . . . . . . . . . . . . . . . . . . . .......... . . . . . . 4 a- - ' 14% 6 0 , I
. .
... . . . . . . . . . . . . . . . . . . . . . ....... ............ . . . . . . ................ .. ............................ - - . ~ : . . . . . . . . .
. . .: ....-. c. : . . L : -. - ~
, . : : !
. .
: ; : ; ; : . : 1 : . .
.. . . . . . . . . . . . . . .
. . . . . . . . . . . . . . . . .... . . ............ .. .................
. .
' E . -i -:. / * 7 3 2 x r . ; -..!. - j
; i p I . 6 6 ' : i 1 ; . . I
. .! . E Z ; g ..: * I 5 A 7.L) 8 I -- ~, ; ~ -.i ._ ' 1 4 . 4 6 : G& . . . . . . . . . . . . . I .
. . . I . . . . . .
..... . . . . . . . . . . . . . . . . . . . . . . . . . . . . ....... . . . . . . . . . . . . . . . . . > ! ' - .,..- .:.. :. . i
. . . . :
. : - . . . .
. .
. . . . . . . . . . . . . . . . . . . . . . . . . . . . . . . . . . . . . . . . . . . . . . . . . . . . . . . . . . . . . . . . . I .
- , . . . . . . . . . . . . .
. . . . . . . . . . . . . . . . . . . . . . . . . . . . . . . . / . .
f ' ".. 5 e b c t -'.x jp.eA Ch-k ,~ :S ;ze l o D I L . x 1 % 1 J I - i 2. W I ' ~
6 & a d & -ed-flo% ( G o v a*)& 6f &l.e> . 65


THE RALPH M. PARSONS COMPANY
I 1 I
2 4 3 . 6
-3. os!?
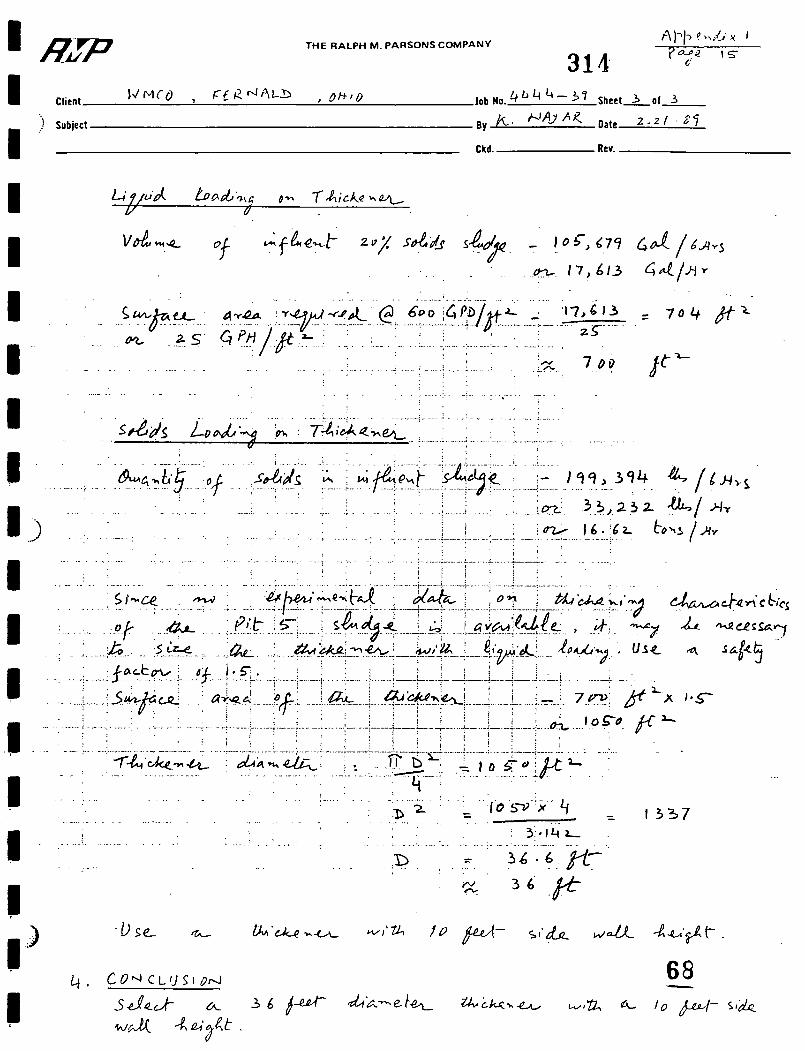
THE RALPH M. PARSONS COMPANY
314
I I I
I I I I I
Ckd. Rev.
. . . . . . . . . . . .- .... :- . . . . . . . . . . . . . . . . . . . - 7 0 4 &-2 . . . . . .... -
. . . . .. . . . . . . . . 02- ....
. . . . . . . . . . . . . . . . . . . . . .; i .... L ;... ... ....:-e.. . . . . . . I
. . , : . . . I
. . . . . . . . . . . . ............... ..... . . . . . . . . . . . . . . . . . . . . . . . . . . . . . . . . . , . . . . . . . . . . . . . . ..... :__. . . i . .r _ . .... i__
. . . . . . . s&Js x : 74iAQ %Q- - i i ..... '.,. . . ; j . . . . . . . . .
.*+i .... . . .;... -sRds ; .... ;- .. 149,394 . 8/6~4~$'
v . . , : . . , . . . . . . ...... . . . * ... .:.. ..!. ........
. . . % . . --_
. . . . .
..... . . . . .... . . . I : . * .
i . .
'.,-
. . . . . . . . . . . . . . . . . . . ....... :. . . . . . -:-. i . . . . . . . :. . . . . - .; i. .. ..-:. ..... :_ L&. ? .$ . 2 3 2. a/ J-k , . .
. . . .
; ! 1 . .:. . : -...: . -. . .... ....... - . . . . . . . . . . . . . . . . . * T ! -. ; . . .. 1 6 . j C ~ - ........... ~ O W / A ~ . . _ . _ . 1 .
. . . . . .
t '
, .
. . . . . . . . . . .
. .
...
. - . ..... .....I
. . . . . . . .
. . . . . . . -
....
. . . . .
...
- . . . . . . . . . . . . . . . . , . . , .* . 5 ~ . ..% .. .+ . . P - - - - 1 3 3 7 . . . . . . . . . . . . . . . . . . ... . . : 3 A 4 L
. . . . . . . -. ... _. . . . . . . . . . . - .............. . I .
. .
. .= ' 3 4 . . 6 -Hi.' :D , . . . . . . . -. . . . .
g 3 6 &t