SLOVENIA - Business statistical kaleidoscope
62
Business Statistics Kaleidoscope
-
Upload
eugenio1958 -
Category
Government & Nonprofit
-
view
9 -
download
0
Transcript of SLOVENIA - Business statistical kaleidoscope
Business Statistics Kaleidoscope


Business Statistics KaleidoscopeOriginal title: Mozaik poslovnih statistikAuthors Jaka Erpič, Ema Mišić, Zala Primožič, Aleksander Sever, Andrejka Šivic Translated by Boris Panič
The publication is available at http://www.stat.si/engInformation: Information Centre:phone: +386 1 241 64 04e-mail: [email protected]
@StatSlovenia
CIP - Kataložni zapis o publikaciji Narodna in univerzitetna knjižnica, Ljubljana
311.42(0.034.2)
BUSINESS statistics kaleidoscope [Elektronski vir] / authors Jaka Erpič ... [et al.] ; translated by Boris Panič. - El. knjiga. - Ljubljana : Statistical Office of the Republic of Slovenia, 2015. - (Collection Brochures / Statistical Office of the Republic of Slovenia)
Prevod dela: Mozaik poslovnih statistik
ISBN 978-961-239-333-5 (pdf) 1. Erpič, Jaka 279748352
Issued and published by the Statistical Office of the Republic of Slovenia, Ljubljana, Litostrojska cesta 54 – © SURS – Use and publication of data is allowed provided the source is acknowledged – ISBN 978-961-239-333-5

3BUSINESS STATISTICS KALEIDOSCOPE
FOREWORD
In recent years the Slovenian economy has struggled with many challenges, including some very tough ones. How these challenges reflected in individual business activities, what their impact on enterprises was and what the prospects are, can in many ways be explained by statistical data.
The mass of business statistics was compiled into an interesting kaleidoscope, which, offered in one place, brings insight into the characteristics, structure, changes and development of the Slovenian economy from 2005 on. We are convinced that these pages will bring interesting and useful information on business activities divided into four main sets: industry, construction, trade and other non-financial services.
Each set of business activities is presented comprehensively, from different points of view and understandably. Many data are shown from which different indicators can be derived indicating the importance of individual activities compared to the total economy, the impact of the economic crisis on them, international comparisons, structural characteristics within individual activities, and forecasts. Short comments and explanations are completed by graphical presentations and emphases on key data and changes. The story concludes with a schematic presentation of an average enterprise in Slovenia.
We hope you will enjoy reading our new brochure and that it will help better understand the Slovenian economy, individual activities and enterprises. For more extensive and detailed data on this subject, visit our SI-STAT Data Portal.
Genovefa Ružić Director-General

4 BUSINESS STATISTICS KALEIDOSCOPE
CONTENTS
FOREWORD ........................................................................................................................................................ 3
1 BUSINESS STATISTICS - what are they and what do they comprise? ................................................................ 5
2 INDUSTRY ....................................................................................................................................................... 15
3 CONSTRUCTION .............................................................................................................................................. 25
4 TRADE ............................................................................................................................................................. 35
5 OTHER NON-FINANCIAL SERVICE .................................................................................................................... 45
6 AVERAGE ENTERPRISE IN SLOVENIA ............................................................................................................... 55
Units of measurement, abbreviations ................................................................................................................ 56Country abbreviations ........................................................................................................................................ 56List of codes of SKD 2008 categories ................................................................................................................. 56Definitions ........................................................................................................................................................ 57Sources and literature ........................................................................................................................................ 60Sources of photographs ..................................................................................................................................... 60

1 BUSINESS STATISTICS - what are they and what do they comprise?Industry
1 BUSINESS STATISTICS – what are they and
what do they comprise?
Construction
Trade
Other non-financial services
Photo: Alenka Mihorič, Sokol ARSO
Photo: Albert Kolar, Sokol ARSO
Photo: Ema Mišić
Photo: Ema Mišić

6 BUSINESS STATISTICS – what are they and what do they comprise? BUSINESS STATISTICS KALEIDOSCOPE
All business entities with headquarters in Slovenia performing market or non-market activities are registered in the Business Register of Slovenia (PRS).
The backbone and the sampling frame of the business statistics (i.e. the list of units comprising the population from which a sample is selected) is the Statistical Business Register (SPRS), which contains data on all active enterprises in Slovenia. It is compiled from several administrative data sources and from data collected with statistical surveys as well as other information.
Structural business statistics monitors the operation of active market enterprises and provides internationally comparable data.
Further on primarily statistical data on non-financial business activities are presented and broken down into four main sets: industry, construction, trade and other non-financial services, i.e. non-financial services excluding trade.
Figure 2: Coverage of business entities, Slovenia
PRS • business entities
SPRS • active enterprises
structural statistics
• active market enterprises
Source: SURS
Business statistics at SURS cover all statistical surveys with which various data on active enterprises are collected. Namely, these are enterprises that are according to the Standard Classification of Activities (SKD 2008) classified into financial and non-financial business activities, i.e. sections of activities B to N and division S95.
Figure 1: Business statistics according to SKD 2008
BUSINESS STATISTICS
Non-financial business activities
Industry(B-E)
Construction (F)
Services (G-N, S95)Non-financial
services (G-J, L-N and
S95)
Financial and
insurance activities
(K)B – Mining and quarrying
C – Manufacturing
D – Electricity, gas, steam and air conditioning supply
E – Water supply, sewerage, waste management and remediation activities
G – Wholesale and retail trade; repair of motor vehicles and motorcycles
H – Transpor-tation and storage
I – Accommoda-tion and food service activities
J – Information and communica-tion
L – Real estate activities
M – Professional, scientific and technical activities
N – Administrative and support service activities
S95 – Repair of computers and personal and household goods
Source: SURS

7BUSINESS STATISTICS – what are they and what do they comprise?BUSINESS STATISTICS KALEIDOSCOPE
87% of enterprises that operated in 2013 were market oriented, i.e. they performed mostly market activities. Almost all enterprises classified into business activities were market oriented. On the other hand, almost all enterprises classified into Public administration and defence, compulsory social security (O) were non-market oriented. Among enterprises classified into Education (P), Human health and social work activities (Q), Arts, entertainment and recreation (R) and Other service activities (S) about half were market-oriented.
Chart 1: Structure of enterprises by operation, Slovenia, 2013
Source: SURS
Did you know that in 2013 almost half of enterprises
were sole proprietors?
A numerical overview of enterprises
There were more than 182,000 active enterprises in Slovenia in 2013, which is 86% of all registered business entities. They had 817,458 persons employed and generated EUR 90.6 billion of turnover.
Compared to 2008, the number of enterprises grew by 19%, but they employed 7% fewer persons and generated 5% less turnover.
Almost half (47%) of enterprises registered in 2013 were sole proprietors, 32% were companies and the rest were other legal and natural persons. As regards sole proprietors, on average they employed two persons, while companies on average employed 8 persons.
Chart 2: Structure of enterprises by size (by number of per-sons employed) and selected indicators, Slovenia, 2013
Source: SURS

8 BUSINESS STATISTICS – what are they and what do they comprise? BUSINESS STATISTICS KALEIDOSCOPE
In 2013, too, the smallest, i.e. micro, enterprises were the most numerous in Slovenia with 95% of all enterprises; 73% of them had up to 1 person employed and 22% had 2-9 persons employed. The remaining 5% of enterprises were small (10-49 persons employed) and medium-sized (50-249 persons employed) enterprises. Only 0.2% of enterprises in the country were large (250+ persons employed), but they generated a third of total turnover. For example, micro enterprises generated 20% of total turnover.
In 2013, 42% of enterprises were registered in three activities: Professional, scientific and technical activities (M), Wholesale and retail trade, repair of motor vehicles and motorcycles (G) and Construction (F). In 2008, the share of enterprises in all of these activities was almost the same (43%).
More than 90% of total turnover was generated by enterprises from business activities; 31% of it was generated by Wholesale and retail trade, repair of motor vehicles and motorcycles (G).
Chart 3: Structure of turnover by activity, Slovenia
A Agriculture, forestry and fishingB-E IndustryF ConstructionG Wholesale and retail trade, repair of motor vehicles and motorcyclesH-N Other servicesO Public administration and defence, compulsory social securityP-S Education; Human health and social work activities; Arts, entertainment
and recreation; Other service activities
Source: SURS
Most persons were employed in manufacturing, 23%. Wholesale and retail trade, repair of motor vehicles and motorcycles employed 14% and education 8% of persons.
Did you know that in 2013 a third of enterprises operated in the Osrednjeslovenska
statistical region?
As regards regional dispersion, in 2013 58% of all enterprises were registered in three statistical regions: Osrednjeslovenska, Podravska and Savinjska. Osrednjeslovenska employed 39% of persons employed or just over 300,000.
Compared to 2008, the number of enterprises increased the most in the Savinjska and the Gorenjska (by 22%) and the least in the Goriška (by 12%) statistical regions.
Chart 4: Enterprises and persons employed1) by statistical regions, Slovenia, 2013
1) Data are shown by statistical regions of enterprise headquarters.
Source: SURS

9BUSINESS STATISTICS – what are they and what do they comprise?BUSINESS STATISTICS KALEIDOSCOPE
Non-financial business activities
Data shown hereafter refer to enterprises classified into non-financial business activities and performing mostly market activities.
According to provisional data for 2013, there were 126,754 active market enterprises in Slovenia. They employed 572,552 persons and generated EUR 79,193 million of turnover and EUR 17,350 million of value added at factor costs.
EUR 79.2 billion of turnoverwas generated by enterprises from non-financial business activities.
As regards the four groups of activities, half of the enterprises operated in other non-financial services, a fifth in trade, 16% in industry and 14% in construction.
Table 1: Structural business statistics, selected indicators, Slovenia, 20131)
Enter-prises
Persons employed Turnover Value
added Gross in-vestment
%
TOTAL 100 100 100 100 100
B-E 16 37 39 43 59
F 14 11 6 7 4
G 20 19 36 18 10
H-J, L-N, S95 50 33 19 32 27
1) Provisional data.
Source: SURS
In 2013, most persons were employed in industry (37%), which generated most of the turnover (39%), value added (43%) and gross fixed capital investment (59%). Trade employed a fifth of persons, generated 36% of turnover and almost a fifth of value added. The fewest persons were employed in construction (11%).
Compared to 2005, in 2013 the number of enterprises in non-financial business activities was 42% higher. It went up in all four groups of activities, the most in other non-financial services (by 67%).
Did you know that in the 2005-2013 period
turnover and value added increased the most
in other non-financial services?
In the 2005-2013 period enterprises generated a third more turnover and 21% more value added than in 2005.
On average, between the beginning and the end of the observed period total employment in observed enterprises decreased by 1%. Employment in industry dropped by 15%, while in trade and other non-financial services it increased, in the latter by as much as 20%.
As regards the size of enterprises by the number of persons employed, in the 2005-2013 period the number of micro and small enterprises in non-financial business activities increased, while the number of medium-sized and large enterprises decreased. The number of micro enterprises increased in all four groups of activities, the most in other non-financial services (by 70%). On the other hand, the number of large enterprises increased only in trade (by 21%).

10 BUSINESS STATISTICS – what are they and what do they comprise? BUSINESS STATISTICS KALEIDOSCOPE
Chart 5: Changes in the number of enterprises by size by the number of persons employed, Slovenia, 20131)
1) Provisional data.
Source: SURS
In the 2005-2013 period turnover increased the most in medium-sized enterprises, by 52%, and the least in large enterprises, by 12%. In micro enterprises it increased by 37%. Compared to 2005, in 2013 employment increased in micro (by 26%) and small enterprises and decreased in large (by 22%) and medium-sized enterprises.
Non-financial business activities contributed 63% of value added to gross domestic product (GDP) in Slovenia in 2013. This is the same as these activities contributed in the EU overall, where the shares were between 71% (in Lithuania) and 49% (in Luxembourg).
Chart 6: Value added of selected activities in GDP, basic prices, 2013
B-E IndustryF ConstructionG-I Wholesale and retail trade, repair of motor vehicles and motorcycles; Transportation and storage; Accommodation and food service activitiesJ Information and communicationL Real estate activitiesM,N Professional, scientific and technical activities; Administrative and support service activities
Source: Eurostat (http://ec.europa.eu/eurostat, 27.11. 2014)
11BUSINESS STATISTICS – what are they and what do they comprise?BUSINESS STATISTICS KALEIDOSCOPE
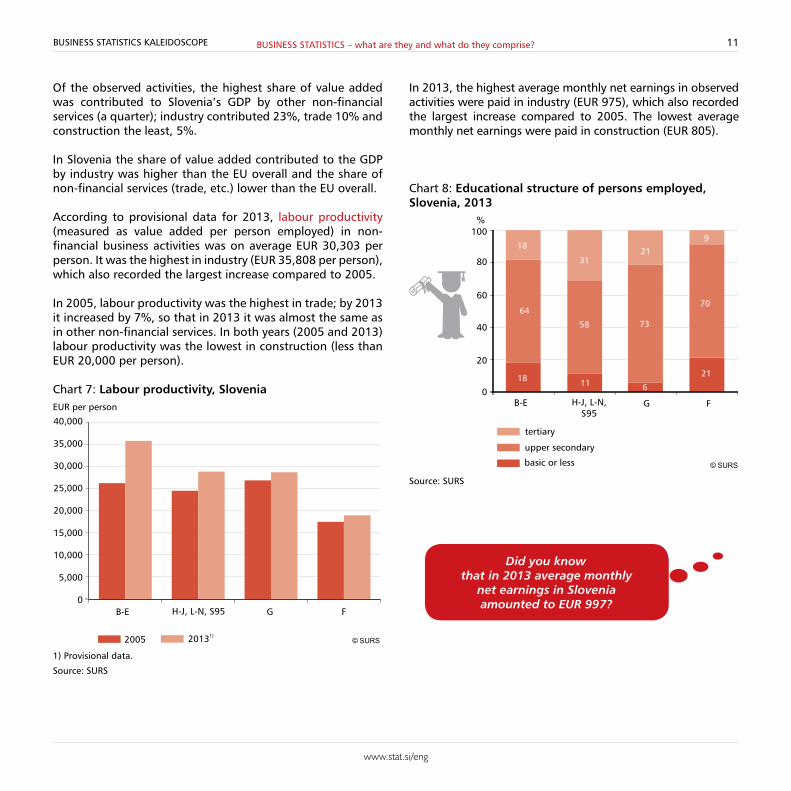
Of the observed activities, the highest share of value added was contributed to Slovenia’s GDP by other non-financial services (a quarter); industry contributed 23%, trade 10% and construction the least, 5%.
In Slovenia the share of value added contributed to the GDP by industry was higher than the EU overall and the share of non-financial services (trade, etc.) lower than the EU overall.
According to provisional data for 2013, labour productivity (measured as value added per person employed) in non-financial business activities was on average EUR 30,303 per person. It was the highest in industry (EUR 35,808 per person), which also recorded the largest increase compared to 2005. In 2005, labour productivity was the highest in trade; by 2013 it increased by 7%, so that in 2013 it was almost the same as in other non-financial services. In both years (2005 and 2013) labour productivity was the lowest in construction (less than EUR 20,000 per person).
Chart 7: Labour productivity, Slovenia
1) Provisional data.
Source: SURS
In 2013, the highest average monthly net earnings in observed activities were paid in industry (EUR 975), which also recorded the largest increase compared to 2005. The lowest average monthly net earnings were paid in construction (EUR 805).
Chart 8: Educational structure of persons employed, Slovenia, 2013
Source: SURS
Did you know that in 2013 average monthly
net earnings in Slovenia amounted to EUR 997?

12 BUSINESS STATISTICS – what are they and what do they comprise? BUSINESS STATISTICS KALEIDOSCOPE
In 2013, most persons with basic education or less worked in construction (21%), most persons with upper secondary education worked in trade (almost three quarters) and most persons with tertiary education worked in other non-financial services (almost a third).
In 2013, 64% of persons employed in non-financial business activities were men and 36% were women. Persons in employed in construction were mostly men (90%), while persons in employed in trade were mostly women (52%).
Did you know that in 2012 enterprise births
represented 10% of enterprises
In 2012, there were 12,826 enterprise births in non-financial business activities, i.e. 10% of all enterprises in these activities. More than half of enterprises were born in other non-financial services (more than 6,000), followed by 20% in trade, 15% in construction and 13% in industry.
Compared to 2005, there were 52% more enterprise births in 2012. The number of enterprise births increased the most in other non-financial services.
As regards the legal form, 65% of enterprise births in 2012 were natural persons, i.e. sole proprietors, and other natural persons (e.g. layers). Most of the enterprise births were recorded in industry and in other non-financial business services (almost 70%).
Almost three quarters of enterprise births had no employees; most of them were born in other non-financial services and industry (78%). Of enterprise births in construction, 46% had employees; 91% of them had up to 4 employees.
Chart 9: Enterprise births, Slovenia
B-E IndustryF ConstructionG TradeH-J, L-N, S95 Other non-financial services
Source: SURS
As regards the growth of number of employees, there were 1,180 high-growth and medium-growth enterprises in non-financial business activities in 2012. Most of these enterprises operated in other non-financial services, 39% (37% of which in transportation and storage); 30% of high-growth and medium-growth enterprises operated in industry.
Compared to 2008, in 2012 the number of high-growth and medium-growth enterprises measured in employment declined by a half, the most in construction (by 71%) and the least in industry (by 36%).

13BUSINESS STATISTICS – what are they and what do they comprise?BUSINESS STATISTICS KALEIDOSCOPE
Chart 10: Structure of high-growth and medium-growth enterprises measured in employment, Slovenia
Source: SURS
In 2012, among enterprises in non-financial business activities in Slovenia there were 4,959 (4%) inward foreign affiliates, most of them among trade enterprises (6%). Foreign affiliates employed 15% of persons working in observed activities and generated a quarter of total turnover. Foreign affiliates in trade generated almost a third of total trade turnover.
Foreign affiliates are larger than all-resident enterprises. In 2012, the former employed on average 18 persons and the latter 4 persons. Both all-resident enterprises and foreign affiliates are the largest in industry; an average foreign affiliate in industry at that time employed 61 persons.
In 2012, enterprises in non-financial business activities (including other activities – SKD 2008 section S) were integrated into 5,437 enterprise groups, which is 43% more than in 2008. In total, 10,771 enterprises were integrated into enterprise groups, most of them in other non-financial services.
Enterprises integrated into enterprise groups employed about half of all persons employed in 2012. In industry they generated 82% of total turnover and employed around 70% of all persons employed.
Chart 11: Average enterprise size by the number of per-sons employed and control, Slovenia, 2012
Source: SURS
Enterprises in non-financial business activities generated around 90% of total exports and imports1 in 2013. They generated the highest share of exports in industry (around two thirds) and the highest share of imports in trade (almost half).
In 2012, 70% of turnover in non-financial business activities was generated by enterprises integrated into enterprise groups.
1 Data on trade in goods with EU Member States take into account only enterprises whose trade in goods exceeded the Intrastat reporting threshold.


2 INDUSTRYThe mine in Idrija used to be the second largest quicksilver mine in the world.
In the 2008-2013 period 726 industrial buildings were built in Slovenia.
2 INDUSTRY
The water supply network in Sloveniawas 22,655 km long in 2013.
In 2013, 32,068 (4%) households in Slovenia changed their electricity supplier.
Photo: Filip Pesek, Sokol ARSO
Photo: Anja Jerin, Sokol ARSO
Photo: Štefka Krivec, Sokol ARSO
Photo: Živa Rant, Sokol ARSO

16 INDUSTRY BUSINESS STATISTICS KALEIDOSCOPE
Industry2 covers four SKD 2008 sections.
Figure 3: Industry
Industry
E Water supply, sewerage, waste
management and remediation
activities
D Electricity, gas, steam and air conditioning
supply
C Manufacturing
B Mining and quarrying
Source: SURS
In 2013, there were 20,177 industrial enterprises in Slovenia, 90% of them in manufacturing, almost 8% in electricity, gas, steam and air conditioning supply, 2% in water supply, sewerage, waste management and remediation services and 0.5% in mining and quarrying.
39% of total turnover in 2013 was generated by industrial enterprises.
As regards size (by the number of persons employed), the most numerous were micro enterprises, which together with small enterprises represented more than 95% of all enterprises in mining and quarrying, manufacturing and electricity, gas, steam and air conditioning supply. The exception was water supply, sewerage, waste management and remediation services where the share of medium-sized and large enterprises was slightly higher at about 15%.
2 The definition of industry slightly differs among individual statistical surveys.
Table 2: Principal indicators of the situation in industry, Slovenia, 2013
Indicator Unit Value
Enterprises1) number 20,177Persons employed1) number 209,664Turnover1) in 1,000 EUR 31,201,468Value of sales1) in 1,000 EUR 25,522,828Gross investment1) in 1,000 EUR 2,040,352Value added1) in 1,000 EUR 7,507,595
Enterprise births2) % 8.7Enterprise deaths1)2) % 17.0Enterprise survivals (five years)2) % 59.2High- and medium-growth enterpri-ses measured in employment2)
number 357
Enterprise groups2) number 1,050Enterprises integrated into enterprise groups2)
number 1,924
Persons employed in enterprises inte-grated into enterprise groups2)
number 147,554
Turnover of enterprises integrated into enterprise groups2)
in 1,000 EUR 26,229,811
Inward foreign affiliates2) number 689Persons employed in inward foreign affiliates2)
number 42,365
Turnover of inward foreign affiliates2) in 1,000 EUR 8,121,650
Labour productivity1)
EUR 35,808Average monthly net earnings EUR 975Labour costs per hour1) EUR 14,30Value added in GDP % 23.1Share of exports of goods % 69.8Share of imports of goods % 42.6
Job vacancy rate % 0.5
1) Provisional data.2) Data for 2012.
Source: SURS

17INDUSTRYBUSINESS STATISTICS KALEIDOSCOPE
In 2012, fewer than 10% of industrial enterprises were integrated into enterprise groups (1,924); 3.4% were under foreign control.
Chart 12: Trends in the value of selected situation indicators in industry, Slovenia, 20131)
1) Provisional data.
Source: SURS
Between 2005 and 2013 the number of enterprises in industry increased by 20%, the most in electricity, gas, steam and air conditioning supply, i.e. by almost five times. It also increased in manufacturing (by 12%) and in water supply, sewerage, waste management and remediation services (by 53%), while in mining and quarrying it decreased (by 5%).
Even though in the 2005-2013 period the number of industrial enterprises increased, the number of persons employed decreased, the most in mining and quarrying and in manufacturing (by 15%).
Table 3: Value of selected situation indicators in industry, Slovenia, 20131)
Enterprises Persons employed
Value of production Turnover Value
addedGross
investment
number 1,000 EUR
TOTAL 20,177 209,664 25,522,828 31,201,468 7,507,595 2,040,352
B 105 2,400 252,478 272,121 104,162 38,085
C 18,145 188,526 21,415,781 23,827,965 6,290,997 1,195,973
D 1,526 8,936 2,812,079 5,949,925 803,968 762,974
E 401 9,802 1,042,490 1,151,457 308,468 43,320
1) Provisional data.
Source: SURS
In 2013, the amount of funds for gross investment in tangible fixed assets in industry was on average 7% higher than in 2005; gross investment in electricity, gas, steam and air conditioning supply increased by more than three times (to EUR 763 million). In the other three industrial activities investment dropped significantly, the most in water supply, sewerage, waste management and remediation services (by 67%, to EUR 43 million).
According to the latest data for 2013, industry contributed around a quarter of value added to GDP, most of which (almost 20%) was contributed by manufacturing and the least (less than 0.5%) by mining and quarrying.
Persons employed and their earnings
Of the 209,664 persons employed in industrial enterprises in 2013, 90% or 188,526 were employed in manufacturing. An additional 5% were employed in water supply, sewerage, waste management and remediation services, 4% in electricity, gas, steam and air conditioning supply and 1% in mining and quarrying. The job vacancy rate was 0.5% and has not changed much since 2008 when it stood at 0.6%.
Most of the persons employed in the four industrial activities were men; in mining and quarrying their share was 87%.

18 INDUSTRY BUSINESS STATISTICS KALEIDOSCOPE
Chart 13: Structure of persons in employment in industry by gender, Slovenia, 2013
B Mining and quarryingC ManufacturingD Electricity, gas, steam and air conditioning supplyE Water supply, sewerage, waste management and remediation services
Source: SURS
Most of the persons employed in industry in 2013 had upper secondary education (64%).
Chart 14: Educational structure of persons in employment in industry, Slovenia, 2013
Source: SURS
Total amount of funds for earnings in industry in 2013 was close to EUR 4 billion or 6% less than in 2008 and 11% more than in 2005, which shows the impact of the economic and financial crisis on this activity. In the 2005-2013 period the funds for earnings increased the most in electricity, gas, steam and air conditioning supply (by 46%) and water supply, sewerage, waste management and remediation services (by 37%). These two activities also recorded the largest increase in turnover and in the number of enterprises.
In 2013, average monthly net earnings in industry amounted to EUR 975.
As regards industry, in 2013 the highest average monthly net earnings were paid in electricity, gas, steam and air conditioning supply (EUR 1,410), and the lowest in manufacturing. The difference between the two was EUR 461. Compared to 2005, earnings increased in all four activities, the most in manufacturing (by almost 50%) and the least in water supply, sewerage, waste management and remediation services (by 29%).
Table 4: Average monthly net earnings and inter-annual difference among them, Slovenia
2005 2013 2013/2005
EUR %
TOTAL 664 975 47
B 925 1.294 40
C 644 949 47
D 984 1.410 43
E 747 962 29
Source: SURS

19INDUSTRYBUSINESS STATISTICS KALEIDOSCOPE
Value added per person employed, which is the measure of labour productivity, in industry amounted to EUR 35,808 in 2013 and was just over EUR 5,500 higher than average labour productivity in Slovenia.
In 2013, the ratio between the highest labour productivity in industry, which was achieved in electricity, gas, steam and air conditioning supply, and the lowest labour productivity, which was achieved in water supply, sewerage, waste management and remediation services, was 3 : 1.
Chart 15: Labour productivity in industry, Slovenia1)
1) Provisional data.
Source: SURS
Did you know that in 2013 labour productivity
in industry was 37% higher than in 2005?
Situation in industry from a different point of view
In addition to basic structural business statistics indicators, the situation in industry is also well-reflected by four key indices: • Labour productivity index in industry (LPII) • Index of industrial production (IIP) • Nominal turnover index in industry (NTII)• Industrial producer price index (IPPI).
Chart 16: Trends in the value of selected indices, original data, Slovenia
Source: SURS
In the 2005-2013 period the trends in all four indices were quite similar; changes in economic and market conditions, particularly in the crisis year of 2009, reflected the most in industrial turnover, which dropped by 20%, and in industrial production (down by 17%), and the least in prices (1% decline).

20 INDUSTRY BUSINESS STATISTICS KALEIDOSCOPE
Value of sale of industrial products and services
Industrial enterprises in Slovenia sold about EUR 18.3 billion of industrial products and services in 2013, which is an increase of more than 10% over 2005.
Figure 4: Value of sale of industrial products and services, Slovenia
2009(min.)
2005 2007(max.)
2013
EUR 16.6
billion
EUR 20.6
billion
EUR 18.3
billion
EUR 16.4
billion
Source: SURS
In 2013, more than 10% of turnover from the sale of industrial products and services in manufacturing was achieved in the sale of electrical appliances, motor vehicles, trailers and semi-trailers, and basic metals.
The highest share of turnover in manufacturing on the domestic market was generated by the sale of food (20%) and fabricated metal products except machinery and equipment (10%), while on the foreign markets the highest share was generated by the sale of electrical equipment (13%), motor vehicles, trailers and semi-trailers (12%) and basic metals (11%).
As regards statistical regions, the sale of industrial products and services in 2013 was the most successful in Osrednjeslovenska, which generated almost 19% of total turnover from the sale industrial products and services in the country, followed by Jugovzhodna Slovenija (16%), Savinjska (15%) and Podravska (just over 14%).
Chart 17: Value of sale of industrial products and services, Slovenia, 2013
Source: SURS

21INDUSTRYBUSINESS STATISTICS KALEIDOSCOPE
International trade
Of all non-financial business activities, manufacturing depends the most on trade in goods with other countries to which it contributes the most. In 2013 its share in exports was 66% and in imports 39%.
In 2013, manufacturing enterprises exported more than EUR 14 billion and imported EUR 8.3 billion of goods. That the economic crisis reflected strongly in trade in goods is shown by the comparison with 2008; in 2013 the value of exports was 4% lower and the value of imports 7% lower. On the other hand, in the 2008-2013 period manufacturing had a positive trade balance despite the economic crisis; on average by EUR 5.6 billion per year.
In 2013, manufacturing enterprises generated a quarter of their exports with Germany (almost EUR 3.5 billion) and a further 28% with Italy, Austria, France and Russia. The situation is similar as regards imports; Germany, Italy, Austria and France were also our most important import partners, Croatia was the fifth.
Chart 18: Slovenia’s most important partner countries in trade in goods in manufacturing
Source: SURS
Did you know a quarter of imports and exports in
manufacturing in 2013 were generated with Germany?
As regards the other three industrial activities, international trade in goods does not play such an important role. In 2013, enterprises registered in electricity, gas, steam and air conditioning supply imported goods worth EUR 702 million and exported goods worth EUR 515 million.
In mining and quarrying and in water supply, sewerage, waste management and remediation services the values of international trade in goods were below 1% in both commodity flows.
It is interesting that – contrary to the general economic activity – in 2009 enterprises registered in Slovenia in mining and quarrying, in electricity, gas, steam and air conditioning supply and in water supply, sewerage, waste management and remediation services recorded a significant increase in the value of both exports (by 61%) and imports (by 59%) over 2008. The trend of significant growth in exports continued up to 2011 and that in imports up to 2012.
The most important trade partner countries of enterprises registered in the mentioned three activities were Italy, Croatia, Germany and Austria. In the 2008-2013 period these enterprises generated with the mentioned countries on average 84% of total exports and 52% of total imports.
EUR 14.8 billion or 70% of imports were generated by industrial enterprises in 2013.

22 INDUSTRY BUSINESS STATISTICS KALEIDOSCOPE
Sale of industrial products and services in the EU
Around EUR 4,831 billion of industrial products and services were sold in the EU in 2013. Most of the different products were produced in Germany (3,538), followed by Italy, France, Spain and the United Kingdom. With 1,756 different products produced in 2013, Slovenia was 18th in the EU.
1,756 different products were produced in Slovenia in 2013.
The top ten products sold in EU Member States generated just over 12% of total turnover from the sale of industrial products and services. Three of these products were passenger cars. Other products included medicaments, cartons, boxes and cases, of corrugated paper or paperboard, other parts and accessories n.e.c. for motor vehicles, other parts of aircraft and spacecraft, fresh bread and pastry, and beer made from malt.
Analysis of data for the Slovenian market shows that the most sold products in Slovenia are from these activities: manufacture of basic pharmaceutical products and pharmaceutical preparations, manufacture of motor vehicles, trailers and semi-trailers, manufacture of electrical equipment, and manufacture of basic metals.
Did you know that the sale of industrial products
and services from Slovenia represents only 0.4% of total sale in the EU?
A comparison of data for 2013 with data for 2005 shows considerable differences in the trends in turnover from the sale of industrial products and services among EU Member States. In Romania, Poland and Lithuania turnover increased by more than 80%, while in Cyprus and Spain it dropped by 14% and 9%, respectively.
Chart 19: Changes in the value of turnover from the sale of industrial products and services, 20131)
1) No data for the Netherlands.
Source: Eurostat (http://ec.europa.eu/eurostat, 5. 12. 2014)

23INDUSTRYBUSINESS STATISTICS KALEIDOSCOPE
What are the future prospects?
The value of the manufacturing confidence indicator was gradually rising during 2014; in December it exceeded the long-term average by 6 p.p., but it was still far from the highest value achieved in June 2006, which was 17 p.p.
Chart 20: Industrial production and the manufacturing confidence indicator, Slovenia
Source: SURS
It is encouraging that 93% of manufacturing enterprises invested in 2014, on average 7 p.p. more than in 2013. In 2015, 92% of enterprises are expected to invest.
Investment in 2014 was positively influenced by technical factors, the demand and the availability of financial resources and expected profits; only other factors (tax policy, possibility of moving production abroad) had a negative impact. In 2015, too, the same factors are expected to have positive and negative impacts on investment as in 2014.
Between January and October 2014 the value of industrial production was 1.7% higher than in the same period of 2013. In 2014, the positive trend continued, particularly in manufacturing, and the trend rose again in electricity, gas, steam and air conditioning supply.
Chart 21: Industrial production, Slovenia
B Mining and quarryingC ManufacturingD Electricity, gas, steam and air conditioning supply
Source: SURS
Did you know that the manufacturing,
retail trade, construction and services confidence indicators and the consumer confidence
indicator together comprise the sentiment indicator?


3 CONSTRUCTION
3 CONSTRUCTION
When it was built, the Nebotičnik in
Ljubljana was the tallest building in Slovenia and
9th tallest building in Europe.
Households in Slovenia spend
on average EUR 164 per year on the
insurance of their the dwelling.
The Aljaž Tower on the
summit of Mount Triglav is the highest
building in Slovenia.
An average dwelling in Slovenia measures 81 m2. On
average the largest are dwellings in the Pomurska
and the smallest in the Zasavska statistical
region.
Photo: Carmen Neumeier
Photo: Vladimir Tkalčić
Photo: Darja Šter
Photo: Domen Groegl, STA

26 CONSTRUCTION BUSINESS STATISTICS KALEIDOSCOPE
Construction covers only one SKD 2008 section, i.e. F, which is divided into three divisions.
Figure 5: Construction
Construction
F43 Specialised
construction activities
F42 Civil
engineering
F41 Construction of
buildings
Source: SURS
There were 18,065 active market enterprises in construction in Slovenia in 2013, which is 2% fewer than a year before, 7% fewer than in 2008 when construction was at its peak and a fifth more than in 2005. In 2013, a large majority of construction enterprises was engaged in specialised construction activities (80%), followed by those enagaged in construction of buildings (17%) and civil engineering (3%).
Construction enterprises represented 14% of all active market enterprises in Slovenia in 2013. The share of construction enterprises was the highest in 2008 (18%), but after the onset of the economic crisis it started to gradually decline.
6% of total turnover in 2013 was generated by construction enterprises.
In 2013, most of the construction enterprises were micro enterprises (95%). They employed 55% of persons employed and generated 39% of total turnover. There were only 10 large construction enterprises in 2013.
Table 5: Principal indicators of the situation in construction, Slovenia, 2013
Indicator Unit Value
Enterprises1) number 18,065Persons employed1) number 60,800Turnover1) in 1,000 EUR 4,429,951Value of sales1) in 1,000 EUR 4,193,578Gross investment1) in 1,000 EUR 129,969Value added1) in 1,000 EUR 1,151,462
Enterprise births2) % 9.2Enterprise deaths1)2) % 12.3Enterprise survivals (five years)2) % 46.0High- and medium-growth enterpri-ses measured in employment2)
number 156
Enterprise groups2) number 587Enterprises integrated into enterprise groups2)
number 1,162
Persons employed in enterprises inte-grated into enterprise groups2)
number 15,237
Turnover of enterprises integrated into enterprise groups2)
in 1,000 EUR 2,193,947
Inward foreign affiliates2) number 826Persons employed in inward foreign affiliates2)
number 3,695
Turnover of inward foreign affiliates2) in 1,000 EUR 342,223
Labour productivity1)
EUR 18,939Average monthly net earnings EUR 805Labour costs per hour1) EUR 10,62Value added in GDP % 4.6Share of exports of goods % 0.3Share of imports of goods % 0.7
Job vacancy rate % 2.1
1) Provisional data.2) Data for 2012.
Source: SURS

27CONSTRUCTIONBUSINESS STATISTICS KALEIDOSCOPE
Table 6: Value of selected situation indicators in construction, Slovenia, 20131)
Enterprises Persons employed
Value of production Turnover Value
addedGross
investment
number 1,000 EUR
TOTAL 18,065 60,800 4,193,578 4,429,951 1,151,462 129,969
F41 2,979 14,559 1,213,138 1,285,528 226,346 32,309
F42 565 7,926 966,702 999,857 242,342 32,981
F43 14,521 38,315 2,013,737 2,144,566 682,774 64,680
1) Provisional data.
Source: SURS
In 2013, construction enterprises generated EUR 4.4 billion of turnover and almost EUR 130 million of gross investment, while the value of production was around EUR 4.2 billion. Among all observed sections of activities, the values of these indicators were by far the lowest in construction.
Did you know that the number of large construction enterprises in Slovenia has dropped by
more than half since 2008?
Almost half of total turnover in 2013 was generated by enterprises engaged in specialised construction activities, which also represented the largest number of construction enterprises (14,521 or almost 80%). In 2013, turnover in construction was the lowest ever3, about half of turnover in 2008.
Construction enterprises generated just over EUR 1.2 billion of value added in 2013. Almost 60% of value added was generated by enterprises engaged in specialised construction activities and the rest in about the same shares by enterprises engaged in construction of buildings and enterprises engaged in civil engineering.
3 Since 2005, i.e. the year since when data according to SKD 2008 are available.
Chart 22: Trends in the value of selected situation indicators in construction, Slovenia, 20131)
1) Provisional data.
Source: SURS
In 2013, the values of almost all observed indicators were lower than in 2005. Only the number of construction enterprises was higher. In the 2005-2013 period it went up by 27%, mostly that of enterprises engaged in specialised construction activities (by almost a third). Of all observed activities, the value of gross investment dropped most significantly (by 80%).
Persons employed in construction
In 2013, 60,800 persons were employed in construction enterprises, a third fewer than in 2008. Between 2005 and 2008 employment in construction grew at an above average rate; therefore, the fall during the crisis was that much worse. Compared to 2008, employment declined in all construction enterprises, the most in enterprises engaged in construction of buildings (by 52%).

28 CONSTRUCTION BUSINESS STATISTICS KALEIDOSCOPE
The data on job vacancies in construction show a more optimistic picture. In the third quarter of 2014 the largest demand for labour force was recorded in construction. Almost 900 job vacancies were advertised, which is 20% of all job vacancies in the country. The job vacancy rate in construction was 1.9%.
29,000 personsin constuction lost their jobs in the past five years.
Labour productivity in construction was almost EUR 19,000 per person in 2013, which is 8% more than in 2005 and a fifth less than in 2008. The highest labour productivity in 2013 was recorded in enterprises engaged in civil engineering, almost twice as high as in enterprises engaged in construction of buildings and 72% higher than in enterprises engaged in specialised construction activities.
Chart 23: Labour productivity in construction, Slovenia
1) Provisional data.
Source: SURS
Earnings in construction
The total amount of funds for earnings in construction in 2013 was EUR 711 million or 36% lower than in 2008 and about as high as in 2005. Compared to 2005, funds for earnings increased only in enterprises engaged in specialised construction activities (by 43%). In enterprises engaged in construction of buildings and in those engaged in civil engineering funds for earnings decreased by 19% and 35%, respectively.
Did you know that in 2013 average monthly net
earnings in construction were EUR 190 lower than average monthly
net earnings in Slovenia?
Average monthly net earnings in construction in 2013 were EUR 805. It has to be taken into account that the educational level of persons employed in construction was on average lower than the average educational level of all persons employed in Slovenia.
Chart 24: Educational structure of persons in employment in construction, Slovenia, 2013
Source: SURS

29CONSTRUCTIONBUSINESS STATISTICS KALEIDOSCOPE
Individual divisions did not differ much in terms of the educational structure of employees: in all three divisions most employees had upper secondary education (65% in division F41, 66% in division F42 and 73% in division F43). Most employees with tertiary education worked in enterprises engaged in civil engineering (14%). Employees in construction are mostly men; in 2013 their share was 90%. However, their educational level was on average lower than that of women working in construction.
Construction and value added
Of the four observed business activities, construction generates the lowest share of total value added in Slovenia. Before the boom its share in GDP was 5.7%, in 2008 it reached the peak of 7.3%, then it started to decline and in 2013 it was at the lowest value since 1995, i.e. 4.6%. In the EU overall the share of construction in GDP was 5.8% in 2008 and 4.9% in 2013.
Chart 25: Value added of construction in GDP
Source: SURS, Eurostat (http://ec.europa.eu/eurostat, 5.12. 2014)
The financial and economic crisis had a strong negative impact on construction; between 2008 and 2013 value added of this activity dropped by more than 40% (in other activities by up to 11%). The data for 2014 show that the situation is gradually improving; in the third quarter of 2014 value added in construction increased for the fourth consecutive quarter (by 10%). The improvement was mostly the result of civil engineering, which is linked to intensive construction of public utility infrastructure co-financed by EU funds.
Chart 26: Value added growth rate, Slovenia
Source: SURS

30 CONSTRUCTION BUSINESS STATISTICS KALEIDOSCOPE
Construction and globalisation
Of all observed activities construction was the least involved in trade in goods with other countries. In 2013, construction enterprises exported EUR 59.7 million and imported EUR 142.0 million of goods. The value of exports was 14% lower than in 2012 and 20% lower than in 2008. The value of imports was 15% lower than in 2012 and 44% lower than in 2008.
Chart 27: The most important Slovenia’s partner countries in trade in goods in construction, 2013
Source: SURS
In recent years construction enterprises exported the most to Germany, Austria and Italy; exports to these countries represented 42% of total exports in construction (EUR 8.6 million, EUR 6.0 million and EUR 10.4 million, respectively). Imports from these three countries were also the highest, representing 65% of total imports in construction. Austria was first with EUR 32.1 million, followed by Italy with EUR 30.8 million and Germany with EUR 28.7 million. In 2013, construction enterprises mostly exported prefabricated buildings, sanitary, plumbing, heating and lighting fixtures and fitting, and imported general industrial machinery and equipment.
In 2012, 17% of foreign enterprisesin Slovenia were engaged in construction.
There were 587 construction enterprise groups in Slovenia in 2012, which is 8% of all enterprise groups. Most of the enterprise groups were all-resident enterprise groups (78% or 456). The number of construction enterprise groups was almost double the number in 2008 (309). In 2012, almost 12,000 enterprises were integrated into enterprise groups, of which a tenth were registered in construction. These enterprises generated almost 4% of total turnover of all enterprises in Slovenia and employed more than 15,200 persons.
Table 7: Number of enterprise groups in construction, Slovenia
2008 2009 2010 2011 2012
TOTAL 309 346 456 557 587
all-resident enterprise groups
199 241 329 429 456
multinational enterprise groups
110 105 127 128 131
Source: SURS
There were 826 foreign construction enterprises in Slovenia in 2012. Most of the foreign active enterprises were from countries outside the EU, mostly from the area of former Yugoslavia. Even though foreign construction enterprises were second in number among all foreign enterprises, they were less important in terms of business results; in 2012 they generated only 2.2% of value added of all foreign enterprises.

31CONSTRUCTIONBUSINESS STATISTICS KALEIDOSCOPE
Trends in the value of construction put in place
In 2013, Slovenian construction enterprises put in place around EUR 1,681 million of construction work, which is 60% less than in 2008, when construction activity in Slovenia was at its peak. Construction put in place on buildings was three quarters lower and on civil engineering more than half lower than in 2008. Compared to 2012, construction put in place was 3% lower.
The shares of the value of construction put in place by type of structure have recently changed significantly. In 2005 construction of buildings accounted for 54% of total construction put in place. Later on the share of civil engineering was rising and in 2013 accounted for 64% of total construction put in place (construction of buildings accounted for the remaining 36%).
64% of the value of construction put in place in 2013 was generated by civil engineering.
The economic crisis affected construction in the entire EU, but the impact was not as large as in Slovenia. Compared to 2008, the value of construction put in place in 2013 was 19% lower in the EU overall. In Slovenia it dropped by 60%. The largest decline in the value of construction put in place was recorded in Greece (79%), followed by Slovenia and Ireland. In 2008, these three countries were among the countries with the highest indices of construction put in place.
Did you know that in 2013 the value of construction put in place
in Slovenia was a third lower than the EU average?
Chart 28: Changes in the value of construction put in place, 2013
Source: Eurostat (http://ec.europa.eu/eurostat, 5.12. 2014)

32 CONSTRUCTION BUSINESS STATISTICS KALEIDOSCOPE
What are the prospects of construction activity in Slovenia?
Between January and October 2014 the value of construction put in place in Slovenia was a quarter higher than in the same period of 2013. The main reasons for the increase were vast clean-up operations after the ice storm and accelerated construction of civil engineering as a result of increased investment in public infrastructure with the help of European funds. The value of construction put in place on civil engineering increased by 34% and the value of construction put in place on buildings by only 5%. In the EU the value of construction put in place grew much less, by only 4%.
The prospects for construction in Slovenia are uncertain, since in October 2014 the value of new contracts was more than a third lower than in October 2013. The value of new contracts for construction of buildings was 13% lower and that for civil engineering 48% lower.
Chart 29: Value of new contracts, Slovenia
Source: SURS
A similar situation is indicated by the value of stocks of contracts, i.e. values of all as yet unfulfilled contracts. In the second half of 2013 their value increased, but in 2014 it again started to slowly decline.
Another important indicator of construction prospects is the number of building permits issued. In 2013 it went up at the annual level for the first time after 2007. However, 2,302 building permits issued in 2013 is still 41% fewer than in 2007. The number of building permits for residential buildings (1,931) declined the most, by 43% compared to 2007. In all these years most of the building permits for residential buildings were issued to natural persons; their share is rising (in 2007 it was 77% and in 2013 88%).
Chart 30: Number of buildings for which building permits were issued, Slovenia
Source: SURS

33CONSTRUCTIONBUSINESS STATISTICS KALEIDOSCOPE
The latest data for 2014 indicate that the number of building permits will again be lower than in the previous year: between January and November 2014 8% fewer building permits were issued than in the same period of 2013.
In the third quarter of 2014 dwelling prices were on average 1% lower than in the second quarter of 2014. Both newly built and existing dwellings were cheaper. The prices of newly built dwellings reached the lowest level measured. The number of transactions was also the lowest since 2007 when we started to statistically monitor them.
92% of all real estate transactions were transactions of existing dwellings.
The number of transactions of all existing dwellings (flats and family houses) increased in the second and third quarters of 2014, which indicates that at least this part of the real estate market is experiencing a revival.
Did you know that most flats in Slovenia were built
between 1971 and 1980?
Useful information about expected activity in construction is provided by the construction confidence indicator. It shows growing confidence in construction in Slovenia, since in the 12 months of 2014 the average value of this indicator was
11 p.p. higher than in the same period of 2013. Despite the mentioned rise, in all months of 2014 the construction confidence indicator was the lowest in all observed activities. In December 2014, the construction confidence indicator was 6 p.p. higher than the long-term average.
Chart 31: Construction confidence indicator
Sources: SURS, Eurostat (http://ec.europa.eu/eurostat, 5.12. 2014)
The values of expectation indicators in construction are also gradually rising, but they are still lower than the long-term average. Enterprises have work assured for about the next 4 months; at the peak of construction activity they had work assured for more than 5 months.
The main factors limiting the improvement of the position of construction enterprises are insufficient demand and labour costs, as stated by 37% and 35% of the enterprises, respectively.


4 TRADEThe first self-service store in Slovenia
was opened in Ljutomer in 1958.
4 TRADE
Shopping carts appeared in 1936; they have been mass produced since 1947.
In Europe, bar (EAN) codes appeared in 1977.
In 2013, 3,076 enterprises registered in trade (G) were selling their products online.
Photo: DreamCode Studio
Photo: Kristina Alexanderson
Photo: Dragiša Modrinjak
Photo: Ed Sweeney

36 TRADE BUSINESS STATISTICS KALEIDOSCOPE
Trade also covers only one SKD 2008 section, i.e. G, which is divided into three divisions.
Figure 6: Trade
G45 Wholesale and retail trade and repair of motor vehicles and
motorcycles
Trade G47 Retail trade, except of motor vechicles and motorcycles
G46 Wholesale trade, except of motor
vehicles and motorcycles
Source: SURS
In 2013, 25,703 enterprises in Slovenia were registered in trade, which is 20% of all active market enterprises in the country. Compared to 2005, the number of enterprises increased by 4,861, but the share of trade enterprises in the total number of active enterprises decreased by 3 p.p.
36% of total turnover in 2013 was generated by trade enterprises.
Most of the active trade enterprises in 2012 were micro enterprises, i.e. 23,885 or 95% of all trade enterprises; they employed 41,791 persons or 37% of all persons employed by trade enterprises. The remaining 63% of persons were employed by small, medium-sized and large trade enterprises; almost a third of them (28%) were employed by large trade enterprises.
In the 2005-2012 period the number of enterprises increased mostly on account of the growth of micro enterprises employing 1 person; their number increased by 4,580.
Table 8: Principal indicators of the situation in trade, Slovenia, 2013
Indicator Unit Value
Enterprises1) number 25,703Persons employed1) number 112,135Turnover1) in 1,000 EUR 28,472,900Value of sales1) in 1,000 EUR 6,932,598Gross investment1) in 1,000 EUR 364,569Value added1) in 1,000 EUR 3,215,466
Enterprise births2) % 9.8Enterprise deaths1)2) % 7.6Enterprise survivals (five years)2) % 51.6High- and medium-growth enter-prises measured in employment2)
number 210
Enterprise groups2) number 1,504Enterprises integrated into enter-prise groups2)
number 2,628
Persons employed in enterprises integrated into enterprise groups2)
number 57,936
Turnover of enterprises integrated into enterprise groups2)
in 1,000 EUR 20,397,260
Inward foreign affiliates2) number 1,640Persons employed in inward for-eign affiliates2)
number 22,408
Turnover of inward foreign affili-ates2)
in 1,000 EUR 9,290,337
Labour productivity1) EUR 35,661Average monthly net earnings EUR 904Labour costs per hour1) EUR 13,16Value added in GDP % 10.3Share of exports of goods % 16.9Share of imports of goods % 44.0Job vacancy rate % 0.6
1) Provisional data.2) Data for 2012.
Source: SURS

37TRADEBUSINESS STATISTICS KALEIDOSCOPE
In 2013, the number of trade enterprises was 23% higher than in 2005; it increased the most in wholesale and retail trade and repair of motor vehicles and motorcycles (by 27%). Most of the enterprises were registered in wholesale trade, except of motor vehicles and motorcycles, i.e. 13,661.
Chart 32: Trade enterprises by size by the number of per-sons employed, Slovenia
Source: SURS
In 2013, all trade enterprises together generated 32% more turnover than in 2005; the increase was the largest in retail trade, except of motor vehicles and motorcycles, by 42%. Compared to 2005, the gross margin on goods for resale in 2012 was 24% higher; here too the increase was the largest in retail trade, except of motor vehicles and motorcycles, by 36%.
In 2012, 2,628 or 10% of trade enterprises were integrated into enterprise groups. These enterprises generated more than two thirds of total turnover. Among inward foreign affiliates the share of trade enterprises was 33%.
Table 9: Value of selected situation indicators in trade, 20131)
Enterprises Persons employed Turnover
Gross margin on goods for
resale2)
number 1,000 EUR
TOTAL 25,703 112,135 28,472,900 4,379,604
G45 4,300 14,276 3,800,144 365,623
G46 13,661 44,168 12,680,307 1,920,692
G47 7,742 53,691 11,992,449 2,093,288Source: SURS
Chart 33: Trends in the value of selected situation indica-tors in trade, Slovenia, 20131)
Source: SURS
1) Provisional data.2) Data for 2012.

38 TRADE BUSINESS STATISTICS KALEIDOSCOPE
Persons employed
In 2013, trade enterprises employed 112,135 persons. Between 2005 and 2013 the number grew by 5% or 5,701.
The structure of persons employed in trade by gender did not change much over the past nine years. In the 2005-2013 period the share of women employed in trade was on average 4 p.p. higher than the share of men, i.e. 52% vs. 48%.
Women employed in trade are on average better educated than men: 24% of women and 19% of men working in trade had tertiary education in 2013.
Did you know that trade employs more women and
that they are on average better educated than men but have on average
lower earnings?
Role of trade in international trade in goods
In Slovenia’s trade, imports play a much more important role than exports; in 2013, the share of imports was 44% and that of exports only 17%.
In the 2008-2013 period the share of imports in trade declined by 4 p.p., but it was still the highest among all observed activities. On the other hand, in the same period the share of exports increased by 3 p.p.
All trade enterprises in the country together exported EUR 3.6 billion of goods in 2013, which is 11% more than in 2012 and 31% more than in 2008.
Chart 34: Structure of exports and imports in trade, Slovenia
Source: SURS
As regards the value, Slovenia exported most to Croatia (16% or EUR 565 million), followed by Italy (15%), Austria (13%), Germany (10%) and Serbia (7%).
Chart 35: Top five Slovenia’s trading partner countries by value of exports in trade, 2013
Source: SURS

39TRADEBUSINESS STATISTICS KALEIDOSCOPE
In 2013, trade enterprises imported EUR 9.5 billion of goods, which is 5% less than in 2012 and 13% less than in 2008. Most of the imports came from Germany and Italy (32%), followed by Austria (14%), Hungary (7%) and Croatia (4% or EUR 412 million).
Chart 36: Top five Slovenia’s partner countries by value of imports in trade, 2013
Source: SURS
Chart 37: Goods with the highest export value by SITC4, trade, 2013
Source: SURS
As regards value, petroleum products were the most important exports and imports in 2013. Exports of petroleum products represented almost a quarter of total exports, while imports of petroleum products represented 20% of total imports or EUR 1,866 million.
Slovenia’s surplus in trade in 2013 was EUR 5.9 billion.
As regards value, in 2013 other important goods in Slovenia’s international trade were road vehicles; exports amounted to EUR 395 million and imports to EUR 1,243 million.
Chart 38: Goods with the highest import value by SITC4, trade, 2013
4 SITC - Standard International Trade Classification.

40 TRADE BUSINESS STATISTICS KALEIDOSCOPE
GDP and trade
In the past five years the share of trade in GDP was between 10% (in 2012 and 2013) and 11% (in 2008). In all these years trade was thus the second most important economic activity behind manufacturing.
Chart 39: GDP and contribution of trade to GDP growth, Slovenia
1) Contribution of trade in 2013: 0 p.p.
Source: SURS
Trade did not contribute to annual GDP growth in 2013. Its contribution was the highest in 2008, 0.5 of a p.p., mostly on account of retail trade, except of motor vehicles and motorcycles, and the lowest in 2009 when it was –0.9 of a p.p.
10% of value added was contributed by trade to GDP in 2013.
Retail trade
Retail trade is purchase of goods for further sale to final users for personal and household use. In 2008-2013, nominal retail trade turnover declined by 8% and real turnover by 16%.
Chart 40: Turnover in retail trade, Slovenia
Source: SURS
Did you know that in 2013 nominal turnover in retail trade was 8% lower than in 2008 and
that in this period prices grew by more than 9%?
As regards commodity groups, compared to 2008, in 2013 nominal retail trade turnover went up in fuels (by 6%) and food, beverages and tobacco (by 1%) and went down in non-food products (by 17%) and motor vehicles (by 13%).

41TRADEBUSINESS STATISTICS KALEIDOSCOPE
Real retail trade turnover declined in all four commodity groups, the most in non-food products (by 25%) and fuels (by 18%). Nominal turnover was higher than the real one in all commodity groups, except in motor vehicles, where it was the opposite, since retail prices of motor vehicles decreased.
Chart 41: Retail trade turnover by commodity groups, Slovenia
Source: SURS
In the 2008-2013 period nominal turnover in commodity group food, beverages and tobacco increased in subgroups tobacco (by 6%) and food (by 1%) and decreased in the subgroup beverages (by 3%). Despite nominal increase in two subgroups, real turnover decreased in all three subgroups, the most in tobacco (by 27%), followed by beverages (by 20%) and food (by 12%).
Did you know that in 2013 real turnover from the sale of wine was 28% lower than in 2008?
Chart 42: Retail trade turnover in commodity group food, beverages and tobacco, Slovenia
Source: SURS
As expected, in the five-year period under review the retail trade confidence indicator was also falling; compared to 2008 its average value in 2013 was 20 p.p. lower. The lowest value was recorded in 2009, when it was 34 p.p. lower than a year before. In 2014, the average annual value of the mentioned indicator grew, but it was still 13 p.p. lower than in 2008.

42 TRADE BUSINESS STATISTICS KALEIDOSCOPE
In recent years the highest share of retail trade turnover (over 40%) was generated in the sale of non-food products, followed by the sale of food, beverages and tobacco.
Chart 43: Structure of retail trade turnover by commodity groups, Slovenia
Source: SURS
From 2008 on the structure of retail trade turnover by type of buyer did not change much. The share of turnover generated by the sale to final consumers slightly decreased (by 4 p.p. in the 2008-2013 period), but still represented around 80% of total retail trade turnover.
Chart 44: Structure of retail trade turnover by type of buyer, Slovenia, 2013
Source: SURS
Retail trade in Slovenia and abroad
In the EU real turnover of enterprises registered in retail trade declined on average by around 4% between 2008 and 2013.
Chart 45: Trends in retail trade turnover1), 2013
1) Seasonally and working day adjusted.
Source: Eurostat (http://ec.europa.eu/eurostat, 5.12. 2014)

43TRADEBUSINESS STATISTICS KALEIDOSCOPE
As in most countries, between 2008 and 2013 turnover in Slovenia declined, i.e. by 14%, which is 10 p.p. more than the EU overall. The greatest drop in the EU happened in Greece (by 40%), followed by Spain (by 24%) and Cyprus (by 22%). However, in some countries real turnover increased, the most in Luxembourg (by 72%).
Wholesale
Wholesale is purchase of goods for further sale to merchants, entrepreneurs, legal persons and others that purchase goods for performing their professional or profit-making activity.
From 2008 on wholesale turnover (in nominal terms) was declining; in the 2008-2013 period it declined by more than 26%. The greatest fall (at the annual level) over the previous year was recorded in 2009, by almost 26%.
Chart 46: Nominal wholesale turnover, Slovenia
Source: SURS
Did you know that wholesale generates 2% of its
turnover with the sale to final consumers on the domestic market?
In 2013, the highest share of wholesale turnover was generated by the sale of non-food products (55%), and the lowest by the sale of motor vehicles (13%). The structure of turnover by commodity groups has not changed much since 2008.
Table 10: Structure of wholesale turnover on the domestic market by commodity groups, Slovenia
2008 2013
%
TOTAL1) 100,0 100,0
Food, beverages and tobacco 15,6 17,6
Non-food products 58,1 55,4
Solid, liquid and gaseous fuels 13,8 14,2
Motor vehicles 12,6 12,7
1) Because of rounding, the totals do not always add up.
Source: SURS
Commission trade
Commission trade is the activity of commercial agents and wholesale traders trading on their own behalf and on third party account or activity of those who act as agents between sellers and buyers and take over trade business on behalf of the owner of goods. The agents’ sales income is the commission.
Commission trade represents a low share of trade activity, but in 2013 turnover from commission trade was 49% higher than in 2008. More than two thirds of turnover were generated by agents on the domestic market.

5 OTHER NON-FINANCIAL SERVICE
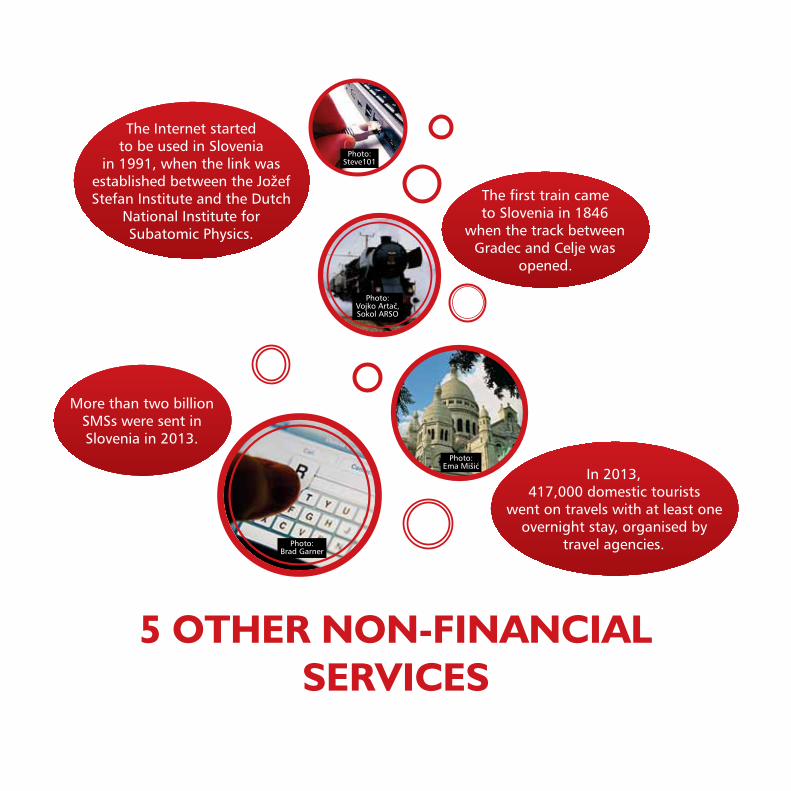
5 OTHER NON-FINANCIAL SERVICES
The Internet started to be used in Slovenia
in 1991, when the link was established between the Jožef Stefan Institute and the Dutch
National Institute for Subatomic Physics.
The first train came to Slovenia in 1846
when the track between Gradec and Celje was
opened.
More than two billion SMSs were sent in Slovenia in 2013.
In 2013, 417,000 domestic tourists
went on travels with at least one overnight stay, organised by
travel agencies. Photo: Brad Garner
Photo: Ema Mišić
Photo: Steve101
Photo: Vojko Artač, Sokol ARSO

46 OTHER NON-FINANCIAL SERVICES BUSINESS STATISTICS KALEIDOSCOPE
Services cover various non-financial and financial services classified into the following SKD 2008 sections (trade – section G – is also a service, but it is presented separately):
• Transportation and storage (H)
• Accommodation and food service activities (I)
• Information and communication (J)
• Financial and insurance activities (K)
• Real estate activities (L)
• Professional, scientific and technical activities (M)
• Administrative and support service activities (N)
• Repair of computers and personal and household goods
(S95).
Other non-financial services are all activities mentioned above, except financial and insurance activities (K). In 2013, there were 2,215 enterprises in financial and insurance activities, which is 1% of all enterprises in the country. They employed 23,143 persons. Further on indicators for other non-financial services are presented.
In other non-financial services 62,809 active market enterprises were recorded in 2013. They employed 189,953 persons, and generated EUR 15,089 million of turnover and EUR 927 million of gross investment in tangible fixed assets.
33% of persons worked in other non-financial services.
As regards the size of enterprises by the number of persons employed, in 2013 most of them were micro enterprises (96%). They generated 38% of total turnover and employed almost half of persons employed.
Other non-financial services (mostly enterprises engaged in real estate activities) contributed 25% of value added to GDP in 2013.
Table 11: Principal indicators of the situation in other non-financial services, Slovenia, 2013
Indicator Unit Value
Enterprises1) number 62,809Persons employed1) number 189,953Turnover1) in 1,000 EUR 15,088,612Value of sales1) in 1,000 EUR 13,365,515Gross investment1) in 1,000 EUR 926,863Value added1) in 1,000 EUR 5,475,347
Enterprise births2) % 11.0Enterprise deaths1)2) % 8.1Enterprise survivals (five years)2) % 56.0High- and medium-growth en-terprises measured in employ-ment2)
number 457
Enterprise groups2)3) number 2,296Enterprises integrated into enterprise groups2)3)
number 5,058
Persons employed in enter-prises integrated into enterprise groups 2)3)
number 75,366
Turnover of enterprises inte-grated into enterprise groups2)3)
in 1,000 EUR 7,863,066
Inward foreign affiliates2) number 1,804 Persons employed in inward foreign affiliates2)
number 18,810
Turnover of inward foreign af-filiates2)
in 1,000 EUR 2,461,172
Labour productivity1) EUR 28,825Average monthly net earnings EUR 925Labour costs per hour1)3) EUR 13,6Value added in GDP % 25.2Share of exports of goods % 3.0Share of imports of goods % 2.8Job vacancy rate3) % 0.9
1) Provisional data.2) Data for 2012.3) The entire section S is covered.
Source: SURS

47OTHER NON-FINANCIAL SERVICESBUSINESS STATISTICS KALEIDOSCOPE
In 2012, 5,058 enterprises were integrated into enterprise groups, i.e. around 8% of enterprises in other non-financial services (including other activities in SKD 2008 section S). These enterprises generated about a half of turnover in these activities.
Other non-financial services represented almost the same share of enterprises in non-financial business activities in Slovenia in 2012 as in the EU overall. However, in the EU these enterprises generated on average a higher share of turnover and value added than in Slovenia (40% vs 32%). They also employed a higher share of persons employed.
Most of the enterprises in the observed activities were engaged in professional, scientific and technical activities (over 27,000 or 44% of enterprises in other non-financial services). These enterprises employed the highest share of persons (29%), but they did not generate the highest values as regards other indicators. The highest values of production, turnover, value added and gross investment were generated by enterprises registered in transportation and storage (45% of gross investment in other non-financial services).
Did you know that over the past eight years other non-financial services have
become increasingly important?
In eight years other non-financial services gained importance among non-financial business activities, the most as regards employment and generating value added. In 2005, these activities employed 27% of persons employed and in 2013 a third, i.e. almost 190,000 persons. The increase regarding value added was almost the same.
In 2013, the number of enterprises performing other non-financial services was two thirds higher than in 2005. In the same comparison these enterprises employed 20% more persons and generated 41% more turnover and 42% more value added. However, they invested 35% less (gross).
Table 12: Selected indicators of the situation in other non-financial services, Slovenia, 20131)
Enter-prises
Persons employed
Value of production Turnover Value
addedGross
investment
number 1,000 EUR
TOTAL 62,809 189,953 13,365,515 15,088,612 5,475,347 926,863
H 8,432 43,418 4,450,495 4,725,903 1,646,944 420,817
I 10,217 33,672 1,386,154 1,531,545 555,378 85,300
J 7,219 23,955 2,607,675 2,971,627 1,124,357 163,045
L 2,427 4,855 471,654 550,437 249,586 45,869
M 27,452 55,066 3,289,038 4,029,559 1,428,112 172,369
N 5,964 27,339 1,101,423 1,195,443 450,352 38,353
S95 1,098 1,648 59,076 84,098 20,618 1,110
1) Provisional data.
Source: SURS
In the 2005-2013 period the number of enterprises grew the most in information and communication (by 129%). Enterprises in this activity employed 24% more persons, and generated 25% more turnover and 18% more value added.
18% of turnover in other non-financial services was generated in land transport and transport via pipelines.
Enterprises registered in transportation and storage generated in 2005 about a half more turnover than in 2013 although they employed fewer persons. In 2013, the number of enterprises in this activity was 4% higher than in 2005.
In the 2005-2013 period gross investment decreased in all observed activities, the least in transportation and storage (by 9% less, amounting to EUR 420 million).

48 OTHER NON-FINANCIAL SERVICES BUSINESS STATISTICS KALEIDOSCOPE
Chart 47: Trends in the value of selected situation indica-tors in other non-financial services, Slovenia, 20131)
H Transportation and storage I Accommodation and food service activities J Information and communication L Real estate activities M Professional, scientific and technical activities N Administrative and support service activities S95 Repair of computers and personal and household goods
1) Provisional data.
Source: SURS
Value added per person employed in other non-financial services in 2013 amounted toEUR 28,825.
Labour productivity
In 2013, labour productivity in other non-financial services was 5% lower than the average value added in all non-financial business activities.
The highest value among other non-financial services was recorded in real estate activities, i.e. EUR 51,408 per person or 70% more than average labour productivity in all non-financial business activities.
In other non-financial services higher labour productivity than the national average was recorded in information and communication and in transportation and storage.
In 2013, labour productivity in other non-financial services was 18% higher than in 2005. Enterprises engaged in transportation and storage contributed the most to this increase, since their labour productivity jumped by 59%.
Chart 48: Labour productivity in other non-financial ser-vices, Slovenia
1) Provisional data.
Source: SURS
49OTHER NON-FINANCIAL SERVICESBUSINESS STATISTICS KALEIDOSCOPE
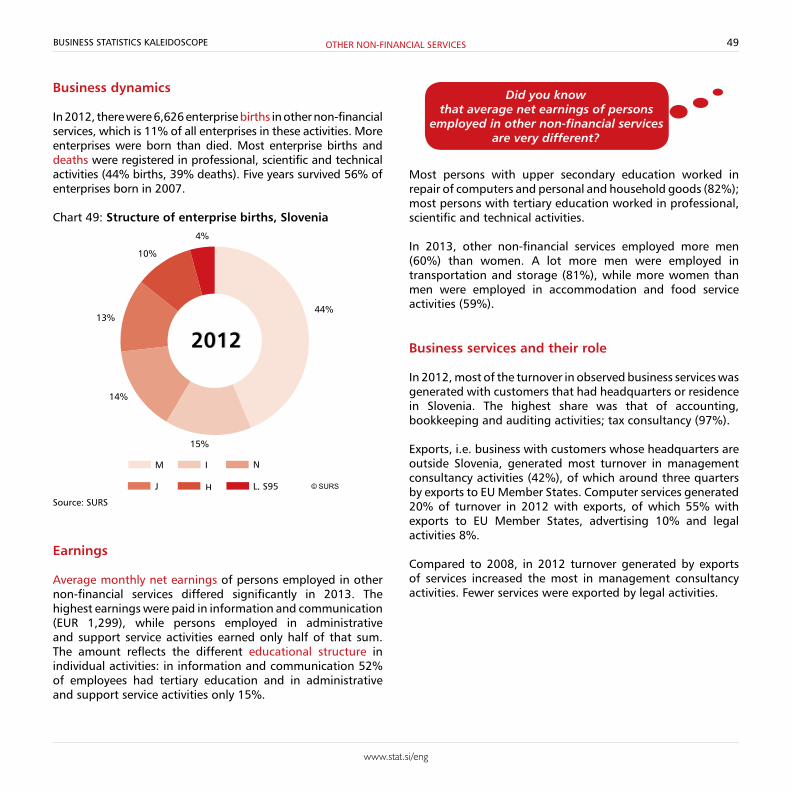
Business dynamics
In 2012, there were 6,626 enterprise births in other non-financial services, which is 11% of all enterprises in these activities. More enterprises were born than died. Most enterprise births and deaths were registered in professional, scientific and technical activities (44% births, 39% deaths). Five years survived 56% of enterprises born in 2007.
Chart 49: Structure of enterprise births, Slovenia
Source: SURS
Earnings
Average monthly net earnings of persons employed in other non-financial services differed significantly in 2013. The highest earnings were paid in information and communication (EUR 1,299), while persons employed in administrative and support service activities earned only half of that sum. The amount reflects the different educational structure in individual activities: in information and communication 52% of employees had tertiary education and in administrative and support service activities only 15%.
Did you know that average net earnings of persons
employed in other non-financial services are very different?
Most persons with upper secondary education worked in repair of computers and personal and household goods (82%); most persons with tertiary education worked in professional, scientific and technical activities.
In 2013, other non-financial services employed more men (60%) than women. A lot more men were employed in transportation and storage (81%), while more women than men were employed in accommodation and food service activities (59%).
Business services and their role
In 2012, most of the turnover in observed business services was generated with customers that had headquarters or residence in Slovenia. The highest share was that of accounting, bookkeeping and auditing activities; tax consultancy (97%).
Exports, i.e. business with customers whose headquarters are outside Slovenia, generated most turnover in management consultancy activities (42%), of which around three quarters by exports to EU Member States. Computer services generated 20% of turnover in 2012 with exports, of which 55% with exports to EU Member States, advertising 10% and legal activities 8%.
Compared to 2008, in 2012 turnover generated by exports of services increased the most in management consultancy activities. Fewer services were exported by legal activities.

50 OTHER NON-FINANCIAL SERVICES BUSINESS STATISTICS KALEIDOSCOPE
Chart 50: Structure of turnover in selected business services by headquarters of customers, 2012
J58.2 Software publishingJ62 Computer programming, consultancy and related activitiesJ63.1 Data processing, hosting and related activities; web portalsM69.1 Legal activitiesM69.2 Accounting, bookkeeping and auditing activities; tax consultancyM70.2 Management consultancy activitiesM73.1 Advertising
Source: SURS
In 2012, enterprises engaged in legal activities generated almost all their turnover (99%) with sale of specialised services (i.e. turnover generated with the sale of services characteristic for the observed activity). These enterprises generated three quarters of turnover with three services: legal advisory and representation services in judicial procedures concerning business and commercial law, other legal services and notarial services.
The lowest share of turnover from the sale of specialised services was generated by enterprises engaged in business and management consultancy activities (47%). These enterprises generated 86% of turnover with two services: business and other management consultancy activities and other business consulting services.
Did you know that in 2012 management
consultancy activities generated more than half of turnover with non-specialised services?
In computer programming, consultancy and related activities 90% of turnover was generated by specialised services; 63% of this turnover was generated by three services: computer programming services, computer consultancy services, and other information technology and computer services.
Chart 51: Structure of turnover in selected business ser-vices, Slovenia, 2012
Source: SURS

51OTHER NON-FINANCIAL SERVICESBUSINESS STATISTICS KALEIDOSCOPE
International participation in exports and imports of goods
Enterprises in other non-financial services contributed little to total exports and imports of goods: in 2013, 3% of exports and 2.8% of imports. Thus they generated surplus in trade in goods.
The highest values of exports (59%) and imports (40%) of goods in these activities were generated by enterprises engaged in professional, scientific and technical activities. These enterprises generated 71% of their exports in 2013 by exporting five types of goods: power-generating machinery and equipment, general industrial machinery and equipment, machinery specialized for particular industries, electrical machinery, apparatus and appliances, and professional, scientific and controlling instruments and apparatus.
Chart 52: Goods with the highest values of exports by SITC, professional, scientific and technical activities, Slovenia
Source: SURS
Trends in turnover from the sale of services5
In the 2005-2013 period, turnover from sale of services increased by 17%. In 2009, it dropped by 14% over the previous year; in the next two years it went up and in 2012 and 2013 down again. In 2013 it was 8% lower than in 2008.
Did you know that in 2013 only in transportation and storage the turnover from the sale of services was higher than before the
economic crisis (2008)?
In the 2005-2013 period turnover from the sale of services was varying the most in transportation and storage; it declined the most in 2009 (by 20% over the previous year), but in 2011 it was again at the 2008 level.
Turnover from the sale of services in information and communication decreased the least in 2009 compared to 2008 (by 3%), but it continued to fall in 2011 and 2012, so that in 2013 it was 5% lower than in 2008.
In 2013, only turnover from the sale of services in professional, scientific and technical activities was lower than in 2005 (by 7%).
According to provisional data, between January and October 2014 turnover from the sale of services was on average 3% higher than in the same period a year earlier. It was lower only in professional, scientific and technical activities (by 0.2%). It increased the most in transportation and storage (by 6%).
5 Covered are SKD 2008 sections H, I, J, M (except 70.1, 72 and 75) and N (except 77 and 81.1).

52 OTHER NON-FINANCIAL SERVICES BUSINESS STATISTICS KALEIDOSCOPE
Chart 53: Average annual growth rates of nominal turnover1) in some non-financial services, Slovenia2)
1) Working-day adjusted.2) Provisional data for 2014.
Source: SURS
At the EU level turnover from the sale of services was 7% higher in 2013 than in 2010. In this period the growth rate in Slovenia was lower than the EU overall (only 0.3%). More than 30% growth rates were recorded in Slovakia, Lithuania and Latvia, while in six Member States turnover from the sale of services was lower in 2013 than in 2010 (in Greece by as much as 24%).
Chart 54: Trends in the value of nominal turnover in some non-financial services1), 2013
1) No data for Denmark.
Source: Eurostat (http://ec.europa.eu/eurostat, 5.12. 2014)

53OTHER NON-FINANCIAL SERVICESBUSINESS STATISTICS KALEIDOSCOPE
Chart 55: Average annual growth rates of nominal turn-over and services producer prices, Slovenia
Source: SURS
In the 2007-2012 period services producer prices6 at the annual level were increasing (except in 2010), but since 2009 the growth has calmed down. In 2013, they were on average 0.2% lower than in the previous year.
In the third quarter of 2014 they were on average 0.7% higher than in the third quarter of 2013.
Did you know that in 2013 services producer prices
were 0.9% higher than in 2010?
6 Covered are selected activities in SKD 2008 sections H, J, M and N.
What are the prospects?
The services confidence indicator7 shows that confidence is rising, since the average value of this indicator in 2014 was 17 p.p. higher than in 2013. In December 2014 it was 2 p.p. higher than the long-term average (since 2005).
In December 2014, expectations for the next three months improved over the previous month as regards selling prices, while as regards expected demand and employment they remained the same. The values of all three expectation indicators were on average higher in 2014 than in 2013.
The main factors limiting the enterprises in service activities were insufficient demand and financial constraints.
Chart 56: Expectation indicators in service activities, Slovenia
Source: SURS
7 Covered are SKD 2008 sections H to N and divisions R92, R93, S95 and S96.


6 AVERAGE ENTERPRISE IN SLOVENIA
6 AVERAGE ENTERPRISE IN SLOVENIA
Registered as a sole proprietor. Is a micro enterprise: employs up to 9 persons.
Most of the employees are 35 to 39
years old.
Turnover higher than in 2005.
The greatest problem is insufficient demand.
Performs mostly market
activities.
Average earnings EUR 902.
Survived the first
five years.
Not part of an
enterprise group.
Oper-ates
in the Osrednje-slovenska statistical region.
Average labour
costs per employee per hour
worked are EUR 14.
Not under foreign control.
Funds for invest-
ment are declining.
Trades mostly with
Germany.
Most of the em-ployees
are men.
Most of the em-ployees
have upper secondary education.
Deals with other non-
financial services.
Source: SURS
2013

56 BUSINESS STATISTICS KALEIDOSCOPE
UNITS OF MEASUREMENT, ABBREVIATIONS
% percentEUR euromio millionmax. maximummin. minimump.p. percentage pointGDP gross domestic productEurostat Statistical Office of the European UnionPRS Business Register of SloveniaSKD 2008 Standard Classification of Activities 2008SKIS Standard Classification of Institutional SectorsSITC Standard International Trade Classification SPRS Statistical Business Register SURS Statistical Office of the Republic of Slovenia
COUNTRY ABBREVIATIONS
EU European Union IE IrelandEU-28 28 EU Member States IT ItalyAT Austria LT Lithuania BE Belgium LU LuxembourgBG Bulgaria LV LatviaCZ Czech Republic MT MaltaCY Cyprus NL NetherlandsDE Germany PO PolandDK Denmark PT PortugalEE Estonia RO Romania EL Greece SE SwedenES Spain SI SloveniaFI Finland SK SlovakiaFR France UK United KingdomHR Croatia HU Hungary RS Serbia
LIST OF CODES OF SKD 2008 CATEGORIESA AGRICULTURE, FORESTRY AND FISHING B MINING AND QUARRYINGC MANUFACTURINGD ELECTRICITY, GAS, STEAM AND AIR CONDITIONING
SUPPLYE WATER SUPPLY; SEWERAGE; WASTE MANAGEMENT
AND REMEDIATION ACTIVITIESF CONSTRUCTIONF41 Construction of buildingsF42 Civil engineeringF43 Specialised construction activitiesG WHOLESALE AND RETAIL TRADE; REPAIR OF
MOTOR VEHICLES AND MOTORCYCLESG45 Wholesale and retail trade and repair of motor
vehicles and motorcyclesG46 Wholesale trade, except of motor vehicles and
motorcyclesG47 Retail trade, except of motor vehicles and motorcyclesH TRANSPORTATION AND STORAGEI ACCOMMODATION AND FOOD SERVICE ACTIVITIESJ INFORMATION AND COMMUNICATIONJ58.2 Software publishingJ62 Computer programming, consultancy and related
activitiesJ63.1 Data processing, hosting and related activities;
web portalsK FINANCIAL AND INSURANCE ACTIVITIESL REAL ESTATE ACTIVITIESM PROFESSIONAL, SCIENTIFIC AND TECHNICAL
ACTIVITIESM69.1 Legal activitiesM69.2 Accounting, bookkeeping and auditing activities;
tax consultancyM70.2 Management consultancy activitiesM73.1 AdvertisingN ADMINISTRATIVE AND SUPPORT SERVICE ACTIVITIESO PUBLIC ADMINISTRATION AND DEFENCE;
COMPULSORY SOCIAL SECURITYP EDUCATIONQ HUMAN HEALTH AND SOCIAL WORK ACTIVITIESR ARTS, ENTERTAINMENT AND RECREATIONR92 Gambling and betting activitiesR93 Sports activities and amusement and recreation
activitiesS OTHER SERVICE ACTIVITIESS95 Repair of computers and personal and household goodsS96 Other personal service activities
57BUSINESS STATISTICS KALEIDOSCOPE
DEFINITIONS
Affiliates are enterprises that are in any of the following relationships: (a) One enterprise holds a majority of the shareholders’ or members’ voting rights in another. (b) One enterprise is entitled to appoint or remove a majority of the administrative, management or supervisory body of another. (c) A contract between the enterprises, or a provision in the memorandum or articles of association of one of the enterprises, enables one to exercise a dominant influence over the other. (d) One enterprise is able, by agreement, to exercise sole control over a majority of shareholders’ or members’ voting rights in another.
All-resident enterprise group is a group of legal units which are composed only of resident units. It must include at least two units. The coverage does not include all-resident enterprise groups with two units where the group head is a natural person that controls only one legal unit.
Average monthly (net) earnings are average (net) amounts received for a month of work by persons in paid employment working for legal persons or natural persons. Net earnings are gross earnings less social security contributions and advance on income tax.
Buildings are constructions with one or more rooms into which persons can enter and are intended for residence or for performing activities.We distinguish residential and non-residential buildings. Residential buildings are buildings in which at least half of the useful floor space is used for residential purposes. Non-residential buildings are buildings in which more than half of the useful floor space is used for performing activities.
Business entities are legal and natural persons that on the basis of entry into a corresponding primary register or record or on the basis of laws in a legally defined organisational form perform registered activities or activities defined by a foundation regulation or document and are registered in the Business Register of Slovenia.
Civil engineering includes all construction work not classified under building construction, i.e. construction of railways, roads, bridges, airport runways, dams, etc.
Earnings are defined as the total remuneration, in cash or in kind, payable to all persons counted on the payroll (including home workers), in return for work done during the accounting period, regardless of whether it is paid on the basis of working time, output or piecework and whether it is paid regularly or not.
Employees are persons who work for an employer (for legal persons or for individual private entrepreneurs and other registered natural persons), receive payment in the form of salaries and are socially insured on the basis of the employment contract. The number of employees includes also trainees, persons performing public works and partners in private companies and institutions in the Republic of Slovenia who are managers (if they do not have compulsory insurance on some other basis). From 2013 onwards detached workers are also included in the number of employees (persons employed in Slovenia and sent to work or training abroad).
Enterprise is registered as a legal or natural person (legal unit) that had either turnover or employment during the reference year. According to the Standard Classification of Institutional Sectors and Non-profit Institutions Serving Households, in determining enterprises membership fees, subsidies and other operating income are also taken into account. The data on active enterprises include all units that were active at least part of the observed period.
Enterprise birth is the creation of an enterprise as a combination of production factors with the restriction that no other enterprises are involved in the event. Events such as mergers, break-ups, split-off, change in the legal form or reactivations are excluded from enterprise births.
Enterprise birth rate is the number of enterprise births in the total number of all enterprises (in %).
Enterprise death rate is the number of enterprise deaths in the total number of enterprises (in %).

58 BUSINESS STATISTICS KALEIDOSCOPE
Enterprise group is an association of legal units which consists of the group head and subsidiary units. Enterprise groups are identified through the links of control between their units.
Enterprise survival rate five years is the share of enterprise survivals in the reference period (t) five years after birth among enterprise births in t-5 (in %).
Gross domestic product equals value added at basic prices by activities plus taxes on products and services less subsidies on products and services. Gross domestic product thus equals the sum of value added at basic prices of all domestic (resident) production units and net taxes on products and services (taxes less subsidies on products and services).
Gross investment in tangible fixed assets is all investment during the reference period in all tangible fixed assets. Included are new and existing tangible fixed assets, whether bought from third parties or produced for own use, having a useful life of more than one year, including non-produced tangible fixed assets such as land.
Gross margin on goods for resale corresponds to the return on the activity of purchase and resale without further processing. It is calculated from turnover, purchases and changes in stocks of goods and services purchased for resale in the same condition as received.
High-growth enterprise is an enterprise with average annual growth greater than 20% over a three-year period and with at least 5 persons employed in the first year of monitoring of three-year growth. Growth can be measured by the number of employees or by turnover.
Inward foreign affiliate is an enterprise resident in Slovenia (the compiling country of the statistics) over which an institutional unit not resident in Slovenia (the compiling country of the statistics) has control.
Job vacancy rate is job vacancies as a percentage of all posts (vacancies and occupied posts).
Labour productivity is the ratio of output to the quantity of labour used in production. It is one of the main synthetic indicators of economic development. Usually, it is measured in gross value added per employee, which is the ratio of value (in factor costs) to the average number of persons employed. It thus reflects physical productivity (average quantity of products/services per person employed in a certain period) as well as value productivity, which reflects the ratio of prices at which products/services were sold to prices of inputs necessary for producing these products/services.
Large enterprises are enterprises employing 250 persons or more.
Legal unit is a registered legal or natural person.
Legal persons are companies, institutions, associations and other organisations that obtain the status of legal persons by registration in an adequate constitutive register or record or by law.
Medium-growth enterprise is an enterprise with average annual growth between 10% and 20% over a three-year period and with at least 5 persons employed in the first year of monitoring of three-year growth. Growth can be measured by the number of employees or by turnover.
Medium-sized enterprises are enterprises employing 50 to 249 persons.
Micro enterprises are enterprises employing up to 9 persons.
Multinational enterprise group is a group of legal units which has at least two legal units located in different countries. The coverage does not include multinational enterprise groups with two units where the group head is a natural person that controls only one legal unit.
Natural persons are individual private entrepreneurs (sole proprietors) and other natural persons that permanently and independently perform various, exclusively profit activities on the free market.

59BUSINESS STATISTICS KALEIDOSCOPE
Nominal turnover is turnover expressed at current prices, i.e. prices referring to a certain observation period (e.g. calendar year).
Number of market enterprises is the number of registered legal or natural persons that had turnover or personnel cost and were therefore active during at least a part of the reference period. Covered are enterprises that according to SKIS belong to non-financial corporations (code 11), financial corporations (code 12) and households (code 14).
Output price indices measure the dynamics of producer prices of industrial products produced on the territory of Slovenia, and sold on the domestic (Slovene) market and/or on foreign markets.
Persons employed is defined as the total number of persons who work in the observed unit (paid or unpaid), as well as persons who work outside the unit they belong to and are paid by (e.g. sales representatives). Included are part-time workers, seasonal workers and home workers on the pay-roll of the observed unit. From 2013 on detached workers are also included in the number of persons employed by an enterprise with headquarters in Slovenia (persons sent to work or training abroad).
Persons in employment are persons in paid employed in enterprises, companies, institutions and other organisations or in subsidies of foreign enterprises, elected or appointed holders of public functions, mothers with children working under special regulations, owners of enterprises who run them personally and are not insured elsewhere, and since 1 January 1999 persons performing public works. Persons in paid employment are also those employed at self-employed persons, at own account workers performing their activity as the only or principal occupation, and at natural persons using supplementary work of other persons; self-employed persons performing economic or gainful activity (individual private entrepreneurs) and own account workers performing their activity as the only or principal occupation (e.g. independent researchers).
Production value measures the value of goods and services actually produced by the unit, based on sales, including changes in stocks and the resale of goods and services.
Real turnover is nominal turnover reduced by price growth (inflation rate) in a certain observation period (e.g. calendar year).
Services producer price indices measure the dynamics of service prices in selected activities which enterprises as producers of services provide to other enterprises as buyers of services.
Small enterprises are enterprises employing 10 to 49 persons.
Standard Classification of Activities is the Slovenian standard for recording, collecting, analysing and disseminating data important for presenting the characteristics of the economy and for monitoring development trends and structural changes. It is used for classifying business entities and their units by activity in various statistical and administrative data collections.
Tangible fixed assets are assets the enterprise has to produce or supply products or perform services (or lease them to others or use for administrative purposes) and that are expected to be used for more than one accounting period. Tangible fixed assets include land, buildings and structures, equipment, vineyards, orchards and other plantations or trees yielding repeat products, etc.
Turnover is the total amount that the enterprise settled with sale of goods, material and performed services in the reference year. It is measured on the basis of selling prices stated on invoices and other documents less discounts at sale or later on and the value of returned quantities. It includes all costs and charges linked to the buyer and excludes all duties and taxes on the goods or services invoiced by the unit and value added tax, possible sale of fixed assets, financial income, subsidies and other extra income.
Value added at basic prices equals output at basic prices, reduced by intermediate consumption at purchaser’s prices. Value added at basic prices also equals the sum of compensation of employees, other taxes on production, less other subsidies on production, and the sum of gross operating surplus and gross mixed income.
Value added at factor cost is calculated as gross income from operating activities after adjusting for operating subsidies and indirect taxes. Value-added at factor cost is calculated ‘gross’ because value adjustments (such as depreciation) are not subtracted.

60 BUSINESS STATISTICS KALEIDOSCOPE
SOURCES AND LITERATURE
Aljažev stolp - “pleh” z dušo. Retrieved on 20. 12. 2014 from the website: http://www.rtvslo.si/kultura/razstave/aljazev-stolp-pleh-z-duso/341793.
Center za upravljanje z dediščino živega srebra Idrija. Antonijev rov. Retrieved on 10. 12. 2014 from the website: http://www.antonijevrov.si/index.php/sl/ali-ste-vedeli
Črtna koda in njena pot skozi čas. (2009). Retrieved on 10. 12. 2014 from the website: http://www.mojmikro.si/mreza/uporabno/crtna_koda_in_njena_pot_skozi_cas.
Industry, trade and services. Database. Luksemburg: Eurostat. Retrieved on 5. 12. 2014 from the website: http://ec.europa.eu/eurostat/data/database
Internet v Sloveniji. Slovensko združenje Internet ISOC-SI. Retrieved on 7. 1. 2014 from the website: http://www.isoc-drustvo.si/?page_id=158
Javni vodovod, Slovenija, 2013 - končni podatki. (23. 10. 2014). Prva objava. Ljubljana: Statistični urad Republike Slovenije. Retrieved on 11. 12. 2014 from the website: http://www.stat.si/novica_prikazi.aspx?id=6587
Kako so iznašli nakupovalni voziček? (2009). Retrieved on 20. 12. 2014 from the website: http://www.rtvslo.si/zabava/zanimivosti/kako-so-iznasli-nakupovalni-vozicek/198092
National accounts: Annual National Accounts. Database. Luksemburg: Eurostat. Retrieved on 27. 11. 2014 from the website: http://ec.europa.eu/eurostat/data/database
Nebotičnik, Ljubljana. Retrieved on 15. 12. 2014 from the website: http://sl.wikipedia.org/wiki/Neboti%C4%8Dnik,_Ljubljana
Občina Ljutomer. Retrieved on 22. 12. 2014 from the website: http://www.obcinaljutomer.si/stran/zgodovina/57
Poročilo o stanju na področju energetike v Sloveniji v letu 2013. (junij 2014). Ljubljana: Agencija za energijo. Retrieved on 13. 12. 2014 from the website: http://katalogi.studio8.si/jarselp2013/files/assets/basic-html/page68.html
Poslovni subjekti v Poslovnem registru Slovenije po skupinah, po četrtletjih, 4. četrtletje 2013. Poročila. Ljubljana: Agencija Republike Slovenije za javnopravne evidence in storitve. Retrieved on 24. 12. 2014 from the website: http://www.ajpes.si/doc/Registri/PRS/Porocila/posl_subj_skup_31122013.pdf
Število novo registriranih poslovnih subjektov in število izbrisanih poslovnih subjektov po skupinah, v mesecih leta 2013. Poročila. Ljubljana: Agencija Republike Slovenije za javnopravne evidence in storitve. Retrieved on 24. 12. 2014 from the website:
http://www.ajpes.si/doc/Registri/PRS/Porocila/Arhiv/Stevilo_registriranih_in_izbrisanih_subjektov_2013.pdf
Zgodovina Slovenskih železnic. Slovenske železnice. Retrieved on 7. 1. 2014 from the website: http://www.slo-zeleznice.si/podjetje/onas/zgodovina
SOURCES OF PHOTOGRAPHES
Sokol ARSO http://nfp-si.eionet.europa.eu/sokol/index.php
Flicker https://www.flickr.com/photos/
Flaticon http://www.flaticon.com/
Wikipedia http://upload.wikimedia.org/wikipedia/commons/f/f9/Nova_samopostre%C5%BEna_trgovino_podjetja_Koloniale_v_paviljonu_na_Vrbanski_cesti_1964.jpg

WHOLESALE AND RETAIL TRADE, PROFESSIONAL, SCIENTIFIC AND TEHNICAL ACTIVITIES
HUMAN HEALTH AND SOCIAL WORK ACTIVITIES ACCOMMODATION AND FOOD SERVICE ACTIVITIES
REAL ESTATE ACTIVITIESFINANCIAL AND INSURANCE ACTIVITIES
ADMINISTRATIVE AND SUPPORT SERVICE ACTIVITIES
AGRICULTURE, FORESTRY AND FISHING
PUBLIC ADMINISTRATION AND DEFENCE, TRANSPORTATION AND STORAGE
EDUCATION
CONSTRUCTION
INFORMATION AND COMMUNICATION
ELECTRICITY, GAS, STEAM AND AIR CONDITIONING SUPPLY
MANUFACTURING
REPAIR OF MOTOR VEHICLES
COMPULSORY SOCIAL SECURITY
AND MOTORCYCLES


![Kaleidoscope - Amazon Web Services€¦ · Kaleidoscope Make your own reflecting kaleidoscope Written By: Kailash NR Kaleidoscope Guide ID: 520 -Release: 1.0 [major] 2019-02-04 This](https://static.fdocuments.in/doc/165x107/5fa4c91eb608da22fd275ca1/kaleidoscope-amazon-web-services-kaleidoscope-make-your-own-reflecting-kaleidoscope.jpg)