
Slovak Republic
60
Transcript of Slovak Republic


Slovak Republic TADAT Performance Assessment Report
Stephen Vesperman, Allan Jensen, Barrie Russell, Michael O’Grady and Gyӧngyi Végh
Fiscal Affairs Department
June 2018

The contents of this report constitute technical advice provided by
the staff of the International Monetary Fund (IMF) to the authorities of Slovak Republic (the "TA recipient") in response to their request for technical assistance. This report (in whole or in part) or summaries thereof may be disclosed by the IMF to IMF Executive Directors and members of their staff, as well as to other agencies or instrumentalities of the TA recipient, and upon their request, to World Bank staff and other technical assistance providers and donors with legitimate interest, unless the TA recipient specifically objects to such disclosure (see Operational Guidelines for the Dissemination of Technical Assistance Information— http://www.imf.org/external/np/pp/eng/2013/061013.pdf). Publication and disclosure of this report (in whole or in part) or summaries thereof to parties outside the IMF other than agencies or instrumentalities of the TA recipient, World Bank staff, other technical assistance providers and donors with legitimate interest shall require the explicit consent of the TA recipient and the IMF’s Fiscal Affairs Department.

1
Contents Page
ABBREVIATIONS AND ACRONYMS .................................................................................................................... 3
PREFACE ........................................................................................................................................................................ 4
EXECUTIVE SUMMARY ............................................................................................................................................ 5
I. INTRODUCTION ...................................................................................................................................................10
II. COUNTRY BACKGROUND INFORMATION ...............................................................................................11 A. Country Profile ....................................................................................................................................................11 B. Data Tables ...........................................................................................................................................................11 C. 2018 Economic situation ................................................................................................................................12 D. Main Taxes ............................................................................................................................................................12 E. Institutional Framework ....................................................................................................................................12 F. International Information Exchange ............................................................................................................13
III. ASSESSMENT OF PERFORMANCE OUTCOME AREAS .........................................................................14 A. POA 1: Integrity of the Registered Taxpayer Base .................................................................................14 B. POA 2: Effective Risk Management .............................................................................................................16 C. POA 3: Supporting Voluntary Compliance ...............................................................................................19 D. POA 4: Timely Filing of Tax Declarations ..................................................................................................23 E. POA 5: Timely Payment of Taxes ..................................................................................................................25 F. POA 6: Accurate Reporting in Declarations ..............................................................................................28 G. POA 7: Effective Tax Dispute Resolution ...................................................................................................32 H. POA 8: Efficient Revenue Management ....................................................................................................34 I. POA 9: Accountability and Transparency....................................................................................................37 Figure 1. Distribution of Performance Scores .............................................................................................................. 9 Tables 1. Summary of TADAT Performance Assessment ............................................................................. 6 2. P1-1 Assessment ............................................................................................................................. 14 3. P1-2 Assessment ............................................................................................................................. 15 4. P2-3 Assessment ............................................................................................................................. 17 5. P2-4 Assessment ............................................................................................................................. 18 6. P2-5 Assessment ............................................................................................................................. 18 7. P2-6 Assessment ............................................................................................................................. 19 8. P3-7 Assessment ......................................................................................................................... 20 9. P3-8 Assessment ............................................................................................................................. 22 10. P3-9 Assessment .......................................................................................................................... 22 11. P4-10 Assessment ........................................................................................................................ 24 12. P4-11 Assessment ........................................................................................................................ 25
2
13. P5-12 Assessment ........................................................................................................................ 26 14. P5-13 Assessment ........................................................................................................................ 26 15. P5-14 Assessment ........................................................................................................................ 27 16. P5-15 Assessment ..................................................................................................................... 28 17. P6-16 Assessment ........................................................................................................................ 29 18. P6-17 Assessment ..................................................................................................................... 30 19. P6-18 Assessment ........................................................................................................................ 31 20. P7-19 Assessment ........................................................................................................................ 32 21. P7-20 Assessment ........................................................................................................................ 33 22. P7-21 Assessment ........................................................................................................................ 34 23. P8-22 Assessment ........................................................................................................................ 35 24. P8-23 Assessment ........................................................................................................................ 36 25. P8-24 Assessment ........................................................................................................................ 36 26. P9-25 Assessment ........................................................................................................................ 37 27. P9-26 Assessment ..................................................................................................................... 39 28. P9-27 Assessment ........................................................................................................................ 40 29. P9-28 Assessment ........................................................................................................................ 40 Attachments I. TADAT Framework ........................................................................................................................... 41 II. Country Snapshot ........................................................................................................................... 43 III. Data Tables ..................................................................................................................................... 44 IV. Organizational Chart ..................................................................................................................... 54 V. Sources of Evidence ....................................................................................................................... 55

3
ABBREVIATIONS AND ACRONYMS
APA Advance Pricing Agreement
CIT Corporate Income Tax
CRS Common Reporting Standard
EC European Commission
EU European Union
FACO Financial Administration Criminal Office
FASR Financial Administration of the Slovak Republic
FAQ Frequently Asked Question
FDSR Financial Directorate of the Slovak Republic
GDP Gross Domestic Product
IMF International Monetary Fund
IT Information Technology
LTO Large Taxpayer Office
MoF Ministry of Finance
OECD Organization for Economic Cooperation and Development
PAYE Pay-as-you-earn
PIT Personal Income Tax
POA Performance Outcome Area
TPD Tax Proceedings Directorate
TADAT Tax Administration Diagnostic Assessment Tool
VAT Value-added tax

4
PREFACE
An assessment of the system of tax administration of the Slovak Republic (henceforth referred to as Slovakia) was undertaken during the period of April 4–19, 2018 using the Tax Administration Diagnostic Assessment Tool (TADAT). The tool provides an assessment baseline of tax administration performance that can be used to determine reform priorities, and, with subsequent repeat assessments, highlight reform achievements. The assessment team comprised of Messrs. Stephen Vesperman (Chief), Allan Jensen (both IMF), Barrie Russell, Michael O’Grady, and Ms. Gyӧngyi Végh (all IMF external experts). The mission met with Mr. Radko Kuruc, Vice Minister, Ministry of Finance of the Slovak Republic; Mr. František Imrecze, President, Financial Administration of the Slovak Republic (FASR); and many other FASR managers and staff. Visits were made to field offices, including the Large Taxpayer Office (LTO) and the Trnava Regional Office. The mission expresses it appreciation for the authorities’ very cooperative participation in this assessment. In particular, we would like to thank Mr. Rastislav Gabik from the FASR for his excellent mission coordination and logistic assistance. This report represents the final version of the draft report presented to the FASR on April 19, 2018. Comments from the FASR have been considered and included as appropriate in this final report which has been reviewed by IMF headquarters and cleared by the TADAT Secretariat.

5
EXECUTIVE SUMMARY
This assessment captures and measures critical outcomes of tax administration in Slovakia against international good practice—based on evidence made available to the IMF assessment team. Since its establishment in 2012, the primary focus of the FASR has been on combatting VAT evasion and this effort has been successful in reducing the historically high VAT gap. The FASR has also shown commitment to improving technology and e-services, including optimizing electronic filing and payment. Senior management recognizes the need to now shift the focus to improving voluntary compliance across all core taxes and is about to embark on further significant reforms. This performance assessment is timely, as it should help in identifying priorities for improvement and establishing a baseline against which the success of the reforms can be assessed over the medium term. The identified main strengths and weaknesses are:
Strengths
■ Strong VAT controls.
■ Comprehensive electronic filing and payment systems.
■ Strong framework of withholding and advance payment systems.
■ Regular tax gap analysis and contribution to revenue forecasting.
■ Relatively high rates of on-time filing and payment compliance.
Weaknesses
■ Lack of compliance focus on income taxes.
■ Taxpayer register shortcomings that hamper compliance management.
■ Unstructured management of compliance and institutional risks.
■ Unbalanced audit program.
■ Insufficient attention to reducing taxpayer compliance costs.
■ High stock of old tax arrears.
■ Poorly designed dispute resolution system.
■ Lack of public perception surveys.
While the concerted effort on VAT compliance has improved collection, shortcomings remain in many tax administration components. These should be addressed through the reform strategy currently being designed. It is recognized that some weaknesses cannot be resolved by the FASR alone. Some will involve changes to tax law. Resolving other weaknesses (e.g., tax register

6
shortcomings and gaps in external oversight), will require the involvement of outside institutions and a wider legal framework.
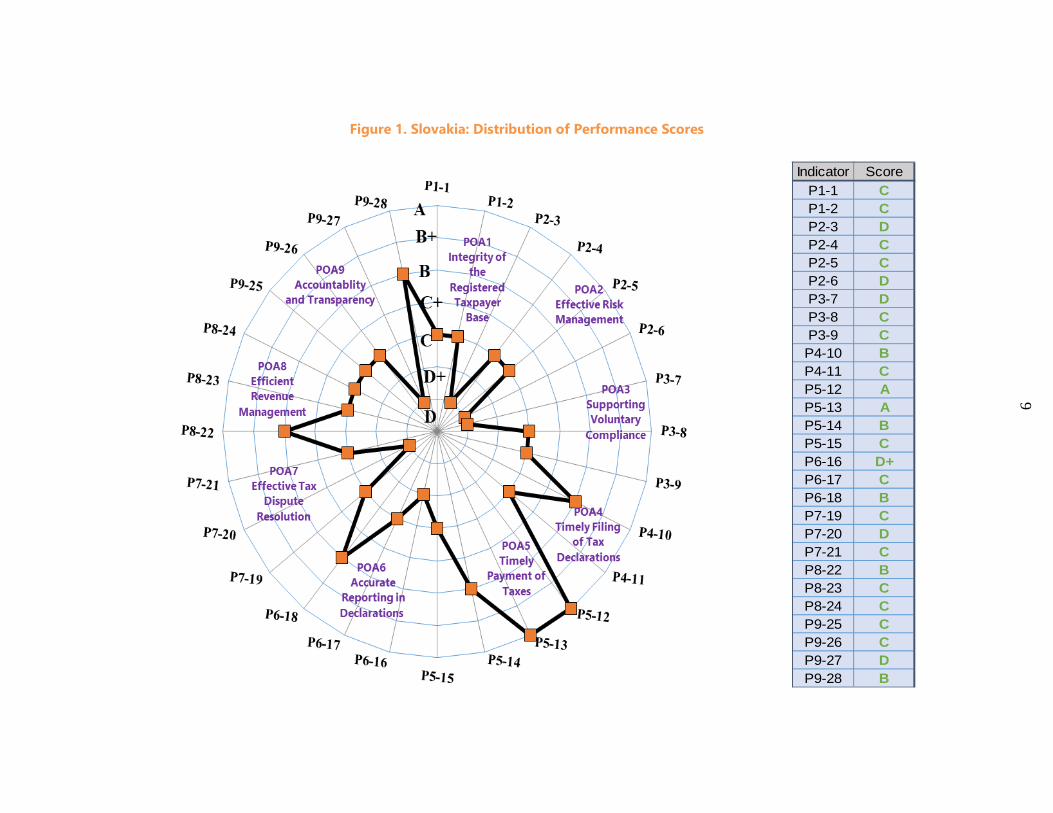
Table 1 provides a summary of performance scores, and Figure 1 a graphical snapshot of the distribution of scores. The scoring is structured around the TADAT framework’s 9 performance outcome areas (POAs) and 28 high level indicators critical to tax administration performance. An ‘ABCD’ scale is used to score each indicator, with ‘A’ representing the highest level of performance and ‘D’ the lowest.
Table 1. Slovakia: Summary of TADAT Performance Assessment
INDICATOR Score 2018 SUMMARY EXPLANATION OF ASSESSMENT
POA 1: Integrity of the Registered Taxpayer Base P1-1. Accurate and reliable taxpayer information.
C
The content of the taxpayer register is adequate, but tax law design adversely affects the accuracy of registration data for tax administration purposes.
P1-2. Knowledge of the potential taxpayer base.
C
The taxpayer register is systematically cross-checked with external registers but the FASR does not have a mandate to detect unregistered businesses.
POA 2: Effective Risk Management P2-3. Identification, assessment, ranking, and quantification of compliance risks. D
There is no high level structured risk assessment process in place to assess and prioritize compliance risks for income taxes or the four main compliance obligations. Some advanced risk modelling is undertaken at the case selection level.
P2-4. Mitigation of risks through a compliance improvement plan.
C A documented annual compliance improvement plan of the kind envisaged by TADAT is not in place except for VAT.
P2-5. Monitoring and evaluation of compliance risk mitigation activities.
C Except for VAT action plans, compliance risk management strategies are not routinely monitored and evaluated.
P2-6. Identification, assessment, and mitigation of institutional risks.
D There is no structured process in place to identify, assess and mitigate institutional risks.
POA 3: Supporting Voluntary Compliance P3-7. Scope, currency, and accessibility of information. D
There is a wide range of taxpayer information, but no procedures to ensure its currency, no education program, and no data on call center waiting times.

7
INDICATOR Score 2018 SUMMARY EXPLANATION OF ASSESSMENT
P3-8. Scope of initiatives to reduce taxpayer compliance costs. C
There is no prefilling of declarations or online access to tax account details. Forms are not regularly reviewed to reduce compliance costs.
P3-9. Obtaining taxpayer feedback on products and services.
C
There is high-level consultation with key taxpayer groups and intermediaries, but limited taxpayer input into the design and testing of new products and processes.
POA 4: Timely Filing of Tax Declarations P4-10. On-time filing rate.
B The on-time filing rates for core taxes are generally high, but the rate for PAYE withholding cannot be determined.
P4-11. Use of electronic filing facilities.
C Taxpayers’ use of electronic filing methods is relatively high across all core tax types, except for PIT.
POA 5: Timely Payment of Taxes P5-12. Use of electronic payment methods. A
All payments of core taxes are made electronically.
P5-13. Use of efficient collection systems.
A A strong legal framework for withholding at source and advance payment systems is in place.
P5-14. Timeliness of payments. B There is a healthy level of compliance with VAT
payment obligations.
P5-15. Stock and flow of tax arrears. C The stock of arrears is high and comprises a significant proportion of old debt.
POA 6: Accurate Reporting in Declarations P6-16. Scope of verification actions taken to detect and deter inaccurate reporting.
D+
The annual audit program does not provide adequate coverage of all core taxes and key taxpayer segments. Large-scale automated cross-checking is undertaken but incorporates data from only a narrow range of government agencies.
P6-17. Extent of proactive initiatives to encourage accurate reporting.
C Binding general rulings are published on a regular basis on the website, but there is no viable system of binding private rulings.
P6-18. Monitoring the extent of inaccurate reporting. B
The extent of inaccurate reporting is monitored using internationally accepted tax gap estimation methodologies.
POA 7: Effective Tax Dispute Resolution P7-19. Existence of an independent, workable, and graduated dispute resolution process.
C A tiered review mechanism is in place, but the administrative review process is multi-layered and there is no specialist tax tribunal or court.

8
INDICATOR Score 2018 SUMMARY EXPLANATION OF ASSESSMENT
P7-20. Time taken to resolve disputes. D There is insufficient information to assess this
indicator. P7-21. Degree to which dispute outcomes are acted upon. C Dispute outcomes of a material nature are
analyzed, but only on an ad hoc basis. POA 8: Efficient Revenue Management
P8-22. Contribution to government tax revenue forecasting process.
B The administration routinely provides input to government tax revenue forecasting and estimating processes.
P8-23. Adequacy of the tax revenue accounting system.
C The tax accounting system appears sound, but is not reviewed by the internal audit department to confirm alignment with the tax laws.
P8-24. Adequacy of tax refund processing
C The VAT refund system is sound, but the time taken to pay or offset VAT refunds is outside good practice standards.
POA 9: Accountability and Transparency P9-25. Internal assurance mechanisms.
C
The internal audit department does not conduct audits of the IT systems. The internal investigations department does not lead the formulation of anti-corruption policies.
P9-26. External oversight of the tax administration.
C
External audits of financial statements and elements of operational performance are conducted annually, but FASR’s responses to the audit findings are not published.
P9-27. Public perception of integrity.
D Statistically valid taxpayer surveys are not undertaken to monitor trends in public confidence in the tax administration.
P9-28. Publication of activities, results, and plans.
B The FASR publishes its annual reports and elements of its plans within three months of the end of the fiscal year.
9
Indicator ScoreP1-1 CP1-2 CP2-3 DP2-4 CP2-5 CP2-6 DP3-7 DP3-8 CP3-9 CP4-10 BP4-11 CP5-12 AP5-13 AP5-14 BP5-15 CP6-16 D+P6-17 CP6-18 BP7-19 CP7-20 DP7-21 CP8-22 BP8-23 CP8-24 CP9-25 CP9-26 CP9-27 DP9-28 B
Figure 1. Slovakia: Distribution of Performance Scores

10
I. INTRODUCTION
This report documents the results of the TADAT assessment conducted in Slovakia during the period of April 4-19, 2018 and subsequently reviewed by the TADAT Secretariat. The report is structured around the TADAT framework of 9 POAs and 28 high level indicators critical to tax administration performance that is linked to the POAs. Forty-seven measurement dimensions are taken into account in arriving at the indicator scores. A four-point ‘ABCD’ scale is used to score each dimension and indicator:
• ‘A’ denotes performance that meets or exceeds international good practice. In this regard, for TADAT purposes, a good practice is taken to be a tested and proven approach applied by a majority of leading tax administrations. It should be noted, however, that for a process to be considered ‘good practice,’ it does not need to be at the forefront or vanguard of technological and other developments. Given the dynamic nature of tax administration, the good practices described throughout the field guide can be expected to evolve over time as technology advances and innovative approaches are tested and gain wide acceptance.
• ‘B’ represents sound performance (i.e., a healthy level of performance but a rung below international good practice).
• ‘C’ means weak performance relative to international good practice.
• ‘D’ denotes inadequate performance, and is applied when the requirements for a ‘C’ rating or higher are not met. Furthermore, a ‘D’ score is given in certain situations where there is insufficient information available to assessors to determine and score the level of performance. For example, where a tax administration is unable to produce basic numerical data for purposes of assessing operational performance (e.g., in areas of filing, payment, and refund processing) a ‘D’ score is given. The underlying rationale is that the inability of the tax administration to provide the required data is indicative of deficiencies in its management information systems and performance monitoring practices.
For further details on the TADAT framework, see Attachment I. Some points to note about the TADAT diagnostic approach are the following:
• TADAT assesses the performance outcomes achieved in the administration of the major direct and indirect taxes critical to central government revenues, specifically corporate income tax (CIT), personal income tax (PIT), value-added tax (VAT), and pay-as-you-earn (PAYE) amounts withheld by employers (which, strictly speaking, are remittances of PIT). By assessing outcomes in relation to administration of these core taxes, a picture can be developed of the relative strengths and weaknesses of a country’s tax administration.

11
• TADAT assessments are evidence based (see Attachment V for the sources of evidence applicable to the assessment of Slovakia).
• TADAT is not designed to assess special tax regimes, such as those applying in the natural resource sector, nor does it assess customs administration.
• TADAT provides an assessment within the existing revenue policy framework in a country, with assessments highlighting performance issues that may be best dealt with by a mix of administrative and policy responses.
The aim of TADAT is to provide an objective assessment of the health of key components of the system of tax administration, the extent of reform required, and the relative priorities for attention. TADAT assessments are particularly helpful in:
• identifying the relative strengths and weaknesses in tax administration;
• facilitating a shared view among all stakeholders (country authorities, international organizations, donor countries, and technical assistance providers);
• setting the reform agenda (objectives, priorities, reform initiatives, and implementation sequencing);
• facilitating management and coordination of external support for reforms, and achieving faster and more efficient implementation; and
• monitoring and evaluating reform progress by way of subsequent repeat assessments.
II. COUNTRY BACKGROUND INFORMATION
Country Profile
General background information on Slovakia and the environment in which its tax system operates are provided in the country snapshot in Attachment II.
Data Tables
Numerical data provided by the authorities and used in the TADAT performance assessment is contained in the tables comprising Attachment III.

12
C. 2018 Economic situation1
Slovakia, a European Union (EU) member state since May 2004, and a Eurozone member since January 2009, is a high-income country with a GDP of around $90 billion (2016) and a population of 5.4 million. Per capita GDP in purchasing power standard stood at 77 percent of the EU-28 average in 2016. Slovakia’s post-crisis recovery has been one of the most robust in Europe and it continues to enjoy strong economic growth. Rising employment and real wages, together with high absorption of EU funds supported estimated growth of 3.3 percent in 2016 and 2017. Growth is expected to peak at 3.9 percent of GDP in 2019 and settle at around 3.5 percent thereafter, reflecting the expansion of export capacity from investments in the automotive industry.* Government debt is approximately 52 percent of GDP and the fiscal deficit is likely to be 0.7 percent of GDP in 2019 on current policies. Headline inflation has been negative since 2014 and the overall unemployment rate is under 8 percent (although unemployment rates in East and central Slovakia are three times as high as in the Bratislava region). An aging population and sharp regional disparities are the most significant long-term challenges. The United Kingdom’s planned exit from the EU also poses large uncertainty and risks of negative spillovers.
D. Main Taxes
Tax revenue collections in 2017 amounted to 16.8 percent of GDP. For 2017, the main revenue sources were VAT (41.7 percent of total tax revenues); PIT (20.1 percent); CIT (17.9 percent); and Excises (15.7 percent). Further details on tax revenue collections are provided in Table 1 of Attachment III.
E. Institutional Framework The FASR, which operates within the budget of the Ministry of Finance (MoF), is responsible for administering direct and indirect taxes. Social contributions are paid to the Social Insurance Agency and health insurance companies, although there are long-standing proposals2 to integrate the collection of tax and social contributions within the FASR and to harmonize the assessment bases. The FASR was restructured in 2012 upon a merger of the tax and customs administrations3. The
1 Based on recent IMF 2017 Article IV Staff Report, World Bank 2017 World Data Indicators and EU 2017 Taxation Trends report.
2 Under an integration and reform program called UNITAS.
3 Act No.333/2011 Coll.
* Corrigendum: The fiscal outlook in this paragraph was made at the time the report was written and is no longer current.

13
FASR now comprises the network of tax and customs offices as well as the Financial Administration Criminal Office (FACO) – all of which are managed and controlled by the Financial Directorate of the Slovak Republic (FDSR). The latter carries out headquarters and other central functions in relation to tax and customs operations. The head of the FASR has the title of President and is appointed by the Minister of Finance. The FASR president has an Advisory Board, which is a platform for discussion with business and professional bodies on matters relating to the FASR’s operations. The main tax and customs offices are located in each of the eight higher territorial units; there is also a network of smaller branch offices and contact points. An LTO, which has national coverage, is based in Bratislava. The FASR has approximately 9,300 staff: 1,500 in the FDSR, 4,600 in the Tax Offices, 3,000 in the Customs Offices and the remainder in FACO. An organizational chart for the FASR is provided in Attachment IV.
International Information Exchange
Slovakia has double taxation agreements in force with 68 countries, most of which contain provisions on exchange of information for tax purposes that meet the international standard. In addition, Slovakia has signed the Convention on Mutual Administrative Assistance in Tax Matters, a multilateral agreement developed jointly by the Council of Europe and the Organization for Economic Cooperation and Development (OECD). Overall, Slovakia’s network of information exchange mechanisms on tax matters (bilateral and multilateral) covers 116 jurisdictions.4 Slovakia is a member of the OECD’s Global Forum on Transparency and Exchange of Information for Tax Purposes. In relation to exchange of information on request, Global Forum peer review reports5 have found Slovakia to be “largely compliant” with the international standard. Slovakia has also endorsed the Common Reporting Standard (CRS) for automatic exchange of financial account information in tax matters—this is a global standard developed by the OECD, working with G20 countries and in close cooperation with the EU—and is an “early adopter” of the CRS with automatic reporting having commenced in 2017. Exchange of information for tax purposes between Slovakia and other EU countries is also provided for in EU legislation;6 this includes spontaneous and automatic information exchanges, multilateral controls, and tax debt recovery assistance.
4 Position as at January 1, 2018 – full lists are published on MoF website. The double taxation agreements include all EU countries as well as major non-EU trading partners such as China, India, Japan, Russia and the US.
5 The most recent (phase 2) peer review report was published in April 2014.
6 For example, the directives on administrative cooperation in the field of taxation (DACs); on assistance in recovering tax debts; and on combatting VAT fraud.

14
III. ASSESSMENT OF PERFORMANCE OUTCOME AREAS
POA 1: Integrity of the Registered Taxpayer Base
A fundamental initial step in administering taxes is taxpayer registration and numbering. Tax administrations must compile and maintain a complete database of businesses and individuals that are required by law to register; these will include taxpayers in their own right, as well as others such as employers with PAYE withholding responsibilities. Registration and numbering of each taxpayer underpins key administrative processes associated with filing, payment, assessment, and collection.
Two performance indicators are used to assess POA 1: • P1-1—Accurate and reliable taxpayer information. • P1-2—Knowledge of the potential taxpayer base.
P1-1: Accurate and reliable taxpayer information For this indicator two measurement dimensions assess (1) the adequacy of information held in the tax administration’s registration database and the extent to which it supports effective interactions with taxpayers and tax intermediaries (i.e., tax advisors and accountants); and (2) the accuracy of information held in the database. Assessed scores are shown in Table 2 followed by an explanation of reasons underlying the assessment. Table 2. Slovakia: P1-1 Assessment
Measurement Dimensions Scoring Method
Score 2018
P1-1-1. The adequacy of information held in respect of registered taxpayers and the extent to which the registration database supports effective interactions with taxpayers and tax intermediaries. M1 B C P1-1-2. The accuracy of information held in the registration database. C
The content and functionality of the taxpayer register are generally sound; however, it does not provide online access to taxpayers to update their details on the register. Taxpayers may submit applications to register with the FASR through several channels (tax offices, on-line portal, and one-stop shops). Businesses must first register with the Commercial Register (legal entities) or with the trade licensing authority (“small business register”). The FASR uploads and maintains registration data in a central computerized database and keeps the data aligned with relevant data held in the above external registers. The content of the FASR database is adequate for tax administration purposes. It includes all necessary registration details, which are linked to taxpayers through a single high integrity identification number. Taxpayers may

15
submit requests for changes to their registration details on-line, but cannot make the changes on-line themselves. The taxpayer registration system interfaces with other IT subsystems. It provides users with a whole-of-taxpayer view and facilitates standard tax administration operations (e.g. taxpayer registration and deregistration, archiving; generation of tax declarations, filing enforcement, payment processing, generation of statistics and management information, and analysis across tax types, industry groups, and geographic areas, etc.). Tax law design adversely impacts the reliability of information held in the registration database for some core taxes. The accuracy of VAT information on the register appears satisfactory. However, the FASR is prevented from cancelling or suspending registrations of legal entities that remain registered on the Commercial Register, even where these entities are known to have ceased trading. Staff advised that many thousands of taxpayers on the FASR register (estimated to represent around 23 percent of CIT registrations) are known to be defunct or inactive. No internal audit or management reports were available that indicate that the FASR has confidence in the accuracy of the taxpayer register. Applications for registration are authenticated. Identity checks are made by the FASR in situations where taxpayers register at Tax Offices whereas this obligation falls on the Commercial Register and the small business register when taxpayers register with them. On an ongoing basis, the FASR verifies its register data against relevant data held in these external registers. P1-2: Knowledge of the potential taxpayer base This indicator measures the extent of tax administration efforts to detect unregistered businesses and individuals. The assessed score is shown in Table 3 followed by an explanation of reasons underlying the assessment. Table 3. Slovakia: P1-2 Assessment
Measurement Dimensions Scoring Method
Score 2018
P1-2. The extent of initiatives to detect businesses and individuals who are required to register but fail to do so. M1 C
Some initiatives are in place to detect unregistered businesses. The FASR systematically follows-up on any businesses that register with the Commercial Register or the small business register but fail to register for tax purposes within 60 days. However, the FASR has no mandate to detect businesses that have failed to register with the external business registers. This responsibility falls within the mandate of the small business register. For this reason, the FASR’s

16
operational plans do not specify initiatives to detect unregistered businesses and individuals. However, in situations where FASR personnel in their daily work encounter businesses that are required to register but have failed to do so, they notify the small business register.
POA 2: Effective Risk Management
Tax administrations face numerous risks that have the potential to adversely affect revenue and/or tax administration operations. For convenience, these risks can be classified as: • compliance risks—where revenue may be lost if businesses and individuals fail to meet the
four main taxpayer obligations (i.e., registration in the tax system, filing of tax declarations, payment of taxes on time, and complete and accurate reporting of information in declarations); and
• institutional risks—where tax administration functions may be interrupted if certain external
or internal events occur, such as natural disasters, sabotage, loss or destruction of physical assets, failure of information technology system hardware or software, strike action by employees, and administrative breaches (e.g., leakage of confidential taxpayer information which results in loss of community confidence and trust in the tax administration).
Risk management is essential to effective tax administration and involves a structured approach to identifying, assessing, prioritizing, and mitigating risks. It is an integral part of multi-year strategic and annual operational planning. Four performance indicators are used to assess POA 2:
• P2-3—Identification, assessment, ranking, and quantification of compliance risks. • P2-4—Mitigation of risks through a compliance improvement plan. • P2-5—Monitoring and evaluation of compliance risk mitigation activities. • P2-6—Identification, assessment, and mitigation of institutional risks. P2-3: Identification, assessment, ranking, and quantification of compliance risks For this indicator two measurement dimensions assess (1) the scope of intelligence gathering and research to identify risks to the tax system; and (2) the process used to assess, rank, and quantify compliance risks. Assessed scores are shown in Table 4 followed by an explanation of reasons underlying the assessment.

17
Table 4. Slovakia: P2-3 Assessment
The FASR does not build knowledge of compliance levels and emerging risks except for VAT. Improving compliance with VAT obligations has been the central theme of the planning process in recent years. For VAT, data and intelligence is gathered from a range of external sources including customs and other government agencies and other tax jurisdictions. Data is also gathered and interpreted from a range of internal sources including tax audits, tax declarations, VAT control statements, and tax gap studies. Intelligence gathering and research initiatives for the other core taxes are not comprehensive and are mostly limited to internal data sources. The support and analysis unit within the LTO conducts some rudimentary research and analysis into CIT compliance but there is no evidence of any analysis of the results of environmental scans undertaken as part of a multi-year strategic planning process to identify compliance risks for PIT, CIT or PAYE withholding. Formal tax gap estimates are undertaken for both VAT and CIT, but the analysis of the CIT tax gap reports is still at a very early stage and undocumented. There is no high level structured risk assessment process in place to assess and prioritize compliance risks for income taxes or the four main compliance obligations7. The compliance risk management capability is fragmented across the organization and mainly focused on VAT compliance although FASR has recently developed data mining models for CIT and PIT audit case selection. Senior management advised that the highest priority has been to mitigate the known major compliance problems with VAT before broadening the compliance risk management focus to include the other core taxes. The need for a more structured approach to identifying, assessing, quantifying and ranking compliance risks across all the core taxes is recognized. P2-4: Mitigation of risks through a compliance improvement plan This indicator examines the extent to which the tax administration has formulated a compliance improvement plan to address identified risks. The assessed score is shown in Table 5 followed by an explanation of reasons underlying the assessment.
7 Registration, filing, payment and reporting.
Measurement Dimensions Scoring Method
Score 2018
P2-3-1. The extent of intelligence gathering and research to identify compliance risks in respect of the main tax obligations M1
C D P2-3-2. The process used to assess, rank, and quantify taxpayer
compliance risks. D

18
Table 5. Slovakia: P2-4 Assessment
Measurement Dimensions Scoring Method
Score 2018
P2-4. The degree to which the tax administration mitigates assessed risks to the tax system through a compliance improvement plan. M1 C
A documented annual compliance improvement plan of the kind envisaged by TADAT is not in place except for VAT. The administration’s primary objective in recent years has been to bring rampant VAT evasion under control. A series of VAT action plans over recent years have delivered a range of compliance risk mitigation measures including implementation of a VAT control statement to enhance its data matching activities, application of a reverse-charge mechanism in high risk industries such as building and construction, increased audit focus, a sharper focus on filing and payment enforcement including ex-officio deregistration of VAT registrations, and numerous amendments to the VAT law. However, there are no documented examples of any cross-function planning and strategy development to address the underlying causes of identified compliance risks through an optimal mix of tailored education and service initiatives, changes to procedures, amendments of the law, and targeted enforcement action for other core taxes. P2-5: Monitoring and evaluation of compliance risk mitigation activities This indicator looks at the process used to monitor and evaluate mitigation activities. The assessed score is shown in Table 6 followed by an explanation of reasons underlying the assessment. Table 6. Slovakia: P2-5 Assessment
Measurement Dimensions Scoring Method
Score 2018
P2-5. The process used to monitor and evaluate the impact of compliance risk mitigation activities. M1 C
Except in the case of VAT, compliance risk management strategies are monitored and evaluated infrequently and on an ad hoc basis. VAT action plan initiatives feature strongly in the tax administration’s operational planning. Senior management closely monitors movements in the size of the VAT gap at both an aggregate level and a sectoral level to measure the impact on compliance of the VAT action plans. However, there is no permanent committee of senior managers or other organizational arrangements in place to manage major compliance risks across the other core taxes. As a result, evaluation of compliance improvement initiatives in the

19
other core taxes occurs only on an ad hoc basis (e.g., for the project to improve compliance by sportspersons and entertainers). P2-6: Identification, assessment, and mitigation of institutional risks This indicator examines how the tax administration manages institutional risks. The assessed score is shown in Table 7 followed by an explanation of reasons underlying the assessment. Table 7. Slovakia: P2-6 Assessment
Measurement Dimensions Scoring Method
Score 2018
P2-6. The process used to identify, assess, and mitigate institutional risks. M1 D
There is no structured process in place to identify, assess and mitigate institutional risks. The IT system incorporates an audit trail of changes made to taxpayer data, and access to IT systems is restricted to authorized users. All data is backed-up on-site. A standalone back-up facility is under construction but is not yet operational. An IT business continuity plan has been developed for customs but has not yet been completed for tax administration IT systems. Governance arrangements for the management of institutional risks are unclear. Individual department heads are responsible for identifying and mitigating risks to staff safety and assets within their business units but there is no standardized methodology except in the IT department which has adopted ISO 25000. Broader institutional risks to the whole organization are not assessed, an institutional risk register is not in place, a disaster recovery plan has not been prepared, and staff are not trained in what to do in the case of large-scale emergencies.8
POA 3: Supporting Voluntary Compliance
To promote voluntary compliance and public confidence in the tax system, tax administrations must adopt a service-oriented attitude toward taxpayers, ensuring that taxpayers have the information and support they need to meet their obligations and claim their entitlements under the law. Because few taxpayers use the law itself as a primary source of information, assistance from the tax administration plays a crucial role in bridging the knowledge gap. Taxpayers expect
8 A disaster recovery plan: (a) assesses the likelihood and consequences of natural disasters (e.g., flood, fire, earthquake, and epidemic) and man-made events (e.g., sabotage, theft, civil unrest, and internal fraud); (b) outlines the steps to be taken in the event of a disaster to maintain revenue collections, provide taxpayer services, ensure safety of staff, and preserve the integrity and confidentiality of taxpayer records; and (c) sets out how staff will be trained in disaster recovery procedures.

20
that the tax administration will provide summarized, understandable information on which they can rely. Efforts to reduce taxpayer costs of compliance are also important. Small businesses, for example, gain from simplified record keeping and reporting requirements. Likewise, individuals with relatively simple tax obligations (e.g., employees, retirees, and passive investors) benefit from simplified filing arrangements and systems that eliminate the need to file. Three performance indicators are used to assess POA 3: • P3-7—Scope, currency, and accessibility of information. • P3-8—Scope of initiatives to reduce taxpayer compliance costs. • P3-9—Obtaining taxpayer feedback on products and services.
P3-7: Scope, currency, and accessibility of information For this indicator four measurement dimensions assess (1) whether taxpayers have the information they need to meet their obligations; (2) whether the information available to taxpayers reflects the current law and administrative policy; (3) how easy it is for taxpayers to obtain information; and (4) how quickly the tax administration responds to requests by taxpayers and tax intermediaries for information (for this dimension, waiting time for telephone enquiry calls is used as a proxy for measuring a tax administration’s performance in responding to information requests generally). Assessed scores are shown in Table 8 followed by an explanation of reasons underlying the assessment.
Table 8. Slovakia: P3-7 Assessment
Measurement Dimensions Scoring Method
Score 2018
P3-7-1. The range of information available to taxpayers to explain, in clear terms, what their obligations and entitlements are in respect of each core tax.
M1
A
D P3-7-2. The degree to which information is current in terms of the law and administrative policy. C
P3-7-3. The ease by which taxpayers obtain information from the tax administration. C
P3-7-4. The time taken to respond to taxpayer and intermediary requests for information. D
Information about core tax obligations and entitlements is readily available and is tailored to the needs of key categories and groups. A wide range of information is available on the main taxpayer obligations (registration, filing, payment and reporting) and entitlements, in

21
respect of all core taxes. The language used in information material is mostly easily understandable, but could be more user-friendly in certain areas. Information on the website, which is the primary information source, is organized around people, businesses and tax specialists. There is further segmentation around types of person (e.g., employees, students, pensioners) and types of business entity (e.g., freelance trades, business companies, non-profits and those obliged to operate virtual cash registers). Tailored information is provided for smaller businesses with simplified bookkeeping arrangements and certain industry groups subject to special tax regimes, such as accommodation and transport sectors affected by the “digital platform” tax. There is also some customization for disadvantaged groups, for example, providing forms and guidance in the minority Hungarian language. No dedicated technical staff are assigned to ensure that information is kept up to date. Responsibility for updating the website and other information material is not coordinated. No dedicated technical staff are assigned for this purpose and no procedures are in place to ensure the currency of taxpayer information. Taxpayers are alerted to law and policy changes mainly via the website, a newsletter, press releases and social media posts, but such alerts are not always communicated before the law or policy change takes effect. Information is available at no or minimal cost through a variety of user friendly channels, but taxpayer education programs are currently limited and ad hoc. The website contains extensive guidance for taxpayers, including frequently asked questions (FAQs), practical examples, a tax calendar, tax calculators, and a fortnightly newsletter. Information is also available from a national call center (which deals with online live agent and chat requests as well as calls) and walk-in offices. Social media is increasingly being used, for example, 50 information videos were posted on Facebook in 2017. While a Public Education Department has recently been established, it is still at the early stages of development. There is no taxpayer education program for micro- and small business, new businesses and first-time employers. There is a national tax support call center, but no information was available on call waiting times. Data provided (Attachment III, Table 3) shows the number of telephone enquiry calls received by the national call center but call center management could not provide information on calls answered within 6 minutes waiting time. There are no service standards for telephone enquiry call waiting times. P3-8: Scope of initiatives to reduce taxpayer compliance costs This indicator examines the tax administration’s efforts to reduce taxpayer compliance costs. Assessed scores are shown in Table 9 followed by an explanation of reasons underlying the assessment.
22
Table 9. Slovakia: P3-8 Assessment
Measurement Dimensions Scoring Method
Score 2018
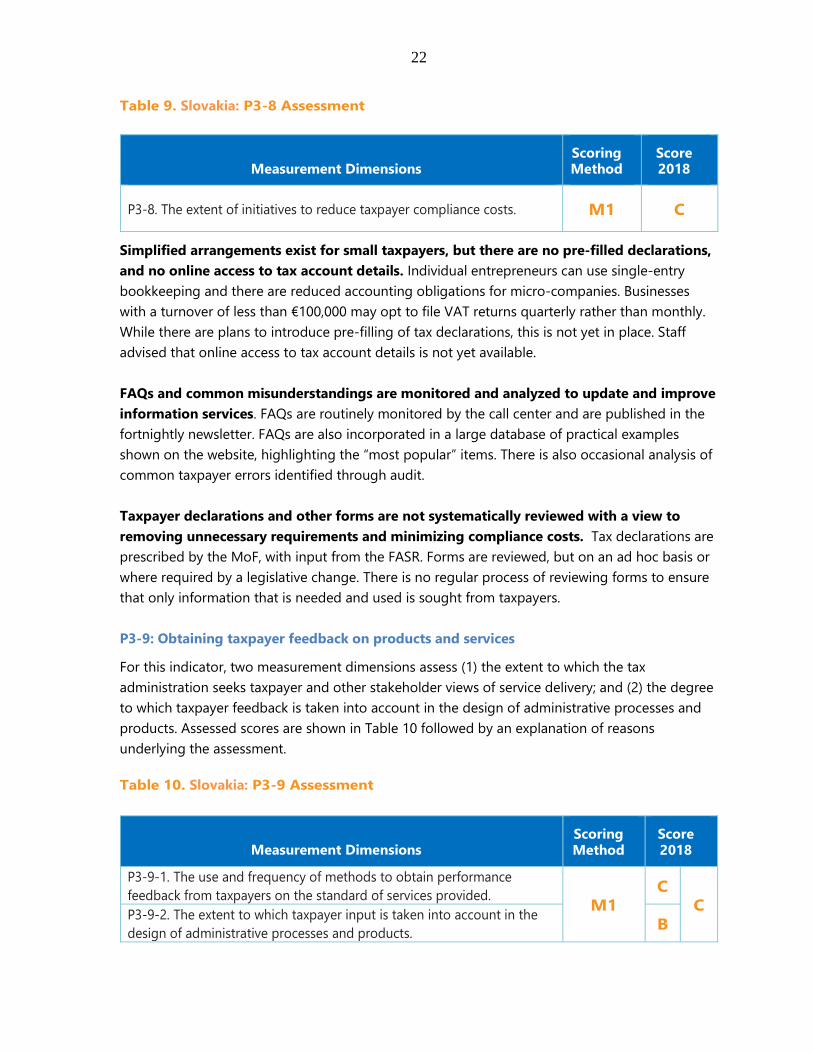
P3-8. The extent of initiatives to reduce taxpayer compliance costs. M1 C
Simplified arrangements exist for small taxpayers, but there are no pre-filled declarations, and no online access to tax account details. Individual entrepreneurs can use single-entry bookkeeping and there are reduced accounting obligations for micro-companies. Businesses with a turnover of less than €100,000 may opt to file VAT returns quarterly rather than monthly. While there are plans to introduce pre-filling of tax declarations, this is not yet in place. Staff advised that online access to tax account details is not yet available. FAQs and common misunderstandings are monitored and analyzed to update and improve information services. FAQs are routinely monitored by the call center and are published in the fortnightly newsletter. FAQs are also incorporated in a large database of practical examples shown on the website, highlighting the “most popular” items. There is also occasional analysis of common taxpayer errors identified through audit. Taxpayer declarations and other forms are not systematically reviewed with a view to removing unnecessary requirements and minimizing compliance costs. Tax declarations are prescribed by the MoF, with input from the FASR. Forms are reviewed, but on an ad hoc basis or where required by a legislative change. There is no regular process of reviewing forms to ensure that only information that is needed and used is sought from taxpayers. P3-9: Obtaining taxpayer feedback on products and services
For this indicator, two measurement dimensions assess (1) the extent to which the tax administration seeks taxpayer and other stakeholder views of service delivery; and (2) the degree to which taxpayer feedback is taken into account in the design of administrative processes and products. Assessed scores are shown in Table 10 followed by an explanation of reasons underlying the assessment.
Table 10. Slovakia: P3-9 Assessment
Measurement Dimensions Scoring Method
Score 2018
P3-9-1. The use and frequency of methods to obtain performance feedback from taxpayers on the standard of services provided. M1
C C P3-9-2. The extent to which taxpayer input is taken into account in the
design of administrative processes and products. B

23
Arrangements to get feedback from taxpayers on service standards are limited, and no statistically valid public perception surveys are carried out. An independent company (Staffino) is used to monitor call center service quality. Apart from that, the use of feedback and survey methods is very much ad hoc. Statistically valid surveys of key taxpayer segments – to monitor trends in perceptions of services and products – are not undertaken. Consultation with key taxpayer groups is primarily through an Advisory Board, but there is limited taxpayer input into the design or testing of new processes and products. The main consultation forum for key taxpayer groups and intermediaries is the Advisory Board of the FASR President. Standing members of this Board include representatives of sixteen professional organizations (covering a broad spectrum of taxpayer segments, industry groups and tax specialists). Examples of prominent issues recently discussed by the Advisory Board were difficulties relating to the extension of mandatory electronic filing and the practical implementation of the new digital platform tax. Taxpayer involvement in the design or user testing of new processes or products (e.g., forms, web design, clarity of rulings) is limited. While there is an opportunity to comment on new form design, this is not actively promoted.
POA 4: Timely Filing of Tax Declarations
Filing of tax declarations (also known as tax returns) remains a principal means by which a taxpayer’s tax liability is established and becomes due and payable. As noted in POA 3, however, there is a trend toward streamlining preparation and filing of declarations of taxpayers with relatively uncomplicated tax affairs (e.g., through prefilling tax declarations). Moreover, several countries treat income tax withheld at source as a final tax, thereby eliminating the need for large numbers of PIT taxpayers to file annual income tax declarations. There is also a strong trend towards electronic filing of declarations for all core taxes. Declarations may be filed by taxpayers themselves or via tax intermediaries. It is important that all taxpayers who are required to file do so, including those who are unable to pay the tax owing at the time a declaration is due (for these taxpayers, the first priority of the tax administration is to obtain a declaration from the taxpayer to confirm the amount owed, and then secure payment through the enforcement and other measures covered in POA 5). The following performance indicators are used to assess POA 4:
• P4-10—On-time filing rate. • P4-11—Use of electronic filing facilities.
P4-10: On-time filing rate
A single performance indicator, with four measurement dimensions, is used to assess the on-time filing rate for CIT, PIT, VAT, and PAYE withholding declarations. A high on-time filing rate is indicative of effective compliance management including, for example, provision of convenient

24
means to file declarations (especially electronic filing facilities), simplified declarations forms, and enforcement action against those who fail to file on time. Assessed scores are shown in Table 11 followed by an explanation of reasons underlying the assessment.
Table 11. Slovakia: P4-10 Assessment
Measurement Dimensions Scoring Method
Score 2018
P4-10-1. The number of CIT declarations filed by the statutory due date as a percentage of the number of declarations expected from registered CIT taxpayers.
M2
B
B
P4-10-2. The number of PIT declarations filed by the statutory due date as a percentage of the number of declarations expected from registered PIT taxpayers.
B
P4-10-3. The number of VAT declarations filed by the statutory due date as a percentage of the number of declarations expected from registered VAT taxpayers.
A
P4-10-4. The number of PAYE withholding declarations filed by employers by the statutory due date as a percentage of the number of PAYE declarations expected from registered employers.
D
The on-time filing rates for core taxes are generally high; however, the rate for PAYE withholding cannot be determined. The latter is because employers have no filing obligation for tax periods in which no salaries are paid to employees. For all other tax types, the IT system automatically generates a list of non-filers to be used by tax offices for filing enforcement purposes. The relatively high on-time filing rate for VAT is partly due to the robust arrangements in place to follow-up VAT taxpayers who fail to file a declaration or pay the VAT due for two consecutive periods, including ex officio deregistration when taxpayers are identified to be inactive. Tables 4 - 8 of Attachment III show the following on-time filing rates for core taxes in 2017:
Tax type/taxpayer segment Percent filed on-time
• All CIT taxpayers 81.5 • Large CIT taxpayers 95.3 • All PIT taxpayers 76.5 • All VAT taxpayers 97.6 • Large VAT taxpayers 99.1 • All PAYE taxpayers No data

25
P4-11: Use of electronic filing facilities
This indicator measures the extent to which declarations, for all core taxes, are filed electronically. Assessed scores are shown in Table 12 followed by an explanation of reasons underlying the assessment.
Table 12. Slovakia: P4-11 Assessment
Measurement Dimensions Scoring Method
Score 2018
P4-11. The extent to which tax declarations are filed electronically. M1 C Electronic filing of tax declarations is relatively high across all core tax types, except for PIT. Table 9 of Attachment III shows that in 2017 the rates for electronic filing were:
• For CIT: 70.0 percent • For PIT: 17.9 percent • For VAT: 99.9 percent • For PAYE withholding: 82.7 percent.
From July 2018, electronic filing will be compulsory for all taxpayers for all tax types.
POA 5: Timely Payment of Taxes
Taxpayers are expected to pay taxes on time. Tax laws and administrative procedures specify payment requirements, including deadlines (due dates) for payment, who is required to pay, and payment methods. Depending on the system in place, payments due will be either self-assessed or administratively assessed. Failure by a taxpayer to pay on time results in imposition of interest and penalties and, for some taxpayers, legal debt recovery action. The aim of the tax administration should be to achieve high rates of voluntary on-time payment and low incidence of tax arrears. Four performance indicators are used to assess POA 5:
• P5-12—Use of electronic payment methods. • P5-13—Use of efficient collection systems. • P5-14—Timeliness of payments. • P5-15—Stock and flow of tax arrears. P5-12: Use of electronic payment methods This indicator examines the degree to which core taxes are paid by electronic means, including through electronic funds transfer (where money is electronically transferred via the Internet from

26
a taxpayer’s bank account to the government’s account), credit cards, and debit cards. For TADAT measurement purposes, payments made in person by a taxpayer to a third-party agent (e.g., a bank or post office) that are then electronically transferred by the agent to the government’s account are accepted as electronic payments. Assessed scores are shown in Table 13 followed by an explanation of reasons underlying the assessment. Table 13. Slovakia: P5-12 Assessment
Measurement Dimensions Scoring Method
Score 2018
P5-12. The extent to which core taxes are paid electronically. M1 A All payments of core taxes are made electronically. Payments may be made at banks or the post office and are then electronically transferred to the FASR. Each payment is made with a reference number identifying the specific liability (by tax type and period) against which the payment is made. Table 9 in Attachment III shows that, for each of the three years 2015 -2017, 100 percent of payments were made electronically for each of the core taxes.
P5-13: Use of efficient collection systems This indicator assesses the extent to which acknowledged efficient collection systems—especially withholding at source and advance payment systems—are used. Assessed scores are shown in Table 14 followed by an explanation of reasons underlying the assessment. Table 14. Slovakia: P5-13 Assessment
Measurement Dimensions Scoring Method
Score 2018
P5-13. The extent to which withholding at source and advance payment systems are used. M1 A
A strong legal framework of withholding at source and advance payment systems is in place:
• Withholding of tax by employers is required at source for all employment income;
• Withholding of tax is required at source for interest and dividend income paid to both resident and non-resident natural persons and legal entities; and
• Advance payment of tax (where the income tax liability on the prior year’s declaration is greater than €2,500) is required for business income for natural persons and legal entities.

27
P5-14: Timeliness of payments This indicator assesses the extent to which payments are made on time (by number and by value). For TADAT measurement purposes, VAT payment performance is used as a proxy for on-time payment performance of core taxes generally. A high on-time payment percentage is indicative of sound compliance management including, for example, provision of convenient payment methods and effective follow-up of overdue amounts. Assessed scores are shown in Table 15 followed by an explanation of reasons underlying the assessment.
Table 15. Slovakia: P5-14 Assessment
Measurement Dimensions Scoring Method
Score 2018
P5-14-1. The number of VAT payments made by the statutory due date in percent of the total number of payments due. M1
A B P5-14-2. The value of VAT payments made by the statutory due date in
percent of the total value of VAT payments due. B Compliance levels for the timely payment of VAT are healthy. VAT payments are made either monthly or quarterly, depending on turnover in the previous year. Taxpayers with a turnover of less than €100,000 in the previous year can pay and file quarterly otherwise the obligation is to file a VAT declaration and make payments monthly. Table 10 of Attachment III shows that 94.4 percent of the number of VAT payments due is received on time and 89.4 percent of the value of VAT payments due is paid on time. P5-15: Stock and flow of tax arrears This indicator examines the extent of accumulated tax arrears. Two measurement dimensions are used to gauge the size of the administration’s tax arrears inventory: (1) the ratio of end-year tax arrears to the denominator of annual tax collections; and (2) the more refined ratio of end-year ‘collectible tax arrears’ to annual collections.9 A third measurement dimension looks at the extent of unpaid tax liabilities that are more than a year overdue (a high percentage may indicate poor debt collection practices and performance given that the rate of recovery of tax arrears tends to decline as arrears get older). Assessed scores are shown in Table 16 followed by an explanation of reasons underlying the assessment.
9 For purposes of this ratio, ’collectible’ tax arrears is defined as total domestic tax arrears excluding: (a) amounts formally disputed by the taxpayer and for which collection action has been suspended pending the outcome, (b) amounts that are not legally recoverable (e.g., debt foregone through bankruptcy), and (c) arrears otherwise uncollectible (e.g., the debtor has no funds or other assets).

28
Table 16. Slovakia: P5-15 Assessment
Measurement Dimensions Scoring Method
Score 2018
P5-15-1. The value of total core tax arrears at fiscal year-end as a percentage of total core tax revenue collections for the fiscal year.
M2
C
C P5-15-2. The value of collectible core tax arrears at fiscal year-end as a percentage of total core tax revenue collections for the fiscal year. B
P5-15-3. The value of core tax arrears more than 12 months’ old as a percentage of the value of all core tax arrears. D
Overall performance on tax arrears collection is relatively weak. Table 11 of Attachment III shows the following average results over the three-year period 2015-2017:
• The average value of total core tax arrears as a percentage of core tax revenue collections is 27.1 percent.
• The average proportion of collectible core tax arrears as a percentage of total core tax revenue collections is of 5.1 percent.
• The average value of core tax arrears more than twelve months old— relative to the value of total tax arrears—is 77.7 percent.
POA 6: Accurate Reporting in Declarations
Tax systems rely heavily on complete and accurate reporting of information by taxpayers in tax declarations. Tax administrations therefore need to regularly monitor tax revenue losses from inaccurate reporting, especially by business taxpayers, and take a range of actions to ensure compliance. These actions fall into two broad groups: verification activities (e.g., tax audits, investigations, and income matching against third party information sources) and proactive initiatives (e.g., taxpayer assistance and education as covered in POA 3, and cooperative compliance approaches). If well designed and managed, tax audit programs can have far wider impact than simply raising additional revenue from discrepancies detected by tax audits. Detecting and penalizing serious offenders serves to remind all taxpayers of the consequences of inaccurate reporting. Also prominent in modern tax administration is high-volume automated crosschecking of amounts reported in tax declarations with third party information. Because of the high cost and relative low coverage rates associated with traditional audit methods, tax administrations are increasingly using technology to screen large numbers of taxpayer records to detect discrepancies and encourage correct reporting.
29
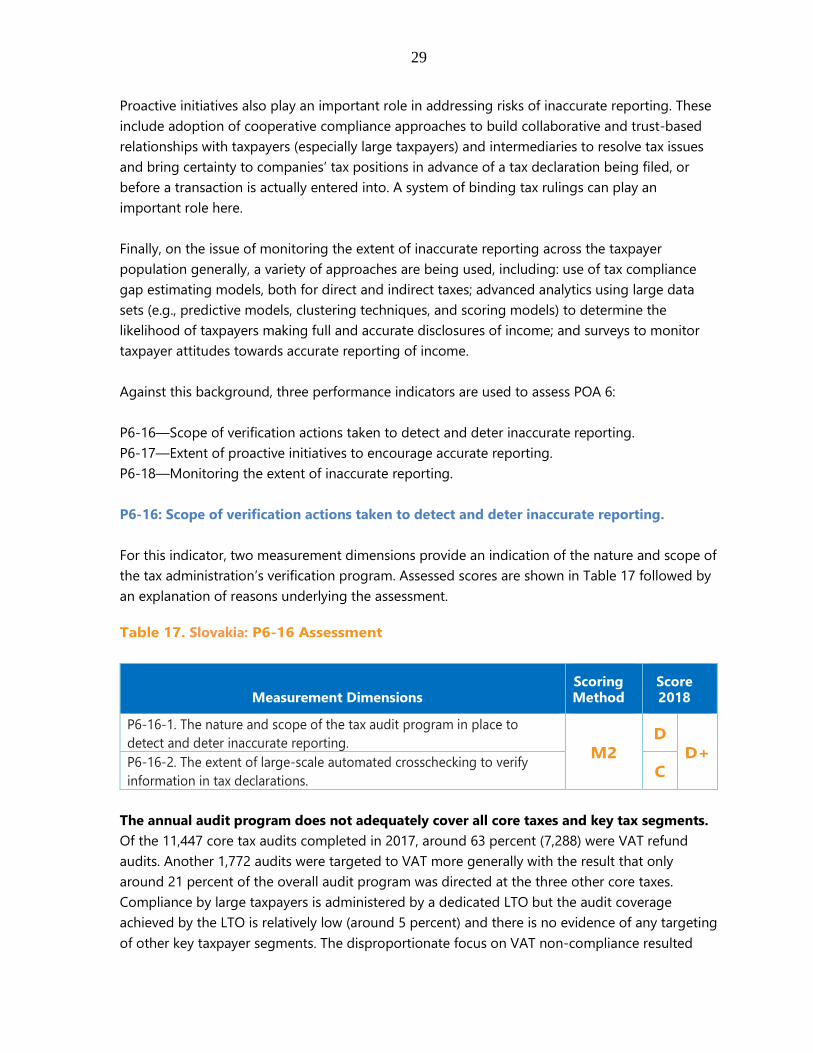
Proactive initiatives also play an important role in addressing risks of inaccurate reporting. These include adoption of cooperative compliance approaches to build collaborative and trust-based relationships with taxpayers (especially large taxpayers) and intermediaries to resolve tax issues and bring certainty to companies’ tax positions in advance of a tax declaration being filed, or before a transaction is actually entered into. A system of binding tax rulings can play an important role here. Finally, on the issue of monitoring the extent of inaccurate reporting across the taxpayer population generally, a variety of approaches are being used, including: use of tax compliance gap estimating models, both for direct and indirect taxes; advanced analytics using large data sets (e.g., predictive models, clustering techniques, and scoring models) to determine the likelihood of taxpayers making full and accurate disclosures of income; and surveys to monitor taxpayer attitudes towards accurate reporting of income. Against this background, three performance indicators are used to assess POA 6: P6-16—Scope of verification actions taken to detect and deter inaccurate reporting. P6-17—Extent of proactive initiatives to encourage accurate reporting. P6-18—Monitoring the extent of inaccurate reporting. P6-16: Scope of verification actions taken to detect and deter inaccurate reporting. For this indicator, two measurement dimensions provide an indication of the nature and scope of the tax administration’s verification program. Assessed scores are shown in Table 17 followed by an explanation of reasons underlying the assessment.
Table 17. Slovakia: P6-16 Assessment
The annual audit program does not adequately cover all core taxes and key tax segments. Of the 11,447 core tax audits completed in 2017, around 63 percent (7,288) were VAT refund audits. Another 1,772 audits were targeted to VAT more generally with the result that only around 21 percent of the overall audit program was directed at the three other core taxes. Compliance by large taxpayers is administered by a dedicated LTO but the audit coverage achieved by the LTO is relatively low (around 5 percent) and there is no evidence of any targeting of other key taxpayer segments. The disproportionate focus on VAT non-compliance resulted
Measurement Dimensions Scoring Method
Score 2018
P6-16-1. The nature and scope of the tax audit program in place to detect and deter inaccurate reporting. M2
D D+ P6-16-2. The extent of large-scale automated crosschecking to verify
information in tax declarations. C
30
from concerns about the very high VAT gap which has been reduced significantly in recent years. A gradual rebalancing of the audit program commenced in 2017. Audit cases are selected centrally on the basis of risk but are heavily weighted towards VAT. The above analysis shows that the risk criteria are principally focused on VAT risks (especially refunds). For the eight field tax offices all VAT cases are selected centrally, although around 30 percent of these cases result from proposals submitted to headquarters for approval. In the case of the LTO, all VAT cases are centrally selected but around 90 percent of CIT cases are selected by the LTO following in-depth risk reviews. A range of audit types and audit methodologies is used. Audit types include comprehensive audits, specific issue audits and VAT refund checks. In recent times, the emphasis has been on specific issue audits and VAT refund audits. Auditors are authorized under the law to apply certain indirect audit methodologies where taxpayers fail to cooperate. The overall effectiveness of the audit program is not evaluated. Audit results are analyzed to measure efficiency but there are no evaluations of the overall impact of the audit program on taxpayer compliance levels. Large scale automated cross-checking of data from internal and external sources is undertaken to verify information in tax declarations. Amounts reported in PIT and CIT declarations are cross-matched on a large scale automated basis with data from employers, VAT declarations, register of financial statements and customs. Verification and risk models have been developed for PIT and CIT.
P6-17: Extent of proactive initiatives to encourage accurate reporting This indicator assesses the nature and scope of cooperative compliance and other proactive initiatives undertaken to encourage accurate reporting. Assessed scores are shown in Table 18 followed by an explanation of reasons underlying the assessment. Table 18. Slovakia: P6-17 Assessment
Measurement Dimensions Scoring Method
Score 2018
P6-17. The nature and scope of proactive initiatives undertaken to encourage accurate reporting. M1 C
Binding general rulings are published on a regular basis on the FASR’s website and intranet. The MoF also publishes binding general rulings but these are made on an infrequent basis (e.g., most recently on the taxation of cryptocurrency) and generally aim to clarify policy positions related to new legislation.

31
A viable system of binding private interpretive rulings is not in place. By law, taxpayers may pay a fee to receive a private binding ruling but, in practice, only two such rulings have been issued on core taxes since 2015—one on VAT and one on CIT. The principal reason cited for the lack of interest from taxpayers is the high cost—until recently between €4,000 and €30,000 depending on the nature and scale of the issue. These costs have been halved from the start of 2018 but this has not triggered more requests. This is not considered to represent a viable private binding rulings system of the kind envisaged by TADAT. Advance Pricing Agreements (APA) are also available and are subject to a similar fee structure. In 2017, ten APAs were requested with seven of these finalized in the same year. A program of “soft warnings” commenced in December 2017 to promote accurate reporting. This includes reminders to taxpayers that the outcomes from VAT audits should be taken into account when filing income tax declarations and highlights information about differences detected between VAT declarations and VAT control statements. The FASR has not entered into any cooperative compliance arrangements with taxpayers. A project is underway to examine international practice for both tax and customs operations. The project is still at an early stage of development and no final decisions have yet been made on the scope of such arrangements or qualifying criteria for taxpayers. P6-18: Monitoring the extent of inaccurate reporting This indicator examines the soundness of methods used by the tax administration to monitor the extent of inaccurate reporting in declarations. The assessed score is shown in Table 19 followed by an explanation of reasons underlying the assessment. Table 19. Slovakia: P6-18 Assessment
Measurement Dimensions Scoring Method
Score 2018
P6-18. The soundness of the method/s used by the tax administration to monitor the extent of inaccurate reporting. M1 B
The tax gaps for VAT and CIT are estimated using internationally accepted methodologies; but only the VAT gap has been used to design compliance initiatives. Tax gap estimates are conducted on a regular basis for both VAT and CIT using methodologies developed by the IMF and the EU. The results of the VAT gap estimates have influenced the design of compliance interventions to improve accuracy of reporting such as introduction of the VAT control statements, reverse-charging mechanism, and several proposals for changes to the VAT law. Analysis of the CIT gap estimates is at a much earlier stage and there is no documented evidence of compliance improvement initiatives emanating from this work.

32
POA 7: Effective Tax Dispute Resolution
This POA deals with the process by which a taxpayer seeks an independent review, on grounds of facts or interpretation of the law, of a tax assessment resulting from an audit. Above all, a tax dispute process must safeguard a taxpayer’s right to challenge a tax assessment and get a fair hearing. The process should be based on a legal framework, be known and understood by taxpayers, be easily accessible, guarantee transparent independent decision-making, and resolve disputed matters in a timely manner. Three performance indicators are used to assess POA 7: • P7-19—Existence of an independent, workable, and graduated dispute resolution process. • P7-20—Time taken to resolve disputes. • P7-21—Degree to which dispute outcomes are acted upon.
P7-19: Existence of an independent, workable, and graduated resolution process For this indicator three measurement dimensions assess (1) the extent to which a dispute may be escalated to an independent external tribunal or court where a taxpayer is dissatisfied with the result of the tax administration’s review process; (2) the extent to which the tax administration’s review process is truly independent; and (3) the extent to which taxpayers are informed of their rights and avenues of review. Assessed scores are shown in Table 20 followed by an explanation of reasons underlying the assessment.
Table 20. Slovakia: P7-19 Assessment
Measurement Dimensions Scoring Method
Score 2018
P7-19-1. The extent to which an appropriately graduated mechanism of administrative and judicial review is available to, and used by, taxpayers.
M2
C
C P7-19-2. Whether the administrative review mechanism is independent of the audit process. D P7-19-3. Whether information on the dispute process is published, and whether taxpayers are explicitly made aware of it. B
A tiered review mechanism is in place but the administrative review process is multi-layered and there is no specialist tax tribunal or specialist court. Appeals are subject to a first instance administrative review by the Tax Office that issued the assessment. If the appeal is not resolved at the first instance, it is passed to the Tax Proceedings Directorate (TPD) for a second instance administrative review. The TPD is physically and organizationally independent of the audit function. Taxpayers dissatisfied with the decision of the TPD may appeal to generalist lower courts. A final appeal may be made to the Supreme Court.

33
The formal dispute process is used. Table 12 of attachment III indicates wide usage of the appeals process. Over 4,000 appeals were dealt with by the TPD in 2017 and taxpayers proceeded to appeal to the courts against a decision of the FASR in 773 cases. While the TPD is physically and organizationally independent within the FASR, case auditors are involved in administrative reviews. The director of the TPD reports to the vice-president of the FASR and manages the headquarters and eight regional office units with 87 staff in total. The TPD and its regional units are physically and organizationally separate from the audit departments of the FASR. However, auditors are directly involved in the first instance administrative review. The TPD may request the Tax Office to conduct an oral hearing with the taxpayer which may be conducted by the auditor that raised the disputed assessment. Information on dispute rights and procedures is published, but there are no written instructions to auditors to inform taxpayers of their appeal rights. Information on dispute rights is publicly available on the FASR’s website, both in links to administrative review procedures and to the law. Information on dispute rights and procedures are included in notices of assessment and in notifications of administrative review decisions. The audit finalization letter contains information on the right to respond to the findings of the audit before the issuance of the notice of assessment. There are, however, no written instructions which require auditors to explicitly inform taxpayers of dispute rights and procedures. P7-20: Time taken to resolve disputes This indicator assesses how responsive the tax administration is in completing administrative reviews. Assessed scores are shown in Table 21 followed by an explanation of reasons underlying the assessment. Table 21. Slovakia: P7-20 Assessment
Measurement Dimensions
Scoring
Method
Score 2018
P7-20. The time taken to complete administrative reviews. M1 D Data provided on the time taken to complete administrative reviews is insufficient to assess performance against this indicator. The data provided reflects all reviews conducted within the TPD, including appeals against assessments of non-core taxes and charges. Furthermore, the time taken for the reviews is calculated from the date of receipt of the taxpayer’s file by the TPD, rather than the date the appeal is received by the Tax Office. In addition, the completion of the TPD’s review does not always result in a final decision. Around 25
34
percent of the reviewed cases were returned to the first instance reviewer for renewed proceedings in 2017. P7-21: Degree to which dispute outcomes are acted upon This indicator looks at the extent to which dispute outcomes are taken into account in determining policy, legislation, and administrative procedure. The assessed score is shown in Table 22 followed by an explanation of reasons underlying the assessment.
Table 22. Slovakia: P7-21 Assessment
Measurement Dimensions Scoring Method
Score 2018
P7-21. The extent to which the tax administration responds to dispute outcomes. M1 C
Dispute outcomes of a material nature are analyzed on an ad hoc basis. The TPD provides tax offices with court decisions concerning taxpayers in their geographical jurisdiction and delivers training on dispute outcomes of a material or systemic nature. The TPD also cooperates with the Methodological Department in preparing the annual handbook on taxation as well as in providing analysis and follow-up input into the formulation of both legislative and procedural policy changes arising from the appeal process. However, these activities are conducted on an ad hoc basis. Examples include cooperation in fighting VAT fraud and introducing a reverse charge mechanism. Decision impact statements of dispute outcomes are not routinely prepared.
POA 8: Efficient Revenue Management
This POA focuses on three key activities performed by tax administrations in relation to revenue management: • Providing input to government budgeting processes of tax revenue forecasting and tax
revenue estimating. (As a general rule, primary responsibility for advising government on tax revenue forecasts and estimates rests with the Ministry of Finance. The tax administration provides data and analytical input to the forecasting and estimating processes. Ministries of Finance often set operational revenue collection targets for the tax administration based on forecasts of revenue for different taxes).10
• Maintaining a system of revenue accounts. • Paying tax refunds.
10 It is common for Ministries of Finance to review budget revenue forecasts and related tax collection targets during the fiscal year (particularly mid-year) to take account of changes in forecasting assumptions, especially changes in the macroeconomic environment.

35
Three performance indicators are used to assess POA 8: • P8-22—Contribution to government tax revenue forecasting process. • P8-23—Adequacy of the tax revenue accounting system. • P8-24—Adequacy of tax refund processing.
P8-22: Contribution to government tax revenue forecasting process This indicator assesses the extent of tax administration input to government tax revenue forecasting and estimating. The assessed score is shown in Table 23 followed by an explanation of reasons underlying the assessment. Table 23. Slovakia: P8-22 Assessment
Measurement Dimensions Scoring Method
Score 2018
P8-22. The extent of tax administration input to government tax revenue forecasting and estimating. M1 B The tax administration routinely provides input to government tax revenue forecasting and estimating processes. A dedicated organizational unit within the FASR is responsible for gathering and analyzing data on tax revenue collections and economic conditions to provide input to the Government’s monthly monitoring and budgetary process. The FASR also monitors tax revenue collections against revenue forecasts and reports findings to the MoF each month. All significant variances from the forecasts are investigated and reported. Staff from the administration’s revenue analysis area meet monthly with the MoF and, as required, to provide input to the government budgetary processes. The outcomes from each meeting are documented. VAT refund levels are monitored and reported to the State Treasury. The State Treasury in cooperation with the Debt and Liquidity Agency uses this data to manage the government’s cash flow. Tax expenditures are closely monitored, but the stock of losses carried forward by taxpayers from year-to-year is not monitored and reported. MoF revenue analysis staff has access to FASR data for purposes of monitoring revenue foregone from tax expenditures and publishes estimates on a regular basis. However, while the stock of losses carried forward can be derived from the tax administration’s internal data holdings, the amount of tax losses that may be set off against future tax liabilities is not monitored and reported.

36
P8-23: Adequacy of the tax revenue accounting system
This indicator examines the adequacy of the tax revenue accounting system. Assessed scores are shown in Table 24 followed by an explanation of reasons underlying the assessment.
Table 24. Slovakia: P8-23 Assessment
Measurement Dimensions Scoring Method
Score 2018
P8-23. Adequacy of the tax administration’s revenue accounting system. M1 C
The FASR’s revenue accounting system appears sound, but internal audit does not provide assurance of the system’s alignment with tax laws. The automated accounting system meets government accounting standards and it interfaces with the MoF’s revenue accounting system. Payment of all taxes is made electronically into designated public revenue accounts in the State Treasury. All account transactions are posted to each taxpayer’s account on the FASR’s accounting system the following day. Transactions posted to the suspense account (where posting to a taxpayers account could not be made automatically) are reviewed daily. While the FASR’s accounting system appears to be operating effectively, there was no evidence of any assurance by internal audit that it is in conformity with tax laws. P8-24: Adequacy of tax refund processing
For this indicator, two measurement dimensions assess the tax administration’s system of processing VAT refund claims. Assessed scores are shown in Table 25 followed by an explanation of reasons underlying the assessment.
Table 25. Slovakia: P8-24 Assessment
Measurement Dimensions Scoring Method
Score 2018
P8-24-1. Adequacy of the VAT refund system. M2
B C P8-24-2. The time taken to pay (or offset) VAT refunds.
D The VAT refund system is sound, but full interest is not paid on cases selected for pre-issue audit. An automated risk assessment that uses a range of criteria is undertaken to identify high-risk claims. In most cases high risk claims are subject to an audit before a claim is approved for payment. Budget funds are allocated to meet all legitimate refund claims when they occur. There have not been any instances in which VAT refunds approved for payment have been delayed due to insufficient funds being available. VAT credits are offset against the following period’s liability

37
or other tax debts. Any taxpayer may self-select an accelerated refund process provided the taxpayer has been registered for at least twelve months, has no tax arrears, and has a good compliance history. The take-up rate for the accelerated refund option is low. Interest is paid on overdue refunds. However, where cases are selected for pre-issue audit, interest only accrues from ten days after the finalization of the audit, even where no adjustment has been made to the claim as a result of the audit. No data was available on the number of VAT refunds paid within 30 calendar days from the time the claim is received. The FASR does not measure the elapsed time taken to pay, offset or decline a VAT refund claim from the time a claim was received.
POA 9: Accountability and Transparency
Accountability and transparency are central pillars of good governance. Their institutionalization reflects the principle that tax administrations should be answerable for the way they use public resources and exercise authority. To enhance community confidence and trust, tax administrations should be openly accountable for their actions within a framework of responsibility to the minister, government, legislature, and the general public. Four performance indicators are used to assess POA 9: • P9-25—Internal assurance mechanisms. • P9-26—External oversight of the tax administration. • P9-27—Public perception of integrity. • P9-28—Publication of activities, results, and plans. P9-25: Internal assurance mechanisms
For this indicator, two measurement dimensions assess the internal assurance mechanisms in place to protect the tax administration from loss, error, and fraud. Assessed scores are shown in Table 26 followed by an explanation of reasons underlying the assessment. Table 26. Slovakia: P9-25 Assessment
Measurement Dimensions Scoring Method
Score 2018
P9-25-1. Assurance provided by internal audit. M2
C C P9-25-2. Staff integrity assurance mechanisms.
C
38
There is an organizationally independent internal audit department but it does not report directly to an audit committee. The internal audit department together with the internal investigation department form the ‘Inspection and Internal Control Section’, which reports directly to the President of the FASR. The internal audit department has 34 staff, including the director. All staff receive regular training. There is an annual internal audit plan but coverage does not include IT systems and there is no independent review of internal audit operations. The framework for the internal audit function in all public bodies is regulated by law and provides for a wide range of system audits as well as performance and financial audits. The internal audit department conducts a range of audits each year but these do not include IT system audits. Internal control policies and procedures are adequately documented and kept in a central repository. Audit trails of user access and changes made to taxpayer data are in place, but there is no surveillance by internal audit of system-generated reports to detect incidents that may threaten the confidentiality and integrity of tax administration data. There is no independent review of internal audit operations and systems.
The internal investigation (anti-corruption) department reports directly to the President. The internal investigation department has five units with 46 staff in total and is responsible for the detection and prevention of corruption and integrity breaches by FASR’s staff.
The internal investigation department has appropriate powers and cooperates with relevant enforcement agencies, but does not lead the formulation of integrity policies. The investigative powers available to the internal investigation department are sufficient and, in case of suspected criminality, the department involves the police for the use of criminal investigation powers. There are general framework agreements in place with the police and other enforcement agencies, facilitating regular contacts and cooperation. The internal investigation department does not provide leadership in the formulation of integrity policies within the FASR. The internal investigation department maintains integrity related statistics for the organization, but only high level aggregate information is included in the annual report. P9-26: External oversight of the tax administration
Two measurement dimensions of this indicator assess (1) the extent of independent external oversight of the tax administration’s operations and financial performance; and (2) the investigation process for suspected wrongdoing and maladministration. Assessed scores are shown in Table 27 followed by an explanation of reasons underlying the assessment.

39
Table 27. Slovakia: P9-26 Assessment
Measurement Dimensions Scoring Method
Score 2018
P9-26-1. The extent of independent external oversight of the tax administration’s operations and financial performance. M2
B C P9-26-2. The investigation process for suspected wrongdoing and
maladministration. D
External audits of financial statements and elements of operational performance are conducted annually, but the FASR’s responses to the audit findings are not published. The administrative budget of the FASR forms part of the MoF financial statements which are independently audited on an annual basis. The Supreme Audit Office regularly carries out audits of the FASR’s operational performance, and elements of operational performance are also audited by the MoF on an annual basis. External review findings are responded to but the FASR responses are not publicly reported. Complaints from taxpayers about treatment they have received from the FASR are not investigated by an ombudsman or any equivalent body. The “Public Defender of Rights” in Slovakia has competence to investigate alleged breaches of fundamental rights and freedoms contrary to legal principles and the rule of law, by a public administration body. The FASR staff interviewed were not aware of any investigation by the Public Defender of a taxpayer complaint relating to alleged wrongdoing or maladministration on the part of the FASR. The national anti-corruption unit does not oversee the FASR’s policies in this area. A specialized anti-corruption unit within Slovakia’s Police Force investigates the most serious cases of alleged corrupt conduct by tax officials. While there is cooperation and exchange of information between the FASR and the anti-corruption unit, that unit has no role in overseeing the FASR’s anti-corruption policies. P9-27: Public perception of integrity
This indicator examines measures taken to gauge public confidence in the tax administration. The assessed score is shown in Table 28 followed by an explanation of reasons underlying the assessment.

40
Table 28. Slovakia: P9-27 Assessment
Measurement Dimensions Scoring Method
Score 2018
P9-27. The mechanism for monitoring public confidence in the tax administration. M1 D
Currently no statistically valid taxpayer surveys are undertaken to monitor trends in public confidence in the tax administration. However, the FASR continuously seeks and monitors taxpayer feedback on its call center service though a customer satisfaction feedback tool provided by an external company (Staffino). Taxpayer feedback is also received from business representatives and tax intermediaries in the Advisory Board to the President of the FASR. P9-28: Publication of activities, results, and plans
Two measurement dimensions of this indicator assess the extent of (1) public reporting of financial and operational performance; and (2) publication of future directions and plans. Assessed scores are shown in Table 29 followed by an explanation of reasons underlying the assessment. Table 29. Slovakia: P9-28 Assessment
Measurement Dimensions Scoring Method
Score 2018
P9-28-1. The extent to which the financial and operational performance of the tax administration is made public, and the timeliness of publication. M2
A B P9-28-2. The extent to which the tax administration’s future directions and
plans are made public, and the timeliness of publication. C The FASR publishes its annual reports within three months of the end of the fiscal year but the publication of strategic and operational plans is limited. The FASR produces annual reports outlining the full financial and operational performance of the tax administration and makes them public on its website within three months of the end of the fiscal year. Strategic and operational plans are not published, but elements of the strategic plan are included in the annual reports.

41
Attachment I. TADAT Framework Performance outcome areas
TADAT assesses the performance of a country’s tax administration system by reference to nine outcome areas:
1. Integrity of the registered taxpayer base: Registration of taxpayers and maintenance of a complete and accurate taxpayer database is fundamental to effective tax administration.
2. Effective risk management: Performance improves when risks to revenue and tax administration operations are identified and systematically managed.
3. Support given to taxpayers to help them comply: Usually, most taxpayers will meet their tax obligations if they are given the necessary information and support to enable them to comply voluntarily.
4. On-time filing of declarations: Timely filing is essential because the filing of a tax declaration is a principal means by which a taxpayer’s tax liability is established and becomes due and payable.
5. On-time payment of taxes: Nonpayment and late payment of taxes can have a detrimental effect on government budgets and cash management. Collection of tax arrears is costly and time consuming.
6. Accuracy of information reported in tax declarations: Tax systems rely heavily on complete and accurate reporting of information in tax declarations. Audit and other verification activities and proactive initiatives of taxpayer assistance, promote accurate reporting and mitigate tax fraud.
7. Adequacy of dispute resolution processes: Independent accessible, and efficient review mechanisms safeguard a taxpayer’s right to challenge a tax assessment and get a fair hearing in a timely manner.
8. Efficient revenue management: Tax revenue collections must be fully accounted for, monitored against budget expectations, and analyzed to inform government revenue forecasting. Legitimate tax refunds to individuals and businesses must be paid promptly.
42
9. Accountability and transparency: As public institutions, tax administrations are answerable for the way they use public resources and exercise authority. Community confidence and trust are enhanced when there is open accountability for administrative actions within a framework of responsibility to the minister, legislature, and general community.
Indicators and associated measurement dimensions
A set of 28 high-level indicators critical to tax administration performance are linked to the performance outcome areas. It is these indicators that are scored and reported on. A total of 47 measurement dimensions are taken into account in arriving at the indicator scores. Each indicator has between one and four measurement dimensions.
Repeated assessments will provide information on the extent to which a country’s tax administration is improving.
Scoring methodology
The assessment of indicators follows the same approach followed in the Public Expenditure and Financial Accountability (PEFA) diagnostic tool so as to aid comparability where both tools are used.
Each of TADAT’s 47 measurement dimensions is assessed separately. The overall score for an indicator is based on the assessment of the individual dimensions of the indicator. Combining the scores for dimensions into an overall score for an indicator is done using one of two methods: Method 1 (M1) or Method 2 (M2). For both M1 and M2, the four-point ‘ABCD’ scale is used to score each dimension and indicator.
Method M1 is used for all single dimensional indicators and for multi-dimensional indicators where poor performance on one dimension of the indicator is likely to undermine the impact of good performance on other dimensions of the same indicator (in other words, by the weakest link in the connected dimensions of the indicator).
Method M2 is based on averaging the scores for individual dimensions of an indicator. It is used for selected multi-dimensional indicators where a low score on one dimension of the indicator does not necessarily undermine the impact of higher scores on other dimensions for the same indicator.

43
Attachment II. Country Snapshot
Geography Slovakia, with a land area of approximately 49,000 km2, is a landlocked country in central Europe bordered by the Czech Republic and Austria to the west, Poland to the north, Ukraine to the east and Hungary to the south. Most of the country is rugged and mountainous, with lowlands to the south. The climate is temperate, with cold winters. The capital and largest city is Bratislava.
Population 5,443,120 as of December 2017 (Source: Statistical Office of the Slovak Republic)
Adult literacy rate
99.6 percent in 2016 (Source: Global Information Technology Report 2016 – World Economic Forum)
Gross Domestic Product
$89.77 billion in 2016 (Source: World Bank)
Gross National Income per capita
$16,800 in 2016 (Source: World Bank—based on Atlas method)
Main industries Automobiles, metals, electricity, gas, oil, nuclear fuels, chemicals, fibers, wood and paper, machinery, ceramics, textiles, electrical and optical, rubber products, food/drink, pharmaceuticals. (Source: CIA World Factbook)
Communications • Internet users per 100 people: 80.5 (est. 2016) • Mobile phone subscriptions per 100 people: 120 (est. 2016)
(Source: CIA World Factbook) Main taxes VAT, CIT, PIT and Excises. Tax-to-GDP 16.8 percent (2017) Number of taxpayers
CIT 247,426; PIT 615,1241; PAYE Withholding (Employers) 269,677; VAT 187, 854. (Number of active taxpayers 2017)
Main collection agency
FASR (Website https://www.financnasprava.sk)
Number of staff in the main collection agency
Approximately 9,300.
Financial Year Calendar year
1 Excluding PIT taxpayers not obliged to file a tax declaration (because liability fully satisfied by PAYE or other withholding arrangements).
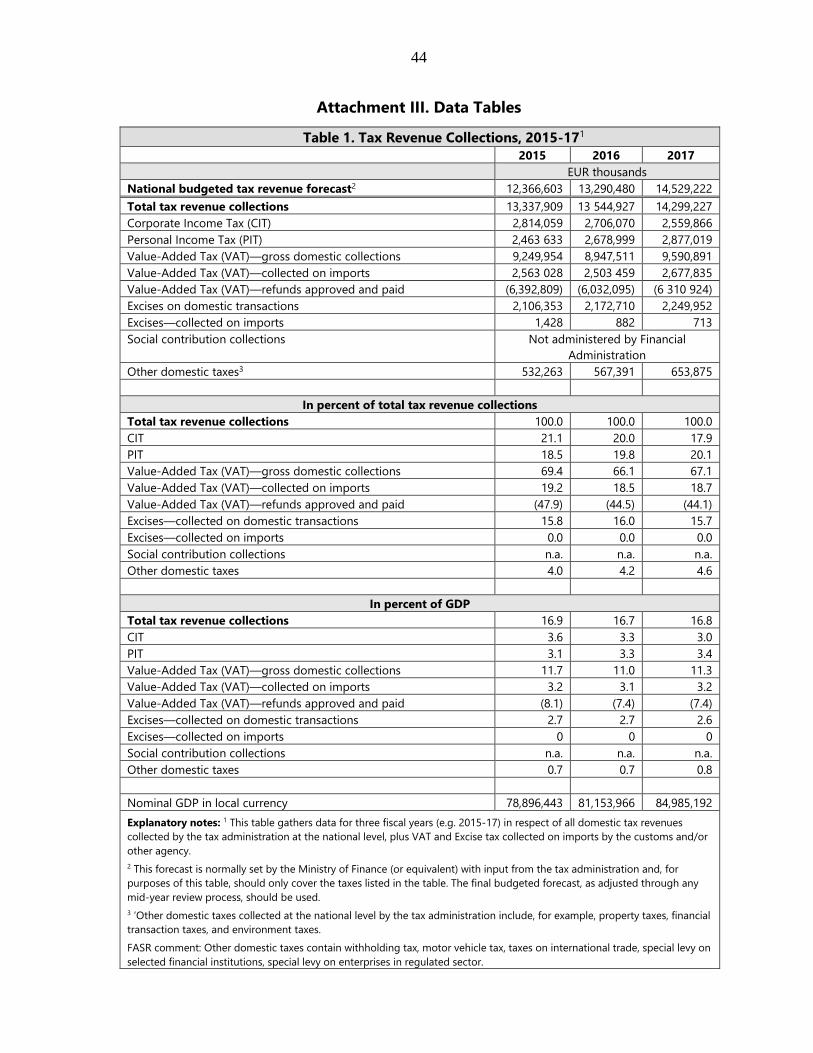
44
Attachment III. Data Tables
Table 1. Tax Revenue Collections, 2015-171 2015 2016 2017
EUR thousands National budgeted tax revenue forecast2 12,366,603 13,290,480 14,529,222 Total tax revenue collections 13,337,909 13 544,927 14,299,227 Corporate Income Tax (CIT) 2,814,059 2,706,070 2,559,866 Personal Income Tax (PIT) 2,463 633 2,678,999 2,877,019 Value-Added Tax (VAT)—gross domestic collections 9,249,954 8,947,511 9,590,891 Value-Added Tax (VAT)—collected on imports 2,563 028 2,503 459 2,677,835 Value-Added Tax (VAT)—refunds approved and paid (6,392,809) (6,032,095) (6 310 924) Excises on domestic transactions 2,106,353 2,172,710 2,249,952 Excises—collected on imports 1,428 882 713 Social contribution collections Not administered by Financial
Administration Other domestic taxes3 532,263 567,391 653,875
In percent of total tax revenue collections Total tax revenue collections 100.0 100.0 100.0 CIT 21.1 20.0 17.9 PIT 18.5 19.8 20.1 Value-Added Tax (VAT)—gross domestic collections 69.4 66.1 67.1 Value-Added Tax (VAT)—collected on imports 19.2 18.5 18.7 Value-Added Tax (VAT)—refunds approved and paid (47.9) (44.5) (44.1) Excises—collected on domestic transactions 15.8 16.0 15.7 Excises—collected on imports 0.0 0.0 0.0 Social contribution collections n.a. n.a. n.a. Other domestic taxes 4.0 4.2 4.6
In percent of GDP Total tax revenue collections 16.9 16.7 16.8 CIT 3.6 3.3 3.0 PIT 3.1 3.3 3.4 Value-Added Tax (VAT)—gross domestic collections 11.7 11.0 11.3 Value-Added Tax (VAT)—collected on imports 3.2 3.1 3.2 Value-Added Tax (VAT)—refunds approved and paid (8.1) (7.4) (7.4) Excises—collected on domestic transactions 2.7 2.7 2.6 Excises—collected on imports 0 0 0 Social contribution collections n.a. n.a. n.a. Other domestic taxes 0.7 0.7 0.8 Nominal GDP in local currency 78,896,443 81,153,966 84,985,192 Explanatory notes: 1 This table gathers data for three fiscal years (e.g. 2015-17) in respect of all domestic tax revenues collected by the tax administration at the national level, plus VAT and Excise tax collected on imports by the customs and/or other agency. 2 This forecast is normally set by the Ministry of Finance (or equivalent) with input from the tax administration and, for purposes of this table, should only cover the taxes listed in the table. The final budgeted forecast, as adjusted through any mid-year review process, should be used. 3 ’Other domestic taxes collected at the national level by the tax administration include, for example, property taxes, financial transaction taxes, and environment taxes. FASR comment: Other domestic taxes contain withholding tax, motor vehicle tax, taxes on international trade, special levy on selected financial institutions, special levy on enterprises in regulated sector.

45
Table 2. Movements in the Taxpayer Register, 2015-17
(Ref: POA1)
Active1,2 [A]
Inactive (not yet
deregistered) [B]
Total end-year
position [A + B]
Percentage of inactive
(not yet deregistered)
Deregistered during the
year
2015 Corporate income tax 236,667 236,667 8,898 Personal income tax B 635,636 635,636 41,326 PAYE withholding (# of employers) 267,702 267,702 15,620
Value Added Tax 185,429 185,429 11,374 Domestic excise tax Other taxpayers 2016 Corporate income tax 239,095 239,095 8,947 Personal income tax B 596,000 596,000 40,591 PAYE withholding (# of employers) 268,792 268,792 15,269
Value Added Tax 185,790 185,790 12,967 Domestic excise tax Other taxpayers 2017 Corporate income tax 247,426 247,426 8,894 Personal income tax B 615,125 615,125 38,924 PAYE withholding (# of employers) 269,677 269,677 14,690
Value Added Tax 187,854 187,854 12,581 Domestic excise tax Other taxpayers
Explanatory Note: 1’Active’ taxpayers means registrants from whom tax declarations (returns) are expected (i.e. ‘active’ taxpayers exclude those who have not filed a declaration within at least the last year because the case is defunct (e.g., a business taxpayer has ceased trading or an individual is deceased), the taxpayer cannot be located, or the taxpayer is insolvent). 2’Includes inactive as well.

46
Table 3. Telephone Enquiry Call Waiting Time
(for most recent 12-month period)
(Ref: POA3)
Month Total number of
telephone enquiry calls received
Telephone enquiry calls answered within 6 minutes’ waiting time
Number In percent of total calls
January 19,722 n.a. n.a. February 18,609 n.a. n.a. March 29,865 n.a. n.a. April 13,023 n.a. n.a. May 14,754 n.a. n.a. June 17,762 n.a. n.a. July 11,992 n.a. n.a.
August 11,251 n.a. n.a. September 11,827 n.a. n.a.
October 12,694 n.a. n.a. November 11,230 n.a. n.a. December 12,728 n.a. n.a.
12-month total 185,457 n.a. n.a.
* Financial Administration does not follow number of telephone enquiries answered within 6 minutes
Table 4. On-time Filing of CIT Declarations for 2017
(Ref: POA 4) Number of declarations
filed on-time1 Number of declarations
expected to be filed2 On-time filing rate3
(In percent) All CIT taxpayers 201,742 247,426 81.5 Large taxpayers only 890 934 95.3
Explanatory notes:
1 ‘On-time’ filing means declarations (also known as ‘returns’) filed by the statutory due date for filing (plus any ‘days of grace’ applied by the tax administration as a matter of administrative policy).
2 ‘Expected declarations’ means the number of CIT declarations that the tax administration expected to receive from registered CIT taxpayers that were required by law to file declarations.
3 The ‘on-time filing rate’ is the number of declarations filed by the statutory due date as a percentage of the total number of declarations expected from registered taxpayers, i.e. expressed as a ratio:
𝑁𝑁𝑁𝑁𝑁𝑁𝑁𝑁𝑁𝑁𝑁𝑁 𝑜𝑜𝑜𝑜 𝐶𝐶𝐶𝐶𝐶𝐶 𝑑𝑑𝑁𝑁𝑑𝑑𝑑𝑑𝑑𝑑𝑁𝑁𝑑𝑑𝑑𝑑𝑑𝑑𝑜𝑜𝑑𝑑𝑑𝑑 𝑜𝑜𝑑𝑑𝑑𝑑𝑁𝑁𝑑𝑑 𝑁𝑁𝑏𝑏 𝑑𝑑ℎ𝑁𝑁 𝑑𝑑𝑁𝑁𝑁𝑁 𝑑𝑑𝑑𝑑𝑑𝑑𝑁𝑁 𝑁𝑁𝑁𝑁𝑁𝑁𝑁𝑁𝑁𝑁𝑁𝑁 𝑜𝑜𝑜𝑜𝑑𝑑𝑁𝑁𝑑𝑑𝑑𝑑𝑑𝑑𝑁𝑁𝑑𝑑𝑑𝑑𝑑𝑑𝑜𝑜𝑑𝑑𝑑𝑑 𝑁𝑁𝑒𝑒𝑒𝑒𝑁𝑁𝑑𝑑𝑑𝑑𝑁𝑁𝑑𝑑 𝑜𝑜𝑁𝑁𝑜𝑜𝑁𝑁 𝑁𝑁𝑁𝑁𝑟𝑟𝑑𝑑𝑑𝑑𝑑𝑑𝑁𝑁𝑁𝑁𝑁𝑁𝑑𝑑 𝐶𝐶𝐶𝐶𝐶𝐶 𝑑𝑑𝑑𝑑𝑒𝑒𝑒𝑒𝑑𝑑𝑏𝑏𝑁𝑁𝑁𝑁𝑑𝑑
𝑥𝑥 100
FASR comment: Definition of large taxpayer - Bank and branch of foreign bank, insurance and assurance company, branch of foreign insurance and assurance company. Taxpayer with annual turnover higher than EUR 40 million.

47
Table 5. On-time Filing of PIT Declarations for 2017
(Ref: POA 4) Number of declarations filed on-
time1 Number of declarations expected to
be filed2 On-time filing rate3
(In percent) 470,266 615,125 76.5
Explanatory notes: 1 ‘On-time’ filing means declarations (also known as ‘returns’) filed by the statutory due date for filing (plus any ‘days of grace’ applied by the tax administration as a matter of administrative policy). 2 ‘Expected declarations’ means the number of PIT declarations that the tax administration expected to receive from registered PIT taxpayers that were required by law to file declarations. 3 The ‘on-time filing rate’ is the number of declarations filed by the statutory due date as a percentage of the total number of declarations expected from registered taxpayers, i.e. expressed as a ratio:
𝑁𝑁𝑁𝑁𝑁𝑁𝑁𝑁𝑁𝑁𝑁𝑁 𝑜𝑜𝑜𝑜 𝑃𝑃𝑃𝑃𝑃𝑃 𝑑𝑑𝑁𝑁𝑑𝑑𝑑𝑑𝑑𝑑𝑁𝑁𝑑𝑑𝑑𝑑𝑑𝑑𝑜𝑜𝑑𝑑𝑑𝑑 𝑜𝑜𝑑𝑑𝑑𝑑𝑁𝑁𝑑𝑑 𝑁𝑁𝑏𝑏 𝑑𝑑ℎ𝑁𝑁 𝑑𝑑𝑁𝑁𝑁𝑁 𝑑𝑑𝑑𝑑𝑑𝑑𝑁𝑁 𝑁𝑁𝑁𝑁𝑁𝑁𝑁𝑁𝑁𝑁𝑁𝑁 𝑜𝑜𝑜𝑜 𝑃𝑃𝑃𝑃𝑃𝑃 𝑑𝑑𝑁𝑁𝑑𝑑𝑑𝑑𝑑𝑑𝑁𝑁𝑑𝑑𝑑𝑑𝑑𝑑𝑜𝑜𝑑𝑑𝑑𝑑 𝑁𝑁𝑥𝑥𝑒𝑒𝑁𝑁𝑑𝑑𝑑𝑑𝑁𝑁𝑑𝑑 𝑜𝑜𝑁𝑁𝑜𝑜𝑁𝑁 𝑁𝑁𝑁𝑁𝑟𝑟𝑑𝑑𝑑𝑑𝑑𝑑𝑁𝑁𝑁𝑁𝑁𝑁𝑑𝑑 𝑃𝑃𝑃𝑃𝑃𝑃 𝑑𝑑𝑑𝑑𝑥𝑥𝑒𝑒𝑑𝑑𝑏𝑏𝑁𝑁𝑁𝑁𝑑𝑑
𝑥𝑥 100
Table 6. On-time Filing of VAT Declarations—All taxpayers
(2017) (Ref: POA 4)
Month Number of declarations filed on-time1
Number of declarations expected to be filed2
On-time filing rate3 (In percent)
January 120,927 123,894 97.6 February 121,636 124,326 97.8 March 180,471 185,384 97.3 April 123,372 126,260 97.7 May 123,816 126,756 97.7 June 181,021 186,090 97.3 July 124,880 128,053 97.5
August 125,553 128,523 97.7 September 181,607 186,300 97.5
October 126,635 129,746 97.6 November 126,895 130,034 97.6 December 181,753 186,427 97.5
12-month total 1,718,566 1,761,793 97.5
Explanatory notes: 1 ‘On-time’ filing means declarations filed by the statutory due date for filing (plus any ‘days of grace’ applied by the tax administration as a matter of administrative policy). 2 ‘Expected declarations’ means the number of VAT declarations that the tax administration expected to receive from registered VAT taxpayers that were required by law to file declarations. 3 The ‘on-time filing rate’ is the number of VAT declarations filed by the statutory due date as a percentage of the total number of declarations expected from registered VAT taxpayers, i.e. expressed as a ratio:
𝑁𝑁𝑁𝑁𝑁𝑁𝑁𝑁𝑁𝑁𝑁𝑁 𝑜𝑜𝑜𝑜 𝑉𝑉𝑉𝑉𝑃𝑃 𝑑𝑑𝑁𝑁𝑑𝑑𝑑𝑑𝑑𝑑𝑁𝑁𝑑𝑑𝑑𝑑𝑑𝑑𝑜𝑜𝑑𝑑𝑑𝑑 𝑜𝑜𝑑𝑑𝑑𝑑𝑁𝑁𝑑𝑑 𝑁𝑁𝑏𝑏 𝑑𝑑ℎ𝑁𝑁 𝑑𝑑𝑁𝑁𝑁𝑁 𝑑𝑑𝑑𝑑𝑑𝑑𝑁𝑁 𝑁𝑁𝑁𝑁𝑁𝑁𝑁𝑁𝑁𝑁𝑁𝑁 𝑜𝑜𝑜𝑜 𝑑𝑑𝑁𝑁𝑑𝑑𝑑𝑑𝑑𝑑𝑁𝑁𝑑𝑑𝑑𝑑𝑑𝑑𝑜𝑜𝑑𝑑𝑑𝑑 𝑁𝑁𝑥𝑥𝑒𝑒𝑁𝑁𝑑𝑑𝑑𝑑𝑁𝑁𝑑𝑑 𝑜𝑜𝑁𝑁𝑜𝑜𝑁𝑁 𝑁𝑁𝑁𝑁𝑟𝑟𝑑𝑑𝑑𝑑𝑑𝑑𝑁𝑁𝑁𝑁𝑁𝑁𝑑𝑑 𝑉𝑉𝑉𝑉𝑃𝑃 𝑑𝑑𝑑𝑑𝑥𝑥𝑒𝑒𝑑𝑑𝑏𝑏𝑁𝑁𝑁𝑁𝑑𝑑 𝑥𝑥 100

48
Table 7. On-time Filing of VAT Declarations—Large taxpayers only (2017)
(Ref: POA 4)
Month Number of
declarations filed on-time1
Number of declarations
expected to be filed2
On-time filing rate3 (In percent)
January 769 780 98.6 February 771 778 99.1 March 776 783 99.1 April 765 775 98.7 May 765 770 99.4 June 768 772 99.5 July 762 766 99.5
August 755 765 98.7 September 762 768 99.2
October 759 765 99.2 November 760 765 99.4 December 757 767 98.7
12-month total 9,169 9,254 99.1
Explanatory notes:
1 ‘On-time’ filing means declarations filed by the statutory due date for filing (plus any ‘days of grace’ applied by the tax administration as a matter of administrative policy).
2 ‘Expected declarations’ means the number of VAT declarations that the tax administration expected to receive from large taxpayers that were required by law to file VAT declarations.
3 The ‘on-time filing rate’ is the number of VAT declarations filed by large taxpayers by the statutory due date as a percentage of the total number of VAT declarations expected from large taxpayers, i.e. expressed as a ratio:
𝑁𝑁𝑁𝑁𝑁𝑁𝑁𝑁𝑁𝑁𝑁𝑁 𝑜𝑜𝑜𝑜 𝑉𝑉𝑉𝑉𝑃𝑃 𝑑𝑑𝑁𝑁𝑑𝑑𝑑𝑑𝑑𝑑𝑁𝑁𝑑𝑑𝑑𝑑𝑑𝑑𝑜𝑜𝑑𝑑𝑑𝑑 𝑜𝑜𝑑𝑑𝑑𝑑𝑁𝑁𝑑𝑑 𝑁𝑁𝑏𝑏 𝑑𝑑ℎ𝑁𝑁 𝑑𝑑𝑁𝑁𝑁𝑁 𝑑𝑑𝑑𝑑𝑑𝑑𝑁𝑁 𝑁𝑁𝑏𝑏 𝑑𝑑𝑑𝑑𝑁𝑁𝑟𝑟𝑁𝑁 𝑑𝑑𝑑𝑑𝑥𝑥𝑒𝑒𝑑𝑑𝑏𝑏𝑁𝑁𝑁𝑁𝑑𝑑𝑁𝑁𝑁𝑁𝑁𝑁𝑁𝑁𝑁𝑁𝑁𝑁 𝑜𝑜𝑜𝑜 𝑉𝑉𝑉𝑉𝑃𝑃 𝑑𝑑𝑁𝑁𝑑𝑑𝑑𝑑𝑑𝑑𝑁𝑁𝑑𝑑𝑑𝑑𝑑𝑑𝑜𝑜𝑑𝑑𝑑𝑑 𝑁𝑁𝑥𝑥𝑒𝑒𝑁𝑁𝑑𝑑𝑑𝑑𝑁𝑁𝑑𝑑 𝑜𝑜𝑁𝑁𝑜𝑜𝑁𝑁 𝑑𝑑𝑑𝑑𝑁𝑁𝑟𝑟𝑁𝑁 𝑑𝑑𝑑𝑑𝑥𝑥𝑒𝑒𝑑𝑑𝑏𝑏𝑁𝑁𝑁𝑁𝑑𝑑
𝑥𝑥 100
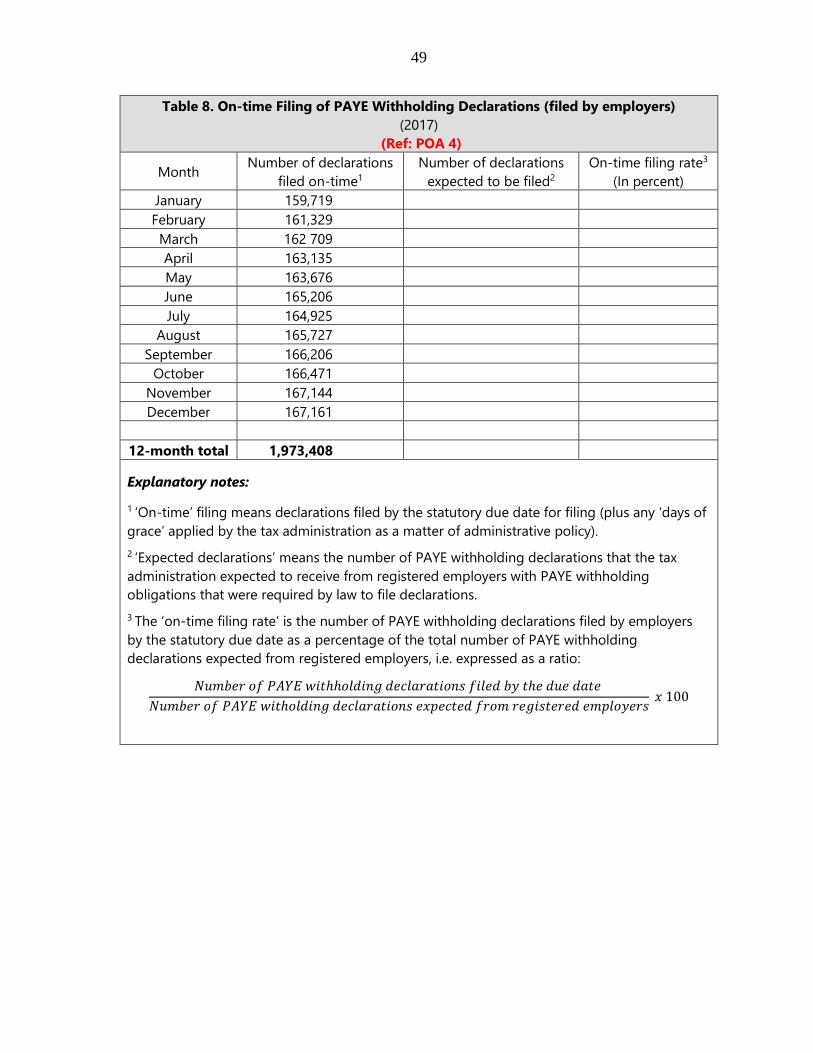
49
Table 8. On-time Filing of PAYE Withholding Declarations (filed by employers) (2017)
(Ref: POA 4)
Month Number of declarations filed on-time1
Number of declarations expected to be filed2
On-time filing rate3 (In percent)
January 159,719 February 161,329 March 162 709 April 163,135 May 163,676 June 165,206 July 164,925
August 165,727 September 166,206
October 166,471 November 167,144 December 167,161
12-month total 1,973,408
Explanatory notes:
1 ‘On-time’ filing means declarations filed by the statutory due date for filing (plus any ‘days of grace’ applied by the tax administration as a matter of administrative policy). 2 ‘Expected declarations’ means the number of PAYE withholding declarations that the tax administration expected to receive from registered employers with PAYE withholding obligations that were required by law to file declarations. 3 The ‘on-time filing rate’ is the number of PAYE withholding declarations filed by employers by the statutory due date as a percentage of the total number of PAYE withholding declarations expected from registered employers, i.e. expressed as a ratio:
𝑁𝑁𝑁𝑁𝑁𝑁𝑁𝑁𝑁𝑁𝑁𝑁 𝑜𝑜𝑜𝑜 𝑃𝑃𝑉𝑉𝑃𝑃𝑃𝑃 𝑤𝑤𝑑𝑑𝑑𝑑ℎℎ𝑜𝑜𝑑𝑑𝑑𝑑𝑑𝑑𝑑𝑑𝑟𝑟 𝑑𝑑𝑁𝑁𝑑𝑑𝑑𝑑𝑑𝑑𝑁𝑁𝑑𝑑𝑑𝑑𝑑𝑑𝑜𝑜𝑑𝑑𝑑𝑑 𝑜𝑜𝑑𝑑𝑑𝑑𝑁𝑁𝑑𝑑 𝑁𝑁𝑏𝑏 𝑑𝑑ℎ𝑁𝑁 𝑑𝑑𝑁𝑁𝑁𝑁 𝑑𝑑𝑑𝑑𝑑𝑑𝑁𝑁 𝑁𝑁𝑁𝑁𝑁𝑁𝑁𝑁𝑁𝑁𝑁𝑁 𝑜𝑜𝑜𝑜 𝑃𝑃𝑉𝑉𝑃𝑃𝑃𝑃 𝑤𝑤𝑑𝑑𝑑𝑑ℎ𝑜𝑜𝑑𝑑𝑑𝑑𝑑𝑑𝑑𝑑𝑟𝑟 𝑑𝑑𝑁𝑁𝑑𝑑𝑑𝑑𝑑𝑑𝑁𝑁𝑑𝑑𝑑𝑑𝑑𝑑𝑜𝑜𝑑𝑑𝑑𝑑 𝑁𝑁𝑥𝑥𝑒𝑒𝑁𝑁𝑑𝑑𝑑𝑑𝑁𝑁𝑑𝑑 𝑜𝑜𝑁𝑁𝑜𝑜𝑁𝑁 𝑁𝑁𝑁𝑁𝑟𝑟𝑑𝑑𝑑𝑑𝑑𝑑𝑁𝑁𝑁𝑁𝑁𝑁𝑑𝑑 𝑁𝑁𝑁𝑁𝑒𝑒𝑑𝑑𝑜𝑜𝑏𝑏𝑁𝑁𝑁𝑁𝑑𝑑
𝑥𝑥 100

50
Table 9. Use of Electronic Services, 2015-171
(Ref: POAs 4 and 5)
2015 2016 2017 Electronic filing2
(In percent of all declarations filed for each tax type)
CIT 63.5 67.3 70.0 PIT A 0.2 0.4 0.5 PIT B 16.5 17.9 17.9 VAT 99.8 99.9 99.8 PAYE withholding (declarations filed by employers)
78.5 80.6 82.7
Electronic payments3 (In percent of total number of payments
received for each tax type) CIT 100 100 100 PIT 100 100 100 VAT 100 100 100 PAYE withholding (remitted by employers) 100 100 100 Electronic payments
(In percent of total value of payments received for each tax type)
CIT 100 100 100 PIT 100 100 100 VAT 100 100 100 PAYE withholding (remitted by employers) 100 100 100
Explanatory notes:
1 Data in this table will provide an indicator of the extent to which the tax administration is using modern technology to transform operations, namely in areas of filing and payment.
2 For purposes of this table, electronic filing involves facilities that enable taxpayers to complete tax declarations online and file those declarations via the Internet.
3 Methods of electronic payment include credit cards, debit cards, and electronic funds transfer (where money is electronically transferred via the Internet from a taxpayer’s bank account to the Treasury account). Electronic payments may be made, for example, by mobile telephone where technology is used to turn mobile phones into an Internet terminal from which payments can be made. For TADAT measurement purposes, payments made in-person by a taxpayer to a third party agent (e.g., a bank or post office) that are then electronically transferred by the agent to the Treasury account are accepted as electronic payments.

51
Table 10. VAT Payments Made During 2017 (Ref: POA 5)
VAT payments made on-time1 VAT payments due2 On-time payment rate3
(In percent) Number of payments 1,021,205 1,081,267 94.4 Value of payments 8,924,771,985 9,986,297,761 89.4 Explanatory notes: 1 ‘On-time’ payment means paid on or before the statutory due date for payment (plus any ‘days of grace’ applied by the tax administration as a matter of administrative policy). 2 ‘Payments due’ include all payments due, whether self-assessed or administratively assessed (including as a result of an audit). 3 The ‘on-time payment rate’ is the number (or value) of VAT payments made by the statutory due date in percent of the total number (or value) of VAT payments due, i.e. expressed as ratios:
• The on-time payment rate by number is: 𝑁𝑁𝑁𝑁𝑁𝑁𝑁𝑁𝑁𝑁𝑁𝑁 𝑜𝑜𝑜𝑜 𝑉𝑉𝑉𝑉𝐶𝐶 𝑒𝑒𝑑𝑑𝑏𝑏𝑁𝑁𝑁𝑁𝑑𝑑𝑑𝑑𝑑𝑑 𝑁𝑁𝑑𝑑𝑑𝑑𝑁𝑁 𝑁𝑁𝑏𝑏 𝑑𝑑ℎ𝑁𝑁 𝑑𝑑𝑁𝑁𝑁𝑁 𝑑𝑑𝑑𝑑𝑑𝑑𝑁𝑁 𝐶𝐶𝑜𝑜𝑑𝑑𝑑𝑑𝑑𝑑 𝑑𝑑𝑁𝑁𝑁𝑁𝑁𝑁𝑁𝑁𝑁𝑁 𝑜𝑜𝑜𝑜 𝑉𝑉𝑉𝑉𝐶𝐶 𝑒𝑒𝑑𝑑𝑏𝑏𝑁𝑁𝑁𝑁𝑑𝑑𝑑𝑑𝑑𝑑 𝑑𝑑𝑁𝑁𝑁𝑁
𝑥𝑥 100
• The on-time payment rate by value is: 𝑉𝑉𝑑𝑑𝑑𝑑𝑁𝑁𝑁𝑁 𝑜𝑜𝑜𝑜 𝑉𝑉𝑉𝑉𝐶𝐶 𝑒𝑒𝑑𝑑𝑏𝑏𝑁𝑁𝑁𝑁𝑑𝑑𝑑𝑑𝑑𝑑 𝑁𝑁𝑑𝑑𝑑𝑑𝑁𝑁 𝑁𝑁𝑏𝑏 𝑑𝑑ℎ𝑁𝑁 𝑑𝑑𝑁𝑁𝑁𝑁 𝑑𝑑𝑑𝑑𝑑𝑑𝑁𝑁𝐶𝐶𝑜𝑜𝑑𝑑𝑑𝑑𝑑𝑑 𝑣𝑣𝑑𝑑𝑑𝑑𝑁𝑁𝑁𝑁 𝑜𝑜𝑜𝑜 𝑉𝑉𝑉𝑉𝐶𝐶 𝑒𝑒𝑑𝑑𝑏𝑏𝑁𝑁𝑁𝑁𝑑𝑑𝑑𝑑𝑑𝑑 𝑑𝑑𝑁𝑁𝑁𝑁
𝑥𝑥 100
Table 11. Value of Tax Arrears, 2015-171
(Ref: POA 5)
2015 2016 2017 EUR thousands
Total core tax revenue collections (from Table 1) (A) 10,859 870 10,983,156 11,573,128 Total core tax arrears at end of fiscal year2 (B) 2,951,351 3,014,230 3,078,341 Of which: Collectible3 (C) 920,665 473,110 284,269 Of which: More than 12 months’ old (D) 2,443,174 2,201,025 2,382,457 In percent Ratio of (B) to (A)4 27.2 27.4 26.6 Ratio of (C) to (A)5 8.5 4.3 2.5 Ratio of (D) to (B)6 82.8 73.0 77.4 Explanatory notes: 1 Data in this table will be used in assessing the value of core tax arrears relative to annual collections, and examining the extent to which unpaid tax liabilities are significantly overdue (i.e. older than 12 months). 2 ‘Total core tax arrears’ include tax, penalties, and accumulated interest. 3 ’Collectible’ core tax arrears is defined as the total amount of domestic tax, including interest and penalties, that is overdue for payment and which is not subject to collection impediments. Collectible core tax arrears therefore generally exclude: (a) amounts formally disputed by the taxpayer and for which collection action has been suspended pending the outcome, (b) amounts that are not legally recoverable (e.g., debt foregone through bankruptcy), and (c) arrears otherwise uncollectible (e.g., the debtor has no funds or other assets).
4 i.e. 𝑉𝑉𝑑𝑑𝑑𝑑𝑁𝑁𝑁𝑁 𝑜𝑜𝑜𝑜 𝑑𝑑𝑜𝑜𝑑𝑑𝑑𝑑𝑑𝑑 𝑑𝑑𝑜𝑜𝑁𝑁𝑁𝑁 𝑑𝑑𝑑𝑑𝑒𝑒 𝑑𝑑𝑁𝑁𝑁𝑁𝑁𝑁𝑑𝑑𝑁𝑁𝑑𝑑 𝑑𝑑𝑑𝑑 𝑁𝑁𝑑𝑑𝑑𝑑 𝑜𝑜𝑜𝑜 𝑜𝑜𝑑𝑑𝑑𝑑𝑑𝑑𝑑𝑑𝑑𝑑 𝑏𝑏𝑁𝑁𝑑𝑑𝑁𝑁 (𝐵𝐵) 𝐶𝐶𝑜𝑜𝑑𝑑𝑑𝑑𝑑𝑑 𝑑𝑑𝑜𝑜𝑁𝑁𝑁𝑁 𝑑𝑑𝑑𝑑𝑒𝑒 𝑑𝑑𝑜𝑜𝑑𝑑𝑑𝑑𝑁𝑁𝑑𝑑𝑑𝑑𝑁𝑁𝑑𝑑 𝑜𝑜𝑜𝑜𝑁𝑁 𝑜𝑜𝑑𝑑𝑑𝑑𝑑𝑑𝑑𝑑𝑑𝑑 𝑏𝑏𝑁𝑁𝑑𝑑𝑁𝑁 (𝑉𝑉)
𝑥𝑥 100
5 i.e. 𝑉𝑉𝑑𝑑𝑑𝑑𝑁𝑁𝑁𝑁 𝑜𝑜𝑜𝑜 𝑑𝑑𝑜𝑜𝑑𝑑𝑑𝑑𝑁𝑁𝑑𝑑𝑑𝑑𝑑𝑑𝑁𝑁𝑑𝑑𝑁𝑁 𝑑𝑑𝑜𝑜𝑁𝑁𝑁𝑁 𝑑𝑑𝑑𝑑𝑒𝑒 𝑑𝑑𝑁𝑁𝑁𝑁𝑁𝑁𝑑𝑑𝑁𝑁𝑑𝑑 𝑑𝑑𝑑𝑑 𝑁𝑁𝑑𝑑𝑑𝑑 𝑜𝑜𝑜𝑜 𝑜𝑜𝑑𝑑𝑑𝑑𝑑𝑑𝑑𝑑𝑑𝑑 𝑏𝑏𝑁𝑁𝑑𝑑𝑁𝑁 (𝐶𝐶)𝐶𝐶𝑜𝑜𝑑𝑑𝑑𝑑𝑑𝑑 𝑑𝑑𝑜𝑜𝑁𝑁𝑁𝑁 𝑑𝑑𝑑𝑑𝑒𝑒 𝑑𝑑𝑜𝑜𝑑𝑑𝑑𝑑𝑁𝑁𝑑𝑑𝑑𝑑𝑁𝑁𝑑𝑑 𝑜𝑜𝑜𝑜𝑁𝑁 𝑜𝑜𝑑𝑑𝑑𝑑𝑑𝑑𝑑𝑑𝑑𝑑 𝑏𝑏𝑁𝑁𝑑𝑑𝑁𝑁 (𝑉𝑉)
𝑥𝑥 100
6 i.e. 𝑉𝑉𝑑𝑑𝑑𝑑𝑁𝑁𝑁𝑁 𝑜𝑜𝑜𝑜 𝑑𝑑𝑜𝑜𝑁𝑁𝑁𝑁 𝑑𝑑𝑑𝑑𝑒𝑒 𝑑𝑑𝑁𝑁𝑁𝑁𝑁𝑁𝑑𝑑𝑁𝑁𝑑𝑑 >12 𝑁𝑁𝑜𝑜𝑑𝑑𝑑𝑑ℎ𝑑𝑑′ 𝑜𝑜𝑑𝑑𝑑𝑑 𝑑𝑑𝑑𝑑 𝑁𝑁𝑑𝑑𝑑𝑑 𝑜𝑜𝑜𝑜 𝑏𝑏𝑁𝑁𝑑𝑑𝑁𝑁 (𝐷𝐷)𝑉𝑉𝑑𝑑𝑑𝑑𝑁𝑁𝑁𝑁 𝑜𝑜𝑜𝑜 𝑑𝑑𝑜𝑜𝑑𝑑𝑑𝑑𝑑𝑑 𝑑𝑑𝑜𝑜𝑁𝑁𝑁𝑁 𝑑𝑑𝑑𝑑𝑒𝑒 𝑑𝑑𝑁𝑁𝑁𝑁𝑁𝑁𝑑𝑑𝑁𝑁𝑑𝑑 𝑑𝑑𝑑𝑑 𝑁𝑁𝑑𝑑𝑑𝑑 𝑜𝑜𝑜𝑜 𝑜𝑜𝑑𝑑𝑑𝑑𝑑𝑑𝑑𝑑𝑑𝑑 𝑏𝑏𝑁𝑁𝑑𝑑𝑁𝑁 (𝐵𝐵)
𝑥𝑥 100
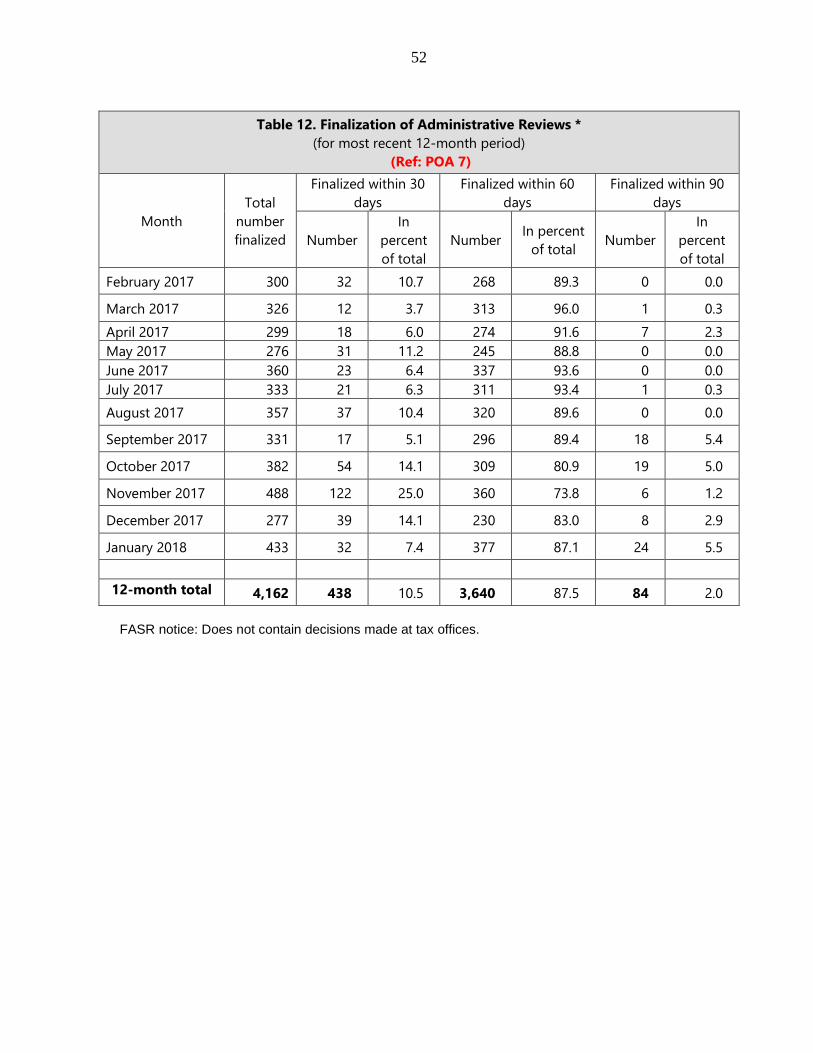
52
Table 12. Finalization of Administrative Reviews *
(for most recent 12-month period) (Ref: POA 7)
Month Total
number finalized
Finalized within 30 days
Finalized within 60 days
Finalized within 90 days
Number In
percent of total
Number In percent of total Number
In percent of total
February 2017 300 32 10.7 268 89.3 0 0.0
March 2017 326 12 3.7 313 96.0 1 0.3 April 2017 299 18 6.0 274 91.6 7 2.3 May 2017 276 31 11.2 245 88.8 0 0.0 June 2017 360 23 6.4 337 93.6 0 0.0 July 2017 333 21 6.3 311 93.4 1 0.3 August 2017 357 37 10.4 320 89.6 0 0.0
September 2017 331 17 5.1 296 89.4 18 5.4
October 2017 382 54 14.1 309 80.9 19 5.0
November 2017 488 122 25.0 360 73.8 6 1.2
December 2017 277 39 14.1 230 83.0 8 2.9
January 2018 433 32 7.4 377 87.1 24 5.5
12-month total 4,162 438 10.5 3,640 87.5 84 2.0 FASR notice: Does not contain decisions made at tax offices.
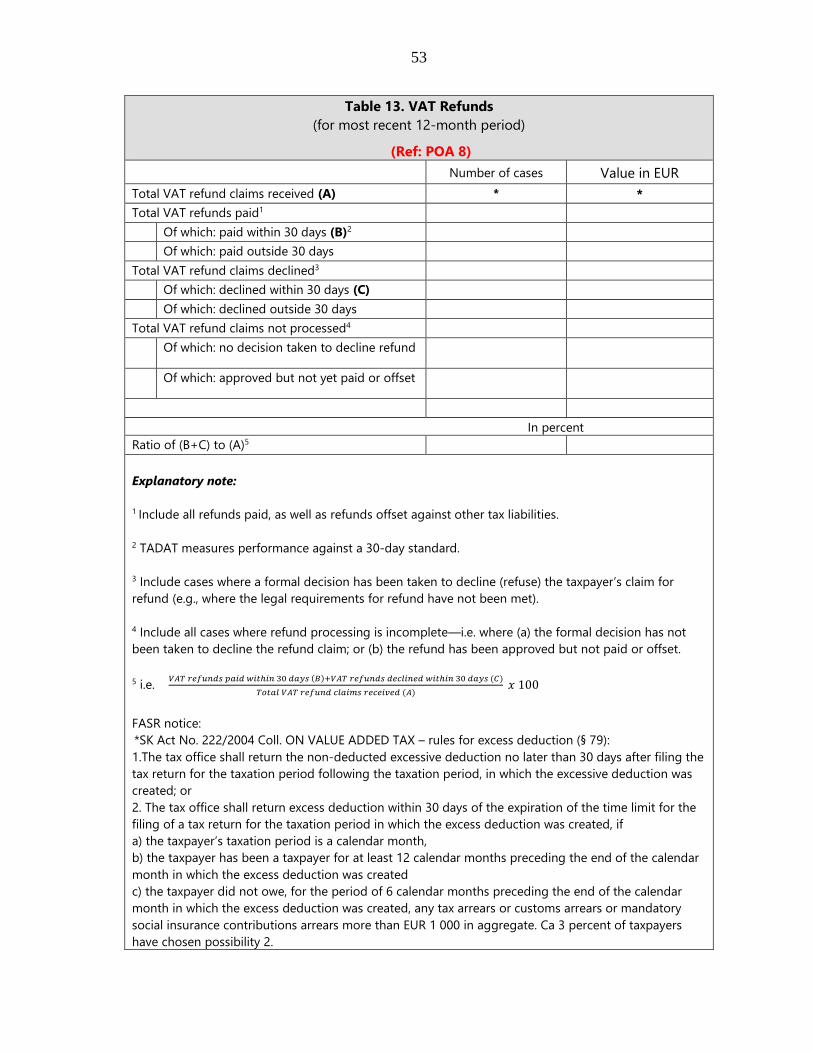
53
Table 13. VAT Refunds (for most recent 12-month period)
(Ref: POA 8) Number of cases Value in EUR
Total VAT refund claims received (A) * * Total VAT refunds paid1 Of which: paid within 30 days (B)2 Of which: paid outside 30 days Total VAT refund claims declined3 Of which: declined within 30 days (C) Of which: declined outside 30 days Total VAT refund claims not processed4 Of which: no decision taken to decline refund
Of which: approved but not yet paid or offset
In percent
Ratio of (B+C) to (A)5 Explanatory note: 1 Include all refunds paid, as well as refunds offset against other tax liabilities. 2 TADAT measures performance against a 30-day standard. 3 Include cases where a formal decision has been taken to decline (refuse) the taxpayer’s claim for refund (e.g., where the legal requirements for refund have not been met). 4 Include all cases where refund processing is incomplete—i.e. where (a) the formal decision has not been taken to decline the refund claim; or (b) the refund has been approved but not paid or offset. 5 i.e. 𝑉𝑉𝑉𝑉𝐶𝐶 𝑁𝑁𝑁𝑁𝑜𝑜𝑁𝑁𝑑𝑑𝑑𝑑𝑑𝑑 𝑒𝑒𝑑𝑑𝑑𝑑𝑑𝑑 𝑤𝑤𝑑𝑑𝑑𝑑ℎ𝑑𝑑𝑑𝑑 30 𝑑𝑑𝑑𝑑𝑏𝑏𝑑𝑑 (𝐵𝐵)+𝑉𝑉𝑉𝑉𝐶𝐶 𝑁𝑁𝑁𝑁𝑜𝑜𝑁𝑁𝑑𝑑𝑑𝑑𝑑𝑑 𝑑𝑑𝑁𝑁𝑑𝑑𝑑𝑑𝑑𝑑𝑑𝑑𝑁𝑁𝑑𝑑 𝑤𝑤𝑑𝑑𝑑𝑑ℎ𝑑𝑑𝑑𝑑 30 𝑑𝑑𝑑𝑑𝑏𝑏𝑑𝑑 (𝐶𝐶)
𝐶𝐶𝑜𝑜𝑑𝑑𝑑𝑑𝑑𝑑 𝑉𝑉𝑉𝑉𝐶𝐶 𝑁𝑁𝑁𝑁𝑜𝑜𝑁𝑁𝑑𝑑𝑑𝑑 𝑑𝑑𝑑𝑑𝑑𝑑𝑑𝑑𝑁𝑁𝑑𝑑 𝑁𝑁𝑁𝑁𝑑𝑑𝑁𝑁𝑑𝑑𝑣𝑣𝑁𝑁𝑑𝑑 (𝑉𝑉) 𝑥𝑥 100
FASR notice: *SK Act No. 222/2004 Coll. ON VALUE ADDED TAX – rules for excess deduction (§ 79): 1.The tax office shall return the non-deducted excessive deduction no later than 30 days after filing the tax return for the taxation period following the taxation period, in which the excessive deduction was created; or 2. The tax office shall return excess deduction within 30 days of the expiration of the time limit for the filing of a tax return for the taxation period in which the excess deduction was created, if a) the taxpayer’s taxation period is a calendar month, b) the taxpayer has been a taxpayer for at least 12 calendar months preceding the end of the calendar month in which the excess deduction was created c) the taxpayer did not owe, for the period of 6 calendar months preceding the end of the calendar month in which the excess deduction was created, any tax arrears or customs arrears or mandatory social insurance contributions arrears more than EUR 1 000 in aggregate. Ca 3 percent of taxpayers have chosen possibility 2.
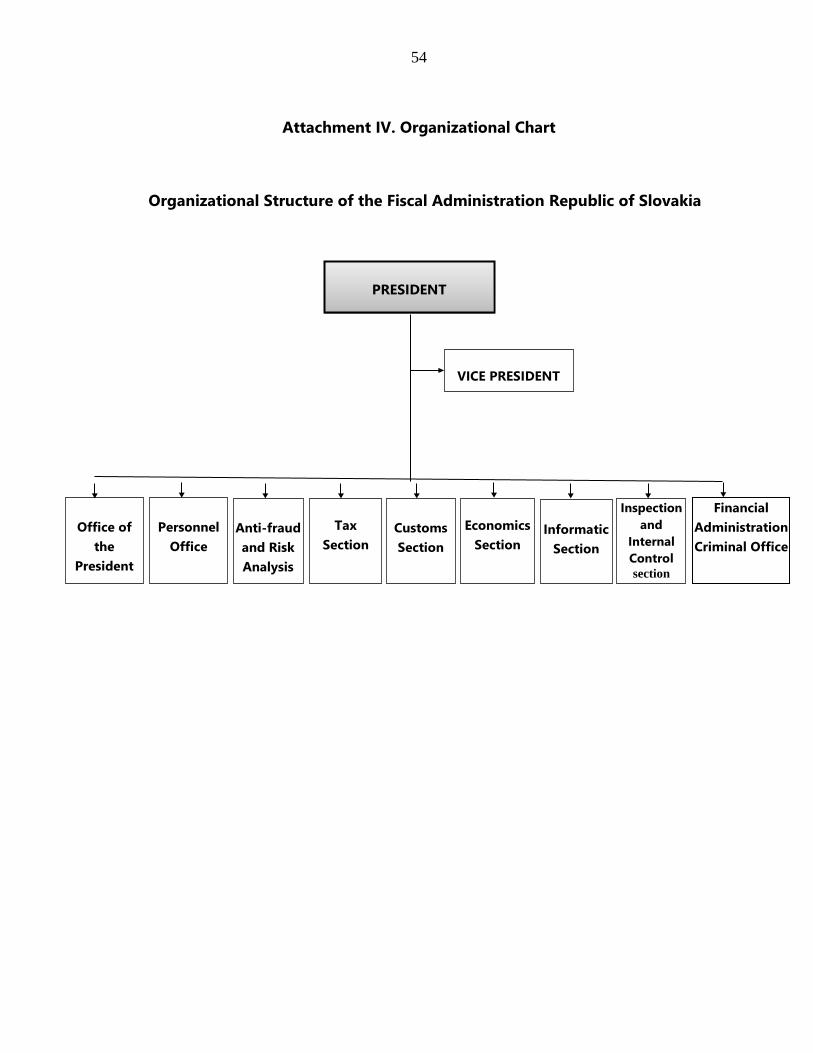
54
Attachment IV. Organizational Chart
Organizational Structure of the Fiscal Administration Republic of Slovakia
PRESIDENT
VICE PRESIDENT
Office of
the President
Personnel
Office
Anti-fraud and Risk Analysis
Tax
Section
Customs Section
Economics
Section
Inspection and
Internal Control section
Financial Administration Criminal Office
Informatic
Section

55
Attachment V. Sources of Evidence
Indicators Sources of Evidence P1-1. Accurate and reliable taxpayer information.
• Field visit to Trnava Tax Office (including examination of tax register screens)
• § 41 sec.1 of Income Tax Law 595/2003 (Companies required to file a tax return – even if ceased trading)
• Description of registration process for VAT www.financnasprava.sk/sk/podnikatelia/dane/dan-z-pridanej-hodnoty/_registrovanie
P1-2. Knowledge of the potential taxpayer base.
• Field visit to Trnava Tax Office • Website of office responsible for trade licenses
http://zivnostensky.urad-online.sk/ P2-3. Identification, assessment, ranking, and quantification of compliance risks.
• Presentation on VAT risk analysis (by Head of Anti-fraud and Risk Analysis Section)
• EU VAT gap analysis https://ec.europa.eu/taxation_customs/sites/taxation/files/study_and_reports_on_the_vat_gap_2017.pdf
P2-4. Mitigation of risks through a compliance improvement plan.
• Action Plan (including VAT compliance)
P2-5. Monitoring and evaluation of compliance risk mitigation activities.
• Evaluation of compliance operation on Sportspersons and Entertainers
P2-6. Identification, assessment, and mitigation of institutional risks.
• Instruction to department heads re risk assessment • Instruction to IT department re ISO 25000
P3-7. Scope, currency, and accessibility of information.
• FRSA website https://financnasprava.sk • Field visit to Trnava Tax Office
P3-8. Scope of initiatives to reduce taxpayer compliance costs.
• Weblink to fortnightly newsletter showing routine FAQs https://www.financnasprava.sk/sk/financna-sprava/newsletter/newsletter-archiv
P3-9. Obtaining taxpayer feedback on products and services.
• Weblink showing role and membership of the President’s Advisory Board https://www.financnasprava.sk/sk/financna-sprava/organy-financnej-spravy
P4-10. On-time filing rate. • § 39 sec.12 of Income Tax Law 595/2003 (Non-obligation of Employer to file return when no salary paid).
P5-13. Use of efficient collection systems.
• Procedures on collection enforcement • Internal regulation on collection enforcement
P5-15. Stock and flow of tax arrears.
• Report on Tax Arrears
https://ec.europa.eu/taxation_customs/sites/taxation/files/study_and_reports_on_the_vat_gap_2017.pdf
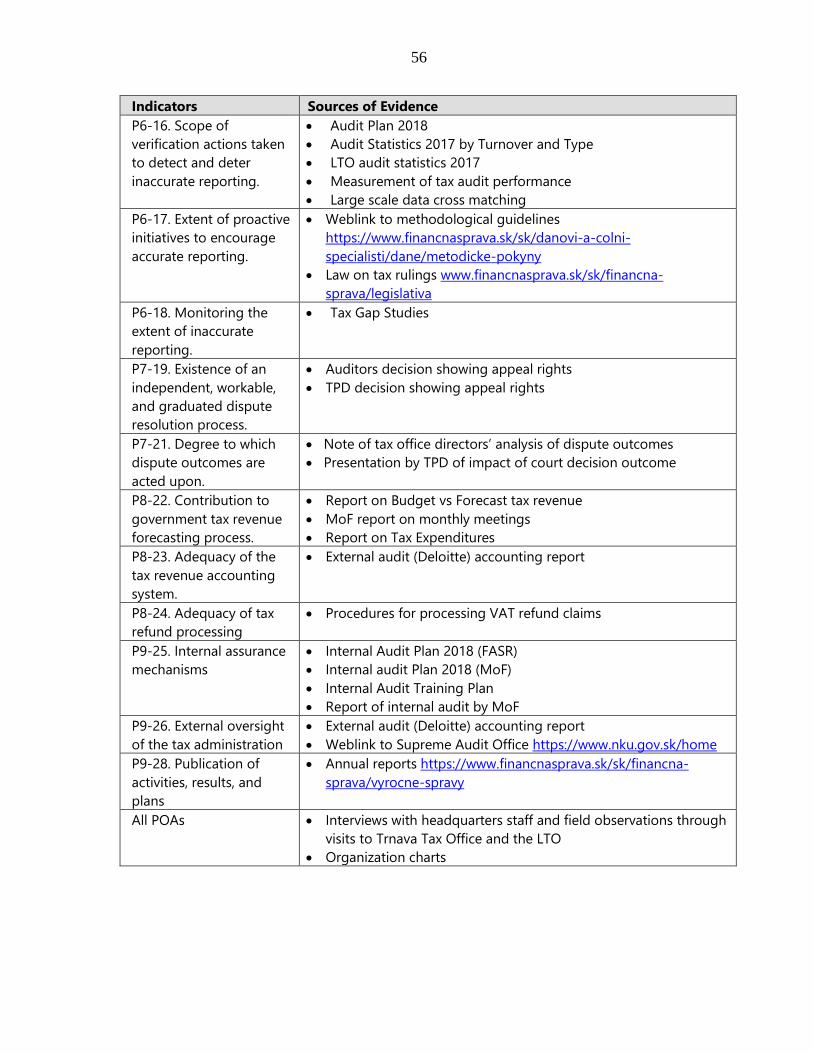
56
Indicators Sources of Evidence P6-16. Scope of verification actions taken to detect and deter inaccurate reporting.
• Audit Plan 2018 • Audit Statistics 2017 by Turnover and Type • LTO audit statistics 2017 • Measurement of tax audit performance • Large scale data cross matching
P6-17. Extent of proactive initiatives to encourage accurate reporting.
• Weblink to methodological guidelines https://www.financnasprava.sk/sk/danovi-a-colni-specialisti/dane/metodicke-pokyny
• Law on tax rulings www.financnasprava.sk/sk/financna-sprava/legislativa
P6-18. Monitoring the extent of inaccurate reporting.
• Tax Gap Studies
P7-19. Existence of an independent, workable, and graduated dispute resolution process.
• Auditors decision showing appeal rights • TPD decision showing appeal rights
P7-21. Degree to which dispute outcomes are acted upon.
• Note of tax office directors’ analysis of dispute outcomes • Presentation by TPD of impact of court decision outcome
P8-22. Contribution to government tax revenue forecasting process.
• Report on Budget vs Forecast tax revenue • MoF report on monthly meetings • Report on Tax Expenditures
P8-23. Adequacy of the tax revenue accounting system.
• External audit (Deloitte) accounting report
P8-24. Adequacy of tax refund processing
• Procedures for processing VAT refund claims
P9-25. Internal assurance mechanisms
• Internal Audit Plan 2018 (FASR) • Internal audit Plan 2018 (MoF) • Internal Audit Training Plan • Report of internal audit by MoF
P9-26. External oversight of the tax administration
• External audit (Deloitte) accounting report • Weblink to Supreme Audit Office https://www.nku.gov.sk/home
P9-28. Publication of activities, results, and plans
• Annual reports https://www.financnasprava.sk/sk/financna-sprava/vyrocne-spravy
All POAs • Interviews with headquarters staff and field observations through visits to Trnava Tax Office and the LTO
• Organization charts

Fiscal Affairs Department
International Monetary Fund700 19th Street NWWashington, DC 20431USAhttp://www.imf.org/capacitydevelopment