SLOPE MINI-ART PROJECT - High Tech Highdp.hightechhigh.org/~cchen/the peace of art project/slope...
22
1 SLOPE MINI-ART PROJECT Description: In order to practice creating your design for the Peace of Art project, you will draw and color a pattern or design made of simply lines. This project will also allow you to practice some of the coordinate geometry skills you will be asked to demonstrate at the end of the project. Skills you will need for this mini-project: ● understanding patterns, how they grow and how we represent them with equations ● graphing coordinate points and linear equations ● finding the equations of linear lines Product: A visually interesting graphic design made on a 8.5 X 11 piece of graph paper. Examples: From: http://pichaus.com/+impressive+bw/ Timeline: From: http://www.childs.mccsc.edu/ art98/radsym4t.gif From: http://quester- shadow.deviantart.com/art/New- Graph-Art-010-99071314 DAY 1: Tile pattern investigations DAY 2: Patterns and Rules, John’s Redwood Tree and the Big C Tile Pattern (if time permits) DAY 3: Finding equations of lines, graphing lines, finding the equation of a line if given a point and the slope and finding the equation of a line given 2 points DAY 4: Parallel and Perpendicular Lines Investigation, start designs DAY 5: Work on designs – mini project due Friday, September 21 st at the beginning of team time.
Transcript of SLOPE MINI-ART PROJECT - High Tech Highdp.hightechhigh.org/~cchen/the peace of art project/slope...

1
SLOPE MINI-ART PROJECT
Description: In order to practice creating your design for the Peace of Art project, you will draw and color a pattern or
design made of simply lines. This project will also allow you to practice some of the coordinate geometry skills you will
be asked to demonstrate at the end of the project.
Skills you will need for this mini-project:
● understanding patterns, how they grow and how we represent them with equations
● graphing coordinate points and linear equations
● finding the equations of linear lines
Product: A visually interesting graphic design made on a 8.5 X 11 piece of graph paper.
Examples:
From:
http://pichaus.com/+impressive+bw/
Timeline:
From: http://www.childs.mccsc.edu/
art98/radsym4t.gif
From: http://quester-
shadow.deviantart.com/art/New-
Graph-Art-010-99071314
DAY 1: Tile pattern investigations
DAY 2: Patterns and Rules, John’s Redwood Tree and the Big C Tile Pattern (if time permits)
DAY 3: Finding equations of lines, graphing lines, finding the equation of a line if given a point and the slope and finding
the equation of a line given 2 points
DAY 4: Parallel and Perpendicular Lines Investigation, start designs
DAY 5: Work on designs – mini project due Friday, September 21st at the beginning of team time.

2
Tile Patterns PATTERN #1
1.) Look at the tile patterns in Figure 2, 3 and 4. 2.) Draw the 1st, 5th and 6th figures of the tile pattern on the graph paper below.
3.) Fill in a table of the tile pattern below. Count how many tiles make up each figure and write them in the table.
4.) How is the pattern changing from figure to figure?
-How many more tiles does Figure 2 have than Figure 1? _________ -How many more tiles does Figure 3 have than Figure 2? _________ -How many more tiles does Figure 4 have than Figure 3? _________ -How many more tiles does Figure 5 have than Figure 4? _________ -How many more tiles does Figure 6 have than Figure 5? _________
In summary, how is the pattern changing from figure to figure? ________________________________________________________________________________________ 5.) How many tiles do you think the 100th pattern will have? Show your work below.
figure 1 2 3 4 5 6
# of tiles

3
6.) Based on how the tile pattern increases between the figures, how many tiles do you think Figure 0 will have? Explain how you know.
7.) Now make a graph to represent the table in #3. Put the figure number on the x-axis and # of tiles on the y-axis.
Then connect the points.

4
PATTERN #2
1.) Look at the tile patterns in Figure 2, 3 and 4. 2.) Draw the 1st, 5th and 6th figures of the tile pattern on the graph paper below. Fill out the table of the tile pattern
below.
3.) Fill in a table of the tile pattern below. Count how many tiles make up each figure and write them in the table.
4.) How is the pattern changing from figure to figure? -How many more tiles does Figure 2 have than Figure 1? _________ -How many more tiles does Figure 3 have than Figure 2? _________ -How many more tiles does Figure 4 have than Figure 3? _________ -How many more tiles does Figure 5 have than Figure 4? _________ -How many more tiles does Figure 6 have than Figure 5? _________
In summary, how is the pattern changing from figure to figure? ________________________________________________________________________________________ 5.) How many tiles do you think the 100th pattern will have? Show your work below.
figure
# of tiles

5
6.) Based on how the tile pattern increases between the figures, how many tiles do you think Figure 0 will have? Explain how you know.
7.) Now make a graph to represent the table in #3. Put the figure number on the x-axis and # of tiles on the y-axis.
Then connect the points.

6
Answer the following questions about both tile patterns:
1.) What kind of graph do both of these tile patterns look like? (What shape is the graph?)
Tile pattern #1: _________________________________________________________________________________ Tile pattern #2: _________________________________________________________________________________ 2.) What is the y-intercept (where the line hits the y-axis) for both graphs? ___________ (tile #1) and
____________(tile #2)
3.) For tile patterns, the y-intercept is the same as which figure of the tile patterns? ____________ 4.) Describe how each line is growing.
a. The graph of tile #1 grows by what pattern? _________________________________________________
b. The graph of tile #2 grows by what pattern? _________________________________________________
c. Why is tile #1 a parabola and not a straight line? _______________________________________________
___________________________________________________________________________________________
d. Why is tile #2 a straight line? ________________________________________________________________
___________________________________________________________________________________________

7
Finding Patterns and Rules
Directions: Fill in the patterns for each box and then write an algebraic rule to represent the pattern.

8
John’s Giant Redwood Tree
3-10) John found the data in the table shown about his favorite redwood tree. He wondered if he could use it to predict the height of the tree at other points of time. Consider this as you analyze the data and answer the questions shown. Be ready to share (and justify) your answers with the class.
a. How tall was the tree 2 years after it was planted? What about 7 years after it was planted? How do you know?
b. How tall was the tree the year it was planted?
c. Estimate the height of the tree 50 years after it was planted. How did you make your prediction?
3-11) John decided to find out more about his favorite redwood tree by graphing the data.
a. On the Lesson 3.1.2B Resource Page provided by your teacher, plot the points that represent the height of the tree over time. What does the graph look like?
b. Does it make sense to connect the points? Explain your thinking.
c. According to the graph, what was the height of the tree 1.5 years after it was planted?
d. Can you use your graph to predict the height of the redwood tree 20 years after it was planted? Why or why not?

9
3-12) John is still not satisfied. He wants to be able to predict the height of the tree at any time after it was planted.
a. Find John's table on your resource page and extend it to include the height of the tree in the 0th year, 1st year, 2nd year, and 6th year.
b. If you have not already, use the ideas from the Silent Board Game to write an algebraic rule for the data in your table. Be sure to work with your team and check that the rule works for all of the data.
c. Use your rule to check your prediction in part (c) of problem 3–10 for how tall the tree will be in its 50th year. How close was your prediction?

10

11
The "Big Cs" pattern Directions for this activity are below:
a. Draw Figure 0 and Figure 4 on the grid provided on the resource page.
b. On the resource page, represent the number of tiles in each figure with:
*An table.
*An algebraic rule.
*A graph
c. How many tiles will be in Figure 5? Justify your answer in at least two different ways.
d. What will Figure 100 look like? How many tiles will it have? How can you be sure?
ANSWER THE FOLLOWING QUESTIONS AFTER COMPLETING THE ACTIVITY:
1.) Explain how the table connects to the graph.
2.) Explain how the table connects to the algebraic rule or equation.
3.) Explain how the graph connects to the algebraic equation.
4.) I have a tile pattern represented by this equation:
a. Y = 2x + 5
How many tiles do I start off with? ______ How many tiles does the pattern grow by each figure? _______ b.) y = -3x + 15 How many tiles do I start off with? ______ How many tiles does the pattern grow by each figure? _______

12
Algebraic rule: _______________________________________
Show your work on how to
find Fig. 100 below:
Tiles in Fig. 100=
_________

13
Finding the Linear Equation of a Line From a Graph For each graph, find the slope (growth factor of the pattern), the y-intercept (what figure 0 is) and then write the
equation.
Growth factor/slope=
_______
y-intercept/figure 0 =
_______
linear equation =
______________
Growth factor/slope=
_______
y-intercept/figure 0 =
_______
linear equation =
______________
Growth factor/slope=
_______
y-intercept/figure 0 =
_______
linear equation =
______________
Growth factor/slope=
_______
y-intercept/figure 0 =
_______
linear equation =
______________
Growth factor/slope=
_______
y-intercept/figure 0 =
_______
linear equation =
______________
Growth factor/slope=
_______
y-intercept/figure 0 =
_______
linear equation =
______________
Growth factor/slope=
_______
y-intercept/figure 0 =
_______
linear equation =
______________
Growth factor/slope=
_______
y-intercept/figure 0 =
_______
linear equation =
______________

14
Growth factor/slope=
_______
y-intercept/figure 0 =
_______
linear equation =
______________
Growth factor/slope=
_______
y-intercept/figure 0 =
_______
linear equation =
______________
Growth factor/slope=
_______
y-intercept/figure 0 =
_______
linear equation =
______________
Growth factor/slope=
_______
y-intercept/figure 0 =
_______
linear equation =
______________
Growth factor/slope=
_______
y-intercept/figure 0 =
_______
linear equation =
______________
Growth factor/slope=
_______
y-intercept/figure 0 =
_______
linear equation =
______________
Growth factor/slope=
_______
y-intercept/figure 0 =
_______
linear equation =
______________
Growth factor/slope=
_______
y-intercept/figure 0 =
_______
linear equation =
______________

15
Graphing Lines in Slope-Intercept Form Find the slope (growth factor) and the y-intercept (figure 0) for each line and then graph the line.
Growth
factor/slope=
_______
y-intercept/figure
0 = _______
Growth
factor/slope=
_______
y-intercept/figure
0 = _______
Growth
factor/slope=
_______
y-intercept/figure
0 = _______
Growth
factor/slope=
_______
y-intercept/figure
0 = _______
Growth
factor/slope=
_______
y-intercept/figure
0 = _______
Growth
factor/slope=
_______
y-intercept/figure
0 = _______

16

17
Writing Equations Given the Slope and a Point

18
Writing Equations Given Two Points
19
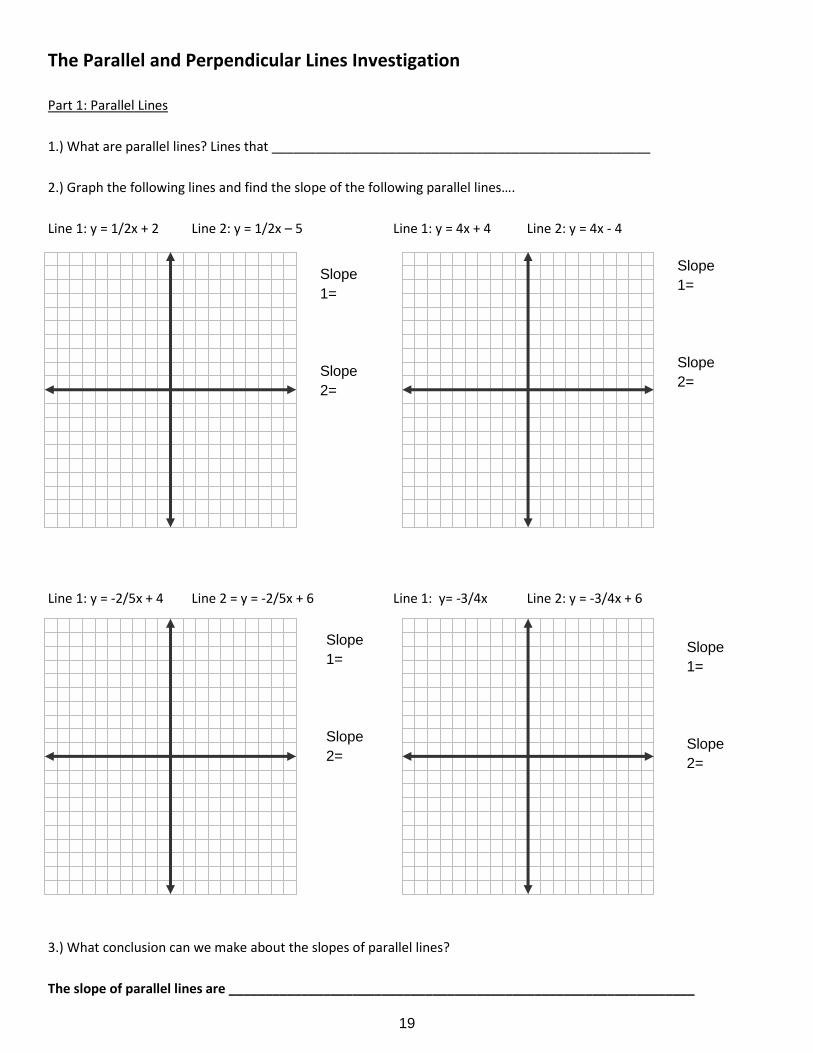
The Parallel and Perpendicular Lines Investigation
Part 1: Parallel Lines
1.) What are parallel lines? Lines that ____________________________________________________
2.) Graph the following lines and find the slope of the following parallel lines….
Line 1: y = 1/2x + 2 Line 2: y = 1/2x – 5 Line 1: y = 4x + 4 Line 2: y = 4x - 4
.
slo
Line 1: y = -2/5x + 4 Line 2 = y = -2/5x + 6 Line 1: y= -3/4x Line 2: y = -3/4x + 6
3.) What conclusion can we make about the slopes of parallel lines?
The slope of parallel lines are ________________________________________________________________
Slope
1=
Slope
2=
Slope
1=
Slope
2=
Slope
1=
Slope
2=
Slope
1=
Slope
2=

20
Part 2: Perpendicular Lines
1.) What are perpendicular lines?
2.) Find the slope of the following perpendicular lines:
Line 1: y = 1/2x + 2 Line 2: y = -2x + 2 Line 1: y = 4x + 4 Line 2: y = -1/4x - 3
Line 1: y = 5/2x + 2 Line 2: y = -2/5x + 4 Line 1: y = 4/3x – 4 Line 2: y = -3/4 x + 6
3.) What conclusion can we make about the slopes of perpendicular lines?
The slopes of perpendicular lines are__________________________________________________________
Slope
1=
Slope
2=
Slope
1=
Slope
2=
Slope
1=
Slope
2=
Slope
1=
Slope
2=
21
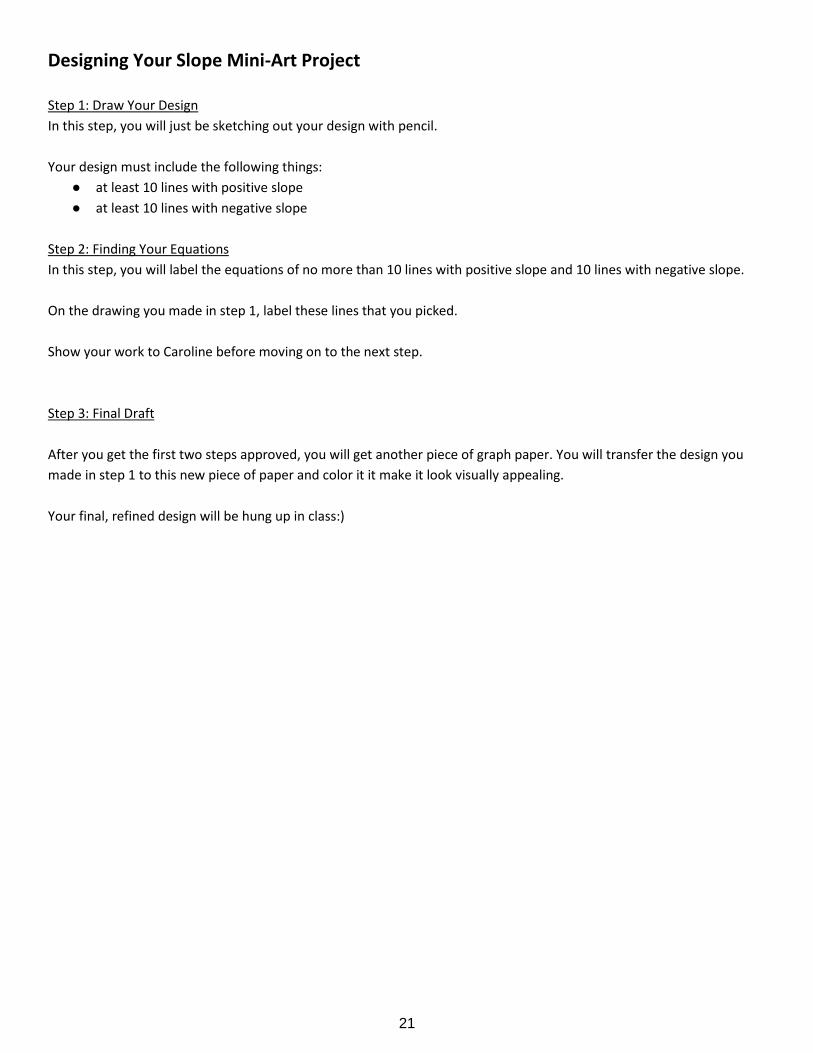
Designing Your Slope Mini-Art Project
Step 1: Draw Your Design
In this step, you will just be sketching out your design with pencil.
Your design must include the following things:
● at least 10 lines with positive slope
● at least 10 lines with negative slope
Step 2: Finding Your Equations
In this step, you will label the equations of no more than 10 lines with positive slope and 10 lines with negative slope.
On the drawing you made in step 1, label these lines that you picked.
Show your work to Caroline before moving on to the next step.
Step 3: Final Draft
After you get the first two steps approved, you will get another piece of graph paper. You will transfer the design you
made in step 1 to this new piece of paper and color it it make it look visually appealing.
Your final, refined design will be hung up in class:)

22