Slipping Millions: A Case study of Tanzania’s Informal ...
25
Slipping Millions: A Case study of Tanzania’s Informal Cross Border Fish Trade in the Eastern Africa Trade Corridor Paul Onyango and Sloans Chimatiro Kalumba
Transcript of Slipping Millions: A Case study of Tanzania’s Informal ...

Slipping Millions: A Case study of Tanzania’s Informal Cross Border Fish Trade in the Eastern Africa Trade Corridor
Paul Onyango and Sloans Chimatiro Kalumba
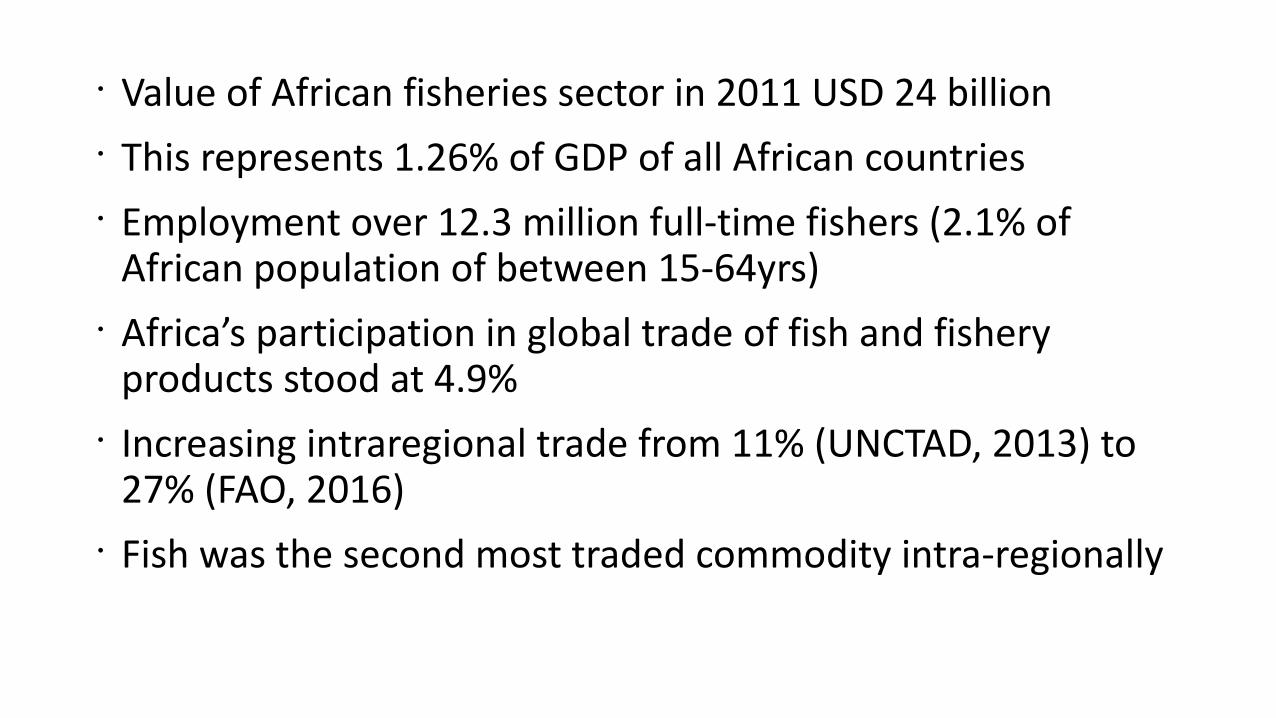
• Value of African fisheries sector in 2011 USD 24 billion• This represents 1.26% of GDP of all African countries• Employment over 12.3 million full-time fishers (2.1% of
African population of between 15-64yrs)• Africa’s participation in global trade of fish and fishery
products stood at 4.9%• Increasing intraregional trade from 11% (UNCTAD, 2013) to
27% (FAO, 2016)• Fish was the second most traded commodity intra-regionally
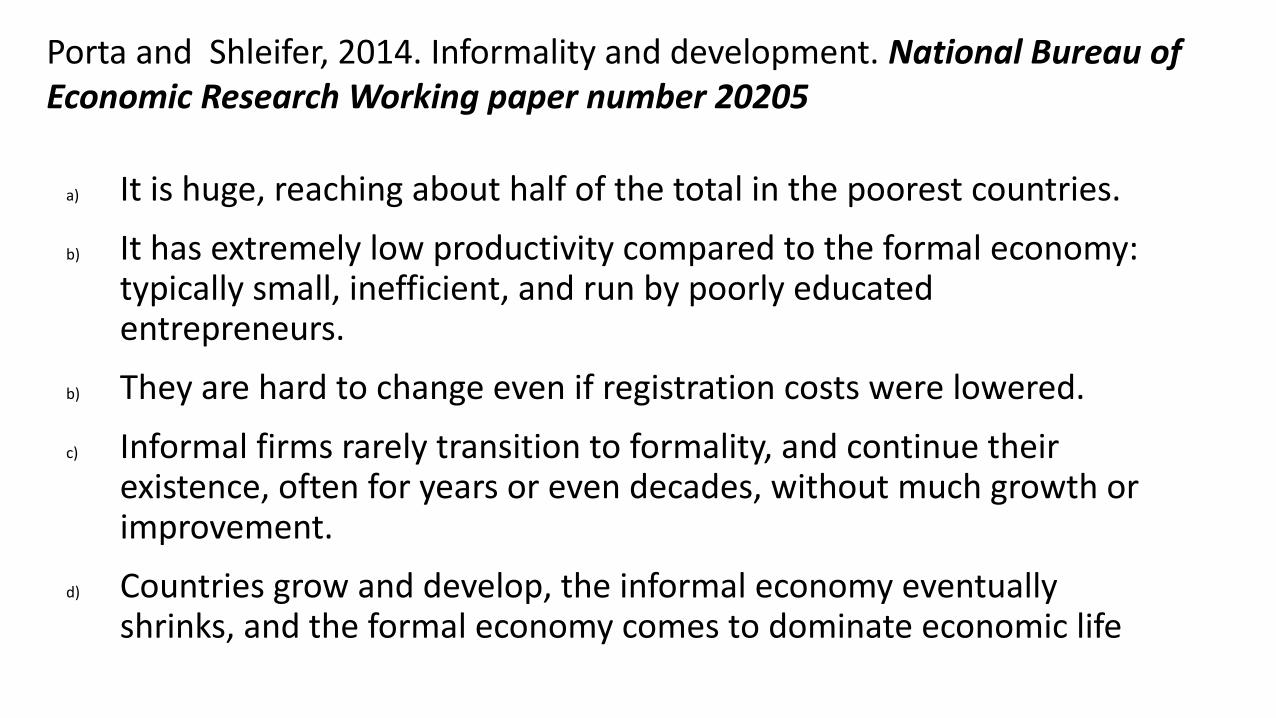
a) It is huge, reaching about half of the total in the poorest countries.
b) It has extremely low productivity compared to the formal economy: typically small, inefficient, and run by poorly educated entrepreneurs.
b) They are hard to change even if registration costs were lowered.
c) Informal firms rarely transition to formality, and continue their existence, often for years or even decades, without much growth or improvement.
d) Countries grow and develop, the informal economy eventually shrinks, and the formal economy comes to dominate economic life
Porta and Shleifer, 2014. Informality and development. National Bureau of Economic Research Working paper number 20205
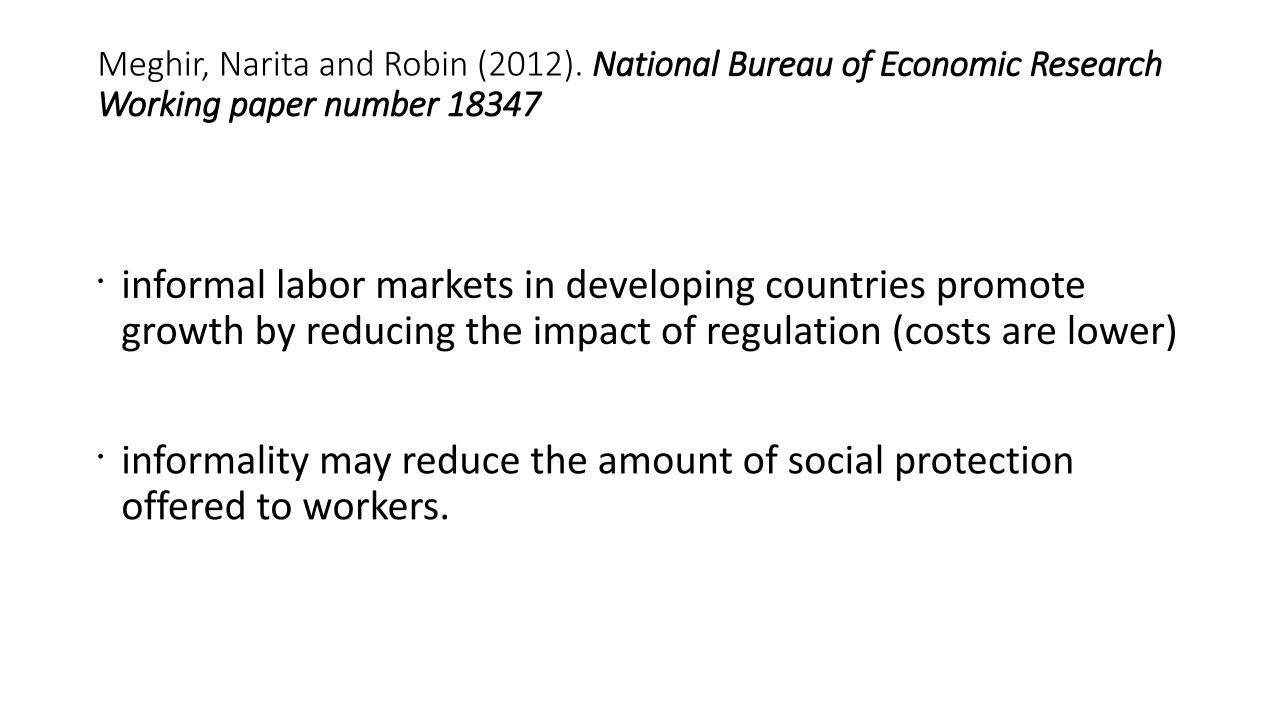
Meghir, Narita and Robin (2012). National Bureau of Economic Research Working paper number 18347
• informal labor markets in developing countries promote growth by reducing the impact of regulation (costs are lower)
• informality may reduce the amount of social protection offered to workers.
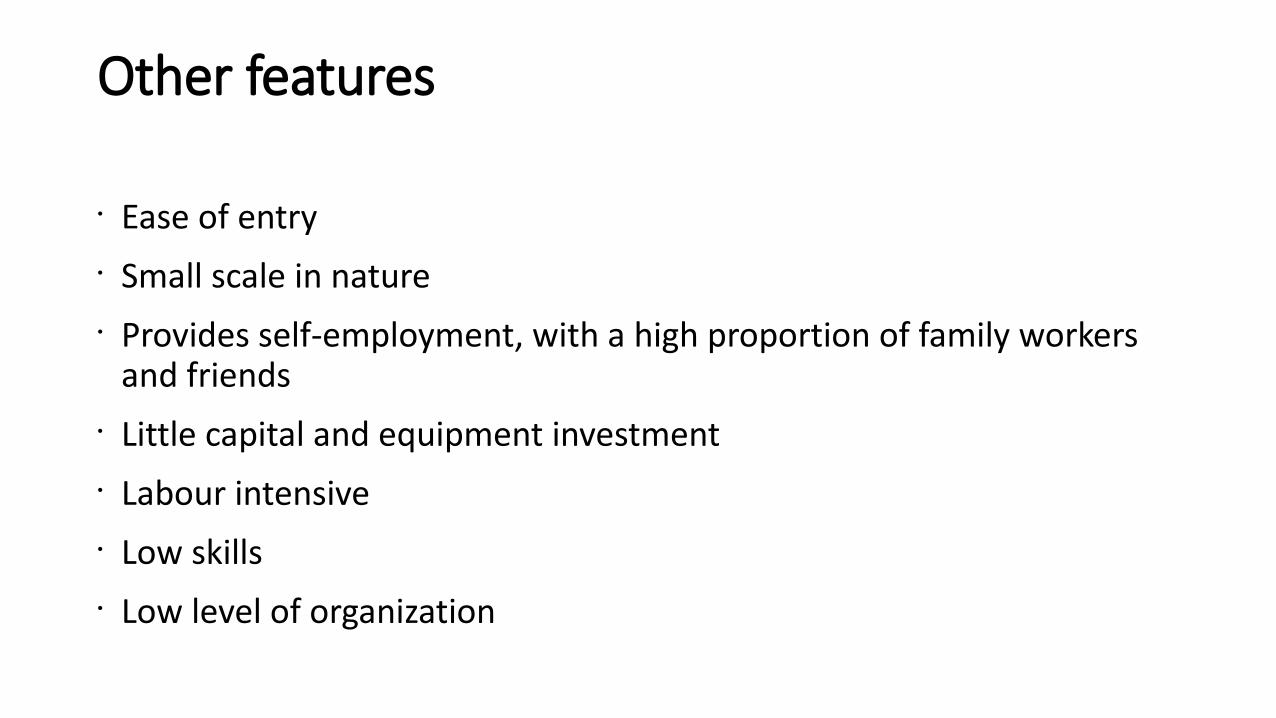
Other features
• Ease of entry• Small scale in nature• Provides self-employment, with a high proportion of family workers
and friends• Little capital and equipment investment• Labour intensive• Low skills• Low level of organization
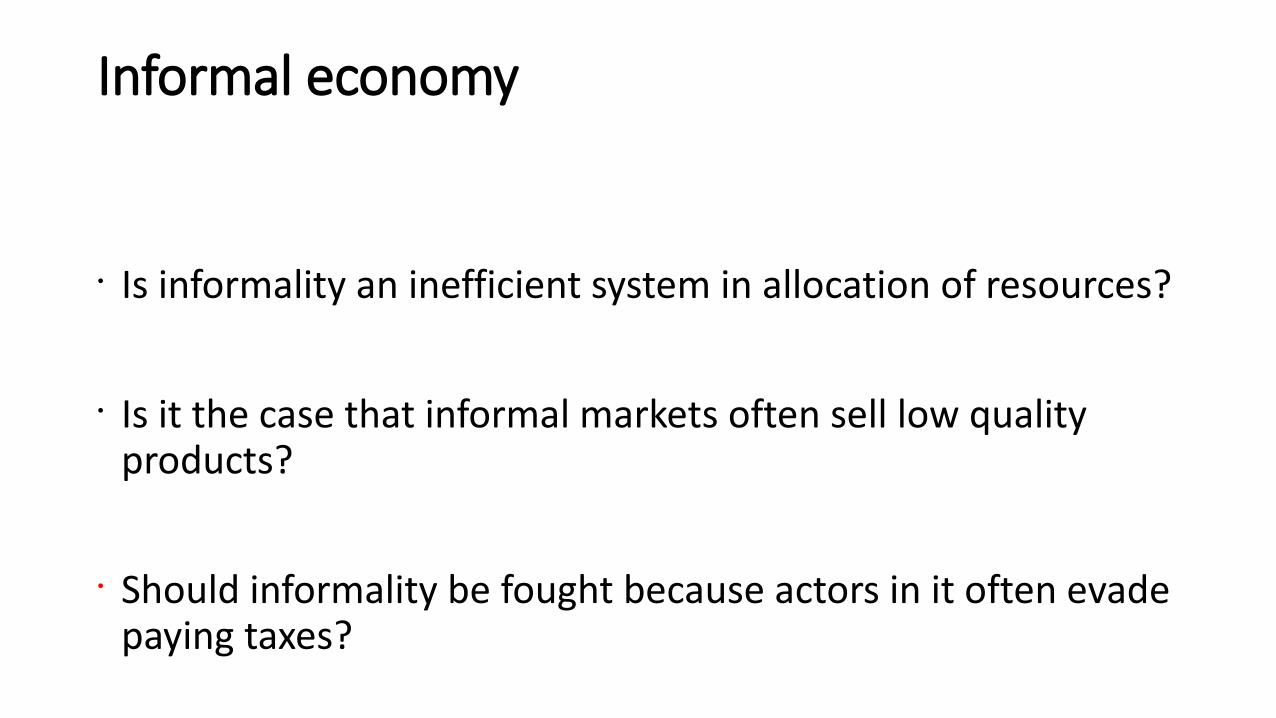
Informal economy
• Is informality an inefficient system in allocation of resources?
• Is it the case that informal markets often sell low quality products?
• Should informality be fought because actors in it often evade paying taxes?
Methods used
• Survey• Participatory and iterative methods• Value chain methods• Undercover method
Key characteristics
Trade flows: Key species traded: Actors involved
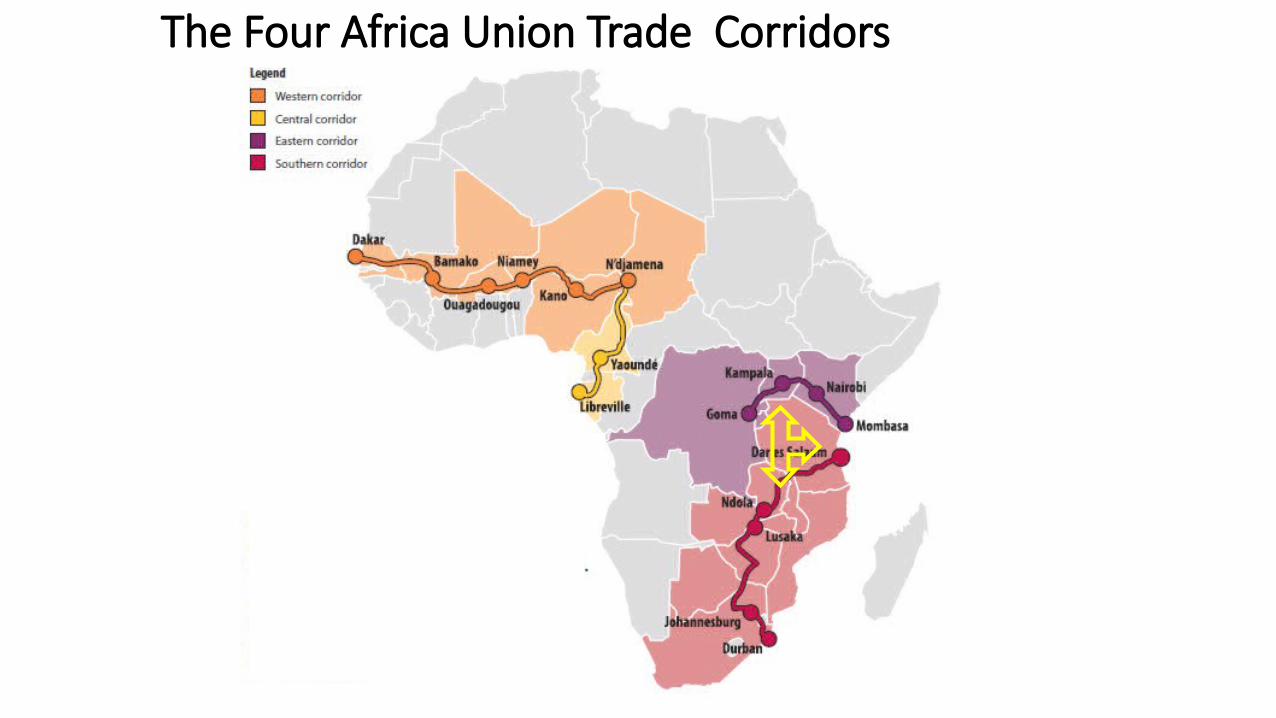
The Four Africa Union Trade Corridors
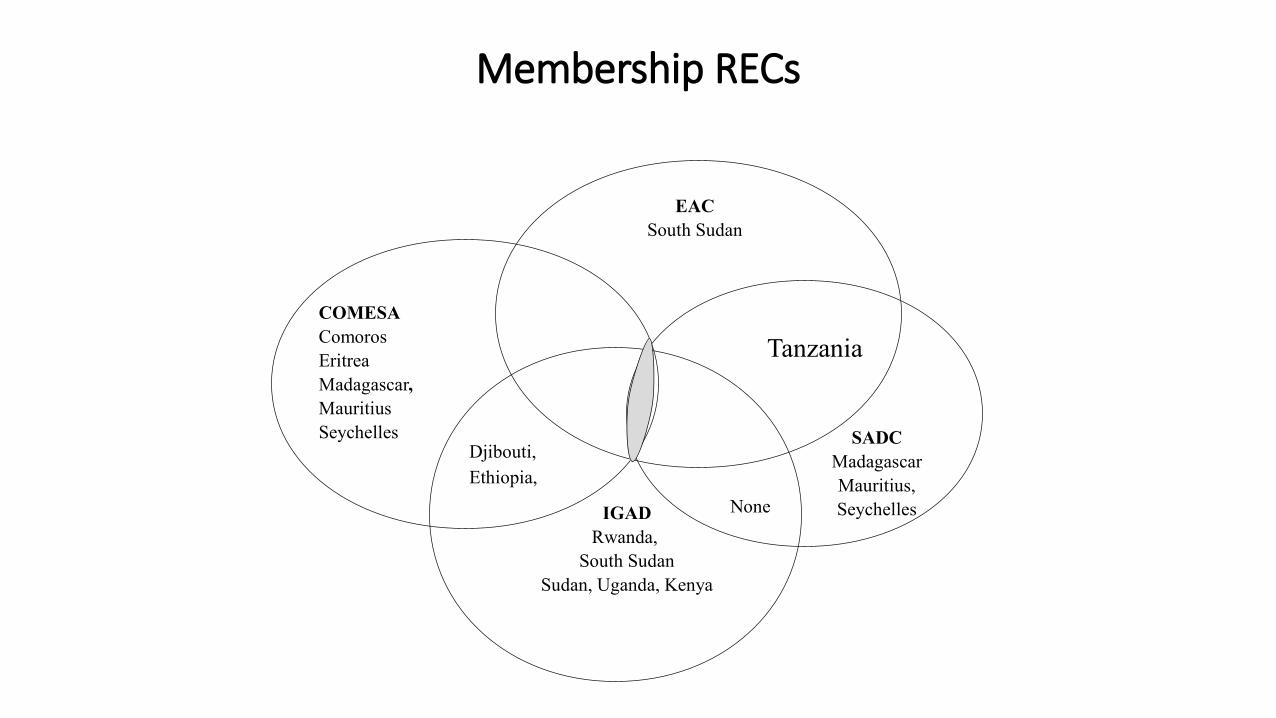
Membership RECs
Djibouti, Ethiopia,
None
SADCMadagascar Mauritius, Seychelles
EACSouth Sudan
COMESAComorosEritrea Madagascar, MauritiusSeychelles
Tanzania
IGADRwanda,
South SudanSudan, Uganda, Kenya
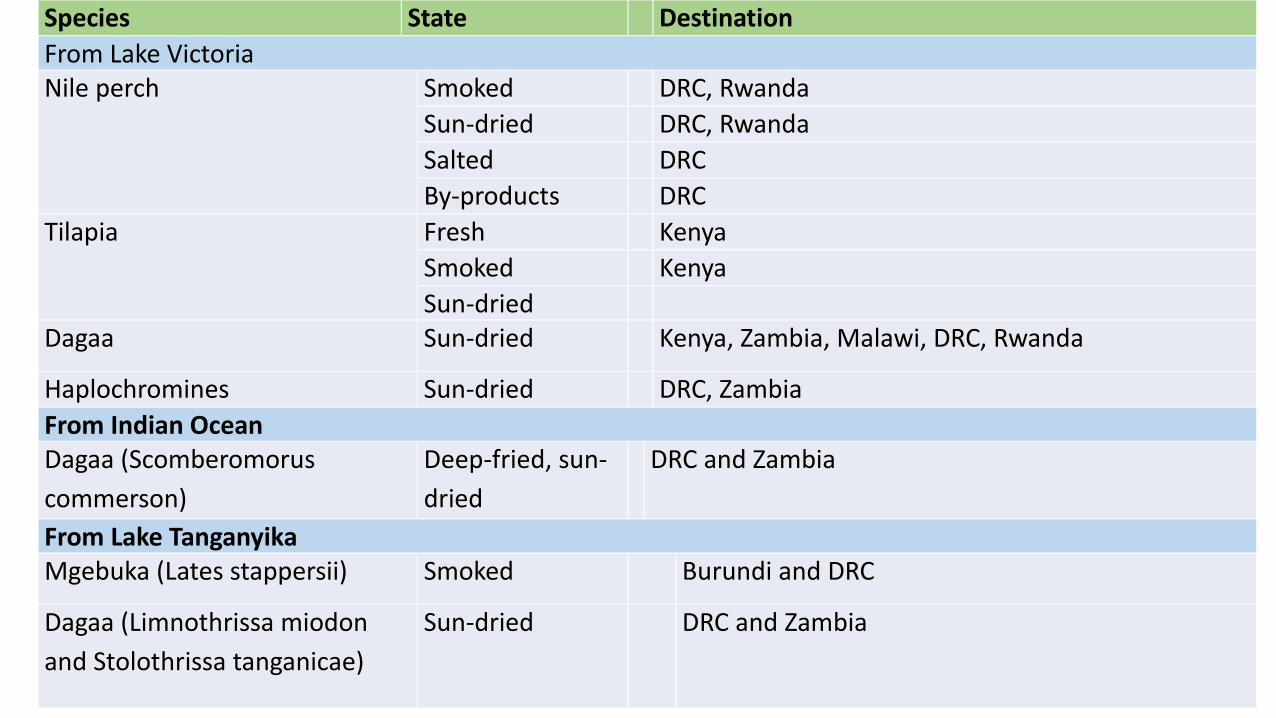
Species State DestinationFrom Lake VictoriaNile perch Smoked DRC, Rwanda
Sun-dried DRC, RwandaSalted DRCBy-products DRC
Tilapia Fresh KenyaSmoked KenyaSun-dried
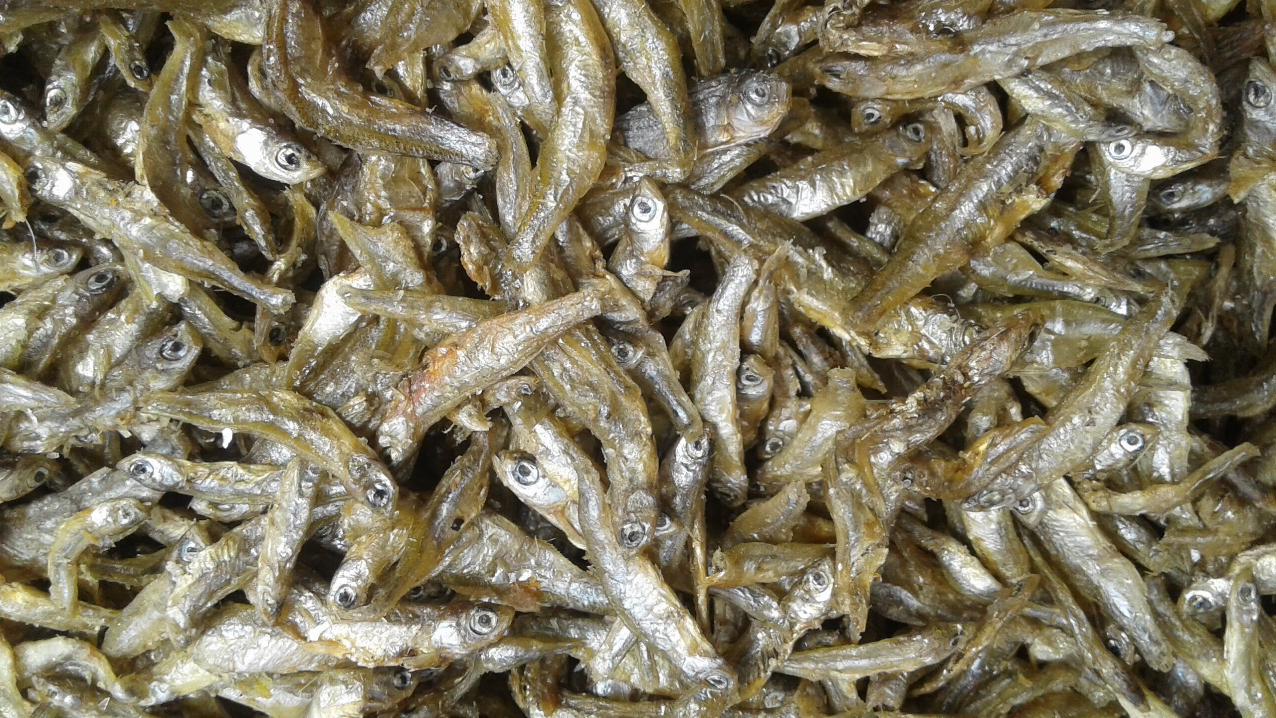
Dagaa Sun-dried Kenya, Zambia, Malawi, DRC, Rwanda
Haplochromines Sun-dried DRC, ZambiaFrom Indian OceanDagaa (Scomberomorus commerson)
Deep-fried, sun-dried
DRC and Zambia
From Lake TanganyikaMgebuka (Lates stappersii) Smoked Burundi and DRC
Dagaa (Limnothrissa miodon and Stolothrissa tanganicae)
Sun-dried DRC and Zambia
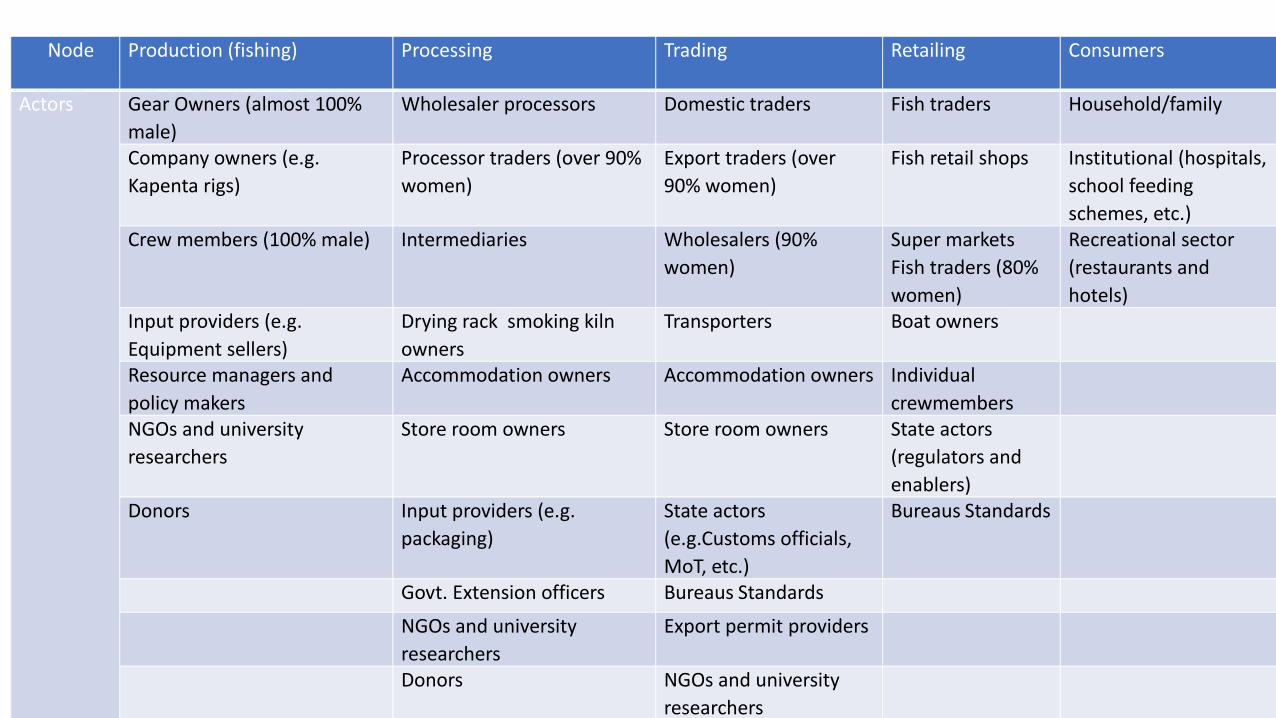
Fish Trade Actors Node Production (fishing)
Processing Trading Retailing Consumers
Actors Gear Owners (almost 100% male)
Wholesaler processors Domestic traders Fish traders Household/family
Company owners (e.g. Kapenta rigs)
Processor traders (over 90% women)
Export traders (over 90% women)
Fish retail shops Institutional (hospitals, school feeding schemes, etc.)
Crew members (100% male) Intermediaries Wholesalers (90% women)
Super marketsFish traders (80% women)
Recreational sector (restaurants and hotels)
Input providers (e.g. Equipment sellers)
Drying rack smoking kiln owners
Transporters Boat owners
Resource managers and policy makers
Accommodation owners Accommodation owners Individual crewmembers
NGOs and university researchers
Store room owners Store room owners State actors (regulators and enablers)
Donors Input providers (e.g. packaging)
State actors (e.g.Customs officials, MoT, etc.)
Bureaus Standards
Govt. Extension officers Bureaus Standards
NGOs and university researchers
Export permit providers
Donors NGOs and university researchers
Donors RECs
Exports: Routes: Cross border trade
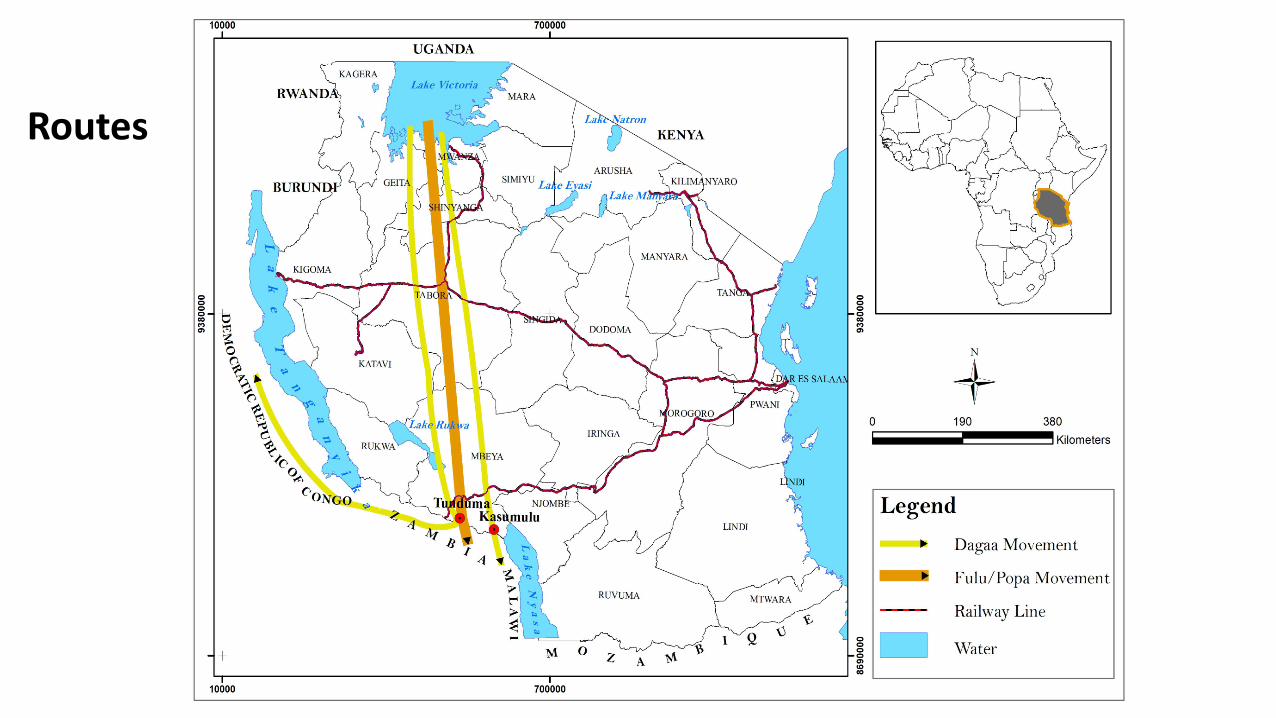
Routes
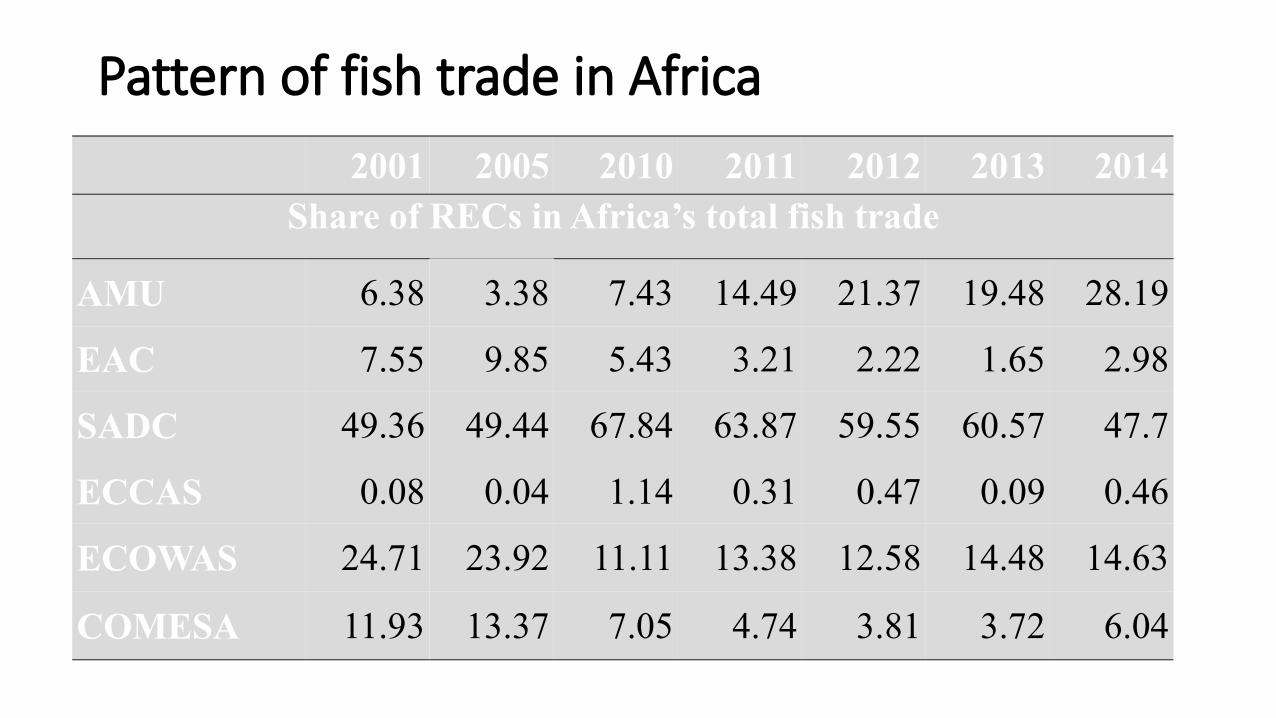
Pattern of fish trade in Africa 2001 2005 2010 2011 2012 2013 2014
Share of RECs in Africa’s total fish trade
AMU 6.38 3.38 7.43 14.49 21.37 19.48 28.19
EAC 7.55 9.85 5.43 3.21 2.22 1.65 2.98
SADC 49.36 49.44 67.84 63.87 59.55 60.57 47.7
ECCAS 0.08 0.04 1.14 0.31 0.47 0.09 0.46
ECOWAS 24.71 23.92 11.11 13.38 12.58 14.48 14.63
COMESA 11.93 13.37 7.05 4.74 3.81 3.72 6.04
Dagaa fish exported from three markets of Lake Victoria between 2010 and 2015
Source: TAFIRI and WorldFish Center, 2016
Dagaa undeclared at Tunduma border between 2013 and 2016 (in Kg)
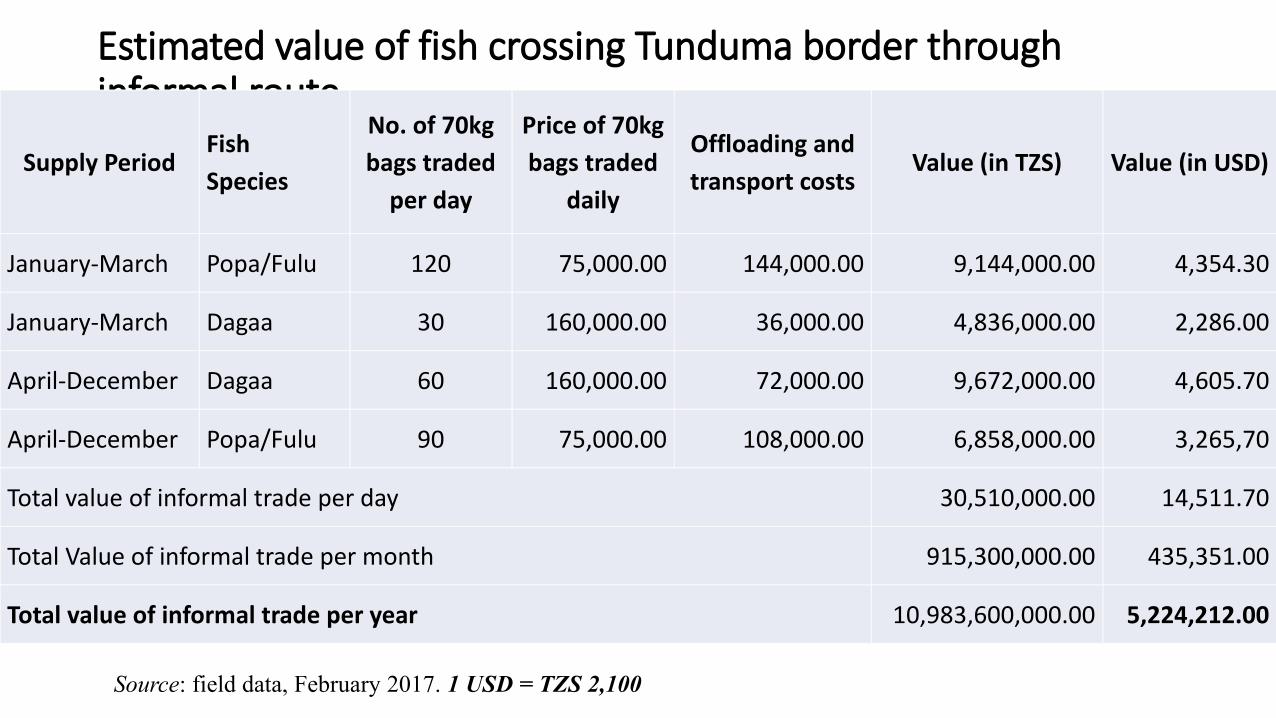
Estimated value of fish crossing Tunduma border through informal route
Supply PeriodFish Species
No. of 70kg bags traded
per day
Price of 70kg bags traded
daily
Offloading and transport costs
Value (in TZS) Value (in USD)
January-March Popa/Fulu 120 75,000.00 144,000.00 9,144,000.00 4,354.30
January-March Dagaa 30 160,000.00 36,000.00 4,836,000.00 2,286.00
April-December Dagaa 60 160,000.00 72,000.00 9,672,000.00 4,605.70
April-December Popa/Fulu 90 75,000.00 108,000.00 6,858,000.00 3,265,70
Total value of informal trade per day 30,510,000.00 14,511.70
Total Value of informal trade per month 915,300,000.00 435,351.00
Total value of informal trade per year 10,983,600,000.00 5,224,212.00
Source: field data, February 2017. 1 USD = TZS 2,100
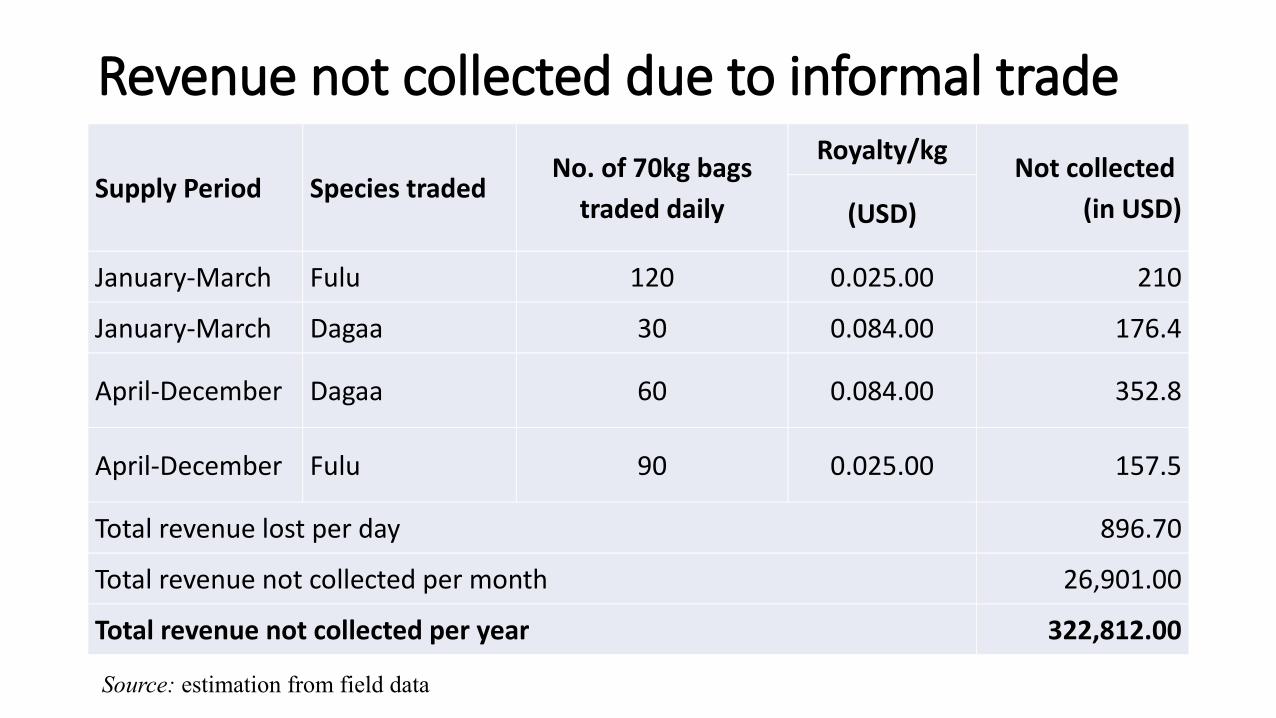
Revenue not collected due to informal trade
Supply Period Species tradedNo. of 70kg bags
traded daily
Royalty/kg Not collected (in USD)(USD)
January-March Fulu 120 0.025.00 210
January-March Dagaa 30 0.084.00 176.4
April-December Dagaa 60 0.084.00 352.8
April-December Fulu 90 0.025.00 157.5
Total revenue lost per day 896.70
Total revenue not collected per month 26,901.00
Total revenue not collected per year 322,812.00
Source: estimation from field data

Where does this money go if not collected?
Is it lost or slipping off ?
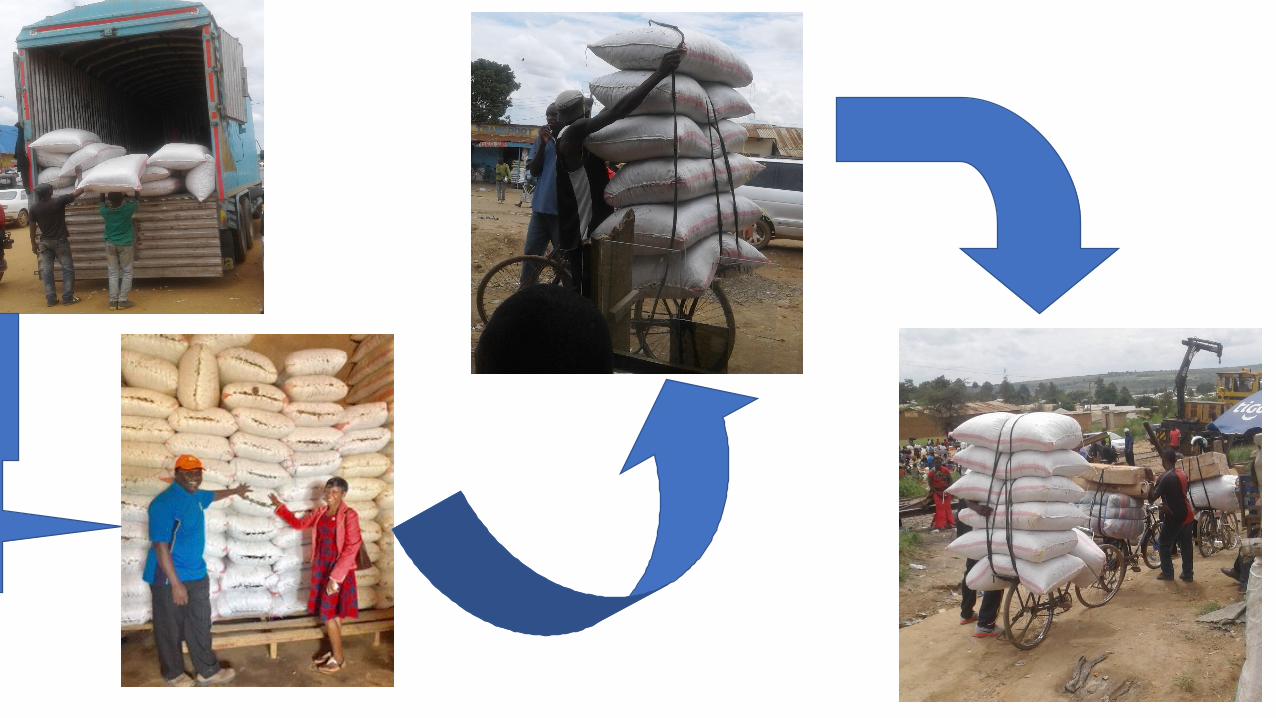
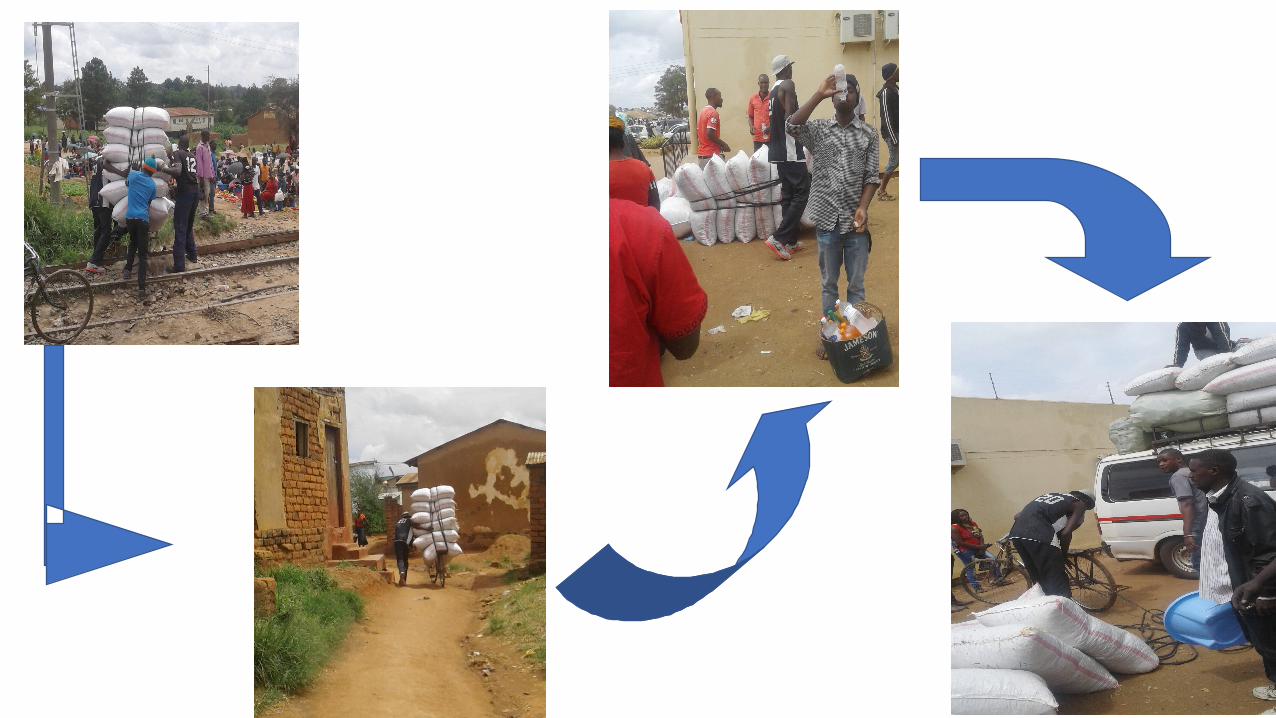
• Created employment (Off-loaders, bicycle transporters, bicycle pushers)
• Functional shopping and convenience for traders• Low administrative costs on the part of government• Increases incomes for low skilled and poor populations• Provides the economy with the operative and
entrepreneurial spirit• Indication of lower production performance
Should informality be fought because actors in it often evade paying taxes?
Is quantification of informality understood by measuring revenue not collected?
Can we think of a broader measure on the slipping millions contribution to the economy?