SLIPPING INTO AND OUT OF POVERTY: THE DYNAMICS OF SPELLS ... · SLIPPING INTO AND OUT OF POVERTY:...
24
SLIPPING INTO AND OUT OF POVERTY: THE DYNAMICS OF SPELLS MARY JO BANE DAVID T. ELLWOOD ABSTRACT This paper examines the dynamics of poverty. Previous analyses have examined either fluctuations in the male heads' eamings or the frequency of poverty periods over a fixed time frame. Our approach depends on a definition of spells of poverty. Using this methodology we find that the majority of poor persons at any time are in the midst of a rather long spell of poverty. The methodology also allows us to estimate that less than 40 percent of poverty spells begin because of a drop in the heads' eamings, while 60 percent of the spells end when the heads' eamings increase. Thus, researchers must focus on household formation decisions and on the behavior of secondary family members. There has beeti a dramatic resurgence recently of discussion of the "underclass." The discussion is retniniscent of debates about poverty during the 1960s, when the notions of a "culture of poverty," particularly as popularized by Michael Harrington's Other America (1962), dominated both intellectual and policy thinking. The idea of an underclass seems inconsistent, however, with much of the research on the dynamics of poverty during the 1970s. That research, using new longitudinal data, seemed to show that the bulk of the poor were poor for only a few years. The research also showed that the poor were a very heterogeneous group, including a small minority of persistently poor. The persistence of poverty is of interest both for understanding the phenomenon and for developing policy. Claims about dependency and separate life styles among the poor rest on assumptions about the long-term nature of poverty. Questions The authors are both associate professors at the John F. Kennedy School of Government, Harvard University. [Manuscript received August 1985; accepted Septemher 1985.]
Transcript of SLIPPING INTO AND OUT OF POVERTY: THE DYNAMICS OF SPELLS ... · SLIPPING INTO AND OUT OF POVERTY:...

SLIPPING INTO AND OUT OF POVERTY:
THE DYNAMICS OF SPELLS
MARY JO BANEDAVID T. ELLWOOD
ABSTRACT
This paper examines the dynamics of poverty. Previous analyses have examinedeither fluctuations in the male heads' eamings or the frequency of poverty periodsover a fixed time frame. Our approach depends on a definition of spells of poverty.Using this methodology we find that the majority of poor persons at any time arein the midst of a rather long spell of poverty. The methodology also allows us toestimate that less than 40 percent of poverty spells begin because of a drop in theheads' eamings, while 60 percent of the spells end when the heads' eamings increase.Thus, researchers must focus on household formation decisions and on the behaviorof secondary family members.
There has beeti a dramatic resurgence recently of discussion of the "underclass."The discussion is retniniscent of debates about poverty during the 1960s, whenthe notions of a "culture of poverty," particularly as popularized by MichaelHarrington's Other America (1962), dominated both intellectual and policythinking.
The idea of an underclass seems inconsistent, however, with much of theresearch on the dynamics of poverty during the 1970s. That research, using newlongitudinal data, seemed to show that the bulk of the poor were poor for onlya few years. The research also showed that the poor were a very heterogeneousgroup, including a small minority of persistently poor.
The persistence of poverty is of interest both for understanding the phenomenonand for developing policy. Claims about dependency and separate life styles amongthe poor rest on assumptions about the long-term nature of poverty. Questions
The authors are both associate professors at the John F. Kennedy School of Government, HarvardUniversity.[Manuscript received August 1985; accepted Septemher 1985.]

2 I THE JOURNAL OF HUMAN RESOURCES
about the allocation of resources can better be answered when the characteristicsof the poor are understood.
To answer all these questions it is important to be able to describe the experi-ence both of people who ever slip into poverty and of people who currently arepoor. We shall show that the distinction between the ever-poor (or the newlypoor) and the poor at a particular time is crucial in understanding poverty andin shedding light on the question of culture, dependency, and allocation ofresources.
The availability of longitudinal income and poverty data now spanning morethan a decade makes possible comprehensive analyses of the durations, beginnings,and endings of spells of poverty. The preliminary analyses we report in this articlelead us to conclude that the seemingly inconsistent findings on permanent andtransitory poverty from the sixties and seventies can indeed be reconciled. Ourprimary finding is that although many people have very short spells of poverty,the few with very long spells account for the bulk of all poverty and representthe majority of the poor at any given time. We also report some analyses of eventsleading to the beginnings and endings of spells of poverty which help to explainthe ways in which the poor slip into poverty and escape it.
/. DESCRIBING DYNAMICS—PREVIOUS RESEARCH
There are three primary approaches which have been followed in recent yearsto describe the dynamics of various types of behavior. These include statisticalmethods which model the level of some variable such as income, allowing fora complex lag or error structure to capture dynamics; methods using spell dura-tions and exit probabilities; and finally tabulations of the frequency of the eventover some fixed time frame. The bulk of the literature on the dynamics of povertyuses the first and third methods. We employ the second. We begin by brieflyconsidering the advantages and disadvantages of each approach.
Any model of income estimated with longitudinal data implicitly or explicitlyprovides a model of intertemporal dynamics. Typically the dynamics are sub-sumed in the error structure. In their classic paper Lillard and Willis (1978) modelthe level of eamings of a group of prime-age men and pay close attention to theerror structure, allowing for both permanent and transitory components in theerror. After estimating such a model it is possible to examine the frequency andduration of periods of poverty by asking what fraction of the population is likelyto be below the poverty line and for how long, based on the estimated structureof eamings.
This approach has appeal. First it largely mirrors the famous Friedmantheoretical decomposition of permanent and transitory income. Moreover it dealsexplicitly with the problem that the poverty line is an arbitrarily defined stan-dard, around which income can fluctuate randomly. Permanent income can be

Bane and Ellwood I 3
estimated and the poor can be decomposed into the groups which are permanentlyand transitorily poor. And the expected durations in poverty can be inferred forany arbitrary poverty line. Both Levy (1977) and Gottschalk (1982) also emphasizethe importance of the permanent/transitory decomposition, although they use dif-ferent methodologies from those of Lillard and Willis.
Although the Lillard and Willis approach has great appeal for ascertaining theincome dynamics of prime-age males, it has shortcomings as a method forunderstanding the nature and dynamics of poverty for the entire population. Itis exceptionally difficult to cope with the fact that "poverty" is a concept thatapplies to families—and that family membership changes. One can certainly speakof permanent and transitory components in eamings for prime age males, buthow should one treat the income pattern that results when a family splits up andthe former wife who was previously out of the labor force goes to work to helpsupport her children? How should one characterize changes in income andeconomic status caused by the household formation choices of young people wholeave well-to-do homes and are poor for a period while they make the completetransition to the labor market? In principle the income of each family membercould be modeled individually, allowing for simultaneous influences from andto family structure, and allowing for life cycle changes. In fact such models aredifficult to develop.
Altematively, one could model not just personal income hut family incomerelative to the poverty line for each individual. When the membership of the indi-vidual's family changed, both family income and family needs would be adjustedto reflect a new situation. This income-to-needs ratio might be hypothesized tohave a permanent and a transitory component just as in the case of individualeamings. Yet this approach also has weaknesses. Changes in the income-needsratio caused by the departure or entrance of another family member, those causedby variations in earnings of the individual, and those caused by variation in othersources of income are all treated equivalently. While it may make sense to talkof a permanent component in earnings, it is far less clear that there is a perma-nent component of income-to-needs where family situations arc changing rapidly.
The notion of a permanent income is easier to implement empirically for able-bodied prime-age males than it is for women, children, the elderly, or the dis-abled. Both Lillard and Willis and Gottschalk limit their analyses to prime-agemales, and Levy did not actually implement a permanent income model. In 1981,however, males aged 22-64 made up only 15.5 percent of the officially definedpoor (U.S. Bureau of the Census 1982). The experience of the rest of the poormay not be well described by the permanent income notion.
Perhaps even more fundamentally, all deviations from permanent income tendto be treated as random and behaviorally equivalent in those models. Typicallyall "disturbances" in income lead to the same temporal path of income in thefuture. But all changes in family income are not likely to lead to the same sortof long-run dynamics. The worker who is poor because he was temporarily laid

4 I THE JOURNAL OF HUMAN RESOURCES
off from his job is unlikely to have the same prospect of long-term poverty asone who lost his job when he became disabled.
Quite often these disturbances are of great interest in their own right. Indeedif dynamics are being considered, the changes themselves really are the drivingforce. Presumably those interested in understanding poverty are interested in know-ing what sorts of adverse events lead people into poverty, whether the durationof a poverty stay varies depending on how it began, and how (if ever) familiesescape poverty. When the events leading into and out of poverty are a sourceof considerable interest it seems strange and unfortunate to treat these ashomogeneous and largely unobservable disturbance terms. Of course these couldbe modeled explicitly, but at great cost in complexity.
Another approach has been adopted by Duncan (1984), Coe, Duncan, and Hill(1982), Coe (1978), Rainwater (1982), and others. They look at the proportionof the number of persons who are poor by some definition over a fixed timeframe—typically eight or ten years. One can tabulate how many people were poorfor, say, ten out often years, or five out often, or one out often. The approachis very simple to use—it need involve no more than simple tabulation. Changingfamily structures cause no problems. The unit of analysis is typically the individualand his or her poverty status at any time and the poverty status of his or her familyat that time. For purposes of tabulation it does not matter if poverty status changesbecause family structure changes or because income of a family changes.
The approach also has some of the appeal of methods based more explicitlyon permanent income notions, because those who were transitorily poor will seem-ingly show up as people with very little poverty over the period, those who havevery low permanent income will be poor for most of the period, and those whoseincomes fluctuate back and forth across the poverty line will be the intermediategroup. But in this case again, no attention is focused on the events which leadpeople into and out of poverty. It is very difficult to trace processes wherebypersons may gradually or suddenly escape from poverty.
But more importantly, this method can be misleading. Consider an extremeexample. Suppose all poverty occurs in spells lasting exactly ten years. If wewere to ask how many persons who were poor over a ten-year survey periodremained poor the entire time, only those people who happened to begin theirten-year spell in the first year of the survey would be counted. Those who beganspells in the year prior to or the year after the survey began would have nine-year episodes in the survey. Those who began nine years before or after the surveystarted would have one-year episodes. Thus even though all spells lasted exactlyten years, because completed spells cannot be observed in the survey, one willfind that roughly equal numbers of people were poor for one survey year, twosurvey years, and so forth. Obviously any conclusion that only a small numberof poor persons remained in poverty for a long time would be quite misleadingbecause of the censored spells.

Bane and Ellwood I 5
We propose instead to model spells of poverty. While we acknowledge andaddress the problems caused by the crossing of an artificial threshold', we thinka spell approach provides a simple and compact way to understand the dynamicsof poverty. One advantage of using spells is that information can be summarizedin a comprehensible manner. Indeed Lillard and Willis and many others imposethe artificial poverty line on their structurally estimated income dynamics, andreport durations of spells and the probability of moving from poverty. All wepropose is to examine those issues directly.
Other researchers have looked at movements into and out of poverty, both toestimate the amount of movement and to examine the characteristics of those whodo and do not move. Hill (1981) and Levy (1977) have calculated exit probabil-ities for those who enter and exit from poverty. Boskin and Nold (1975), Hutchins(1981), Plotnick (1983), and Wiseman (1976) have explored movements on andoff of welfare.
We follow this line of research, and extend it in three ways: by looking at avariety of distributions, by allowing for duration-dependent exit probabilities, andby identifying beginning and ending events. None of the research has reportedthe full set of distributions that are important for understanding the dynamics ofpoverty: completed spell distributions for people beginning a spell of poverty andfor those poor at a given time; and the uncompleted spell distribution for peoplepoor at a given time. The importance of the distinctions between these distribu-tions has been emphasized by several scholars. Kaitz (1970), Salant (1977), Clarkand Summers (1979), and Akerlof and Main (1982), for example, have pointedout that while most people who become unemployed are in that state for onlya short period of time, the bulk of unemployment is long term. As we explainin our next section, we believe these distinctions are important for understandingpoverty as well.
Moreover, little of the research on flows into and out of poverty has lookedexplicitly at differences in exit probabilities by time in poverty. Levy (1977)reported no differences in exit probabilities over time, but his analysis includedall the people who were poor in his beginning year, regardless of how long theyhad been poor before being observed. Much of the research on movements onand off of welfare, for example Plotnick's (1983) event history analysis, as wellas Hutchins's (1981) and Wiseman's (1976) assumes constant exit probabilities.It's worth noting that a permanent income model predicts that exit probabilitieswill decline with duration because those who are temporarily poor will leave early,leaving behind those who will never exit.
Finally, there has been little research on the events associated with movementsinto and out of poverty. Levy (1977) and Gottschalk (1982), for example, dismissthe importance of family composition changes, noting that most people do not
1 It is worth noting that nearly all logit or probit models use an artificial threshold to model behavior.

6 I THE JOURNAL OF HUMAN RESOURCES
change their family composition very often and that most income changes arenot associated with family compositions changes. While this is true generally,we do not believe it is so true for the poverty population, especially looking overrather long periods of time, and thus we deal with it here as an important topicfor empirical investigation. A key innovation of this study is our characterizationof the events which lead to the beginnings and endings of spells of poverty.
//. METHODOLOGY
The ideal methodology for examining durations of spells of poverty and thecharacteristics of spells of various lengths would utilize an extremely large dataset covering a very long period of time. With such a data set, one could simplytabulate the actual distribution of completed spells for people who began a spellin some previous year long in the past. One could also tabulate the distributionof completed spells for those people who were poor at some time in the past.
Unfortunately, such a data set does not exist. The data we used, from the fifteen-year sample of the Panel Study of Income Dynamics (PSID), are the best availablefor examining poverty dynamics. The original study design oversampled low-income households and thus generated reasonable sample sizes. ̂ Detailed incomedata were collected each year.' We were able to use twelve years of data forstudying poverty dynamics, from 1970 to 1982. To make full use of the data,our analyses are based on exit probabilities tabulated from the data, which werethen used to derive the various distributions we report.
Our basic methodology for estimating the durations of spells of poverty hasthree parts. We first identify "spells"—continuous periods during which incomefalls below the poverty line. We then calculate exit probabilities (or hazard func-tions, or death rates), and then use exit probabilities to generate distributions ofspell lengths for new spells, and for completed and uncompleted spells observedat a point in time.
A. Definition of Spells
We first defined poverty in each given year as income below a needs standardcalculated on the basis of household size. We included all cash transfers in thedefinition of income but excluded in-kind transfers as is done in the standardpoverty definitions. The PSID provides a need standard that is essentiallyequivalent to that used by the Census Bureau and OMB in calculating poverty.Largely because the PSID finds more income than the Current Population Survey,however, the reported poverty rate is lower in PSID data. In order to make our
2 The oversampling does not introduce bias so long as correct weights are used.3 The PSID is described in detail in Survey Research Center 1983.
Bane and Ellwood I 7
figures comparable to the published figures we inflated the needs standard by1.25." Using the uninflated definition changes our results very little. It leavesus with slightly smaller sample sizes and slightly shorter spells of poverty.
In all of our tabulations we excluded persons who began a spell of povertywhen they were 65 or over. The public use PSID tape has one unfortunate feature:persons who die during the sample period are excluded from the sample evenfor the years when they were alive. It was impossible for us to track people whoended a spell of poverty when they died. Thus we used the over-64 exclusion.
Normally, we defined a spell of poverty as beginning in the first year that incomewas below the poverty line after having been above it, and as ending when incomewas above the poverty line after having been below. The problem as we havenoted already is that unlike employment or even welfare use, poverty is not aclear-cut state. The poverty line is an arbitrarily defined concept, and small"random" changes in income can move people across the line, creating a "spell"even though no change of any significance to the individual involved has occurred.Moreover, measurement error can cause a false beginning or end.
Yet the spell concept has so many advantages that we chose to make some simpleadjustments for pure randomness or measurement error. One-year spells eitherinto or out of poverty were eliminated if they either began or ended with an incomechange that was less than one-half the needs standard. No spell lasting more thanone year was affected. This adjustment had very little impact on the number ofpeople who were ever poor. We reduced the number of persons who were ever-poor in our sample by only 5.5 percent by eliminating these selected one-yearspells of poverty. It did help to reduce the number of multiple spells among theever-poor. Without the adjustment, 43 percent of the ever-poor had multiple spellsover the thirteen-year sample period, while with the adjustment 31 percent did.
B. Calculation of Exit Probabilities
The exit probabilities reported in our various tables were calculated by combin-ing years of data from the PSID. We used data on all spells for which we observedbeginnings, regardless of whether we also observed endings. Spells with anobserved beginning, which were censored at the end of the sample period, wereproperly included in the calculations of exit probabilities in all but the censoredyear. The exit probabilities are based on beginnings and continuations summedover all years. For example, the exit probability for the first year of a spell isbased on data for all the spells of poverty that began between 1970 and 1981.(Data limitations and several features of our methodology preclude the use of1968 and 1969 data.) The exit probability for the second year is based on allthe spells for which a second year was observed: such spells could have begun
Actually the needs standard reported on the PSID is already 25 percent higher than the traditionalOMB standard, thus we used the value included on the file without further adjustment.

8 I THE JOURNAL OF HUMAN RESOURCES
in any year between 1970 and 1980. Since the unit of observation is a personin a spell of poverty, persons with multiple spells during the sample period wereincluded each time they had a spell.
This procedure means that the sample sizes are quite large for calculating exitprobabilities for the first several years. After that, they become smaller and lessreliable. We chose to calculate exit probabilities for up to nine years. Beyondthat, sample sizes became rather small. Obviously some spells last longer thanthat, so we need estimates of exit probabilities in later years in order to calculatethe full distributions. We assumed that the exit probabilities for year ten and beyondwere stable and approximately equal to the calculated exit probabilities for yearsseven through nine. We regard this as a very reasonable assumption since exitrates in the later years seem relatively stable and show no clear pattern. We alsoassumed, primarily for ease of calculation, that no spells lasted longer than 30years.
C. Beginning and Ending Events
For all spells for which we observed a beginning or an ending, we attemptedto identify a beginning or ending event. We decided to classify beginning andending events into mutually exclusive categories. Thus we looked for the primaryreason the family's poverty situation changed. We developed a hierarchicalclassification system. We first looked for a significant family structure change-defined as a change in the head of household—within the previous two years.'If such a family structure change had occurred, we associated the beginning orending to that event. Although other factors may have simultaneously changedwhich accounted for a family's movement into or out of poverty, we felt thatthe change of headship is significant enough to warrant its special treatment. Indeedmany behavioral changes which might account for a higher or lower level of familyincome may be the direct result of the headship change, as in the case wherea family breakup forces a woman to quit working.
In families where there had been no headship change, we determined whetherthe change in the income/needs ratio was more influenced by the income numeratoror by the needs denominator. Needs-dominated changes were rare and they weretypically brought about by the birth of children or by the departure of membersfrom the household. The remaining changes were income changes. To furtherclassify these we determined which component of family income changed the most:head's earnings, wife's earnings, others' earnings, or transfer income.
Because family structure is defmed at the time of the survey whereas income is reported for theprevious year, it is possible that income changes would not show up until the year after a familystructure change is observed.

Bane and Ellwood I 9
///. EXIT PROBABILITIES
Table 1 displays the exit probabilities derived from the PSID, the sample sizes,and standard errors. It is clear that the longer a person has been poor, the lesslikely it is that he or she will escape poverty. The probability of exiting povertydeclines as time in the poverty spell increases. If a person is in the first year ofa spell of poverty, the probability of exiting is 0.45. If he or she is in the fourthyear, however, the probability of exiting has fallen to 0.21. These declines couldcome about for either of two reasons. One possibility is that poverty itself makesit more difficult to leave. Long spells of poverty may, for example, make it increas-ingly difficult to get the kind of jobs that generate income above the poverty line.
A second possibility is that declining exit probabilities are simply a result ofthe heterogeneity of the poverty population. People who are "long-termers" maybe different in various ways from people who are poor only a short time. Long-termers' exit probabilities are always low, no matter how long or short a timethey have been poor. Over time, people with these long-termer characteristicsmake up a larger and larger proportion of the poverty population. An interpreta-tion consistent with the permanent income context would be that those withtemporarily low incomes are gradually selected out, leaving only those who arepermanently poor. Without imposing functional form assumptions on these data
TABLE 1POVERTY SPELL EXIT PROBABILITIES, SAMPLE SIZES, AND STANDARD ERRORS
BY LENGTH OF SPELL TO DATE
Spell Lengthto Date (years)
1234567899-2930
ExitProbability
0.4450.2850.2460.2080.1970.1450.1280.0740.0830.100*1.000*
StandardError
0.0100.0120.0130.0160.0180.0170.0190.0160.024
——
SampleSize
5,8723,2202,1451,5041,096
759516334223
——
Source: Probabilities and standard errors are derived from the Panel Study of Income Dynamicsand are weighted.
* Value assumed
10 I THE JOURNAL OF HUMAN RESOURCES
it is virtually impossible to decompose the extent to which declines in exit prob-abilities reflect heterogeneity or "duration dependence."
One important conclusion which follows directly from these exit probabilitiesis that persons who have been poor for three years are far less likely to escapepoverty. Some 60 percent of those persons just beginning a spell of poverty willexit within two years. But only 36 percent of those who have been poor for threeyears will escape within the next two.
With these exit probabilities, we can say quite a bit more about the dynamicsof poverty. As we noted earlier, however, in order to make such calculations,exit probabilities had to be assumed for years beyond the maximum eight yearswe could observe. We chose to use 0.10 in all our calculations. This numberseems conservative to us. The true probabilities are well below 0.10 in the eighthand ninth years of spells. And it is reasonable to believe that these probabilitiescontinue to fall. If so, the results we report would be even more dramatic.
IV. CALCULATION OF DISTRIBUTIONS
If the probability that a person who has been poor for t years will not be poorin the next year is given by the exit probability p(t), then three important distribu-tions are easily derived.
Let D{t) describe the fraction of the number of people who have spells whichlast exactly t years. Then
DO) =
(1) D{t) = p(t)[l - ' E D ( / ) ] , for 7- > / > 1,
T-l
D{T) = 1 - E D{j), D{T) where T is maximum length of spells.
The first term in equation (1) is simply the exit probability, the second is thefraction surviving to year f - 1.
The distribution of completed spells at a point in time can be derived providedone assumes a no-growth steady state.* If F(t) gives the fraction of the numberof all persons on the program at a given time who will be poor for exactly / years,then
(2) Fit) ^ tD(t)l L jD(j)i
This assumption of no-growth steady state is not unreasonable for the period of time we are observ-ing. The number of beginnings of spells of poverty in the PSID sample was relatively constantfrom 1968 to 1979. The poverty rate for the general population, as reported by the Current Popula-tion, was 12.8 percent in 1968 and 13.0 percent in 1979, with year-to-year differences mostlyreflecting the business cycle.

Bane and Ellwood I 11
Finally the distribution of uncompleted spells for persons poor at a given time,G(t), is derived by calculating the fraction of the number of persons who beganspells t years earlier who would still be on the program (and renormalizing) assuminga steady state.'
(3) G(t) = [1 - '^D(j)V h [1 - ' E Dik)]j[ 1 k\*=!
These three distributions offer considerable insights into the persistence of poverty.
V. THE PERSISTENCE OF POVERTY
Just how long does poverty (or unemployment, or welfare receipt, or employ-ment) last? The answer depends on whether we are interested in the group ofpeople who ever enter poverty or the group that is poor at a given time. A non-poverty example can help make the point.
Consider the situation in a typical hospital. Most of the persons admitted inany year will require only a very short spell of hospitalization. But a few of thenewly admitted patients are chronically ill and will have extended stays in thehospital. If we ask what proportion of all admissions are people who are chronicallyill, the answer is relatively few. On the other hand, if we ask what fraction ofthe number of the hospital's beds at any one time are occupied by the chronicallyill, the answer is much larger. The reason is simple. Although the chronicallyill account for only a small fraction of all admissions, because they stay so longthey end up being a sizable part of the hospital population and they consume asizable proportion of the hospital's resources.
The same basic lesson applies to poverty. Only a small fraction of those whoenter poverty in any given year will be chronically poor. But people who will havelong spells of poverty represent a sizable portion of the group we label "the poor"at any one time.
The point is illustrated in the distributions in Table 2, all of which are derivedfrom the exit probabilities reported in the previous table. Column 1 correspondsto admissions in our hospital example. It shows the prospective distribution ofcompleted spells of poverty for those just beginning a spell; i.e., for those whowere not poor last year but who are poor this year. Here we see that most spellsof poverty are quite short. Nearly 45 percent end within one year and 70 percentare over within three years. Only 12 percent last ten years or more.
Column 2 reports the distribution of completed spells for persons who are poorat a particular point in time, assuming the number and distribution of new spellsare constant over time. It is comparable to reporting prospective completed hospitalstays for all those now in the hospital as opposed to those who have just beenadmitted. These results suggest that more than 50 percent of those who would
7 The time period is somewhat more troublesome in calculating uncompleted spell distributions.

12 I THE JOURNAL OF HUMAN RESOURCES
TABLE 2DISTRIBUTIONS OF COMPLETED AND UNCOMPLETED
SPELLS OF POVERTY FOR NONELDERLY PERSONS
SpellLength(Years)
123456789Over 9
Totals
Average
PersotisBeginning
a Spell
(1)Completed
SpellDistribution
44.515.89.86.24.72.82.11.01.1
12.0
100.0
4.2
Personsa Given
(2)Completed
SpellDistribution
10.67.67.05.95.64.0
3.52.02.3
51.5
100.0
12.3
Poor atTime*
(3)Uncompleted
SpellDistribution
23.913.39.57.15.74.53.93.43.1
25.6
100.0
6.2
Source: Table derived from exit probabilities reported on Table 1.* Distributions derived assuming no growth steady state.
be identified as the poor in a cross-sectional survey are in the midst of a spellof poverty which will last ten years or more.
Just as in the hospital example where the chronically ill are only a small partof those admitted to the hospital but represent a large portion of the patients inthe hospital at any time, those who will be chronically poor are but a small frac-tion of those entering poverty but a large part of the poor at any time. The long-term poor account for a very large portion of all the person-years of poverty.Most people who slip into poverty are quite successful in getting out. But preciselybecause this is true, the people who escape quickly account for only a small frac-tion of all poverty and a small fraction of the poor at any point in time.
This dual nature of the poverty population can easily be missed if one looksonly at the distribution of new spells or of those who are ever poor. Anothertempting distribution can also be quite misleading. Since it can be difficult evenwith existing longitudinal data sources to collect reliable information on com-pleted spell lengths, one might choose instead to report the length of time those

Bane and Ellwood I 13
in poverty in some year have been poor up to that time.' The distribution of uncom-pleted spells of poverty for the poor at a point in time are reported in Column 3.
The uncompleted spell durations do have some interest, but they must not betreated as being equivalent to completed durations. We cannot conclude fromcolumn 3 that because only 25 percent of poor persons have been poor for morethan nine years that only one-quarter of those in poverty will be poor for overeight years. That would be comparable to observing the age distribution at onetime and concluding that only 12 percent of the current population will live pastage 65.
Thus it is not appropriate to conclude that the poor—poor in the sense that theywould be identified as poor in a particular year—are a group that generally hasbrief stays in poverty. Most people who are ever poor have short spells. Mostpeople who are just beginning a spell of poverty will have a short spell. But thebulk of those poor at a given time and the bulk of the person-years of povertyare accounted for by the long-term poor. If the long-term poor use at least asmany government resources per year of poverty as the short-term poor do, thenthe long-term poor consume the majority of the resources devoted to aiding thepoor (see, for example. Bane and Ellwood 1983). Let us now turn to the eventswhich are associated with movements into and out of poverty.
VL BEGINNING EVENTS
Table 3 shows our basic findings on the beginnings of spells of poverty amongthe nonelderly, by family status at the beginning of the spell and by beginningtype. This table shows distributions for those who are just beginning a spell ofpoverty. Later, we report distributions of beginning types for those poor at a giventime along with durations by beginning type. The table shows that male-headedhouseholds with children accounted for about 45 percent of all poverty-spell begin-nings. Female-headed households with children began another 26 percent of spellsof poverty. Married and unmarried adults without children account for theremainder.
A decline in a head's eamings was the single largest cause of movement intopoverty in our sample; 38 percent of all the spells of poverty whose beginningswe observed began with a decline in the labor income of the household head.The figure is perhaps significant not because it is large, rather because it is small.It suggests that most poverty is not explained simply by fluctuations in eamingsof the head.
The importance of the decline in heads' eamings differs across groups. Formale-headed households with children, such changes account for nearly 60 per-
8 The uncompleted spell distribution is quite commonly reported for unemployment and welfarereceipt. It is less common in the poverty literature.

14 I THE JOURNAL OF HUMAN RESOURCES
uCL.
O
<
z
si
Oi>•
<u.>•
CL.> •
O
zzIffi
U T3
l lu o
"M Z
I
• E 2E.2o SU U•o o.a z
u
IX(U
tt.
ta
I5
I•a
U
u
litP3 Cu <S
•* I
Tt VO v-i
Ov Tf >nod -- od
_ q
Ov 6 —
CN
Ov
qd
OS Ov
d
oo
00VO
vqd
qod
CN
od
Bane and Ellwood I 15
oo
I I o;
I I
I I
I I
cn Ovm —
I I
^1
>O 0C3
- - cn
I I
I I
vqod
li litf. I ^ O u ^ V
=• -o -o 1 * ?•3 ^ -g I 3 .sU U
VOCN
Ov
00od
C/3
u53 «
i2so
•o

16 I THE JOURNAL OF HUMAN RESOURCES
cent of all beginnings. By contrast, only 14 percent of spells for those in female-headed families begin when eamings of the head drop. Adults without childrenfall in between.
In addition some 11 percent of all spells of poverty began with changes in theearnings of wives or other household members, with others somewhat moreimportant than wives. For male-headed families with children, declines in wives'earnings accounted for 7 percent of transitions into poverty. Declines in others'eamings, usually adult children, were associated with another 5 percent of povertyspell beginnings. Among female heads with children, declines in others'eamings—again, usually adult children—accounted for about 10 percent ofbeginnings.
Thus earnings changes of all sorts account for about half of all spells of pov-erty. Another 8 percent are accounted for by changes in unearned income. Thiscategory includes those who lost a variety of benefits (such as UnemploymentCompensation, Workman's Compensation, disability benefits, welfare) and aidfrom others, such as child support or gifts from relatives. The remainder of povertybeginnings can be traced to family changes.
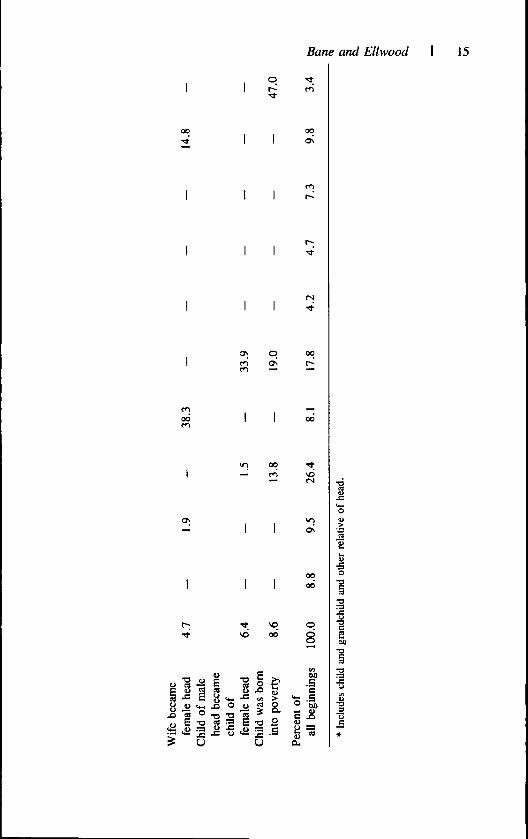
The transition to a female-headed family is an important event precipitatingtransitions into poverty, accounting for about 11 percent of all beginnings and59 percent of the beginnings for female heads with children. Among this lattergroup, about 38 percent of their poverty-spell beginnings come from maritalbreakup, a move from being a wife to being a female head, and another 21 per-cent from what is most likely unmarried motherhood.' Another 8 percent of allbeginnings are created by a changing need standard typically caused by the arri-val of a new family member.
A very large fraction of all poverty beginnings for children occur when theyare born into a poor family. Over 8 percent of all spells of poverty begin withbirth, and 20 percent of all the spells of poverty of children (in both male- andfemale-headed families) begin this way. Almost half of the spells for "otherrelatives" begin with births; these are mostly children who are living with theirgrandparents.
Finally, a sizable proportion of all spells of poverty begin with the movementof a young man or woman out of a parent's home into an independent household.Nearly 15 percent of all poverty spells began when a child moved out of his orher home and became a head, a wife, or a female head without a child. Thisbeginning type is most important for unmarried male heads, accounting for nearly55 percent of their starts in poverty. It is also a very prominent event for all theother groups without children. Much of this poverty is probably the "gettingstarted" phenomenon, no doubt also associated for some people with gettingfurther education or training, and for others with a decision that it is better tobe poor than to live at home.
9 This category includes both women who were formerly living independently who had a childand women who were formerly living in their parents' home who left along with a child.

Bane and Ellwood I 17
What emerges, then, is a picture of a rather heterogeneous poor population.The male-headed families most commonly have suffered a fall in earnings, thoughone-quarter of the beginnings for this group are for other reasons. Female-headedpoverty typically begins when the female-headed family is formed, either throughseparation/divorce or when an unmarried woman has a child. The poverty pat-terns for children not surprisingly mirror those of their families, though a sizablefraction are bom into poverty. Adults without children are an extremely diversegroup. Some are clearly "getting started" after leaving home. Others suffer eam-ings falls. Still others are probably older. Fluctuations in transfer income areimportant.
VIL DURATIONS BY BEGINNING TYPES
Using the methods based on exit probabilities that are described in earlier sec-tions, it is possible to estimate the expected durations of spells of poverty by begin-ning type. Table 4 presents the results. The table shows the mean duration ofcompleted spells for persons who are beginning spells of poverty and for personspoor at a given time. It also shows the distribution of beginning types for personswho are poor at a given time.
The table shows that spell durations differ depending on how the spell begins.The shortest spells are those which begin when a child became a head or wife.The average duration of a spell of poverty which begins this way is less thanthree years. Spells that begin with declines in heads' and wives' eamings are alsorelatively short, with average durations for new spells of 3.3 and 3.1 years. Earn-ings falls seem to lead on average to temporary periods of poverty.
Poverty spells are longer when the reason that they begin is that a woman hasbecome a female head with a child. The spells that begin for children when theirfamilies change from male- to female-headed are longer still, with a mean dura-tion for a new spell of four years and for spells observed at a given time of abouteleven years.'" Spells of poverty that begin with birth are the longest of all,averaging almost eight years for a new spell and nearly 17 years for a spellobserved at a point in time. Children who are bom into poverty seem to be facedwith an extremely long period of disadvantage.
In tabulations not reported here, we also looked at how exit probabilities andexpected spell durations varied by other characteristics. The most striking dif-ferences were by race. We estimated the average duration of a completed newspell for blacks at 6.5 years, compared with 3.4 years for whites. Black childrenwhose spells began with birth had expected poverty durations of 9.7 years. Forsome groups poverty looks quite long term.
10 The difference in average duration between female heads and their children suggests that female-headed families with more children have longer spells.

18 I THE JOURNAL OF HUMAN RESOURCES
TABLE 4DISTRIBUTION OF BEGINNING TYPES AND MEAN DURATION OF COMPLETED SPELLS
FOR PERSONS BEGINNING A SPELL AND FOR PERSONS POOR AT A GIVEN TIME
Beginning Type:Primary Reasonfor Beginning
Eamings of head fellEamings of wife fellEamings of others fellTransfer income fellNeeds/poverty level roseChild* became head or wifeWife became female headChild of male head became
child of female headChild was bom into poverty
Total/Average
Personsa Spell
Percentof
Beginnings
37.93.77.78.08.2
14.74.7
6.48.6
100.0
Beginningof Poverty
MeanDuration ofCompleted
Spell(years)
3.33.16.55.25.32.43.7
4.07.6
4.2
Personsa Given
Percentof
Beginnings
30.12.8
12.110.010.58.54.2
6.215.7
100.0
Poor atTime**
MeanDuration ofCompleted
Spell(years)
9.811.615.014.313.46.9
11.8
10.816.9
12.3
For all beginning types exit probabilities are assumed constant at 0.15 after the ninth year.* Includes child and grandchild and other relative of head.** Assuming no-growth steady state.
. ENDING EVENTS
Our analysis of etiding events proceeded iti exactly the same way as our atialysisof begitinitigs. The results reported here are for all endings that we observed,regardless of whether the spell begati withiti the satnple period. Table 5 showsthe distribution of observed endings by ending type and by family status in thelast year of the poverty spell.
Ending types look rather different from beginning types. More spells end thanbegin with a change in head's earnings. Some 38 percent of spells began witha fall in head's eamings. But over 50 percent of spells ended with a rise. Formale heads, the high proportion of spells that end by eamings increases is notsurprising, since few other routes out of poverty are open. In addition, however,a very sizable proportion of female heads with children—33 percent—escapepoverty by working. It is simply not the case that the only routes out of povertyfor women family heads are marriage or transfers.

Bane and Ellwood I 19
a.
Io
^ S
J XPQ g
^ i
00
H
Z
UJ
u -qw > RJ
•S 5 3C"-̂ OS O
l l(U O
If
c
raO
o
Iu
c= o< 2
Ib
T3C9U
6
(U
CO W^ C*^ ^ O s
vd c<S r-̂ in CN'— ro CN
r~̂ Ov lo 00 CO Osod d od d CN odrr CN —
CN OC) r-; p
O ro CN ON
vq \qro ro00
Tf
00
roVO
CO
OCO
CN
00
CO
p -^ p COCO I od ON CO
CN f ; vq p Ov
vd — od od d I
r-; CN — vq ON
OS CN CN od d
ov,
vqd
CN{^
00
00
in
''̂
ooCO
O en (N
vqON
pd
00d
pd
I I
2 o •p- « o S o 2 . , - ^ > . .
:L| U D
•I "S .5 ^ .3
VO
CN -^ro —.'CN
CO
vd
od
md
rod
CN
odCN
CO
d
mON
£X
ou•£
J!
-5oT3C
P
8
"ta
£o
r73U
T3
E
*•ox:U
ife
oT3
S.c
oc
a0.
en.3• ^
u^̂CO

2 0 I THE JOURNAL OF HUMAN RESOURCES
The earnings of wives and other household members are surprisingly impor-tant in moving people out of poverty. Twenty-three percent of all the spells ofpoverty ended with changes in the eamings of wives or other household members.The behavior of such persons is rarely examined or modeled in the statisticalliterature on the dynamics of poverty." Yet these secondary earners are oftencritical to a family's escape from poverty. For female-headed families withchildren, changes in the earnings of others were especially important, aloneaccounting for 18 percent of movements out of poverty. Some of these may reallybe household structure changes—the moving in of a husband surrogate who doesnot get classed as the head, although the PSID tried to classify as couples thoseunmarried persons who lived together as husband and wife.
Overall, then, although earnings changes of some sort account for only halfof all beginnings, they explain 75 percent of all endings. In many respects thisis not surprising. There are many routes into poverty associated with life-cycleevents which are essentially irreversible. Birth is the obvious example, but thedeparture of an adolescent child from his or her parents' household is rarelyreversed. Thus, except for an increase in transfer payments of some sort, formost families the only route out of poverty must be through the earnings of oneor more of its members.
The one exception, of course, is marriage or remarriage in the case of female-headed families. And marriage is an important road out of poverty for personsin these families, though not as important as work. For female heads with children,26 percent of all movements out of poverty came through marriage. Similarly23 percent of children in female-headed households escape poverty when theirmother marries. Overall about 10 percent of all observed spells of poverty werebrought to an end this way.
Increased transfer payments are only modestly important in ending spells ofpoverty, even for female heads and their children. About 14 percent of all theendings of spells of poverty that we observed were brought about by increasesin transfer payments. About 19 percent ofthe movements out of poverty by femaleheads with children were associated with increased transfer payments.
In interpreting this finding it is important to keep two things in mind. First,the definition of poverty we used in defining spells is posttransfer poverty, includ-ing all cash transfers in the definition of income. Our analysis thus gives us noinformation on the importance of transfers in making people who are pre-transferpoor into those who are post-transfer poor. The second is that spells of povertythat began when a person was over 64 were excluded from this analysis. We feelcertain that Social Security is important in moving some of those excluded personsout of poverty.
11 The dependence of many poor families on the earnings of people other than the head, and thedynamic nature of household composition in these families, has been noted in several anthropo-logical studies, for example Stack (1974).

Bane and Ellwood I 21
IX. CONCLUSIONS
In this paper we develop and exploit the notion of spells of poverty, using exitprobabilities to examine the length of time that people are poor and beginningand ending events to understand why people move into and out of poverty. Wefound that most of those who ever become poor will have only a short stay inpoverty. At the same time, the majority of people who are poor at a given timewill have very long spells of poverty before they escape.
These findings suggest, and others based on welfare use (Bane and Ellwood,1983) suggest even more strongly, that most of the people helped by programsto aid the economically disadvantaged use them only briefly. But the bulk ofresources almost certainly go to a much smaller group of people who have verylong stays in poverty. The policy dilemmas that this finding poses are seriousindeed. Our current policies are probably quite helpful in providing short-termrelief to the temporarily poor, and they may be an essential part of life for thechronically poor. Unfortunately, the results also open the possibility that depen-dency may be a serious problem.
We also found that a fall in a head's eamings explained spell beginning in onlya minority of cases. In nearly half the cases family structure and life cycle eventswere associated with the start of a poverty stay. Our research suggests, therefore,that models which concentrate only on the eamings dynamics of household headswill miss a great deal of the dynamics of poverty.
At the same time we found that increased eamings of all household memberswas the primary route out of poverty, and eamings falls accounted for half ofbeginnings. If effective labor-market policies could be implemented whichimproved the eamings of those near or below the poverty line, it seems likelythat they would dampen movements into poverty and hasten movements out,though obviously the record of current pohcies is mixed. Moreover, the substan-tial role played by "others" in moving families into and out of poverty impliesthat this long-neglected group deserves some attention, both in research and policy.
Finally and perhaps most importantly, our results suggest that the povertypopulation is extremely heterogeneous. Some groups such as youngsters who are"getting started" have relatively short spells of poverty and may not merit greatconcem. But some groups, particularly children and many blacks, often have verylong stays in poverty. Some 20 percent of poverty spells of children begin withbirth. When they do, they tend to last for ten years. The average poor black childtoday appears to be in the midst of a poverty spell which will last for almost twodecades.
We believe the spell methodology offers important advantages. Clearly by usinghazard functions and other multivariate techniques, we will be able to glean stillfurther information about those factors that influence dynamics. Yet we believethe straightforward methods exploited here offer the appeal of simplicity and stillprovide powerful insights into the dynamics of poverty.

22 I THE JOURNAL OF HUMAN RESOURCES
REFERENCES
Akerlof, George A., and Brian G. M. Main. 1982. "Unemployment Spells and JobTetiures: Are They Long? Are They Short? Or, Are They Both?" Xerox.
Bane, Mary Jo, atid David Ellwood. 1983. "The Dynamics of Dependence: Routes toSelf-Sufficiency." Report prepared for Office of Income Security Policy, U.S. Depart-metit of Health and Human Services (Jutie).
Boskin, Michael J., and Frederick C. Nold. 1975. "A Markov Model of Tumover inAid to Families with Dependent Children." Joumal of Human Resources 10:467-81.
Clark, Kim B., and Lawrence H. Summers. 1979. "Labor Force Transitions andUnemployment: A Reconsideration." Brookings Paper of Economic Activities 1 (July).
Coe, Richard D. 1978. "Dependency and Poverty in the Short and Long Run," in 5000American Families: Patterns of Economic Progress, Vol. 6, ed. Greg J. Duncan andJames N. Morgan. Ann Arbor, Mich.: Institute for Social Research.
Coe, Richard D., Greg J. Duncan, and Martha S. Hill. 1982. "Dynamic Aspects of Povertyand Welfare Use in the United States." Paper presented at Conference on Problemsof Poverty, Clark University (August).
Duncan, Greg J. 1984. Years of Poverty Years of Plenty. Ann Arbor, Mich.: Institutefor Social Research.
Gottschalk, Peter. 1982. "Eamings Mobility: Permanent Change or Transitory Fluctua-tions?" Review of Economics and Statistics 64:450-56.
Harrington, Michael. 1962. The Other America: Poverty in the United States. New York:MacMillan.
Hill, MarthaS. 1981. "Some Dynamic Aspects of Poverty," m 5000 American Families:Patterns of Economic Progress, Vol. 9, ed. Martha S. Hill, Daniel H. Hill, and JamesN. Morgan. Ann Arbor, Mich.: Institute for Social Research.
Hutchens, Robert M. 1981. "Entry and Exit Transitions in a Government Transfer Pro-gram: The Case of Aid to Families with Dependent Children," Joumal of HumanResources 16:218-37.
Kaitz, Hyman B. 1970. "Analyzing the Length of Spells of Unemployment," MonthlyLabor Review 93:11-20.
Levy, Frank. 1977. "How Big is the American Underclass?" Working Paper 0090-1.Washington D.C: The Urban Institute.
Lillard, Lee A., and Robert J. Willis. 1978. "Dynamic Aspects of Earning Mobility,"Econometrica 46:985-1012.
Plotnick, Robert. 1983. "Tumover in the AFDC Population: An Event History Analysis,"Joumal of Human Resources 18:65-81.
Rainwater, Lee. 1982. "Persistent and Transitory Poverty: A New Look," Working Paper70. Cambridge, Mass.: Joint Center for Urban Studies.
Salant, Stephen W. 1977. "Search Theory and Duration Data: A Theory of Sorts," Quar-terly Joumal of Economics 91:39-57.
Stack, Carol. 1974. All Our Kin. New York: Harper and Row.Survey Research Center. 1983. User Guide for the Panel Study of Income Dynamics. Ann
Arbor, Mich.: Survey Research Center, University of Michigan.U.S. Bureau of the Census. 1982. Current Population Reports, Series P-60, No. 134.
Money Income and Poveny Status of Families and Persons in the United States: 1981

Bane and Ellwood I 23
(Advance Data from the March 1982 Current Population Survey). Washington D.C:U.S. Government Printing Office.
Wiseman, Michael. 1976. "Change and Turnover in a Welfare Population." IncomeDynamics Project, Working Paper 70. Berkeley, Calif.: University of California atBerkeley.