Slides saopaulo-catastrophe
168
Arthur CHARPENTIER - Modeling and covering catastrophes Modeling and covering catastrophes Arthur Charpentier Sao Paulo, April 2009 [email protected] http ://blogperso.univ-rennes1.fr/arthur.charpentier/index.php/ 1
-
Upload
arthur-charpentier -
Category
Economy & Finance
-
view
1.444 -
download
0
Transcript of Slides saopaulo-catastrophe
Arthur CHARPENTIER - Modeling and covering catastrophes
Modeling and covering catastrophes
Arthur Charpentier
Sao Paulo, April 2009
http ://blogperso.univ-rennes1.fr/arthur.charpentier/index.php/
1
Arthur CHARPENTIER - Modeling and covering catastrophes
Agenda
Catastrophic risks products and models
• General introduction• Modeling very large claims• Natural catastrophes and accumulation risk• Insurance covers against catastrophes, traditional versus alternative techniques
Risk measures and pricing covers
• Pricing insurance linked securities• Risk measures, an economic introduction• Calculating risk measures for catastrophic risks• Pricing cat bonds : the Winterthur example• Pricing cat bonds : the Mexican Earthquake
2
Arthur CHARPENTIER - Modeling and covering catastrophes
Agenda
Catastrophic risks products and models
• General introduction• Modeling very large claims• Natural catastrophes and accumulation risk• Insurance covers against catastrophes, traditional versus alternative techniques
Risk measures and pricing covers
• Pricing insurance linked securities• Risk measures, an economic introduction• Calculating risk measures for catastrophic risks• Pricing cat bonds : the Winterthur example• Pricing cat bonds : the Mexican Earthquake
3
Arthur CHARPENTIER - Modeling and covering catastrophes
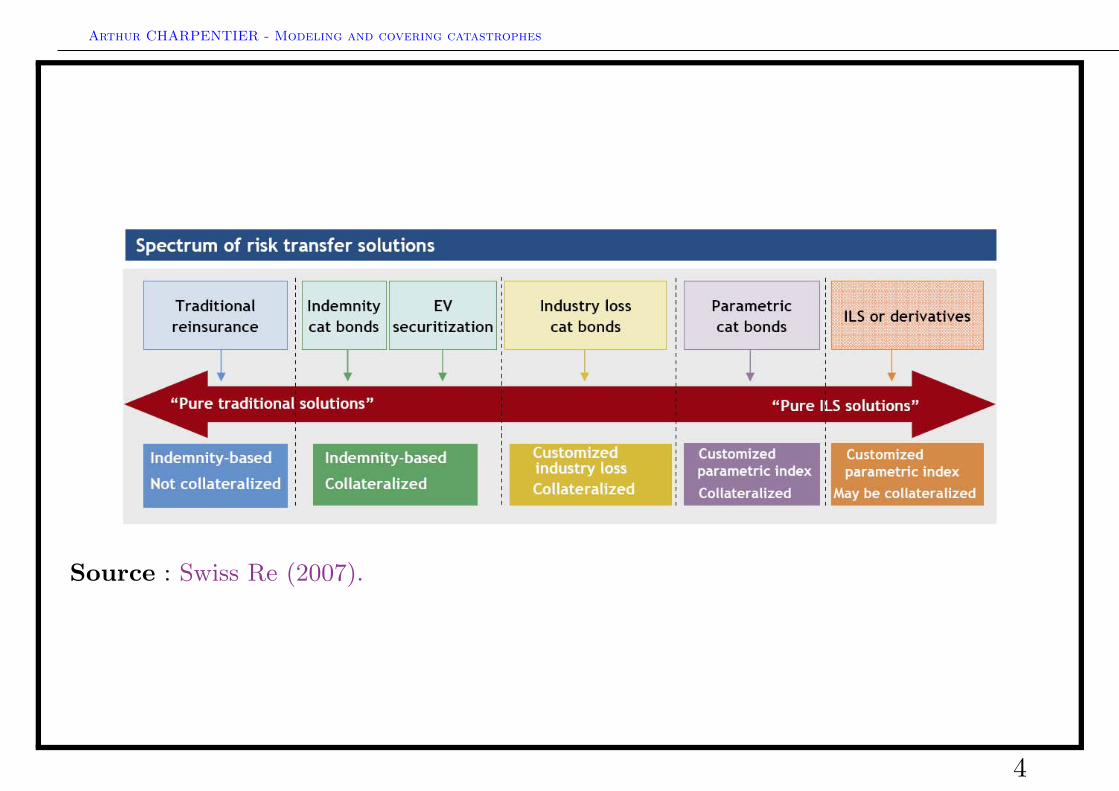
Source : Swiss Re (2007).
4
Arthur CHARPENTIER - Modeling and covering catastrophes
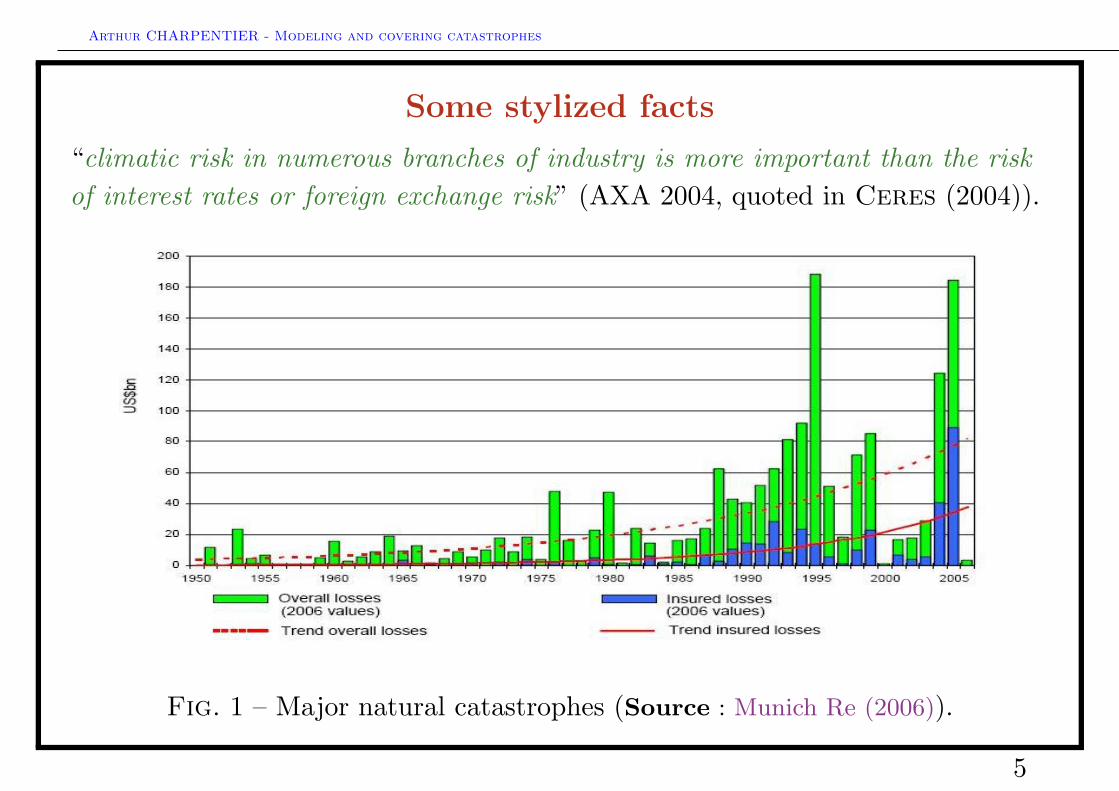
Some stylized facts
“climatic risk in numerous branches of industry is more important than the riskof interest rates or foreign exchange risk” (AXA 2004, quoted in Ceres (2004)).
Fig. 1 – Major natural catastrophes (Source : Munich Re (2006)).
5
Arthur CHARPENTIER - Modeling and covering catastrophes
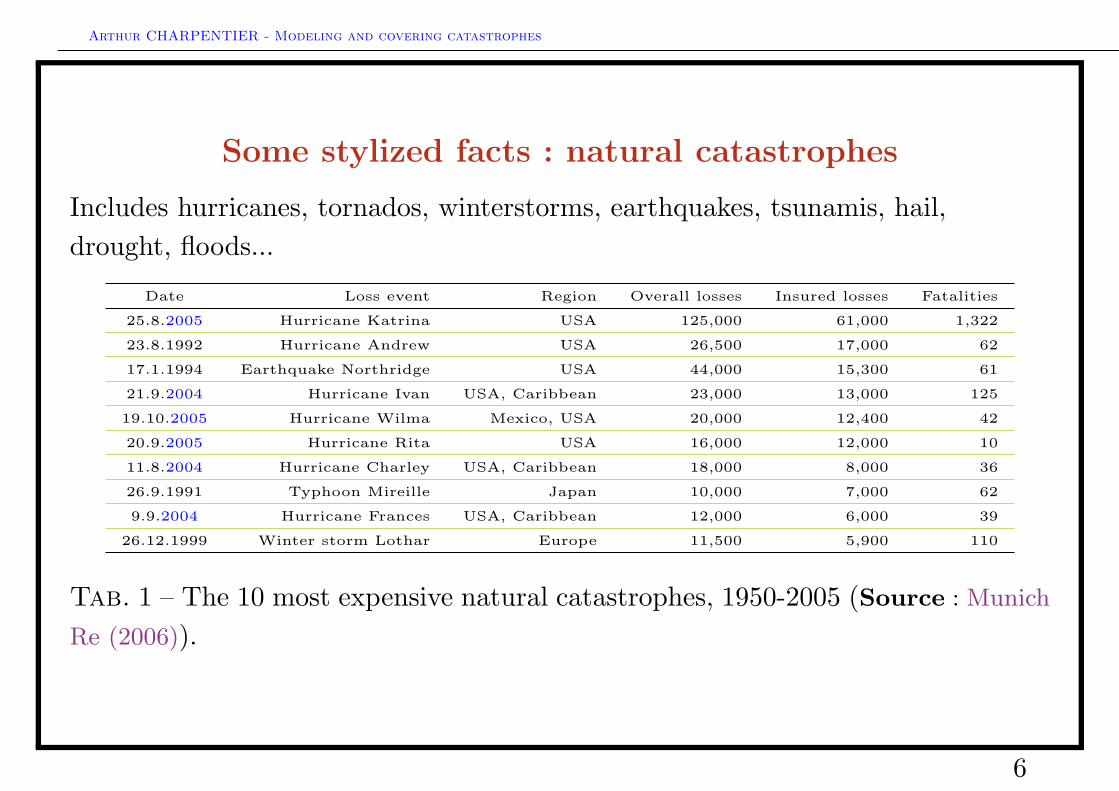
Some stylized facts : natural catastrophes
Includes hurricanes, tornados, winterstorms, earthquakes, tsunamis, hail,drought, floods...
Date Loss event Region Overall losses Insured losses Fatalities
25.8.2005 Hurricane Katrina USA 125,000 61,000 1,322
23.8.1992 Hurricane Andrew USA 26,500 17,000 62
17.1.1994 Earthquake Northridge USA 44,000 15,300 61
21.9.2004 Hurricane Ivan USA, Caribbean 23,000 13,000 125
19.10.2005 Hurricane Wilma Mexico, USA 20,000 12,400 42
20.9.2005 Hurricane Rita USA 16,000 12,000 10
11.8.2004 Hurricane Charley USA, Caribbean 18,000 8,000 36
26.9.1991 Typhoon Mireille Japan 10,000 7,000 62
9.9.2004 Hurricane Frances USA, Caribbean 12,000 6,000 39
26.12.1999 Winter storm Lothar Europe 11,500 5,900 110
Tab. 1 – The 10 most expensive natural catastrophes, 1950-2005 (Source : Munich
Re (2006)).
6
Arthur CHARPENTIER - Modeling and covering catastrophes
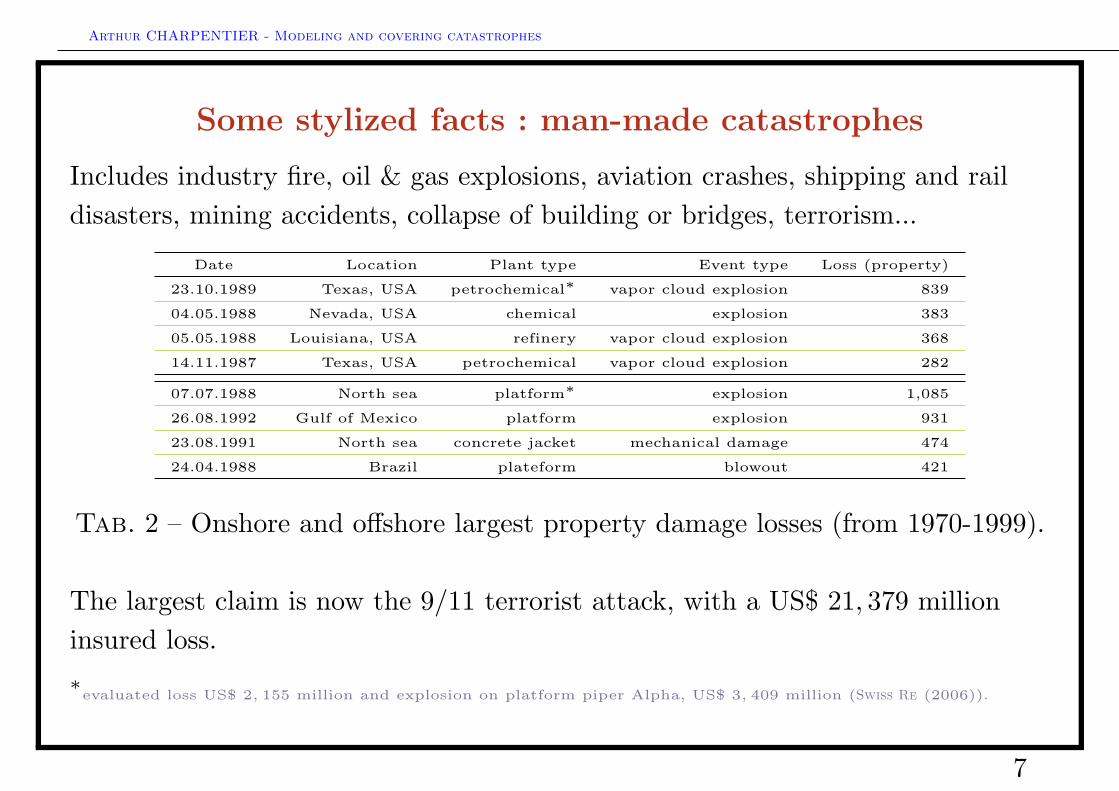
Some stylized facts : man-made catastrophes
Includes industry fire, oil & gas explosions, aviation crashes, shipping and raildisasters, mining accidents, collapse of building or bridges, terrorism...
Date Location Plant type Event type Loss (property)
23.10.1989 Texas, USA petrochemical∗ vapor cloud explosion 839
04.05.1988 Nevada, USA chemical explosion 383
05.05.1988 Louisiana, USA refinery vapor cloud explosion 368
14.11.1987 Texas, USA petrochemical vapor cloud explosion 282
07.07.1988 North sea platform∗ explosion 1,085
26.08.1992 Gulf of Mexico platform explosion 931
23.08.1991 North sea concrete jacket mechanical damage 474
24.04.1988 Brazil plateform blowout 421
Tab. 2 – Onshore and offshore largest property damage losses (from 1970-1999).
The largest claim is now the 9/11 terrorist attack, with a US$ 21, 379 millioninsured loss.∗evaluated loss US$ 2, 155 million and explosion on platform piper Alpha, US$ 3, 409 million (Swiss Re (2006)).
7
Arthur CHARPENTIER - Modeling and covering catastrophes
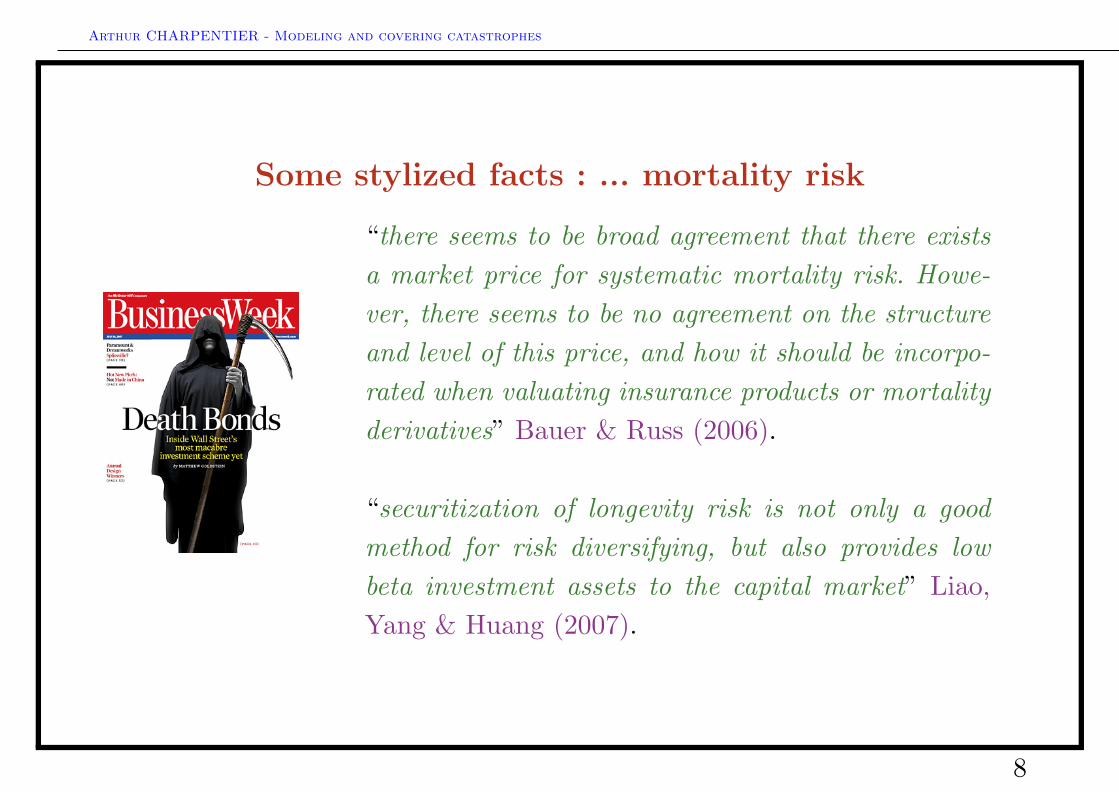
Some stylized facts : ... mortality risk
“there seems to be broad agreement that there existsa market price for systematic mortality risk. Howe-ver, there seems to be no agreement on the structureand level of this price, and how it should be incorpo-rated when valuating insurance products or mortalityderivatives” Bauer & Russ (2006).
“securitization of longevity risk is not only a goodmethod for risk diversifying, but also provides lowbeta investment assets to the capital market” Liao,Yang & Huang (2007).
8
Arthur CHARPENTIER - Modeling and covering catastrophes
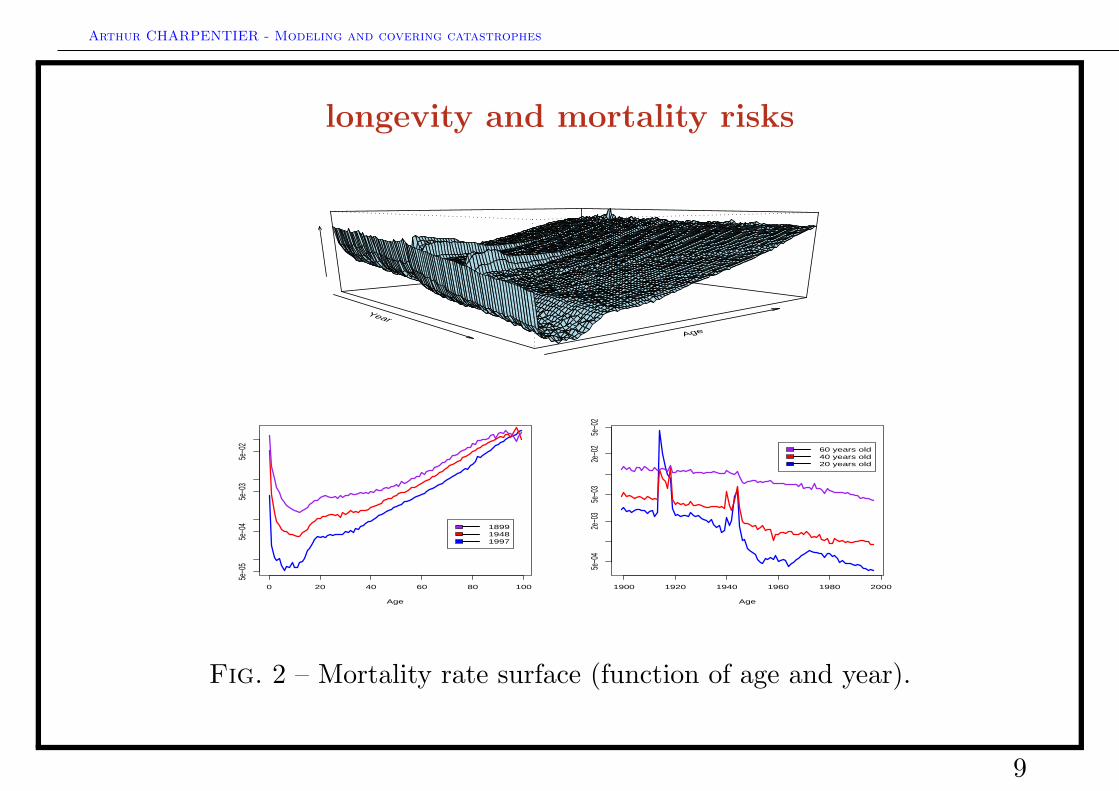
longevity and mortality risks
Year
Age
0 20 40 60 80 100
5e−0
55e
−04
5e−0
35e
−02
Age
189919481997
1900 1920 1940 1960 1980 20005e
−04
2e−0
35e
−03
2e−0
25e
−02
Age
60 years old40 years old20 years old
Fig. 2 – Mortality rate surface (function of age and year).
9
Arthur CHARPENTIER - Modeling and covering catastrophes
What is a large claim ?
An academic answer ? Teugels (1982) defined “large claims”,
Answer 1 “large claims are the upper 10% largest claims”,Answer 2 “large claims are every claim that consumes at least 5% of the sumof claims, or at least 5% of the net premiums”,Answer 3 “large claims are every claim for which the actuary has to go andsee one of the chief members of the company”.
Examples Traditional types of catastrophes, natural (hurricanes, typhoons,earthquakes, floods, tornados...), man-made (fires, explosions, businessinterruption...) or new risks (terrorist acts, asteroids, power outages...).
From large claims to catastrophe, the difference is that there is a before thecatastrophe, and an after : something has changed !
10
Arthur CHARPENTIER - Modeling and covering catastrophes
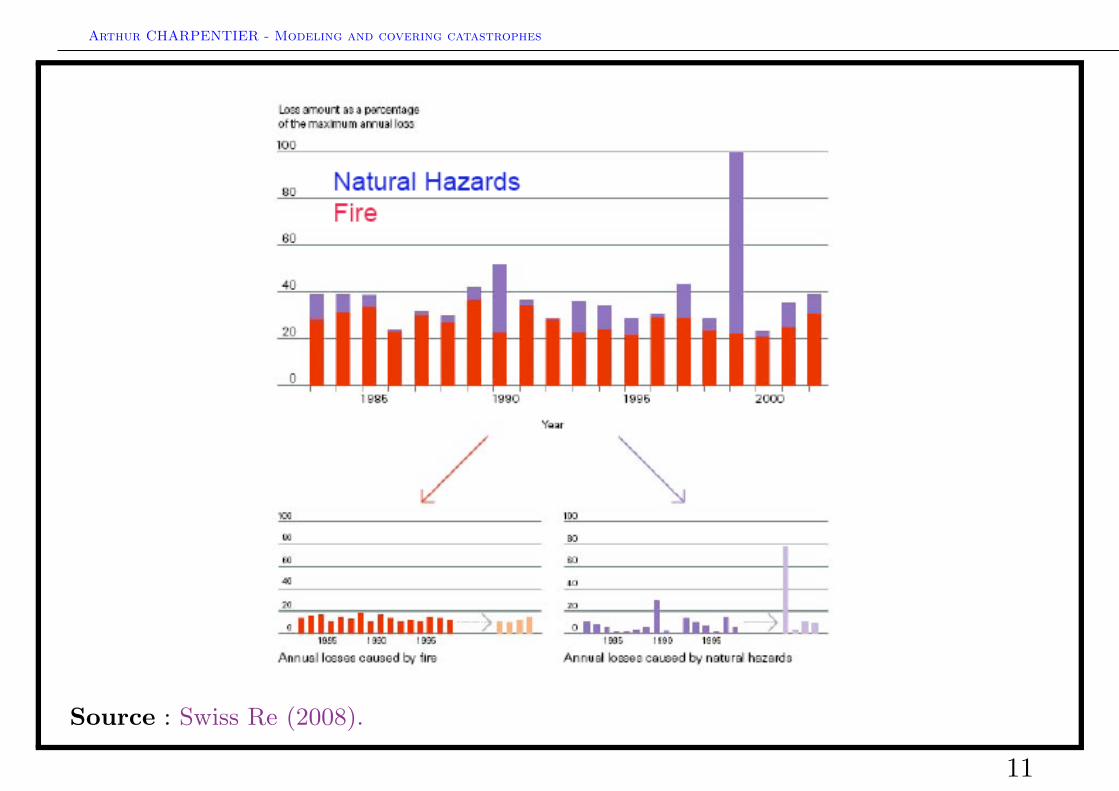
Source : Swiss Re (2008).
11
Arthur CHARPENTIER - Modeling and covering catastrophes
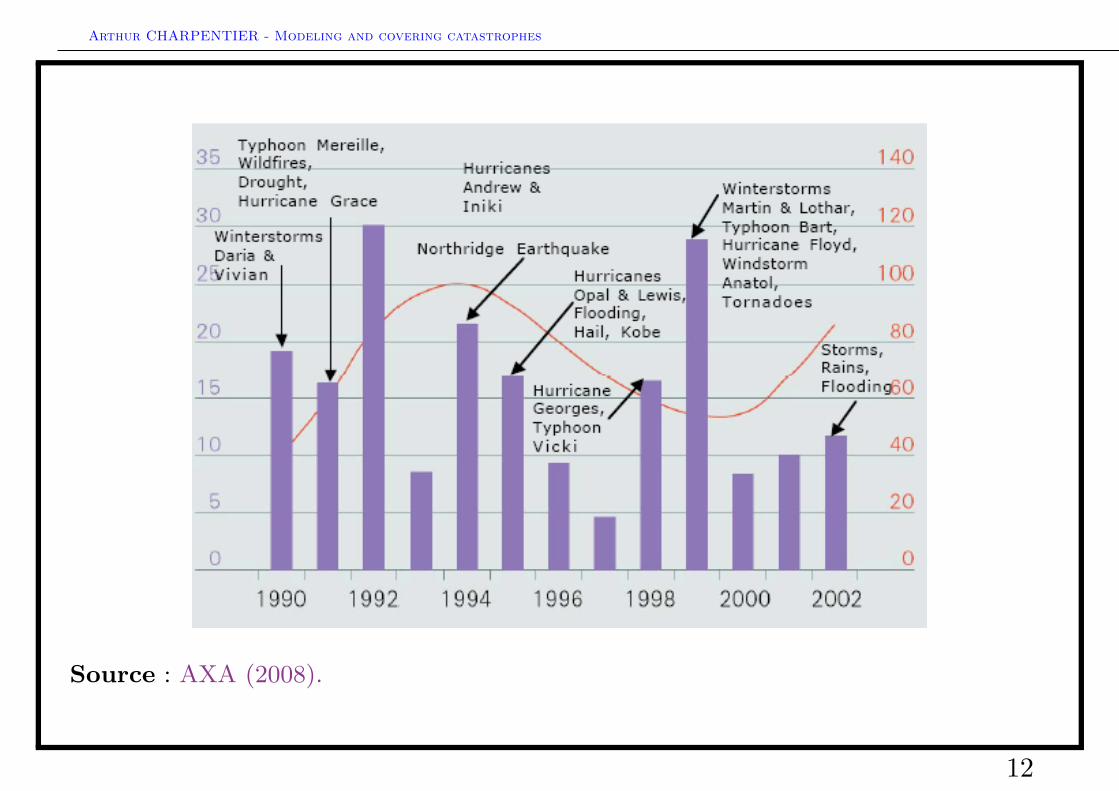
Source : AXA (2008).
12
Arthur CHARPENTIER - Modeling and covering catastrophes
The impact of a catastrophe
• Property damage : houses, cars and commercial structures,• Human casualties (may not be correlated with economic loss),• Business interruption
Example
• Natural Catastrophes - USA : succession of natural events that have hitinsurers, reinsurers and the retrocession market
• lack of capacity, strong increase in rate• Natural Catastrophes - nonUSA : in Asia (earthquakes, typhoons) and Europe
(flood, drought, subsidence)• sui generis protection programs in some countries
13
Arthur CHARPENTIER - Modeling and covering catastrophes
The impact of a catastrophe• Storms - Europe : high speed wind in Europe and US, considered as insurable• main risk for P&C insurers• Terrorism, including nuclear, biologic or bacteriologic weapons• lack of capacity, strong social pressure : private/public partnerships• Liabilities, third party damage• growth in indemnities (jurisdictions) yield unsustainable losses• Transportation (maritime and aircrafts), volatile business, and concentrated
market
14
Arthur CHARPENTIER - Modeling and covering catastrophes
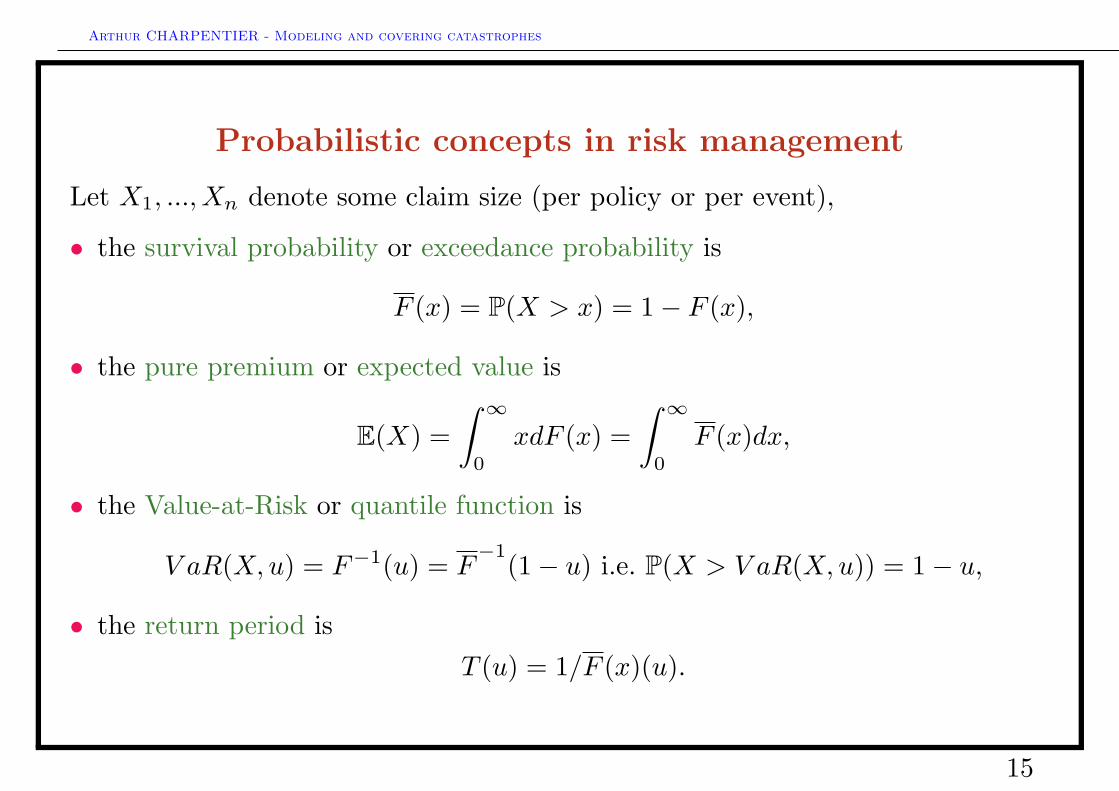
Probabilistic concepts in risk management
Let X1, ..., Xn denote some claim size (per policy or per event),
• the survival probability or exceedance probability is
F (x) = P(X > x) = 1− F (x),
• the pure premium or expected value is
E(X) =∫ ∞
0
xdF (x) =∫ ∞
0
F (x)dx,
• the Value-at-Risk or quantile function is
V aR(X,u) = F−1(u) = F−1
(1− u) i.e. P(X > V aR(X,u)) = 1− u,
• the return period isT (u) = 1/F (x)(u).
15
Arthur CHARPENTIER - Modeling and covering catastrophes
Modeling catastrophes
• Man-made catastrophes : modeling very large claims,• extreme value theory (ex : business interruption)• Natural Catastrophes : modeling very large claims taking into accont
accumulation and global warming• extreme value theory for losses• time series theory for occurrence• credit risk models for contagion or accumulation
16
Arthur CHARPENTIER - Modeling and covering catastrophes
Updating actuarial models
In classical actuarial models (from Cramer and Lundberg), one usuallyconsider• a model for the claims occurrence, e.g. a Poisson process,• a model for the claim size, e.g. a exponential, Weibull, lognormal...For light tailed risk, Cramer-Lundberg’s theory gives a bound for the ruinprobability, assuming that claim size is not to large. Furthermore, additionalcapital to ensure solvency (non-ruin) can be obtained using the central limittheorem (see e.g. RBC approach). But the variance has to be finite.
In the case of large risks or catastrophes, claim size has heavy tails (e.g. thevariance is usually infinite), but the Poisson assumption for occurrence is stillrelevant.
17
Arthur CHARPENTIER - Modeling and covering catastrophes
Updating actuarial models
Example For business interruption, the total loss is S =N∑i=1
Xi where N is
Poisson, and the Xi’s are i.i.d. Pareto.
Example In the case of natural catastrophes, claim size is not necessarily huge,but the is an accumulation of claims, and the Poisson distribution is not relevant.But if considering events instead of claims, the Poisson model can be relevant.But the Poisson process is nonhomogeneous.
Example For hurricanes or winterstorms, the total loss is S =N∑i=1
Xi where N is
Poisson, and Xi =Ni∑j=1
Xi,j , where the Xi,j ’s are i.i.d.
18
Arthur CHARPENTIER - Modeling and covering catastrophes
Agenda
Catastrophic risks products and models
• General introduction• Modeling very large claims• Natural catastrophes and accumulation risk• Insurance covers against catastrophes, traditional versus alternative techniques
Risk measures and pricing covers
• Pricing insurance linked securities• Risk measures, an economic introduction• Calculating risk measures for catastrophic risks• Pricing cat bonds : the Winterthur example• Pricing cat bonds : the Mexican Earthquake
19
Arthur CHARPENTIER - Modeling and covering catastrophes
Example : business interruption
Business interruption claims can be very expensive. Zajdenweber (2001)claimed that it is a noninsurable risk since the pure premium is (theoretically)infinite.
Remark For the 9/11 terrorist attacks, business interruption represented US$ 11billion.
20
Arthur CHARPENTIER - Modeling and covering catastrophes
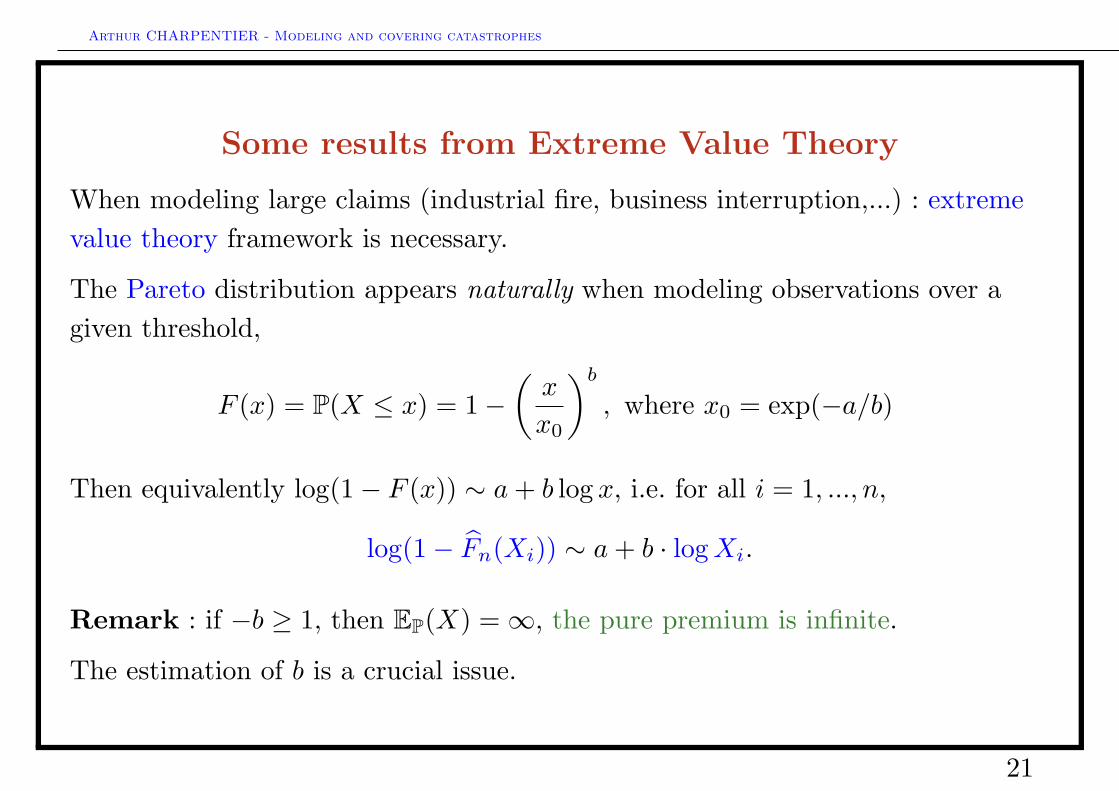
Some results from Extreme Value Theory
When modeling large claims (industrial fire, business interruption,...) : extremevalue theory framework is necessary.
The Pareto distribution appears naturally when modeling observations over agiven threshold,
F (x) = P(X ≤ x) = 1−(x
x0
)b, where x0 = exp(−a/b)
Then equivalently log(1− F (x)) ∼ a+ b log x, i.e. for all i = 1, ..., n,
log(1− Fn(Xi)) ∼ a+ b · logXi.
Remark : if −b ≥ 1, then EP(X) =∞, the pure premium is infinite.
The estimation of b is a crucial issue.
21
Arthur CHARPENTIER - Modeling and covering catastrophes
0 1 2 3 4 5
0.0
0.2
0.4
0.6
0.8
1.0
Cumulative distribution function, with confidence interval
logarithm of the losses
cum
ulat
ive
prob
abili
ties
0 1 # $ % 5
!5!%
!$!#
!10
lo#!lo# %areto *lot, ,it. /onfiden/e inter3al
lo)arit.m of t.e losseslo
)arit
.m o
f t.e
sur
5i5a
l 6ro
7a7i
litie
s
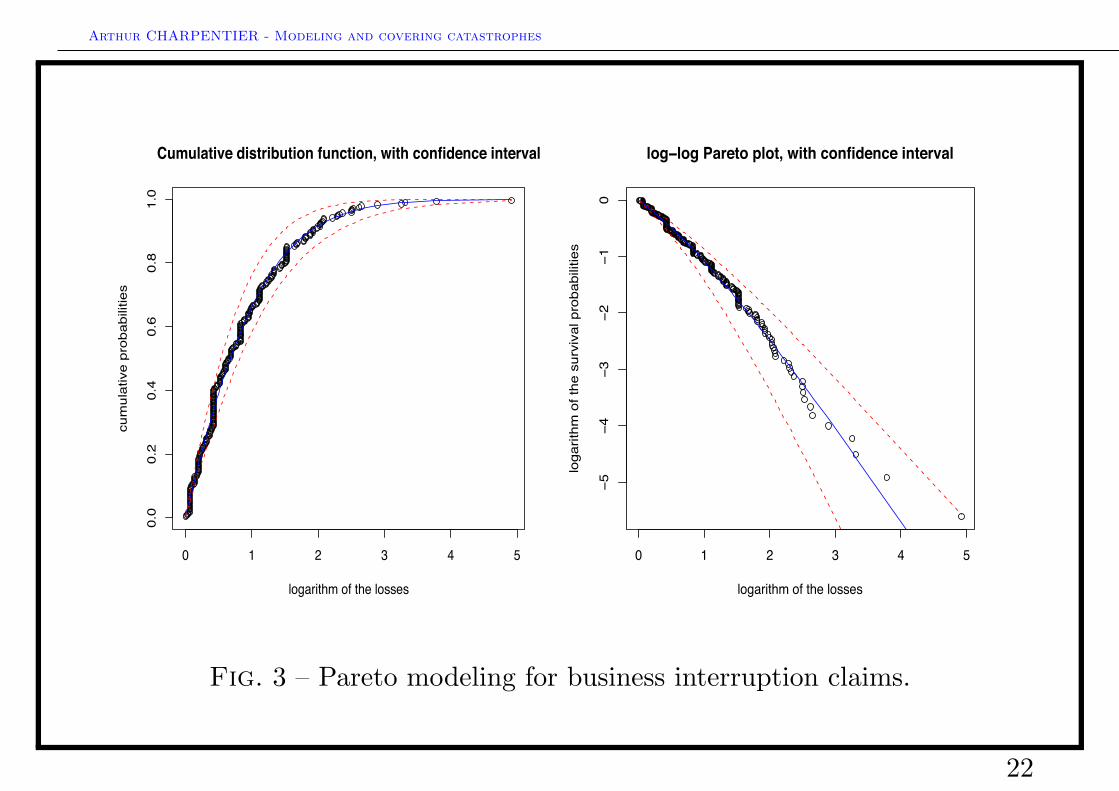
Fig. 3 – Pareto modeling for business interruption claims.
22
Arthur CHARPENTIER - Modeling and covering catastrophes
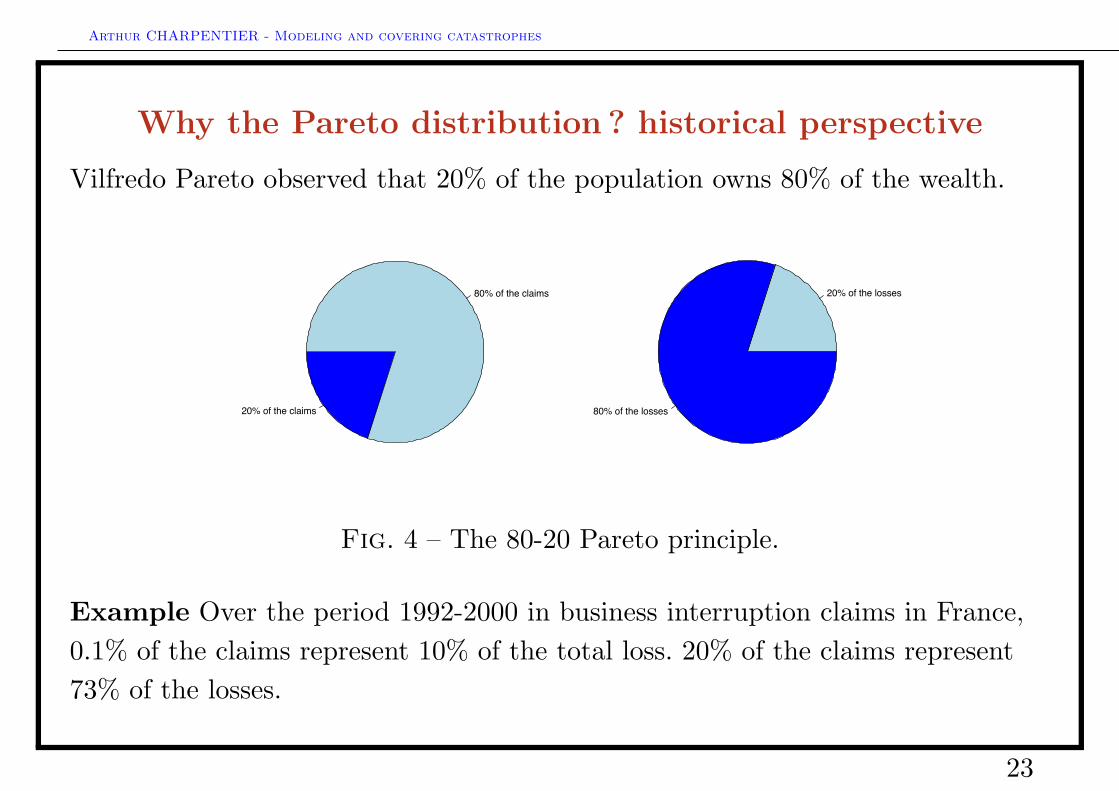
Why the Pareto distribution ? historical perspective
Vilfredo Pareto observed that 20% of the population owns 80% of the wealth.
20% of the claims
80% of the claims 20% of the losses
80% of the losses
Fig. 4 – The 80-20 Pareto principle.
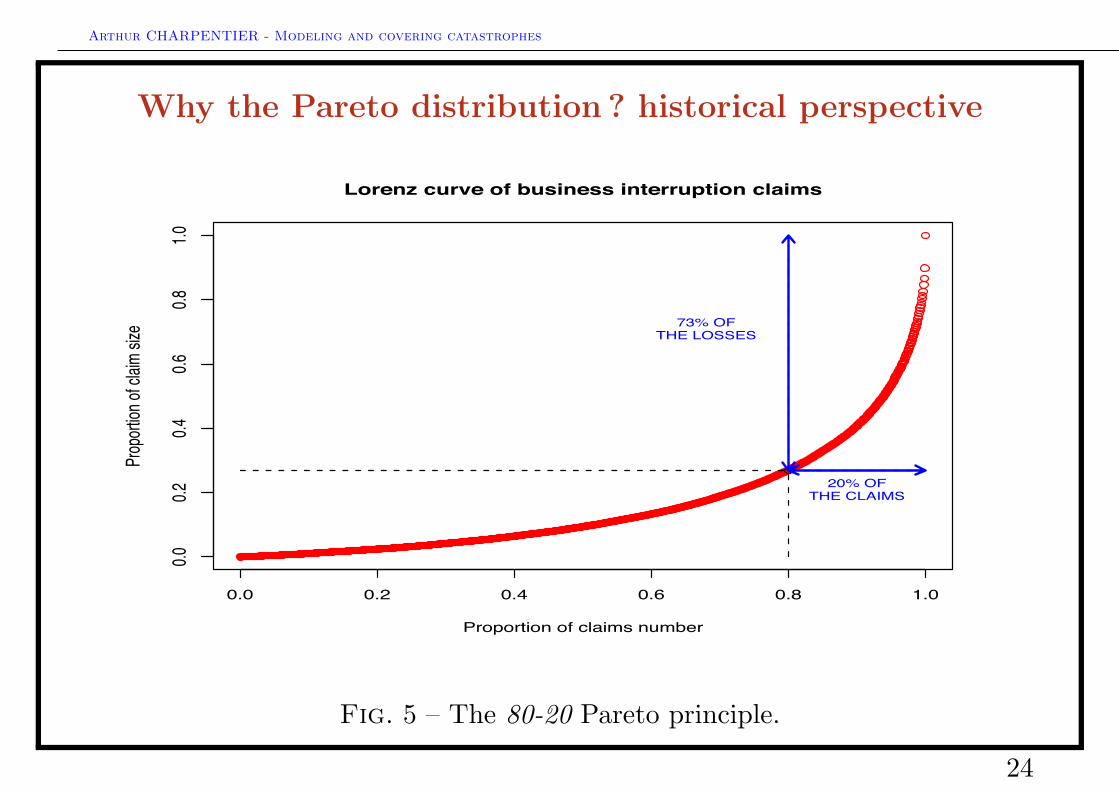
Example Over the period 1992-2000 in business interruption claims in France,0.1% of the claims represent 10% of the total loss. 20% of the claims represent73% of the losses.
23
Arthur CHARPENTIER - Modeling and covering catastrophes
Why the Pareto distribution ? historical perspective
0.0 0.2 0.4 0.6 0.8 1.0
0.00.2
0.40.6
0.81.0
Lorenz curve of business interruption claims
Proportion of claims number
Propo
rtion o
f claim
size
20% OFTHE CLAIMS
73% OFTHE LOSSES
Fig. 5 – The 80-20 Pareto principle.
24
Arthur CHARPENTIER - Modeling and covering catastrophes
Why the Pareto distribution ? mathematical explanation
We consider here the exceedance distribution, i.e. the distribution of X − u giventhat X > u, with survival distribution G(·) defined as
G(x) = P(X − u > x|X > u) =F (x+ u)F (u)
This is closely related to some regular variation property, and only powerfunction my appear as limit when u→∞ : G(·) is necessarily a power function.
The Pareto model in actuarial literature
Swiss Re highlighted the importance of the Pareto distribution in two technicalbrochures the Pareto model in property reinsurance and estimating propertyexcess of loss risk premium : The Pareto model.
Actually, we will see that the Pareto model gives much more than only apremium.
25
Arthur CHARPENTIER - Modeling and covering catastrophes
Large claims and the Pareto model
The theorem of Pickands-Balkema-de Haan states that if the X1, ..., Xn areindependent and identically distributed, for u large enough,
P(X − u > x|X > u) ∼ Hξ,σ(u)(x) =
(
1 + ξx
σ(u)
)−1/ξ
if ξ 6= 0,
exp(− x
σ(u)
)if ξ = 0,
for some σ(·). It simply means that large claims can always be modeled using the(generalized) Pareto distribution.
The practical question which always arises is then “what are large claims”, i.e.how to chose u ?
26
Arthur CHARPENTIER - Modeling and covering catastrophes
How to define large claims ?
• Use of the k largest claims : Hill’s estimator
The intuitive idea is to fit a linear straight line since for the largest claimsi = 1, ..., n, log(1− Fn(Xi)) ∼ a+ blogXi. Let bk denote the estimator based onthe k largest claims.
Let {Xn−k+1:n, ..., Xn−1:n, Xn:n} denote the set of the k largest claims. Recallthat ξ ∼ −1/b, and then
ξ =
(1k
n∑i=1
log(Xn−k+i:n)
)− log(Xn−k:n).
27
Arthur CHARPENTIER - Modeling and covering catastrophes
0 200 400 600 800 1000 1200
1.0
1.5
2.0
2.5
Hill estimator of the slope
slop
e (!
b)
0 200 400 600 800 1000 1200
24
68
10
Hill estimator of the 95% VaR
quan
tile
(95%
)
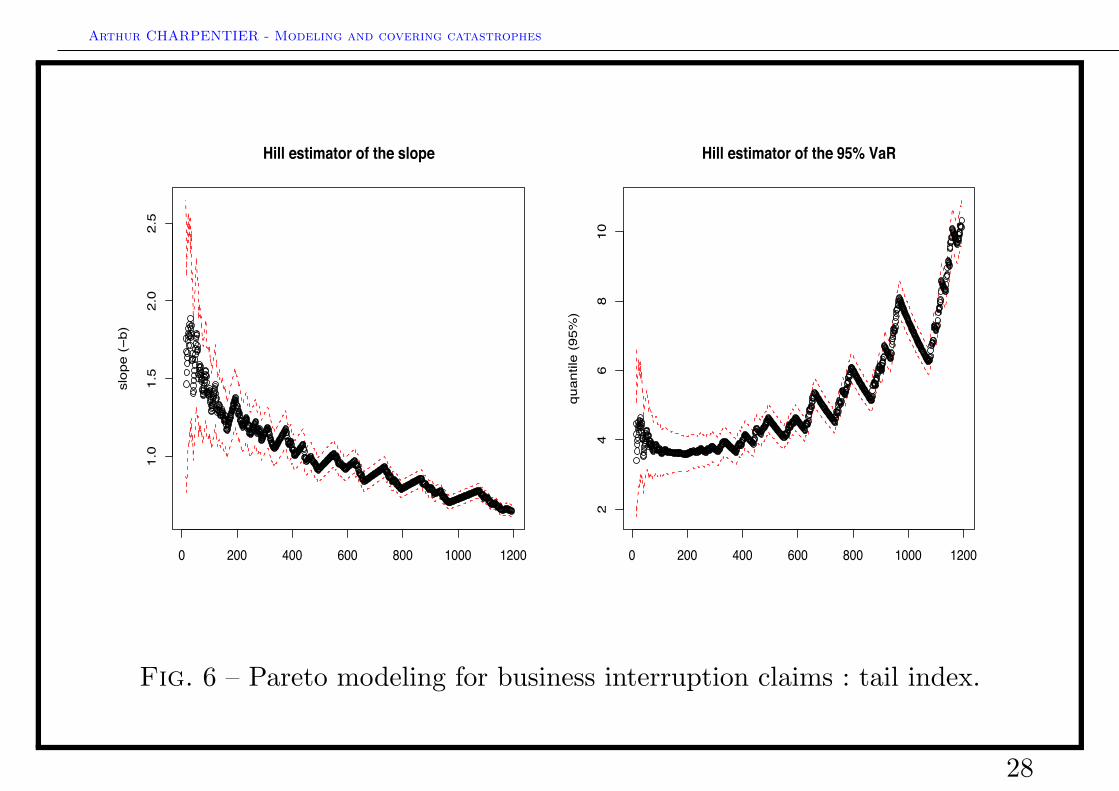
Fig. 6 – Pareto modeling for business interruption claims : tail index.
28
Arthur CHARPENTIER - Modeling and covering catastrophes
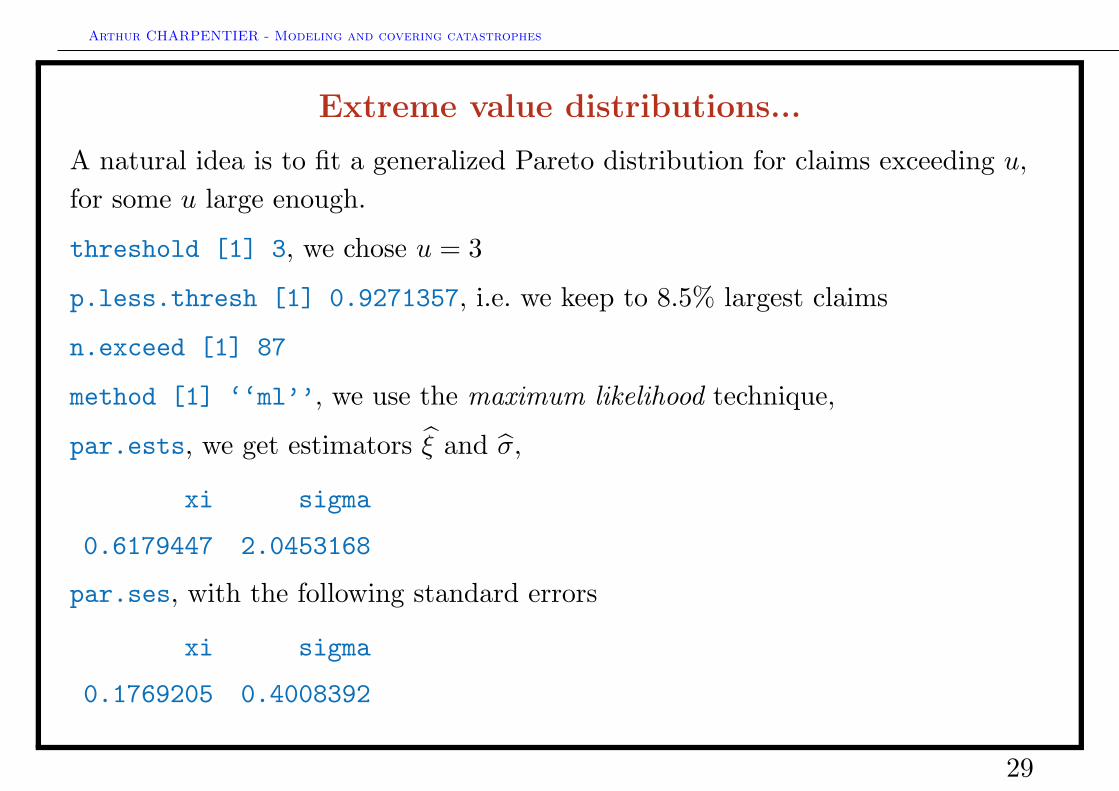
Extreme value distributions...
A natural idea is to fit a generalized Pareto distribution for claims exceeding u,for some u large enough.
threshold [1] 3, we chose u = 3
p.less.thresh [1] 0.9271357, i.e. we keep to 8.5% largest claims
n.exceed [1] 87
method [1] ‘‘ml’’, we use the maximum likelihood technique,
par.ests, we get estimators ξ and σ,
xi sigma
0.6179447 2.0453168
par.ses, with the following standard errors
xi sigma
0.1769205 0.4008392
29
Arthur CHARPENTIER - Modeling and covering catastrophes
0.5 1.0 1.5 2.0 2.5 3.0 3.5
3.0
3.5
4.0
4.5
5.0
MLE of the tail index, using Generalized Pareto Model
tail
inde
x
5 10 20 50 100 200
1 e!
045
e!
042
e!
031
e!
025
e!
02x (on log scale)
1!F
(x)
(on
log
scal
e)
9995
9995
Estimation of VaR and TVaR (95%)
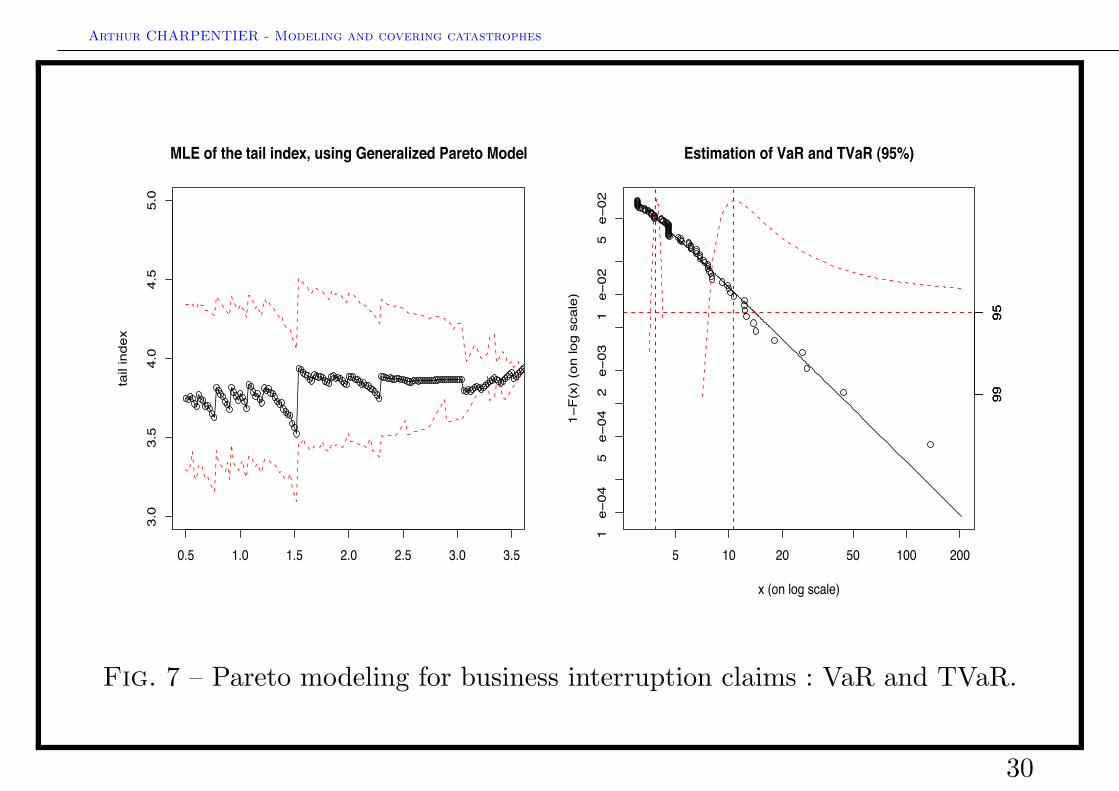
Fig. 7 – Pareto modeling for business interruption claims : VaR and TVaR.
30
Arthur CHARPENTIER - Modeling and covering catastrophes
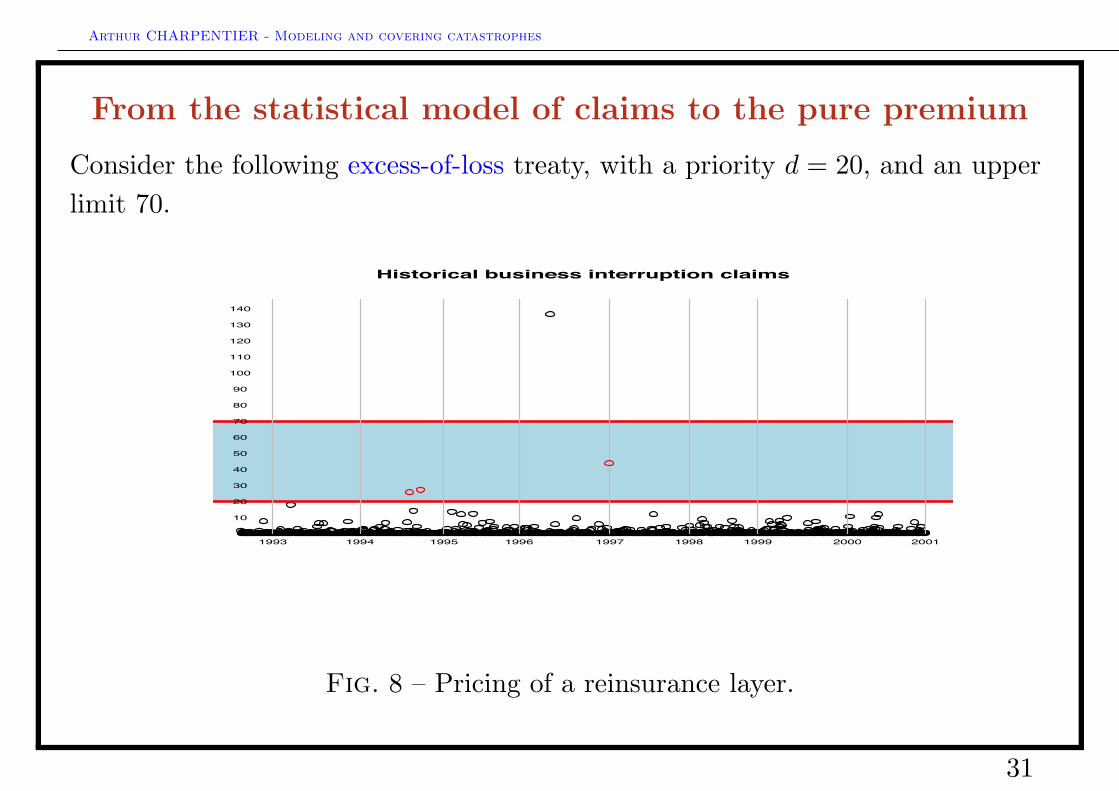
From the statistical model of claims to the pure premium
Consider the following excess-of-loss treaty, with a priority d = 20, and an upperlimit 70.
Historical business interruption claims
1993 1994 1995 1996 1997 1998 1999 2000 2001
10
20
30
40
50
60
70
80
90
100
110
120
130
140
Fig. 8 – Pricing of a reinsurance layer.
31
Arthur CHARPENTIER - Modeling and covering catastrophes
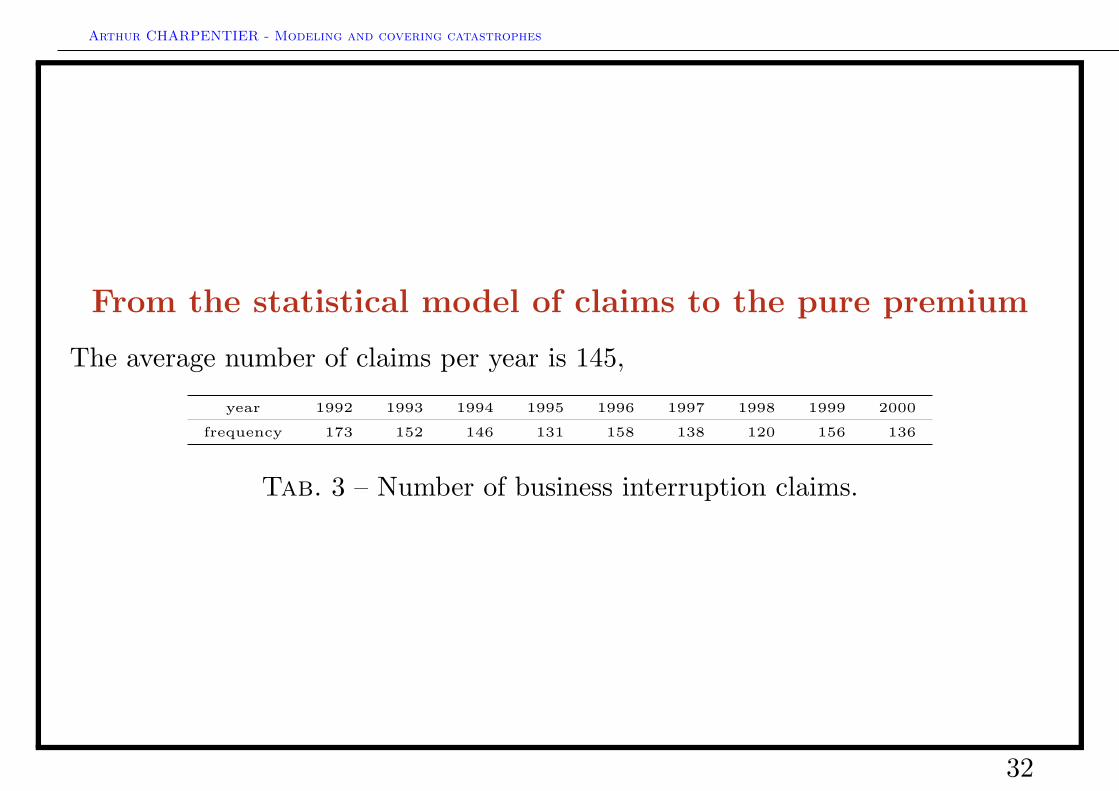
From the statistical model of claims to the pure premium
The average number of claims per year is 145,
year 1992 1993 1994 1995 1996 1997 1998 1999 2000
frequency 173 152 146 131 158 138 120 156 136
Tab. 3 – Number of business interruption claims.
32
Arthur CHARPENTIER - Modeling and covering catastrophes
From the statistical model of claims to the pure premium
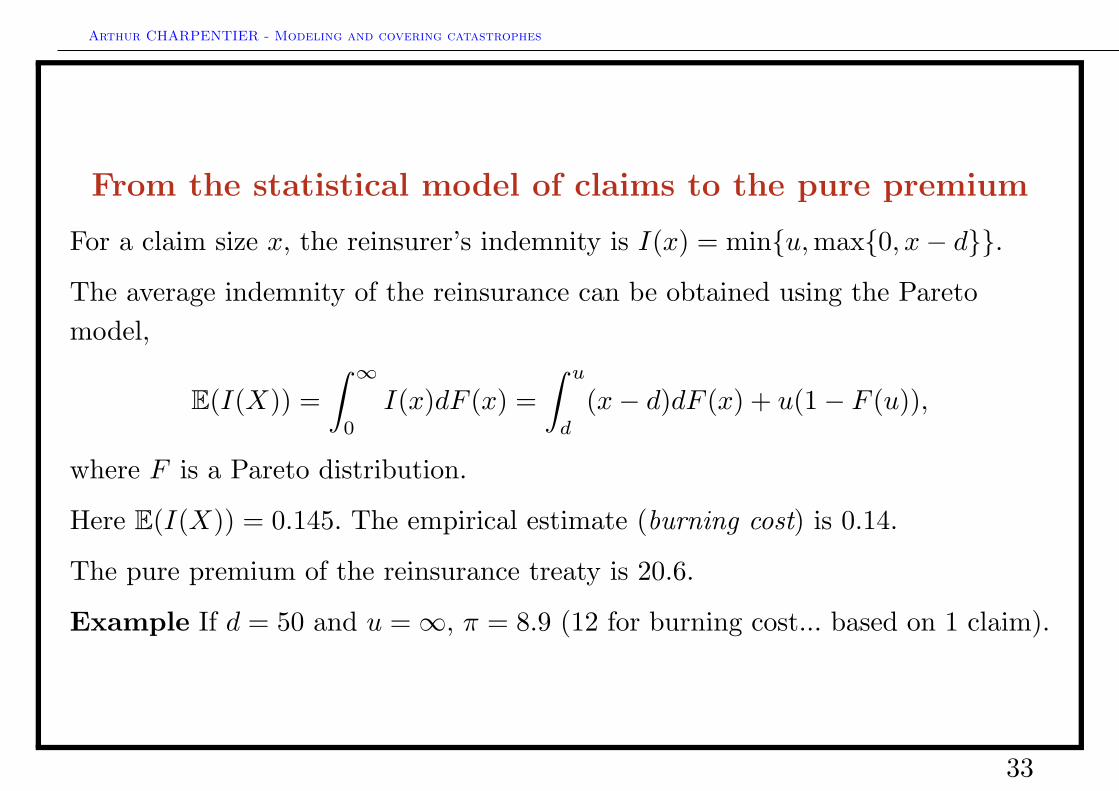
For a claim size x, the reinsurer’s indemnity is I(x) = min{u,max{0, x− d}}.
The average indemnity of the reinsurance can be obtained using the Paretomodel,
E(I(X)) =∫ ∞
0
I(x)dF (x) =∫ u
d
(x− d)dF (x) + u(1− F (u)),
where F is a Pareto distribution.
Here E(I(X)) = 0.145. The empirical estimate (burning cost) is 0.14.
The pure premium of the reinsurance treaty is 20.6.
Example If d = 50 and u =∞, π = 8.9 (12 for burning cost... based on 1 claim).
33
Arthur CHARPENTIER - Modeling and covering catastrophes
Agenda
Catastrophic risks modelling
• General introduction• Business interruption and very large claims• Natural catastrophes and accumulation risk• Insurance covers against catastrophes, traditional versus alternative techniques
Risk measures and capital requirements
• Risk measures, an economic introduction• Calculating risk measures for catastrophic risks• Diversification and capital allocation
34
Arthur CHARPENTIER - Modeling and covering catastrophes
Increased value at risk
In 1950, 30% of the world’s population (2.5 billion people) lived in cities. In 2000,50% of the world’s population (6 billon).
In 1950 the only city with more than 10 million inhabitants was New York. Therewere 12 in 1990, and 26 are expected by 2015, including
• Tokyo (29 million),• New York (18 million),• Los Angeles (14 million).
• Increasing value at risk (for all risks)
The total value of insured costal exposure in 2004 was• $1, 937 billion in Florida (18 million),• $1, 902 billion in New York.
35
Arthur CHARPENTIER - Modeling and covering catastrophes
Two techniques to model large risks
• The actuarial-statistical technique : modeling historical series,
The actuary models the occurrence process of events, and model the claim size(of the total event).
This is simple but relies on stability assumptions. If not, one should modelchanges in the occurrence process, and should take into account inflation orincrease in value-at-risk.
• The meteorological-engineering technique : modeling natural hazard andexposure.
This approach needs a lot of data and information so generate scenarios takingall the policies specificities. Not very flexible to estimate return periods, andworks as a black box. Very hard to assess any confidence levels.
36
Arthur CHARPENTIER - Modeling and covering catastrophes
The actuarial-statistical approach
• Modeling event occurrence, the problem of global warming.
Global warming has an impact on climate related hazard (droughts, subsidence,hurricanes, winterstorms, tornados, floods, coastal floods) but not geophysical(earthquakes).
• Modeling claim size, the problem of increase of value at risk and inflation.
Pielke & Landsea (1998) normalized losses due to hurricanes, using bothpopulation and wealth increases, “with this normalization, the trend of increasingdamage amounts in recent decades disappears”.
37
Arthur CHARPENTIER - Modeling and covering catastrophes
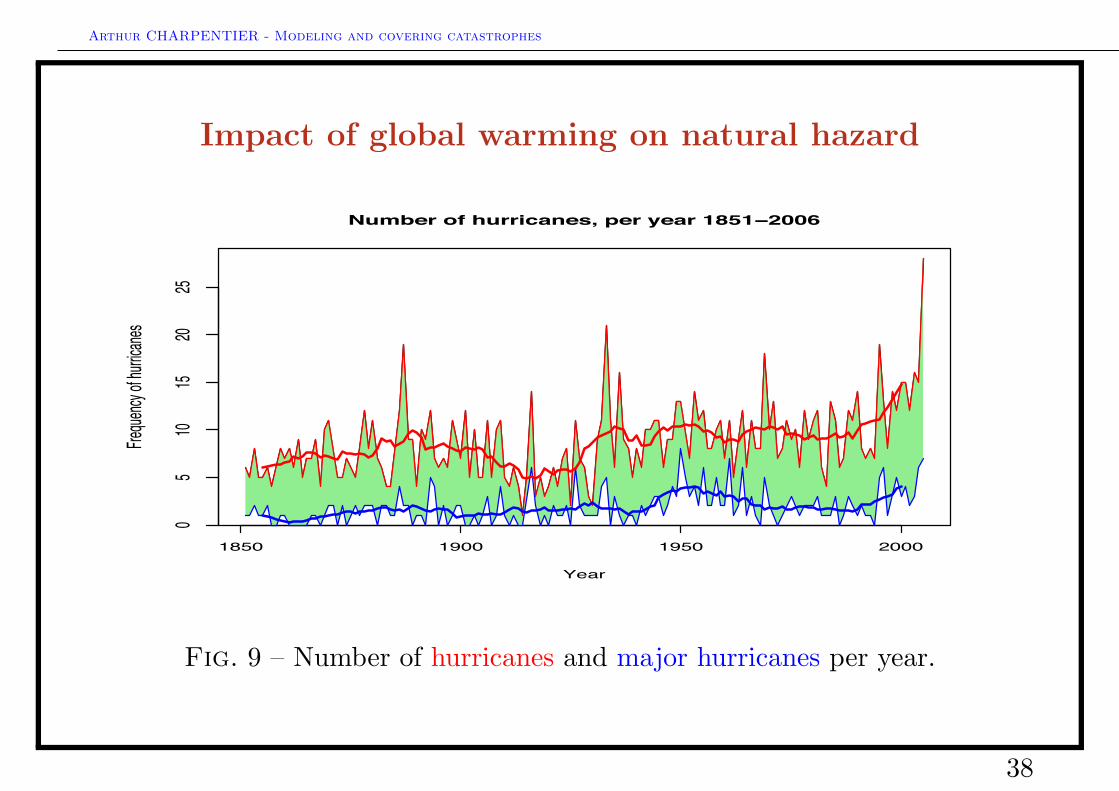
Impact of global warming on natural hazard
1850 1900 1950 2000
05
1015
2025
!u#$er o) *urricanes, per 2ear 3853!6008
Year
Freque
ncy of
hurrica
nes
Fig. 9 – Number of hurricanes and major hurricanes per year.
38
Arthur CHARPENTIER - Modeling and covering catastrophes
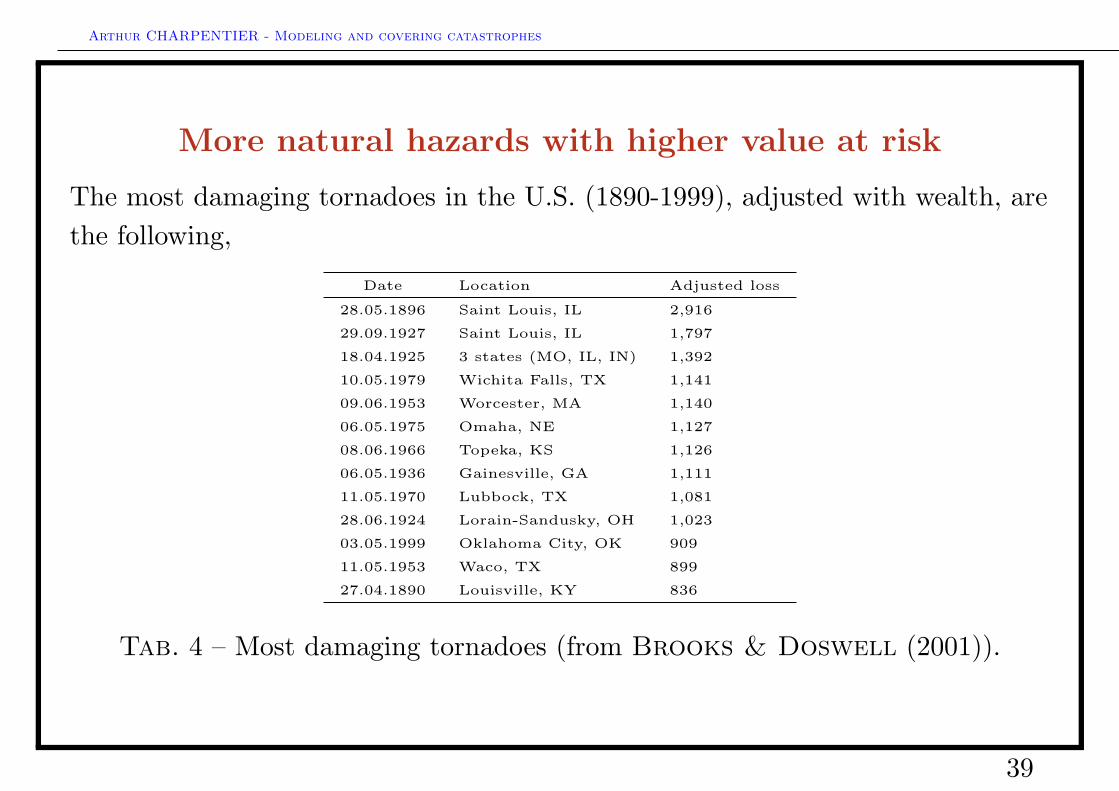
More natural hazards with higher value at risk
The most damaging tornadoes in the U.S. (1890-1999), adjusted with wealth, arethe following,
Date Location Adjusted loss
28.05.1896 Saint Louis, IL 2,916
29.09.1927 Saint Louis, IL 1,797
18.04.1925 3 states (MO, IL, IN) 1,392
10.05.1979 Wichita Falls, TX 1,141
09.06.1953 Worcester, MA 1,140
06.05.1975 Omaha, NE 1,127
08.06.1966 Topeka, KS 1,126
06.05.1936 Gainesville, GA 1,111
11.05.1970 Lubbock, TX 1,081
28.06.1924 Lorain-Sandusky, OH 1,023
03.05.1999 Oklahoma City, OK 909
11.05.1953 Waco, TX 899
27.04.1890 Louisville, KY 836
Tab. 4 – Most damaging tornadoes (from Brooks & Doswell (2001)).
39
Arthur CHARPENTIER - Modeling and covering catastrophes
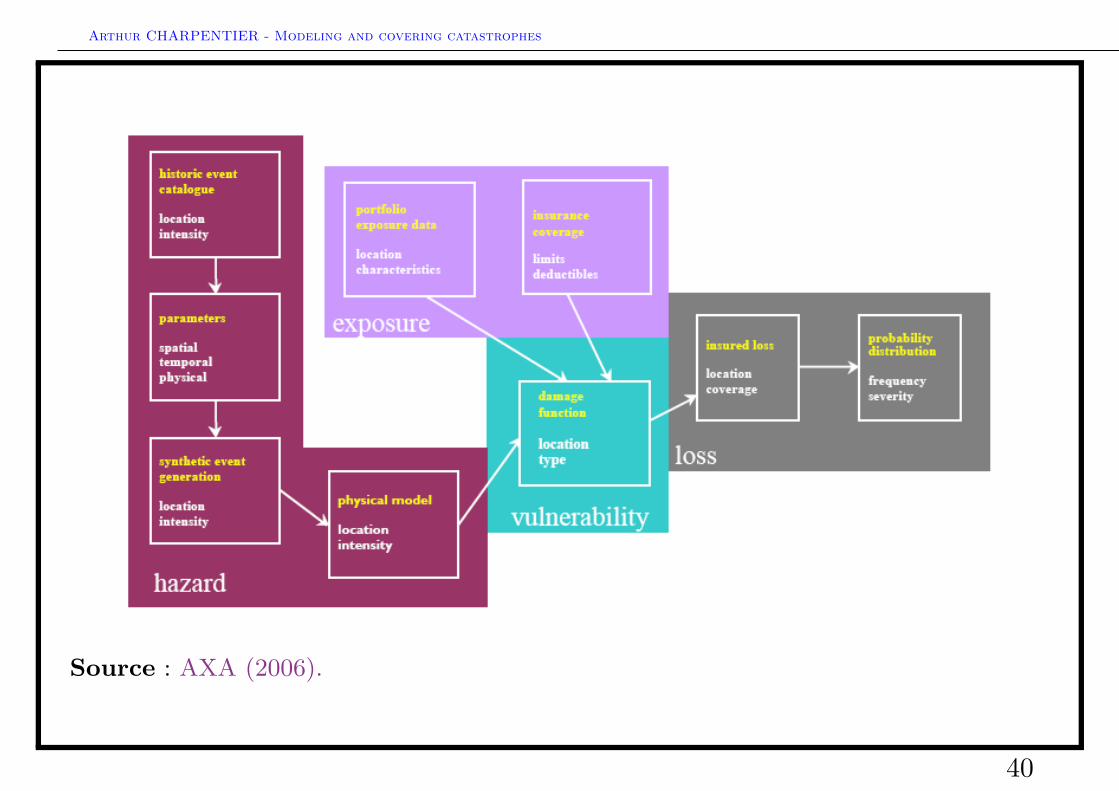
Source : AXA (2006).
40
Arthur CHARPENTIER - Modeling and covering catastrophes
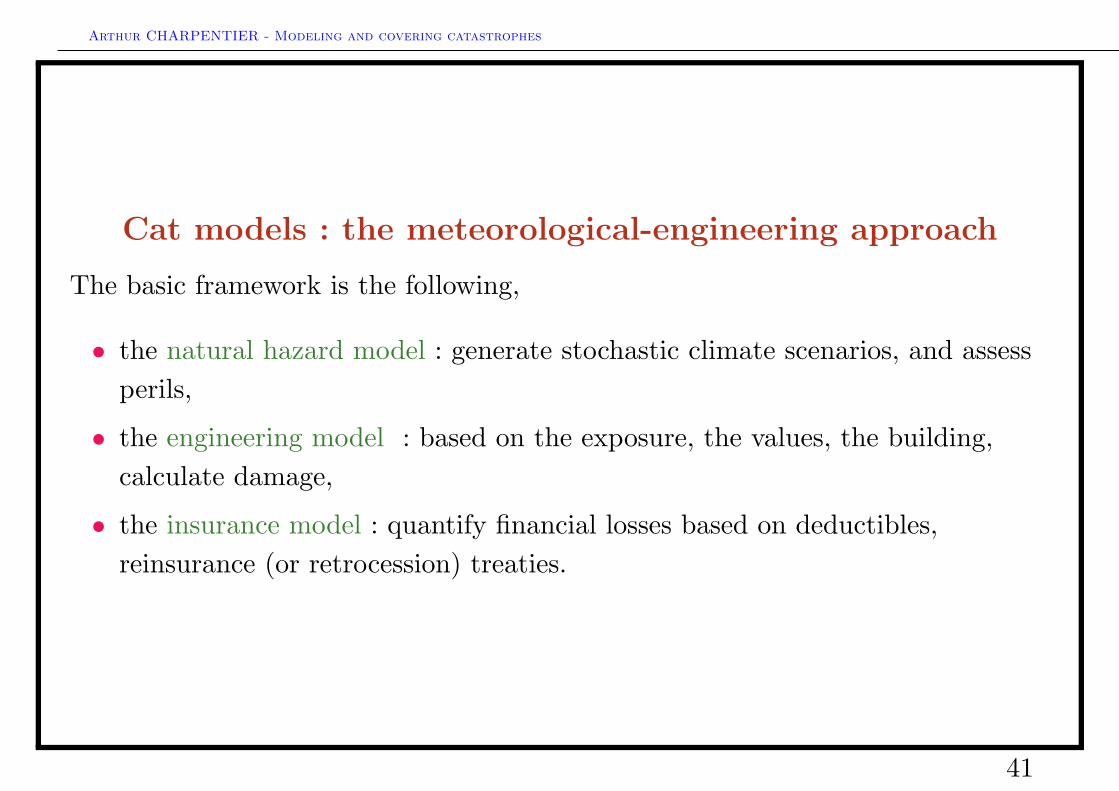
Cat models : the meteorological-engineering approach
The basic framework is the following,
• the natural hazard model : generate stochastic climate scenarios, and assessperils,
• the engineering model : based on the exposure, the values, the building,calculate damage,
• the insurance model : quantify financial losses based on deductibles,reinsurance (or retrocession) treaties.
41
Arthur CHARPENTIER - Modeling and covering catastrophes
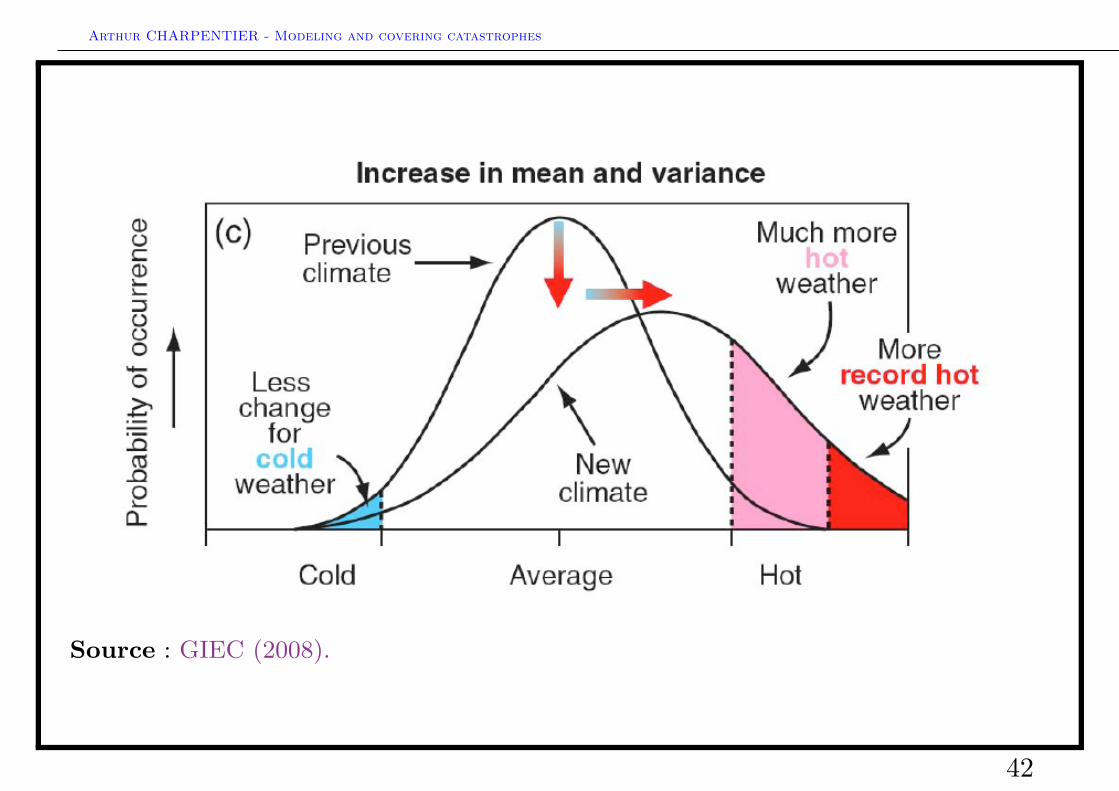
Source : GIEC (2008).
42
Arthur CHARPENTIER - Modeling and covering catastrophes
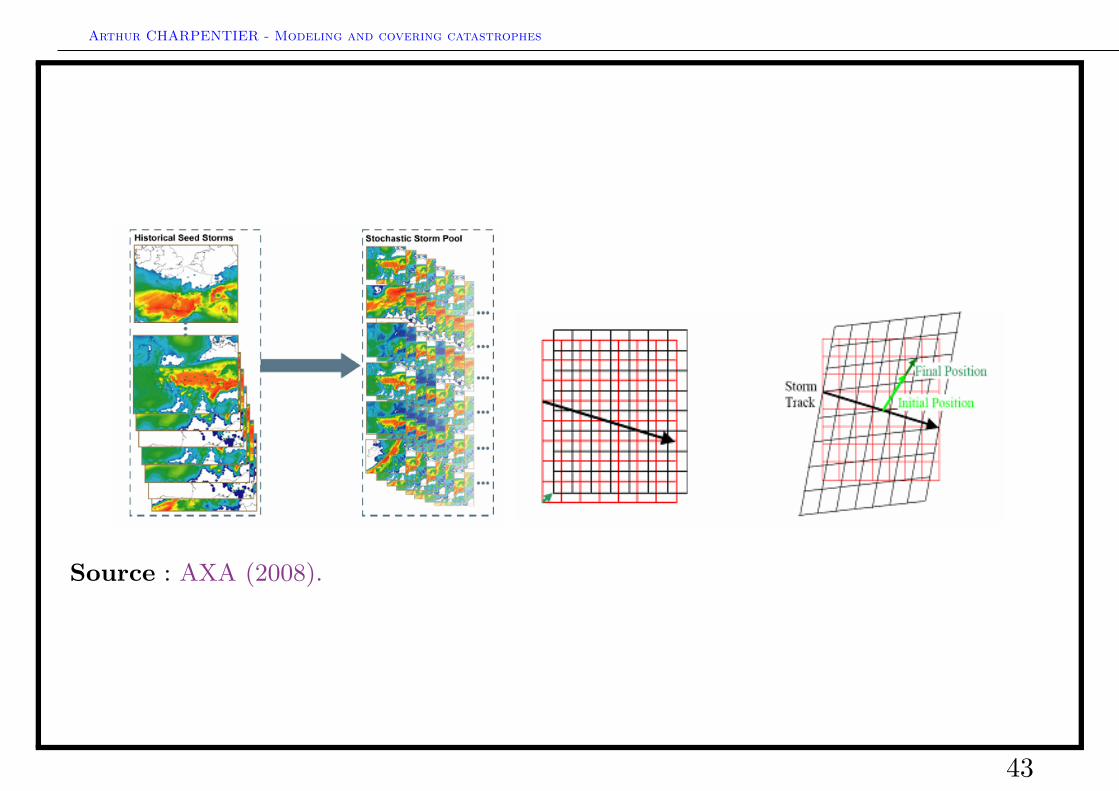
Source : AXA (2008).
43
Arthur CHARPENTIER - Modeling and covering catastrophes
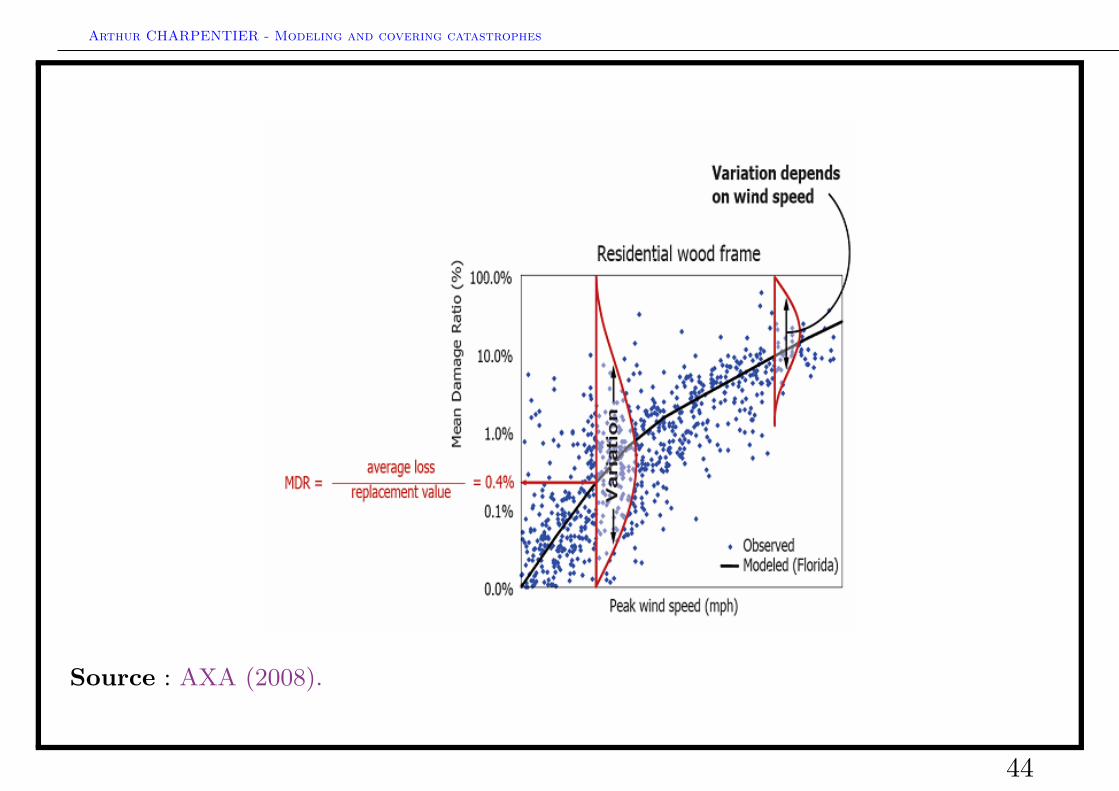
Source : AXA (2008).
44
Arthur CHARPENTIER - Modeling and covering catastrophes
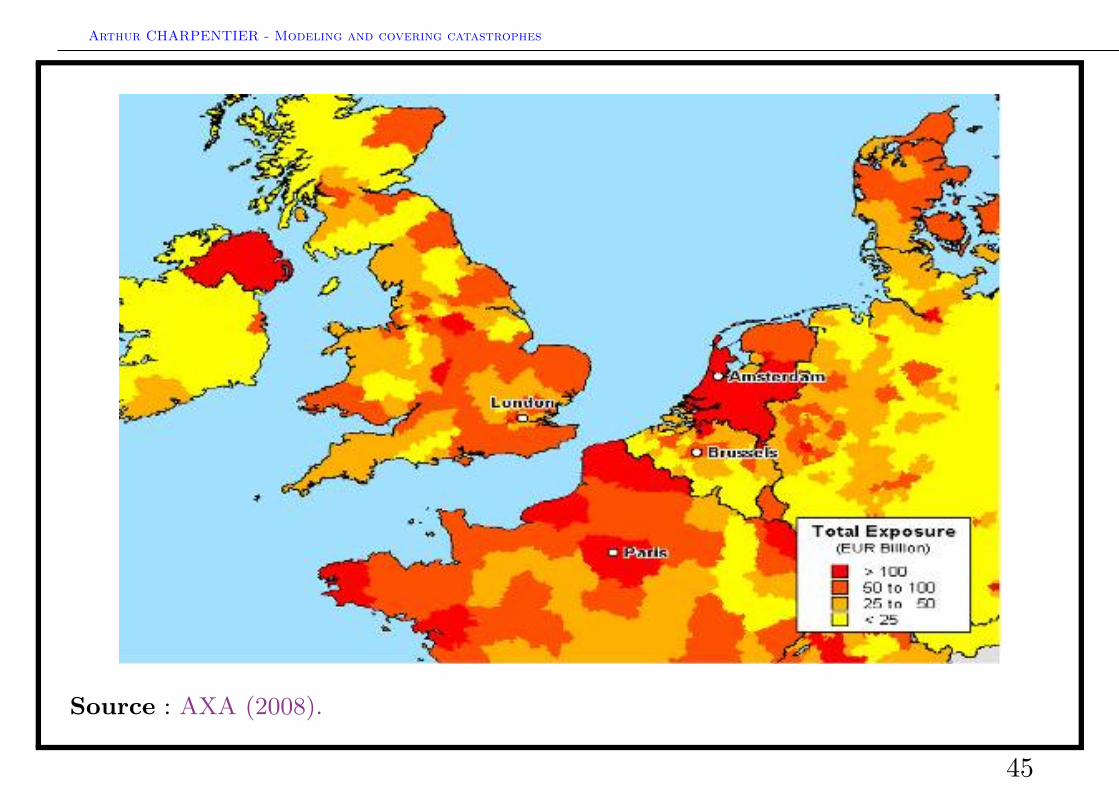
Source : AXA (2008).
45
Arthur CHARPENTIER - Modeling and covering catastrophes
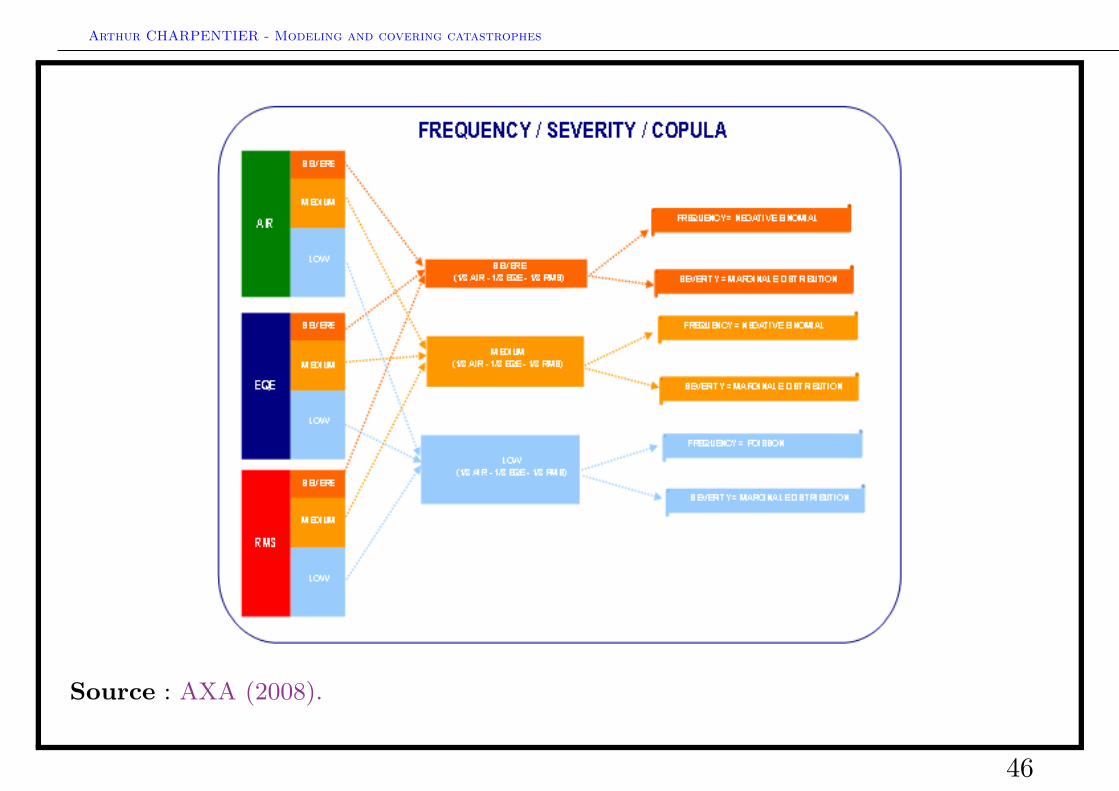
Source : AXA (2008).
46
Arthur CHARPENTIER - Modeling and covering catastrophes
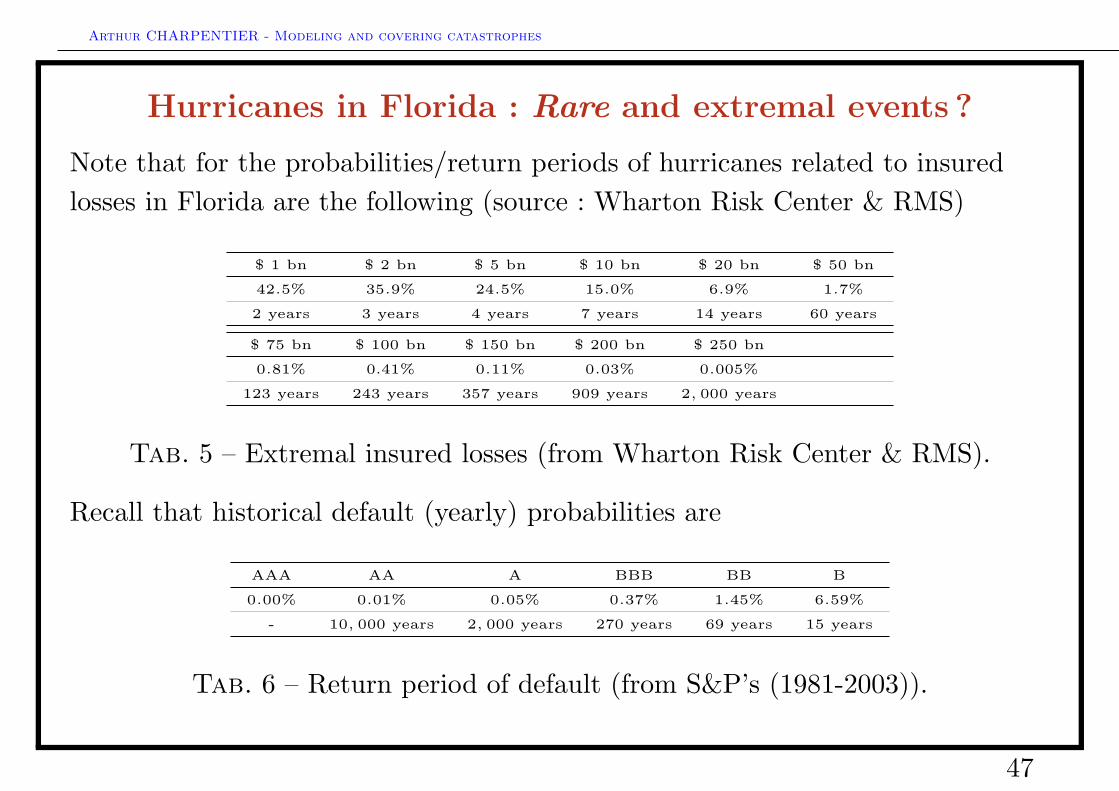
Hurricanes in Florida : Rare and extremal events ?
Note that for the probabilities/return periods of hurricanes related to insuredlosses in Florida are the following (source : Wharton Risk Center & RMS)
$ 1 bn $ 2 bn $ 5 bn $ 10 bn $ 20 bn $ 50 bn
42.5% 35.9% 24.5% 15.0% 6.9% 1.7%
2 years 3 years 4 years 7 years 14 years 60 years
$ 75 bn $ 100 bn $ 150 bn $ 200 bn $ 250 bn
0.81% 0.41% 0.11% 0.03% 0.005%
123 years 243 years 357 years 909 years 2, 000 years
Tab. 5 – Extremal insured losses (from Wharton Risk Center & RMS).
Recall that historical default (yearly) probabilities are
AAA AA A BBB BB B
0.00% 0.01% 0.05% 0.37% 1.45% 6.59%
- 10, 000 years 2, 000 years 270 years 69 years 15 years
Tab. 6 – Return period of default (from S&P’s (1981-2003)).
47
Arthur CHARPENTIER - Modeling and covering catastrophes
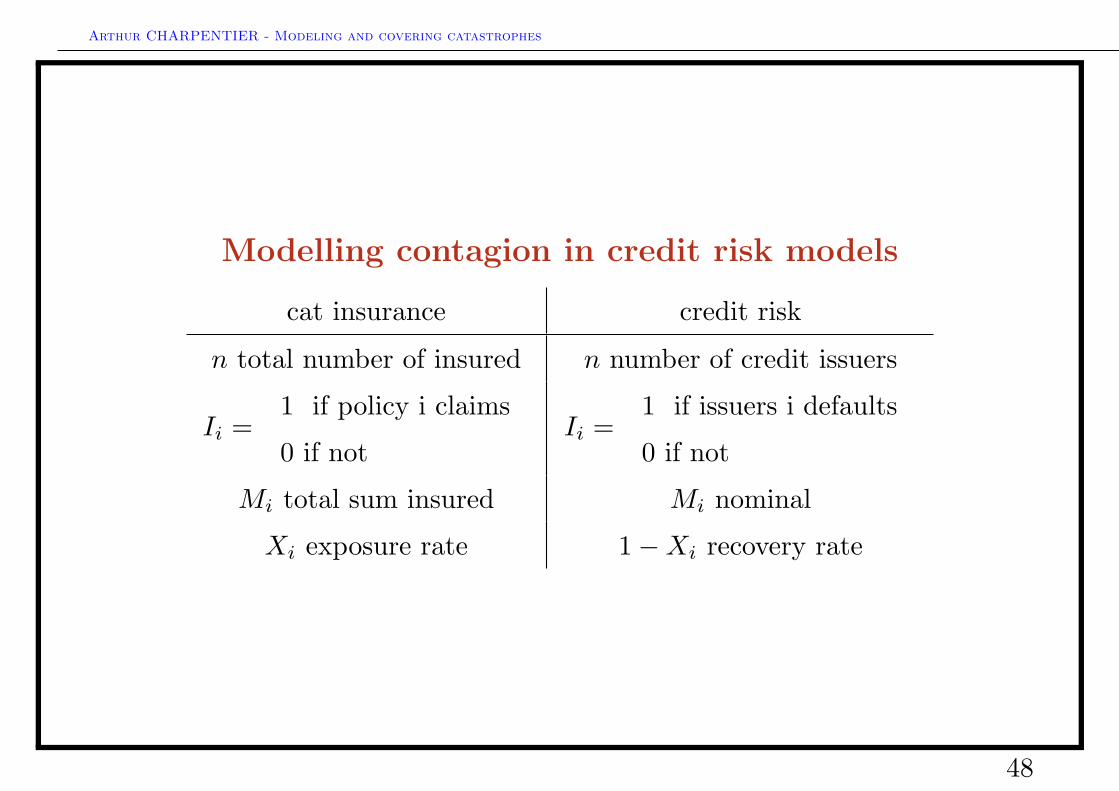
Modelling contagion in credit risk models
cat insurance credit risk
n total number of insured n number of credit issuers
Ii =1 if policy i claims
0 if notIi =
1 if issuers i defaults
0 if not
Mi total sum insured Mi nominal
Xi exposure rate 1−Xi recovery rate
48
Arthur CHARPENTIER - Modeling and covering catastrophes
Modelling contagion in credit risk models
In CreditMetrics, the idea is to generate random scenario to get the Profit &Loss distribution of the portfolio.
• the recovery rate is modeled using a beta distribution,• the exposure rate is modeled using a MBBEFD distribution (see Bernegger
(1999)).
To generate joint defaults, CreditMetrics proposed a probit model.
49
Arthur CHARPENTIER - Modeling and covering catastrophes
Agenda
Catastrophic risks modelling
• General introduction• Modeling very large claims• Natural catastrophes and accumulation risk• Insurance covers against catastrophes, traditional versus alternative
techniques
Risk measures and capital requirements
• Risk measures, an economic introduction• Calculating risk measures for catastrophic risks• Diversification and capital allocation
50
Arthur CHARPENTIER - Modeling and covering catastrophes
Insurance versus credit, an historical background
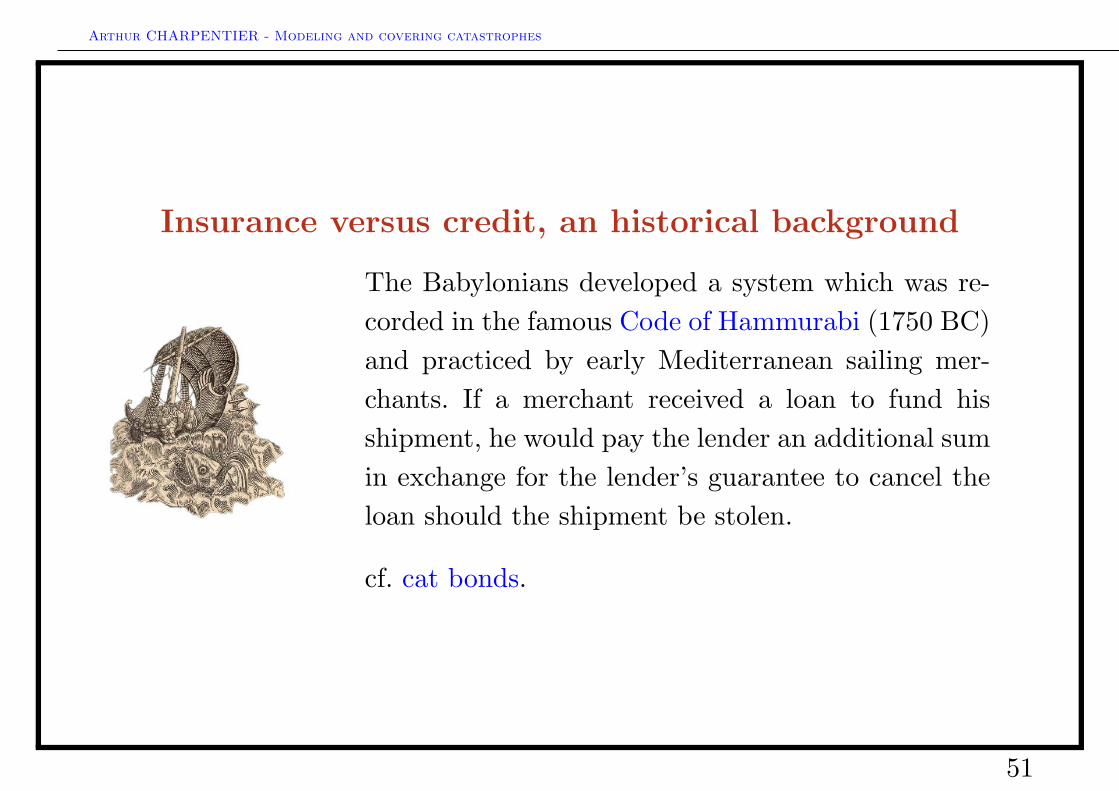
The Babylonians developed a system which was re-corded in the famous Code of Hammurabi (1750 BC)and practiced by early Mediterranean sailing mer-chants. If a merchant received a loan to fund hisshipment, he would pay the lender an additional sumin exchange for the lender’s guarantee to cancel theloan should the shipment be stolen.
cf. cat bonds.
51
Arthur CHARPENTIER - Modeling and covering catastrophes
Why a reinsurance market ?
“reinsurance is the transfer of part of the hazards of risks that a direct insurerassumes by way of reinsurance contracts or legal provision on behalf of aninsured, to a second insurancce carrier, the reinsurer, who has no directcontractual relationship with the insured” (Swiss Re, introduction to reinsurance)
Reinsurance allwo (primary) insurers to increase the maximum amount they caninsure for a given loss : they can optimize their underwriting capacity withoutburdening their need to cover their solvency margin.
The law of large number can be used by insurance companies to assess theirprobable annual loss... but under strong assumptions of identical distribution(hence past event can be used to estimate future one) and independence.
52
Arthur CHARPENTIER - Modeling and covering catastrophes
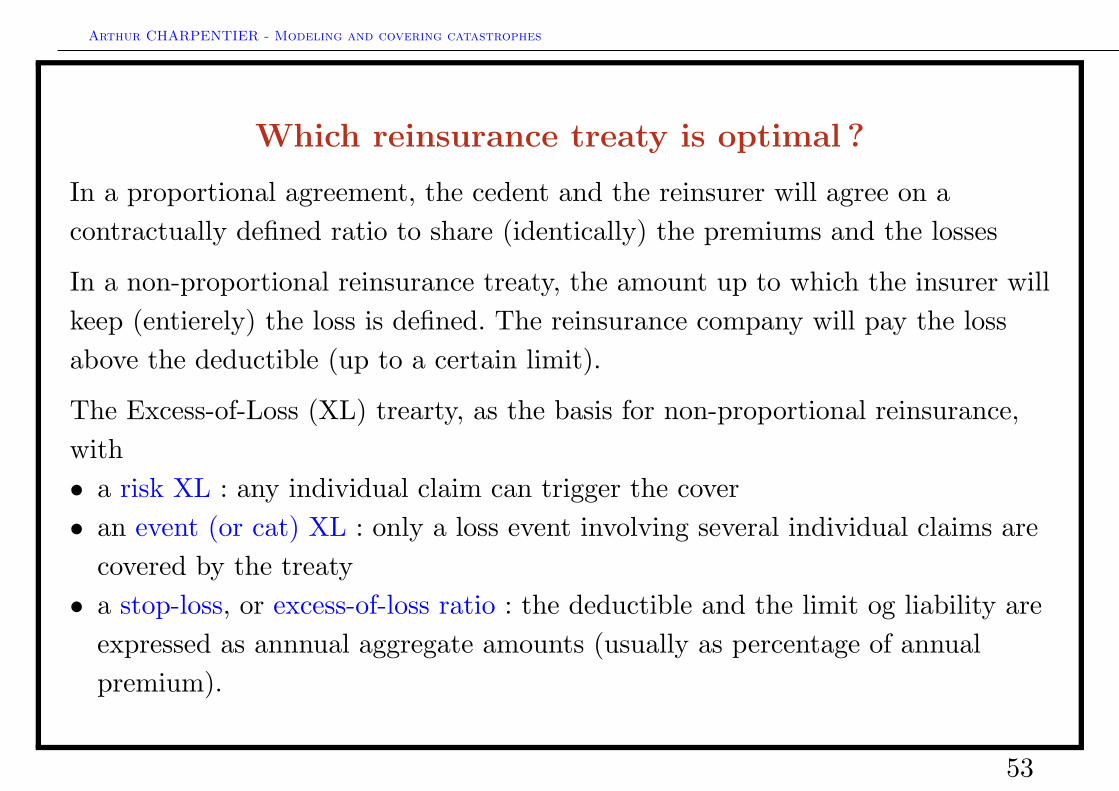
Which reinsurance treaty is optimal ?
In a proportional agreement, the cedent and the reinsurer will agree on acontractually defined ratio to share (identically) the premiums and the losses
In a non-proportional reinsurance treaty, the amount up to which the insurer willkeep (entierely) the loss is defined. The reinsurance company will pay the lossabove the deductible (up to a certain limit).
The Excess-of-Loss (XL) trearty, as the basis for non-proportional reinsurance,with• a risk XL : any individual claim can trigger the cover• an event (or cat) XL : only a loss event involving several individual claims are
covered by the treaty• a stop-loss, or excess-of-loss ratio : the deductible and the limit og liability are
expressed as annnual aggregate amounts (usually as percentage of annualpremium).
53
Arthur CHARPENTIER - Modeling and covering catastrophes
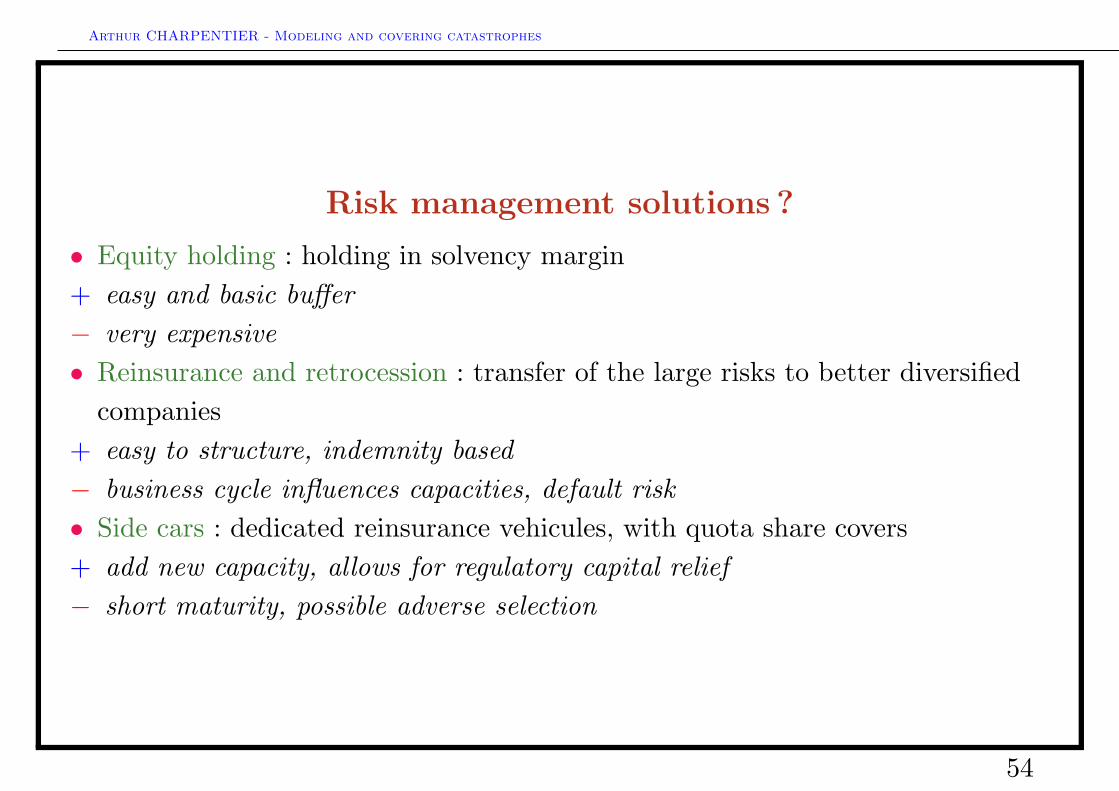
Risk management solutions ?
• Equity holding : holding in solvency margin+ easy and basic buffer− very expensive• Reinsurance and retrocession : transfer of the large risks to better diversified
companies+ easy to structure, indemnity based− business cycle influences capacities, default risk• Side cars : dedicated reinsurance vehicules, with quota share covers+ add new capacity, allows for regulatory capital relief− short maturity, possible adverse selection
54
Arthur CHARPENTIER - Modeling and covering catastrophes
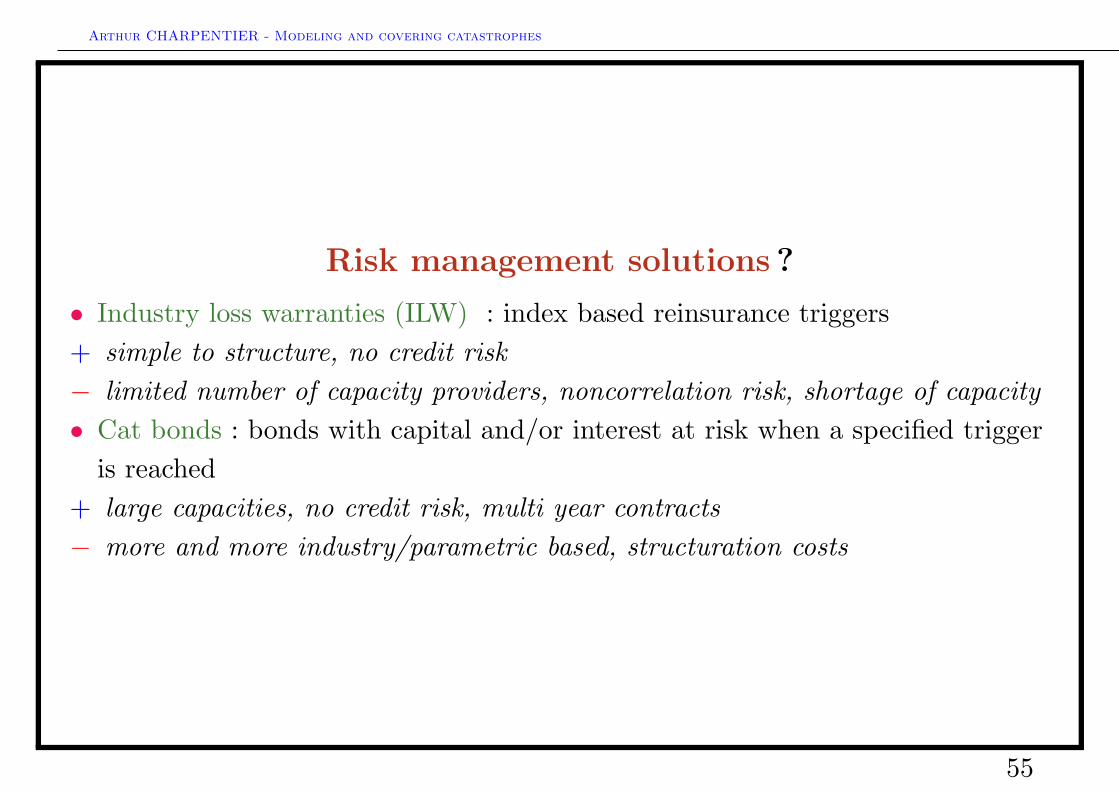
Risk management solutions ?
• Industry loss warranties (ILW) : index based reinsurance triggers+ simple to structure, no credit risk− limited number of capacity providers, noncorrelation risk, shortage of capacity• Cat bonds : bonds with capital and/or interest at risk when a specified trigger
is reached+ large capacities, no credit risk, multi year contracts− more and more industry/parametric based, structuration costs
55
Arthur CHARPENTIER - Modeling and covering catastrophes
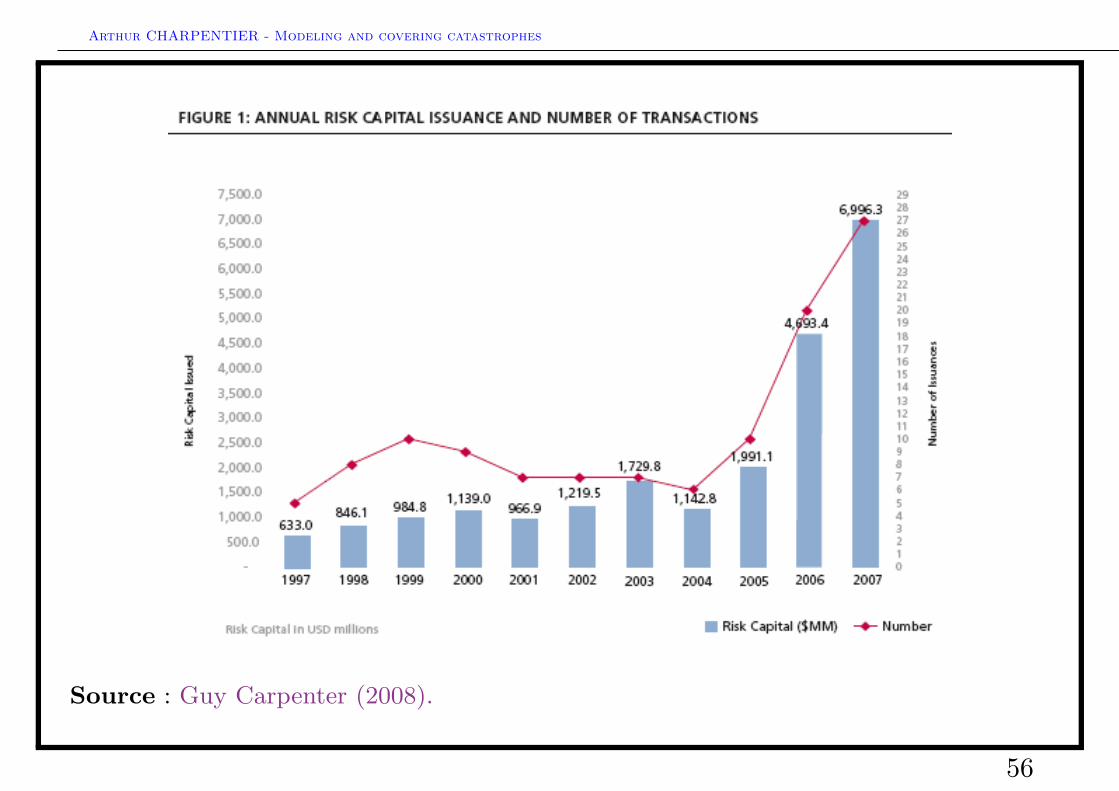
Source : Guy Carpenter (2008).
56
Arthur CHARPENTIER - Modeling and covering catastrophes
57
Arthur CHARPENTIER - Modeling and covering catastrophes
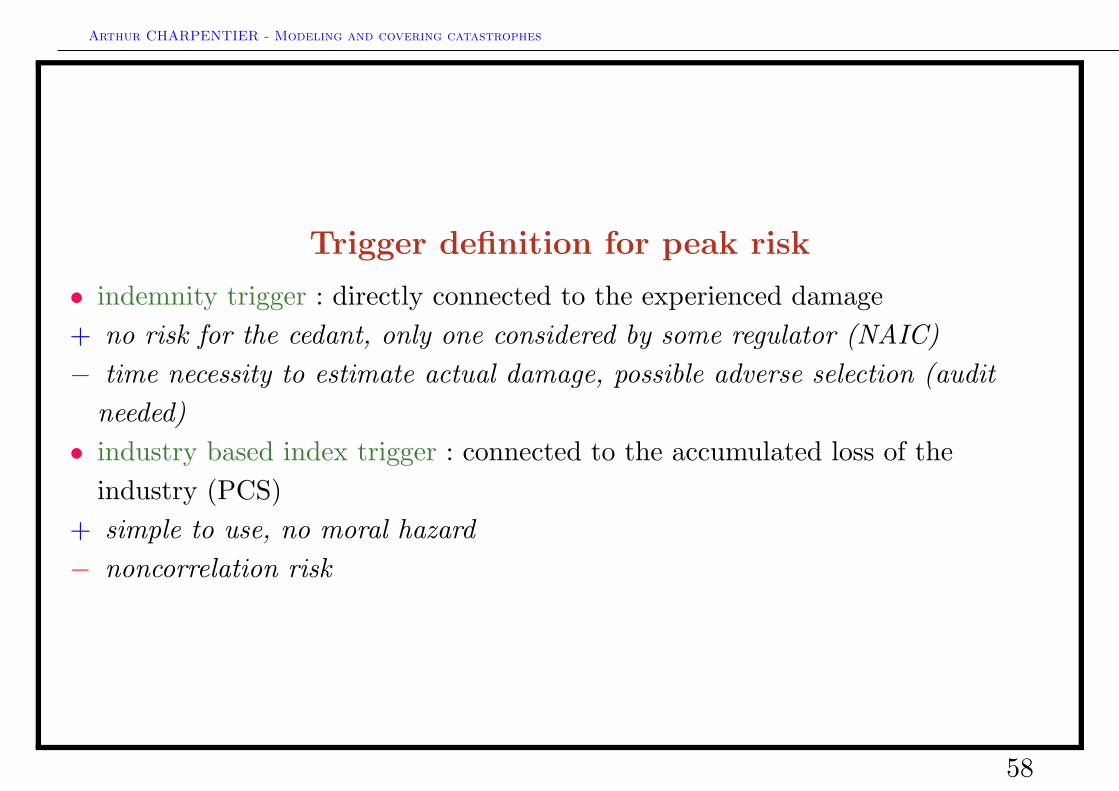
Trigger definition for peak risk
• indemnity trigger : directly connected to the experienced damage+ no risk for the cedant, only one considered by some regulator (NAIC)− time necessity to estimate actual damage, possible adverse selection (audit
needed)• industry based index trigger : connected to the accumulated loss of the
industry (PCS)+ simple to use, no moral hazard− noncorrelation risk
58
Arthur CHARPENTIER - Modeling and covering catastrophes
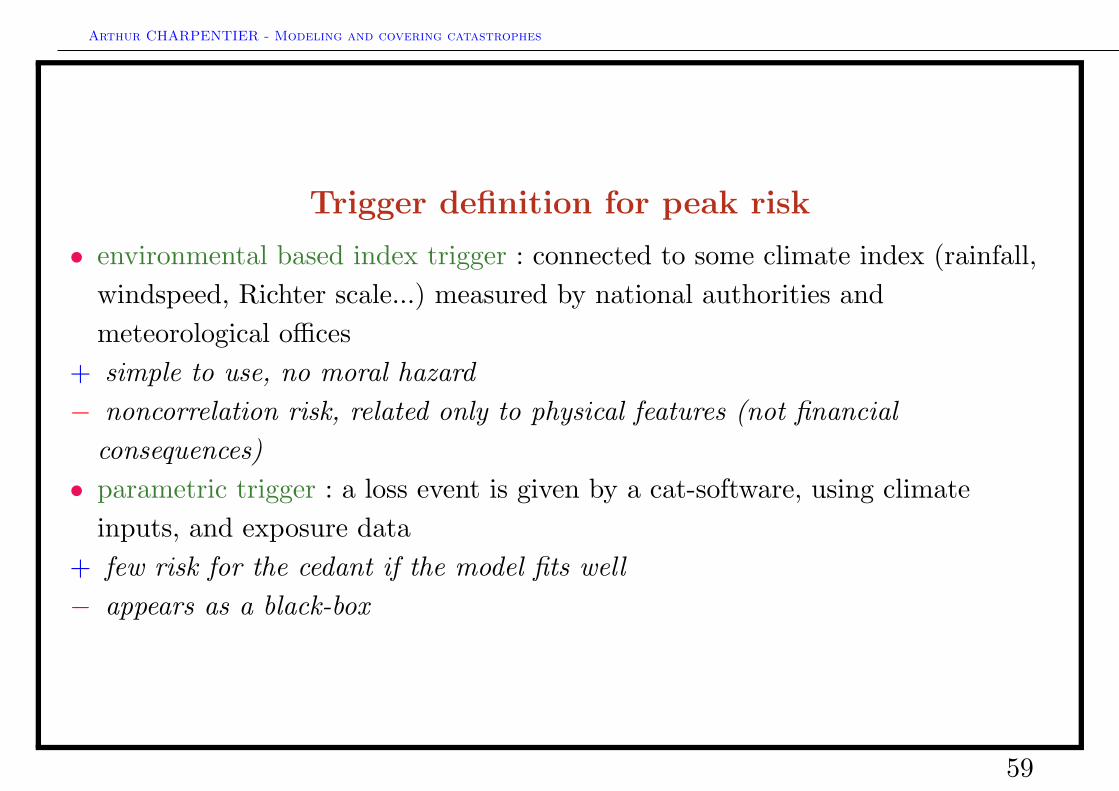
Trigger definition for peak risk
• environmental based index trigger : connected to some climate index (rainfall,windspeed, Richter scale...) measured by national authorities andmeteorological offices
+ simple to use, no moral hazard− noncorrelation risk, related only to physical features (not financial
consequences)• parametric trigger : a loss event is given by a cat-software, using climate
inputs, and exposure data+ few risk for the cedant if the model fits well− appears as a black-box
59
Arthur CHARPENTIER - Modeling and covering catastrophes
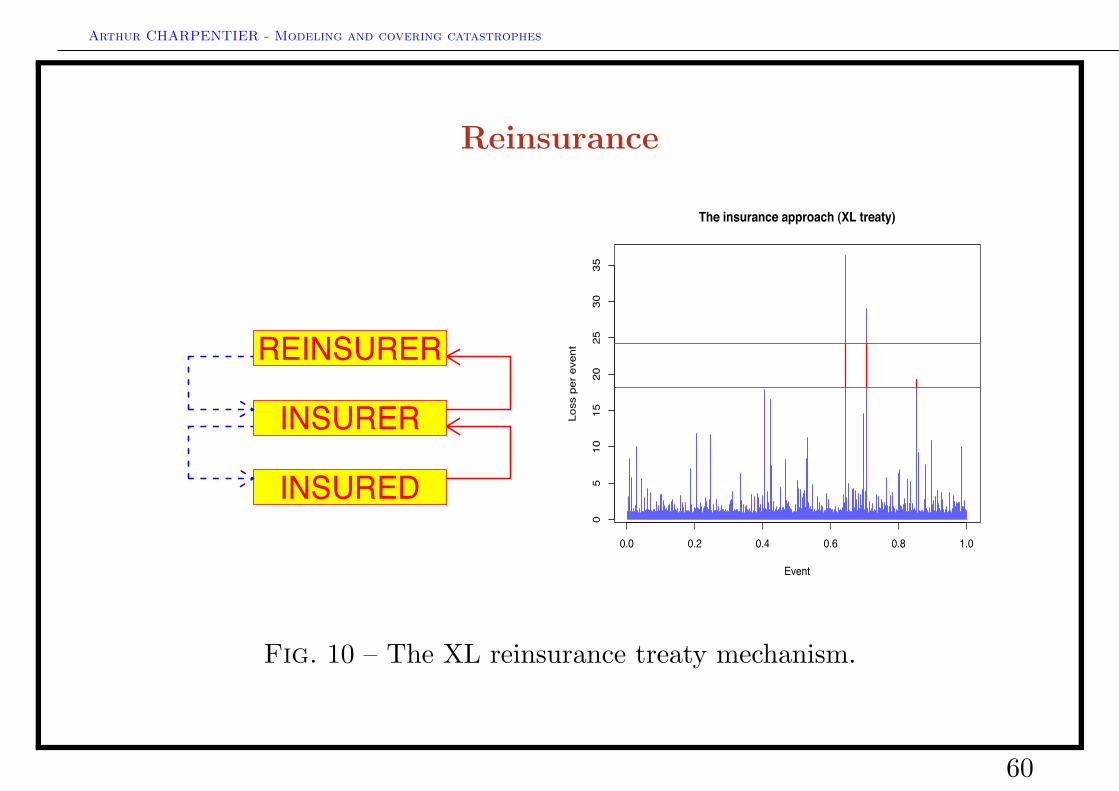
Reinsurance
INSURED
INSURER
REINSURER
0.0 0.2 0.4 0.6 0.8 1.0
05
1015
2025
3035
The insurance approach (XL treaty)
EventLo
ss p
er e
vent
Fig. 10 – The XL reinsurance treaty mechanism.
60
Arthur CHARPENTIER - Modeling and covering catastrophes
Group net W.P. net W.P. loss ratio total Shareholders’ Funds
(2005) (2004) (2005) (2004)
Munich Re 17.6 20.5 84.66% 24.3 24.4
Swiss Re (1) 16.5 20 85.78% 15.5 16
Berkshire Hathaway Re 7.8 8.2 91.48% 40.9 37.8
Hannover Re 7.1 7.8 85.66% 2.9 3.2
GE Insurance Solutions 5.2 6.3 164.51% 6.4 6.4
Lloyd’s 5.1 4.9 103.2%
XL Re 3.9 3.2 99.72%
Everest Re 3 3.5 93.97% 3.2 2.8
Reinsurance Group of America Inc. 3 2.6 1.9 1.7
PartnerRe 2.8 3 86.97% 2.4 2.6
Transatlantic Holdings Inc. 2.7 2.9 84.99% 1.9 2
Tokio Marine 2.1 2.6 26.9 23.9
Scor 2 2.5 74.08% 1.5 1.4
Odyssey Re 1.7 1.8 90.54% 1.2 1.2
Korean Re 1.5 1.3 69.66% 0.5 0.4
Scottish Re Group Ltd. 1.5 0.4 0.9 0.6
Converium 1.4 2.9 75.31% 1.2 1.3
Sompo Japan Insurance Inc. 1.4 1.6 25.3% 15.3 12.1
Transamerica Re (Aegon) 1.3 0.7 5.5 5.7
Platinum Underwriters Holdings 1.3 1.2 87.64% 1.2 0.8
Mitsui Sumitomo Insurance 1.3 1.5 63.18% 16.3 14.1
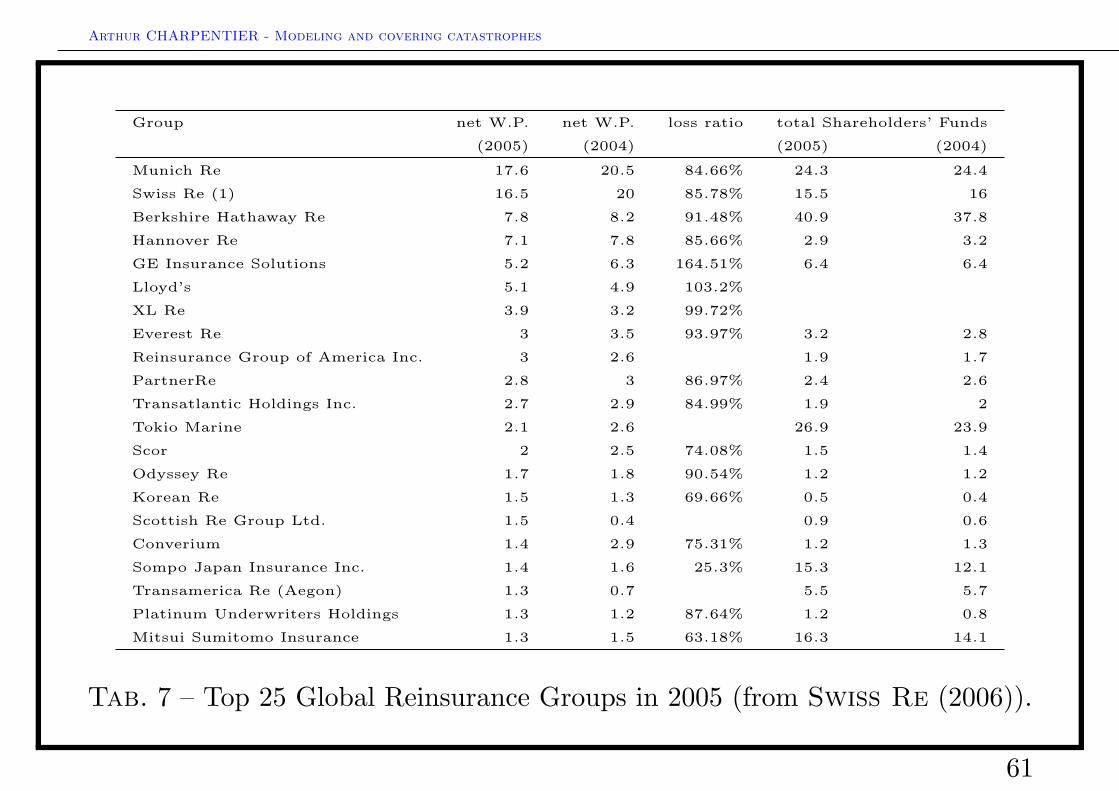
Tab. 7 – Top 25 Global Reinsurance Groups in 2005 (from Swiss Re (2006)).
61
Arthur CHARPENTIER - Modeling and covering catastrophes
Side cars
A hedge fund that wishes to get into the reinsurance business will start a specialpurpose vehicle with a reinsurer.
The hedge fund is able to get into reinsurance without hiring underwriters,buying models, nor getting rated by the rating agencies
62
Arthur CHARPENTIER - Modeling and covering catastrophes
ILW - Insurance Loss Warranty
Industry loss warranties pay a fixed amount based of the amount of industry loss(PCS or SIGMA).
Example For example, a $30 million ILW with a $5 billion trigger.
Cat bonds and securitization
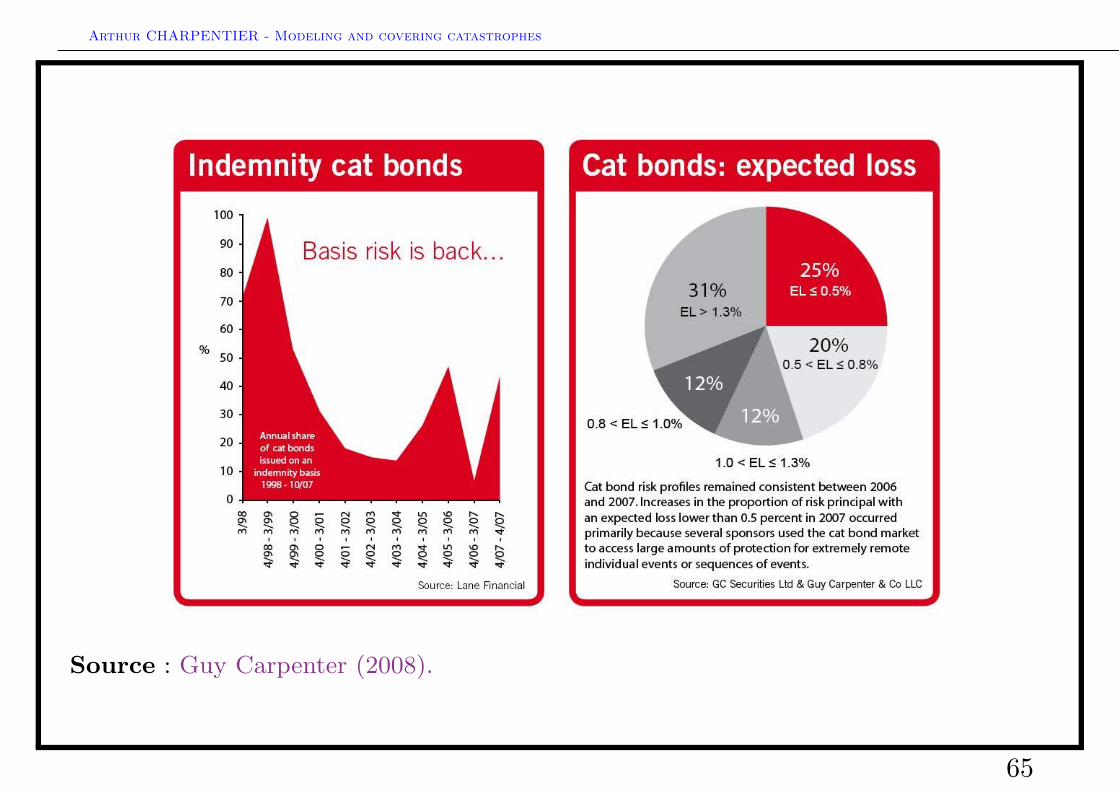
Bonds issued to cover catastrophe risk were developed subsequent to HurricaneAndrew
These bonds are structured so that the investor has a good return if there are noqualifying events and a poor return if a loss occurs. Losses can be triggered on anindustry index or on an indemnity basis.
63
Arthur CHARPENTIER - Modeling and covering catastrophes
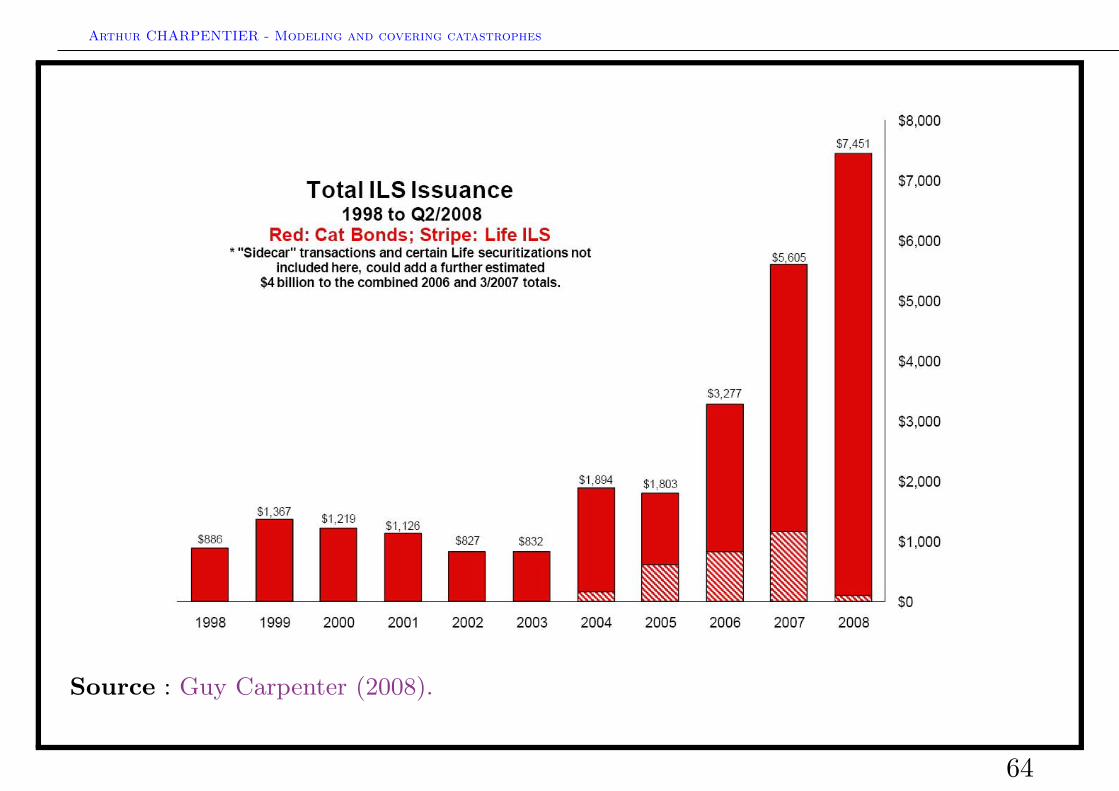
Source : Guy Carpenter (2008).
64
Arthur CHARPENTIER - Modeling and covering catastrophes
Source : Guy Carpenter (2008).
65
Arthur CHARPENTIER - Modeling and covering catastrophes
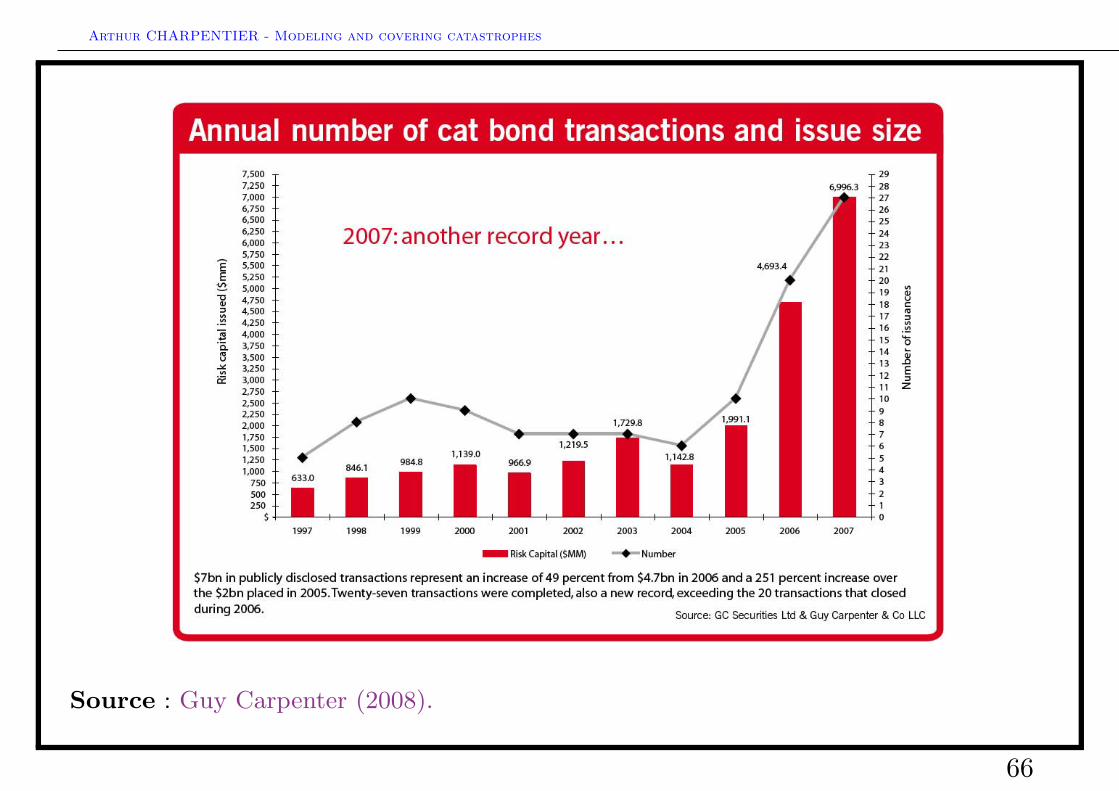
Source : Guy Carpenter (2008).
66
Arthur CHARPENTIER - Modeling and covering catastrophes
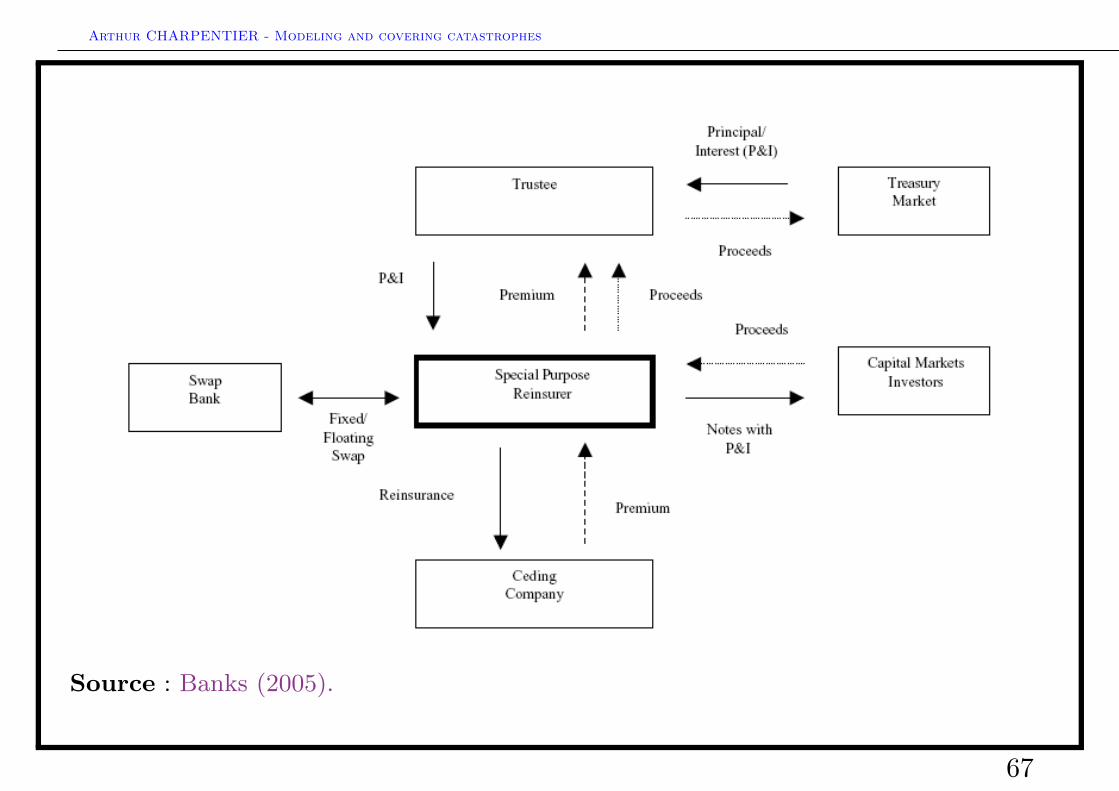
Source : Banks (2005).
67
Arthur CHARPENTIER - Modeling and covering catastrophes
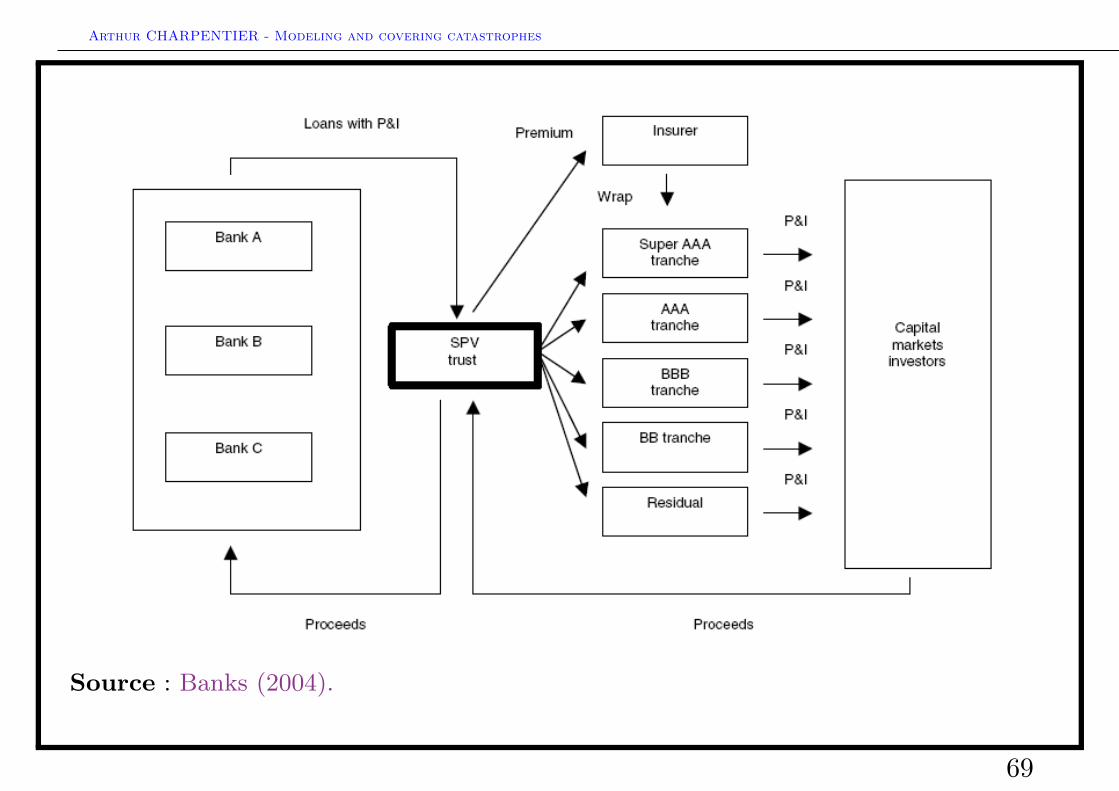
Cat Bonds and securitization
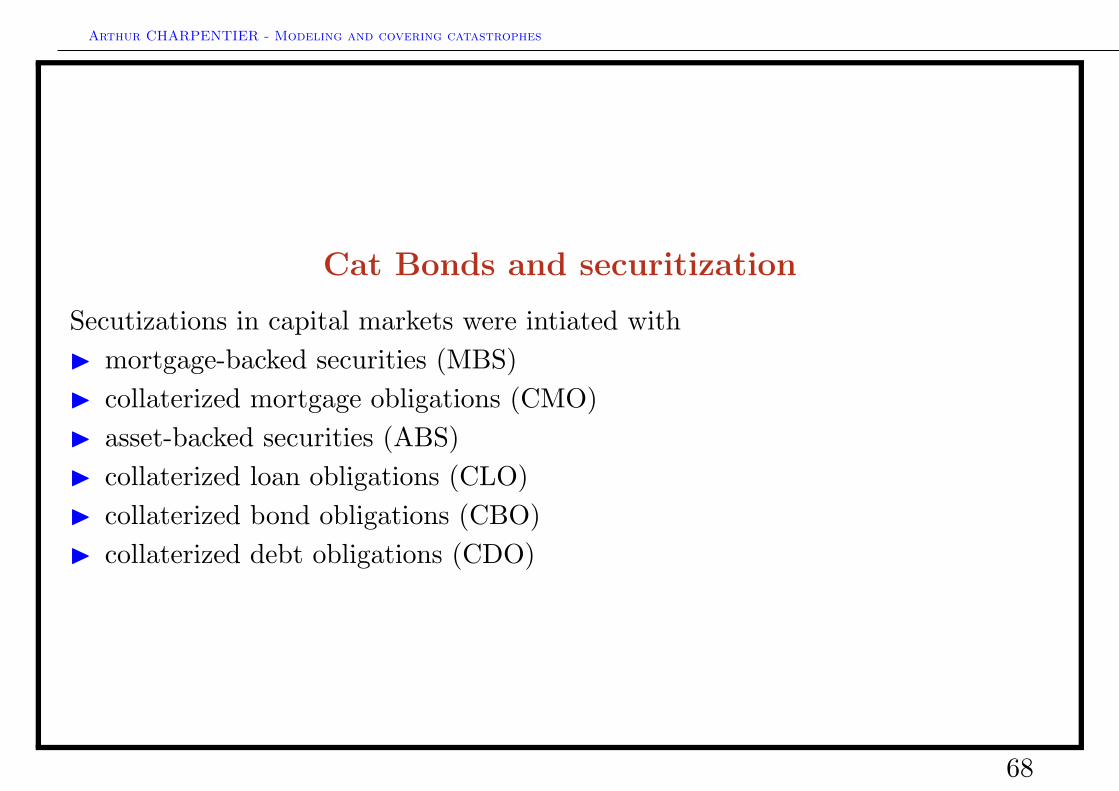
Secutizations in capital markets were intiated withI mortgage-backed securities (MBS)I collaterized mortgage obligations (CMO)I asset-backed securities (ABS)I collaterized loan obligations (CLO)I collaterized bond obligations (CBO)I collaterized debt obligations (CDO)
68
Arthur CHARPENTIER - Modeling and covering catastrophes
Source : Banks (2004).
69
Arthur CHARPENTIER - Modeling and covering catastrophes
Insurance Linked Securities
I indemnity triggerI index triggerI parametric trigger
70
Arthur CHARPENTIER - Modeling and covering catastrophes
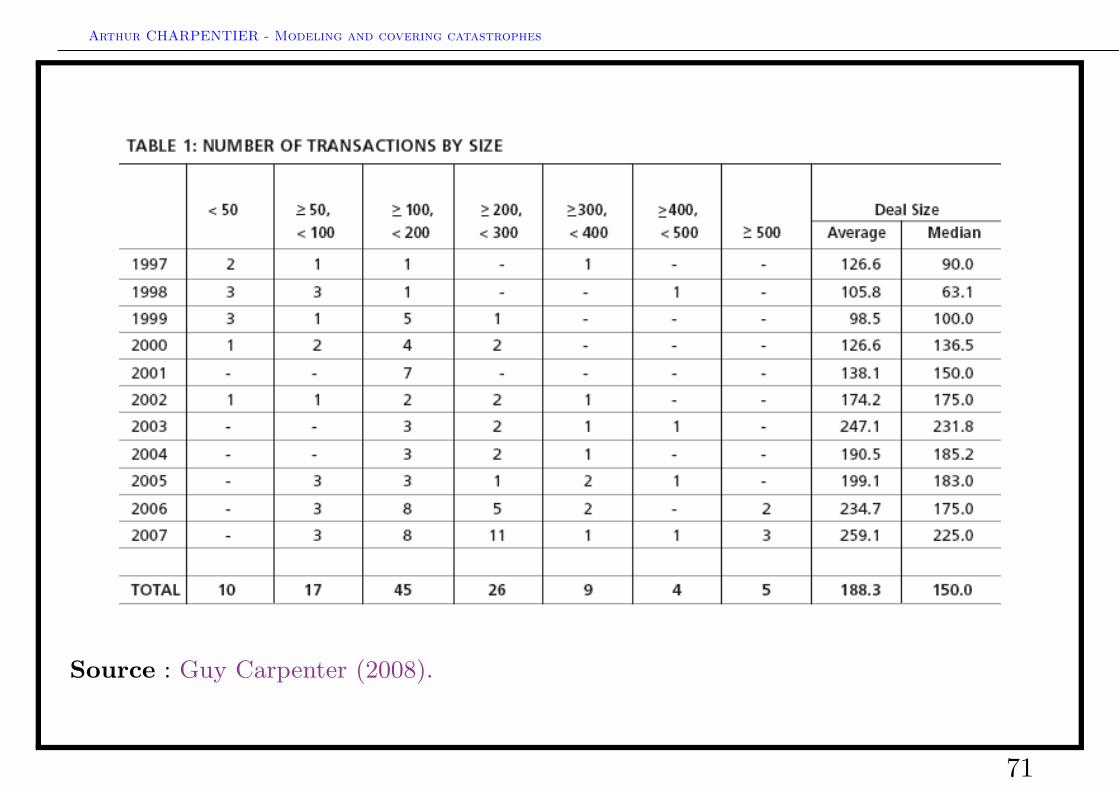
Source : Guy Carpenter (2008).
71
Arthur CHARPENTIER - Modeling and covering catastrophes
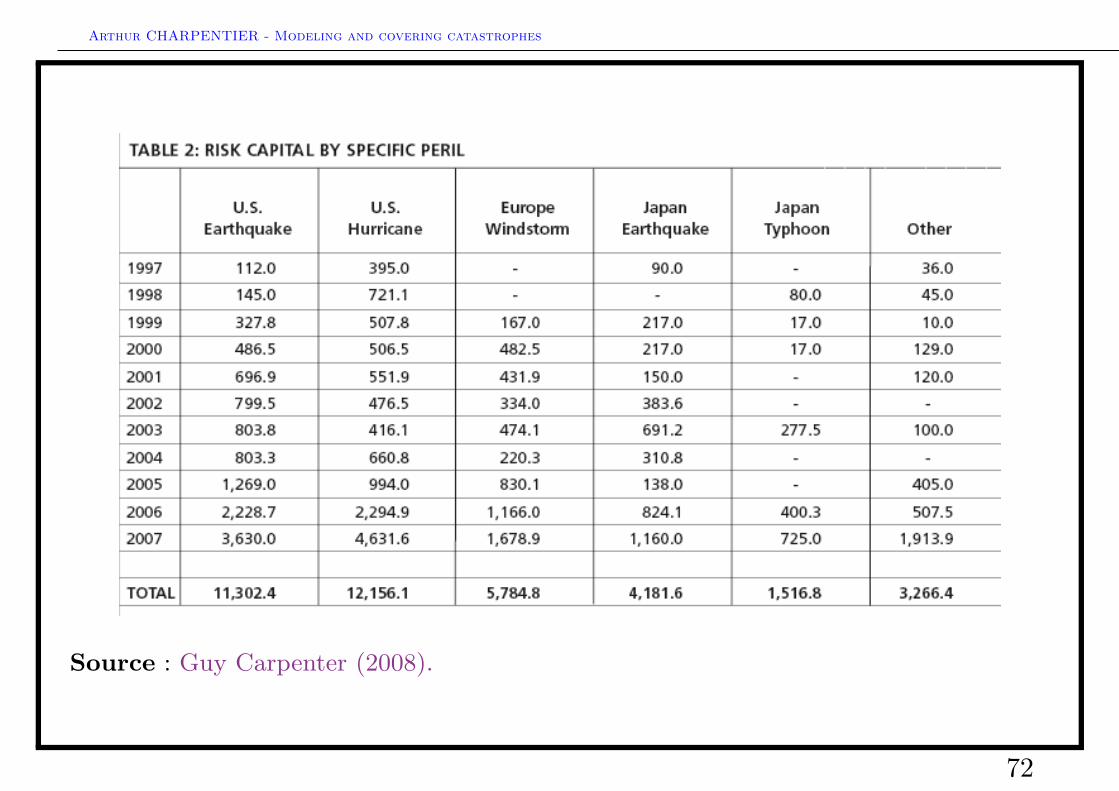
Source : Guy Carpenter (2008).
72
Arthur CHARPENTIER - Modeling and covering catastrophes
Source : Guy Carpenter (2008).
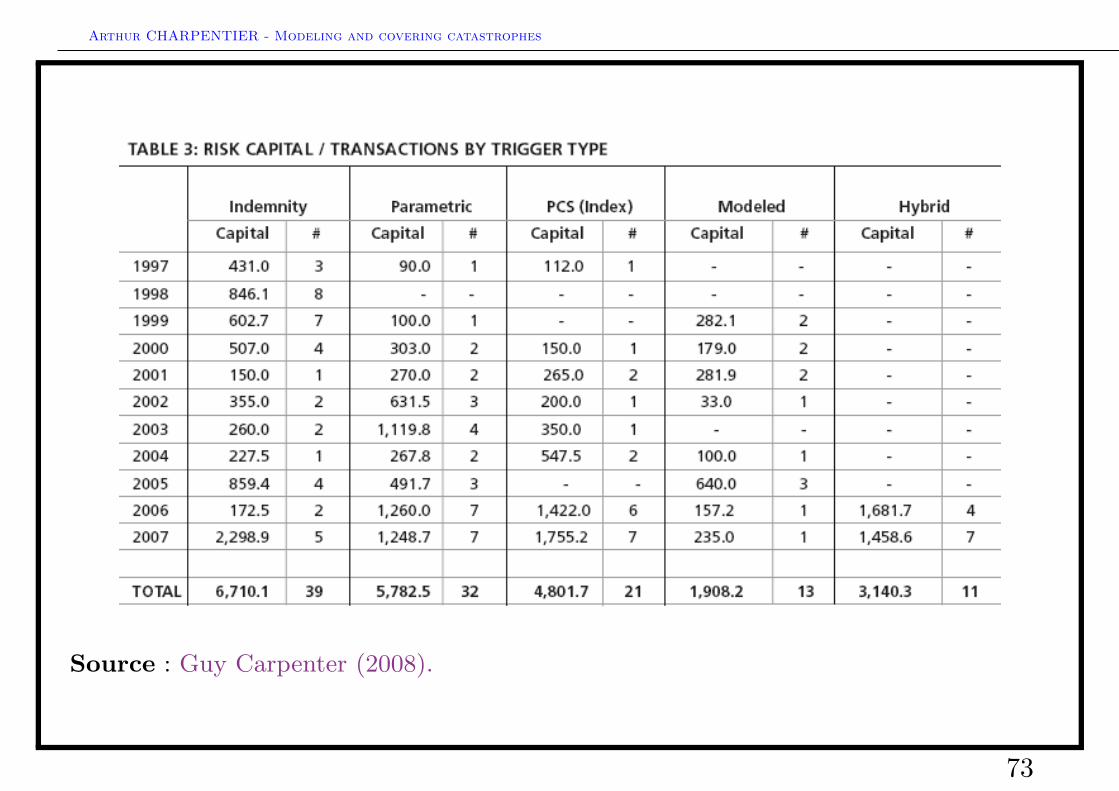
73
Arthur CHARPENTIER - Modeling and covering catastrophes
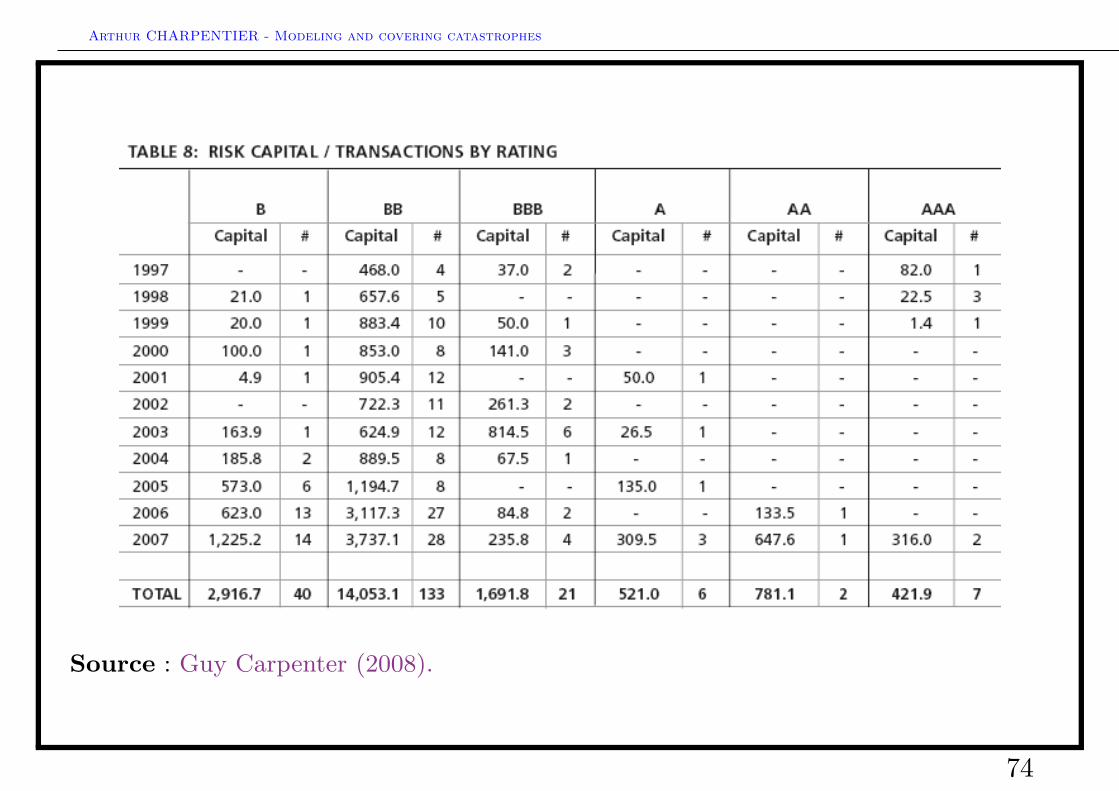
Source : Guy Carpenter (2008).
74
Arthur CHARPENTIER - Modeling and covering catastrophes
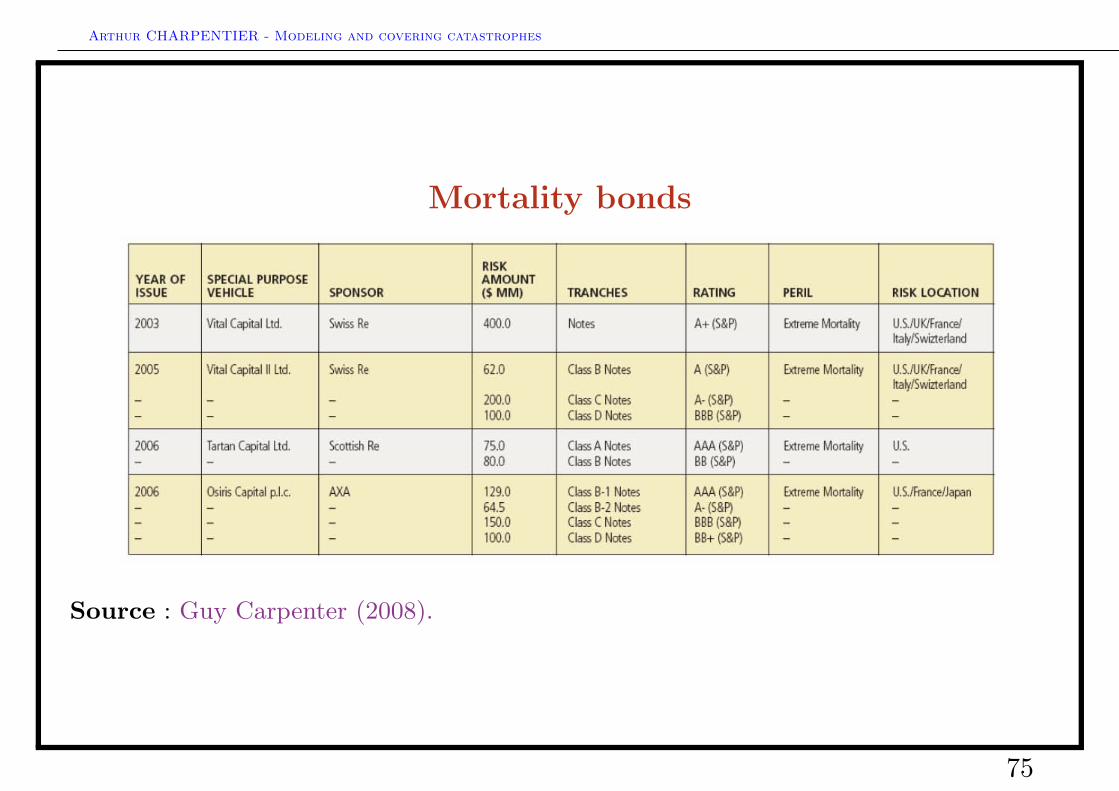
Mortality bonds
Source : Guy Carpenter (2008).
75
Arthur CHARPENTIER - Modeling and covering catastrophes
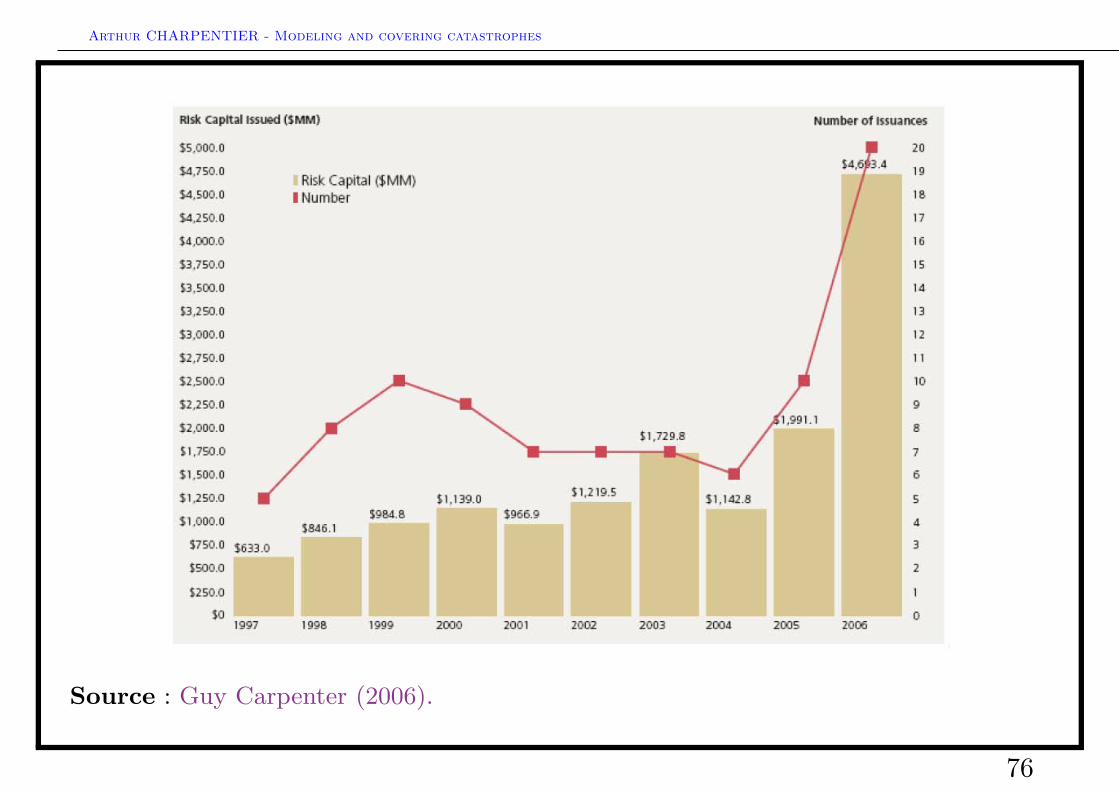
Source : Guy Carpenter (2006).
76
Arthur CHARPENTIER - Modeling and covering catastrophes
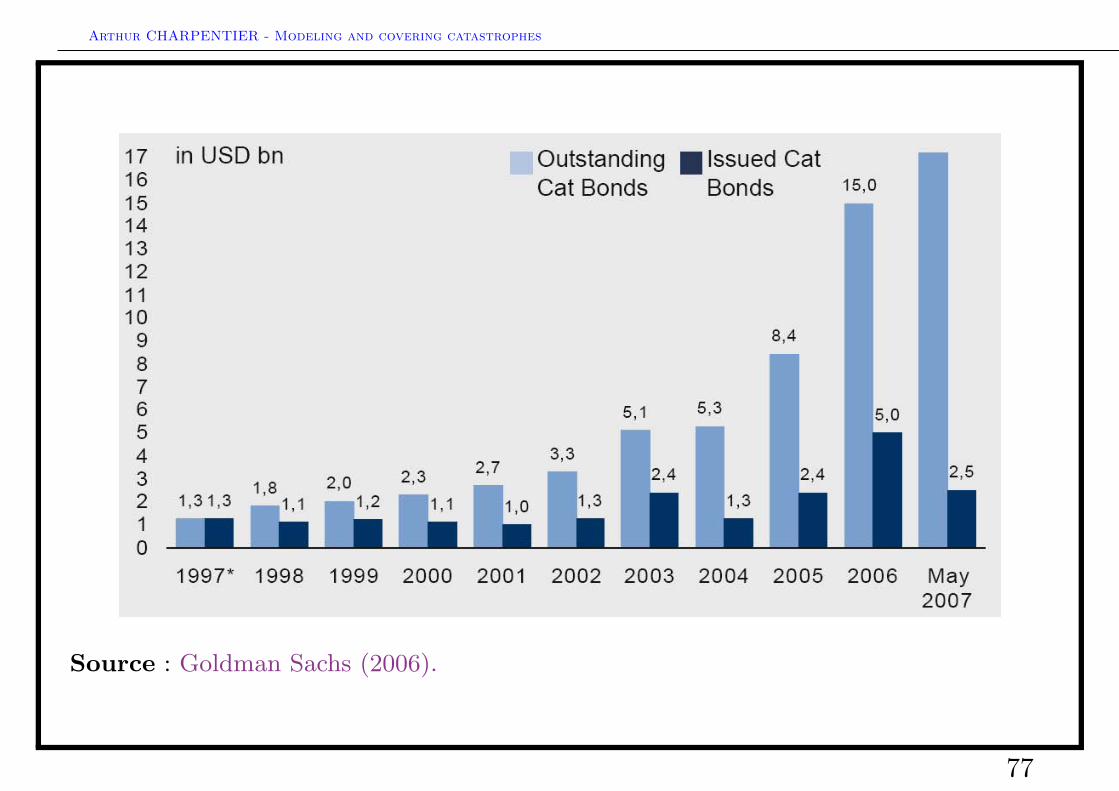
Source : Goldman Sachs (2006).
77
Arthur CHARPENTIER - Modeling and covering catastrophes
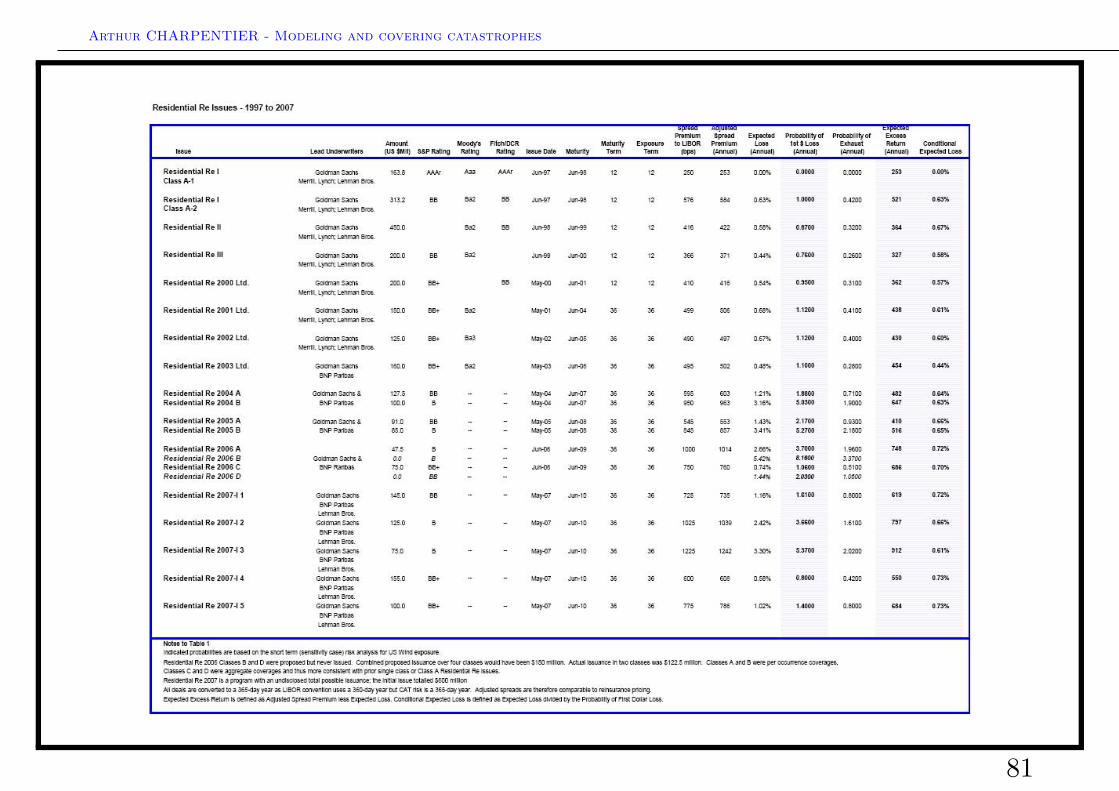
USAA’s hurricane bond(s) : Residential Re
USAA, mutually owned insurance company (auto, householders, dwelling,personal libability for US military personal, and family).
Hurricane Andrew (1992) : USD 620 million
Early 1996, work with AIR and Merrill Lynch (and later Goldman Sachs andLehman Brothers) to transfer a part of their portfolio
Bond structured to give the insurer cover of the Excess-of-Loss layer above USD1 billon, to a maximum of USD 500 million, at an 80% rate (i.e. 20% coinsured),provided by an insurance vehicule Residential Re, established as a Cayman SPR.
The SPR issued notes to investors, in 2 classes of 3 tranches,
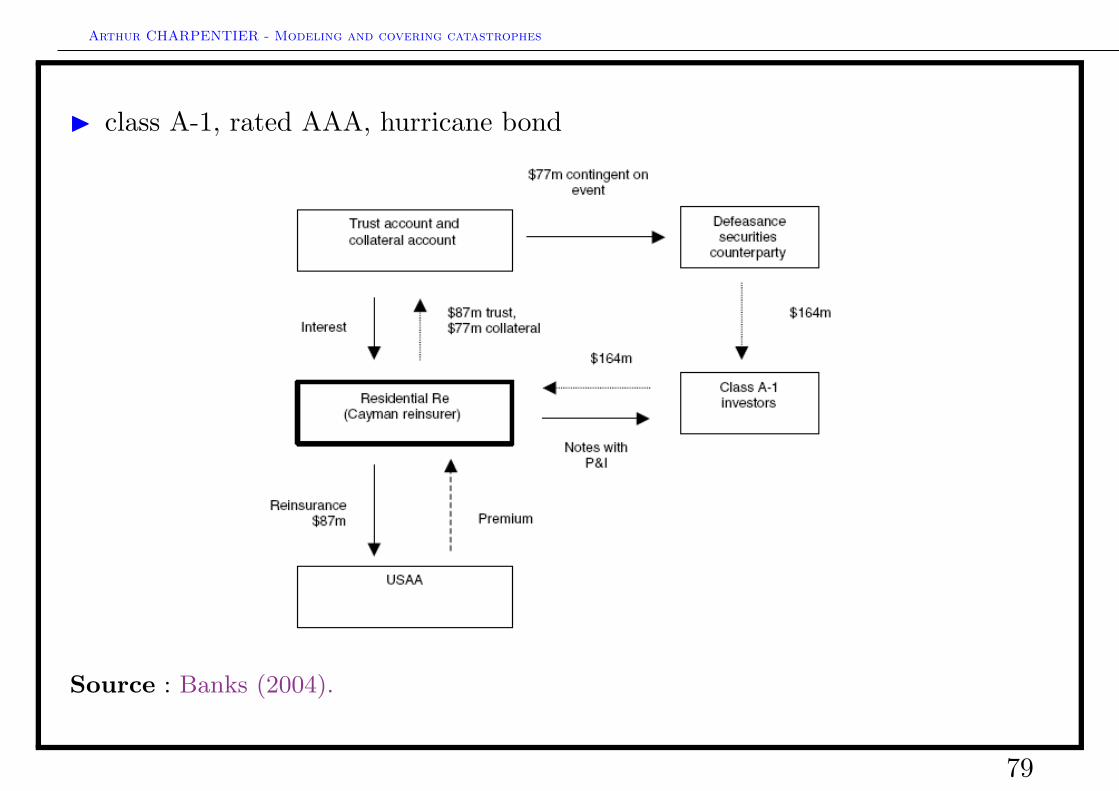
I class A-1, rated AAA, featuring a USD 77 million tranche of principalprotected notes, and USD 87 million of principal variable notes,
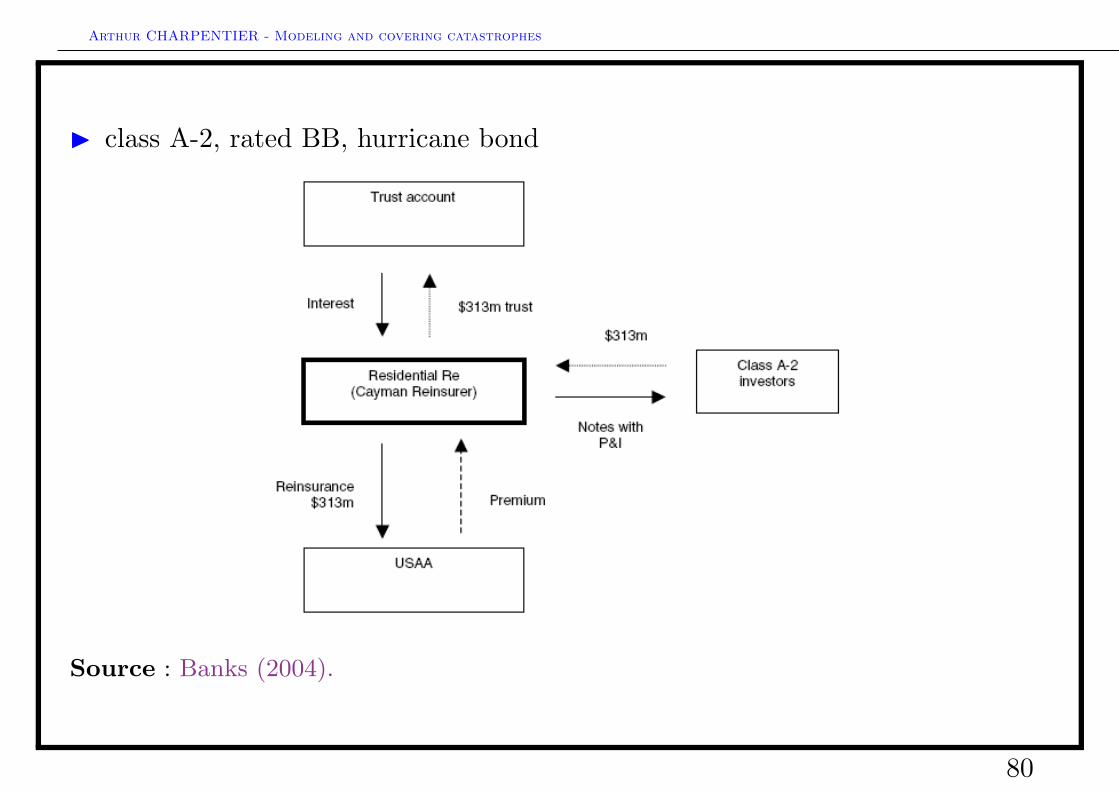
I class A-2, rated BB, featuring a USD 313 million of principal variable notes,
Trigger is the single occurrence of a class 3-5 hurricane, with ultimate net loss asdefined under USAA’s portfolio parameters (indemnity trigger)
78
Arthur CHARPENTIER - Modeling and covering catastrophes
I class A-1, rated AAA, hurricane bond
Source : Banks (2004).
79
Arthur CHARPENTIER - Modeling and covering catastrophes
I class A-2, rated BB, hurricane bond
Source : Banks (2004).
80
Arthur CHARPENTIER - Modeling and covering catastrophes
81
Arthur CHARPENTIER - Modeling and covering catastrophes
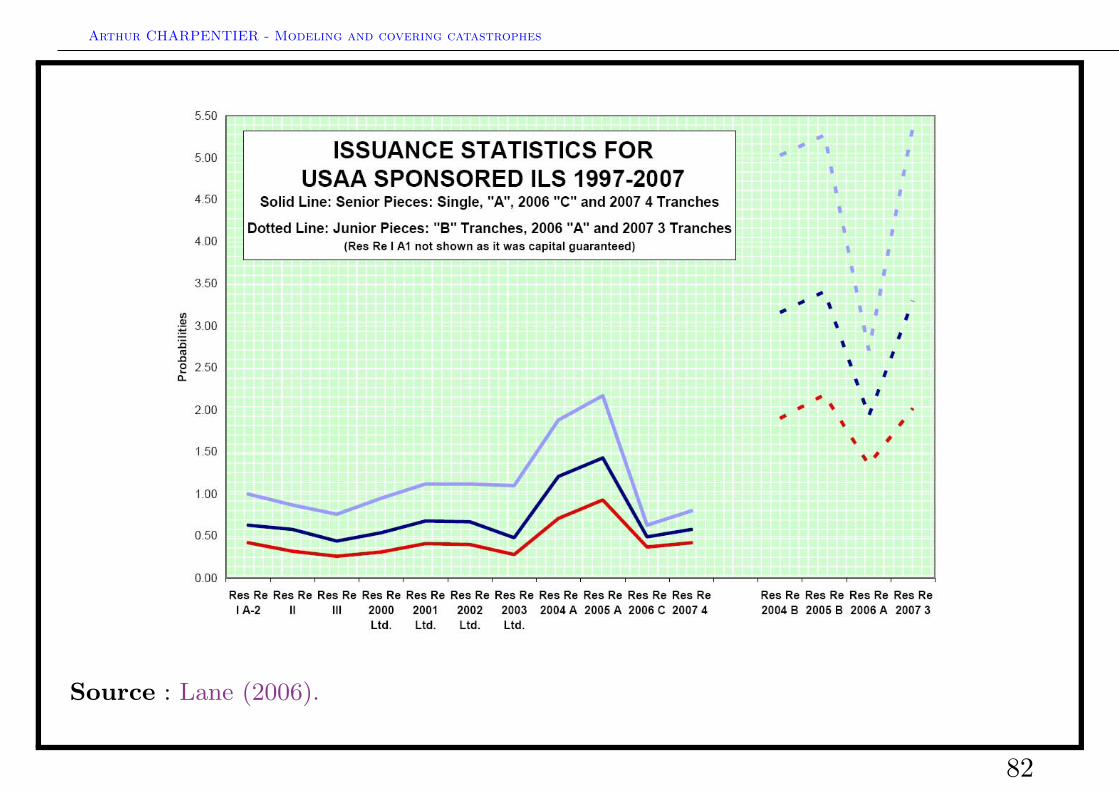
Source : Lane (2006).
82
Arthur CHARPENTIER - Modeling and covering catastrophes
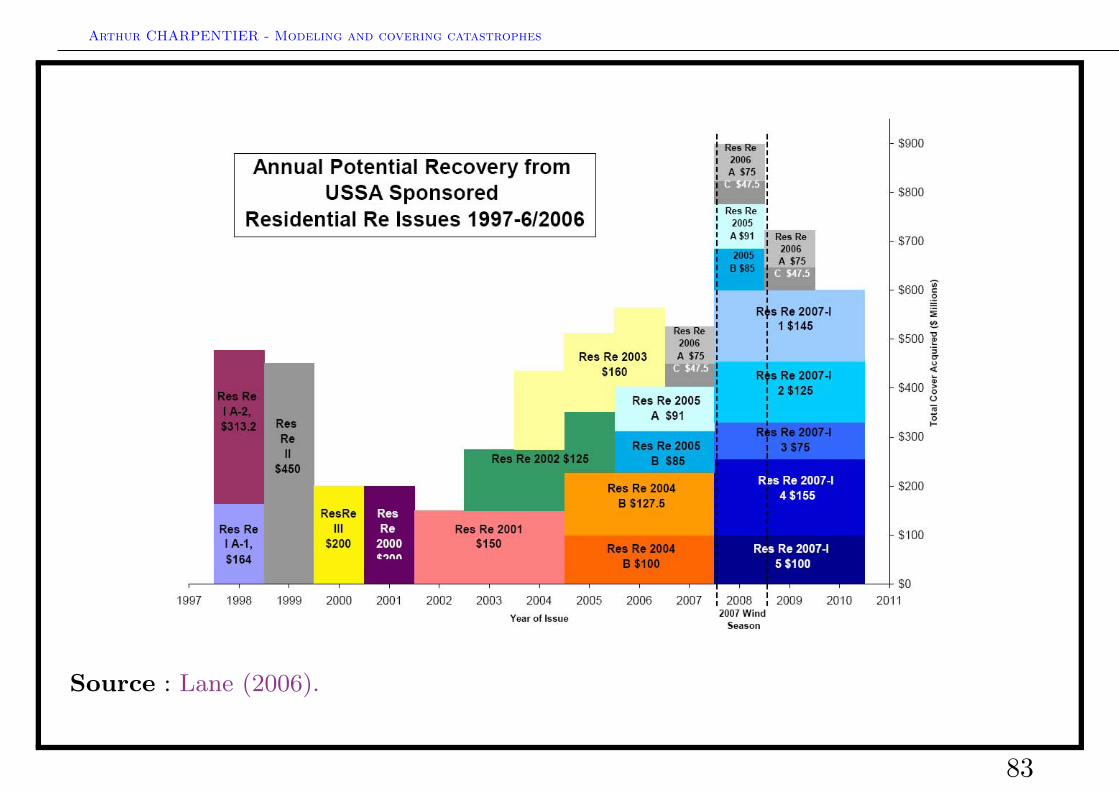
Source : Lane (2006).
83
Arthur CHARPENTIER - Modeling and covering catastrophes
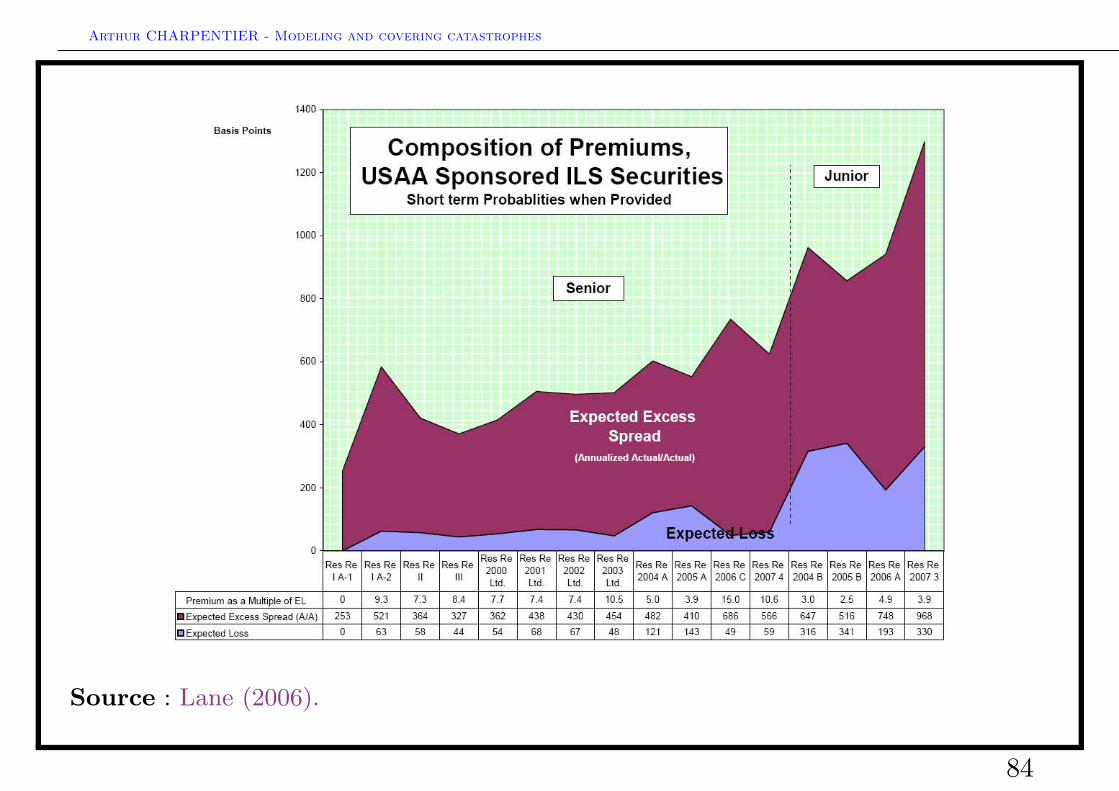
Source : Lane (2006).
84
Arthur CHARPENTIER - Modeling and covering catastrophes
Agenda
Catastrophic risks modelling
• General introduction• Business interruption and very large claims• Natural catastrophes and accumulation risk• Insurance covers against catastrophes, traditional versus alternative techniques
Risk measures and pricing covers
• Pricing insurance linked securities• Risk measures, an economic introduction• Calculating risk measures for catastrophic risks• Pricing cat bonds : the Winterthur example• Pricing cat bonds : the Mexican Earthquake
85
Arthur CHARPENTIER - Modeling and covering catastrophes
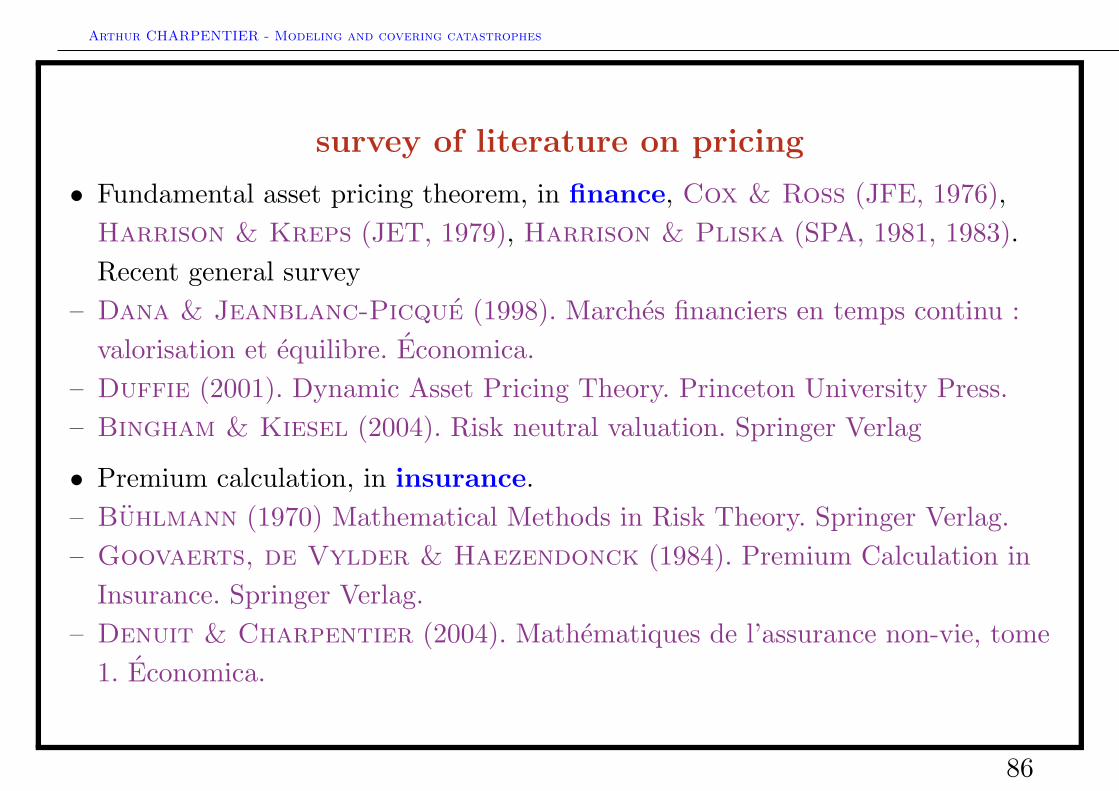
survey of literature on pricing
• Fundamental asset pricing theorem, in finance, Cox & Ross (JFE, 1976),Harrison & Kreps (JET, 1979), Harrison & Pliska (SPA, 1981, 1983).Recent general survey
– Dana & Jeanblanc-Picque (1998). Marches financiers en temps continu :valorisation et equilibre. Economica.
– Duffie (2001). Dynamic Asset Pricing Theory. Princeton University Press.– Bingham & Kiesel (2004). Risk neutral valuation. Springer Verlag
• Premium calculation, in insurance.– Buhlmann (1970) Mathematical Methods in Risk Theory. Springer Verlag.– Goovaerts, de Vylder & Haezendonck (1984). Premium Calculation in
Insurance. Springer Verlag.– Denuit & Charpentier (2004). Mathematiques de l’assurance non-vie, tome
1. Economica.
86
Arthur CHARPENTIER - Modeling and covering catastrophes
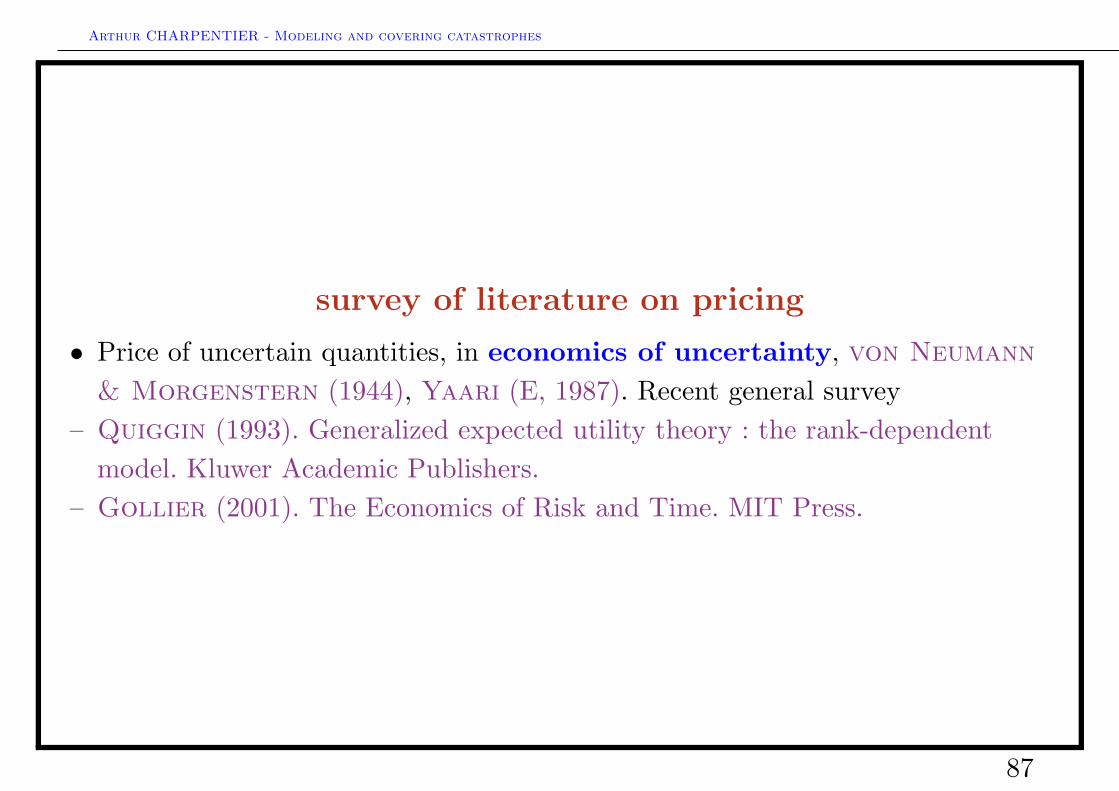
survey of literature on pricing
• Price of uncertain quantities, in economics of uncertainty, von Neumann
& Morgenstern (1944), Yaari (E, 1987). Recent general survey– Quiggin (1993). Generalized expected utility theory : the rank-dependent
model. Kluwer Academic Publishers.– Gollier (2001). The Economics of Risk and Time. MIT Press.
87
Arthur CHARPENTIER - Modeling and covering catastrophes
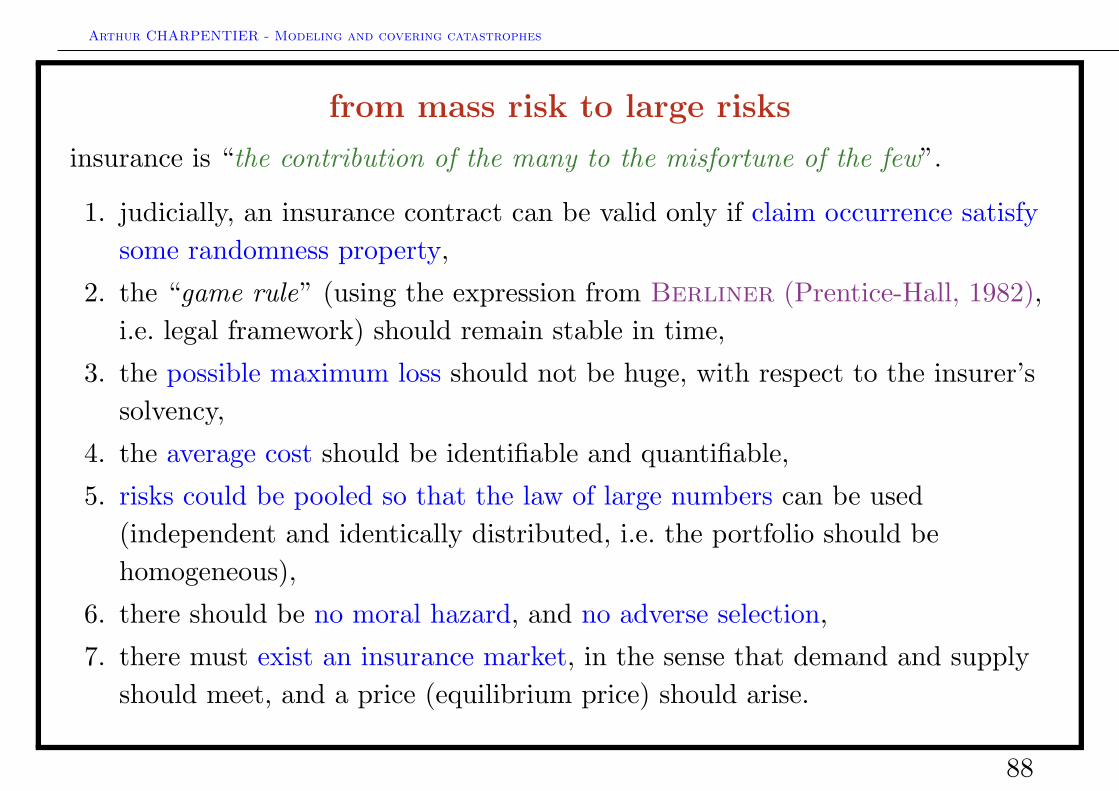
from mass risk to large risks
insurance is “the contribution of the many to the misfortune of the few”.
1. judicially, an insurance contract can be valid only if claim occurrence satisfysome randomness property,
2. the “game rule” (using the expression from Berliner (Prentice-Hall, 1982),i.e. legal framework) should remain stable in time,
3. the possible maximum loss should not be huge, with respect to the insurer’ssolvency,
4. the average cost should be identifiable and quantifiable,
5. risks could be pooled so that the law of large numbers can be used(independent and identically distributed, i.e. the portfolio should behomogeneous),
6. there should be no moral hazard, and no adverse selection,
7. there must exist an insurance market, in the sense that demand and supplyshould meet, and a price (equilibrium price) should arise.
88
Arthur CHARPENTIER - Modeling and covering catastrophes
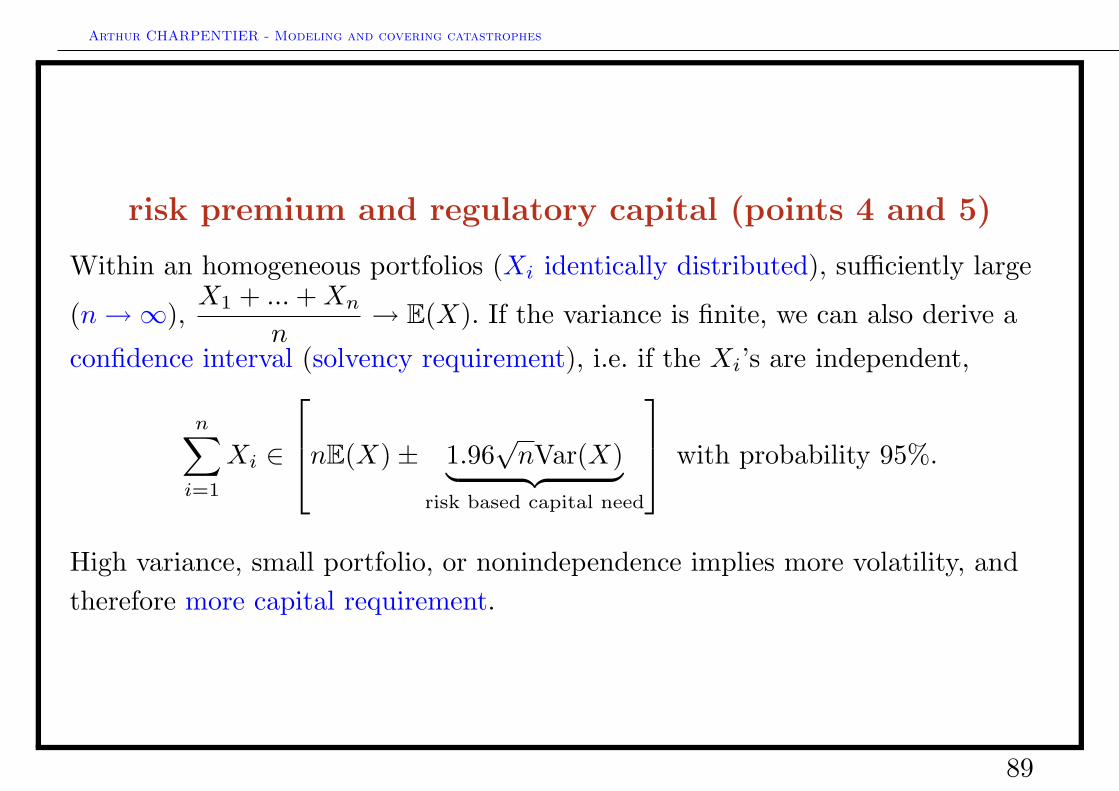
risk premium and regulatory capital (points 4 and 5)
Within an homogeneous portfolios (Xi identically distributed), sufficiently large
(n→∞),X1 + ...+Xn
n→ E(X). If the variance is finite, we can also derive a
confidence interval (solvency requirement), i.e. if the Xi’s are independent,
n∑i=1
Xi ∈
nE(X)± 1.96√nVar(X)︸ ︷︷ ︸
risk based capital need
with probability 95%.
High variance, small portfolio, or nonindependence implies more volatility, andtherefore more capital requirement.
89
Arthur CHARPENTIER - Modeling and covering catastrophes
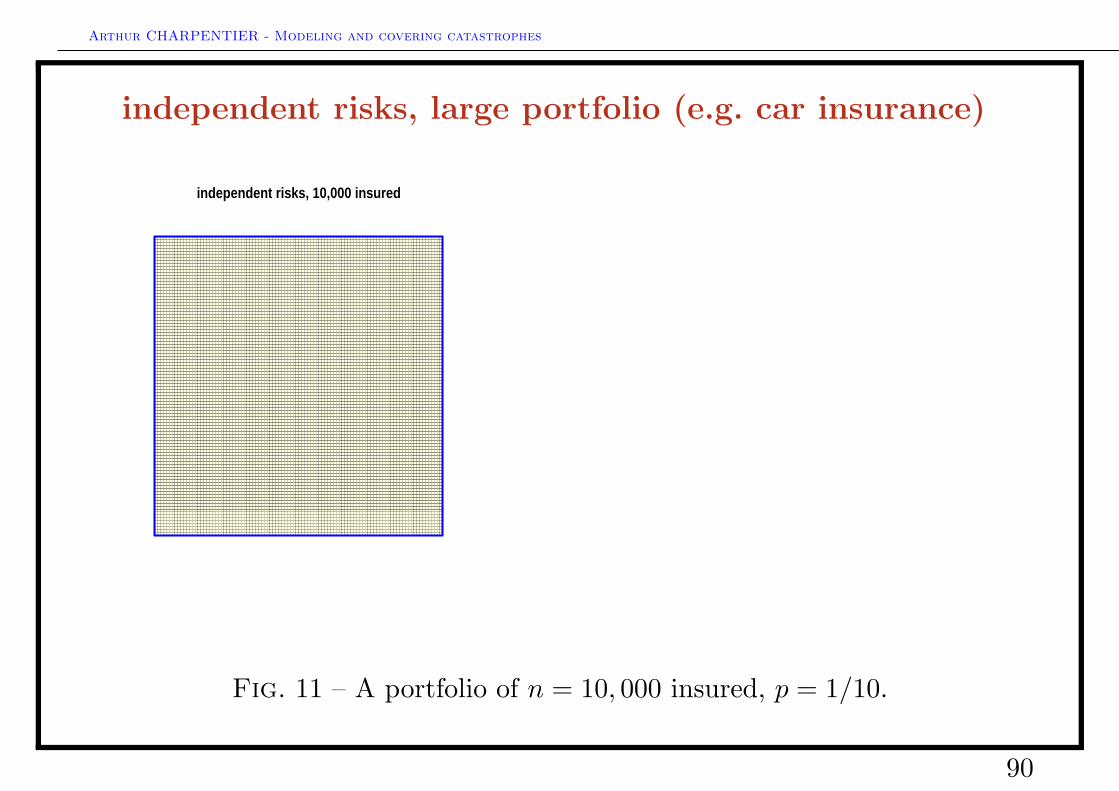
independent risks, large portfolio (e.g. car insurance)
●
●
independent risks, 10,000 insured
●
●
Fig. 11 – A portfolio of n = 10, 000 insured, p = 1/10.
90

Arthur CHARPENTIER - Modeling and covering catastrophes
independent risks, large portfolio (e.g. car insurance)
●
●
independent risks, 10,000 insured, p=1/10
900 950 1000 1050 1100 1150 1200
0.0
00
0.0
02
0.0
04
0.0
06
0.0
08
0.0
10
0.0
12
cas
ind
ép
en
da
nt,
p=
1/1
0,
n=
10
,00
0
distribution de la charge totale, N((np,, np((1 −− p))))
RUIN(1% SCENARIO)
RISK−BASED CAPITALNEED +7% PREMIUM
969
Fig. 12 – A portfolio of n = 10, 000 insured, p = 1/10.
91
Arthur CHARPENTIER - Modeling and covering catastrophes
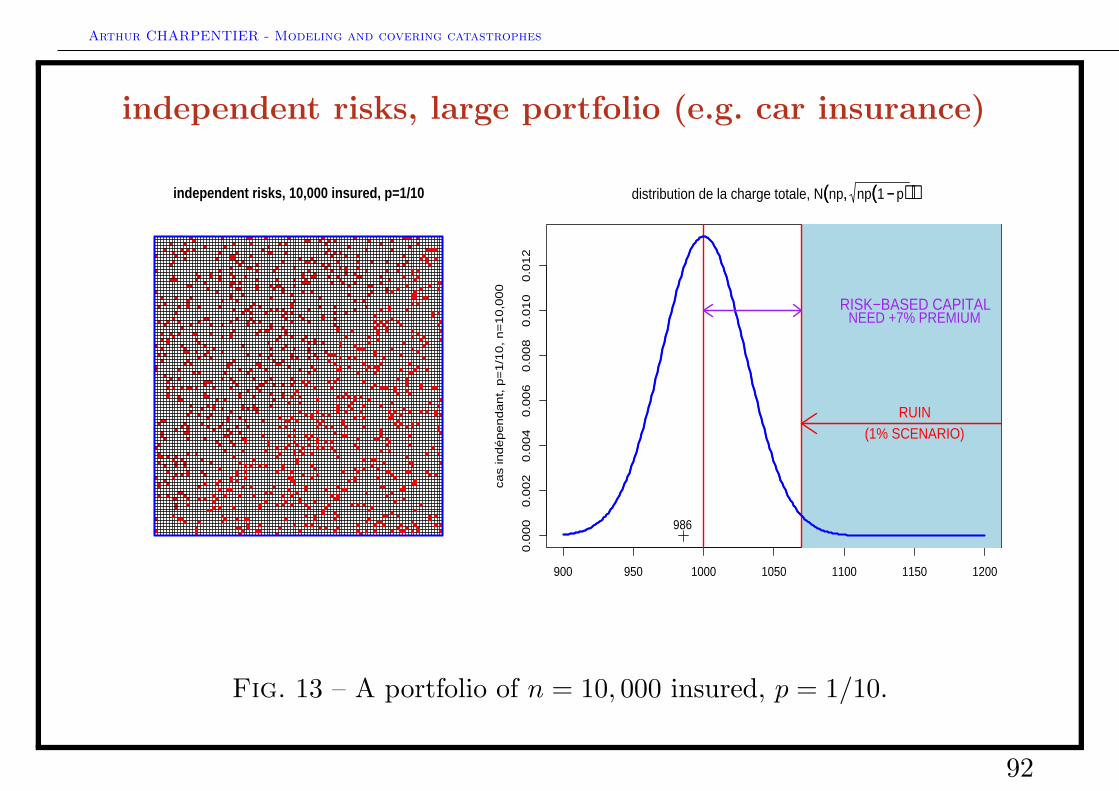
independent risks, large portfolio (e.g. car insurance)
●
●
independent risks, 10,000 insured, p=1/10
900 950 1000 1050 1100 1150 1200
0.0
00
0.0
02
0.0
04
0.0
06
0.0
08
0.0
10
0.0
12
cas
ind
ép
en
da
nt,
p=
1/1
0,
n=
10
,00
0
distribution de la charge totale, N((np,, np((1 −− p))))
RUIN(1% SCENARIO)
RISK−BASED CAPITALNEED +7% PREMIUM
986
Fig. 13 – A portfolio of n = 10, 000 insured, p = 1/10.
92
Arthur CHARPENTIER - Modeling and covering catastrophes
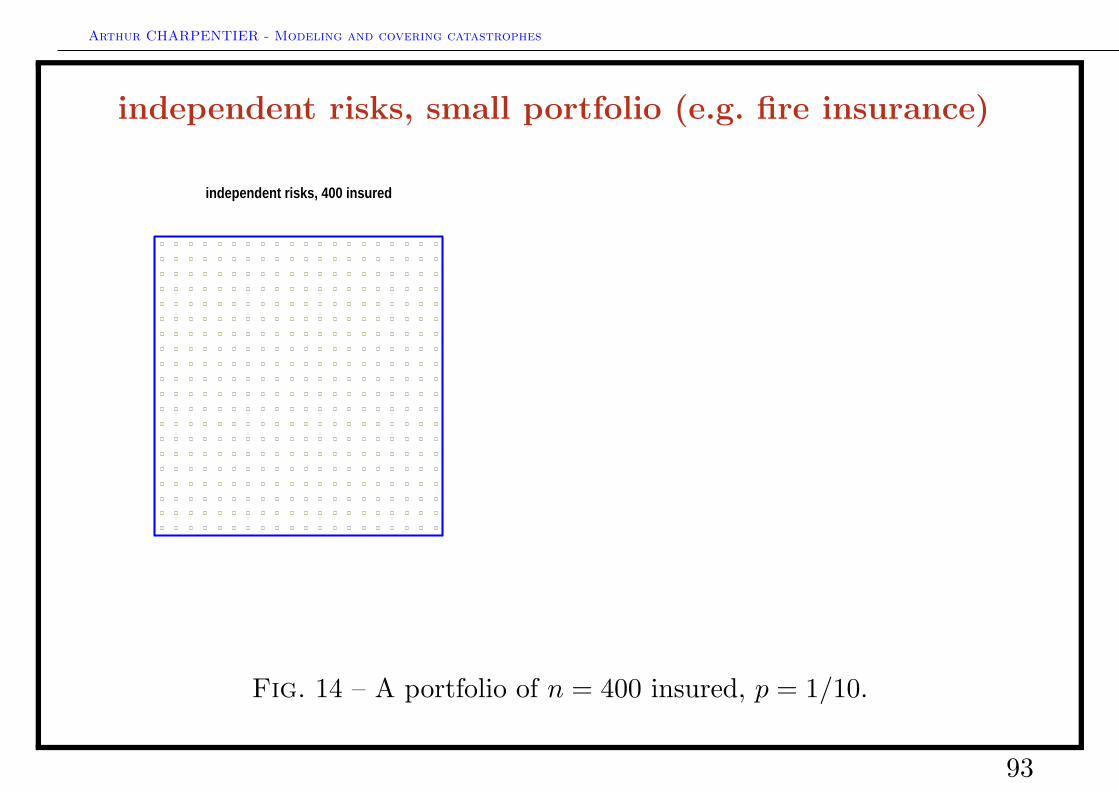
independent risks, small portfolio (e.g. fire insurance)
●
●
independent risks, 400 insured
●
●
Fig. 14 – A portfolio of n = 400 insured, p = 1/10.
93
Arthur CHARPENTIER - Modeling and covering catastrophes
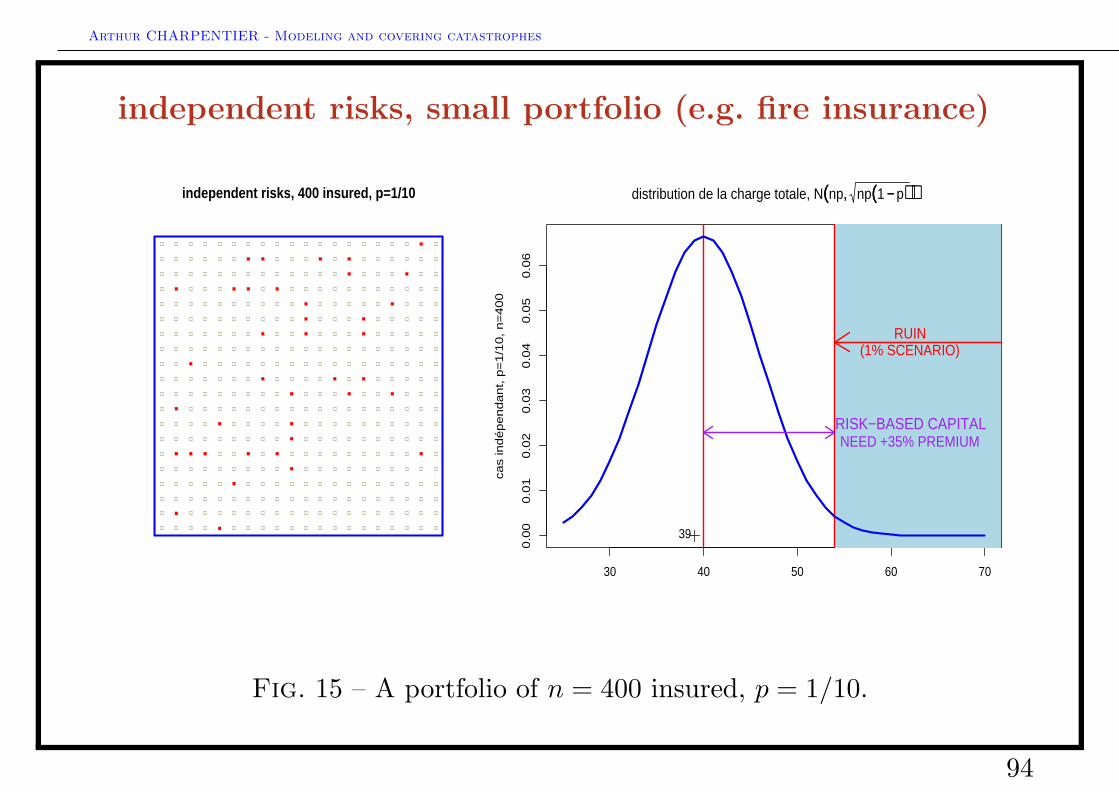
independent risks, small portfolio (e.g. fire insurance)
●
●
independent risks, 400 insured, p=1/10
30 40 50 60 70
0.0
00
.01
0.0
20
.03
0.0
40
.05
0.0
6
cas
ind
ép
en
da
nt,
p=
1/1
0,
n=
40
0
distribution de la charge totale, N((np,, np((1 −− p))))
RUIN(1% SCENARIO)
RISK−BASED CAPITALNEED +35% PREMIUM
39
Fig. 15 – A portfolio of n = 400 insured, p = 1/10.
94
Arthur CHARPENTIER - Modeling and covering catastrophes
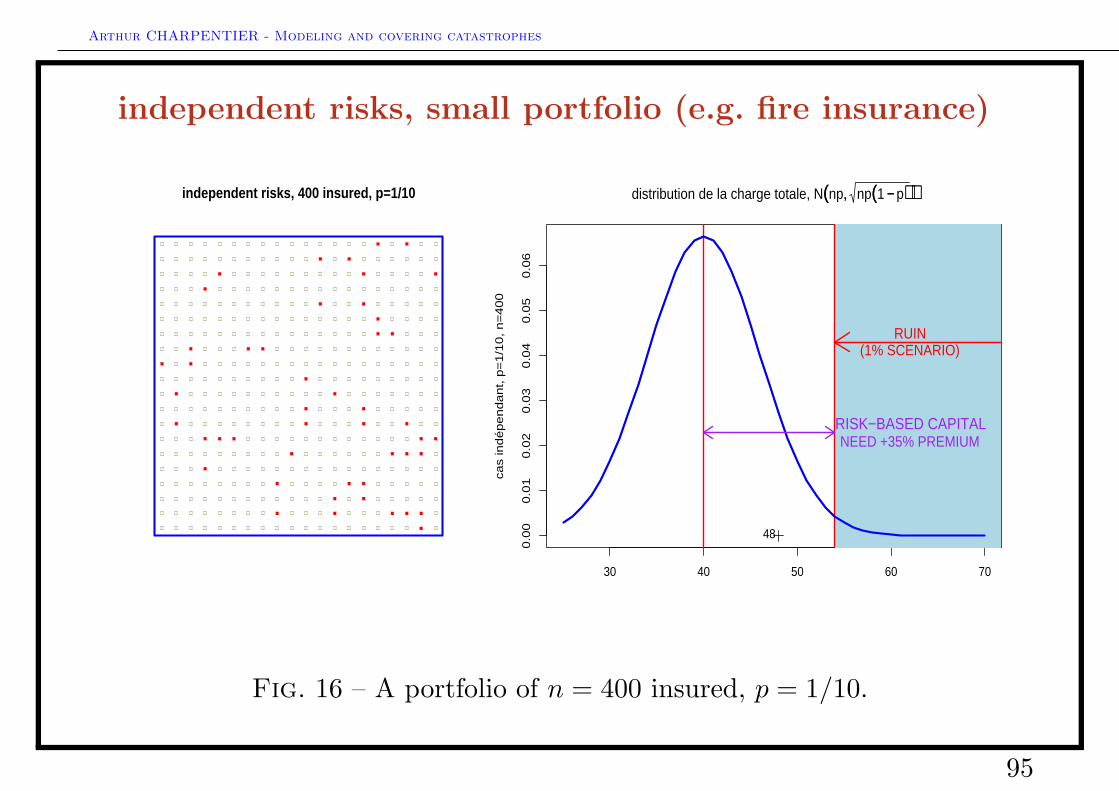
independent risks, small portfolio (e.g. fire insurance)
●
●
independent risks, 400 insured, p=1/10
30 40 50 60 70
0.0
00
.01
0.0
20
.03
0.0
40
.05
0.0
6
cas
ind
ép
en
da
nt,
p=
1/1
0,
n=
40
0
distribution de la charge totale, N((np,, np((1 −− p))))
RUIN(1% SCENARIO)
RISK−BASED CAPITALNEED +35% PREMIUM
48
Fig. 16 – A portfolio of n = 400 insured, p = 1/10.
95
Arthur CHARPENTIER - Modeling and covering catastrophes
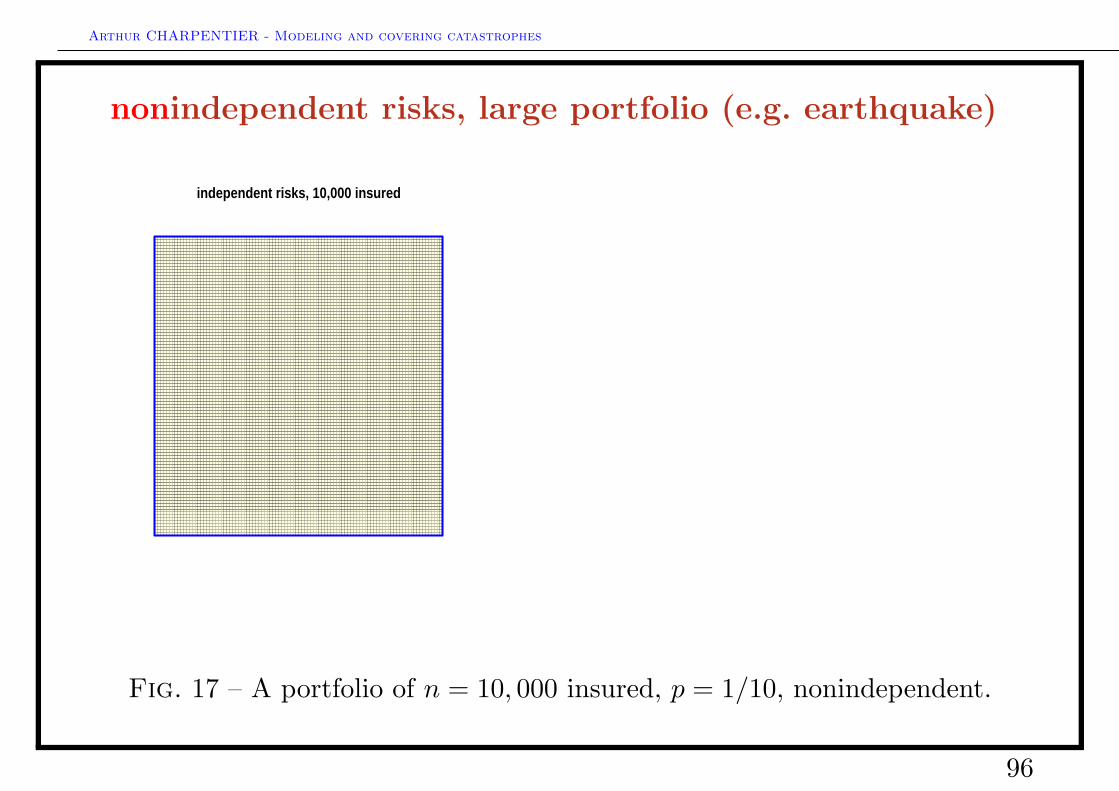
nonindependent risks, large portfolio (e.g. earthquake)
●
●
independent risks, 10,000 insured
●
●
Fig. 17 – A portfolio of n = 10, 000 insured, p = 1/10, nonindependent.
96
Arthur CHARPENTIER - Modeling and covering catastrophes
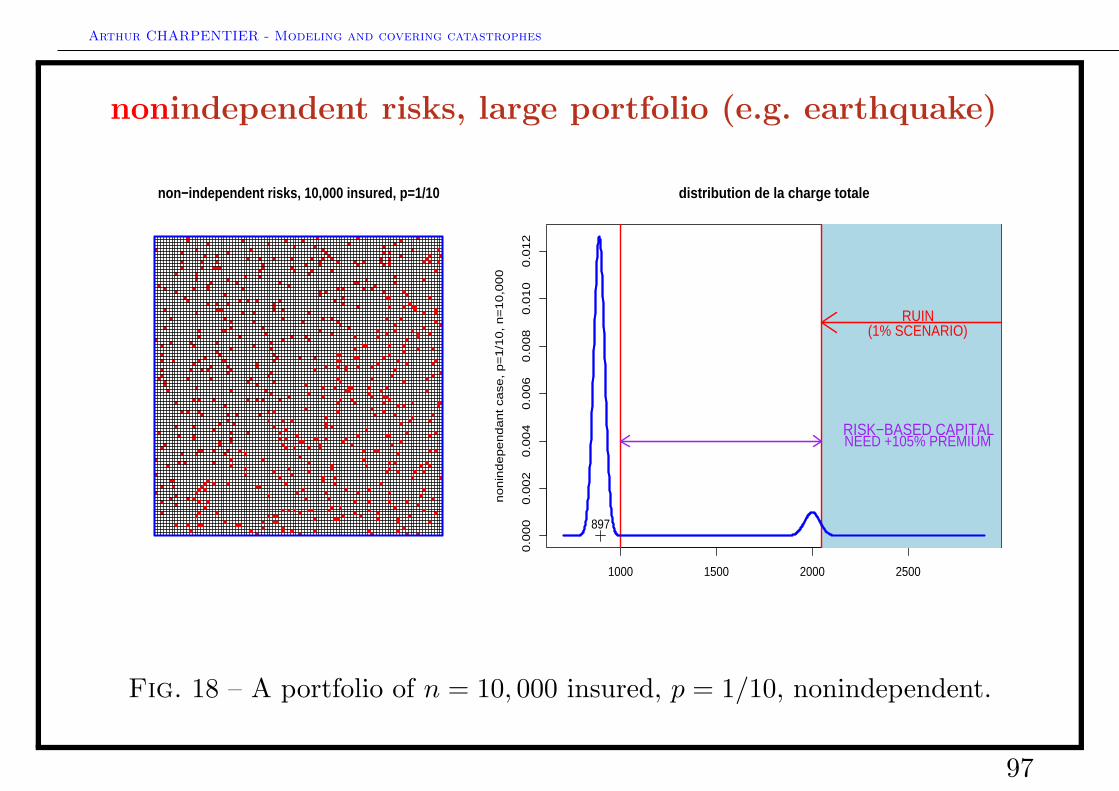
nonindependent risks, large portfolio (e.g. earthquake)
●
●
non−independent risks, 10,000 insured, p=1/10
1000 1500 2000 2500
0.0
00
0.0
02
0.0
04
0.0
06
0.0
08
0.0
10
0.0
12
distribution de la charge totale
no
nin
de
pe
nd
an
t ca
se,
p=
1/1
0,
n=
10
,00
0
RUIN(1% SCENARIO)
RISK−BASED CAPITALNEED +105% PREMIUM
897
Fig. 18 – A portfolio of n = 10, 000 insured, p = 1/10, nonindependent.
97
Arthur CHARPENTIER - Modeling and covering catastrophes
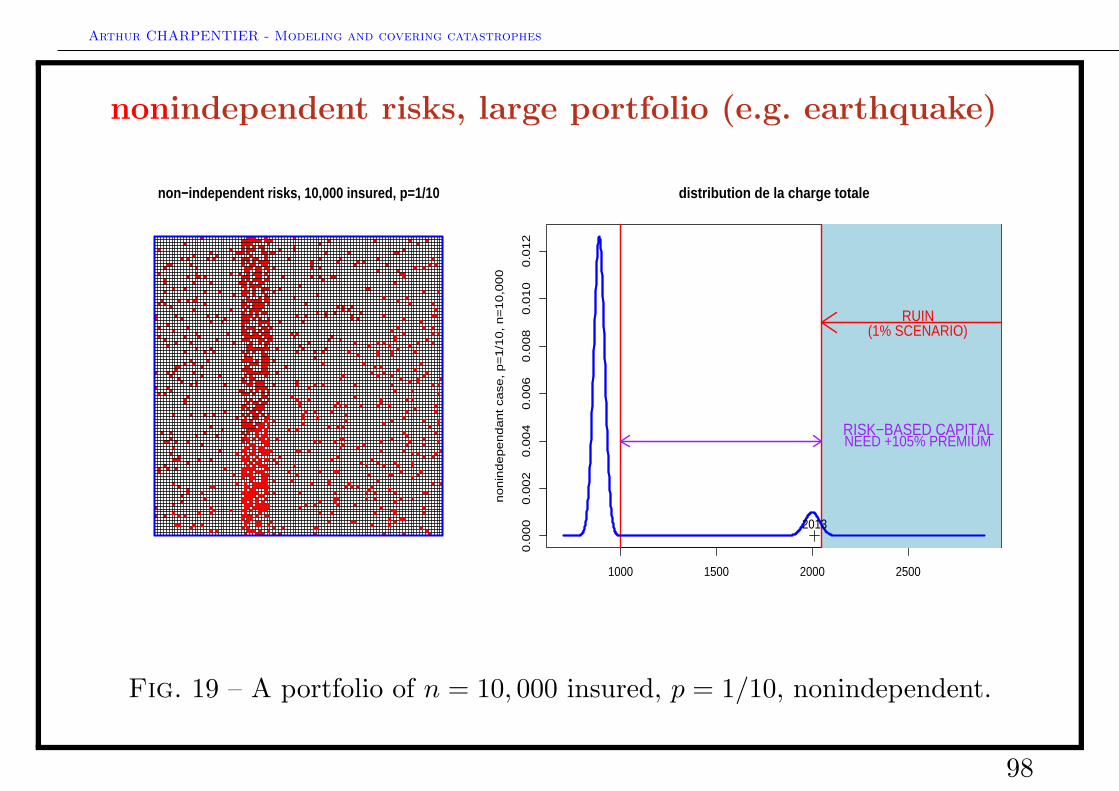
nonindependent risks, large portfolio (e.g. earthquake)
●
●
non−independent risks, 10,000 insured, p=1/10
1000 1500 2000 2500
0.0
00
0.0
02
0.0
04
0.0
06
0.0
08
0.0
10
0.0
12
distribution de la charge totale
no
nin
de
pe
nd
an
t ca
se,
p=
1/1
0,
n=
10
,00
0
RUIN(1% SCENARIO)
RISK−BASED CAPITALNEED +105% PREMIUM
2013
Fig. 19 – A portfolio of n = 10, 000 insured, p = 1/10, nonindependent.
98
Arthur CHARPENTIER - Modeling and covering catastrophes
the pure premium as a technical benchmark
Pascal, Fermat, Condorcet, Huygens, d’Alembert in the XVIIIth centuryproposed to evaluate the “produit scalaire des probabilites et des gains”,
< p,x >=n∑i=1
pixi =n∑i=1
P(X = xi) · xi = EP(X),
based on the “regle des parties”.
For Quetelet, the expected value was, in the context of insurance, the price thatguarantees a financial equilibrium.
From this idea, we consider in insurance the pure premium as EP(X). As inCournot (1843), “l’esperance mathematique est donc le juste prix des chances”(or the “fair price” mentioned in Feller (AS, 1953)).
Problem : Saint Peterburg’s paradox, i.e. infinite mean risks (cf. naturalcatastrophes)
99
Arthur CHARPENTIER - Modeling and covering catastrophes
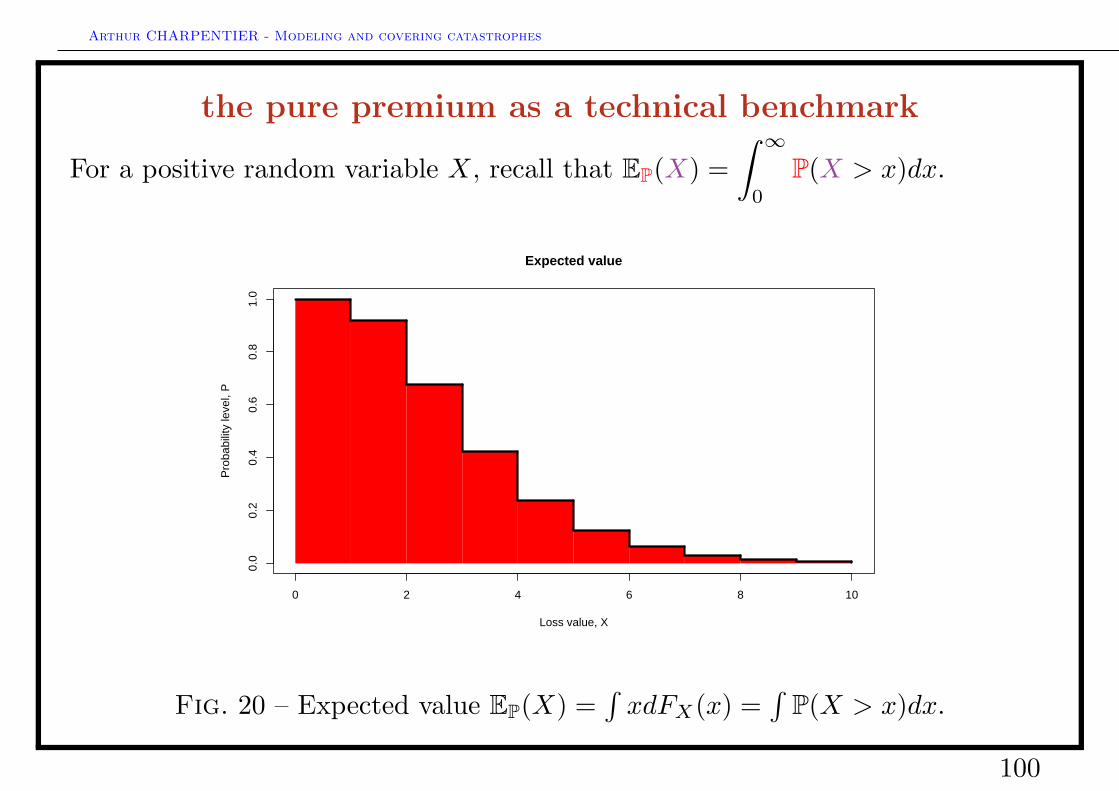
the pure premium as a technical benchmark
For a positive random variable X, recall that EP(X) =∫ ∞
0
P(X > x)dx.
●
●
●
●
●
●
●
●
●
●
●
0 2 4 6 8 10
0.0
0.2
0.4
0.6
0.8
1.0
Expected value
Loss value, X
Pro
babi
lity
leve
l, P
Fig. 20 – Expected value EP(X) =∫xdFX(x) =
∫P(X > x)dx.
100
Arthur CHARPENTIER - Modeling and covering catastrophes
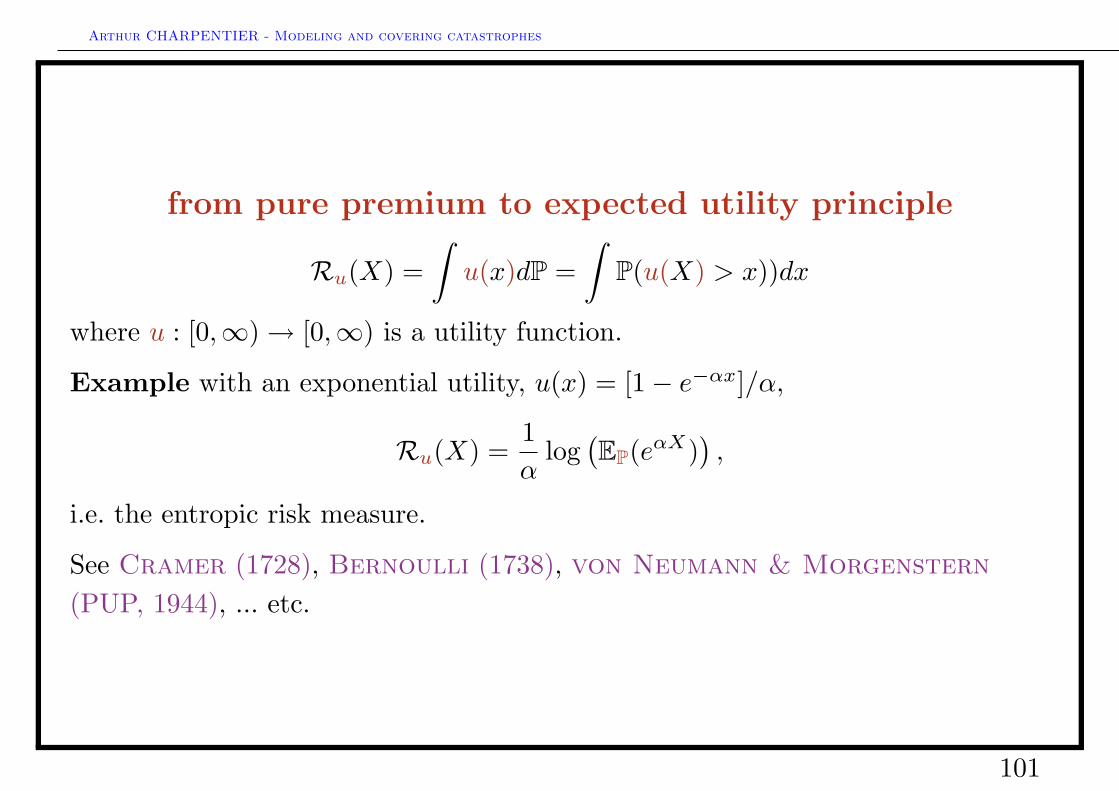
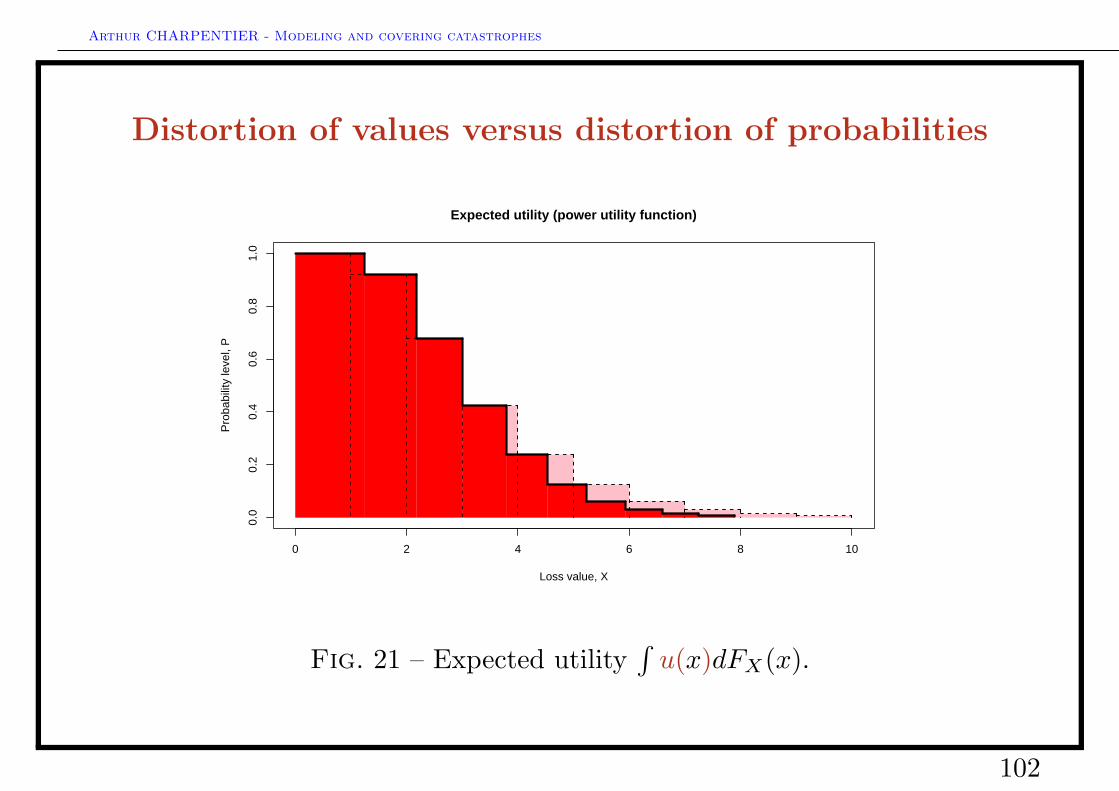
from pure premium to expected utility principle
Ru(X) =∫u(x)dP =
∫P(u(X) > x))dx
where u : [0,∞)→ [0,∞) is a utility function.
Example with an exponential utility, u(x) = [1− e−αx]/α,
Ru(X) =1α
log(EP(eαX)
),
i.e. the entropic risk measure.
See Cramer (1728), Bernoulli (1738), von Neumann & Morgenstern
(PUP, 1944), ... etc.
101
Arthur CHARPENTIER - Modeling and covering catastrophes
Distortion of values versus distortion of probabilities
●
●
●
●
●
●
●
●
●
●
●
0 2 4 6 8 10
0.0
0.2
0.4
0.6
0.8
1.0
Expected utility (power utility function)
Loss value, X
Pro
babi
lity
leve
l, P
Fig. 21 – Expected utility∫u(x)dFX(x).
102
Arthur CHARPENTIER - Modeling and covering catastrophes
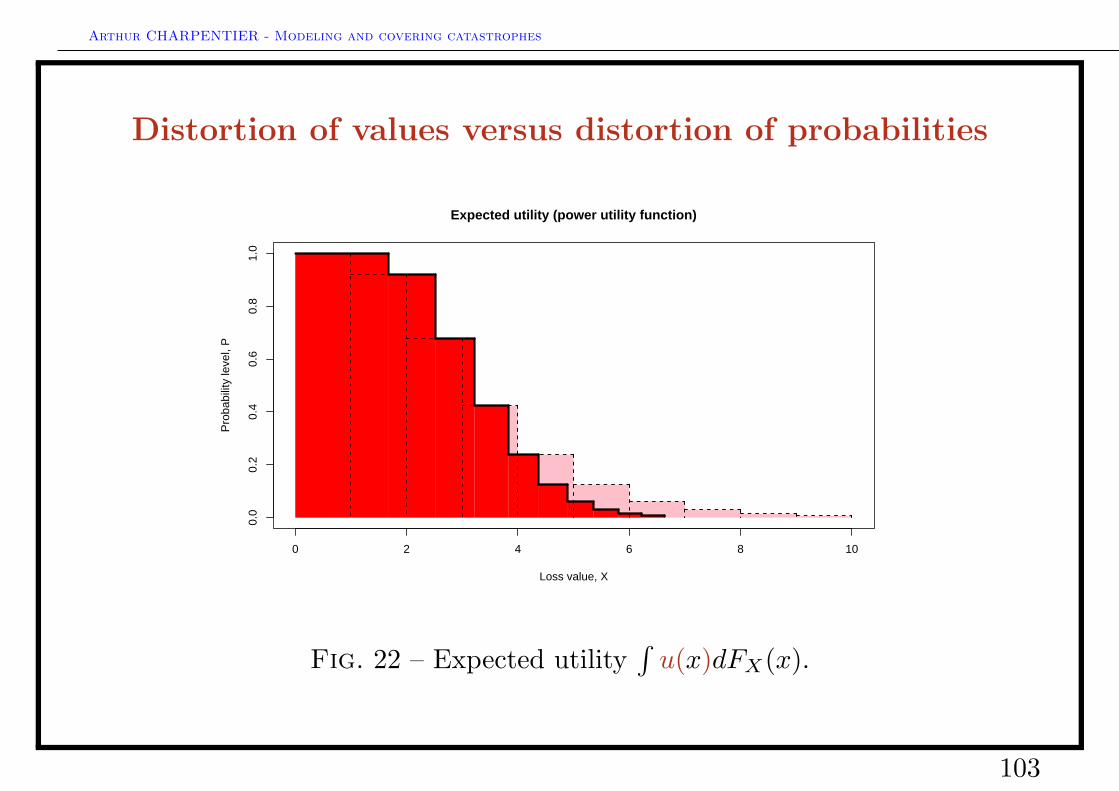
Distortion of values versus distortion of probabilities
●
●
●
●
●
●
●
●
●
●
●
0 2 4 6 8 10
0.0
0.2
0.4
0.6
0.8
1.0
Expected utility (power utility function)
Loss value, X
Pro
babi
lity
leve
l, P
Fig. 22 – Expected utility∫u(x)dFX(x).
103
Arthur CHARPENTIER - Modeling and covering catastrophes
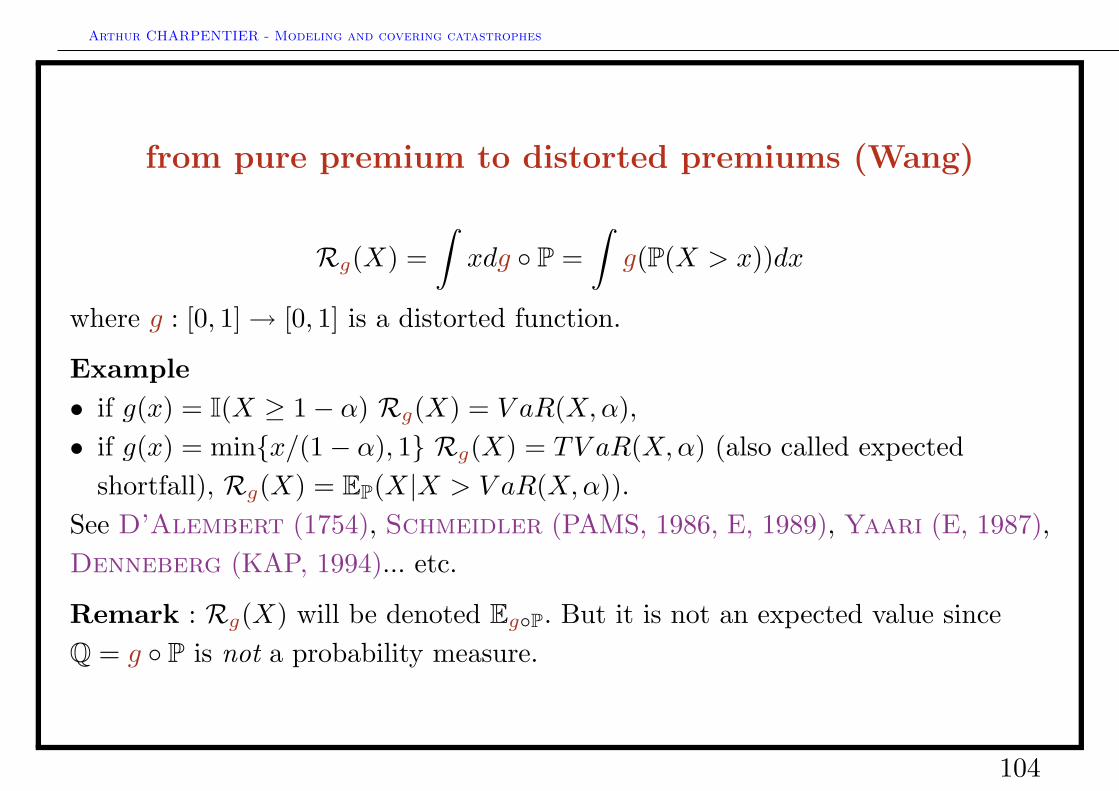
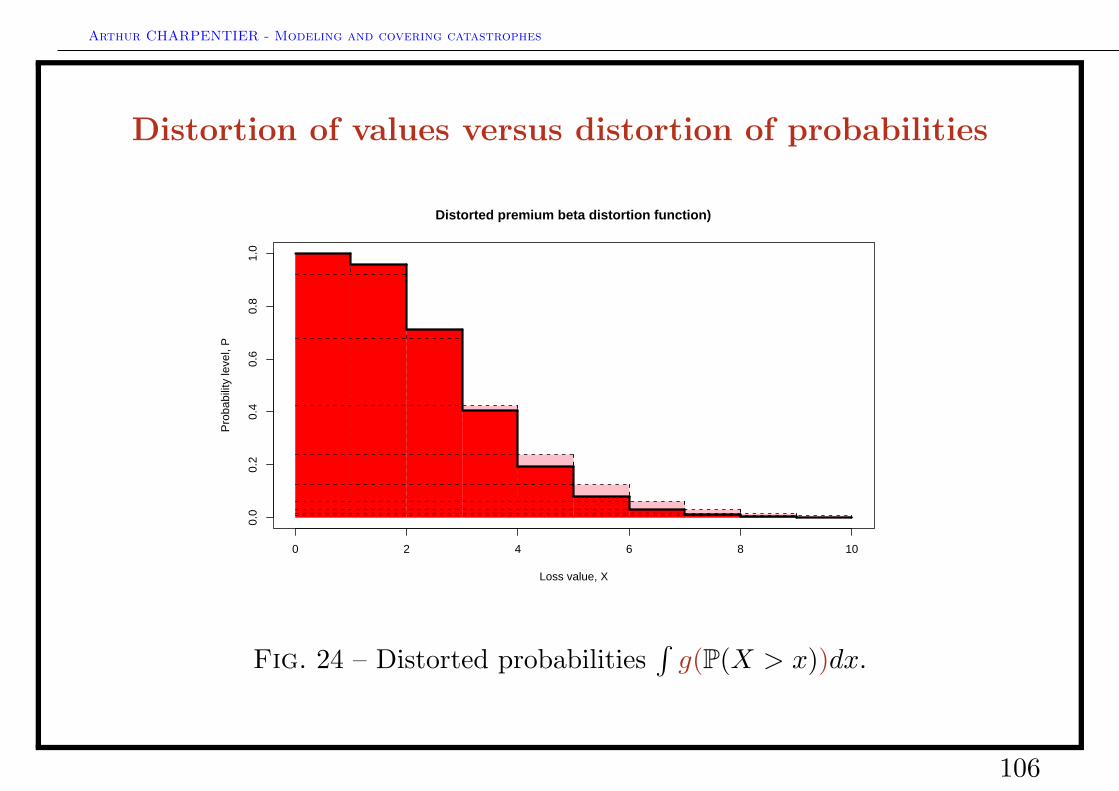
from pure premium to distorted premiums (Wang)
Rg(X) =∫xdg ◦ P =
∫g(P(X > x))dx
where g : [0, 1]→ [0, 1] is a distorted function.
Example• if g(x) = I(X ≥ 1− α) Rg(X) = V aR(X,α),• if g(x) = min{x/(1− α), 1} Rg(X) = TV aR(X,α) (also called expected
shortfall), Rg(X) = EP(X|X > V aR(X,α)).See D’Alembert (1754), Schmeidler (PAMS, 1986, E, 1989), Yaari (E, 1987),Denneberg (KAP, 1994)... etc.
Remark : Rg(X) will be denoted Eg◦P. But it is not an expected value sinceQ = g ◦ P is not a probability measure.
104
Arthur CHARPENTIER - Modeling and covering catastrophes
Distortion of values versus distortion of probabilities
●
●
●
●
●
●
●
●
●
●
●
0 2 4 6 8 10
0.0
0.2
0.4
0.6
0.8
1.0
Distorted premium beta distortion function)
Loss value, X
Pro
babi
lity
leve
l, P
Fig. 23 – Distorted probabilities∫g(P(X > x))dx.
105
Arthur CHARPENTIER - Modeling and covering catastrophes
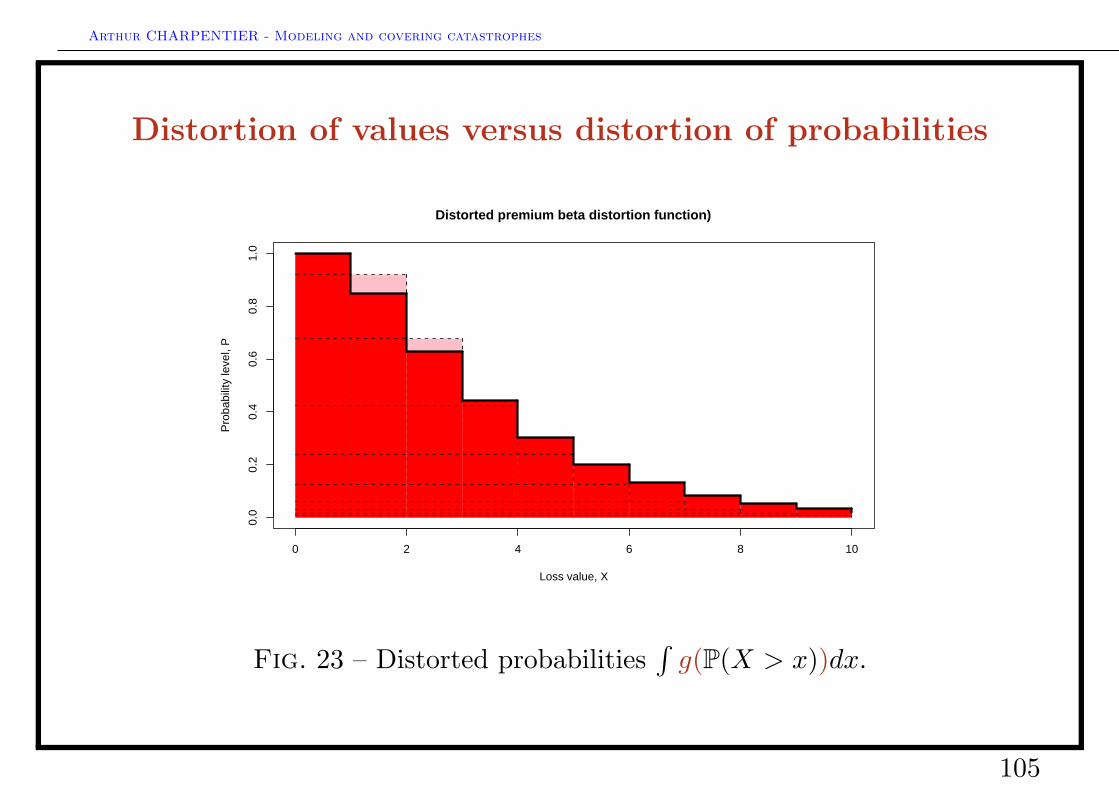
Distortion of values versus distortion of probabilities
●
●
●
●
●
●
●
●
●
●
●
0 2 4 6 8 10
0.0
0.2
0.4
0.6
0.8
1.0
Distorted premium beta distortion function)
Loss value, X
Pro
babi
lity
leve
l, P
Fig. 24 – Distorted probabilities∫g(P(X > x))dx.
106
Arthur CHARPENTIER - Modeling and covering catastrophes
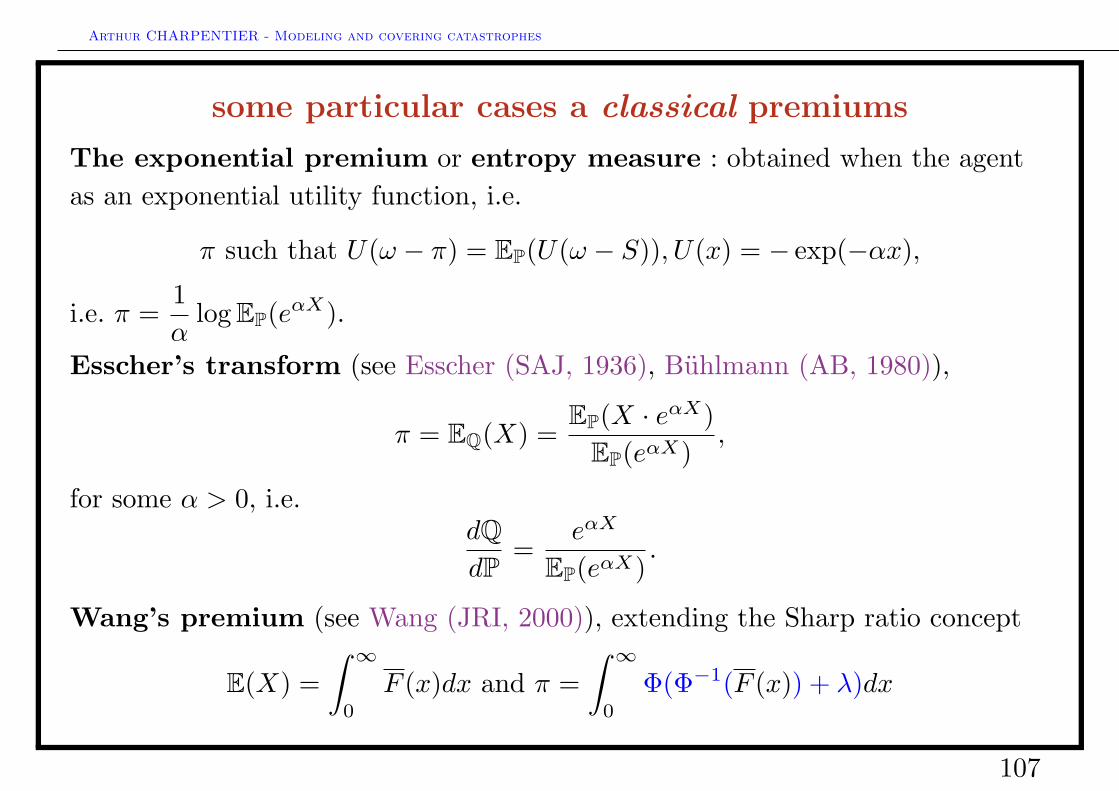
some particular cases a classical premiums
The exponential premium or entropy measure : obtained when the agentas an exponential utility function, i.e.
π such that U(ω − π) = EP(U(ω − S)), U(x) = − exp(−αx),
i.e. π =1α
log EP(eαX).
Esscher’s transform (see Esscher (SAJ, 1936), Buhlmann (AB, 1980)),
π = EQ(X) =EP(X · eαX)
EP(eαX),
for some α > 0, i.e.dQdP
=eαX
EP(eαX).
Wang’s premium (see Wang (JRI, 2000)), extending the Sharp ratio concept
E(X) =∫ ∞
0
F (x)dx and π =∫ ∞
0
Φ(Φ−1(F (x)) + λ)dx
107
Arthur CHARPENTIER - Modeling and covering catastrophes
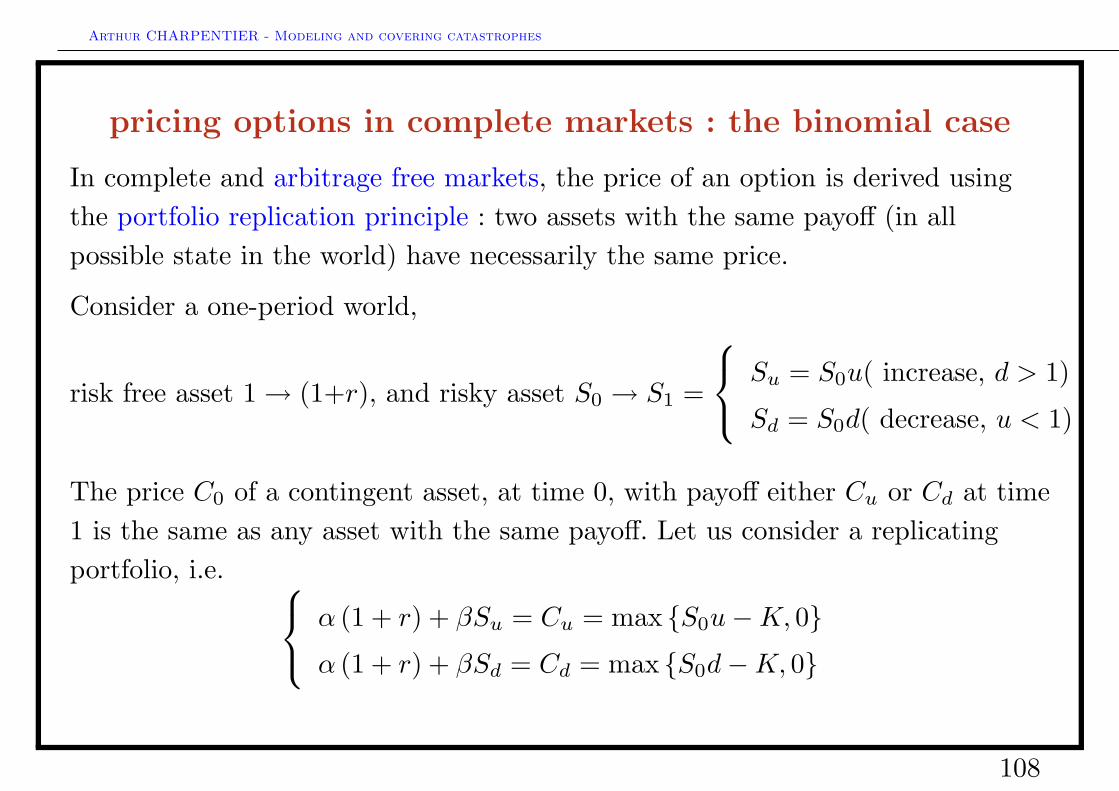
pricing options in complete markets : the binomial case
In complete and arbitrage free markets, the price of an option is derived usingthe portfolio replication principle : two assets with the same payoff (in allpossible state in the world) have necessarily the same price.
Consider a one-period world,
risk free asset 1→ (1+r), and risky asset S0 → S1 =
Su = S0u( increase, d > 1)
Sd = S0d( decrease, u < 1)
The price C0 of a contingent asset, at time 0, with payoff either Cu or Cd at time1 is the same as any asset with the same payoff. Let us consider a replicatingportfolio, i.e. α (1 + r) + βSu = Cu = max {S0u−K, 0}
α (1 + r) + βSd = Cd = max {S0d−K, 0}
108
Arthur CHARPENTIER - Modeling and covering catastrophes
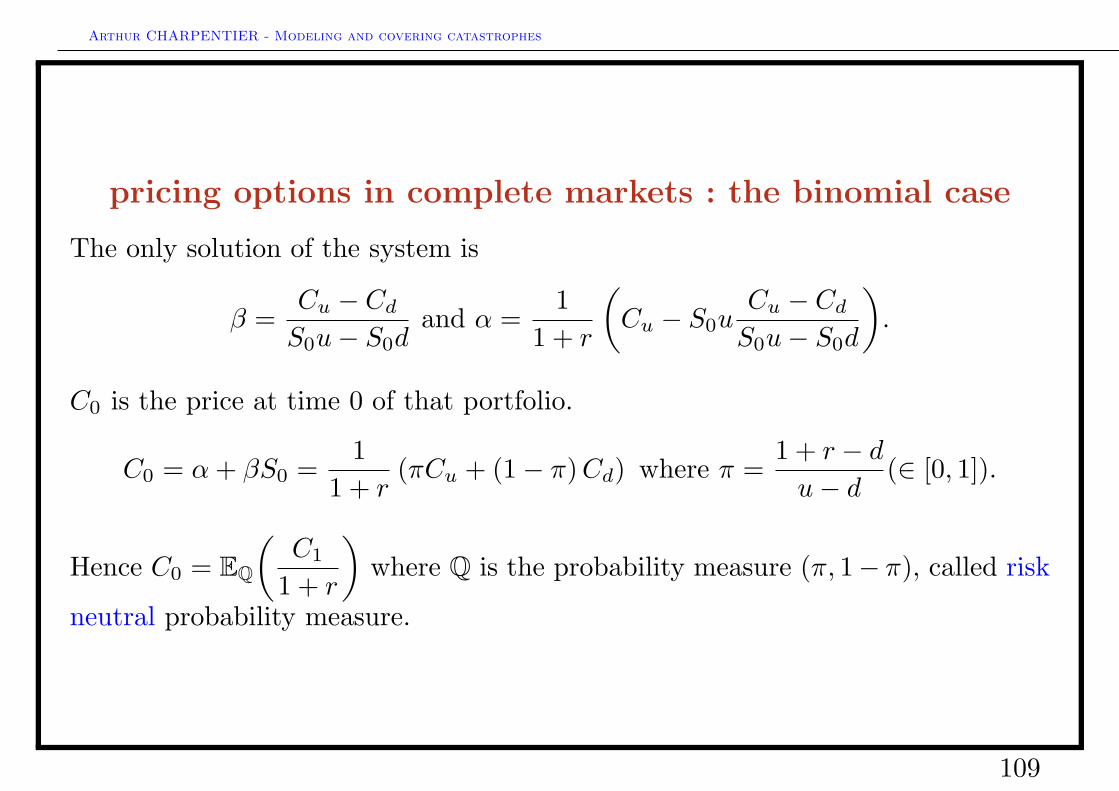
pricing options in complete markets : the binomial case
The only solution of the system is
β =Cu − CdS0u− S0d
and α =1
1 + r
(Cu − S0u
Cu − CdS0u− S0d
).
C0 is the price at time 0 of that portfolio.
C0 = α+ βS0 =1
1 + r(πCu + (1− π)Cd) where π =
1 + r − du− d
(∈ [0, 1]).
Hence C0 = EQ
(C1
1 + r
)where Q is the probability measure (π, 1− π), called risk
neutral probability measure.
109
Arthur CHARPENTIER - Modeling and covering catastrophes
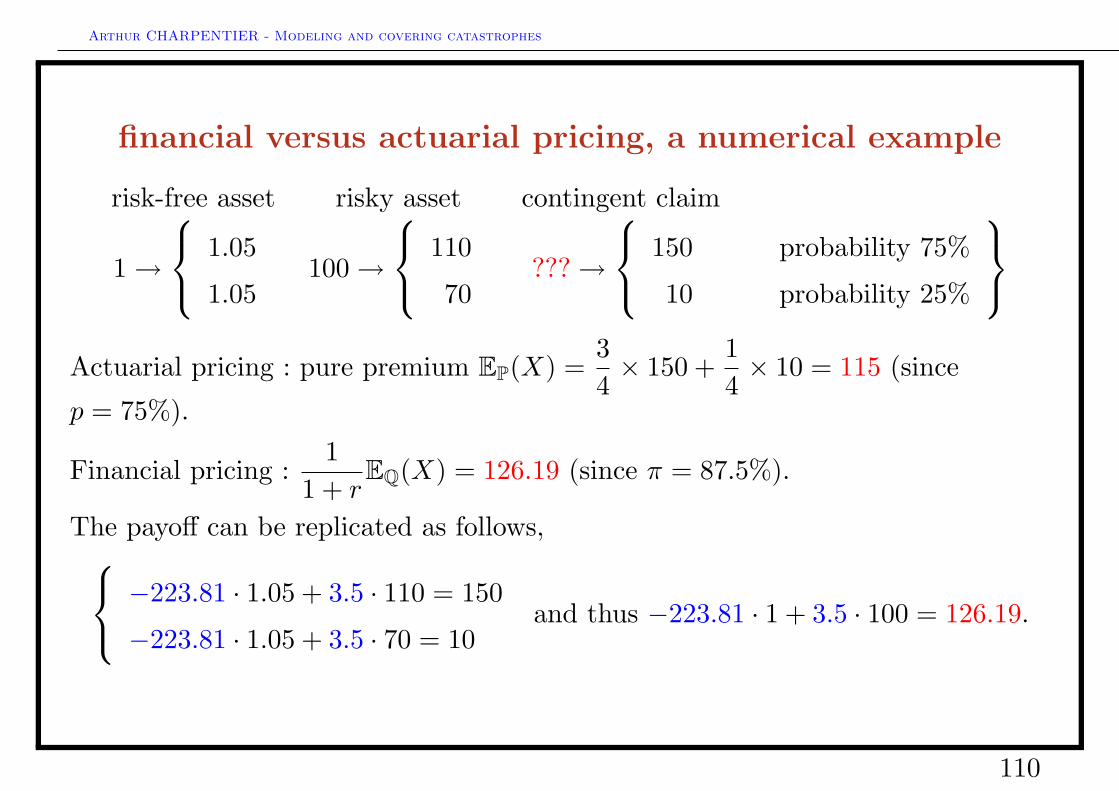
financial versus actuarial pricing, a numerical example
risk-free asset risky asset contingent claim
1→
1.05
1.05100→
110
70???→
150
10
probability 75%
probability 25%
Actuarial pricing : pure premium EP(X) =
34× 150 +
14× 10 = 115 (since
p = 75%).
Financial pricing :1
1 + rEQ(X) = 126.19 (since π = 87.5%).
The payoff can be replicated as follows, −223.81 · 1.05 + 3.5 · 110 = 150
−223.81 · 1.05 + 3.5 · 70 = 10and thus −223.81 · 1 + 3.5 · 100 = 126.19.
110
Arthur CHARPENTIER - Modeling and covering catastrophes
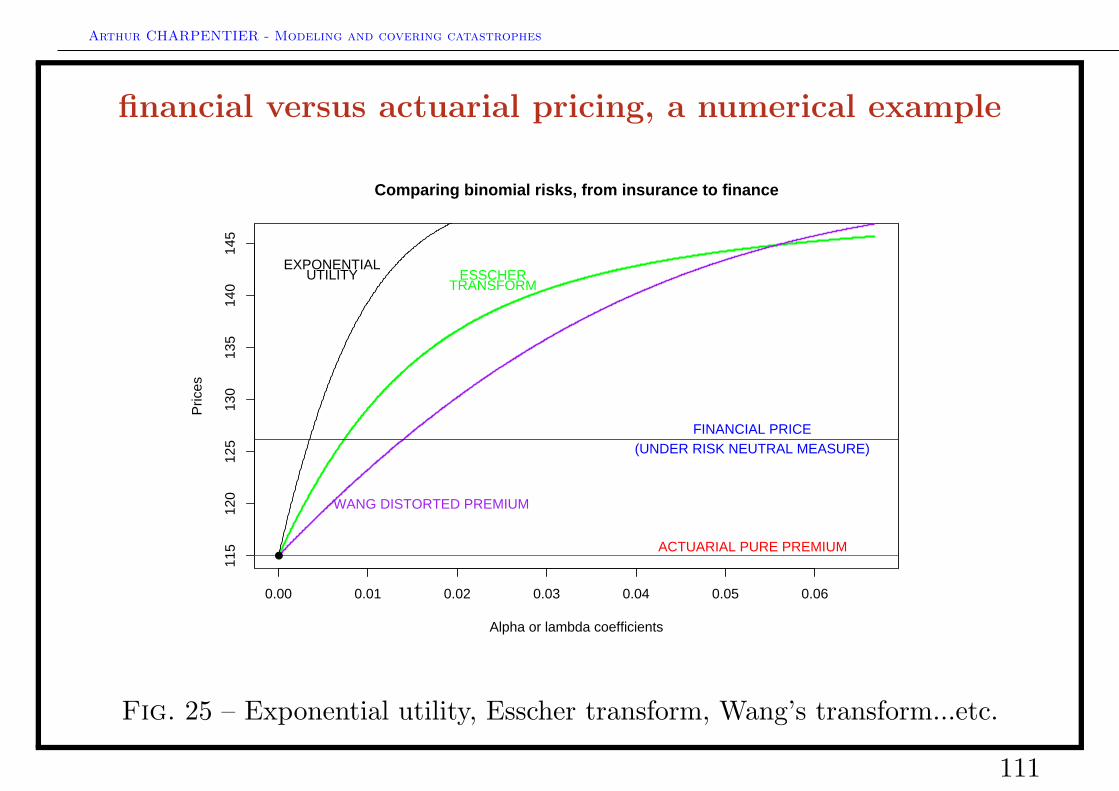
financial versus actuarial pricing, a numerical example
0.00 0.01 0.02 0.03 0.04 0.05 0.06
115
120
125
130
135
140
145
Comparing binomial risks, from insurance to finance
Alpha or lambda coefficients
Pric
es
ACTUARIAL PURE PREMIUM
FINANCIAL PRICE(UNDER RISK NEUTRAL MEASURE)
WANG DISTORTED PREMIUM
ESSCHERTRANSFORM
EXPONENTIALUTILITY
●
Fig. 25 – Exponential utility, Esscher transform, Wang’s transform...etc.
111
Arthur CHARPENTIER - Modeling and covering catastrophes
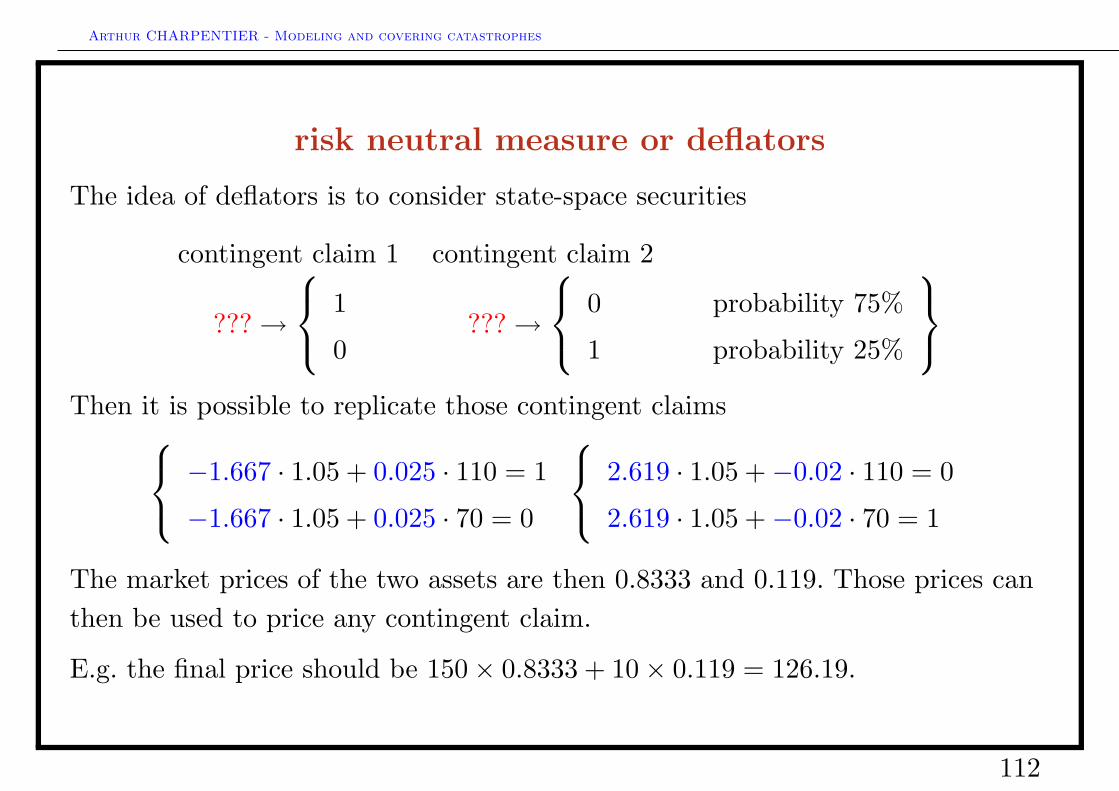
risk neutral measure or deflators
The idea of deflators is to consider state-space securities
contingent claim 1 contingent claim 2
???→
1
0???→
0
1
probability 75%
probability 25%
Then it is possible to replicate those contingent claims −1.667 · 1.05 + 0.025 · 110 = 1
−1.667 · 1.05 + 0.025 · 70 = 0
2.619 · 1.05 +−0.02 · 110 = 0
2.619 · 1.05 +−0.02 · 70 = 1
The market prices of the two assets are then 0.8333 and 0.119. Those prices canthen be used to price any contingent claim.
E.g. the final price should be 150× 0.8333 + 10× 0.119 = 126.19.
112
Arthur CHARPENTIER - Modeling and covering catastrophes
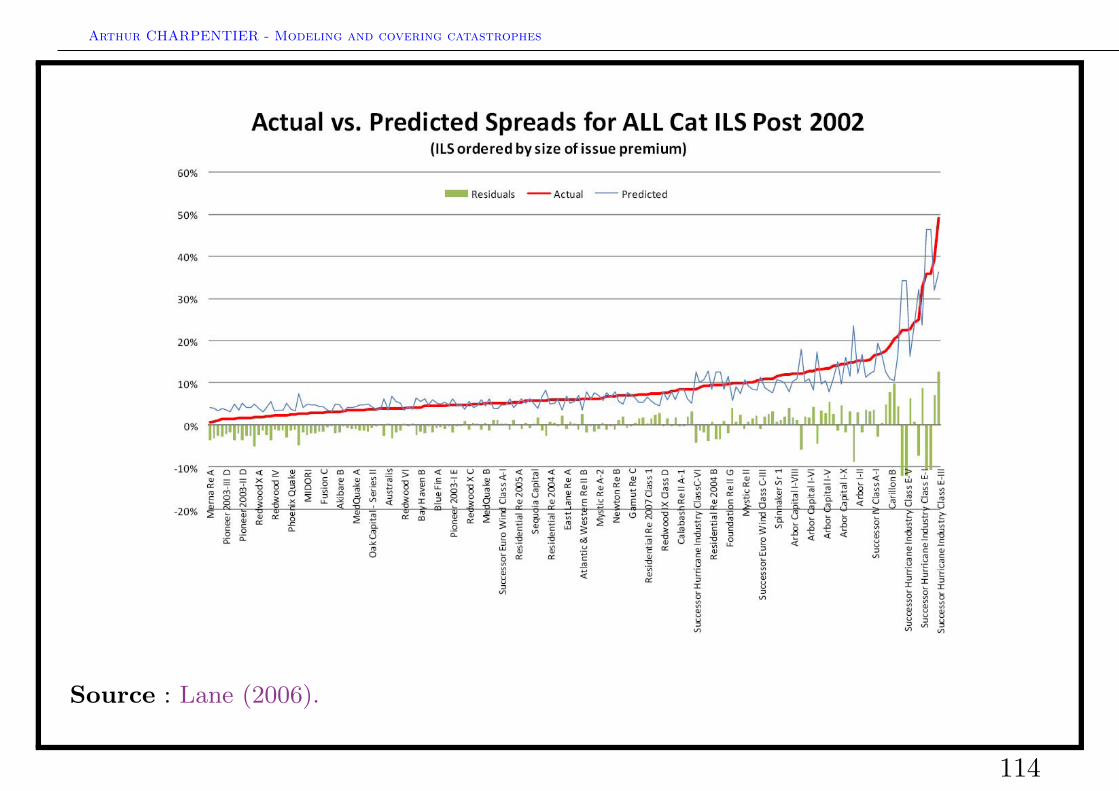
Cat bonds versus (traditional) reinsurance : the price
• A regression model (Lane (2000))
• A regression model (Major & Kreps (2002))
113
Arthur CHARPENTIER - Modeling and covering catastrophes
Source : Lane (2006).
114
Arthur CHARPENTIER - Modeling and covering catastrophes
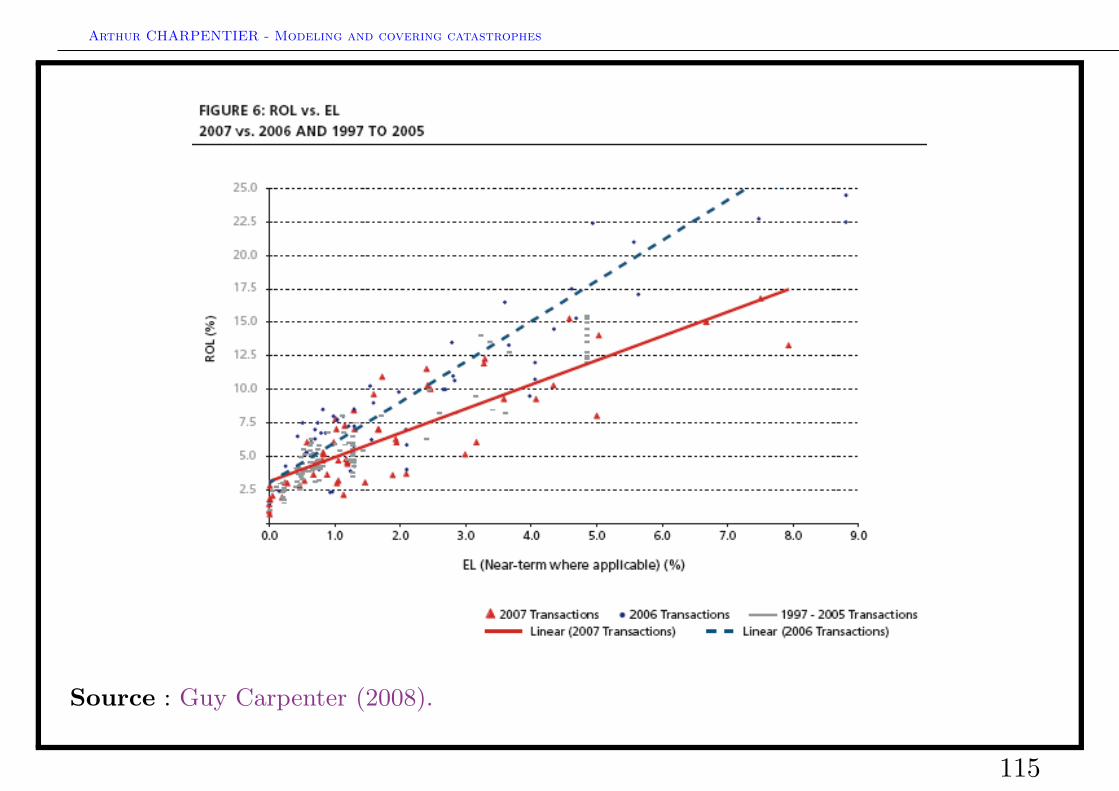
Source : Guy Carpenter (2008).
115
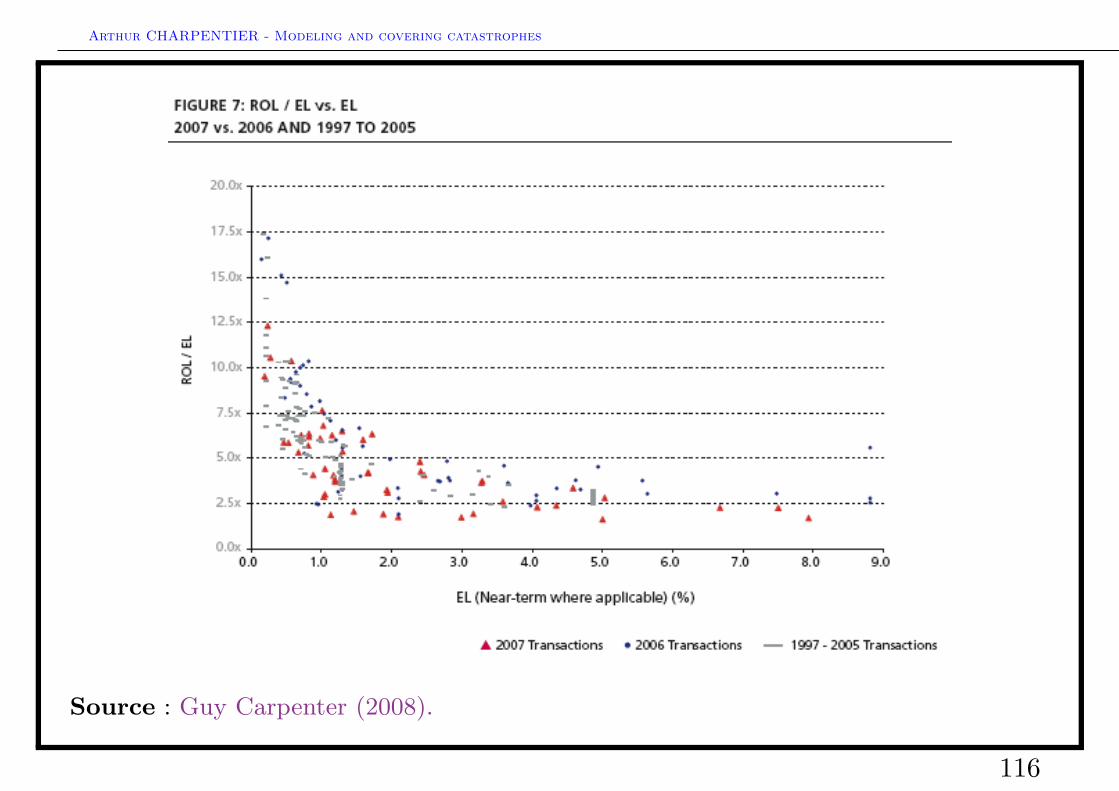
Arthur CHARPENTIER - Modeling and covering catastrophes
Source : Guy Carpenter (2008).
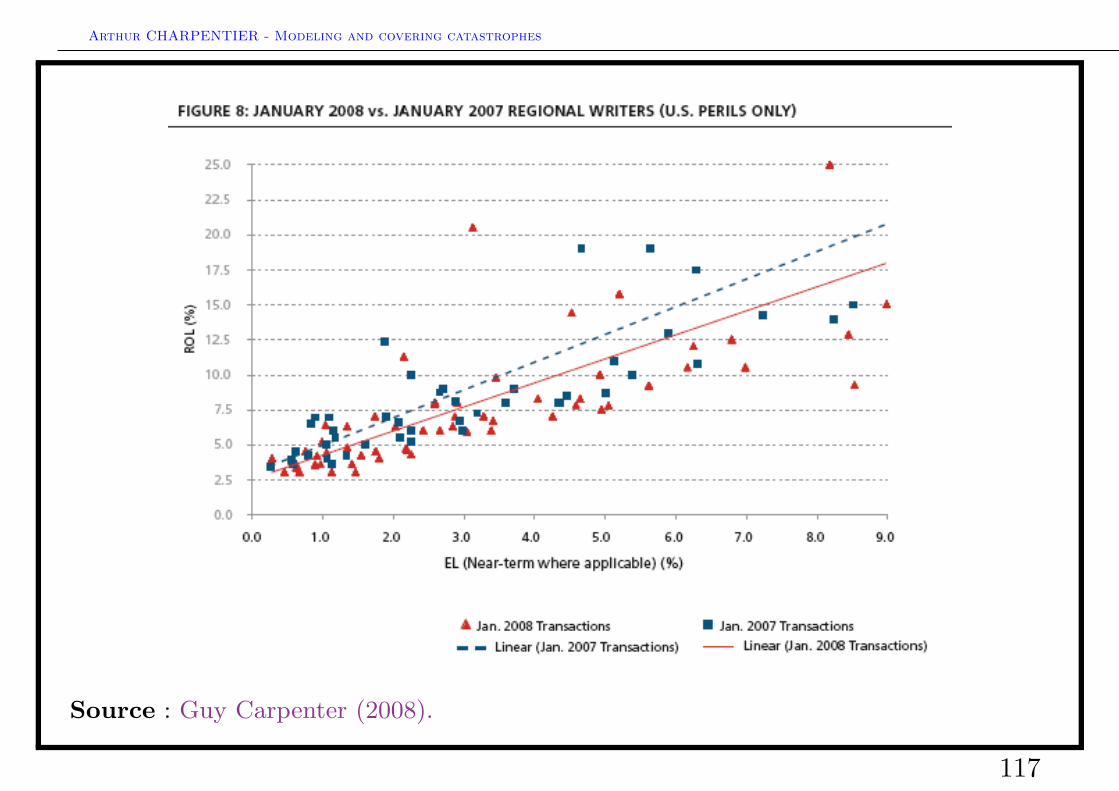
116
Arthur CHARPENTIER - Modeling and covering catastrophes
Source : Guy Carpenter (2008).
117
Arthur CHARPENTIER - Modeling and covering catastrophes
Source : Guy Carpenter (2008).
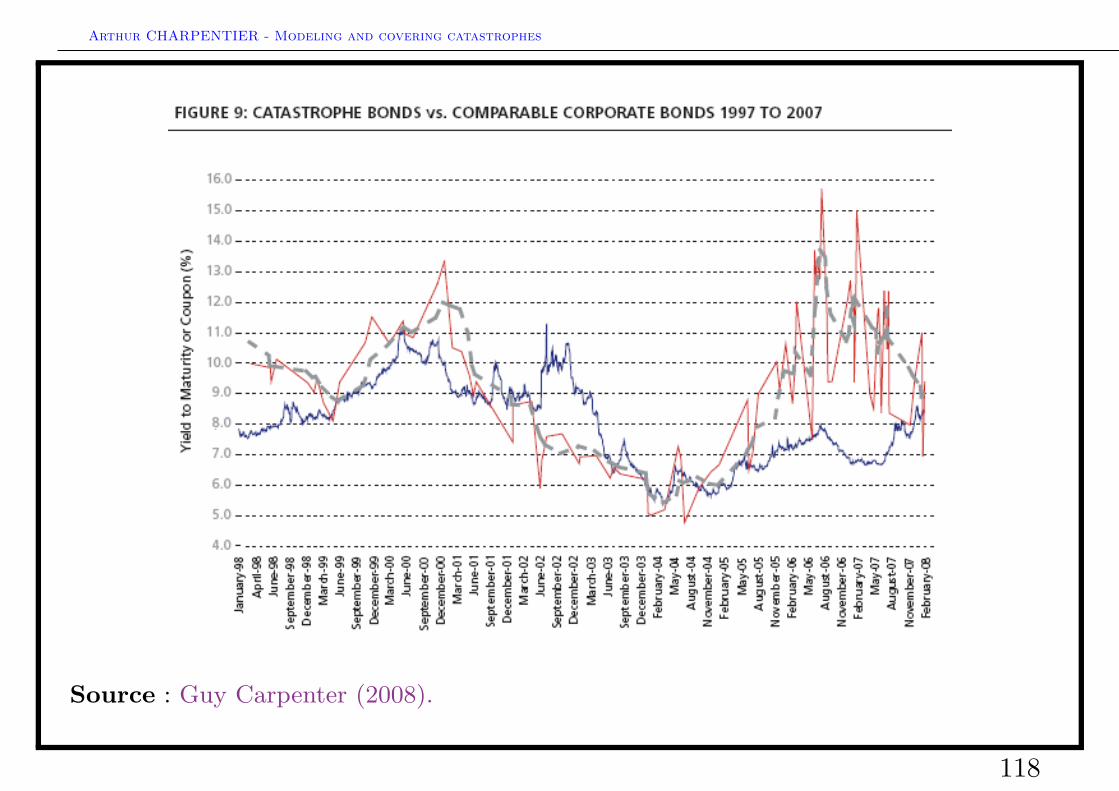
118
Arthur CHARPENTIER - Modeling and covering catastrophes
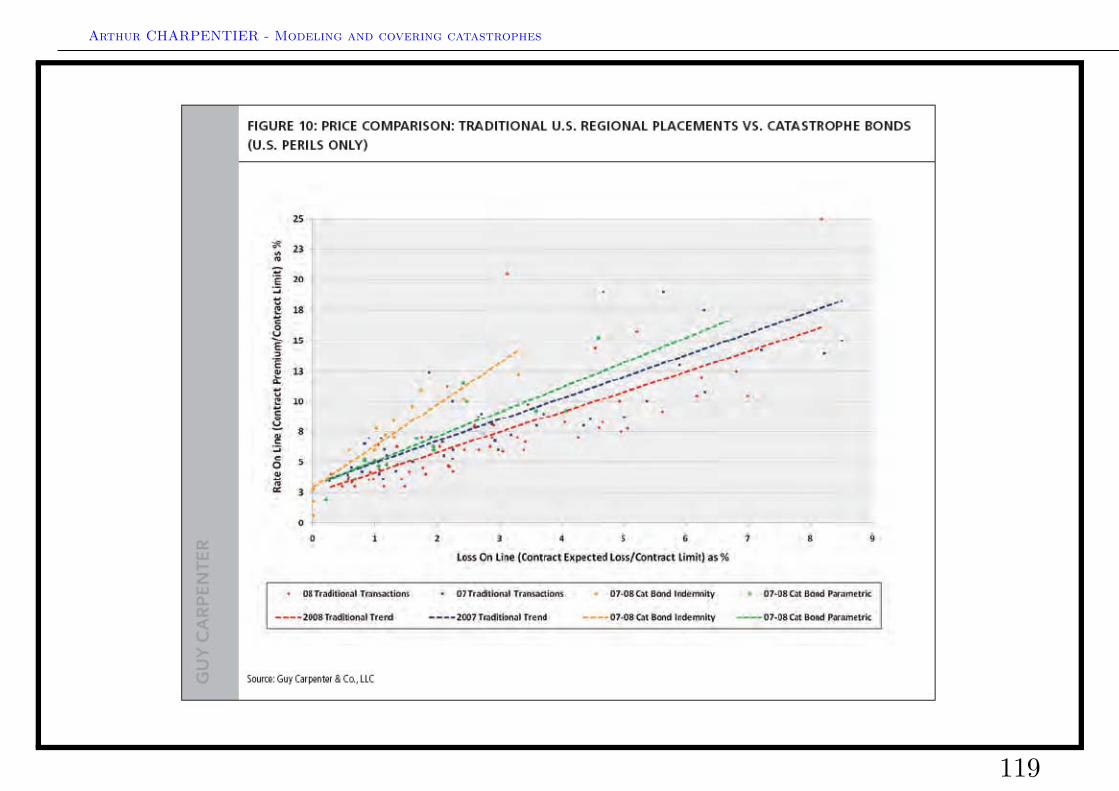
119
Arthur CHARPENTIER - Modeling and covering catastrophes
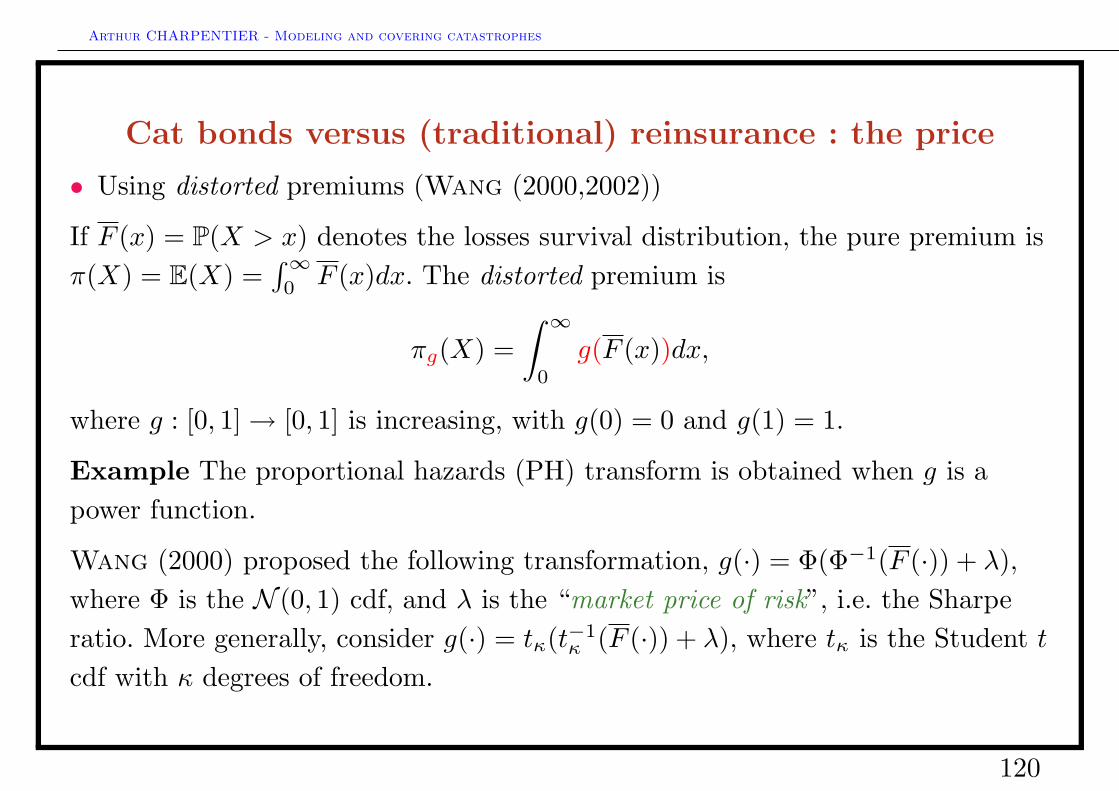
Cat bonds versus (traditional) reinsurance : the price
• Using distorted premiums (Wang (2000,2002))
If F (x) = P(X > x) denotes the losses survival distribution, the pure premium isπ(X) = E(X) =
∫∞0F (x)dx. The distorted premium is
πg(X) =∫ ∞
0
g(F (x))dx,
where g : [0, 1]→ [0, 1] is increasing, with g(0) = 0 and g(1) = 1.
Example The proportional hazards (PH) transform is obtained when g is apower function.
Wang (2000) proposed the following transformation, g(·) = Φ(Φ−1(F (·)) + λ),where Φ is the N (0, 1) cdf, and λ is the “market price of risk”, i.e. the Sharperatio. More generally, consider g(·) = tκ(t−1
κ (F (·)) + λ), where tκ is the Student tcdf with κ degrees of freedom.
120
Arthur CHARPENTIER - Modeling and covering catastrophes
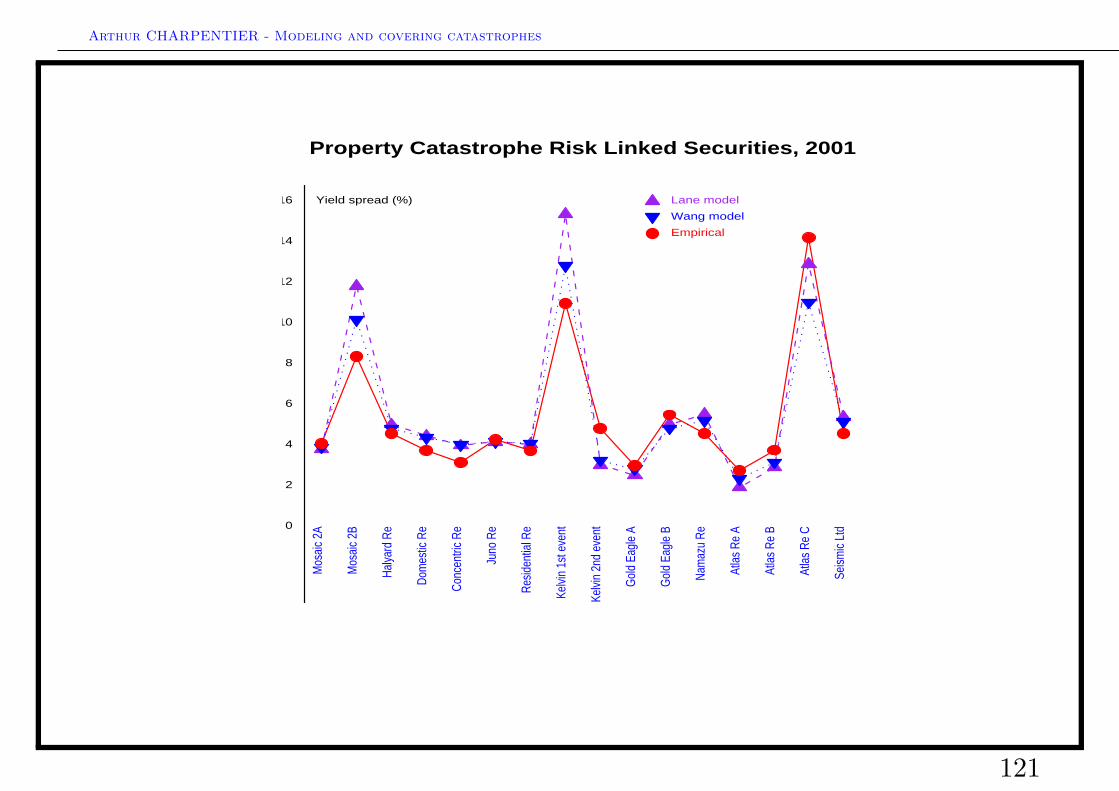
Property Catastrophe Risk Linked Securities, 2001
0
2
4
6
8
10
12
14
16 Yield spread (%)
Mos
aic
2A
Mos
aic
2B
Halya
rd R
e
Dom
estic
Re
Conc
entri
c Re
Juno
Re
Resid
entia
l Re
Kelvi
n 1s
t eve
nt
Kelvi
n 2n
d ev
ent
Gol
d Ea
gle
A
Gol
d Ea
gle
B
Nam
azu
Re
Atla
s Re
A
Atla
s Re
B
Atla
s Re
C
Seism
ic Lt
d
Lane model
Wang model
Empirical
121
Arthur CHARPENTIER - Modeling and covering catastrophes
Who might buy cat bonds ?
In 2004,• 40% of the total amount has been bought by mutual funds,• 33% of the total amount has been bought by cat funds,• 15% of the total amount has been bought by hedge funds.Opportunity to diversify asset management (theoretical low correlation withother asset classes), opportunity to gain Sharpe ratios through cat bonds excessspread.
122
Arthur CHARPENTIER - Modeling and covering catastrophes
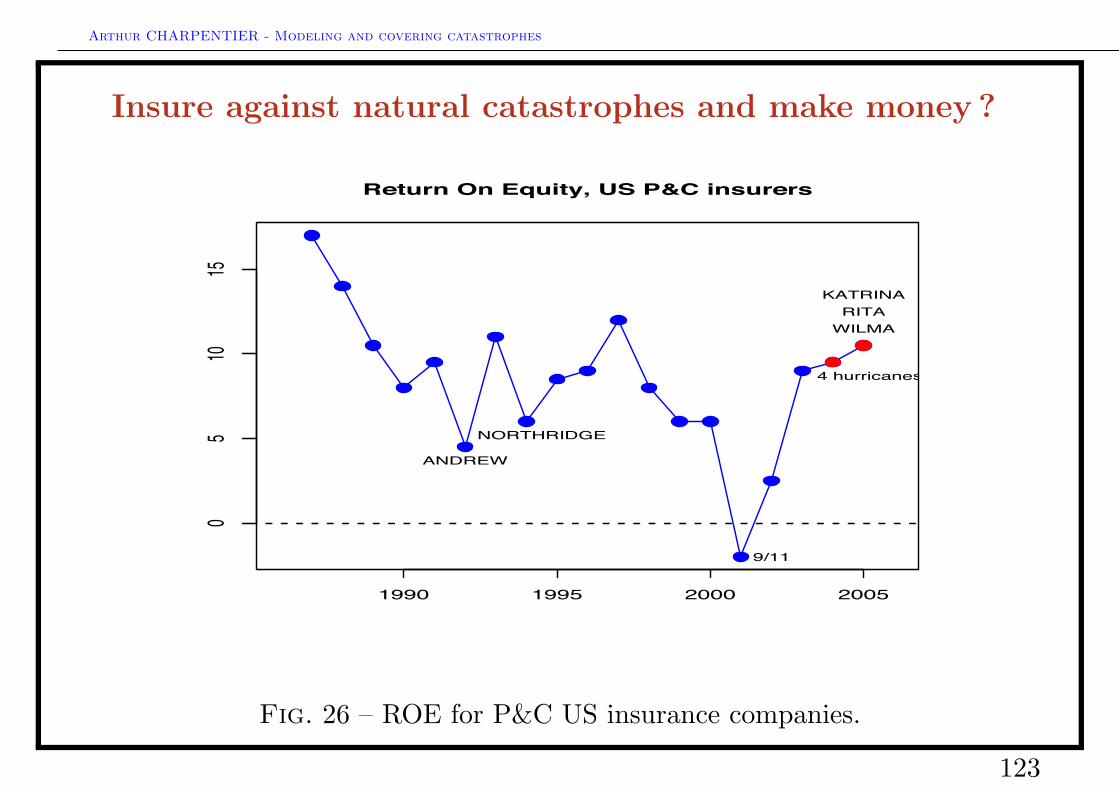
Insure against natural catastrophes and make money ?
1990 1995 2000 2005
05
1015
Return On Equity, US P&C insurers
ANDREW
NORTHRIDGE
9/11
4 hurricanes
KATRINARITA
WILMA
Fig. 26 – ROE for P&C US insurance companies.
123
Arthur CHARPENTIER - Modeling and covering catastrophes
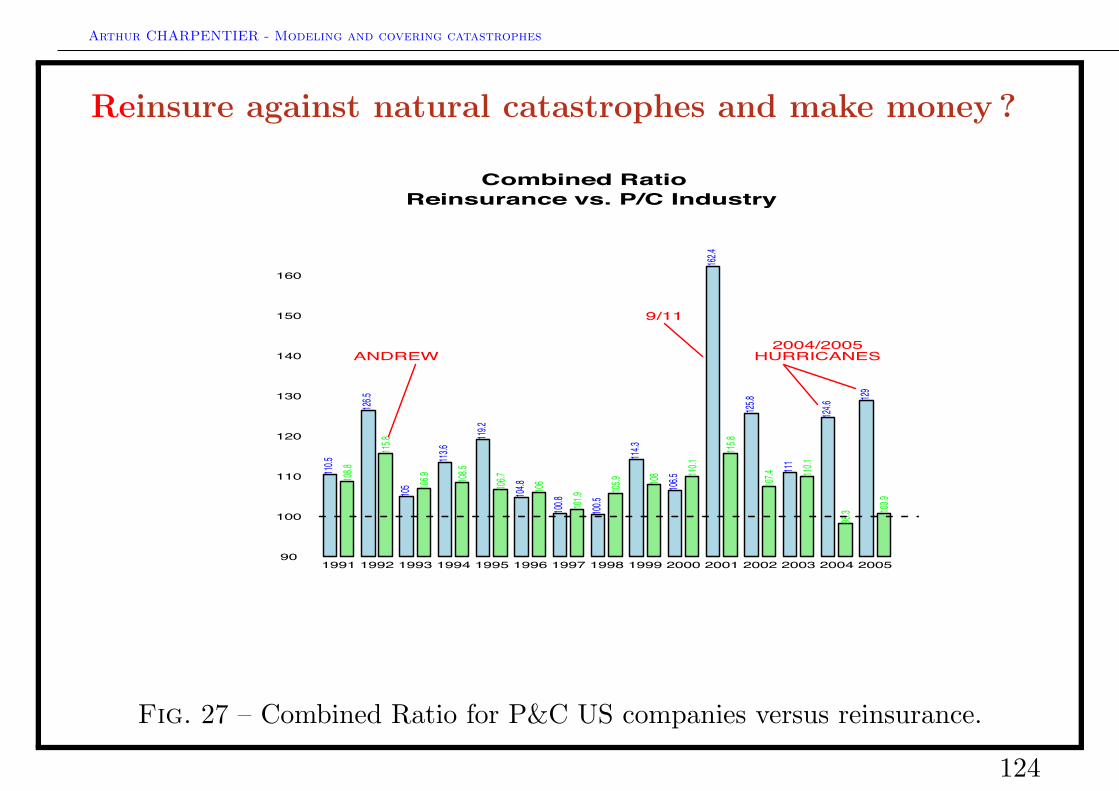
Reinsure against natural catastrophes and make money ?
Combined Ratio Reinsurance vs. P/C Industry
110.5
108.8
1991
126.5
115.8
1992
105 106.9
1993
113.6
108.5
1994
119.2
106.7
1995
104.8 106
1996100
.8 101.9
1997
100.5
105.9
1998
114.3
108
1999
106.5 110
.1
2000
162.4
115.8
2001
125.8
107.4
2002
111 110.1
2003
124.6
98.3
2004
129100
.9
200590
100
110
120
130
140
150
160
ANDREW
9/11
2004/2005HURRICANES
Fig. 27 – Combined Ratio for P&C US companies versus reinsurance.
124
Arthur CHARPENTIER - Modeling and covering catastrophes
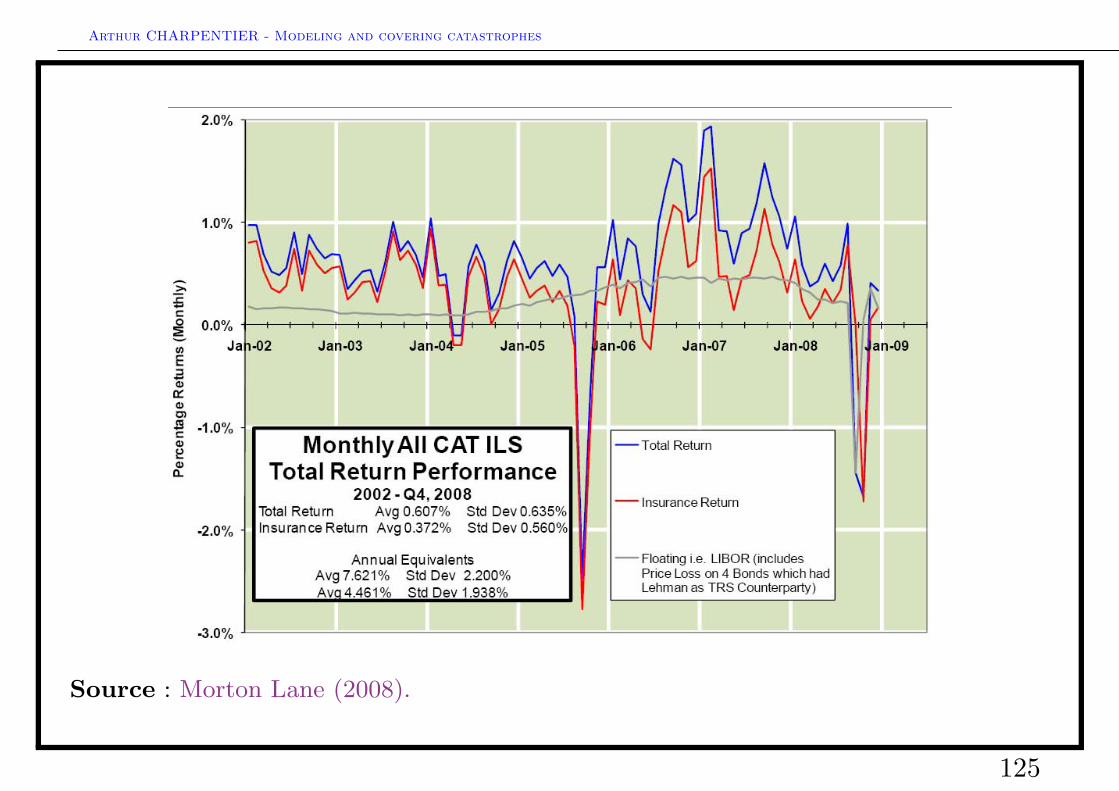
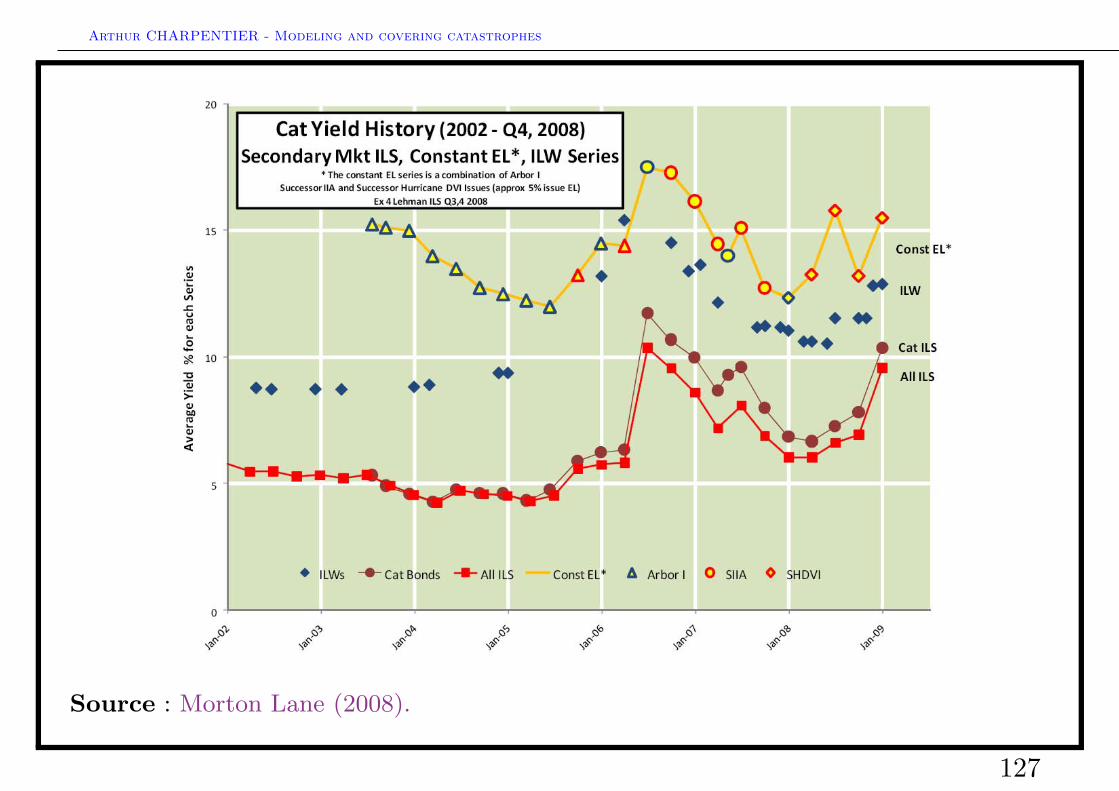
Source : Morton Lane (2008).
125

Arthur CHARPENTIER - Modeling and covering catastrophes
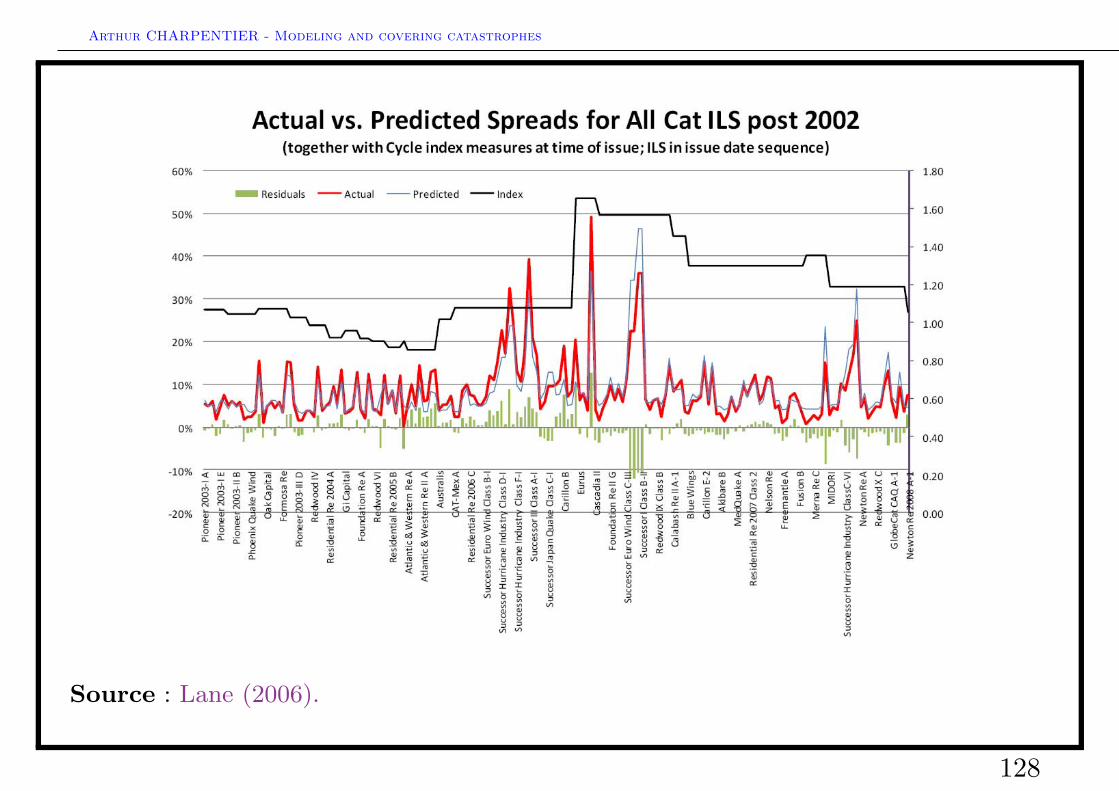
Source : Morton Lane (2008).
126
Arthur CHARPENTIER - Modeling and covering catastrophes
Source : Morton Lane (2008).
127
Arthur CHARPENTIER - Modeling and covering catastrophes
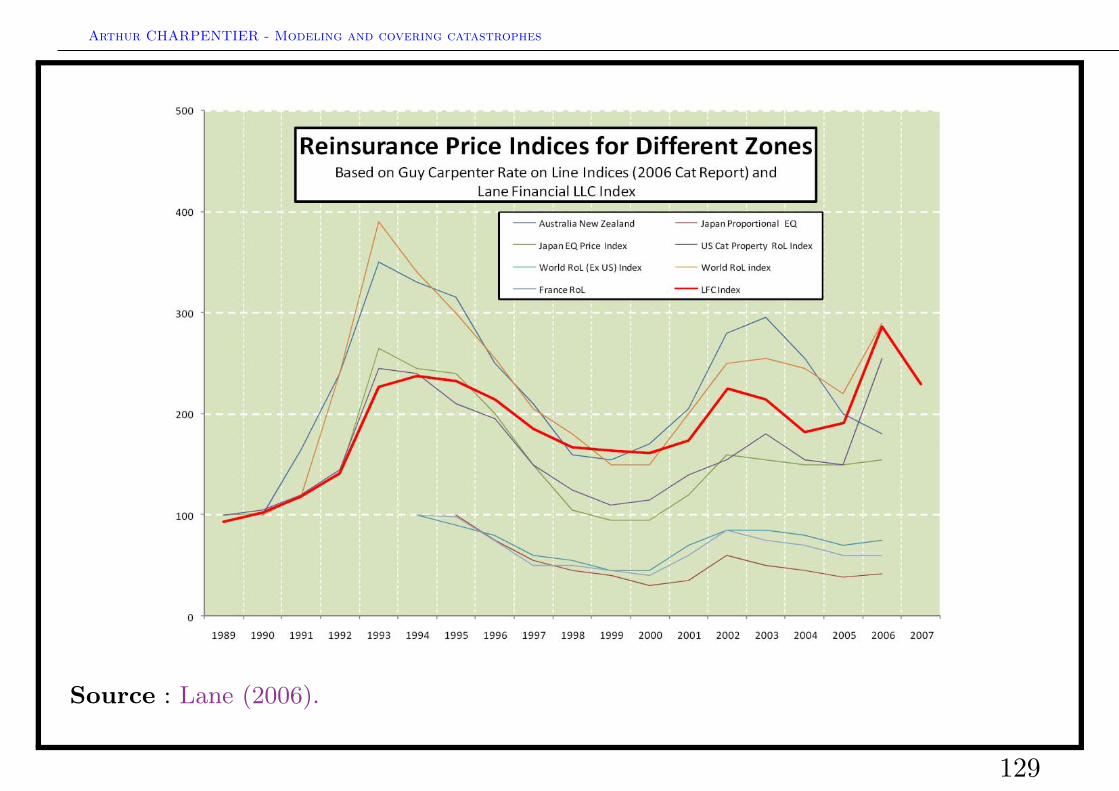
Source : Lane (2006).
128
Arthur CHARPENTIER - Modeling and covering catastrophes
Source : Lane (2006).
129
Arthur CHARPENTIER - Modeling and covering catastrophes
Agenda
Catastrophic risks modelling
• General introduction• Business interruption and very large claims• Natural catastrophes and accumulation risk• Insurance covers against catastrophes, traditional versus alternative techniques
Risk measures and pricing covers
• Pricing insurance linked securities• Risk measures, an economic introduction• Calculating risk measures for catastrophic risks• Pricing cat bonds : the Winterthur example• Pricing cat bonds : the Mexican Earthquake
130
Arthur CHARPENTIER - Modeling and covering catastrophes
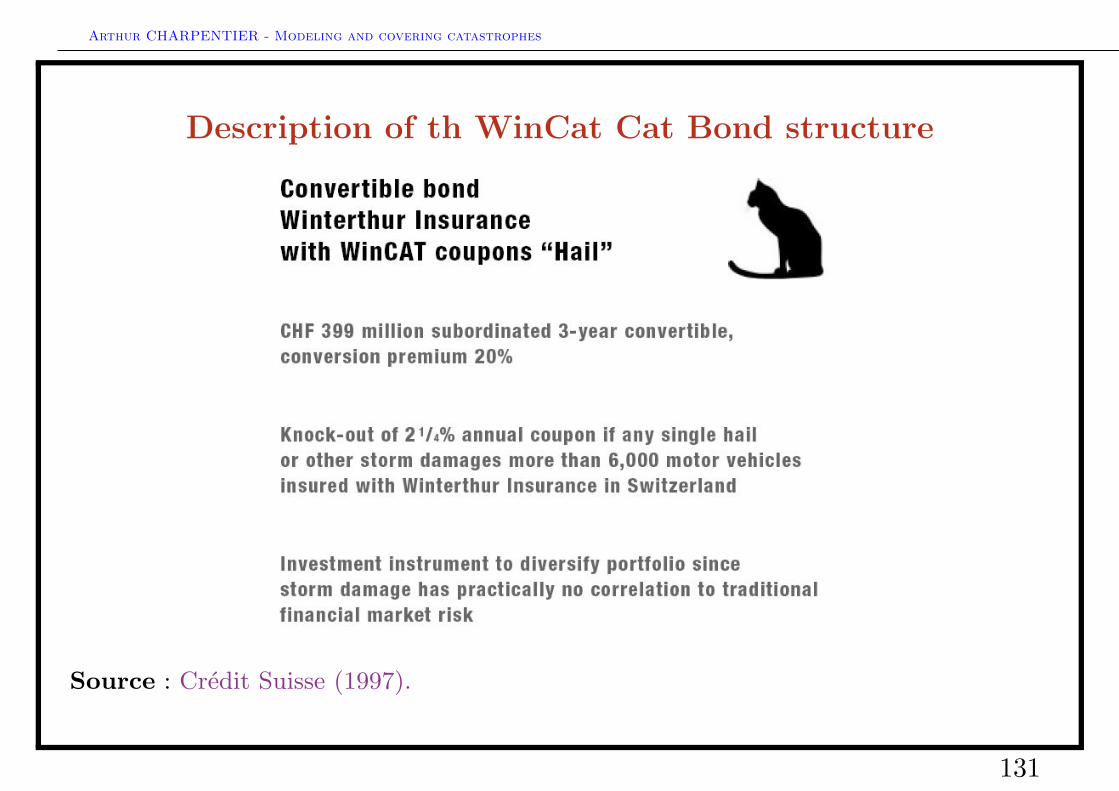
Description of th WinCat Cat Bond structure
Source : Credit Suisse (1997).
131
Arthur CHARPENTIER - Modeling and covering catastrophes
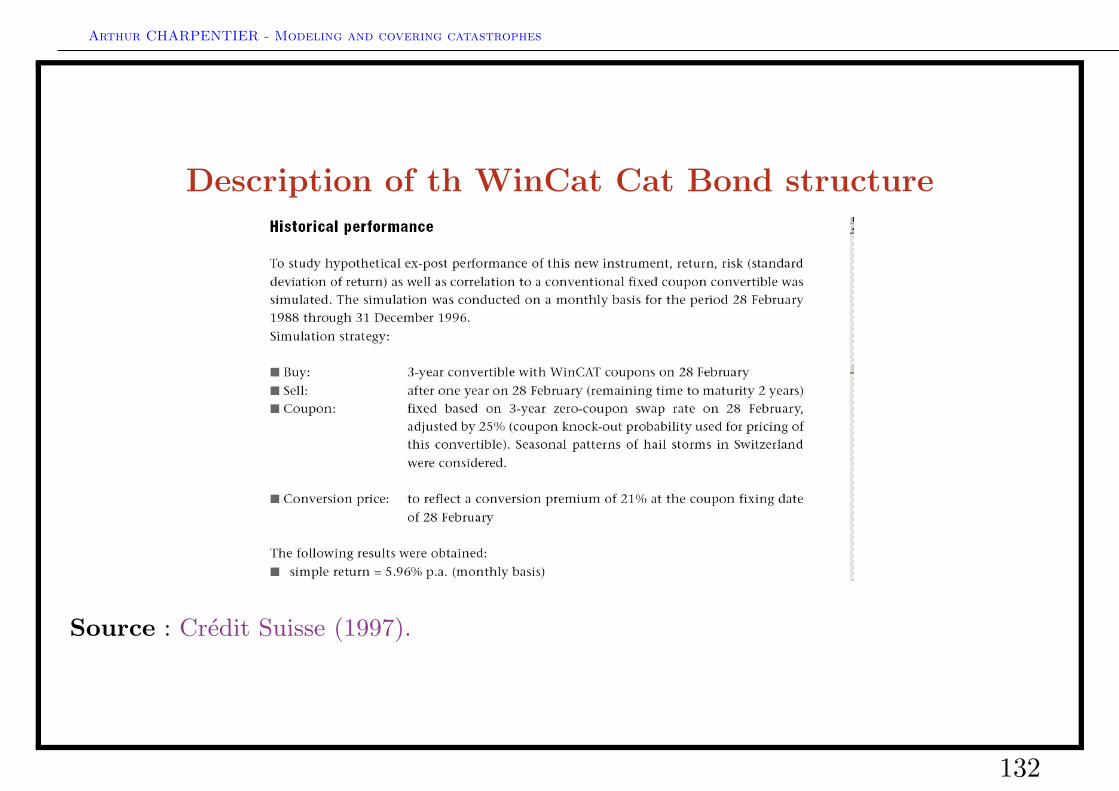
Description of th WinCat Cat Bond structure
Source : Credit Suisse (1997).
132
Arthur CHARPENTIER - Modeling and covering catastrophes
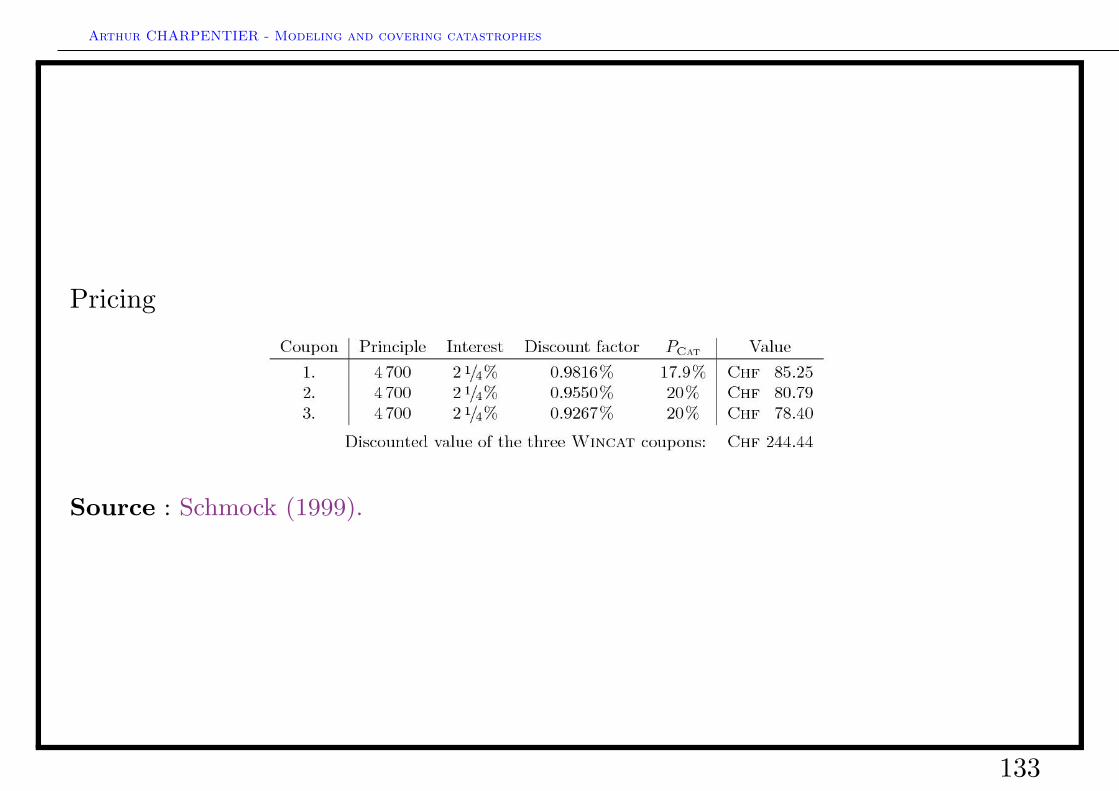
Pricing
Source : Schmock (1999).
133
Arthur CHARPENTIER - Modeling and covering catastrophes
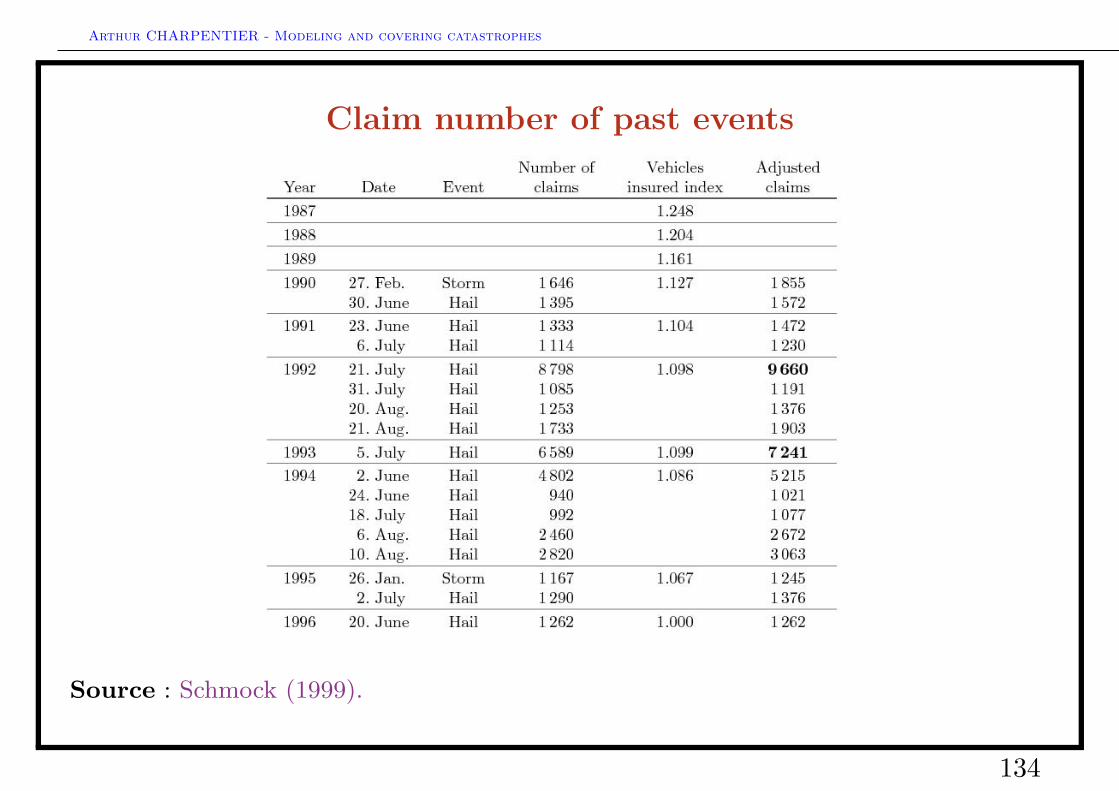
Claim number of past events
Source : Schmock (1999).
134
Arthur CHARPENTIER - Modeling and covering catastrophes
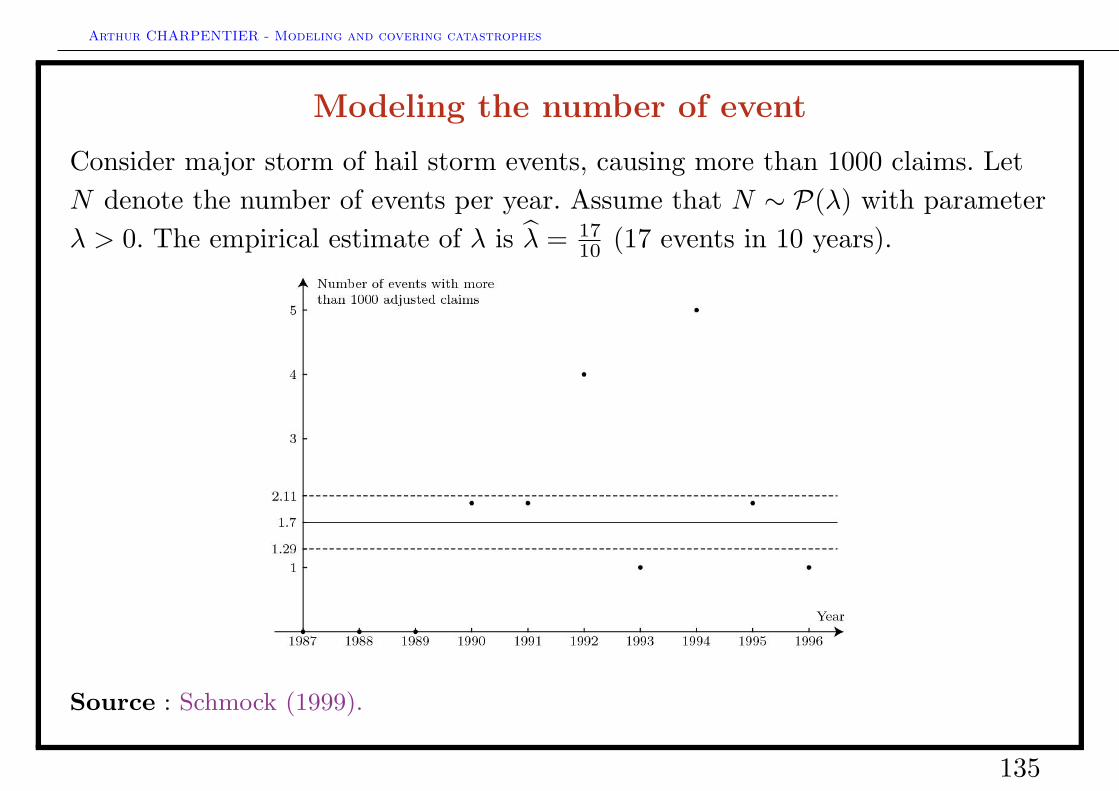
Modeling the number of event
Consider major storm of hail storm events, causing more than 1000 claims. LetN denote the number of events per year. Assume that N ∼ P(λ) with parameterλ > 0. The empirical estimate of λ is λ = 17
10 (17 events in 10 years).
Source : Schmock (1999).
135
Arthur CHARPENTIER - Modeling and covering catastrophes
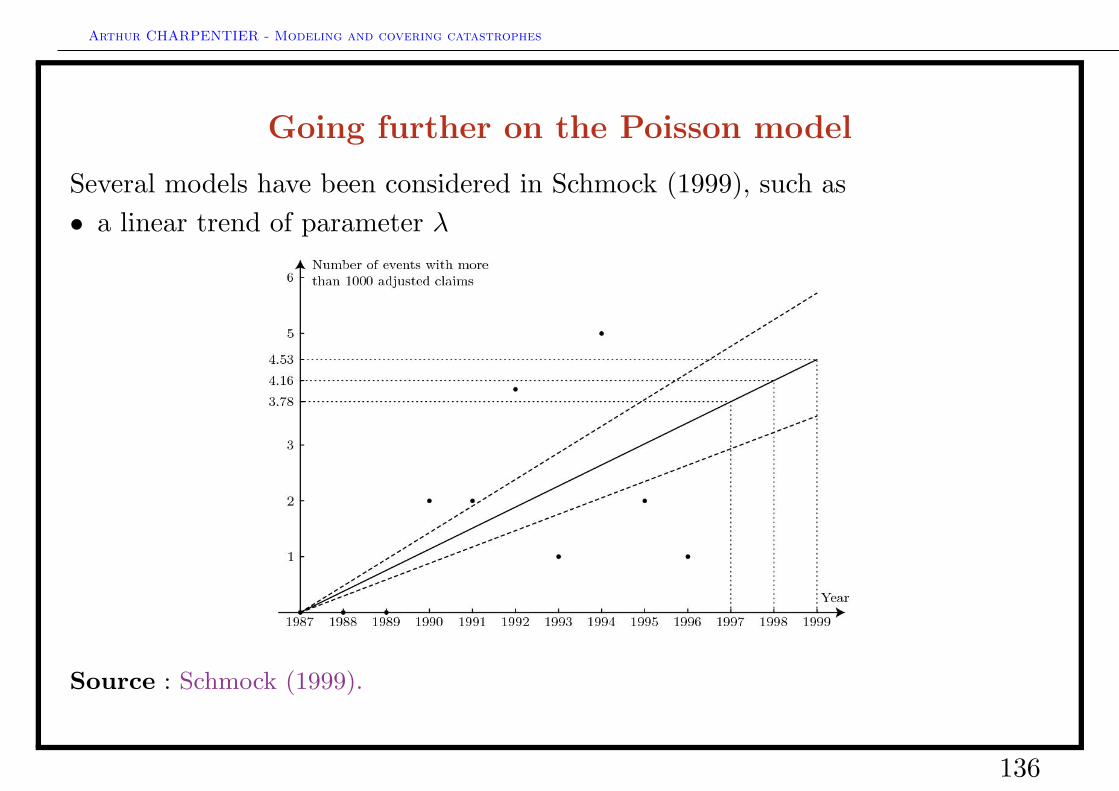
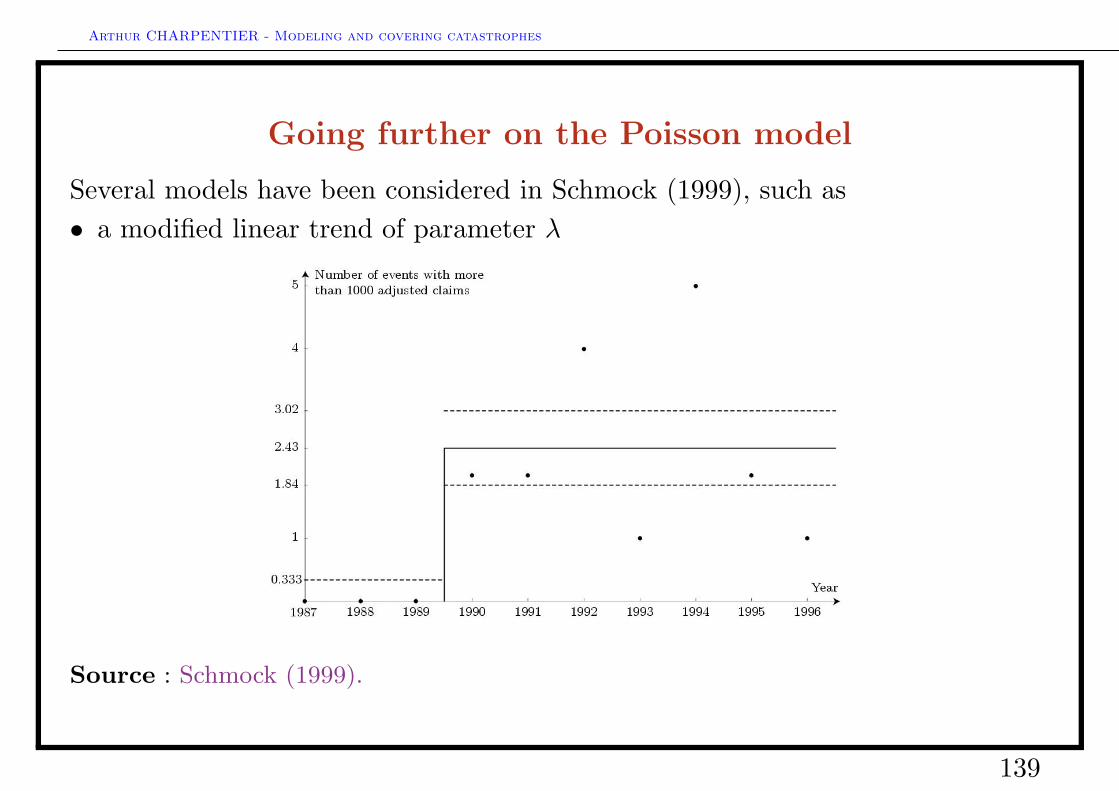
Going further on the Poisson model
Several models have been considered in Schmock (1999), such as• a linear trend of parameter λ
Source : Schmock (1999).
136
Arthur CHARPENTIER - Modeling and covering catastrophes
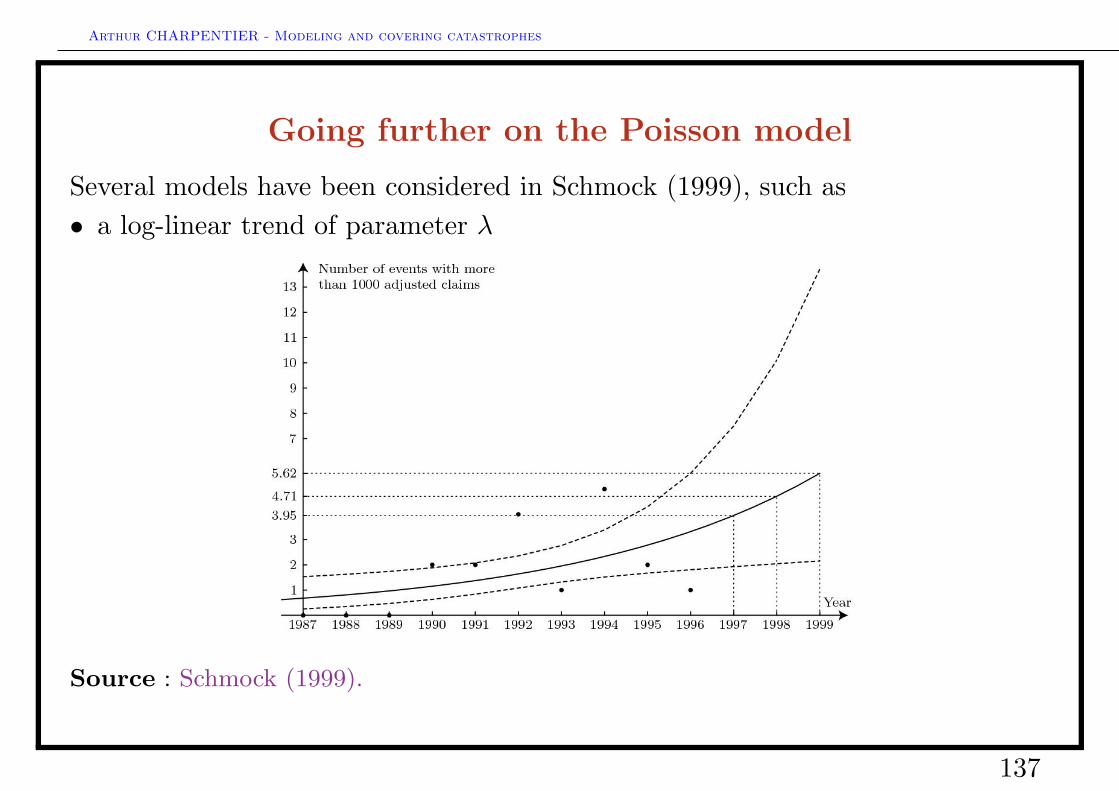
Going further on the Poisson model
Several models have been considered in Schmock (1999), such as• a log-linear trend of parameter λ
Source : Schmock (1999).
137
Arthur CHARPENTIER - Modeling and covering catastrophes
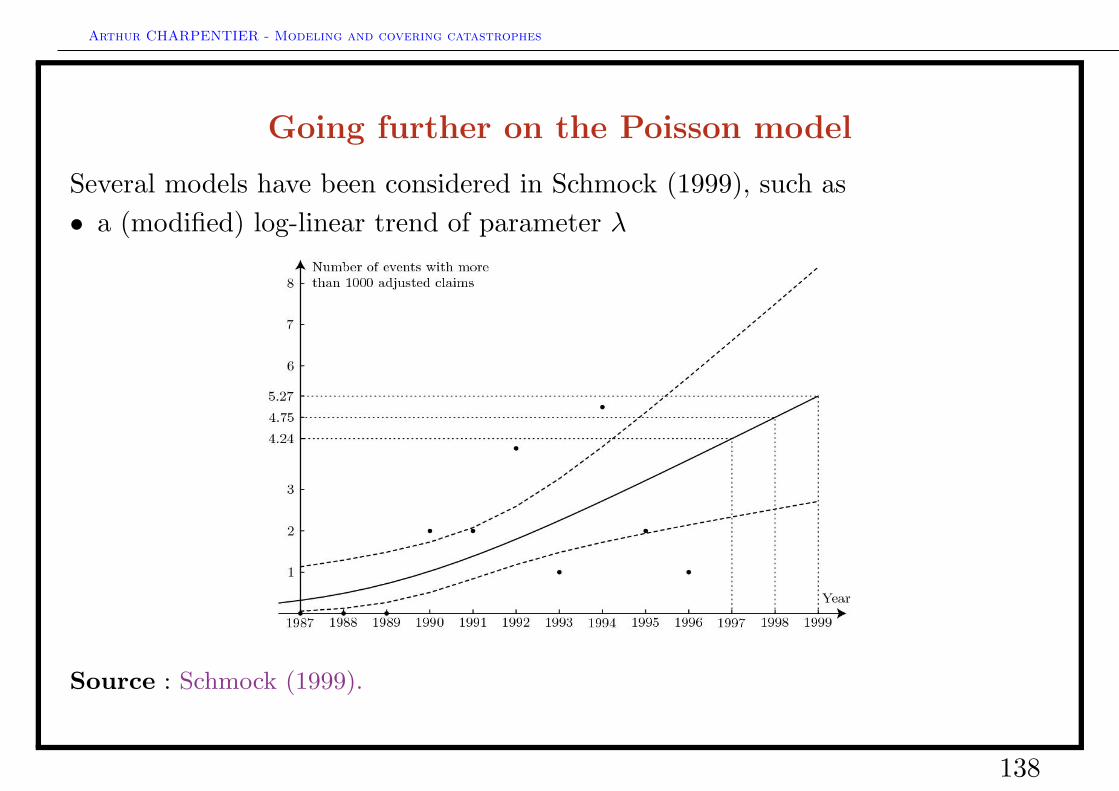
Going further on the Poisson model
Several models have been considered in Schmock (1999), such as• a (modified) log-linear trend of parameter λ
Source : Schmock (1999).
138
Arthur CHARPENTIER - Modeling and covering catastrophes
Going further on the Poisson model
Several models have been considered in Schmock (1999), such as• a modified linear trend of parameter λ
Source : Schmock (1999).
139
Arthur CHARPENTIER - Modeling and covering catastrophes
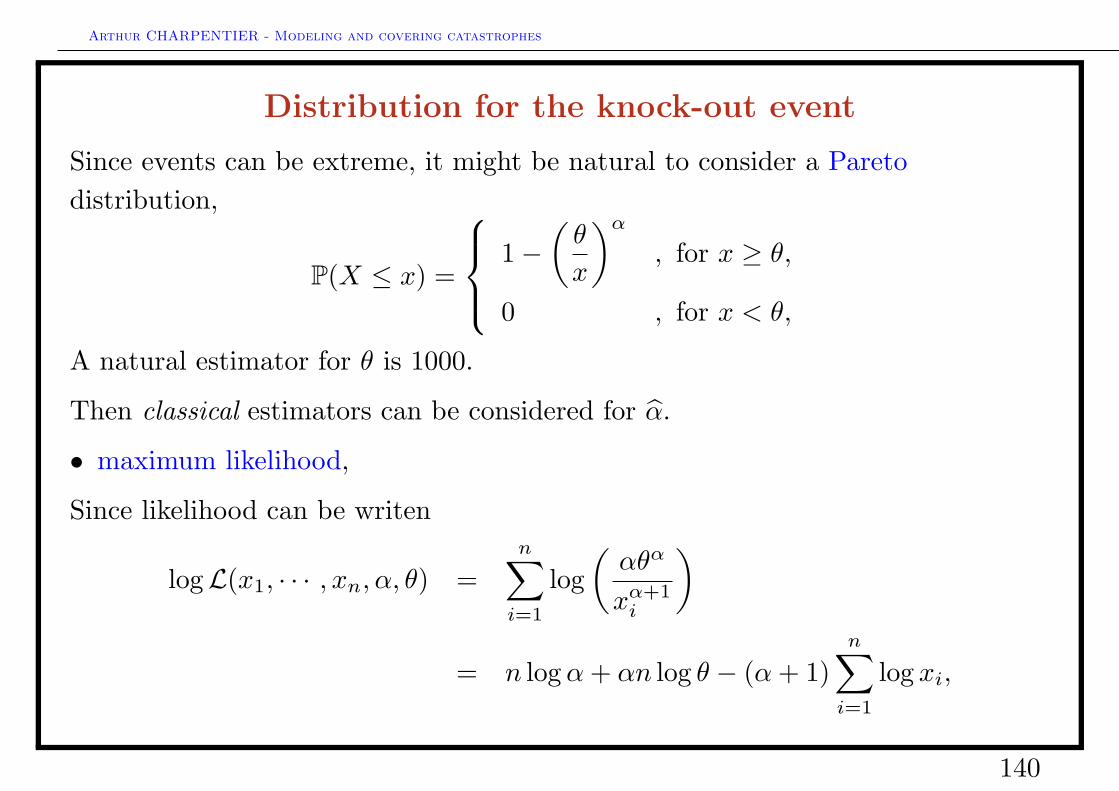
Distribution for the knock-out event
Since events can be extreme, it might be natural to consider a Paretodistribution,
P(X ≤ x) =
1−(θ
x
)α, for x ≥ θ,
0 , for x < θ,
A natural estimator for θ is 1000.
Then classical estimators can be considered for α.
• maximum likelihood,
Since likelihood can be writen
logL(x1, · · · , xn, α, θ) =n∑i=1
log(αθα
xα+1i
)
= n logα+ αn log θ − (α+ 1)n∑i=1
log xi,
140
Arthur CHARPENTIER - Modeling and covering catastrophes
the maximum (in α) is obtained as
α =
(1n
n∑i=1
logxi
θ
)−1
Sinece E(α) =n
n− 1α, set
α1 =n− 1n
α =
(1
n− 1
n∑i=1
logxi
θ
)−1
.
Then
E(α1) = α and V ar(α1) =α2
n− 2.
• method of moments,
For the Pareto distribution
E(X) =αθ
α− 1and V ar(X) =
θ2α
(α− 1)2(α− 2), pour α > 2.
141
Arthur CHARPENTIER - Modeling and covering catastrophes
Thus
α2 =X
X − θ.
Asymptotical properties are then
E(α2)→ α et V ar(α2)→ α(α− 1)2
n(α− 2).
• OLS regression,
If the logarithm of survival probabilities log[1− F (x)] are linear in log x, i.e.
log[1− F (x)] = logF (x) = β0 + β1 log x,
we obtain a Pareto distribution. In that case
Yi = log[1− F (Xi)] = logF (Xi) = β0 + β1 logXi + εi.
The OLS estimator for β = (β0, β1) is then
β1 = −α3 =−n∑ni=1 logXi · logF (Xi) +
∑ni=1 logXi ·
∑ni=1 logF (Xi)
n∑ni=1[logXi]2 − [
∑ni=1 logXi]
2
142
Arthur CHARPENTIER - Modeling and covering catastrophes
Since F is unknown, it should be replaced by an empirical version,
F (x) =1n
n∑i=1
1(Xi > x)
such that F (Xj) is equal to 1− rank(Xj)/n.
• empirical quantiles,
For instance, if we expect quantiles of order 10% and 90% to be equal, 0.10 = 1−(
θq10%
)α0.90 = 1−
(θ
q90%
)αwhere q10% and q10% are the empirical quantiles
Since(q90%q10%
)α= 0.9/0.1 = 9, a natural estimator is then
α4 =log 9
log q90% − log q10%.
143
Arthur CHARPENTIER - Modeling and covering catastrophes
• Gini’s index,
In the case of a Pareto distribution
G = 1− 2∫ 1
0
1− (1− u)1−1/αdu =1
2α− 1
Thus, if γ denotes the empirical version of Gini’s index
α5 =1 + γ
2γ.
144
Arthur CHARPENTIER - Modeling and covering catastrophes
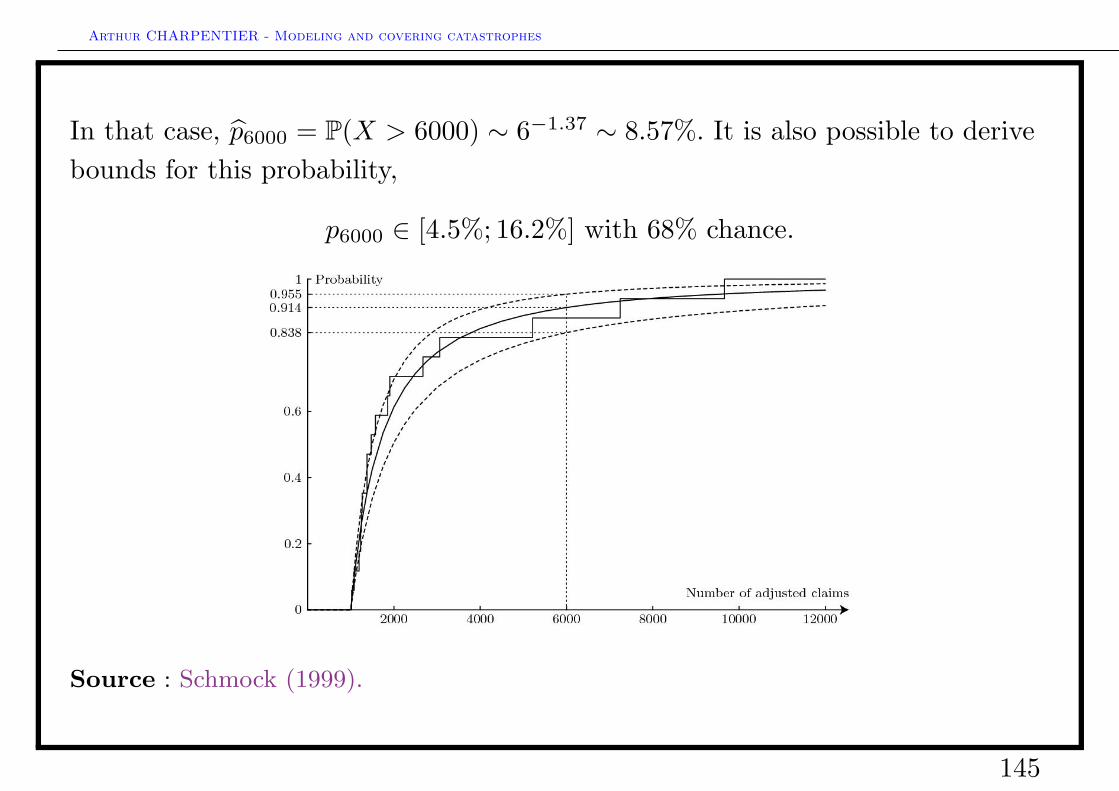
In that case, p6000 = P(X > 6000) ∼ 6−1.37 ∼ 8.57%. It is also possible to derivebounds for this probability,
p6000 ∈ [4.5%; 16.2%] with 68% chance.
Source : Schmock (1999).
145
Arthur CHARPENTIER - Modeling and covering catastrophes
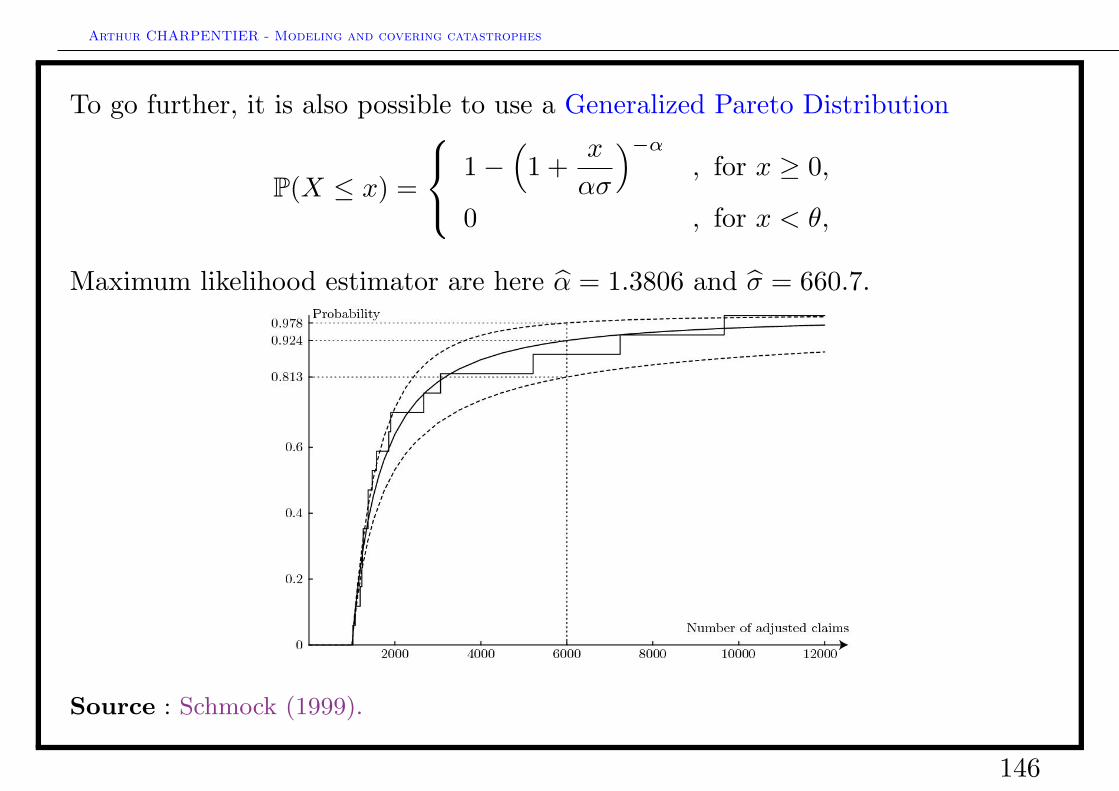
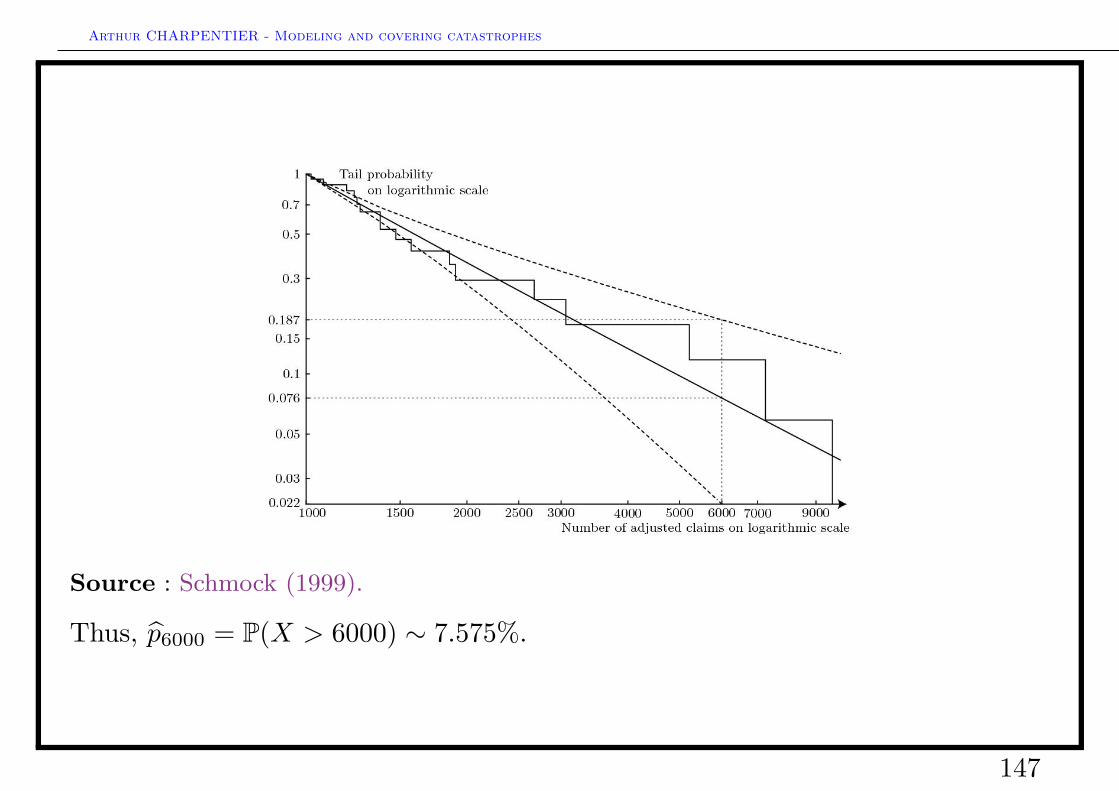
To go further, it is also possible to use a Generalized Pareto Distribution
P(X ≤ x) =
1−(
1 +x
ασ
)−α, for x ≥ 0,
0 , for x < θ,
Maximum likelihood estimator are here α = 1.3806 and σ = 660.7.
Source : Schmock (1999).
146
Arthur CHARPENTIER - Modeling and covering catastrophes
Source : Schmock (1999).
Thus, p6000 = P(X > 6000) ∼ 7.575%.
147
Arthur CHARPENTIER - Modeling and covering catastrophes
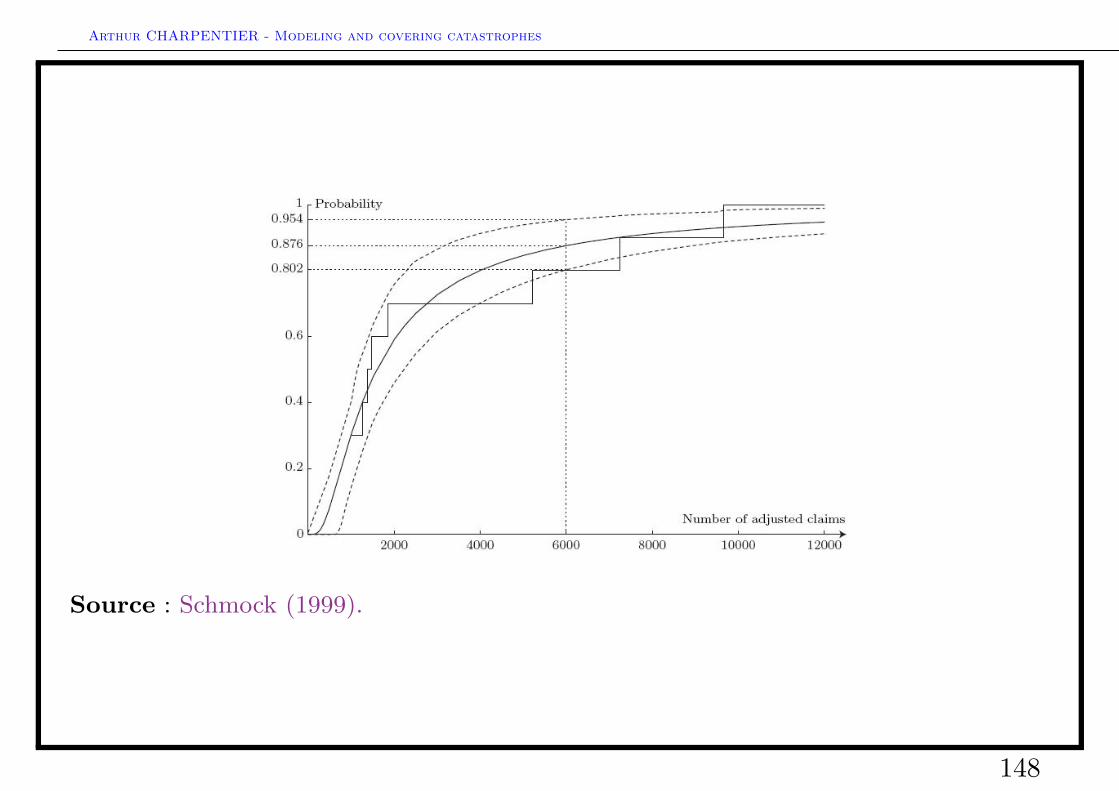
Source : Schmock (1999).
148
Arthur CHARPENTIER - Modeling and covering catastrophes
Agenda
Catastrophic risks modelling
• General introduction• Business interruption and very large claims• Natural catastrophes and accumulation risk• Insurance covers against catastrophes, traditional versus alternative techniques
Risk measures and pricing covers
• Pricing insurance linked securities• Risk measures, an economic introduction• Calculating risk measures for catastrophic risks• Pricing cat bonds : the Winterthur example• Pricing cat bonds : the Mexican Earthquake
149
Arthur CHARPENTIER - Modeling and covering catastrophes
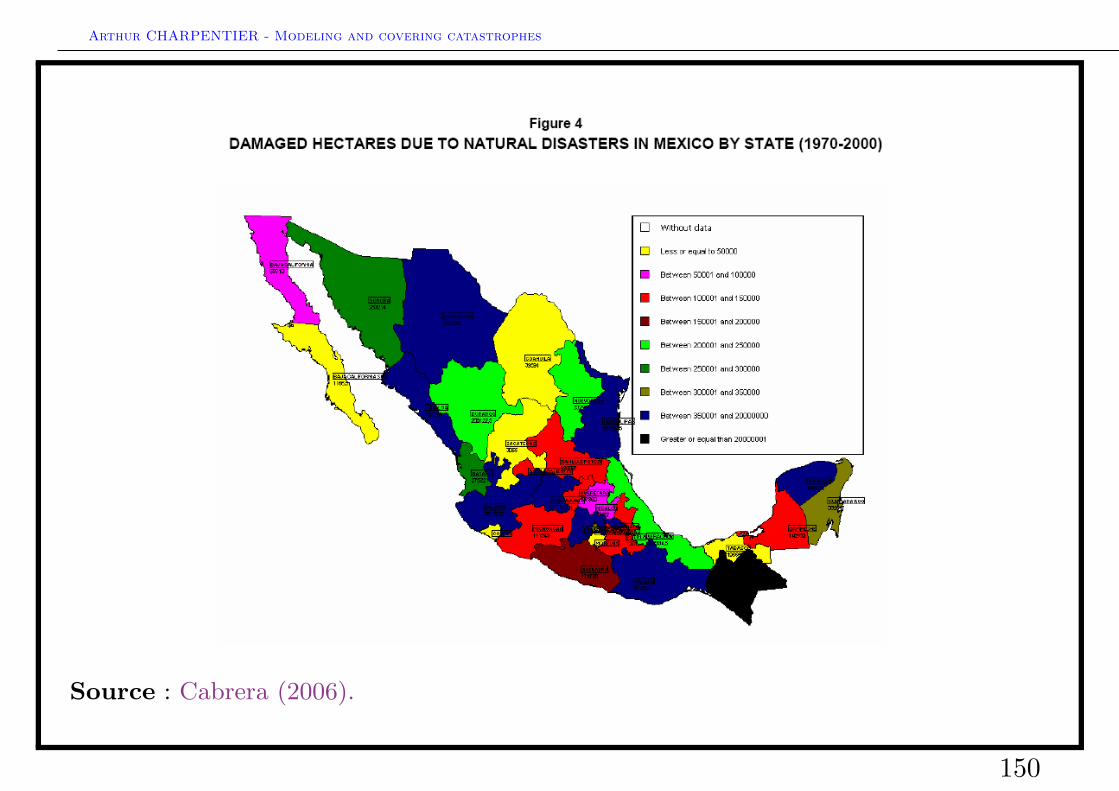
Source : Cabrera (2006).
150

Arthur CHARPENTIER - Modeling and covering catastrophes
Natural Catastrophes in Mexico
For Fonden, a ”catastrophe” is a claim larger than annual average catastrophe,plus the standard deviation,
1996 1997 1998 1999 2000 2001 2002 2003 2004
amount 109 310 330 739 511 120 261 216 32
the average is 292 and standard deviation is 48, thus a catastrophe is obtainedwhen the loss exceed 512.
The AIR annual expected loss probabilities
Annual expected loss probabilities
00zone 100 00zone 200 00zone 500
0.63% 0.96% 0.30%
151
Arthur CHARPENTIER - Modeling and covering catastrophes
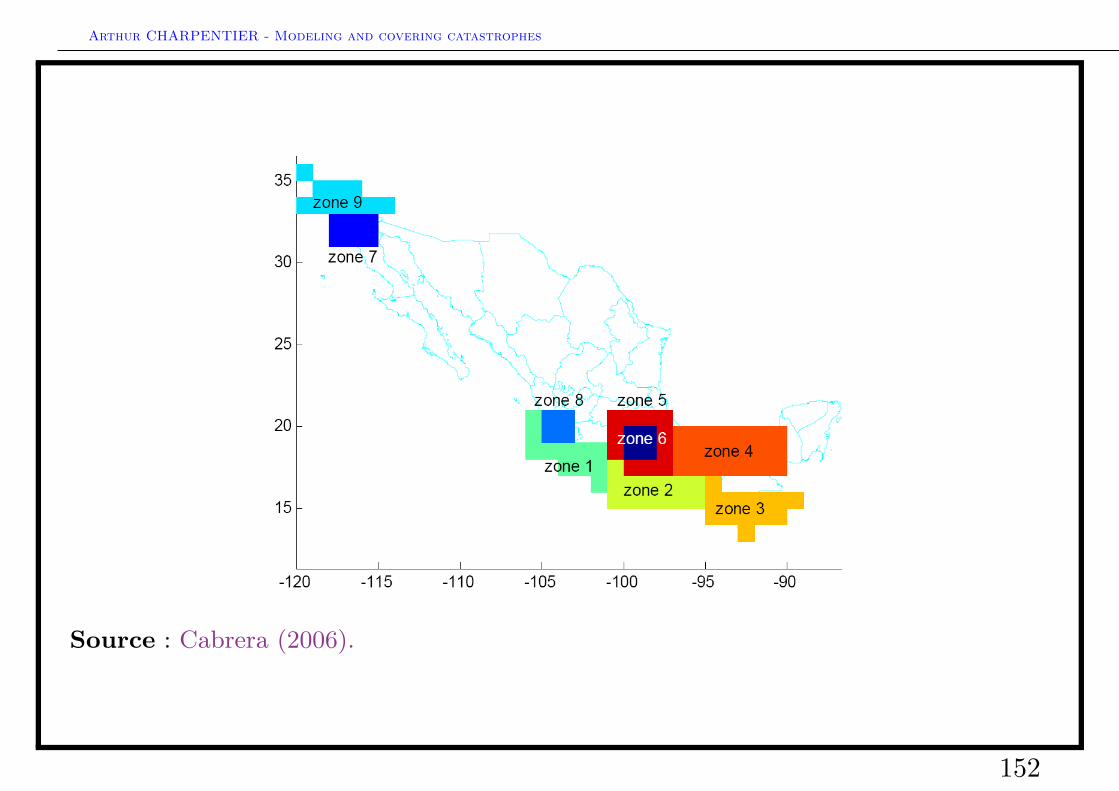
Source : Cabrera (2006).
152
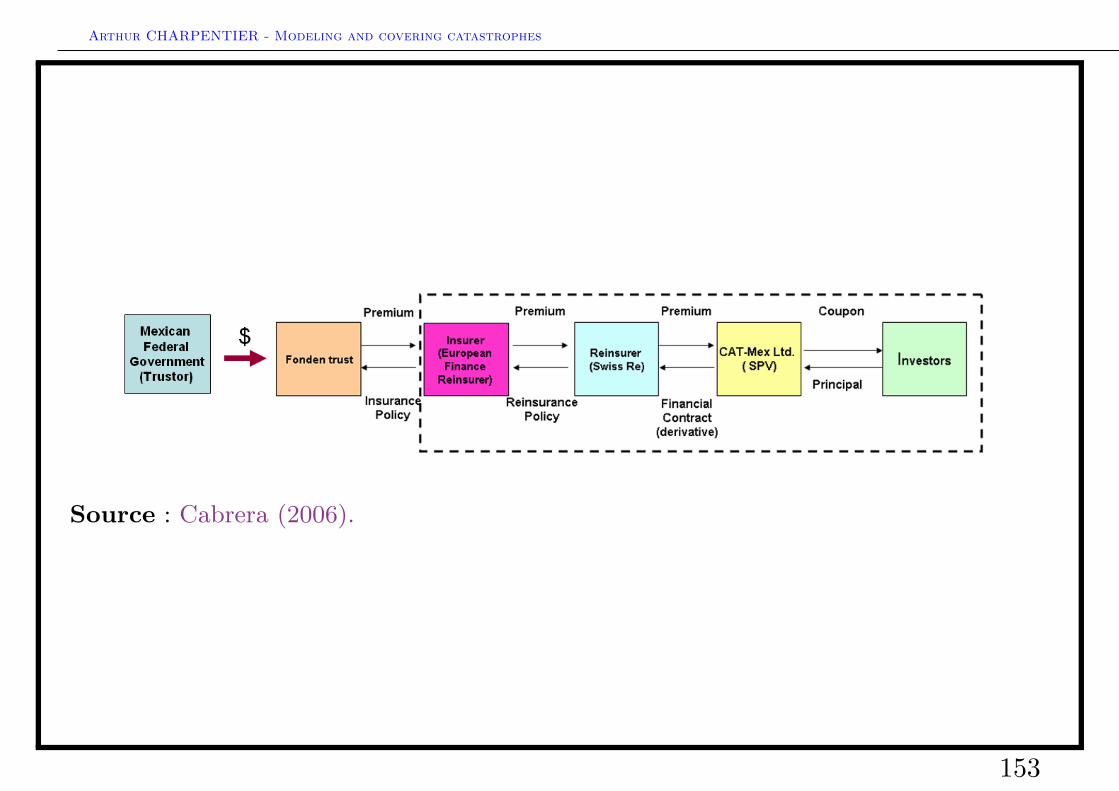
Arthur CHARPENTIER - Modeling and covering catastrophes
Source : Cabrera (2006).
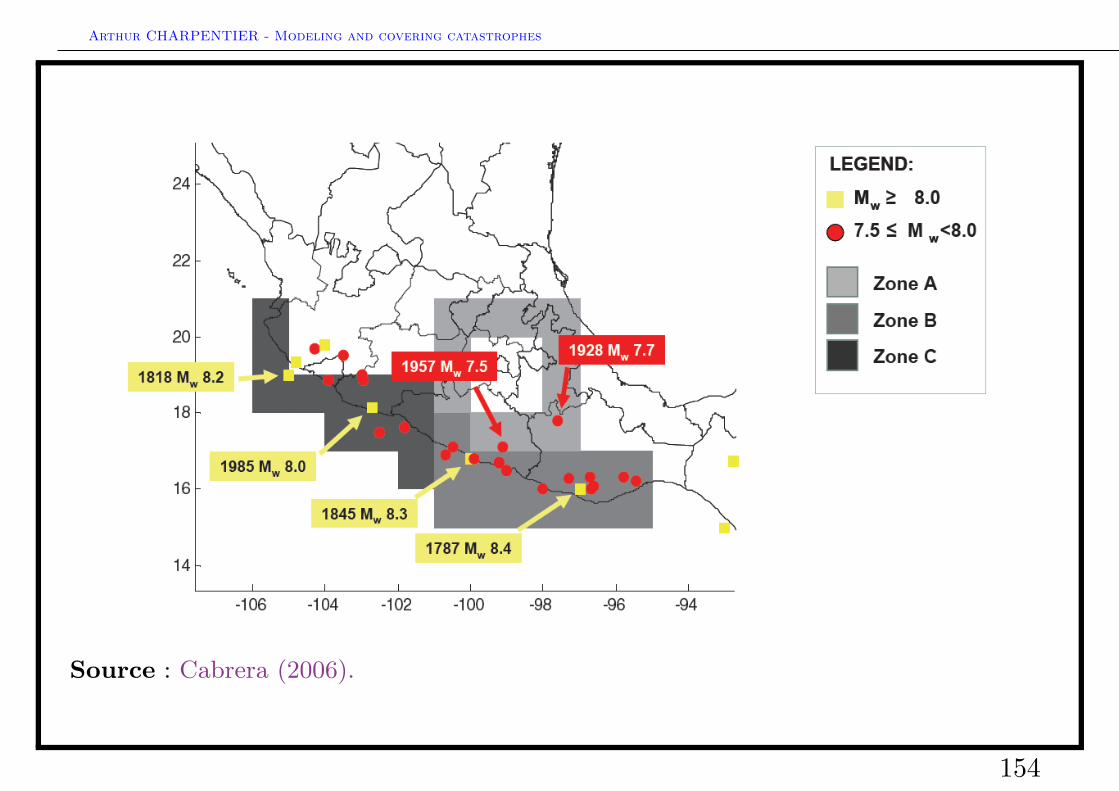
153
Arthur CHARPENTIER - Modeling and covering catastrophes
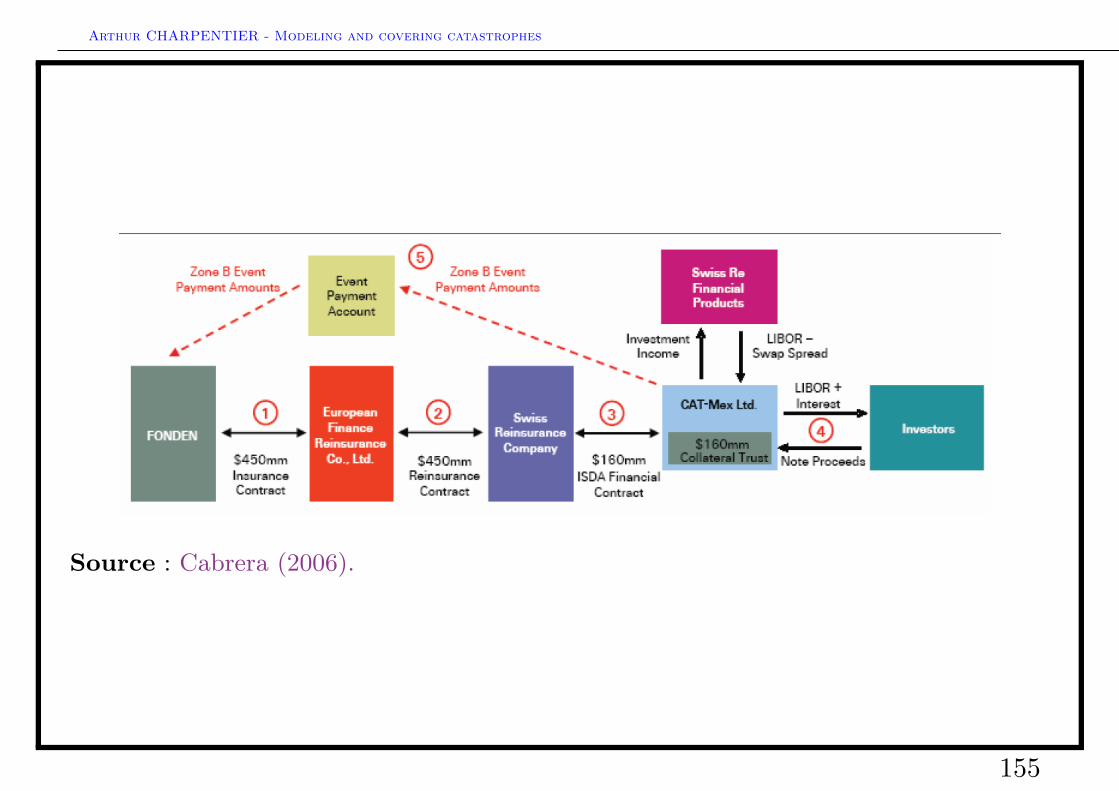
Source : Cabrera (2006).
154
Arthur CHARPENTIER - Modeling and covering catastrophes
Source : Cabrera (2006).
155
Arthur CHARPENTIER - Modeling and covering catastrophes
The Mexican Cat Bond
The cat bond was issued by a SPV Cayman Islands Cat-Mex Ltd, structured bySwiss Reinsurance Company (SRC) and Deutsche Bank.
The 160 million cat bond pays a tranche equal to the LIBOR + 235 basis points.
The cat bond is a part of a total coverage of 450 million provided by the reinsurerfor three years against earthquakes risk, with a total premium of 26 millions.
Payment of losses is conditional upon confirmation by AIR, which modeled theseismic risk. Only 3 zones (out of 9) are insured in the transaction : zones 1, 2and 5, with coverage of 150 million (in each case).
The cat bond payment would be triggered if there is an event, i.e. an earthquakehigher (or equal) than 8Mw hitting zone 1 or zone 2, or an eathquake higher orequal than 7.5Mw hitting zone 5.
156
Arthur CHARPENTIER - Modeling and covering catastrophes
Insurance market intensity λ1
Consider an homogeneous Poisson process with intensity λ1. Under thenon-artbitrage framework, the compounded discount actuarial fair insuranceprice at time t = 0, in the reinsurance market is
H = E(450 · 1 (τ < 3) e−rττ
)= 450
∫ 3
0
e−rttfτ (t)dt = 450∫ 3
0
e−rttλ1e−λ1tdt
i.e. the insurance premium is equal to the value of the expected discounted lossfrom earthquake.
With constant interest rate, rt = log(1.0541). Thus
26 = 450∫ 3
0
e− log(1.0541)tλ1e−λ1tdt, where 1− e−λ1t is the probability of
occurence of an event over period [0, t]. Hence, we get an intensity rate from thereinsurance market λ1 ≈ 0.0214.
The probability of having (at least) one event in three years is 0.0624, i.e. 2.15events in one hundred years.
157
Arthur CHARPENTIER - Modeling and covering catastrophes
Capital market intensity λ2
The cat bond pays to the investors the principal P equal to 160 million atmaturity T = 3 years, and gives coupon C every 3 months during the bond’s lifein case of no event. The coupon bonds pays a fixed spread rate z = 235 basispoints over LIBOR.
Hence the annual interest rate is r = 5.1439%, and thus
C =(r + z
4
)P =
(5.1439% + 2.35%
4
)· 160 = 3.1055
158
Arthur CHARPENTIER - Modeling and covering catastrophes
Let G be the random variable representing the investor’s gain,
P = E(
1(1 + r)τ
G
)= E
(12∑t=1
C · 1(τ >t
4)
1(1 + r)t/4
+ P · 1(τ > 3)1
(1 + r)3
)
=12∑t=1
Ce−λ2t/41
(1 + r)t/4+ Pe−3λ2
1(1 + r)3
Substituting the values of the principal P = 160 million and the coupons
C = 3.1055 million, i.e. 160 =12∑t=1
3.06e−λ2t/4
(1.0541)t/4+ 160
e−3λ2
(1.0541)3. From this
expression, the capital market intensity can be obtained λ2 ≈ 0.0241. Theprobability of having (at least) one event in three years is 0.0699, i.e. 2.4 eventsin one hundred years.
159
Arthur CHARPENTIER - Modeling and covering catastrophes
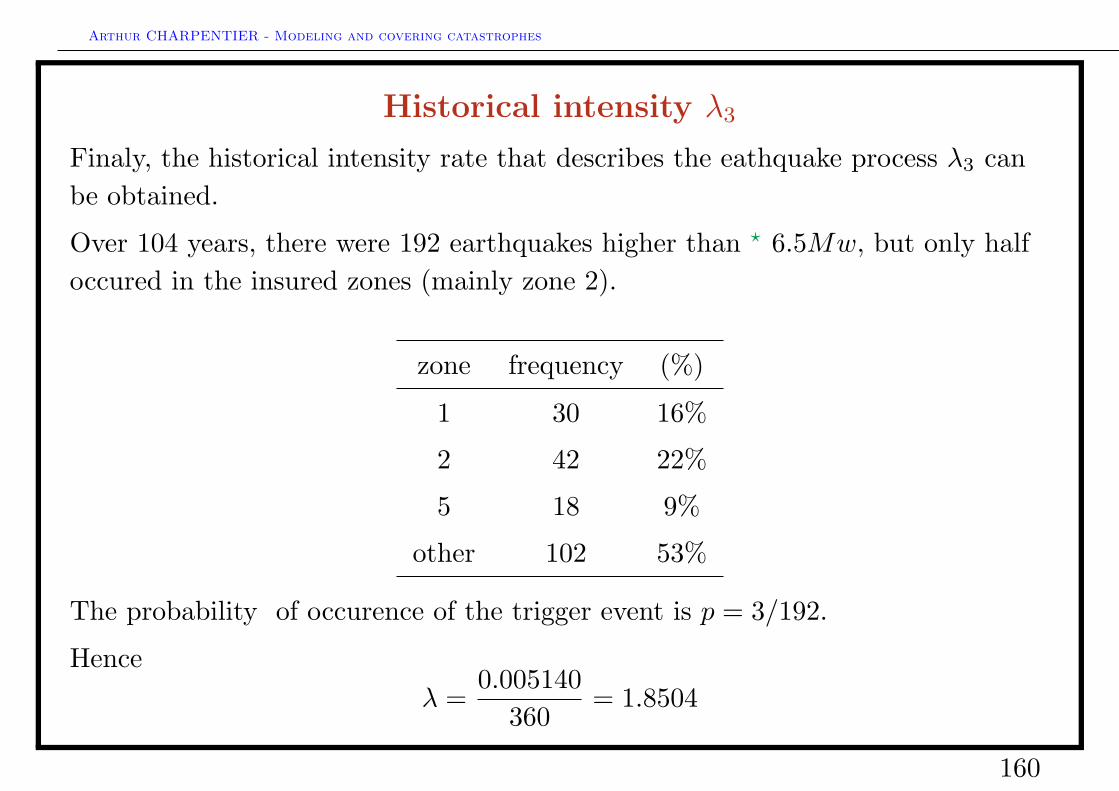
Historical intensity λ3
Finaly, the historical intensity rate that describes the eathquake process λ3 canbe obtained.
Over 104 years, there were 192 earthquakes higher than ? 6.5Mw, but only halfoccured in the insured zones (mainly zone 2).
zone frequency (%)
1 30 16%
2 42 22%
5 18 9%
other 102 53%
The probability of occurence of the trigger event is p = 3/192.
Henceλ =
0.005140360
= 1.8504
160
Arthur CHARPENTIER - Modeling and covering catastrophes
Consequently the annual historical intensity is λ3 = λp = 0.0289.
161
Arthur CHARPENTIER - Modeling and covering catastrophes
References (internet)
Artemis (Alternative Risk Transfer Internet Portal) http ://www.artemis.bm/
Guy Carpenter http ://www.guycarp.com/
Lane Financial LLC http ://www.lanefinancialllc.com/
Munich Re http ://www.munichre.com/
AON Bnefield http ://www.benfieldgroup.com/
Swiss Re http ://www.swissre.com/
162
Arthur CHARPENTIER - Modeling and covering catastrophes
References
Banks, E. (2004). Alternative Risk Transfer : Integrated Risk Managementthrough Insurance, Reinsurance, and the Capital Markets. Wiley.
Banks, E. (2005). Catastrophic Risk. Wiley.
Cabrera, B., B. (2006). Pricing catastrophic bonds for earthquakes in Mexico.Master thesis, Humboldt-Universitat zu Berlin.
Cardenas, V. & Mechler, R. (2005). The Mexico cat bonds - a solution forcountry at risk ? Munich Re Foundation Symposium.
Cox, S.H. & Pedersen, H.W. (2000). Catastrophe risk bonds. North AmericanActuarial Journal, 4, 4, 56-..
Kreps, R. (2005). Riskiness leverage models. CAS Forum.
Lane, M. & Mahul, O. (2008). Catastrophe Risk Pricing : an empirical analysis.World Bank, WPS 4765.
Mata, A.J. (2004) Catastrophe Excess of Loss. in Encyclopedia of ActuarialSciences.
163
Arthur CHARPENTIER - Modeling and covering catastrophes
Meyers, G. (2004) Catastrophe Models and Catastrophe Loads. in Encyclopedia ofActuarial Sciences.
Muerlann, A. (2004) Catastrophe Derivatives. in Encyclopedia of ActuarialSciences.
Neuhaus, W. (2004) Alternative Risk Transfer. in Encyclopedia of ActuarialSciences.
Schmock, U. (1999). Estimating the value of the WinCat coupons of theWinterthur insurance convertible bond. A study of the model risk. ASTINBulleton, 29, 101-163.
164
Arthur CHARPENTIER - Modeling and covering catastrophes
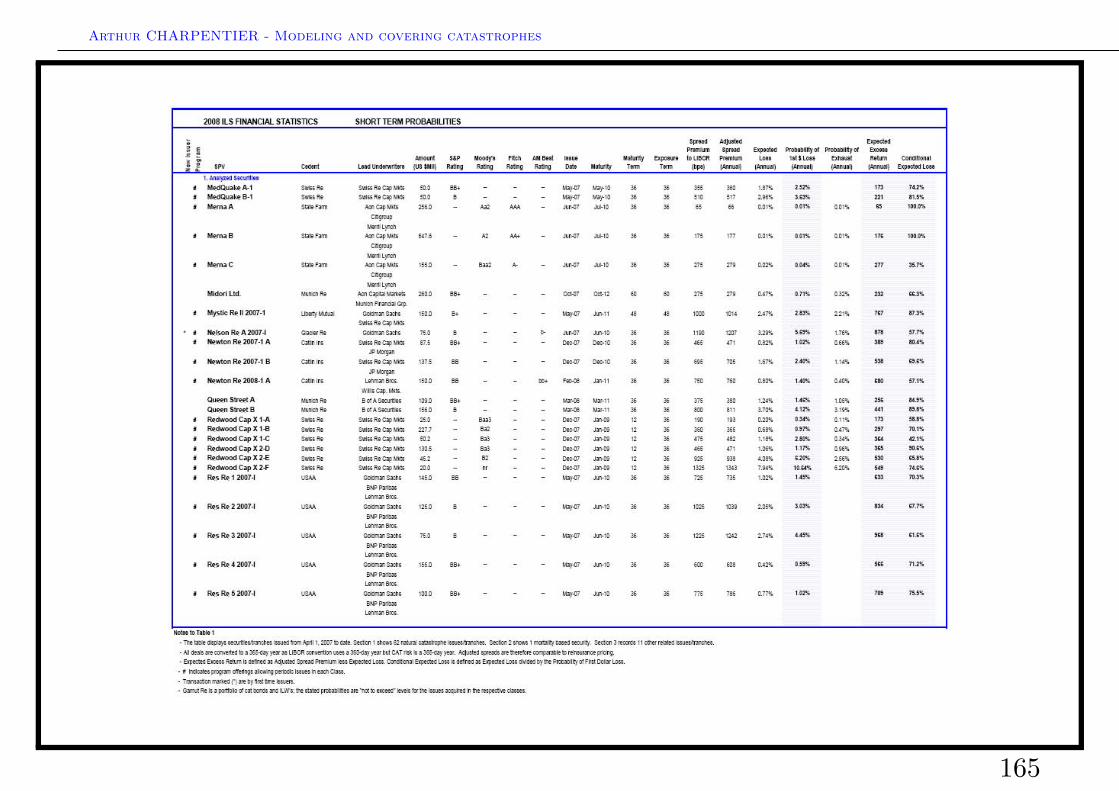
165
Arthur CHARPENTIER - Modeling and covering catastrophes
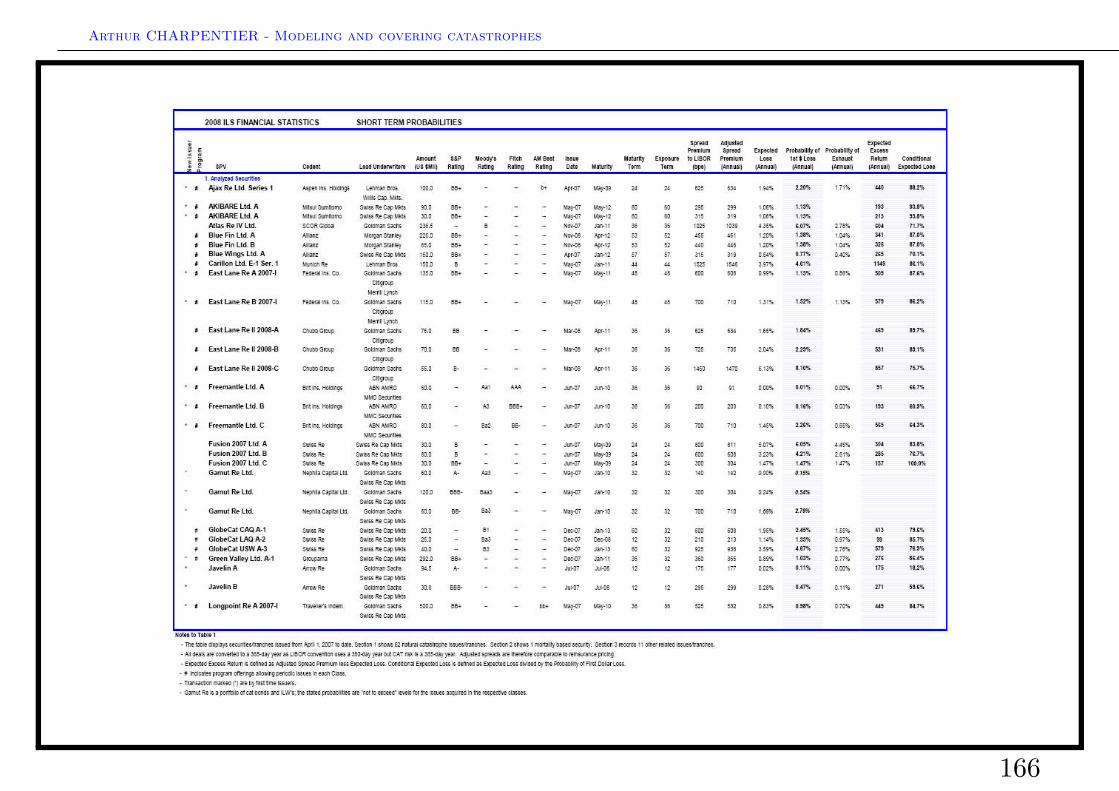
166
Arthur CHARPENTIER - Modeling and covering catastrophes
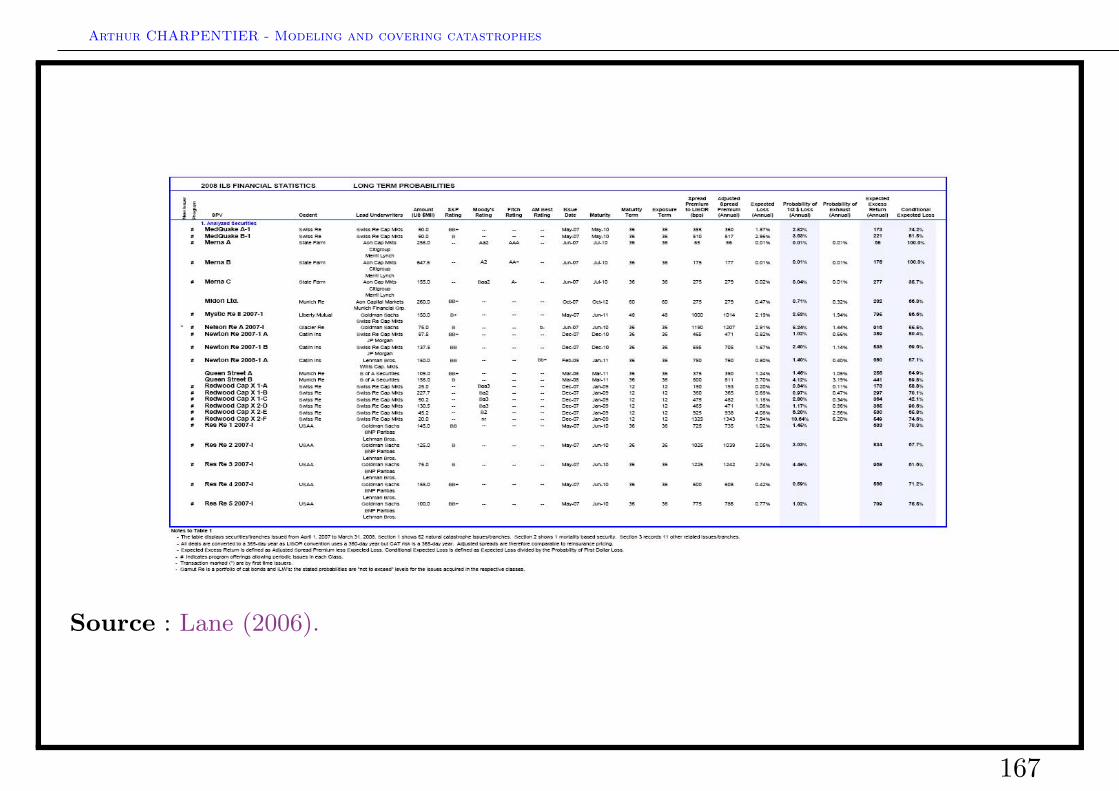
Source : Lane (2006).
167
Arthur CHARPENTIER - Modeling and covering catastrophes
Source : Lane (2006).
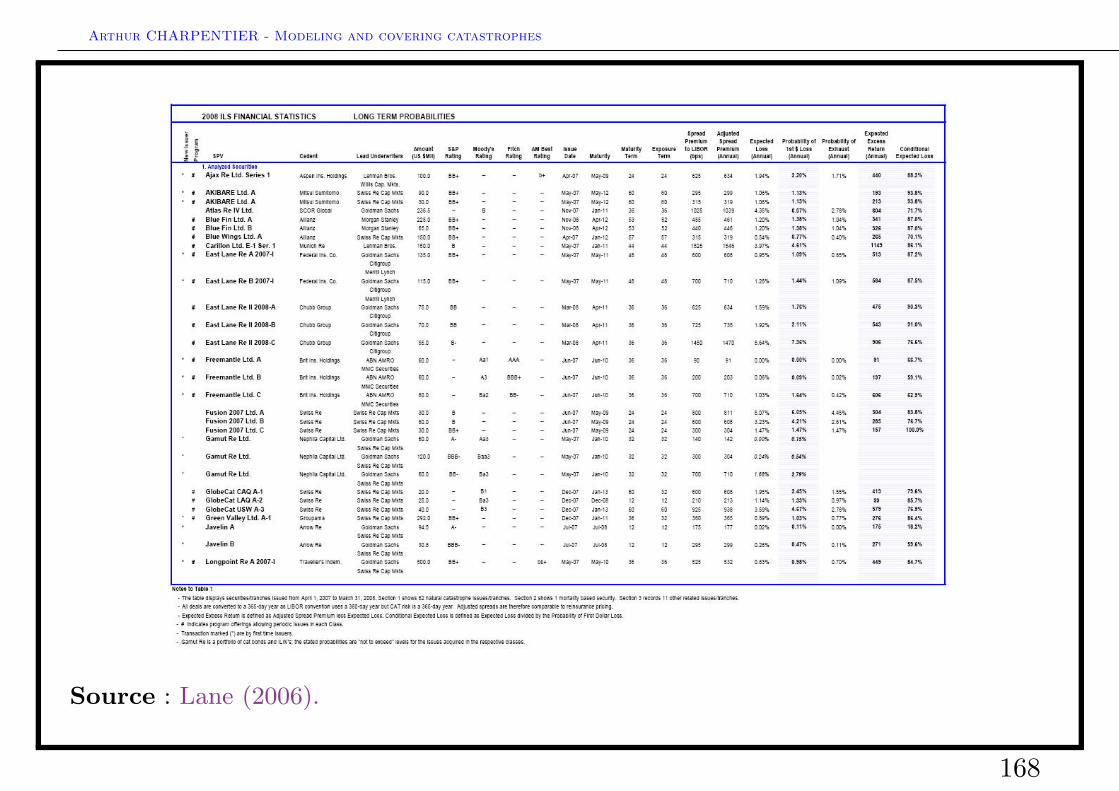
168