
Slides from Growthcon 2014 Lean Analytics masterclass
143
Practical Lean Analytics Growthcon October 24, 2014 @acroll
-
Upload
lean-analytics -
Category
Leadership & Management
-
view
3.619 -
download
1
Transcript of Slides from Growthcon 2014 Lean Analytics masterclass
Practical Lean Analytics
Growthcon October 24, 2014
@acroll
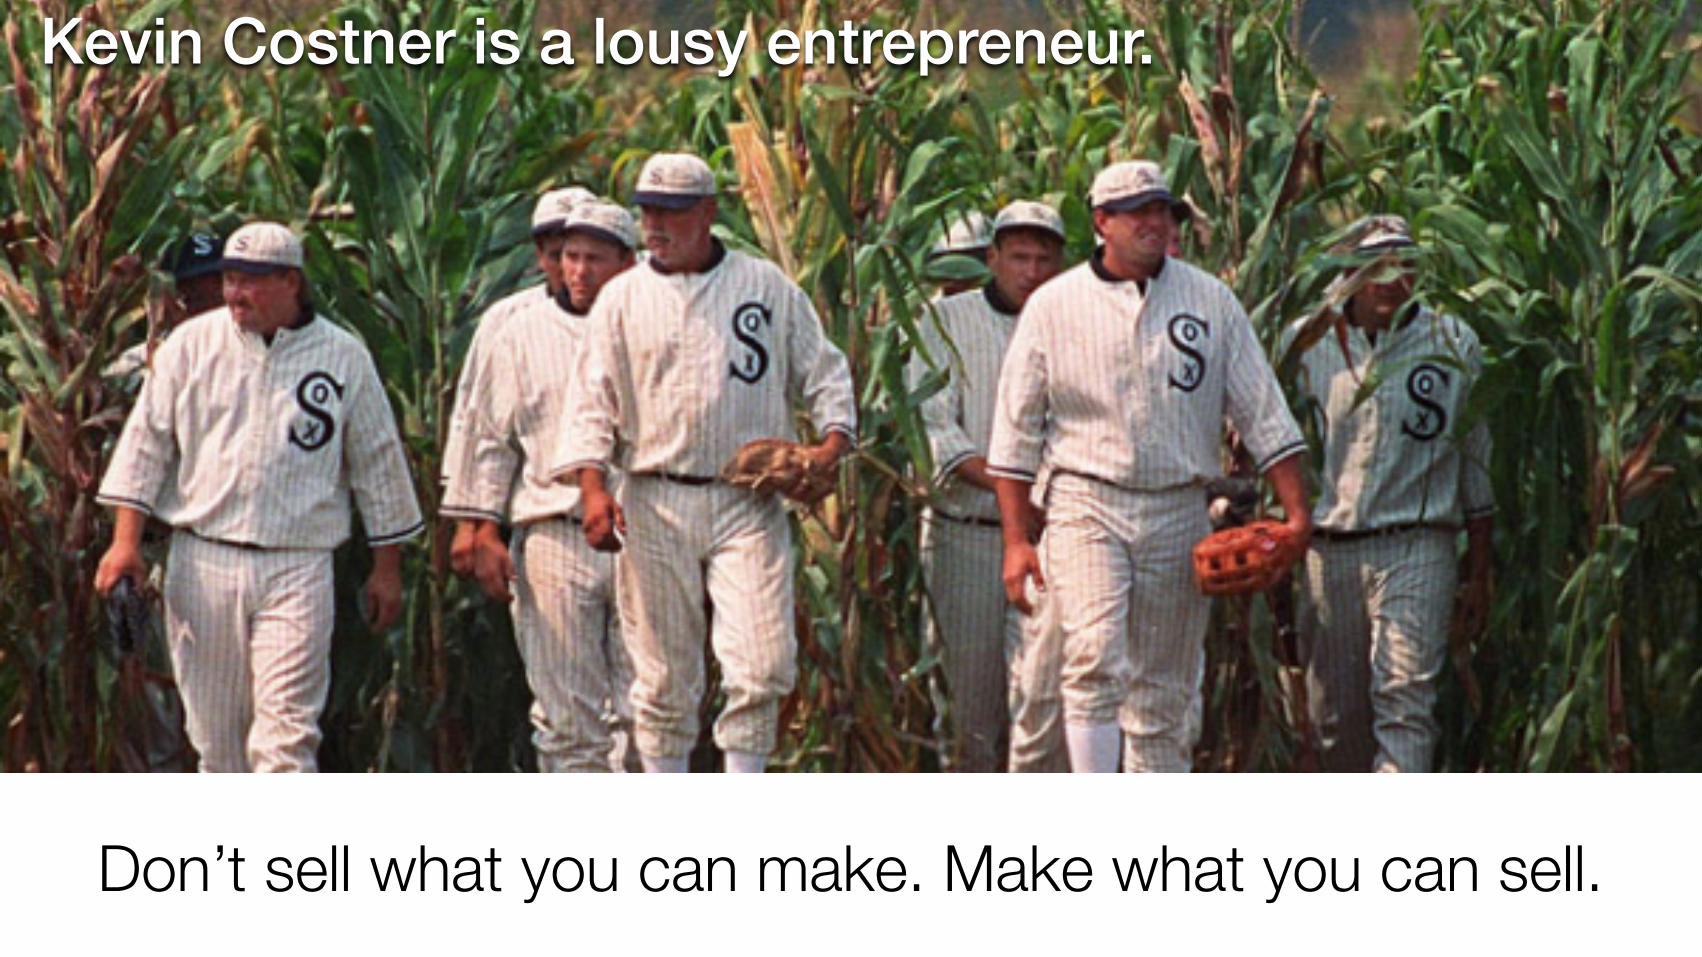
Don’t sell what you can make. Make what you can sell.
Kevin Costner is a lousy entrepreneur.
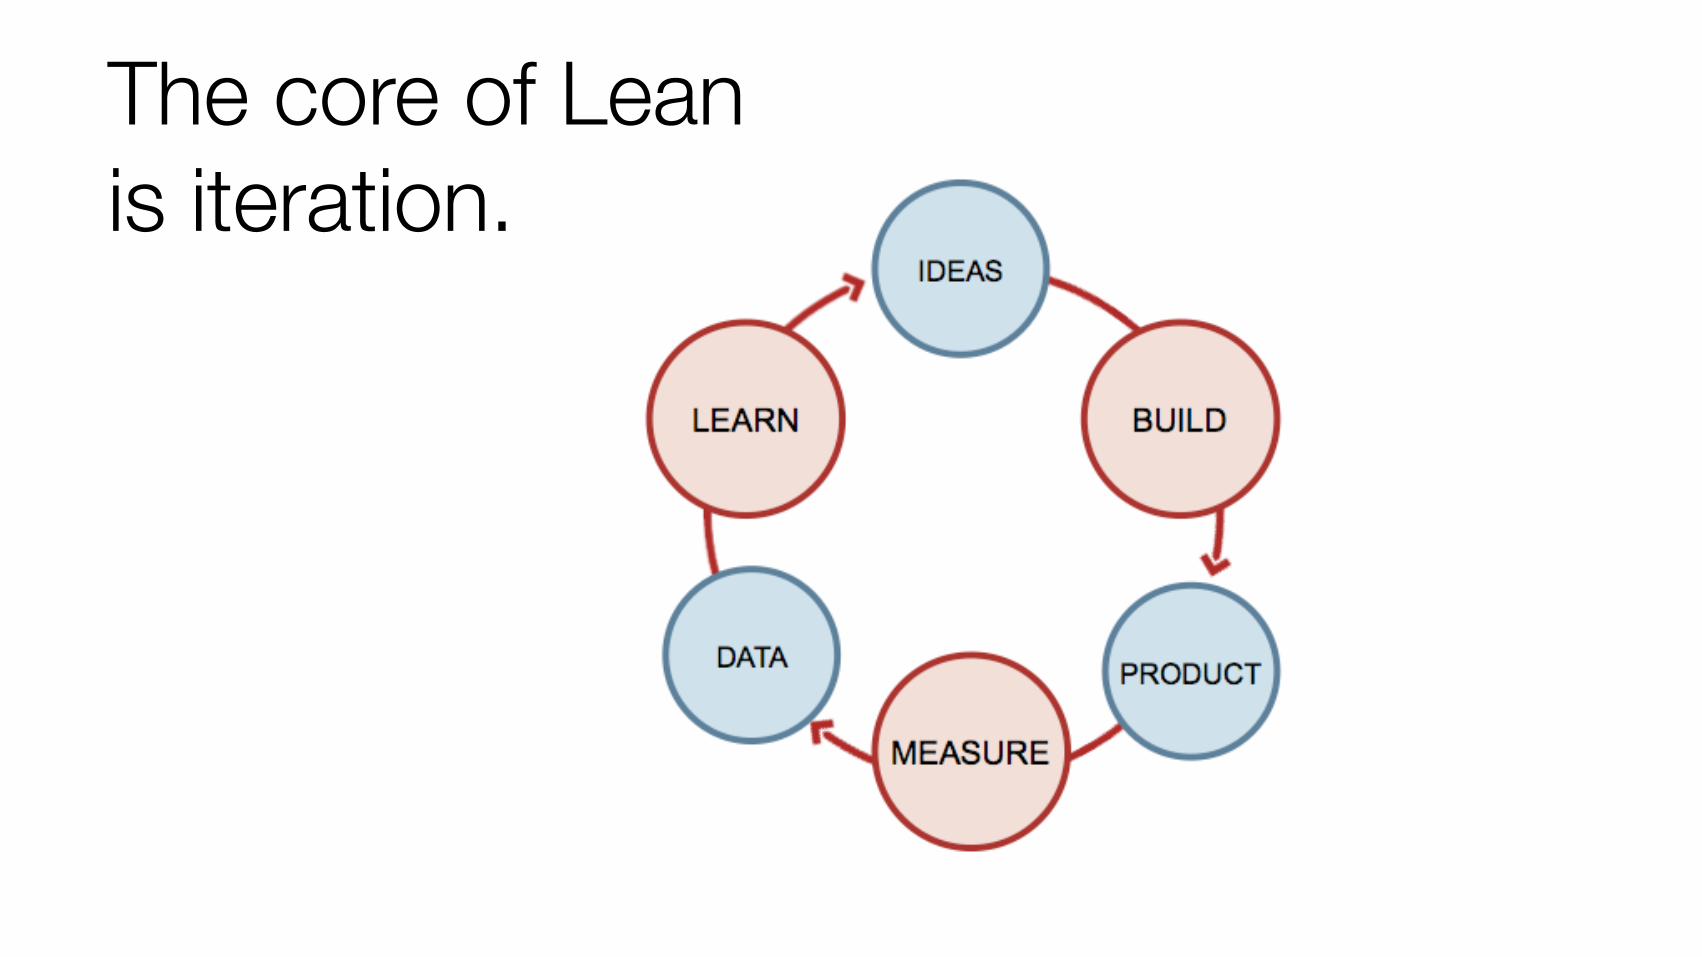
The core of Lean is iteration.

Most startups don’t know what they’ll be when they grow up.
Hotmailwas a database company
Flickrwas going to be an MMO
Twitter was a podcasting company
Autodesk made desktop automation
Paypalfirst built for Palmpilots
Freshbookswas invoicing for a web design firm
Wikipedia was to be written by experts only
Mitelwas a lawnmower company
Waterfall, agile, and lean(Why the old ways don’t work.)
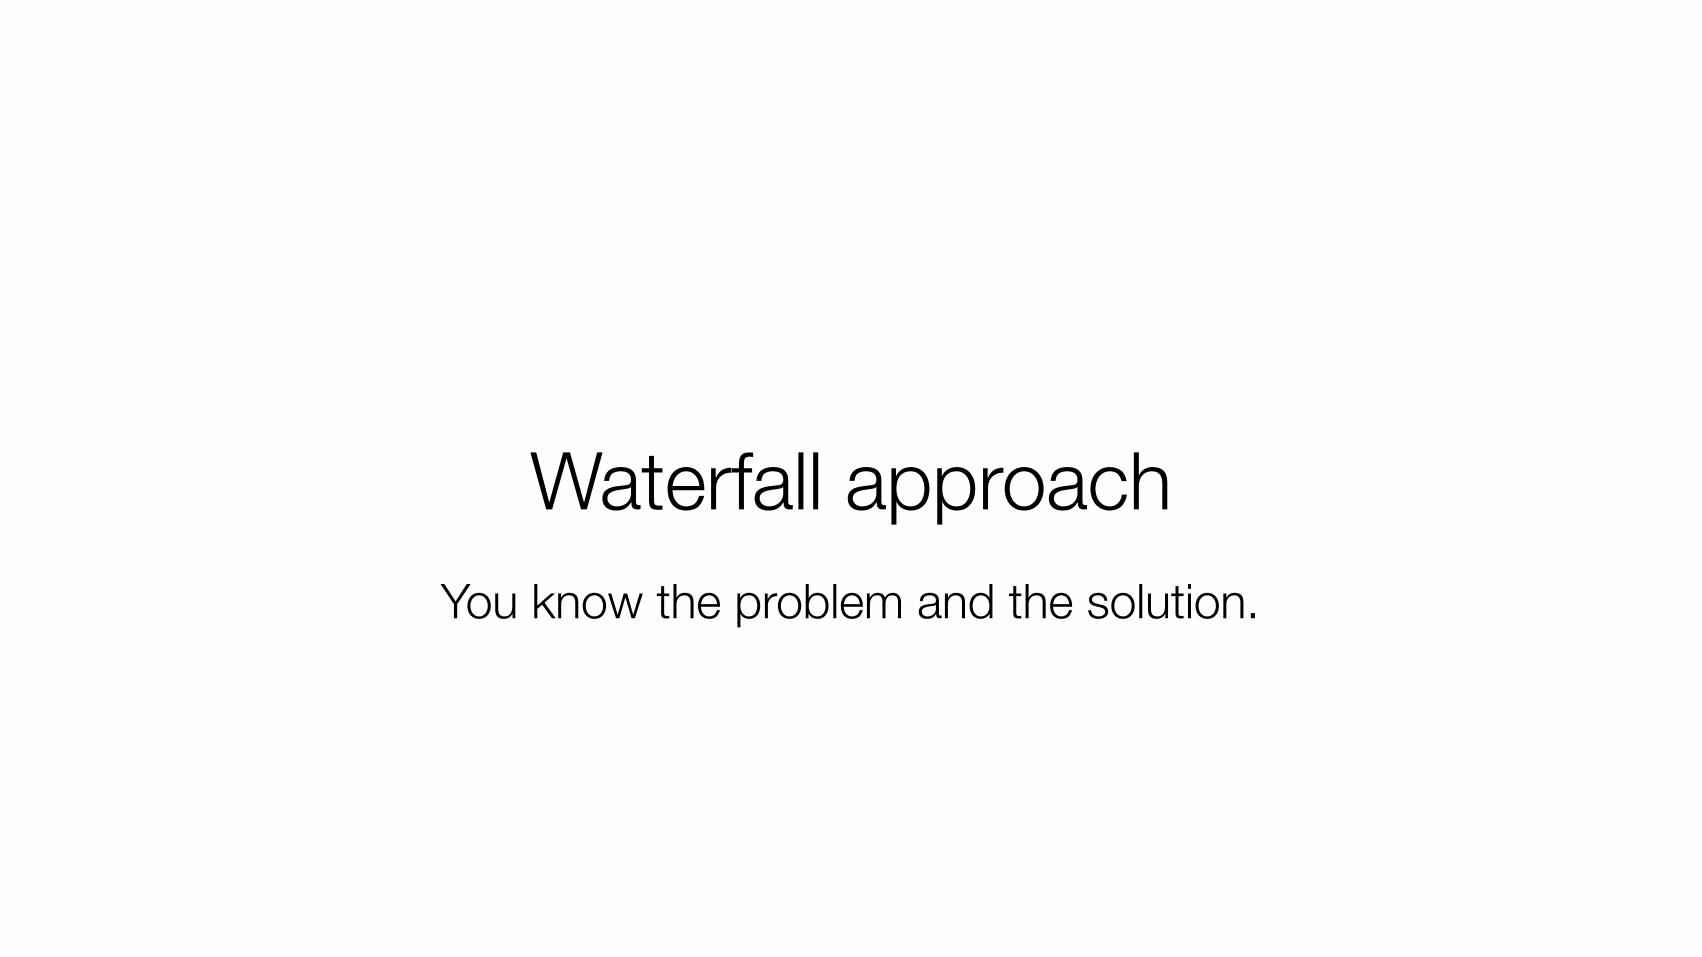
Waterfall approachYou know the problem and the solution.


Known set of requirements
Known ways to satisfy them
Spec Build Test Launch
Agile methodologies
Know the problem, find the solution

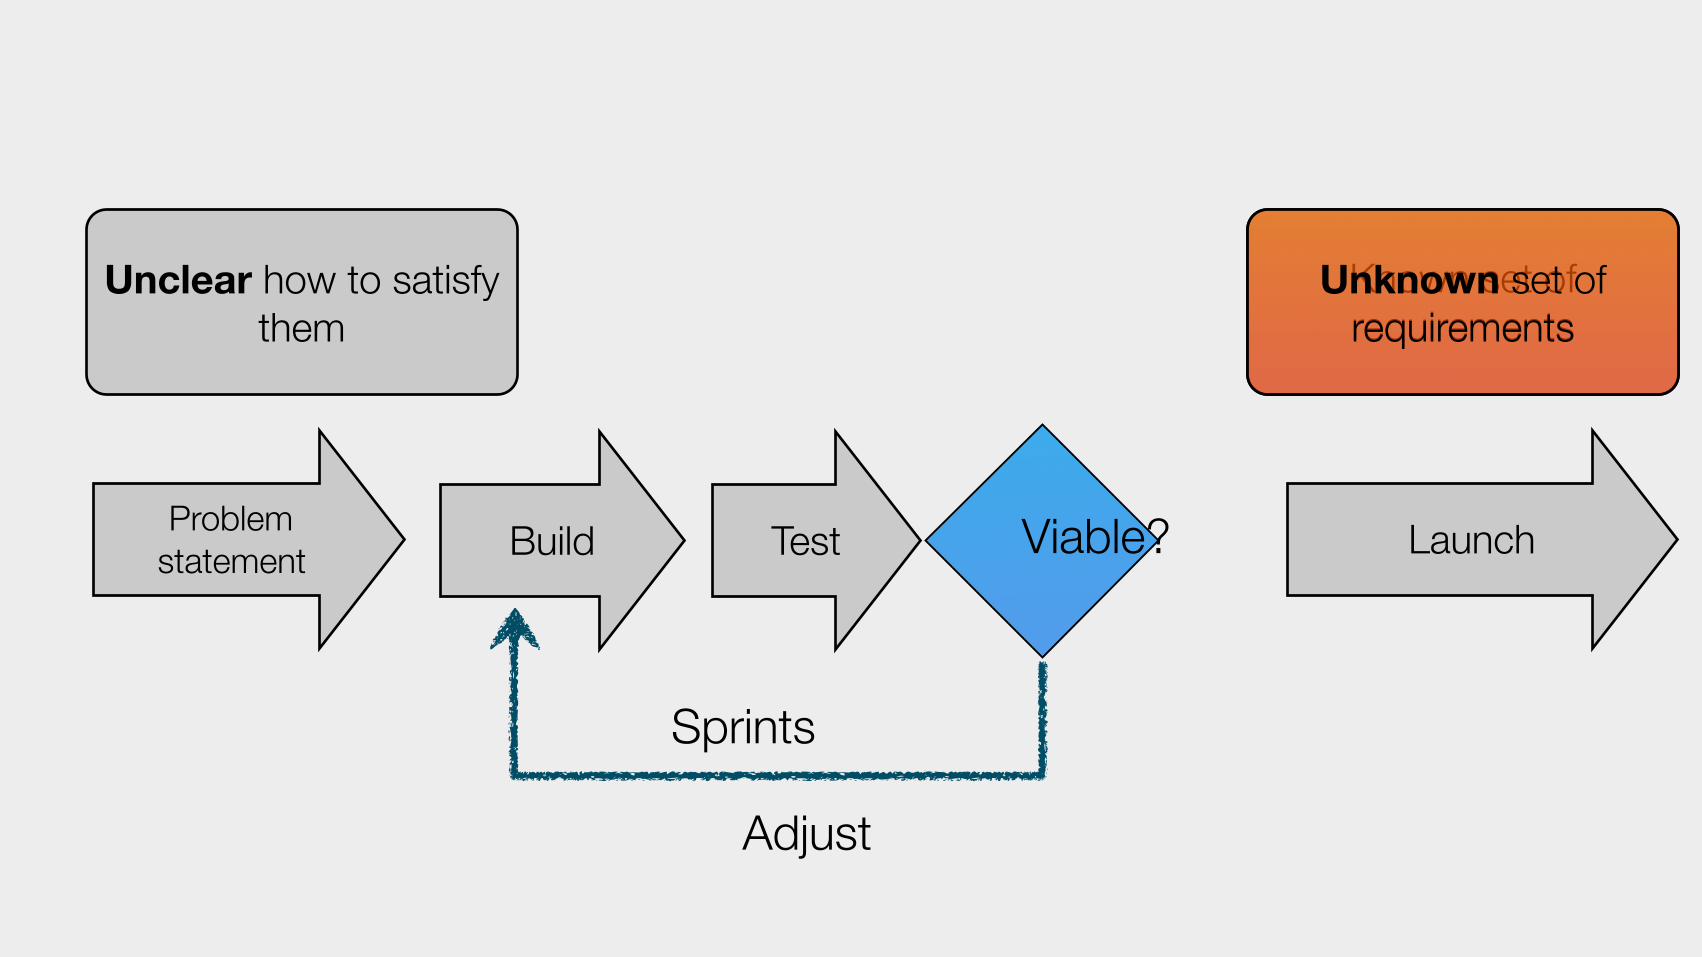
Known set of requirements
Unclear how to satisfy them
Build Test LaunchViable?Problemstatement
Adjust
Sprints
Unknown set of requirements

Lean approach
First, know that you don’t know.

Possible problem space
Product/market
hypothesisTrial startup
Product/market
hypothesisTrial startup
Product/market hypothesis
Trial startup
Product/market hypothesis
Trial startup
You are herePIV
OT

Why now?
First: High rate of change of digital technologies & channels.
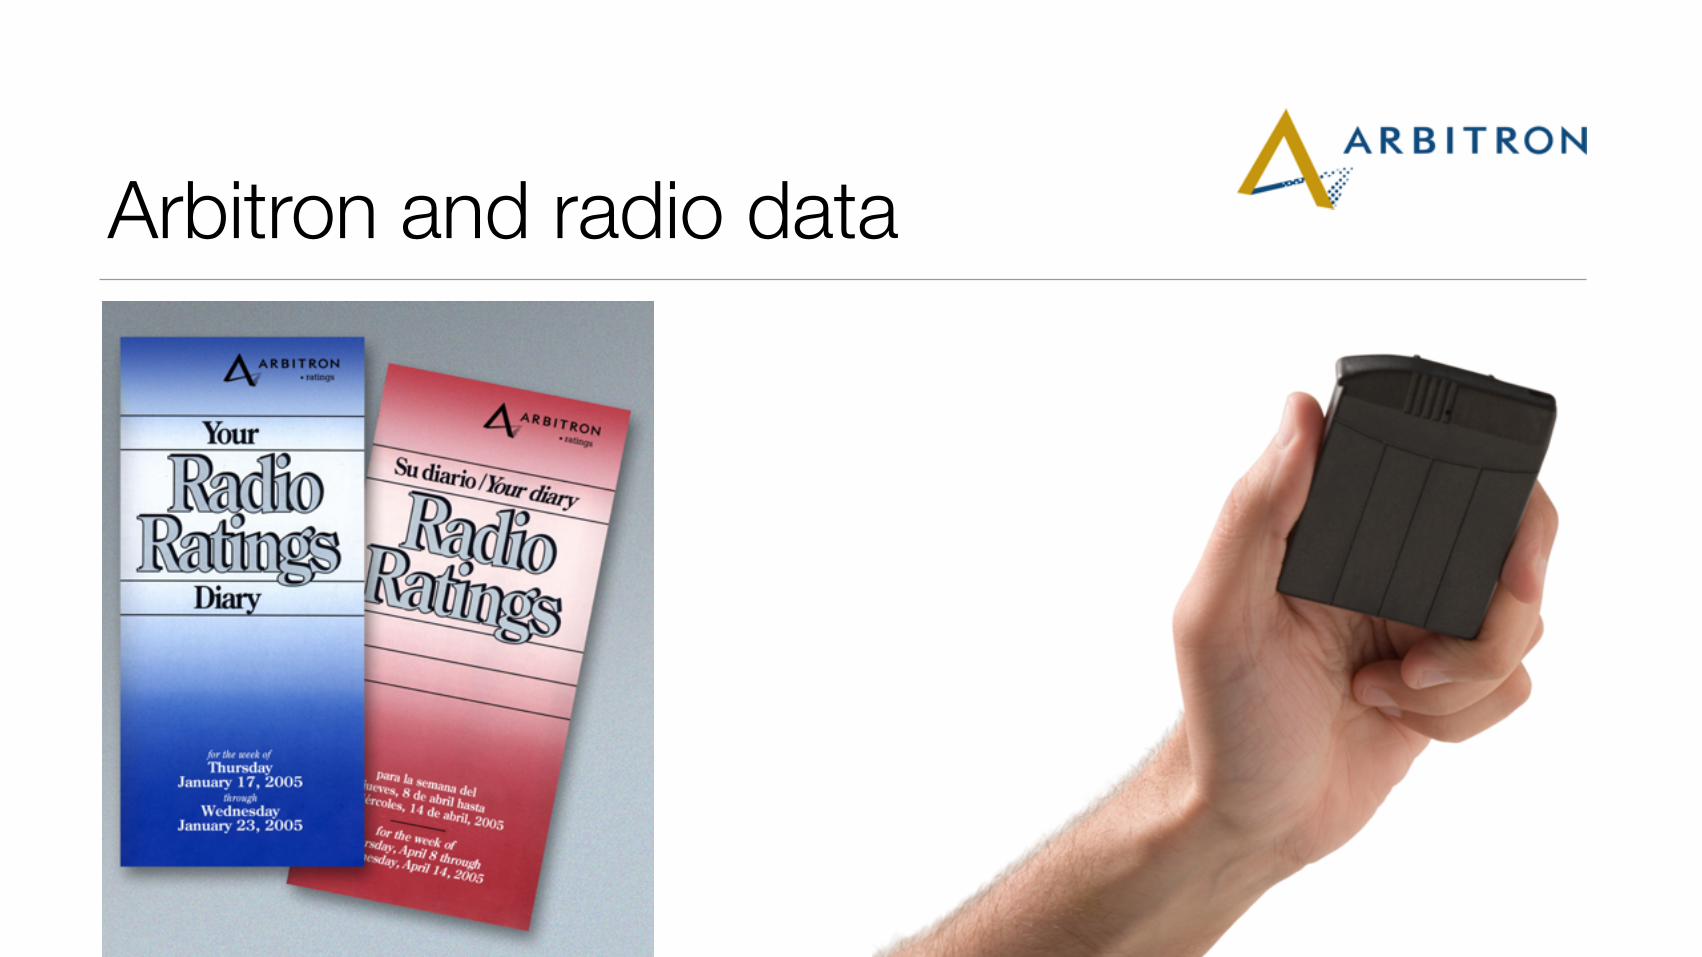
Arbitron and radio data
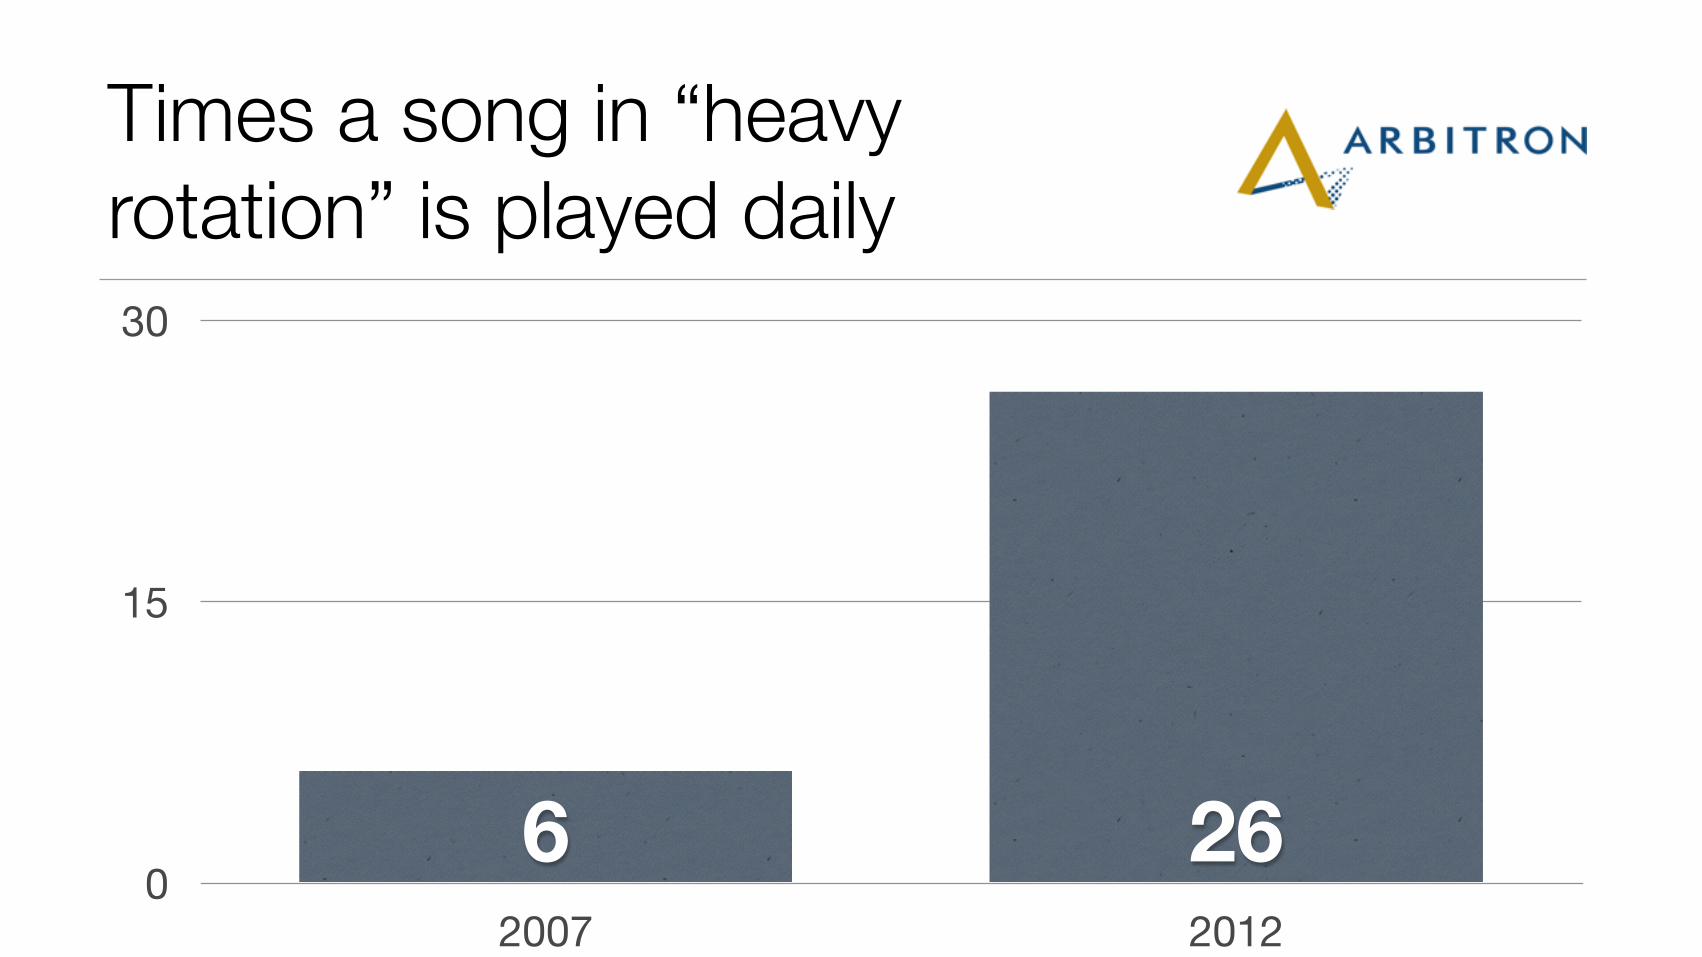
Times a song in “heavy rotation” is played daily
0
15
30
2007 2012
266

Why now?
Second: It’s no longer about whether you can build it—it’s about whether
anyone will care.

The Attention Economy“What information consumes is rather obvious: it consumes the attention of its recipients.
Hence a wealth of information creates a poverty of attention, and a need to allocate that attention efficiently among the overabundance of information sources that might consume it.”
(Computers, Communications and the Public Interest, pages 40-41, Martin Greenberger, ed., The Johns Hopkins Press, 1971.)Herbert Simon

Lit motors tests the risky part

Unfortunately, it is hard to be honest with ourselves.
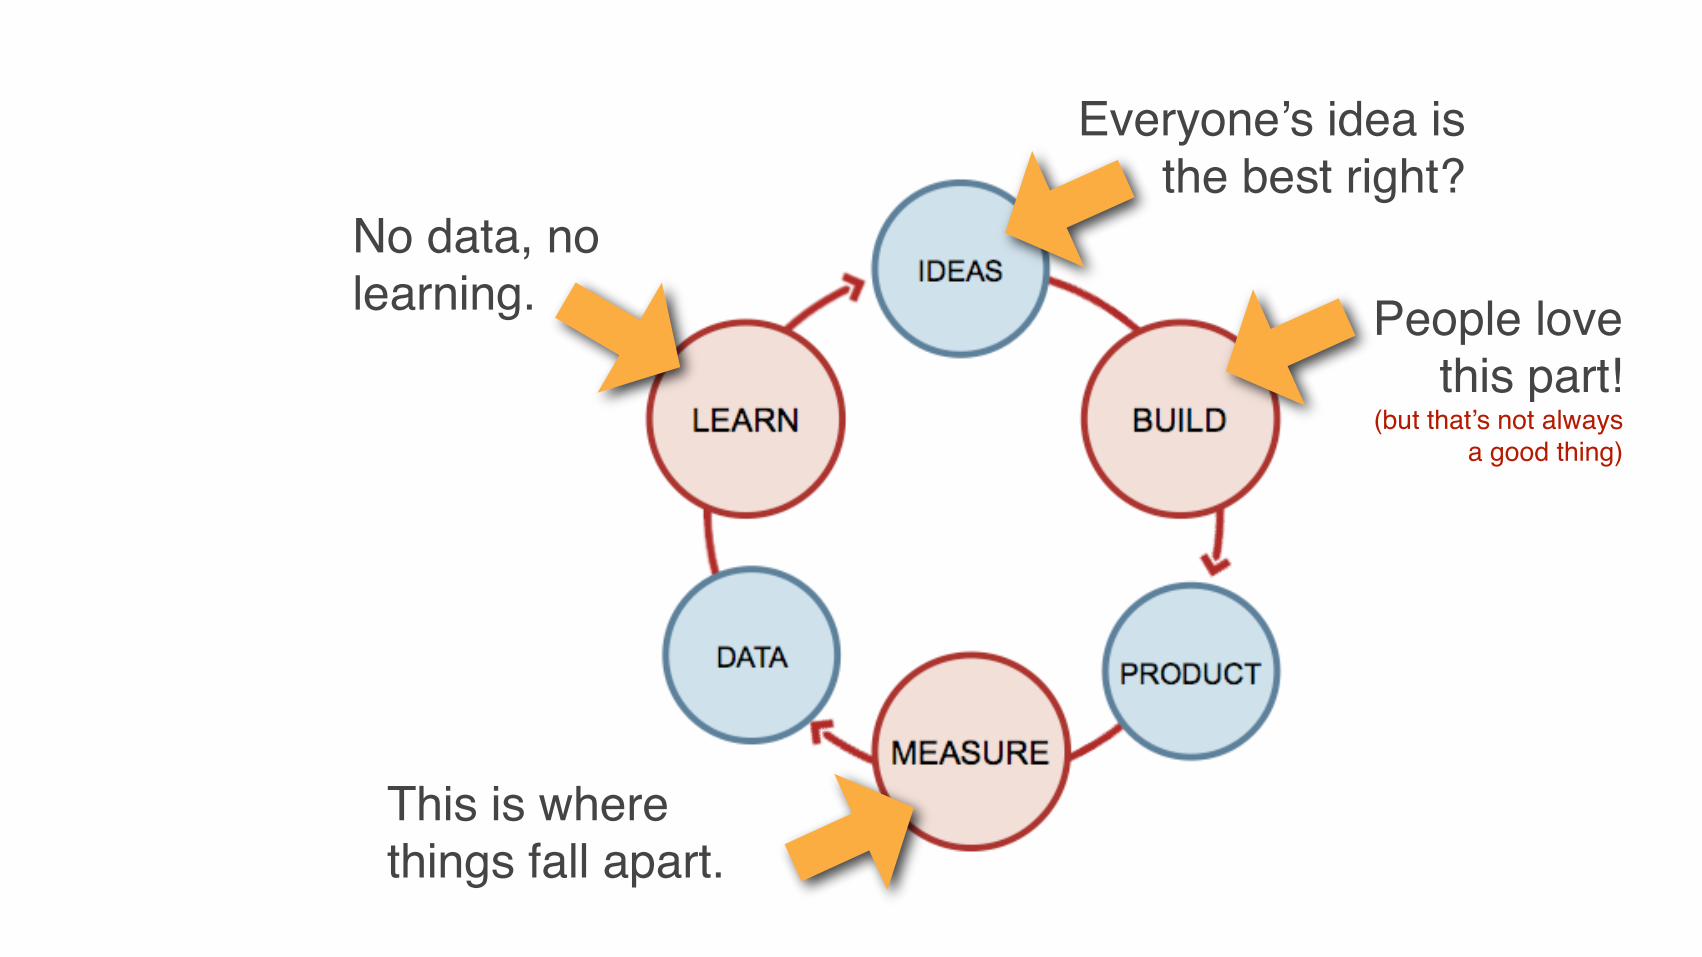
Everyone’s idea is the best right?
People love this part!
(but that’s not always a good thing)
This is where things fall apart.
No data, no learning.

Analytics can help.

Analytics is the measurement of movement towards your business
goals.

In a startup, the purpose of analytics is to iterate to product/market fit
before the money runs out.

Some fundamentals.

A good metric is:
Understandable
If you’re busy explaining the data, you won’t be busy acting on it.
Comparative
Comparison is context.
A ratio or rate
The only way to measure change and roll up the tension between two metrics (MPH)
Behaviorchanging
What will you do differently based on the results you collect?
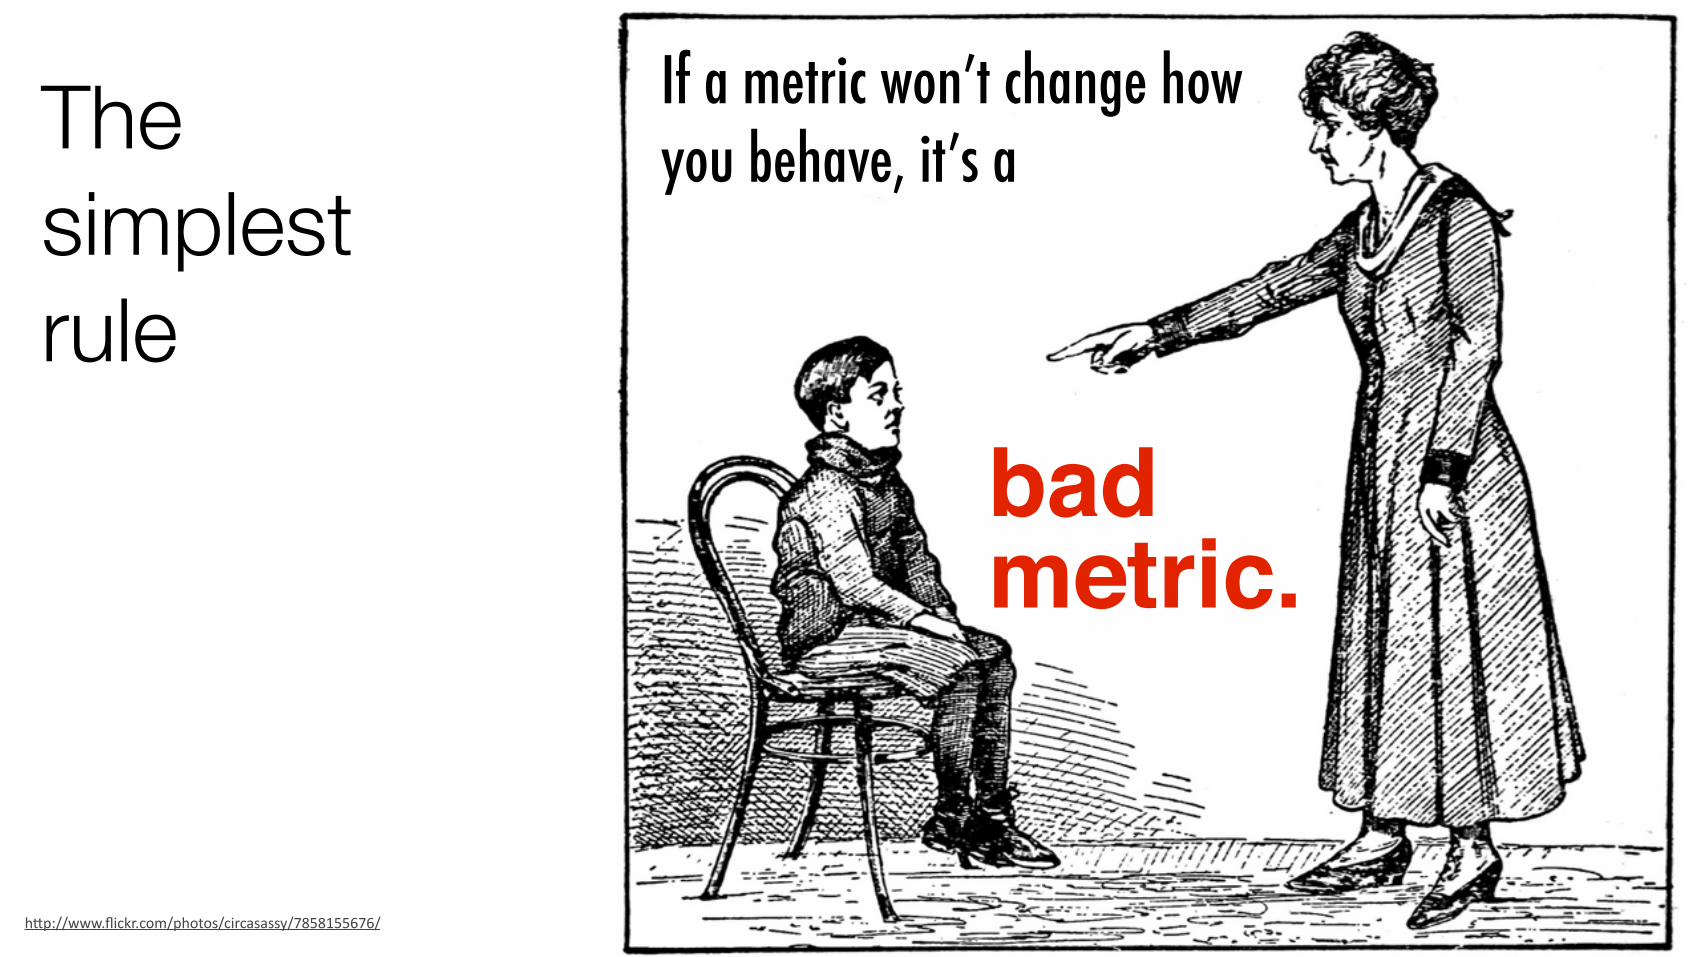
The simplest rule
badmetric.
If a metric won’t change how you behave, it’s a
h"p://www.flickr.com/photos/circasassy/7858155676/
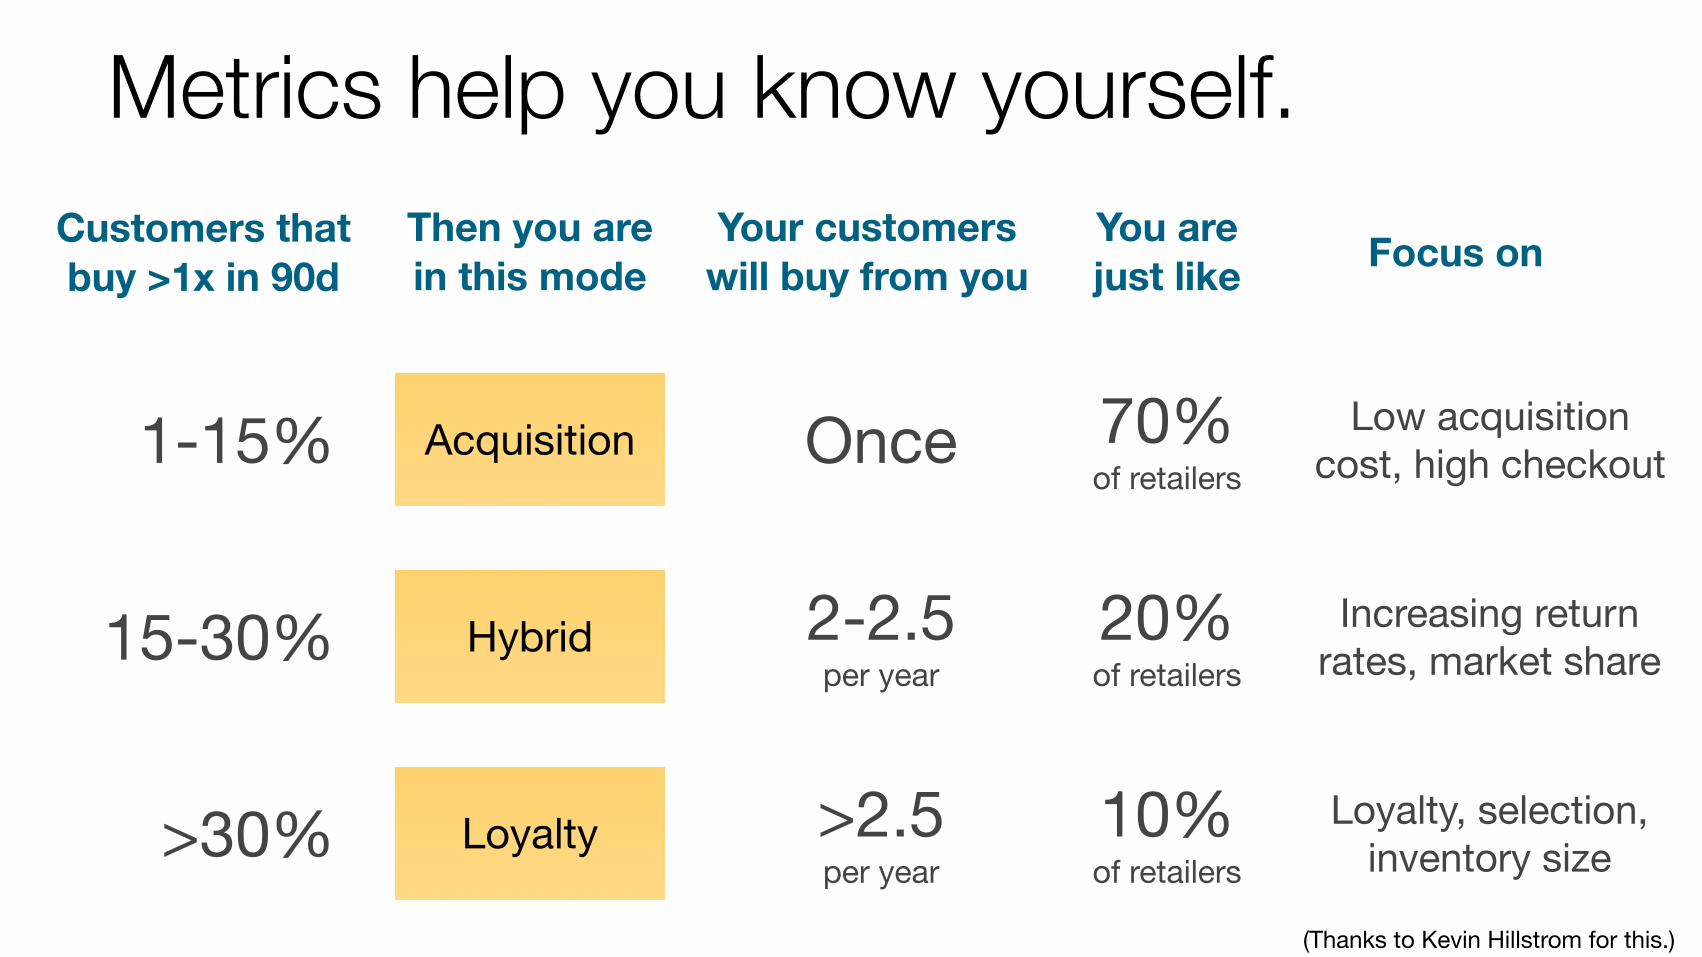
Metrics help you know yourself.
Acquisition
Hybrid
Loyalty
70%of retailers
20%of retailers
10%of retailers
You are just like
Customers that buy >1x in 90d
Once
2-2.5per year
>2.5per year
Your customers will buy from you
Then you are in this mode
1-15%
15-30%
>30%
Low acquisition cost, high checkout
Increasing return rates, market share
Loyalty, selection, inventory size
Focus on
(Thanks to Kevin Hillstrom for this.)
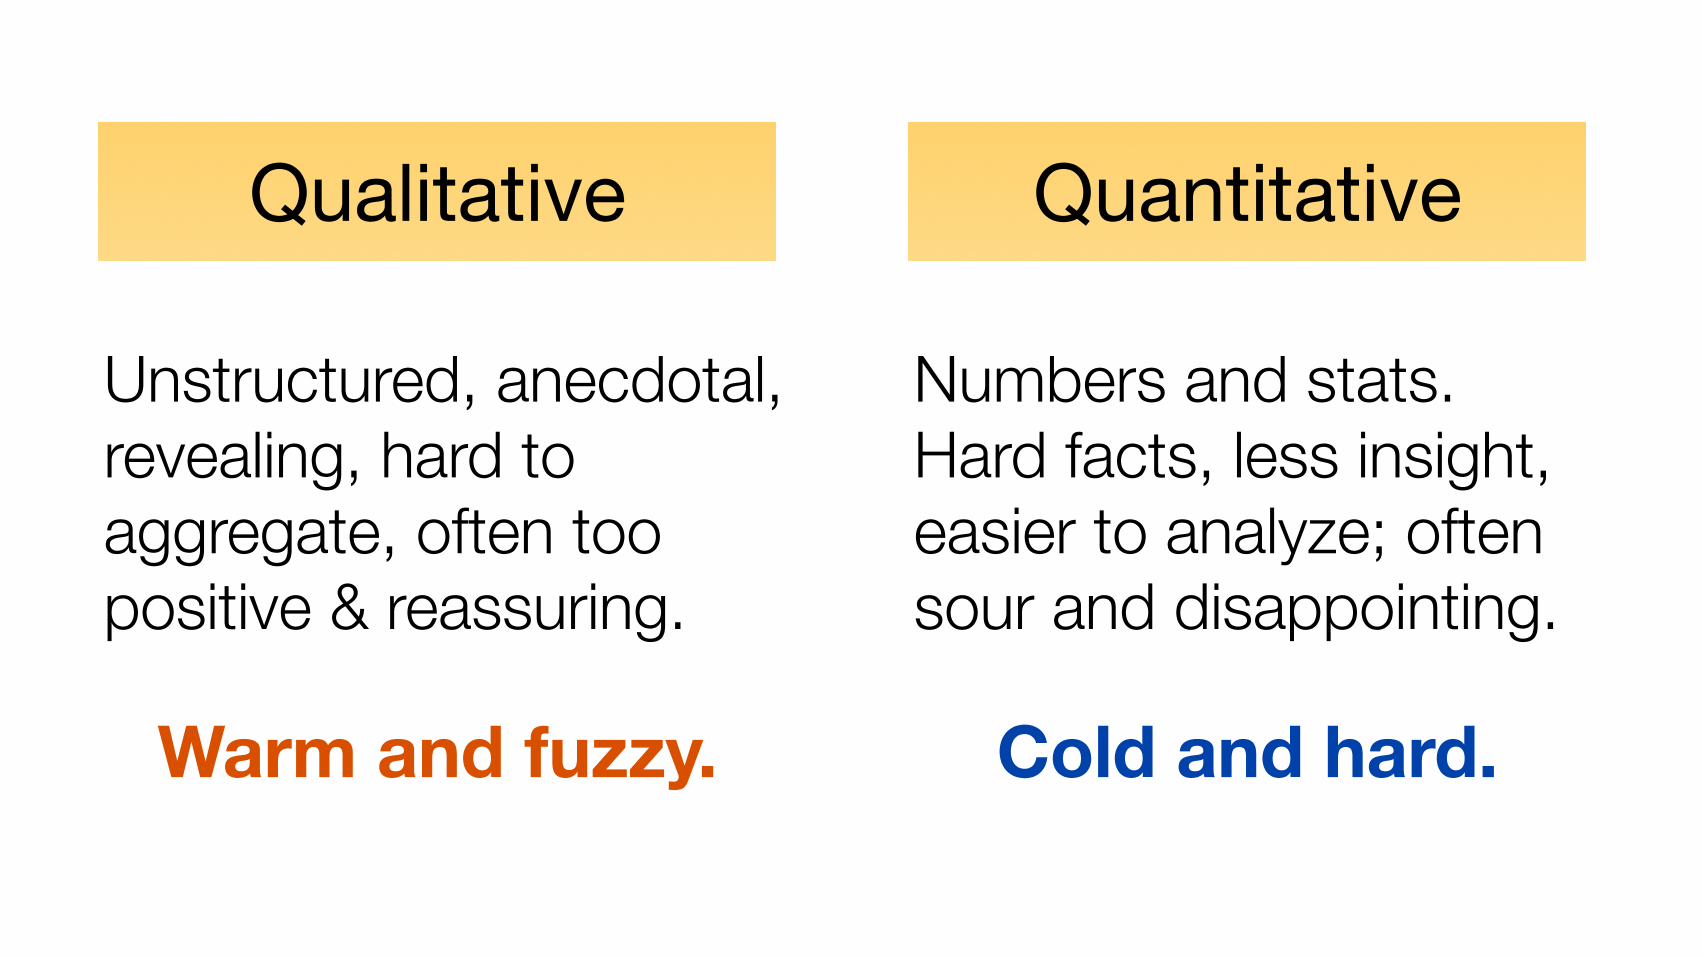
Qualitative
Unstructured, anecdotal, revealing, hard to aggregate, often too positive & reassuring.
Warm and fuzzy.
Quantitative
Numbers and stats. Hard facts, less insight, easier to analyze; often sour and disappointing.
Cold and hard.

Exploratory
Speculative. Tries to find unexpected or interesting insights. Source of unfair advantages.
Cool.
Reporting
Predictable. Keeps you abreast of the normal, day-to-day operations. Can be managed by exception.
Necessary.

Rumsfeld on Analytics
(Or rather, Avinash Kaushik channeling Rumsfeld)
Things we
know
don’tknow
we know Are facts which may be wrong and should be checked against data.
we don’tknow
Are questions we can answer by reporting, which we should baseline & automate.
we knowAre intuition which we should quantify and teach to improve effectiveness, efficiency.
we don’tknow
Are exploration which is where unfair advantage and interesting epiphanies live.

MayAprMarFeb
Slicing and dicing data
Jan
0
5,000
Activ
e use
rs
Cohort: Comparison of similar groups along a timeline. (this is the April cohort)
A/B test: Changing one thing (i.e. color) and measuring the result (i.e. revenue.)
Multivariateanalysis Changing several things at once to see which correlates with a result.
☀☁☀☁
Segment: Cross-sectional
comparison of all people divided by
some attribute (age, gender, etc.)
☀
☁
Which of these two companies is doing better?
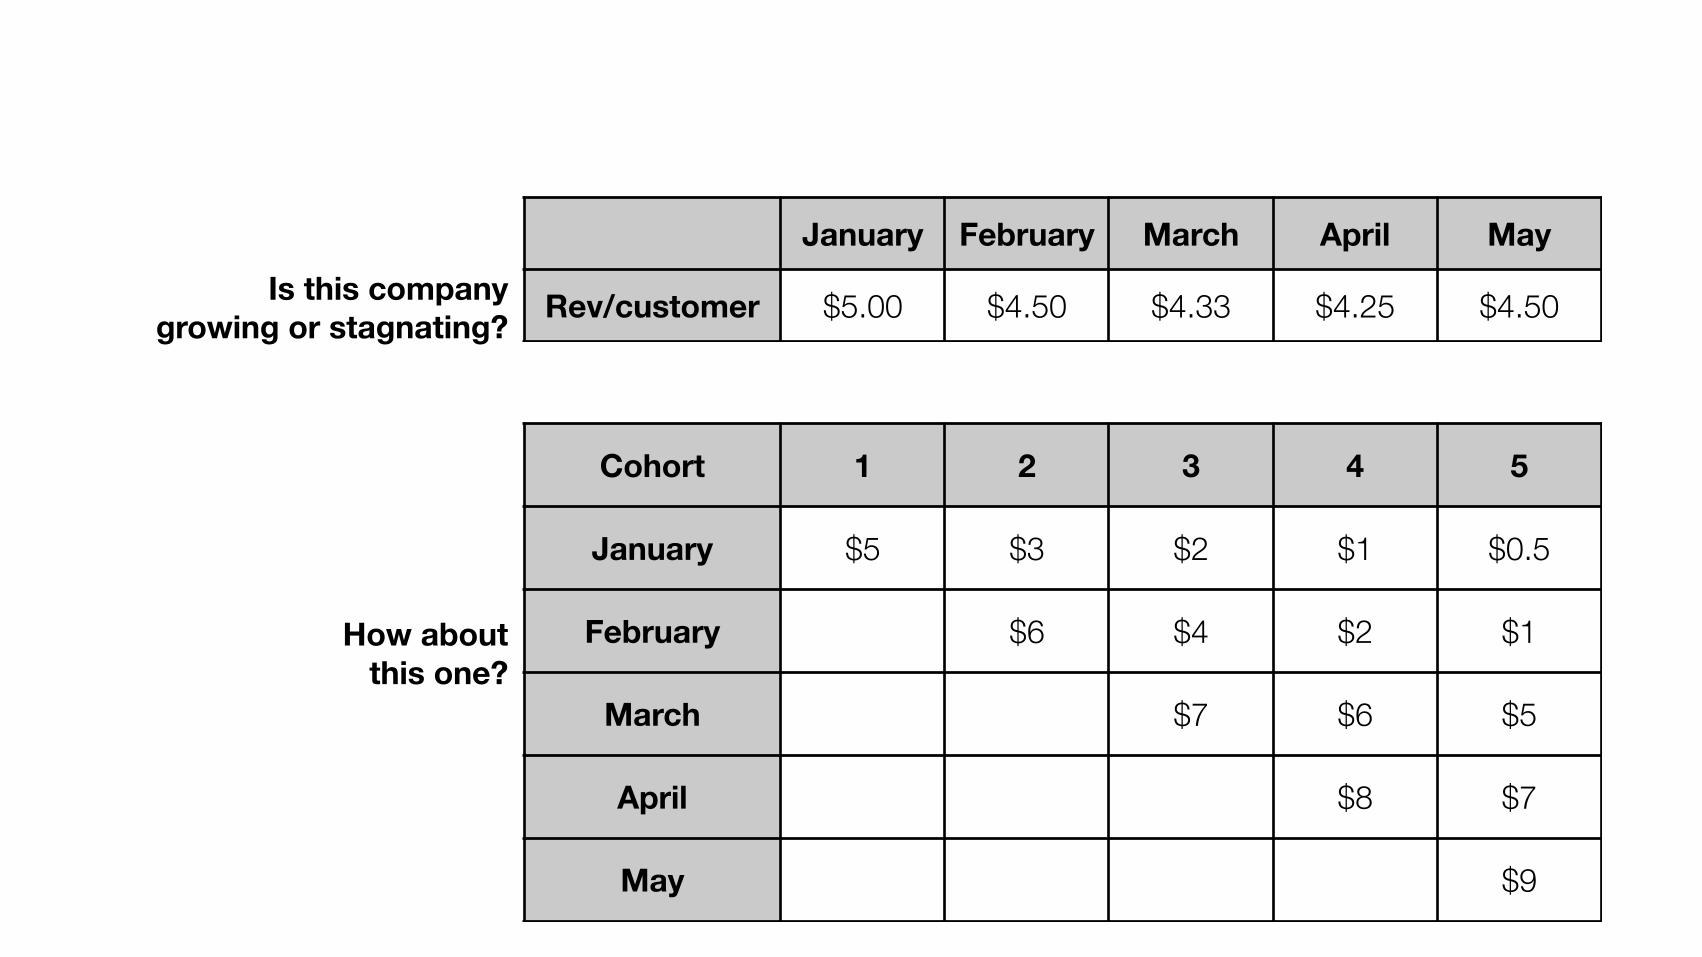
January February March April May
Rev/customer $5.00 $4.50 $4.33 $4.25 $4.50Is this company growing or stagnating?
Cohort 1 2 3 4 5
January $5 $3 $2 $1 $0.5
February $6 $4 $2 $1
March $7 $6 $5
April $8 $7
May $9
How about this one?
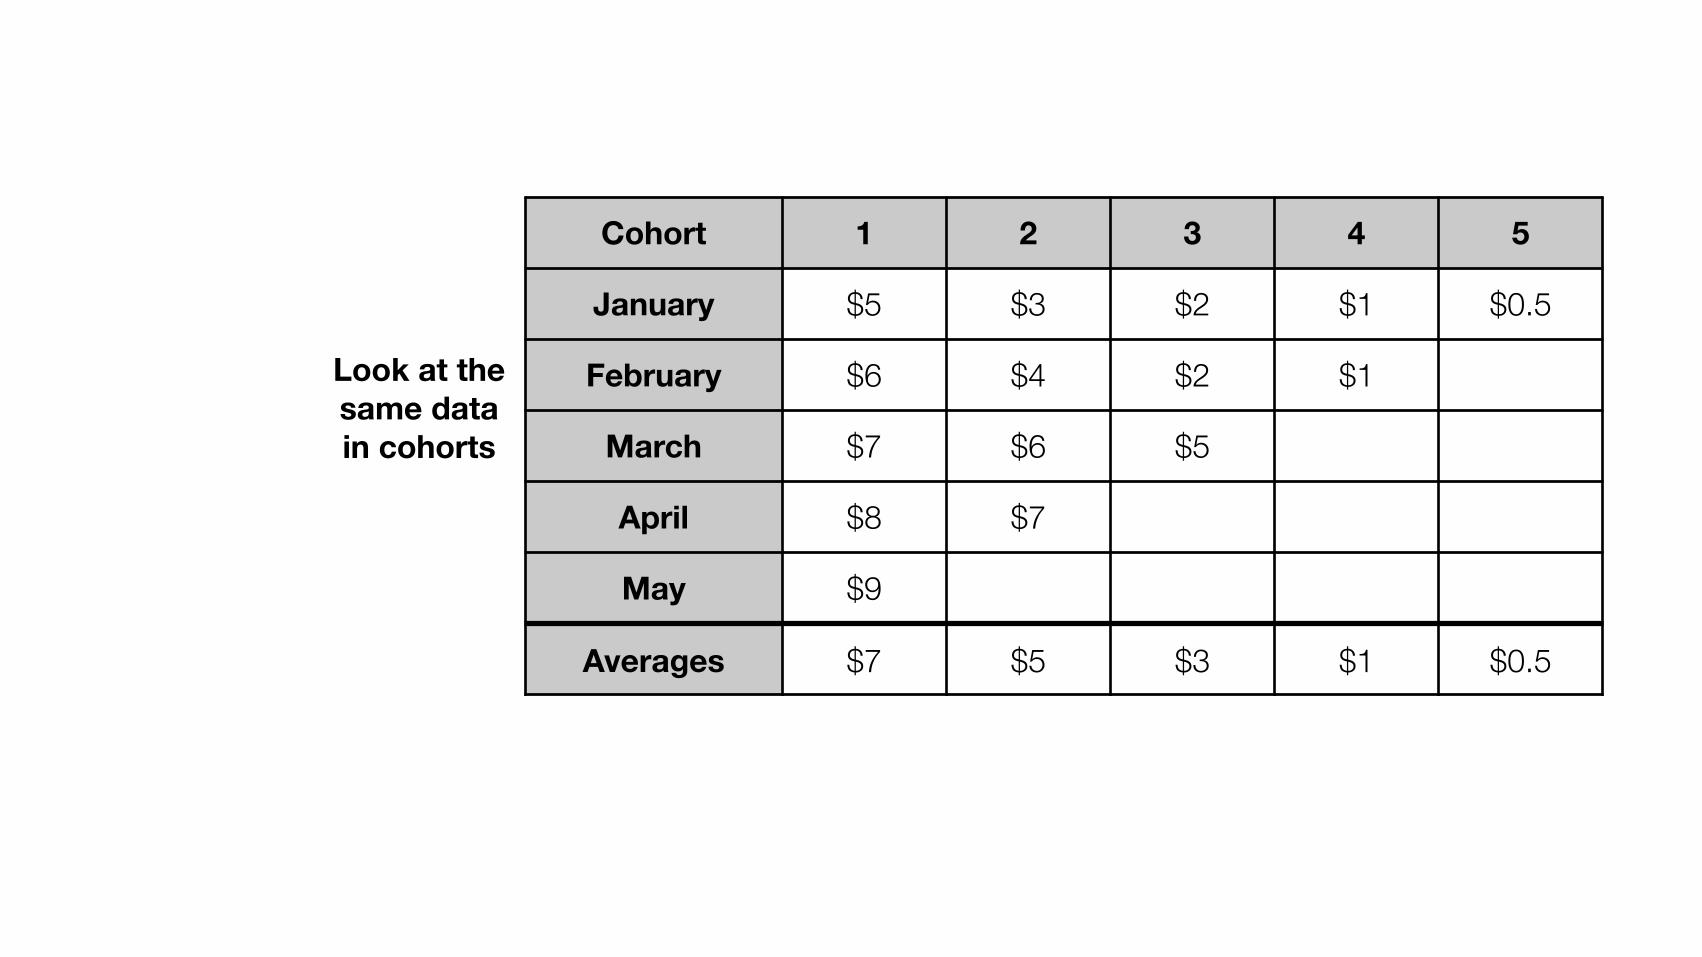
Cohort 1 2 3 4 5
January $5 $3 $2 $1 $0.5
February $6 $4 $2 $1
March $7 $6 $5
April $8 $7
May $9
Averages $7 $5 $3 $1 $0.5
Look at the same data in cohorts
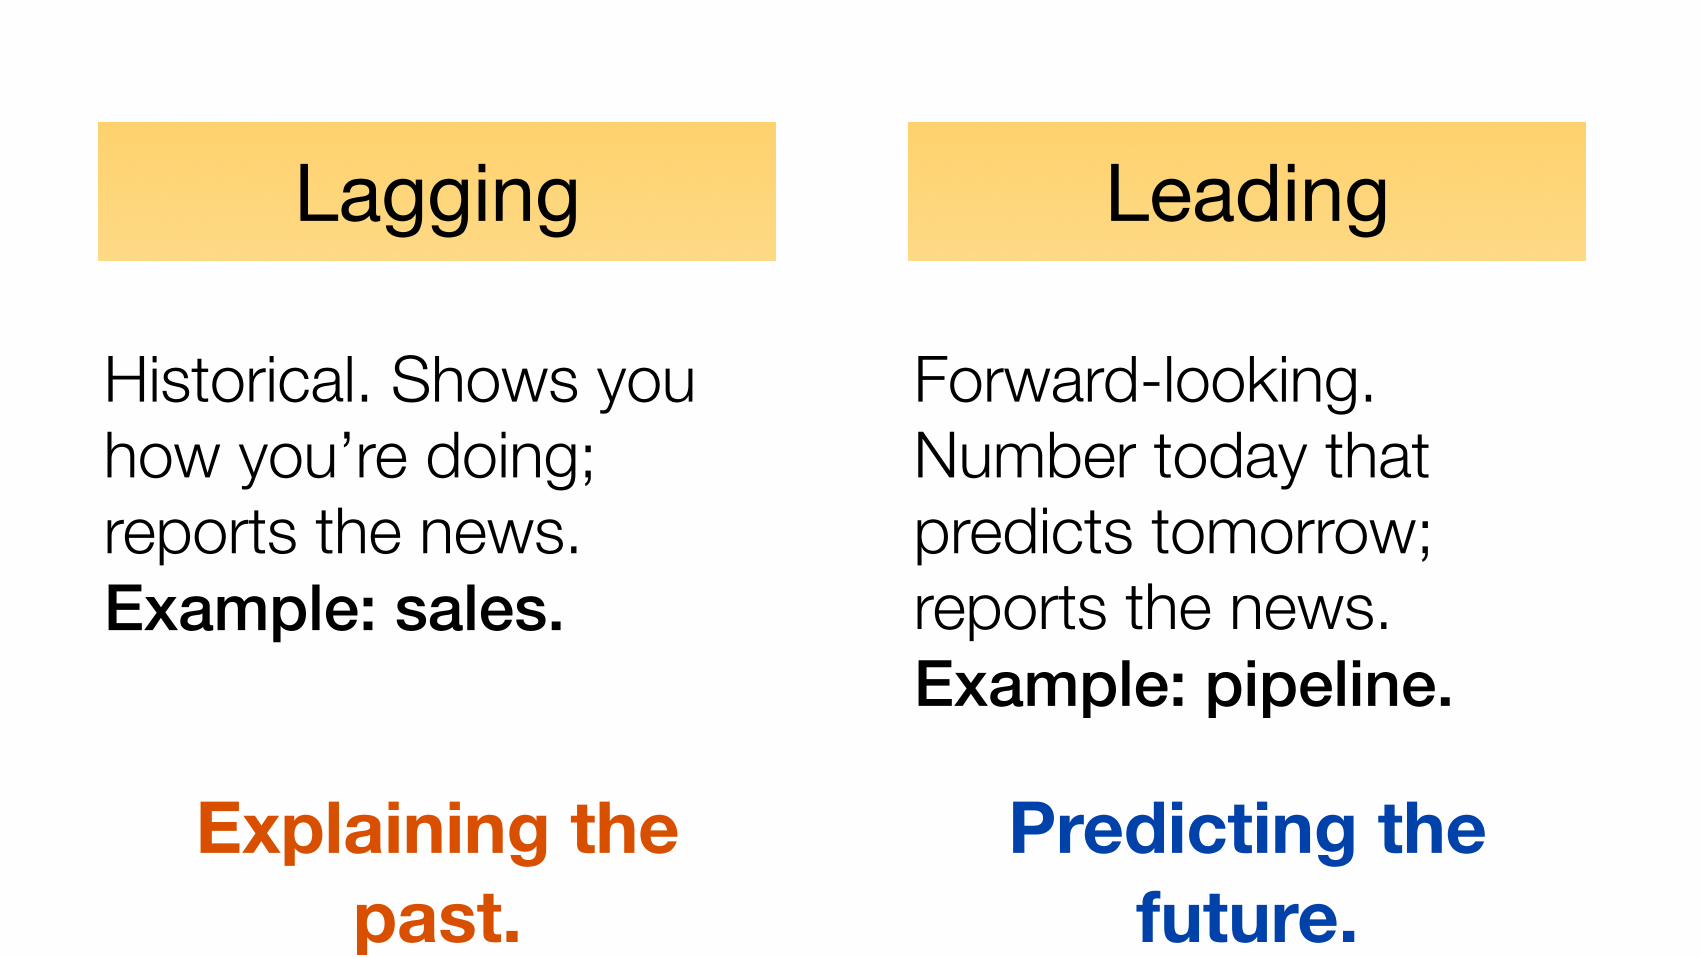
Lagging
Historical. Shows you how you’re doing; reports the news. Example: sales.
Explaining the past.
Leading
Forward-looking. Number today that predicts tomorrow; reports the news. Example: pipeline.
Predicting the future.
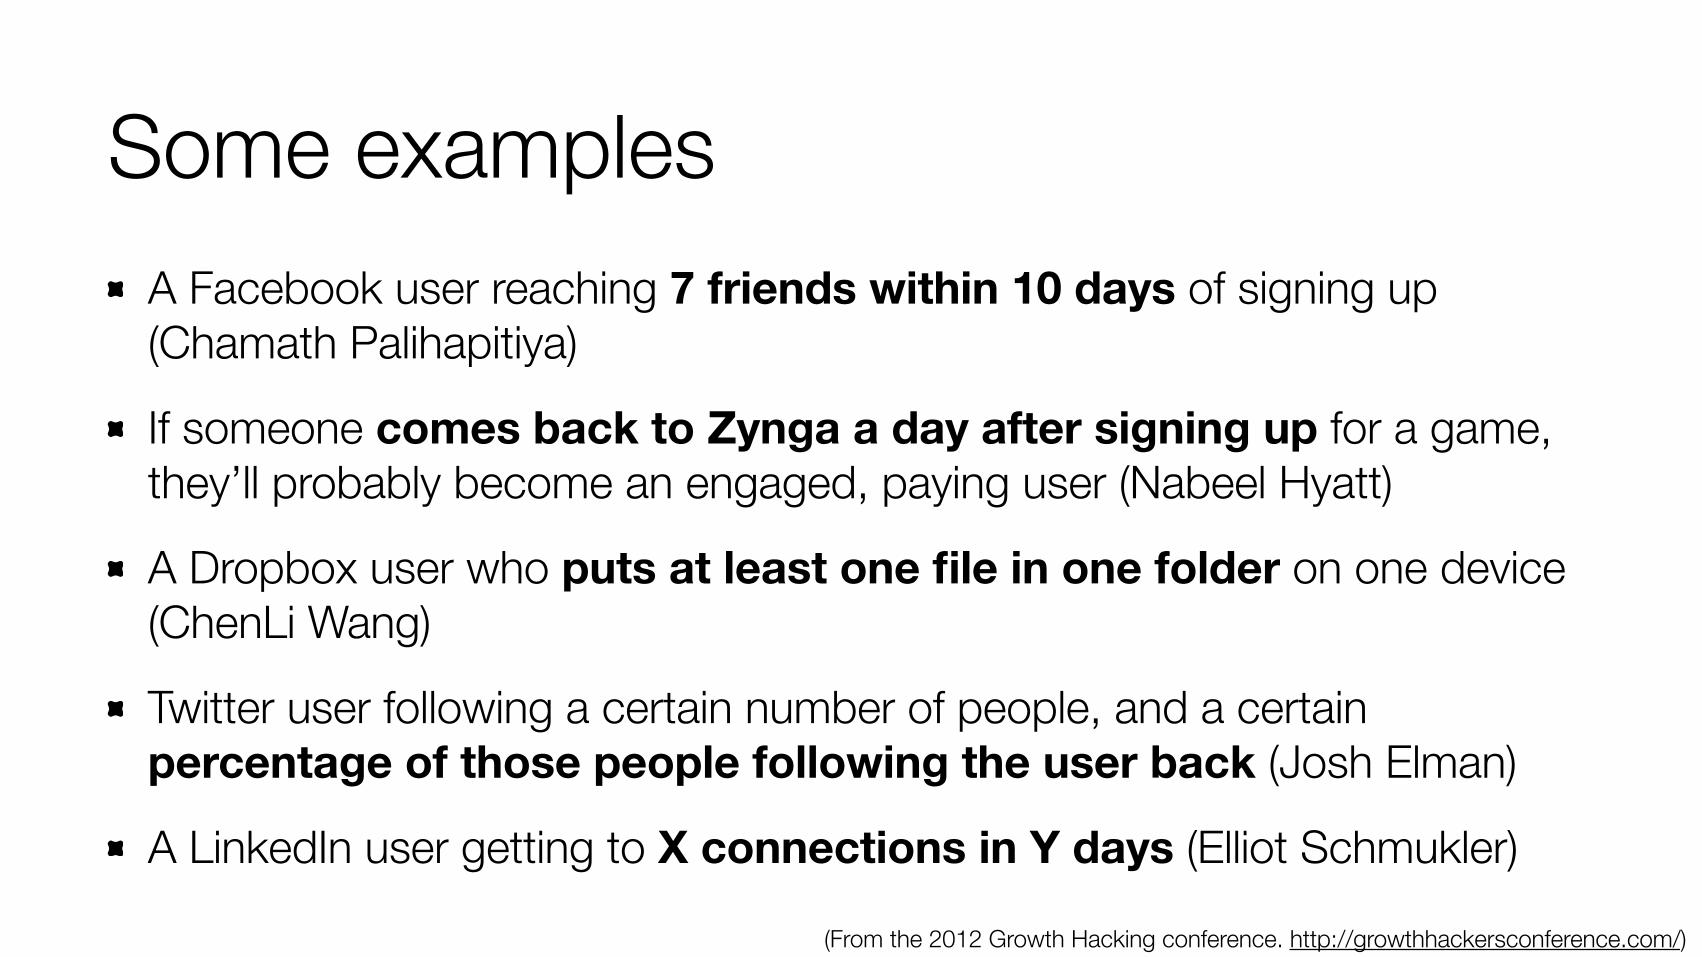
A Facebook user reaching 7 friends within 10 days of signing up (Chamath Palihapitiya)
If someone comes back to Zynga a day after signing up for a game, they’ll probably become an engaged, paying user (Nabeel Hyatt)
A Dropbox user who puts at least one file in one folder on one device (ChenLi Wang)
Twitter user following a certain number of people, and a certain percentage of those people following the user back (Josh Elman)
A LinkedIn user getting to X connections in Y days (Elliot Schmukler)
Some examples
(From the 2012 Growth Hacking conference. http://growthhackersconference.com/)
Which means it’s time to talk about correlation.
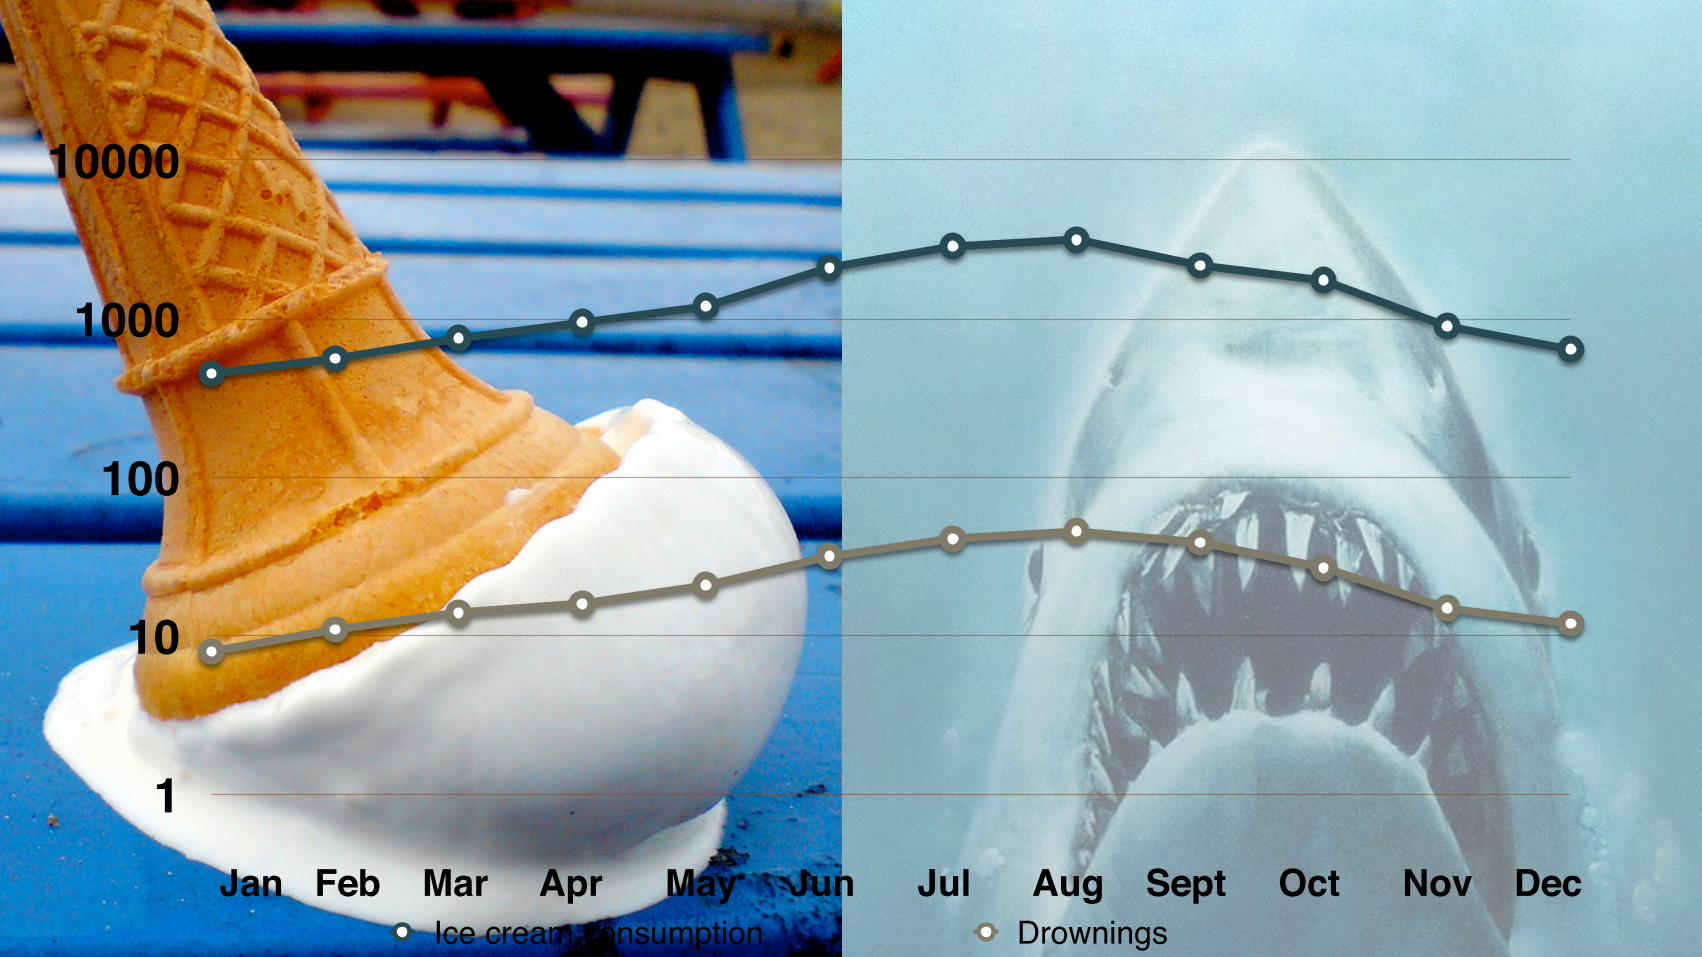
1
10
100
1000
10000
Ice cream consumption DrowningsJan Feb Mar Apr May Jun Jul Aug Sept Oct Nov Dec

Correlated
Two variables that are related (but may be dependent on something else.)
Ice cream & drowning.
Causal
An independent variable that directly impacts a dependent one.
Summertime & drowning.
A leading, causal metric is a superpower.
h"p://www.flickr.com/photos/bloke_with_camera/401812833/sizes/o/in/photostream/

Why is Nigerian spam so badly written?
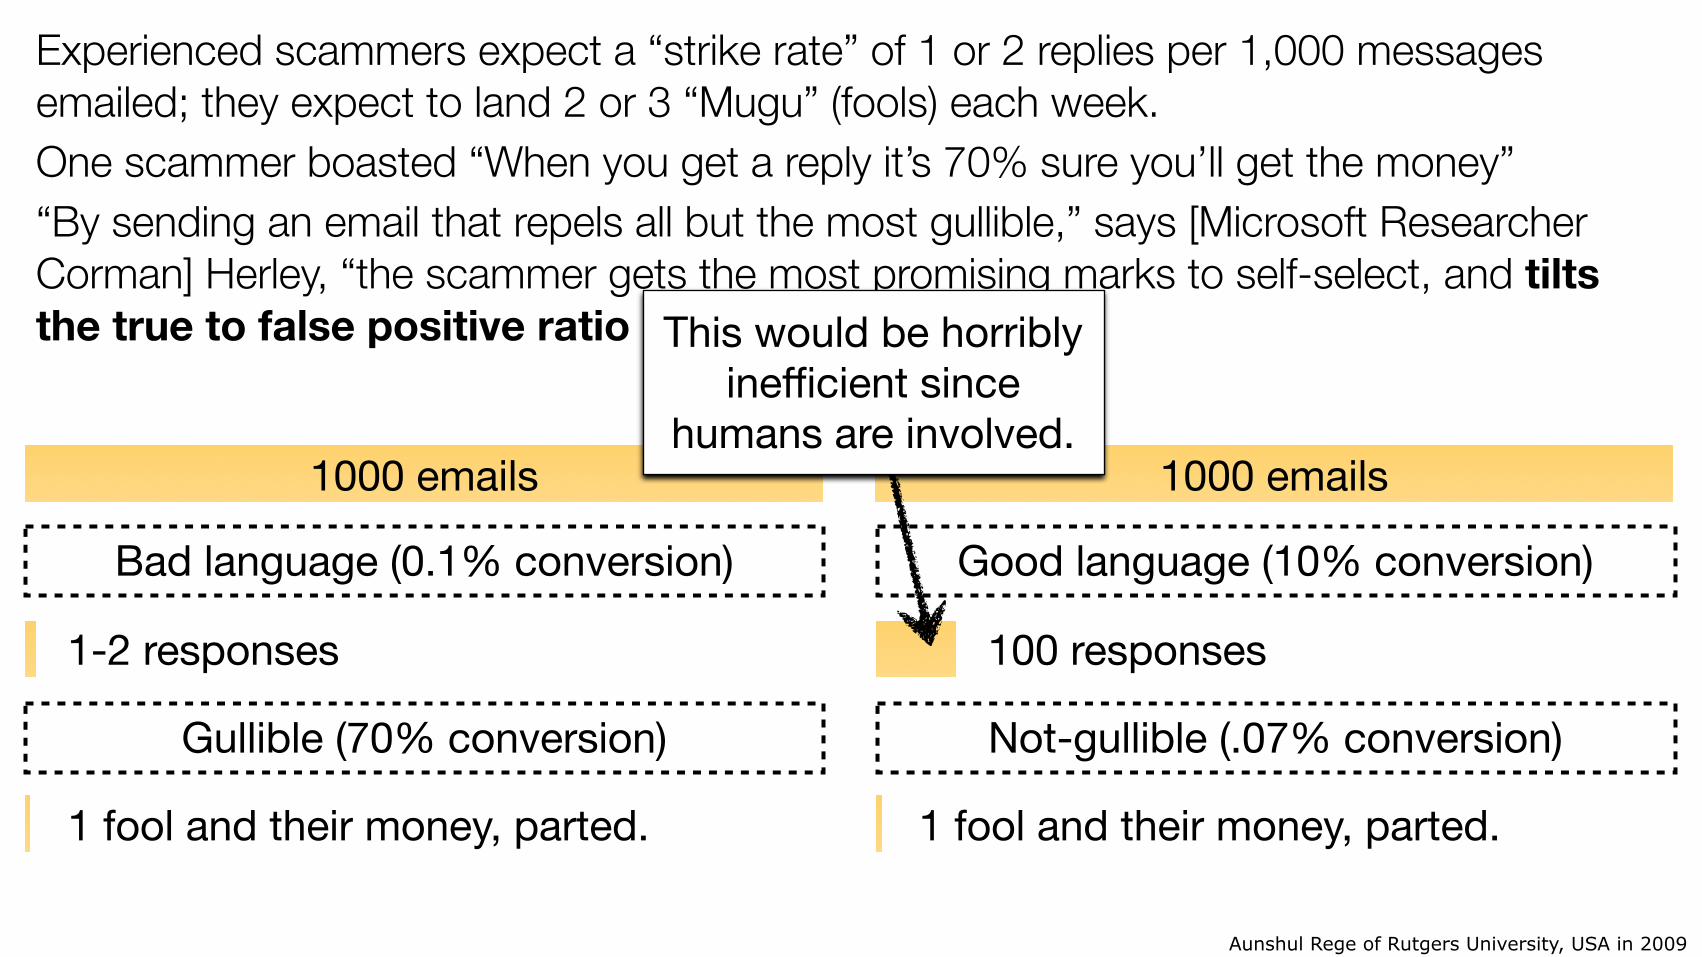
Aunshul Rege of Rutgers University, USA in 2009
Experienced scammers expect a “strike rate” of 1 or 2 replies per 1,000 messages emailed; they expect to land 2 or 3 “Mugu” (fools) each week. One scammer boasted “When you get a reply it’s 70% sure you’ll get the money” “By sending an email that repels all but the most gullible,” says [Microsoft Researcher Corman] Herley, “the scammer gets the most promising marks to self-select, and tilts the true to false positive ratio in his favor.”
1000 emails
1-2 responses
1 fool and their money, parted.
Bad language (0.1% conversion)
Gullible (70% conversion)
1000 emails
100 responses
1 fool and their money, parted.
Good language (10% conversion)
Not-gullible (.07% conversion)
This would be horribly inefficient since
humans are involved.

Turns out the word “Nigeria” is the best way to identify promising prospects.

Nigerian spammers really understand their target market.
They see past vanity metrics.

The Lean Analytics framework.
Sustainable growth comes through the actions of your customers.
- Eric Ries
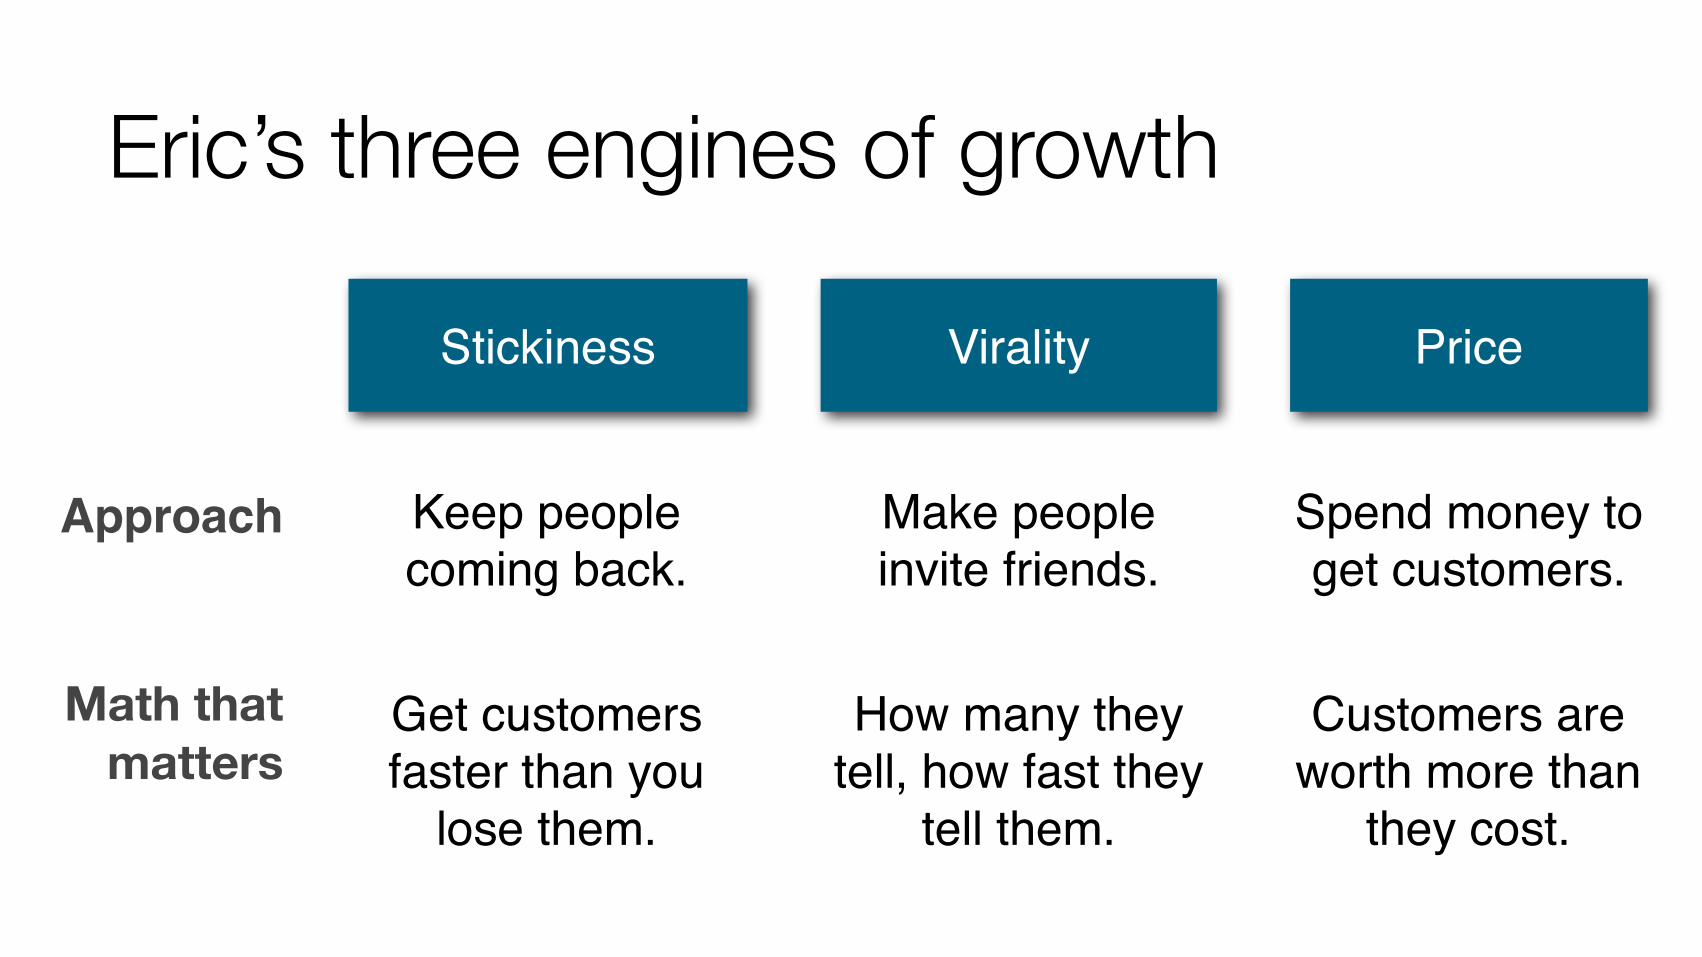
Eric’s three engines of growth
Virality
Make people invite friends.
How many they tell, how fast they
tell them.
Price
Spend money to get customers.
Customers are worth more than
they cost.
Stickiness
Keep people coming back.
Approach
Get customers faster than you
lose them.
Math that matters

Dave’s Pirate MetricsAARRR
AcquisitionHow do your users become aware of you?
SEO, SEM, widgets, email, PR, campaigns, blogs ...
ActivationDo drive-by visitors subscribe, use, etc?
Features, design, tone, compensation, affirmation ...
RetentionDoes a one-time user become engaged?
Notifications, alerts, reminders, emails, updates...
RevenueDo you make money from user activity?
Transactions, clicks, subscriptions, DLC, analytics...
ReferralDo users promote your product?
Email, widgets, campaigns, likes, RTs, affiliates...
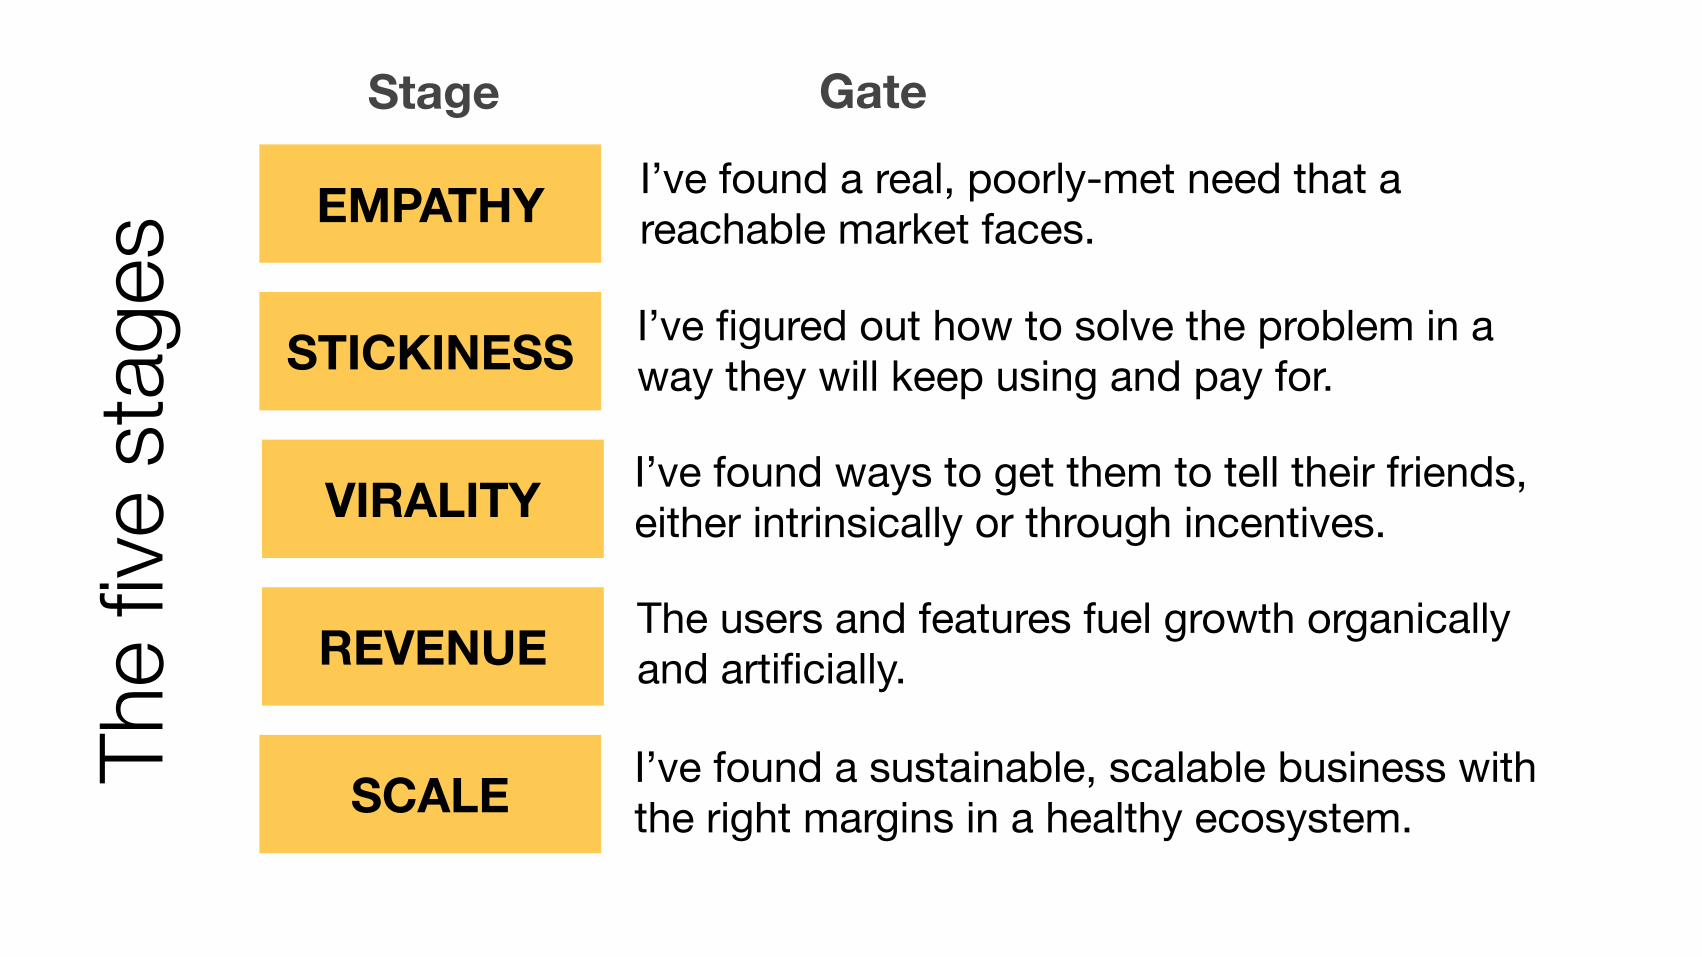
Stage
EMPATHY I’ve found a real, poorly-met need that a reachable market faces.
STICKINESS I’ve figured out how to solve the problem in a way they will keep using and pay for.
VIRALITY I’ve found ways to get them to tell their friends, either intrinsically or through incentives.
REVENUE The users and features fuel growth organically and artificially.
SCALE I’ve found a sustainable, scalable business with the right margins in a healthy ecosystem.
GateTh
e fiv
e st
ages

Empathy stage: Localmind hacks Twitter
Needed to find out if a core assumption—strangers answering questions—was valid. Ran Twitter experiment instead of writing code Asked senders of geolocated Tweets from Times Square random questions; counted response rate Conclusion: high enough to proceed

LikeBright’s mechanical turkUsed Mechanical Turk, Google Voice to speak w/100 single women; paid $2. The interviews lasted typically around 10-15 minutes. Simple interview script with open-ended questions, since he was digging into the problem validation stage of his startup. Founder Nick Soman: “I was amazed at the feedback I got. We were able to speak with one hundred single women that met our criteria in four hours on one evening.”
Went back to TechStars and got accepted. LikeBright’s website is now live with a 50% female user base, and recently raised a round of funding. “Since that first foray into interviewing customers, I’ve probably spoken with over a thousand people through Mechanical Turk,”
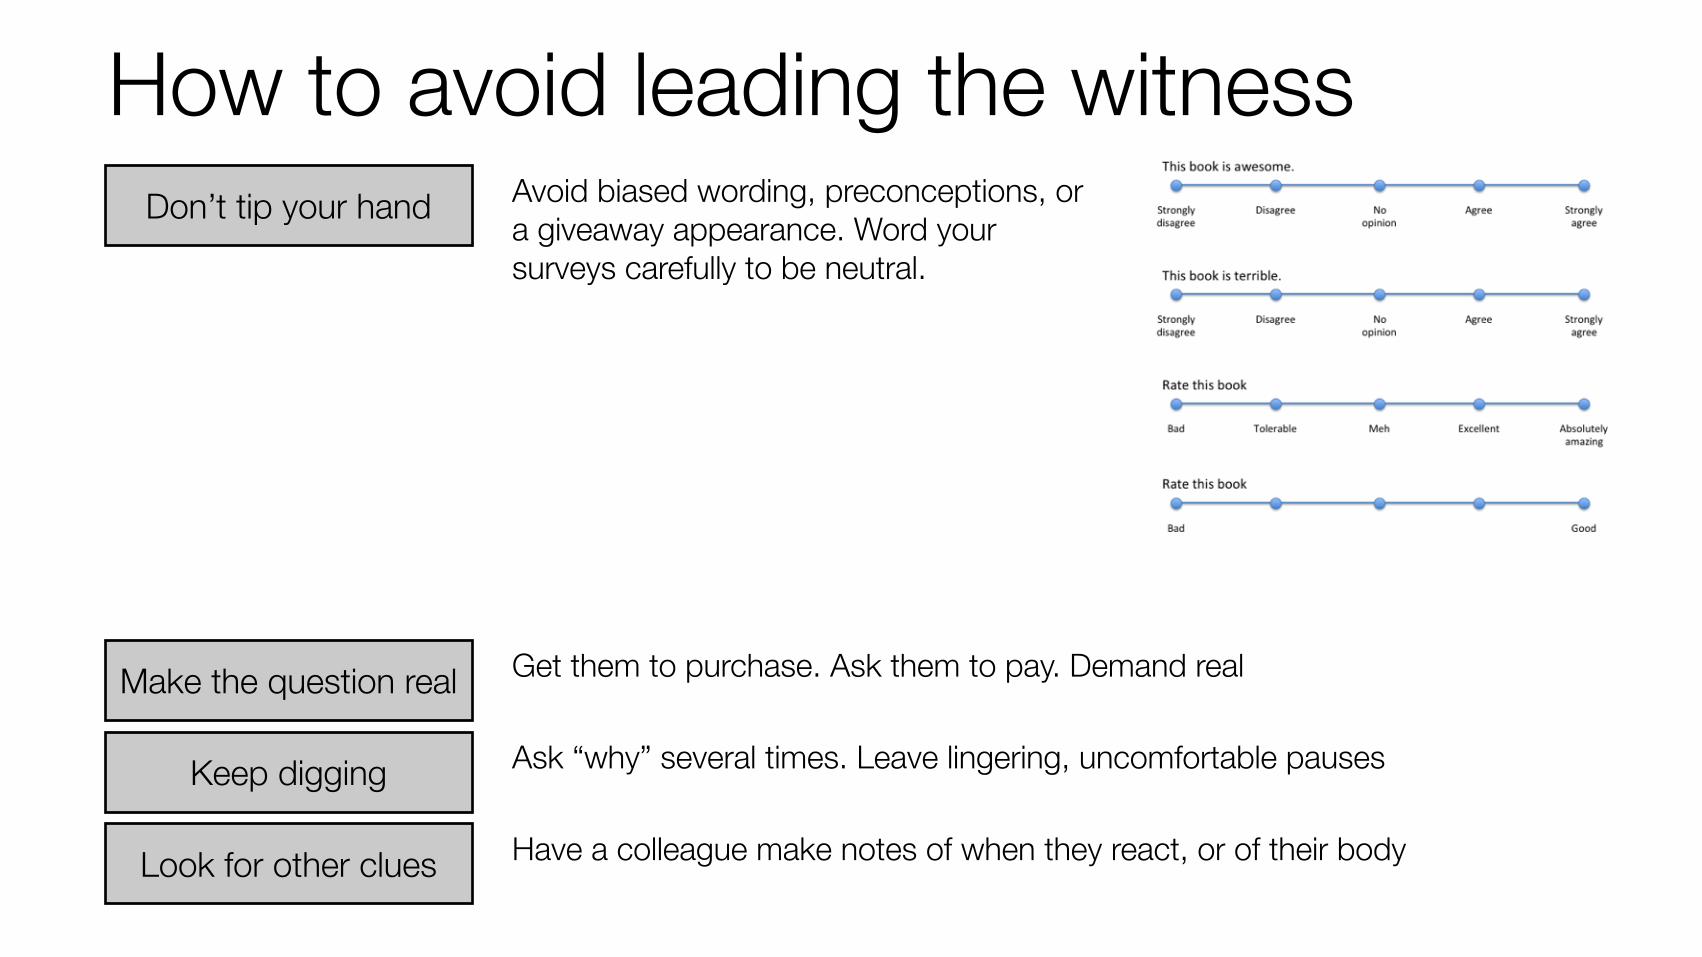
How to avoid leading the witnessAvoid biased wording, preconceptions, or a giveaway appearance. Word your surveys carefully to be neutral.
Get them to purchase. Ask them to pay. Demand real
Ask “why” several times. Leave lingering, uncomfortable pauses
Don’t tip your hand
Make the question real
Keep digging
Look for other clues Have a colleague make notes of when they react, or of their body

Stickiness stage: qidiq streamlines invites
Survey owner adds recipient to groupSurvey owner asks question
Recipient reads survey questionRecipient responds to questionRecipient sees survey results
(Later, if needed…)Recipient visits site; no password!Recipient does password recovery
One-time link sent to emailRecipient creates password
Recipient can edit profile, etc.
Survey owner adds recipient to group
Survey owner asks question
Recipient gets invite
Recipient reads survey question
Recipient responds to question
Recipient installs mobile app
Recipient creates account, profile
Recipient sees survey results
Recipient can edit profile, etc.
10-2
5% R
ESPO
NSE R
ATE
70-9
0% R
ESPO
NSE R
ATE
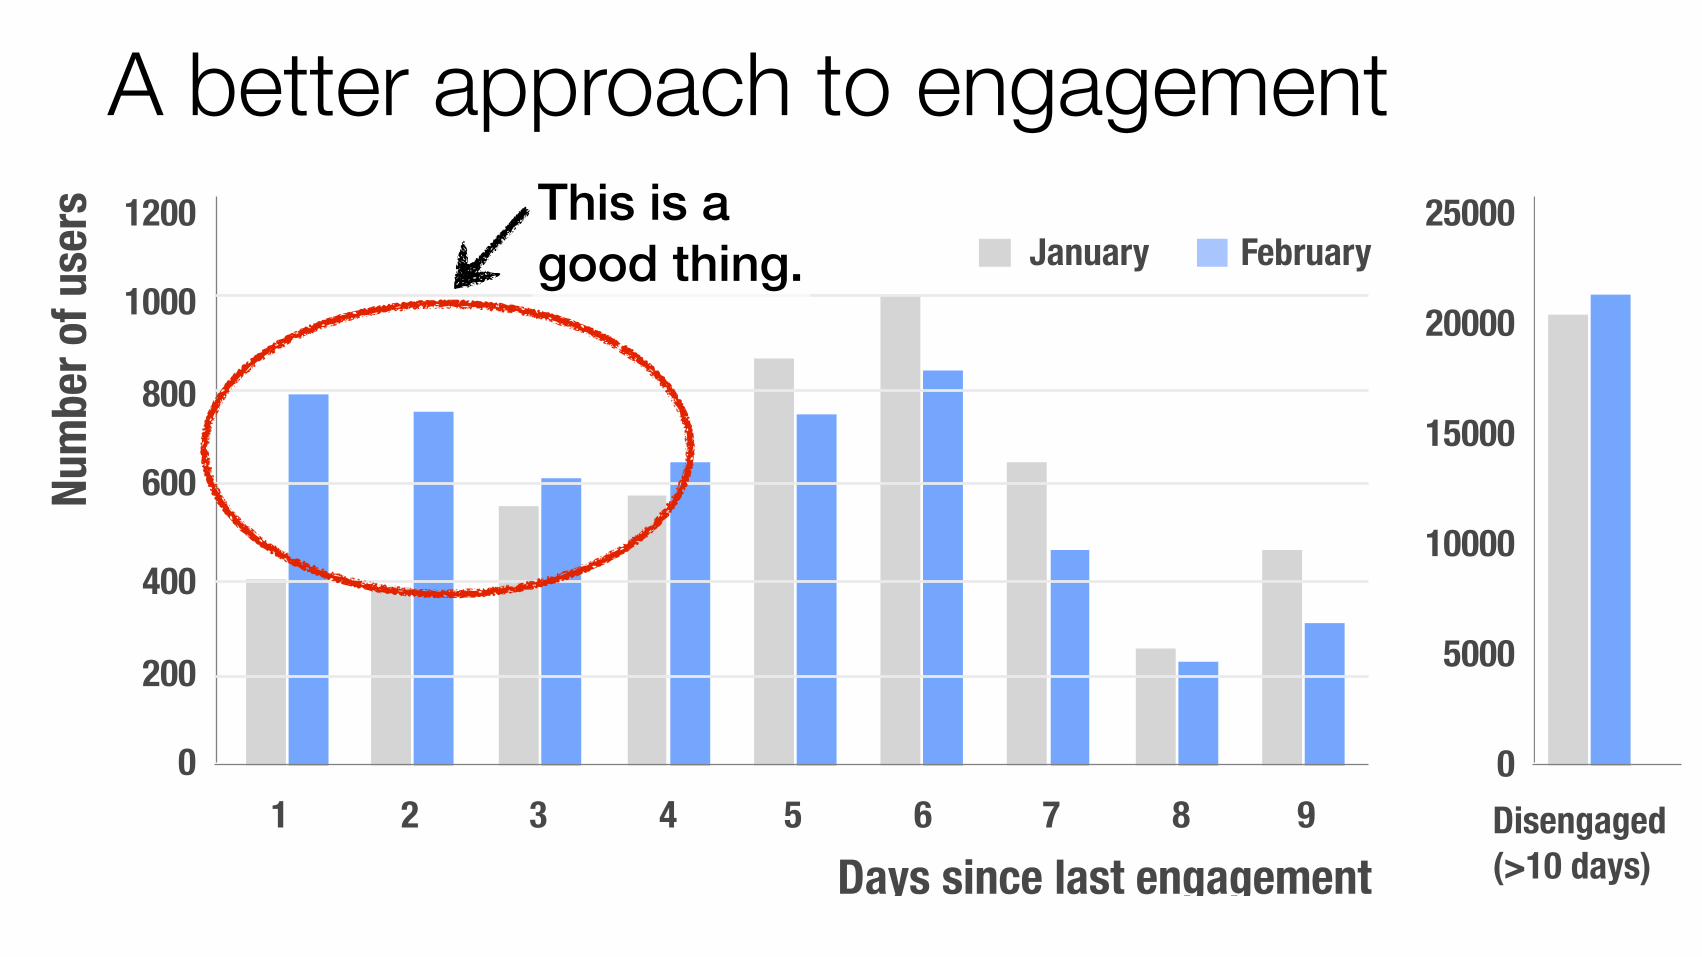
1200
1000
800
600
400
200
01 2 3 4 5 6 7 8 9
Days since last engagement
January February
Disengaged(>10 days)
25000
20000
15000
10000
5000
0
Num
ber o
f use
rsA better approach to engagement
This is agood thing.
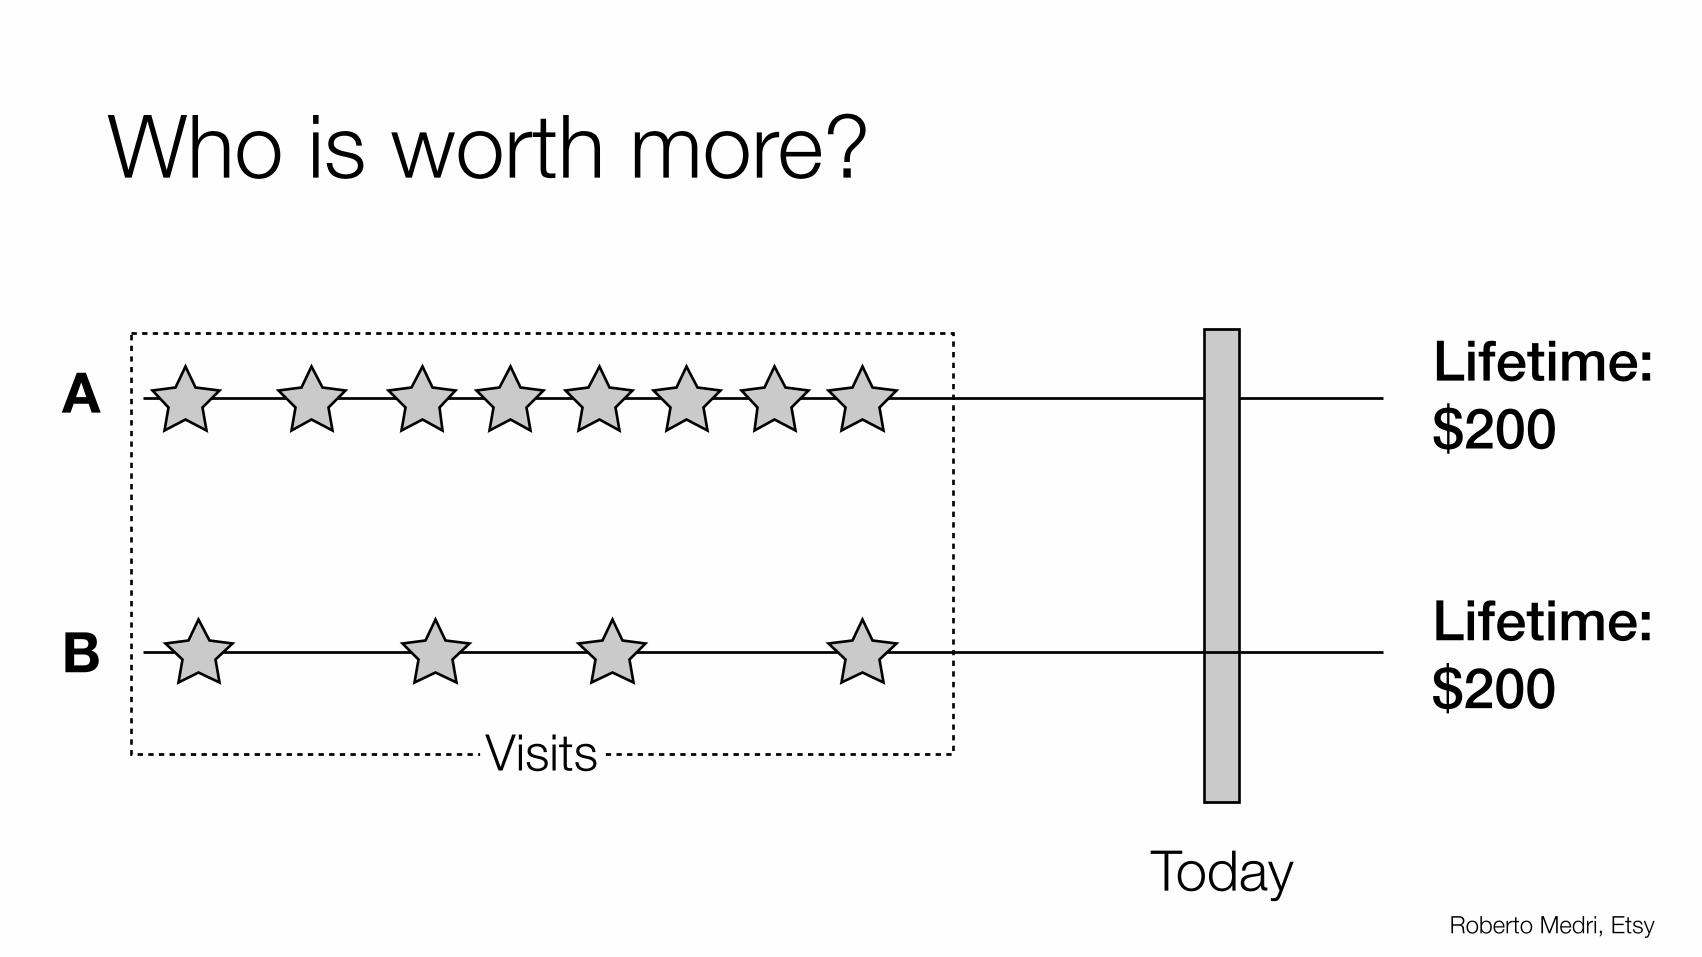
Who is worth more?
Today
A Lifetime:$200
Roberto Medri, Etsy
B Lifetime:$200
Visits

Virality stage: Timehop focuses on content sharing
Focused on percent of daily active users that share their content Aiming for 20-30% of DAU sharing
“All that matters now is virality. Everything else—be it press, publicity stunts or something else—is like pushing a rock up a mountain: it will never scale. But being viral will.”
- Jonathan Wegener, co-founder

------------------------------------------------------Get your free private email at http://www.hotmail.com ------------------------------------------------------


v ≠ 1, pt = δp0 (1 – vt+1) / (1 – v) + p0
http://robert.zubek.net/blog/2008/01/30/viral-coefficient-calculation/
Viral coefficient

Or simpler
Users Viralcoefficient
Churn &abandonment
x - > 1

Revenue stage: Backupify’s Customer Acquisition Payback
Initially focused on site visitors Then focused on trials Then switched to signups Today, MRR In early 2010, CAC was $243 and ARPU was only $39
Pivoted to target business users CLV-to-CAC today is 5-6x
Now they track Customer Acquisition Payback Target is less than 12 months
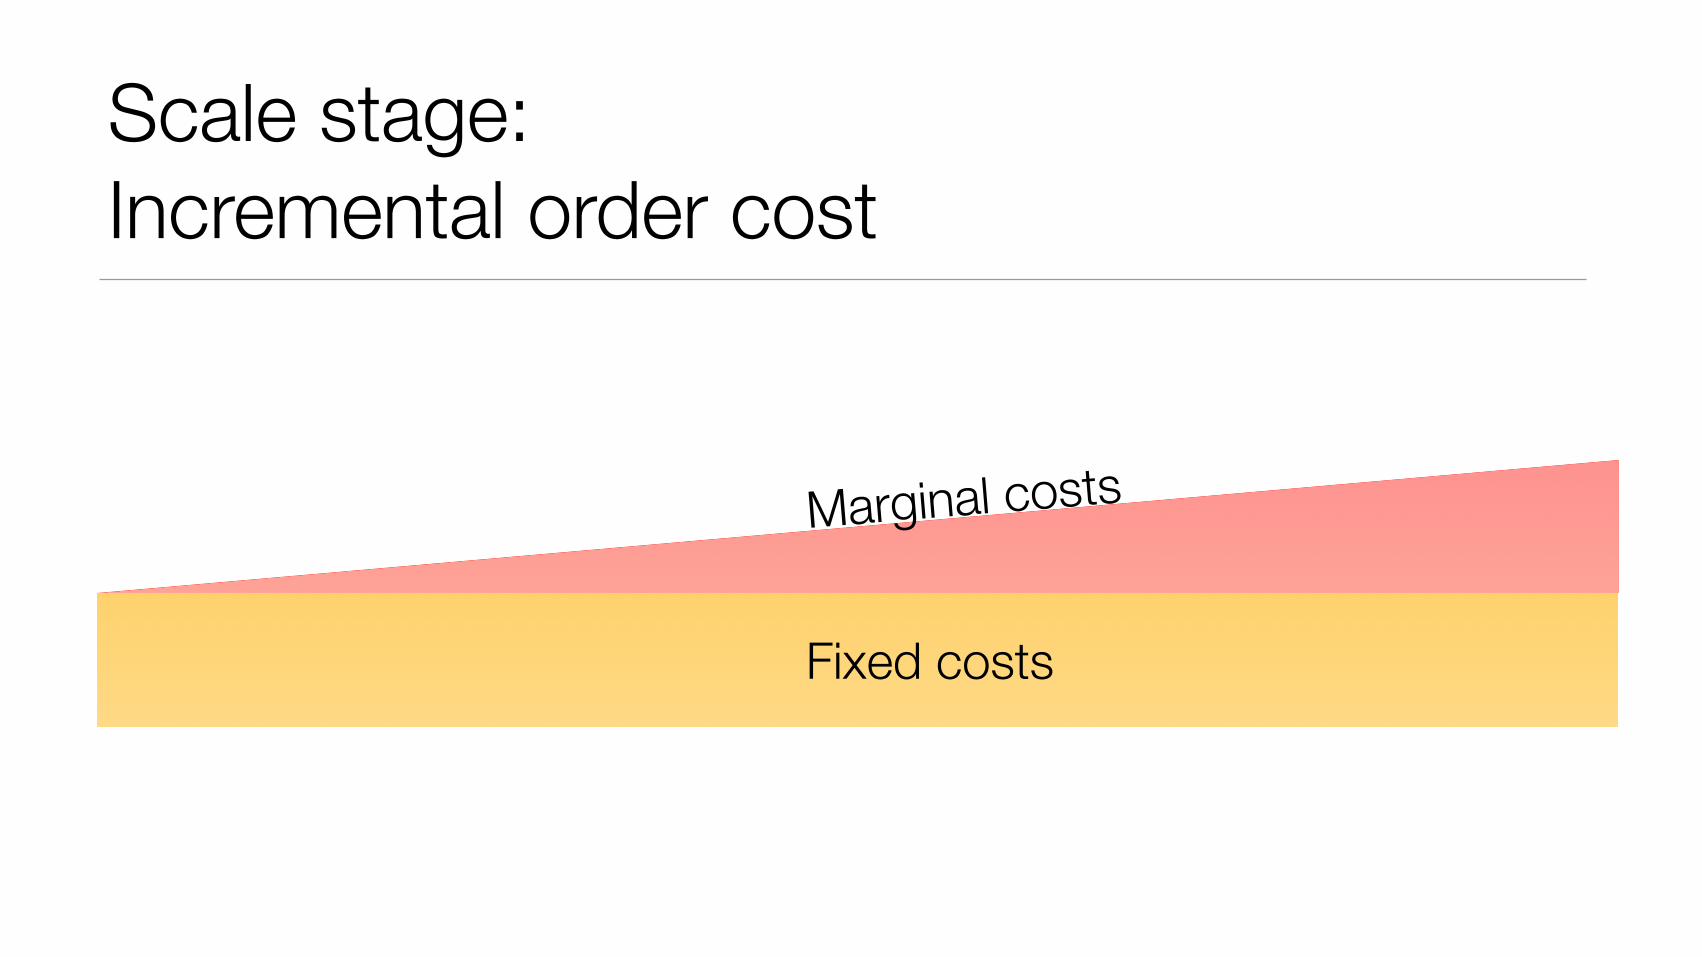
Scale stage: Incremental order cost
Fixed costs
Marginal costs

Six business model archetypes.
E-commerce SaaS MediaMobileapp
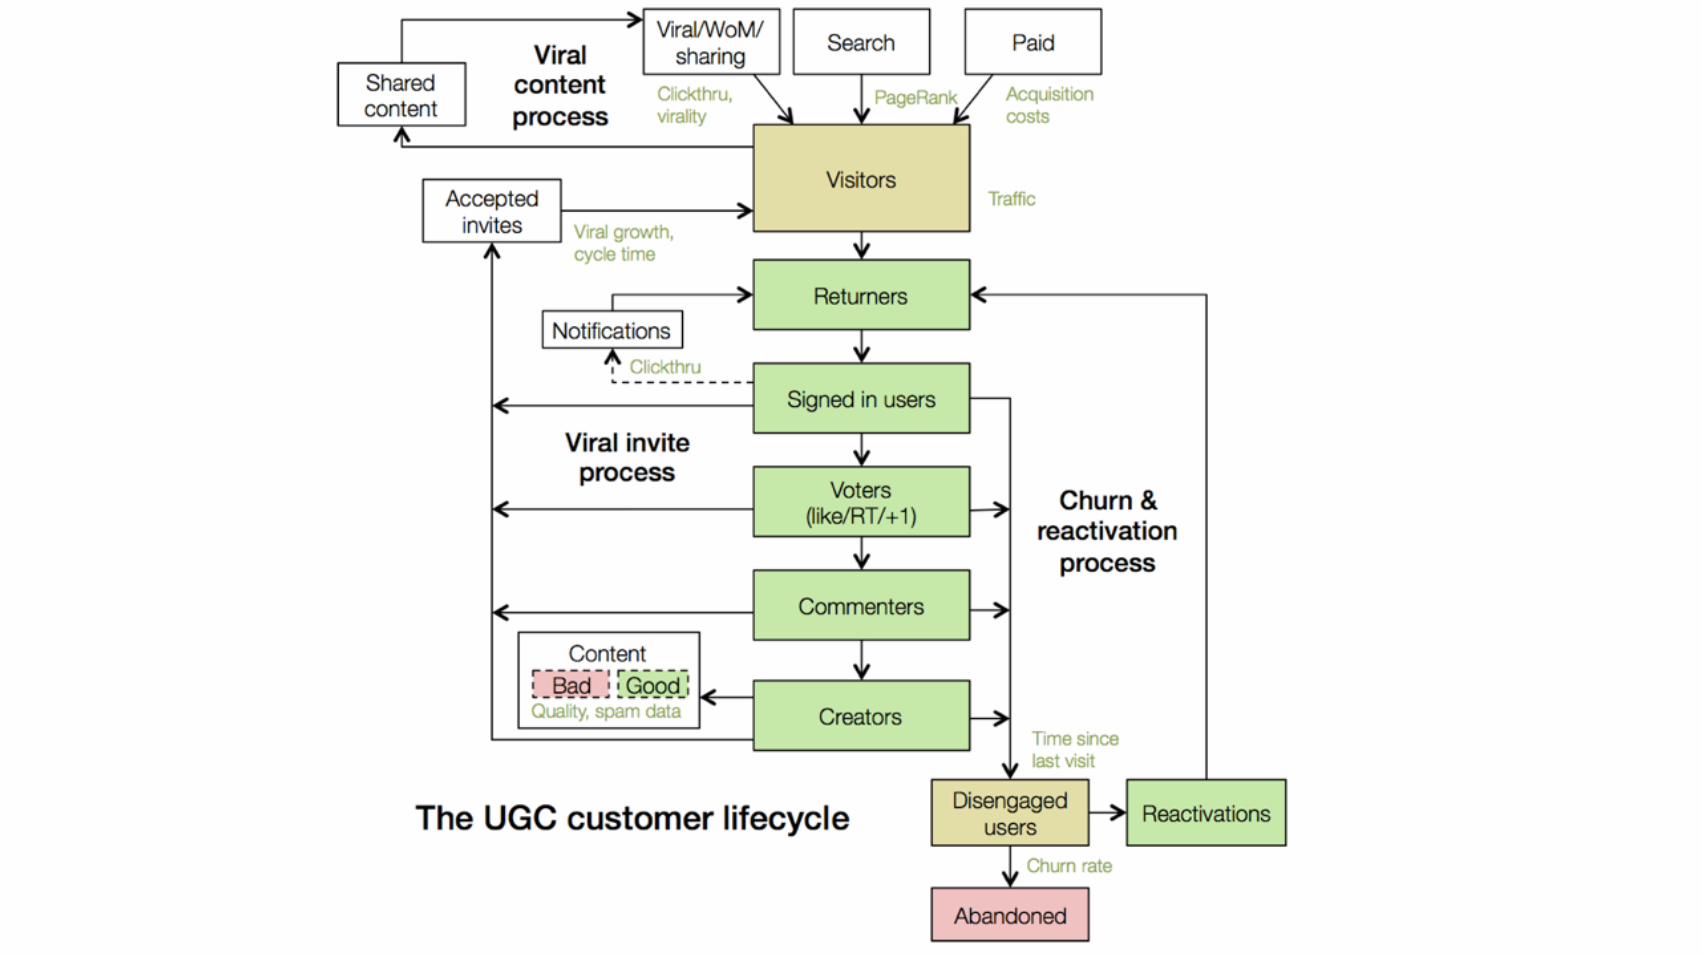
User-gencontent
2-sidedmarket
The business you’re in
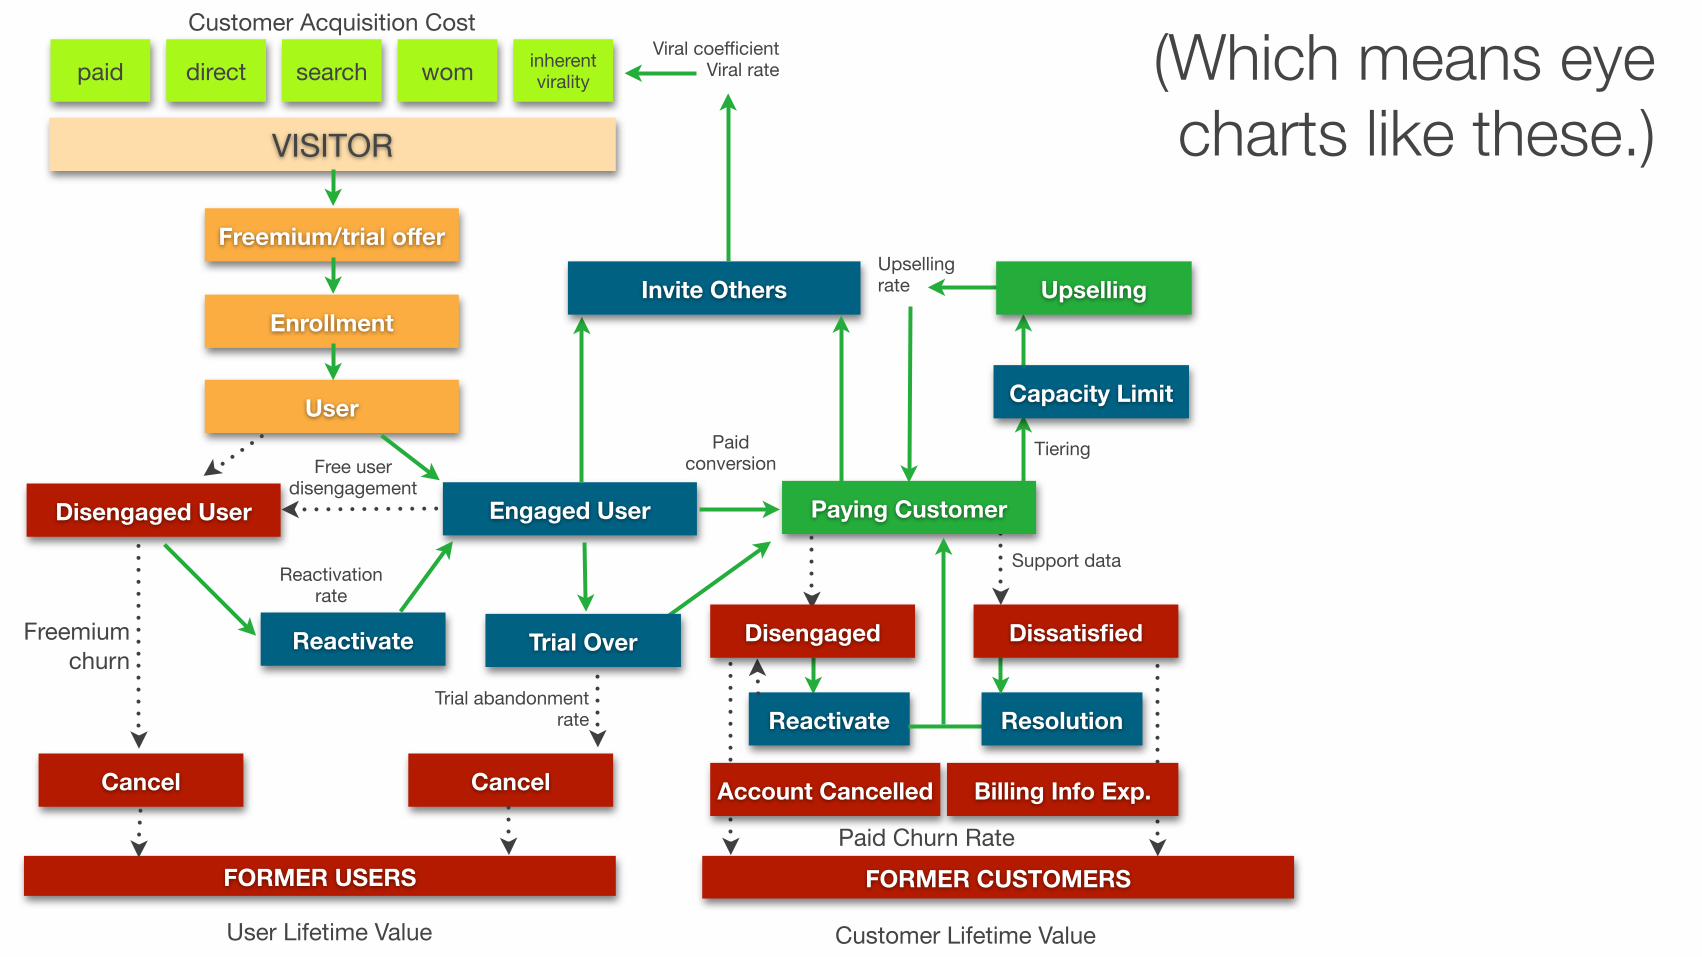
(Which means eye charts like these.)
Customer Acquisition Cost
paid direct search wom inherent virality
VISITOR
Freemium/trial offer
Enrollment
User
Disengaged User
Cancel
Freemium churn
Engaged User
Free user disengagement
Reactivate
Cancel
Trial abandonment rate
Invite Others
Paying Customer
Reactivationrate
Paid conversion
FORMER USERS
User Lifetime Value
Reactivate
FORMER CUSTOMERS
Customer Lifetime Value
Viral coefficientViral rate
Resolution
Support data
Account Cancelled Billing Info Exp.
Paid Churn Rate
Tiering
Capacity Limit
Upselling rate Upselling
Disengaged DissatisfiedTrial Over

AcquisitionCustomer Acquisition Cost
paid direct search wom inherent virality
VISITOR
Freemium/trial offer
Enrollment
User
Disengaged User
Cancel
Freemium churn
Engaged User
Free user disengagement
Reactivate
Cancel
Trial abandonment rate
Invite Others
Paying Customer
Reactivationrate
Paid conversion
FORMER USERS
User Lifetime Value
Reactivate
FORMER CUSTOMERS
Customer Lifetime Value
Viral coefficientViral rate
Resolution
Support data
Account Cancelled Billing Info Exp.
Paid Churn Rate
Tiering
Capacity Limit
Upselling rate Upselling
Disengaged DissatisfiedTrial Over

ActivationCustomer Acquisition Cost
paid direct search wom inherent virality
VISITOR
Freemium/trial offer
Enrollment
User
Disengaged User
Cancel
Freemium churn
Engaged User
Free user disengagement
Reactivate
Cancel
Trial abandonment rate
Invite Others
Paying Customer
Reactivationrate
Paid conversion
FORMER USERS
User Lifetime Value
Reactivate
FORMER CUSTOMERS
Customer Lifetime Value
Viral coefficientViral rate
Resolution
Support data
Account Cancelled Billing Info Exp.
Paid Churn Rate
Tiering
Capacity Limit
Upselling rate Upselling
Disengaged DissatisfiedTrial Over

RetentionCustomer Acquisition Cost
paid direct search wom inherent virality
VISITOR
Freemium/trial offer
Enrollment
User
Disengaged User
Cancel
Freemium churn
Engaged User
Free user disengagement
Reactivate
Cancel
Trial abandonment rate
Invite Others
Paying Customer
Reactivationrate
Paid conversion
FORMER USERS
User Lifetime Value
Reactivate
FORMER CUSTOMERS
Customer Lifetime Value
Viral coefficientViral rate
Resolution
Support data
Account Cancelled Billing Info Exp.
Paid Churn Rate
Tiering
Capacity Limit
Upselling rate Upselling
Disengaged DissatisfiedTrial Over

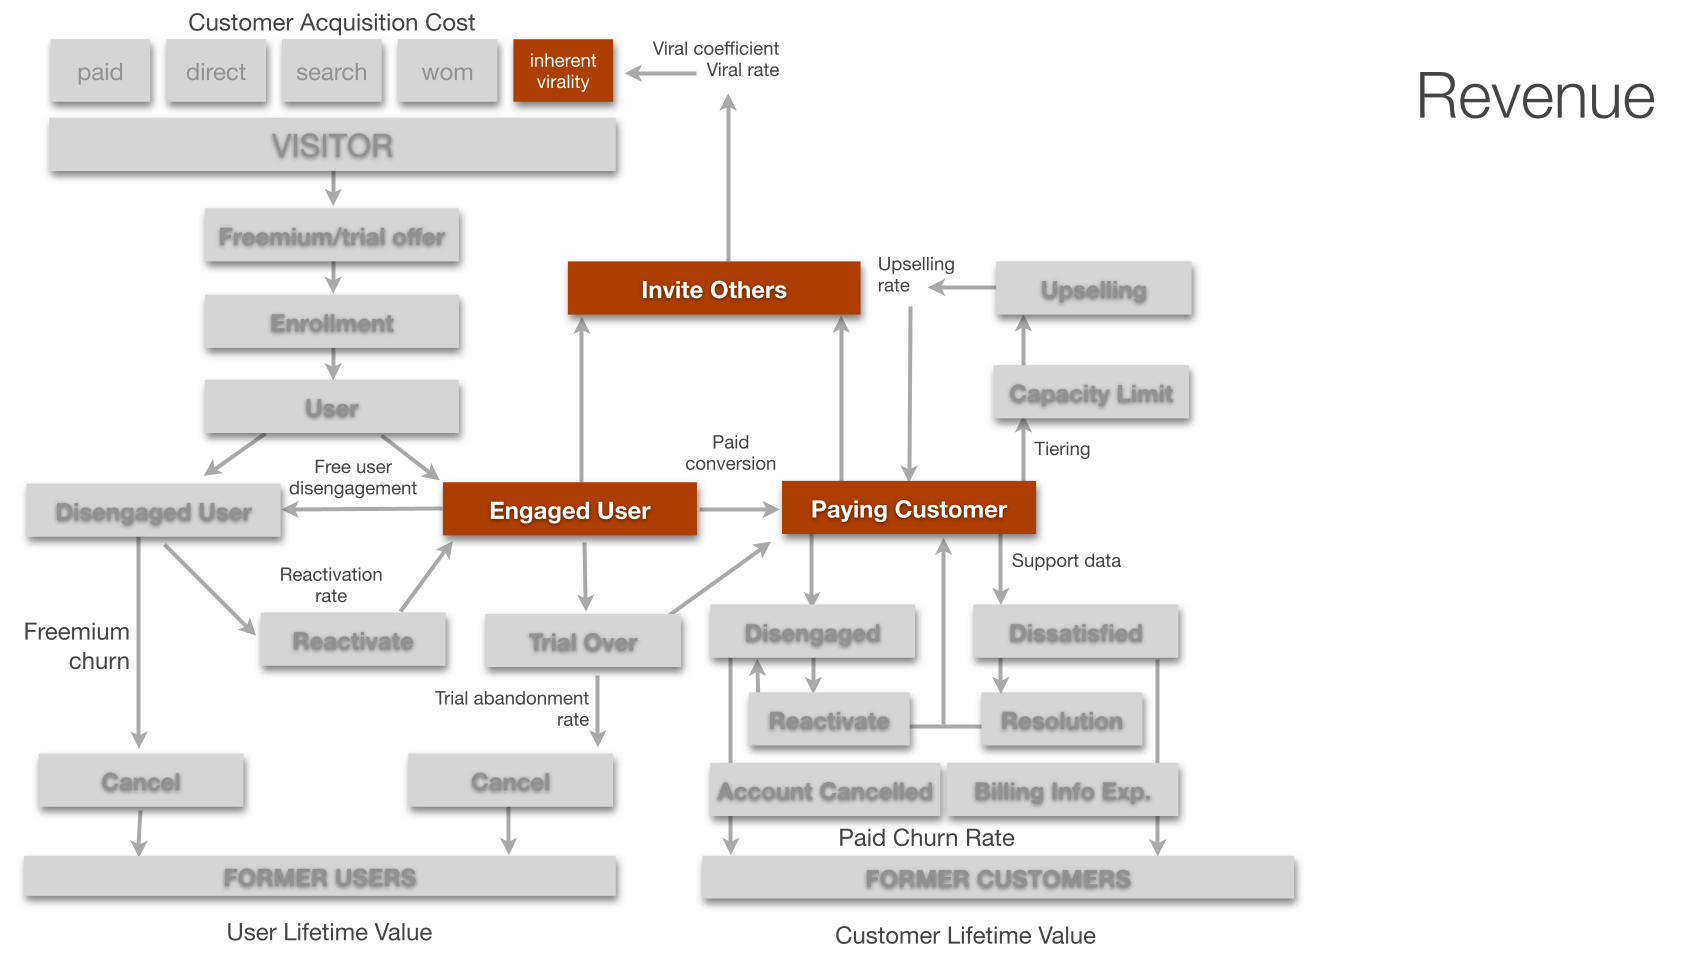
RevenueCustomer Acquisition Cost
paid direct search wom inherent virality
VISITOR
Freemium/trial offer
Enrollment
User
Disengaged User
Cancel
Freemium churn
Engaged User
Free user disengagement
Reactivate
Cancel
Trial abandonment rate
Invite Others
Paying Customer
Reactivationrate
Paid conversion
FORMER USERS
User Lifetime Value
Reactivate
FORMER CUSTOMERS
Customer Lifetime Value
Viral coefficientViral rate
Resolution
Support data
Account Cancelled Billing Info Exp.
Paid Churn Rate
Tiering
Capacity Limit
Upselling rate Upselling
Disengaged DissatisfiedTrial Over

Model + Stage = One Metric That Matters.
One Metric That Matters.
The business you’re in
E-Com SaaS Mobile 2-Sided Media UCG
Empathy
Stickiness
Virality
Revenue
ScaleThe
stag
e yo
u’re
at

Really? Just one?

Yes, one.

In a startup, focus is hard to achieve.

Having only one metric addresses this problem.
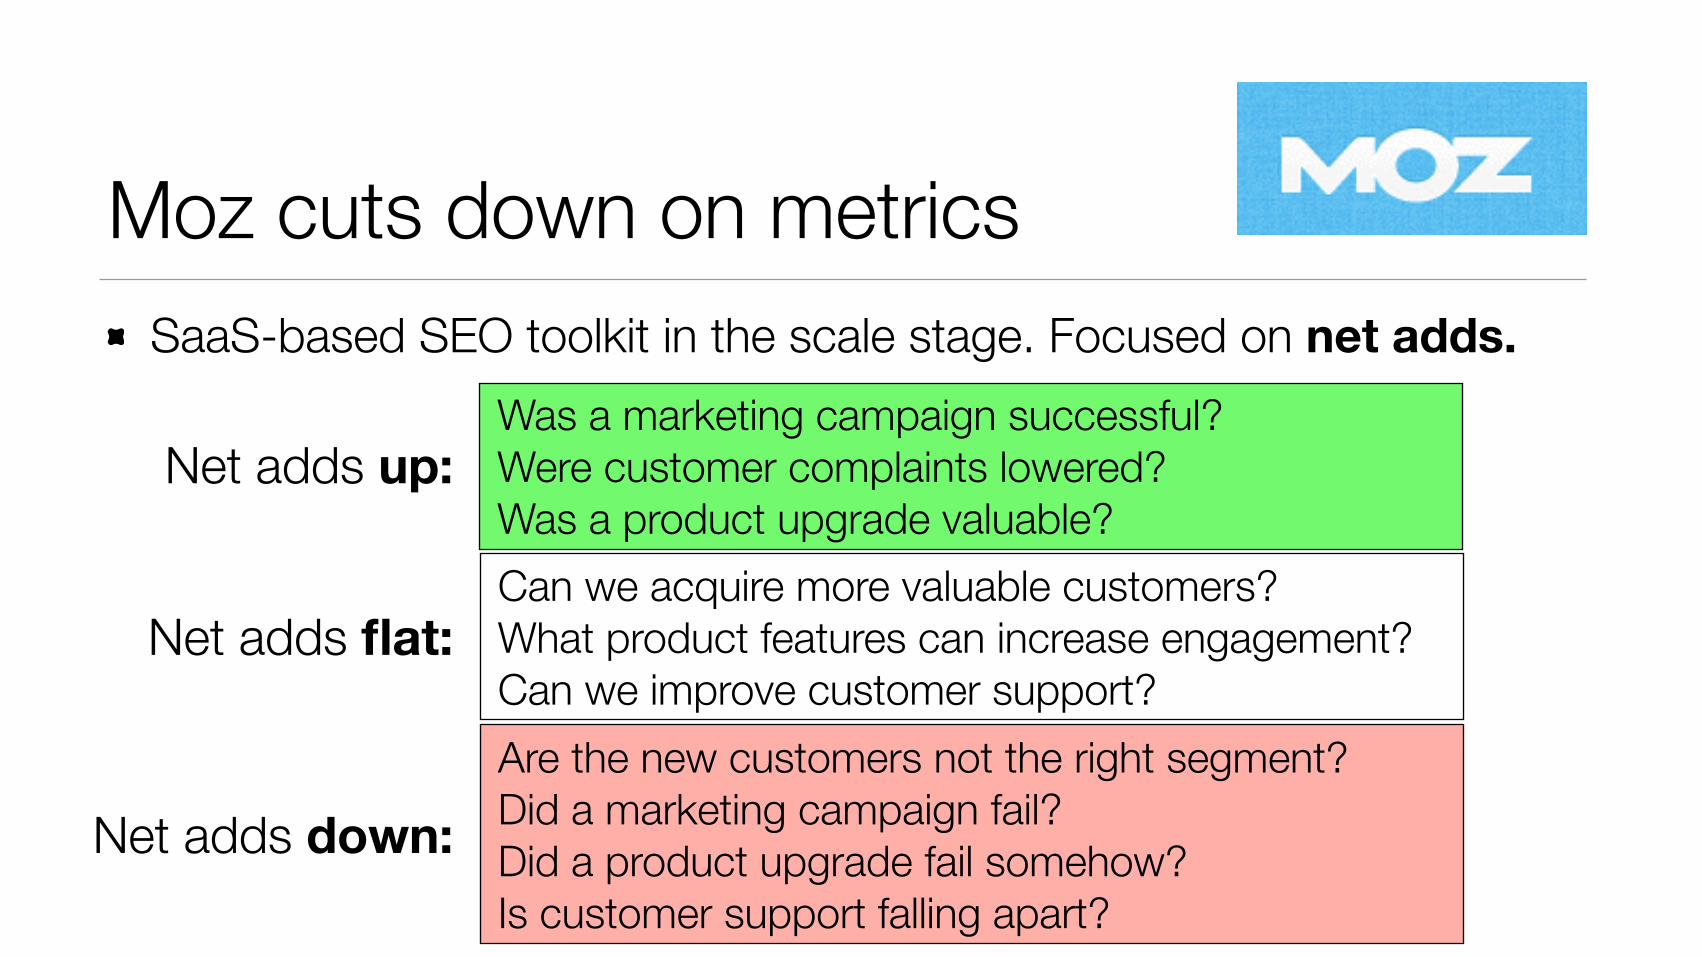
Moz cuts down on metricsSaaS-based SEO toolkit in the scale stage. Focused on net adds.
Was a marketing campaign successful? Were customer complaints lowered? Was a product upgrade valuable?
Net adds up:
Can we acquire more valuable customers? What product features can increase engagement? Can we improve customer support?
Net adds flat:
Are the new customers not the right segment? Did a marketing campaign fail? Did a product upgrade fail somehow? Is customer support falling apart?
Net adds down:
Metrics are like squeeze toys.
http://www.flickr.com/photos/connortarter/4791605202/
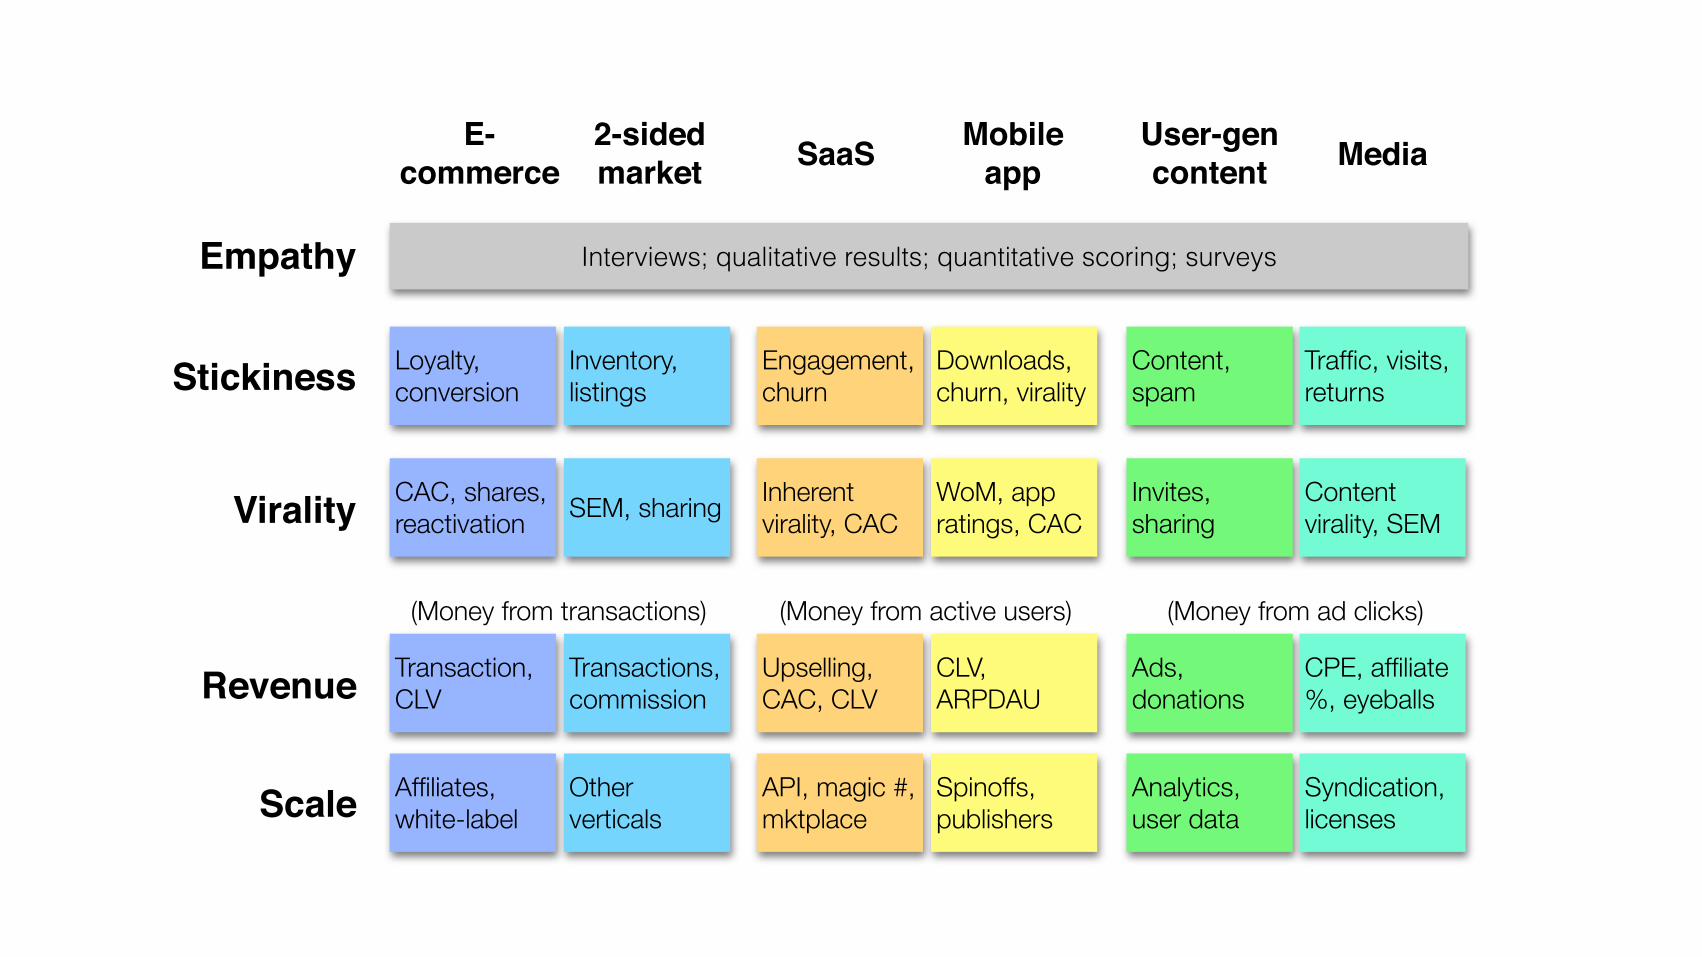
Empathy
Stickiness
Virality
Revenue
Scale
E-commerce SaaS MediaMobile
appUser-gencontent
2-sidedmarket
Interviews; qualitative results; quantitative scoring; surveys
Loyalty, conversion
CAC, shares, reactivation
Transaction, CLV
Affiliates, white-label
Engagement, churn
Inherent virality, CAC
Upselling, CAC, CLV
API, magic #, mktplace
Content, spam
Invites, sharing
Ads, donations
Analytics, user data
Inventory, listings
SEM, sharing
Transactions, commission
Other verticals
(Money from transactions)
Downloads, churn, virality
WoM, app ratings, CAC
CLV, ARPDAU
Spinoffs, publishers
(Money from active users)
Traffic, visits, returns
Content virality, SEM
CPE, affiliate %, eyeballs
Syndication, licenses
(Money from ad clicks)

Better: bit.ly/BigLeanTable

Drawing some lines in the sand.

A company loses a quarter of its customers every year.
Is this good or bad?
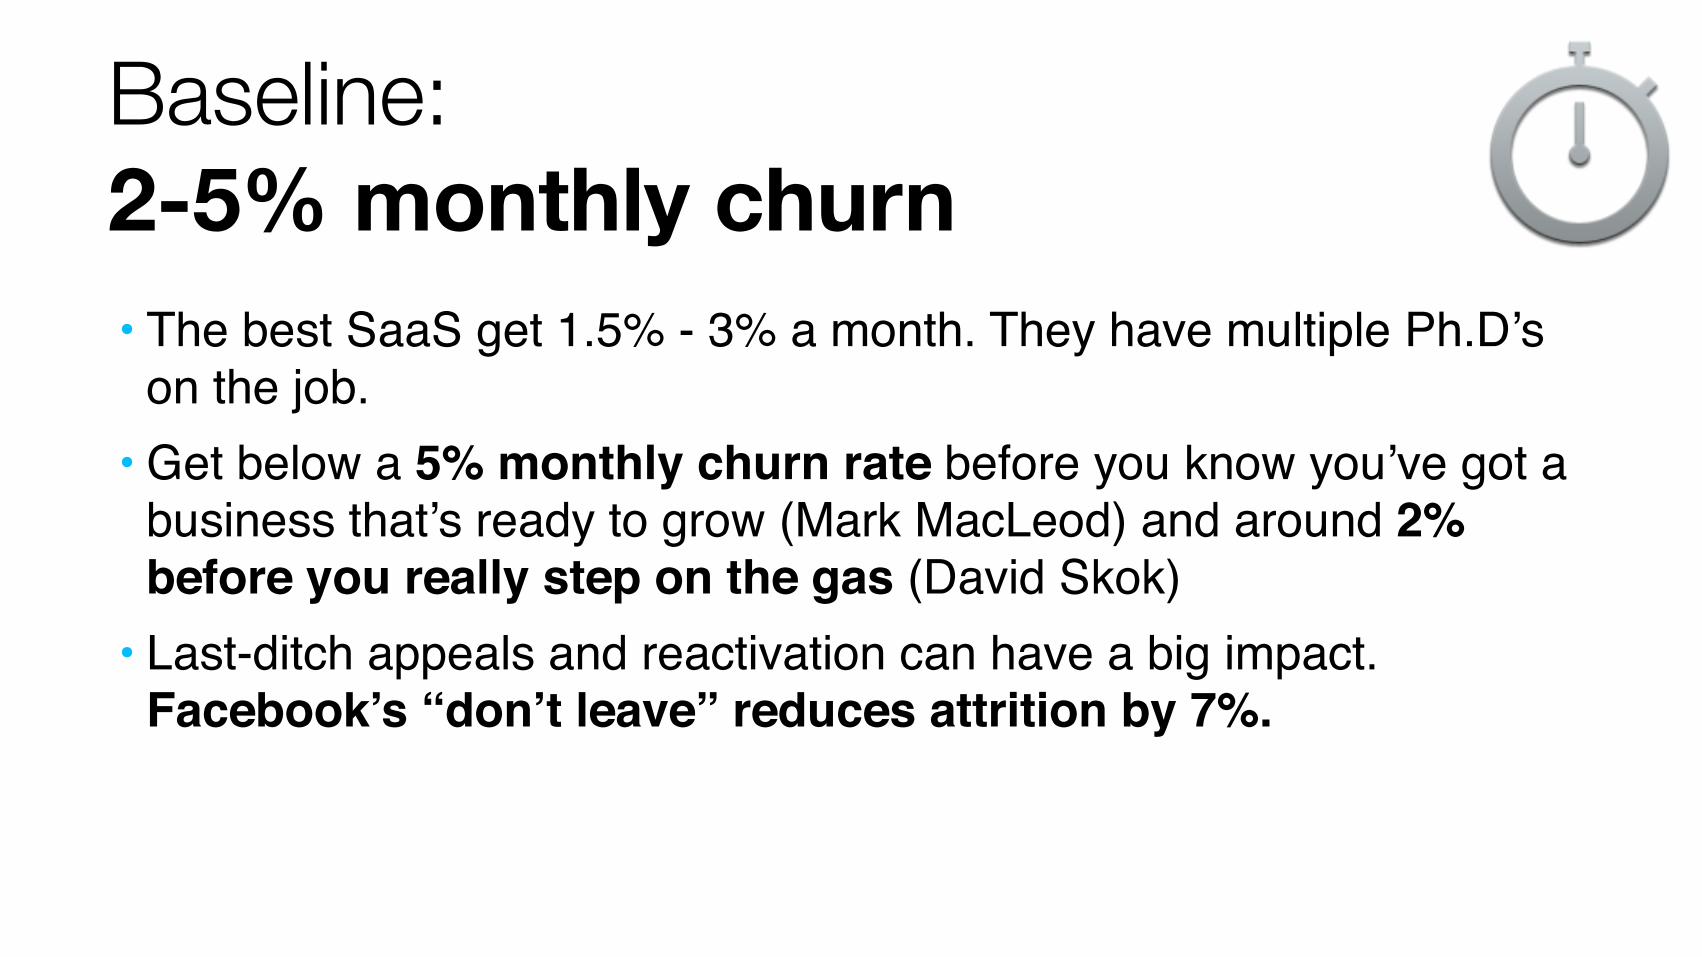
Baseline: 2-5% monthly churn• The best SaaS get 1.5% - 3% a month. They have multiple Ph.D’s
on the job.• Get below a 5% monthly churn rate before you know you’ve got a
business that’s ready to grow (Mark MacLeod) and around 2% before you really step on the gas (David Skok)
• Last-ditch appeals and reactivation can have a big impact. Facebook’s “don’t leave” reduces attrition by 7%.

Not knowing what normal is makes you do unwise things.
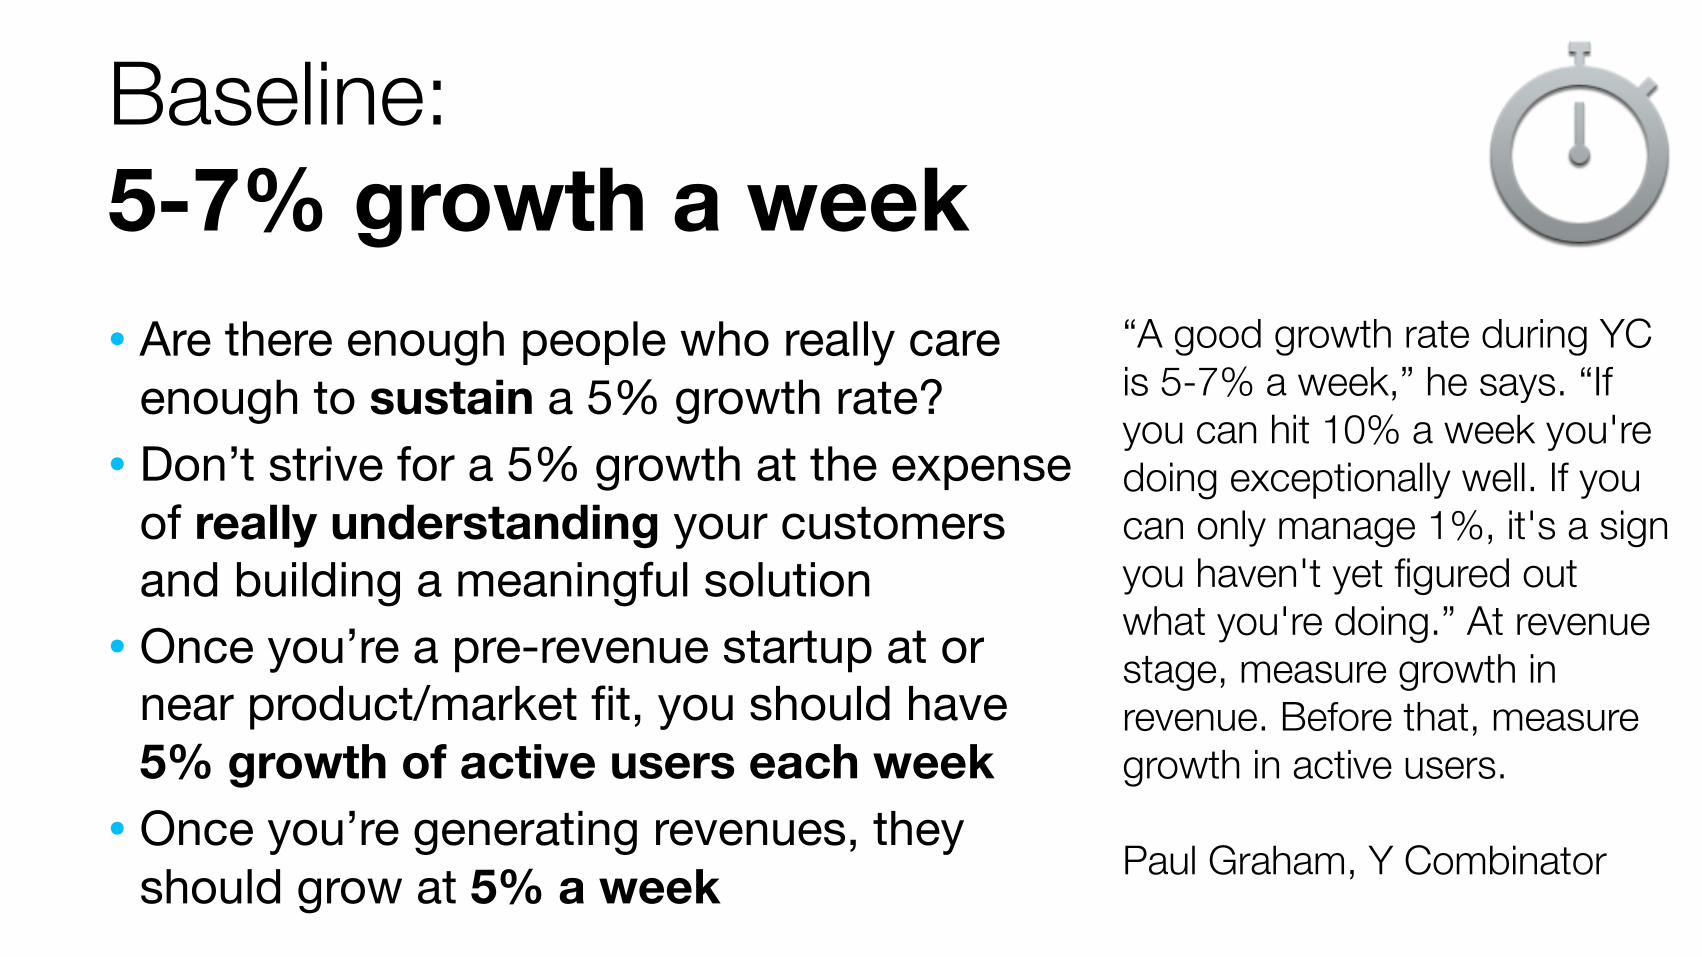
Baseline: 5-7% growth a week
“A good growth rate during YC is 5-7% a week,” he says. “If you can hit 10% a week you're doing exceptionally well. If you can only manage 1%, it's a sign you haven't yet figured out what you're doing.” At revenue stage, measure growth in revenue. Before that, measure growth in active users.
Paul Graham, Y Combinator
• Are there enough people who really care enough to sustain a 5% growth rate?
• Don’t strive for a 5% growth at the expense of really understanding your customers and building a meaningful solution
• Once you’re a pre-revenue startup at or near product/market fit, you should have 5% growth of active users each week
• Once you’re generating revenues, they should grow at 5% a week
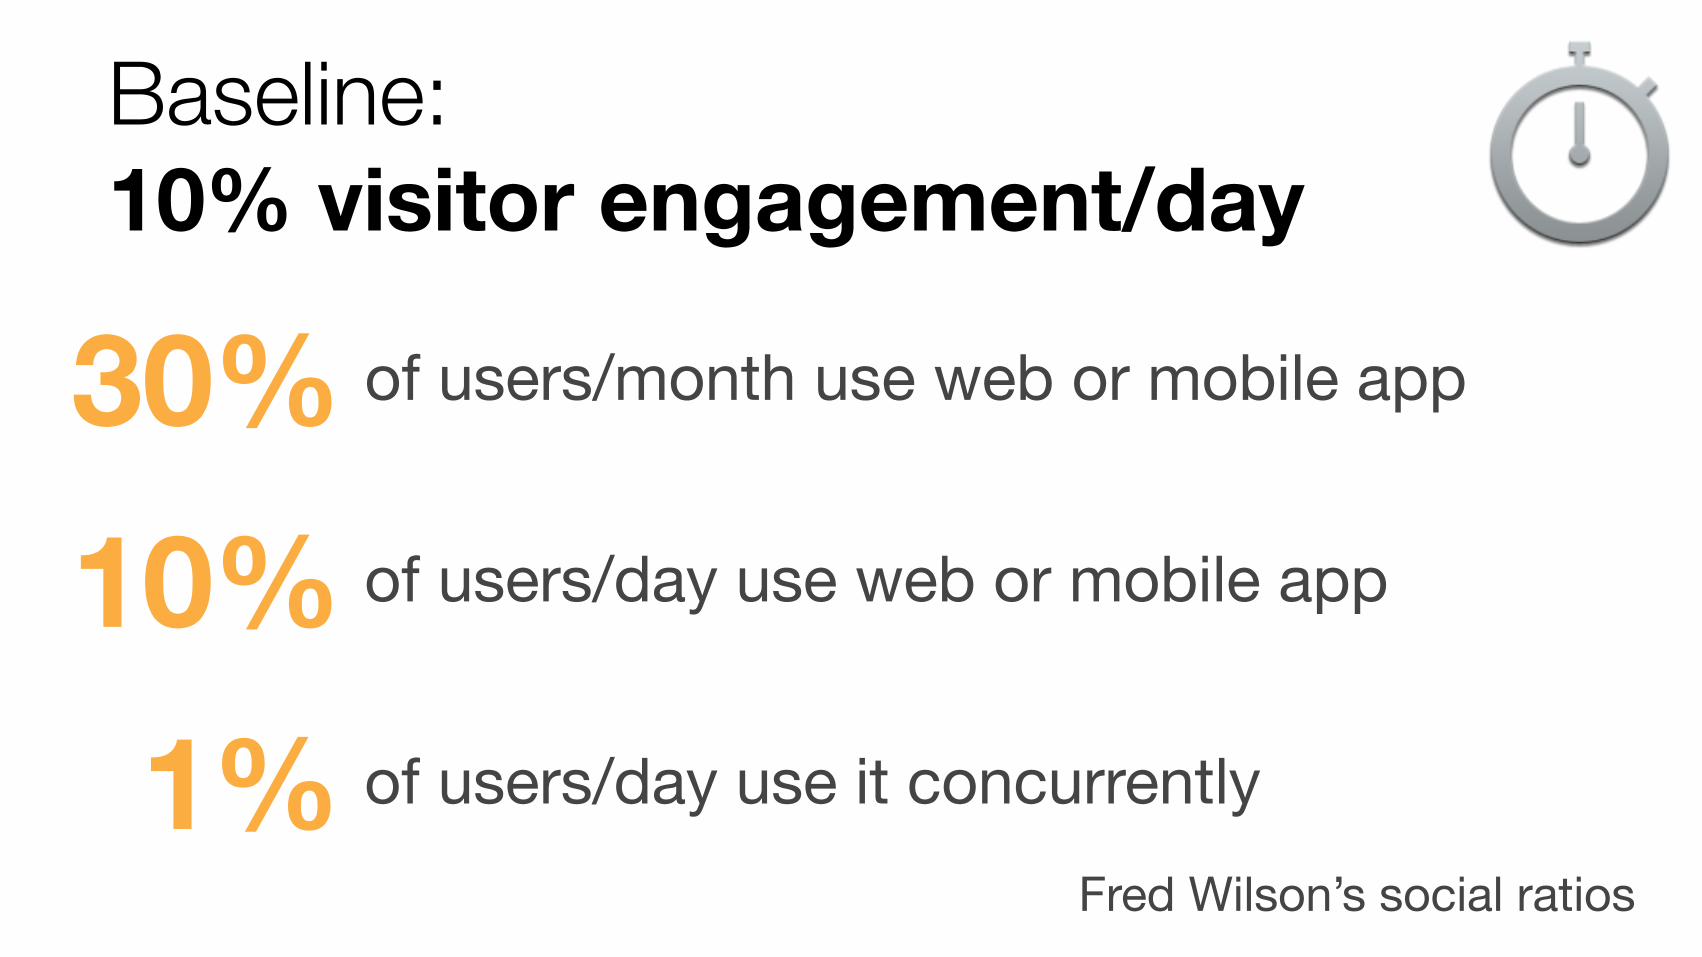
Baseline: 10% visitor engagement/day
Fred Wilson’s social ratios
30% of users/month use web or mobile app
10% of users/day use web or mobile app
1% of users/day use it concurrently
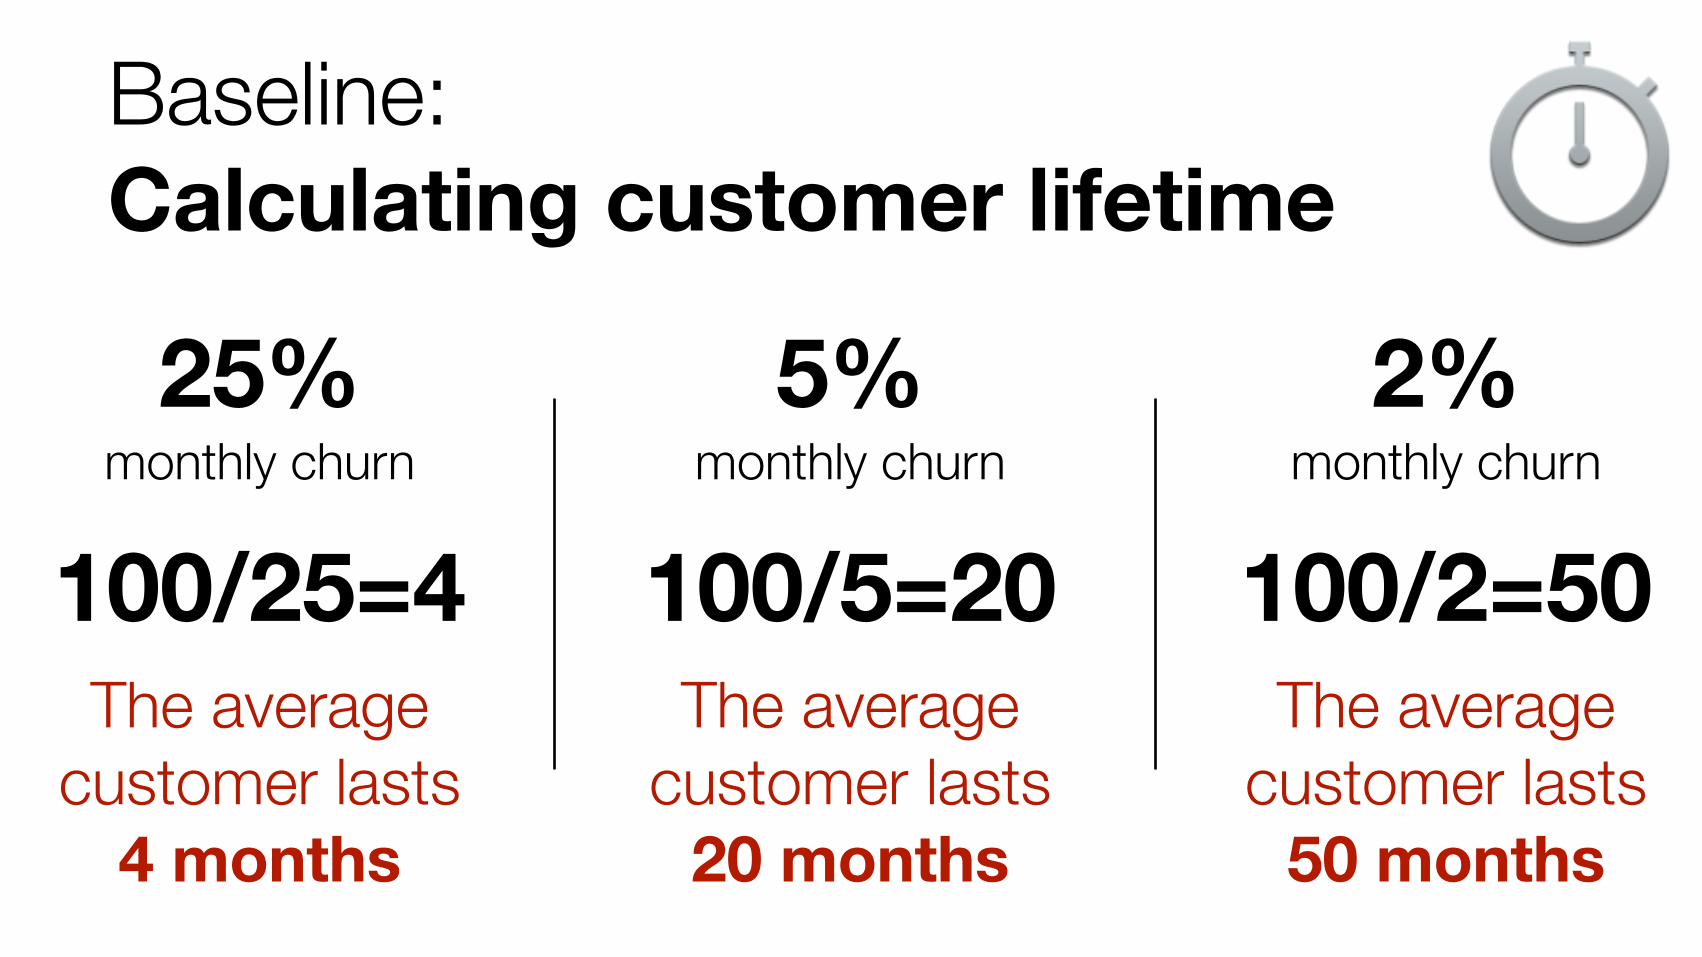
Baseline: Calculating customer lifetime
25%monthly churn
100/25=4The average
customer lasts 4 months
5%monthly churn
100/5=20The average
customer lasts 20 months
2%monthly churn
100/2=50The average
customer lasts 50 months
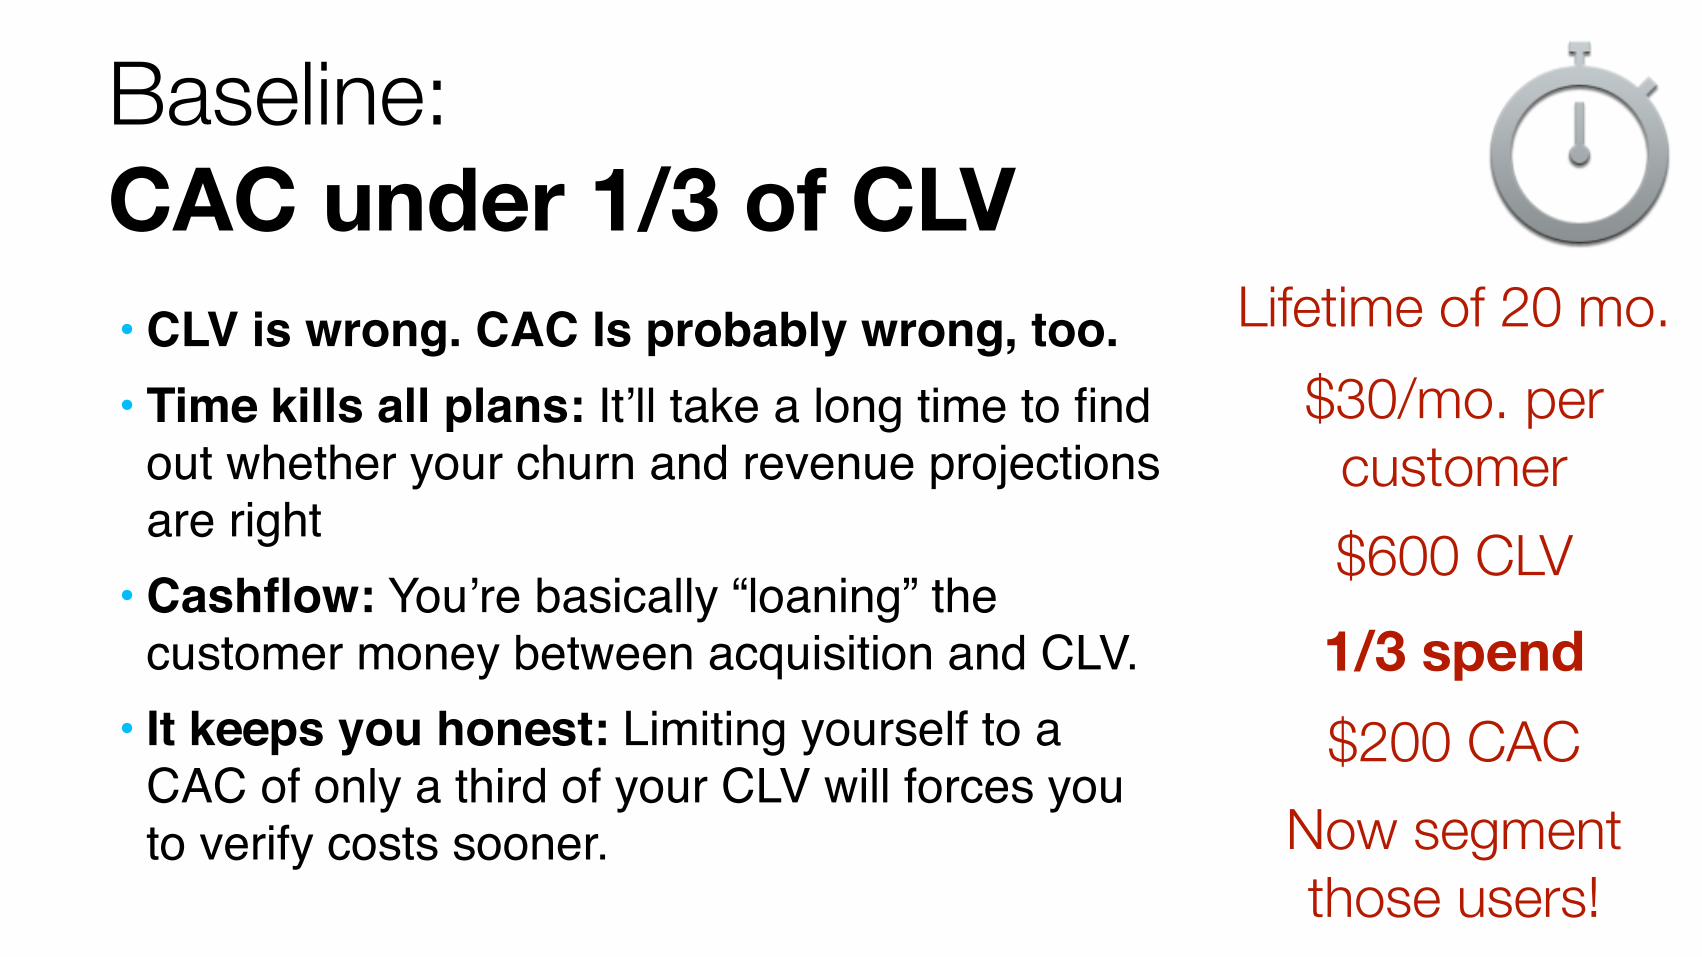
Baseline: CAC under 1/3 of CLV• CLV is wrong. CAC Is probably wrong, too.• Time kills all plans: It’ll take a long time to find
out whether your churn and revenue projections are right
• Cashflow: You’re basically “loaning” the customer money between acquisition and CLV.
• It keeps you honest: Limiting yourself to a CAC of only a third of your CLV will forces you to verify costs sooner.
Lifetime of 20 mo.$30/mo. per
customer$600 CLV
$200 CACNow segment those users!
1/3 spend
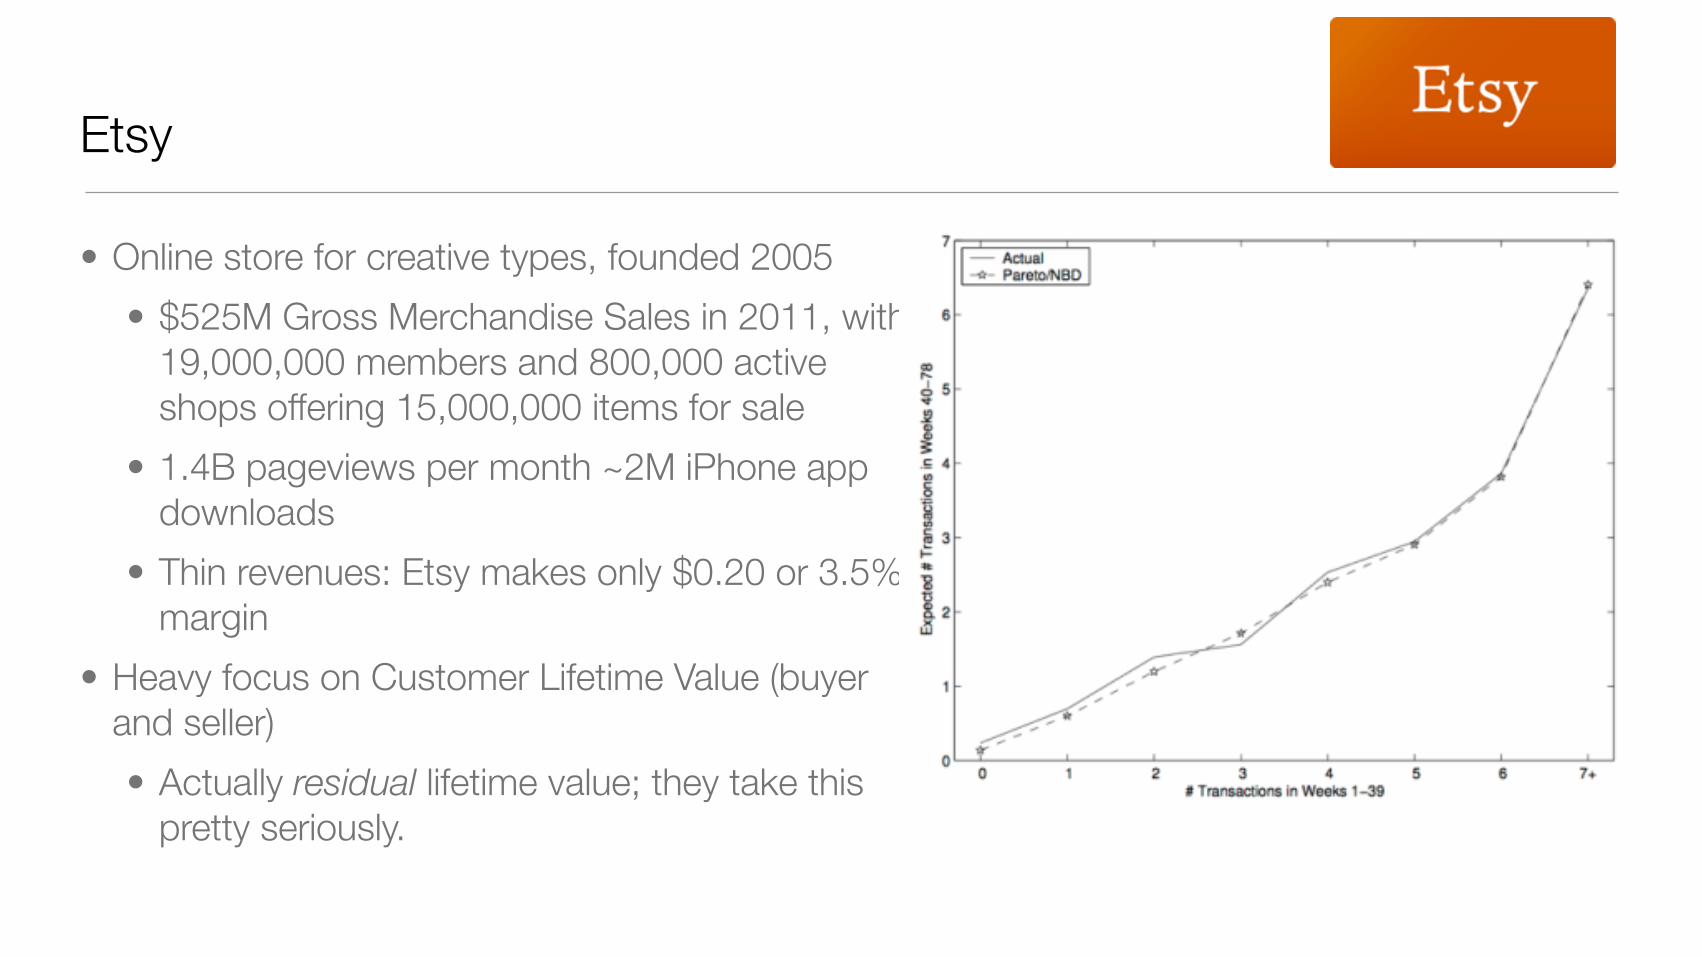
Etsy
• Online store for creative types, founded 2005 • $525M Gross Merchandise Sales in 2011, with
19,000,000 members and 800,000 active shops offering 15,000,000 items for sale
• 1.4B pageviews per month ~2M iPhone app downloads
• Thin revenues: Etsy makes only $0.20 or 3.5% margin
• Heavy focus on Customer Lifetime Value (buyer and seller) • Actually residual lifetime value; they take this
pretty seriously.

Etsy
• The best customers to target are • Recent high-profile customers • Old-time best customers about to
churn or just churned • Tiered campaigns
• Bronze/silver customers: reinforcement, nudges
• Gold customers: premium services • Platinum customers: recognition
• What they watch: • Growth of individual product categories • Time to first sale by a user • Average order value • Percentage of visits that convert to a
sale • Percentage of return buyers • Distinct sellers within a product
category • Time-to-first-sale and average order
value by product category
Roberto Medri, Etsy

The Lean Analytics cycle
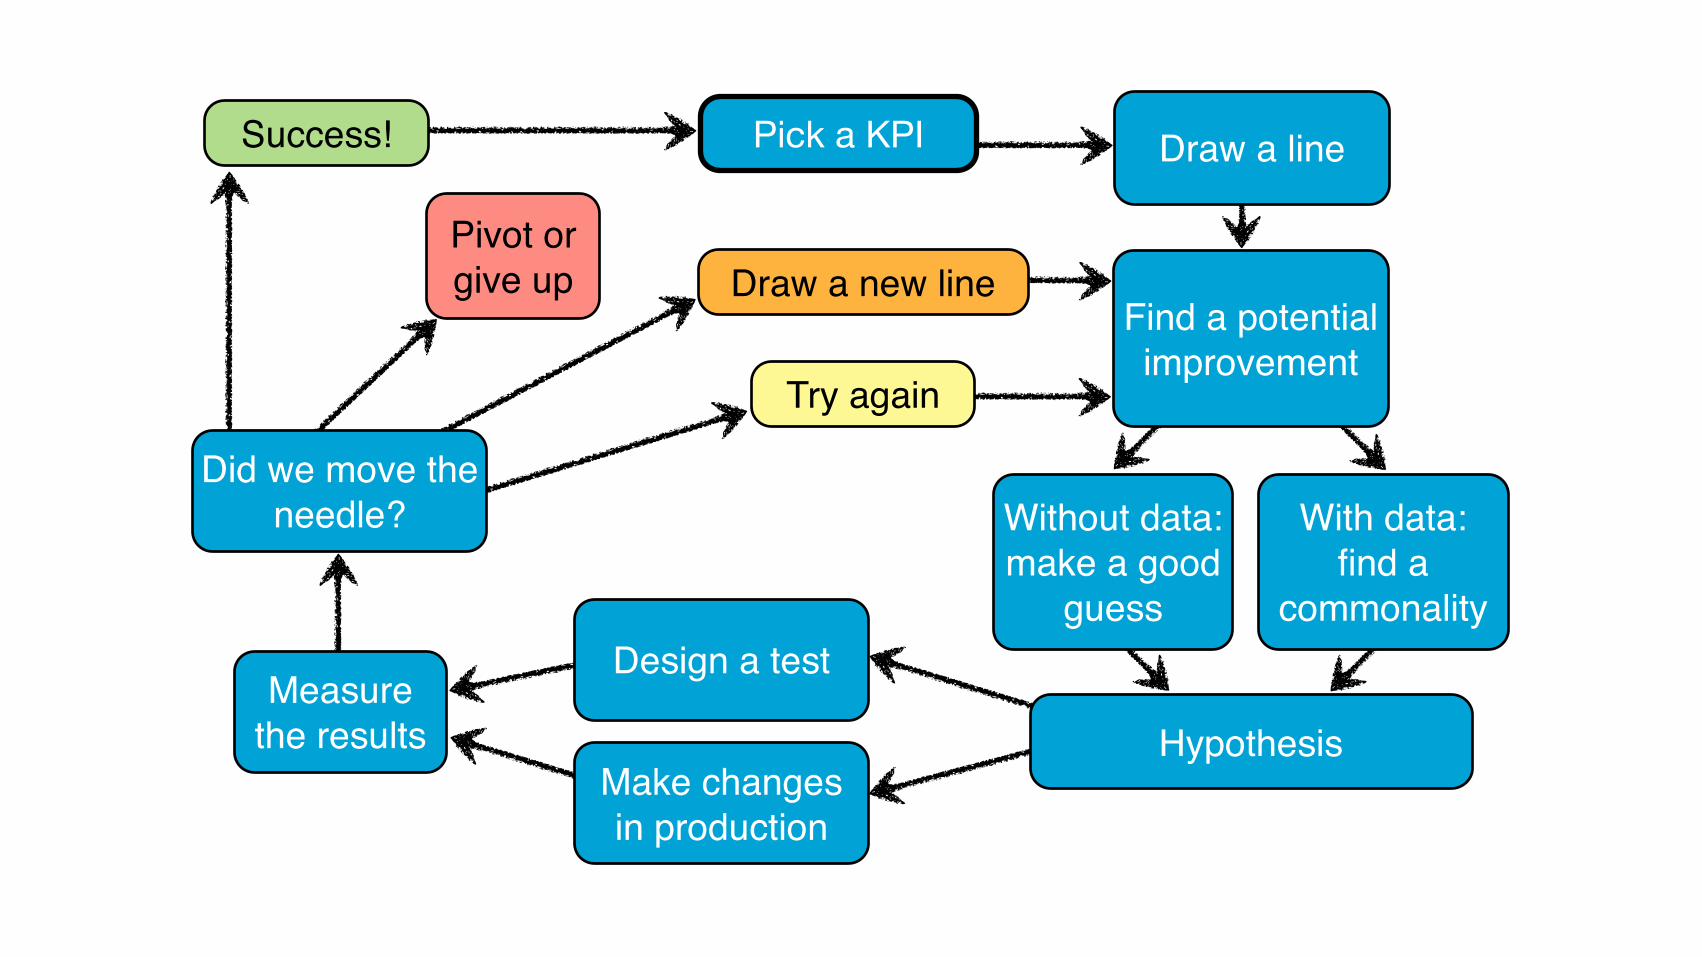
Draw a new linePivot orgive up
Try again
Success!
Did we move the needle?
Measure the results
Make changes in production
Design a test
Hypothesis
With data:find a
commonality
Without data: make a good
guess
Find a potential improvement
Draw a linePick a KPI

Do AirBnB hosts get more business if their property is professionally photographed?
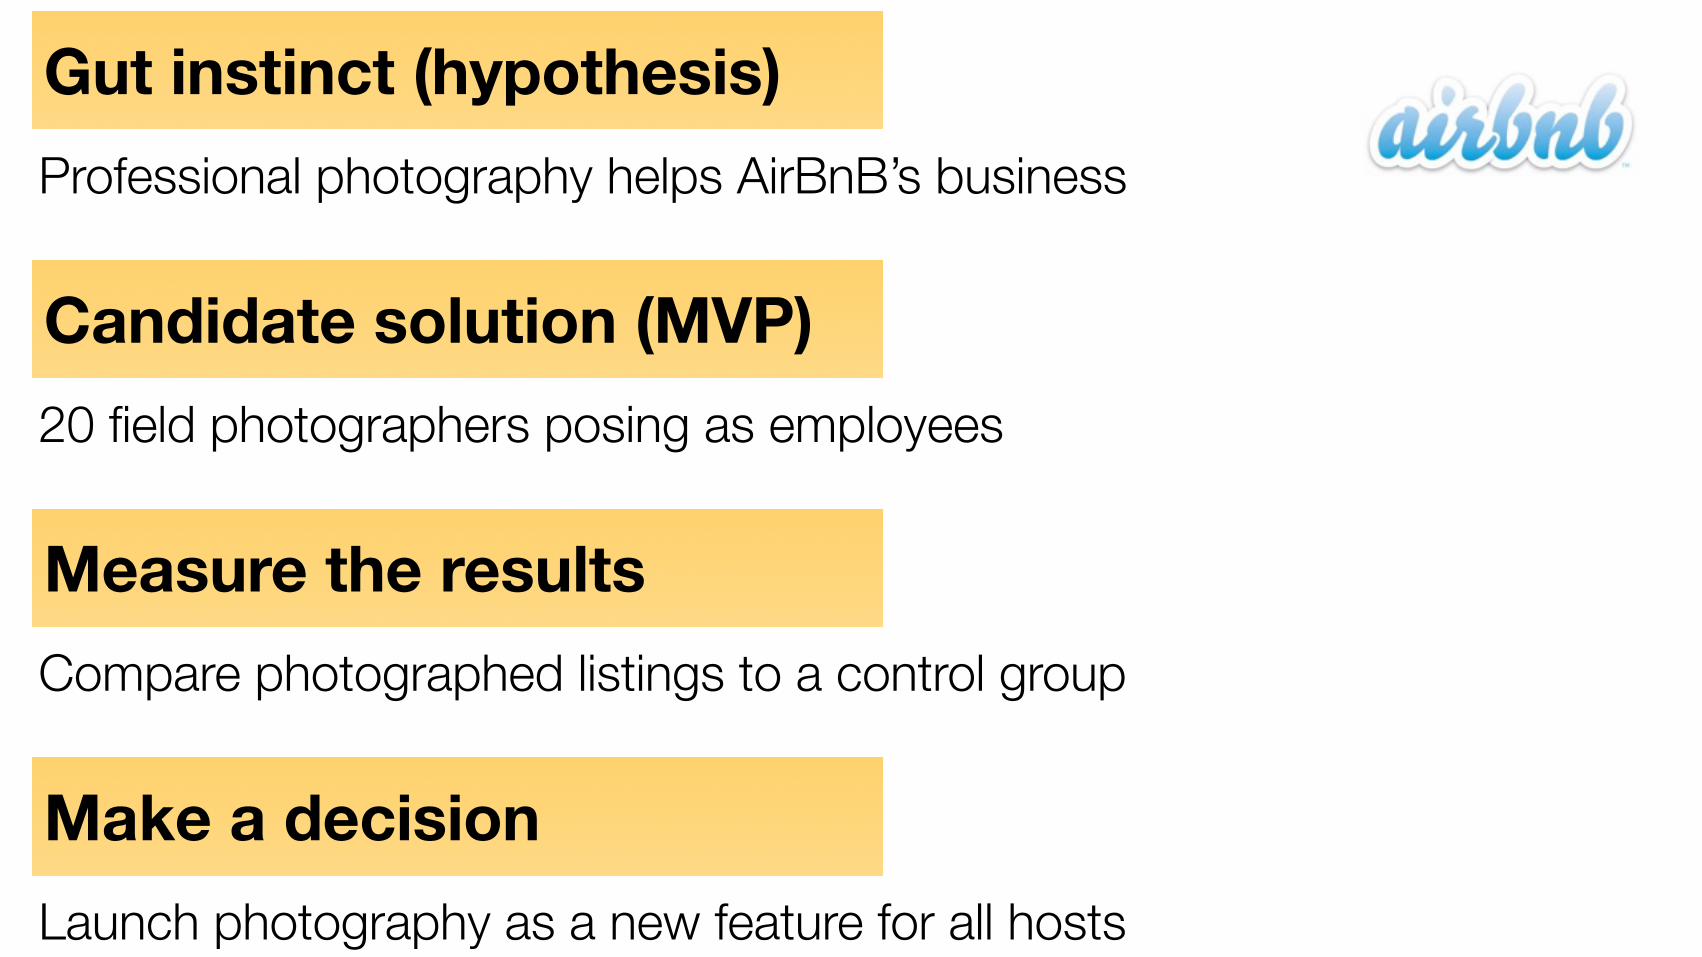
Gut instinct (hypothesis)Professional photography helps AirBnB’s business
Candidate solution (MVP)20 field photographers posing as employees
Measure the resultsCompare photographed listings to a control group
Make a decision Launch photography as a new feature for all hosts

5,000 shoots per month by February 2012

Hang on a second.
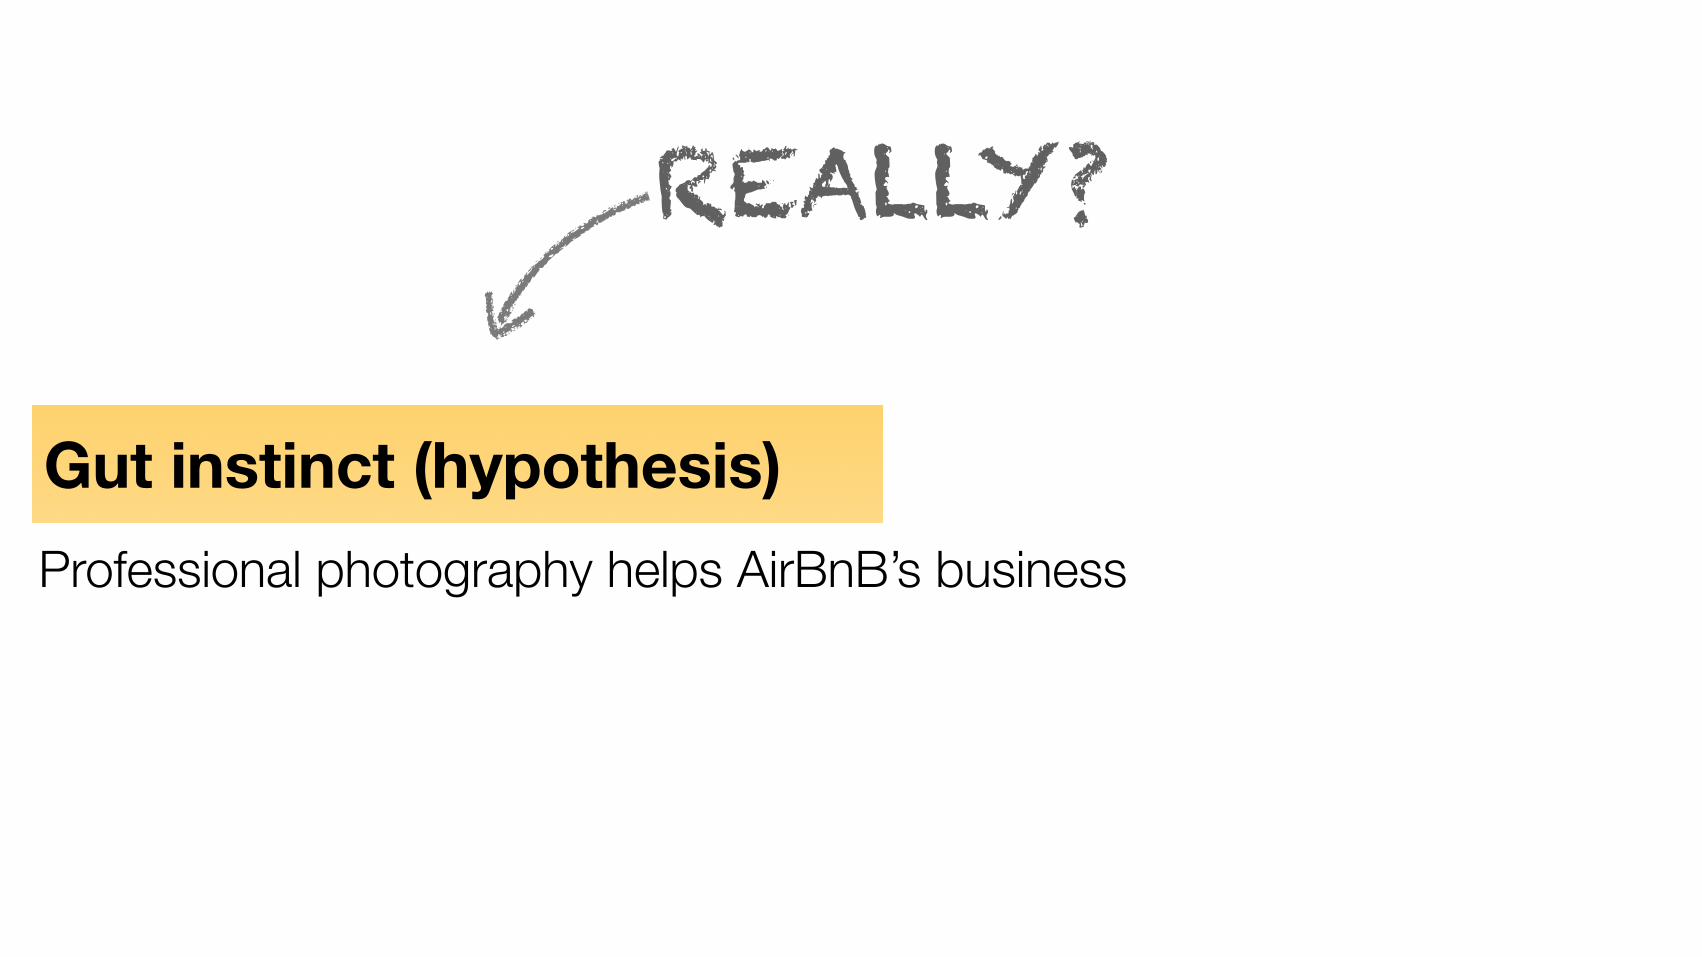
Gut instinct (hypothesis)Professional photography helps AirBnB’s business
REALLY?

Draw a new linePivot orgive up
Try again
Success!
Did we move the needle?
Measure the results
Make changes in production
Design a test
Hypothesis
With data:find a
commonality
Without data: make a good
guess
Find a potential improvement
Draw a linePick a KPI
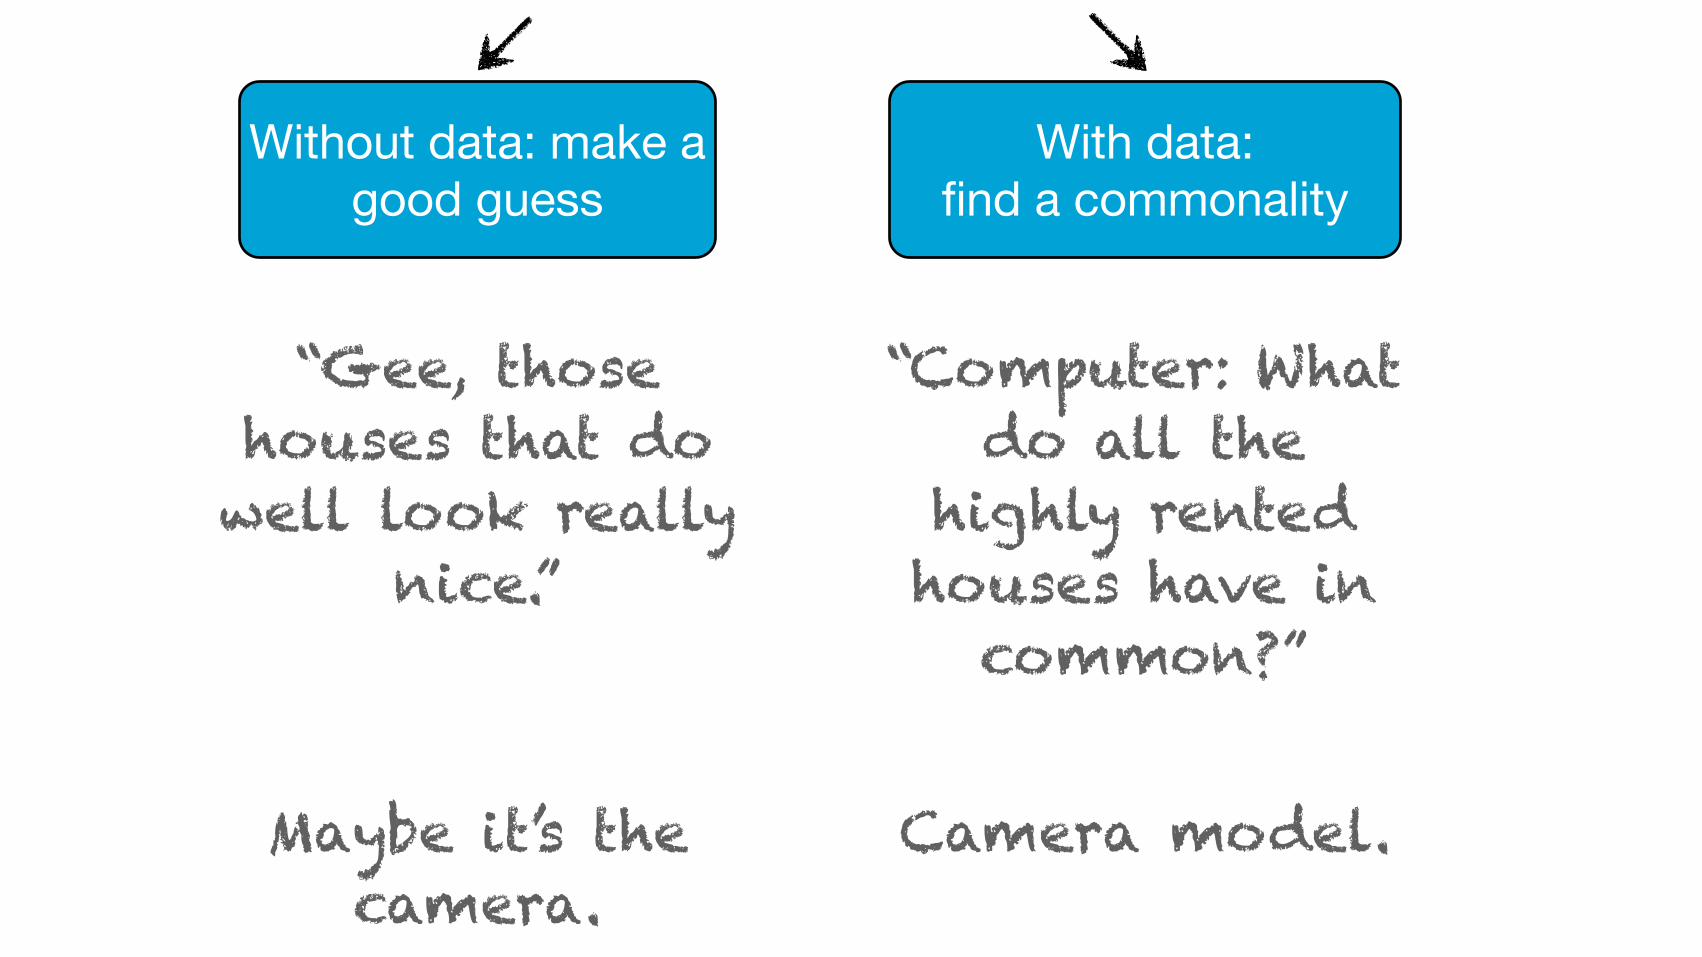
“Gee, those houses that do well look really
nice.”
Maybe it’s the camera.
“Computer: What do all the
highly rented houses have in
common?”
Camera model.
With data:find a commonality
Without data: make a good guess

Circle of Moms: Not enough engagement• Too few people were
actually using the product
• Less than 20% of any circles had any activity after their initial creation
• A few million monthly uniques from 10M registered users, but no sustained traction
• They found moms were far more engaged • Their messages to one another were on average 50% longer • They were 115% more likely to attach a picture to a post they wrote • They were 110% more likely to engage in a threaded (i.e. deep)
conversation • Circle owners’ friends were 50% more likely to engage with the circle • They were 75% more likely to click on Facebook notifications • They were 180% more likely to click on Facebook news feed items • They were 60% more likely to accept invitations to the app
• Pivoted to the new market, including a name change • By late 2009, 4.5M users and strong engagement • Sold to Sugar, inc. in early 2012

Landing page design A/B testing
Cohort analysis General analytics
URL shortening
Funnel analytics
Influencer Marketing
Publisher analytics
SaaS analytics
Gaming analytics
User interaction Customer satisfaction KPI dashboardsUser segmentation
User analytics Spying on users
Growth hacking
(is a word you should hate but will hear a lot about.)
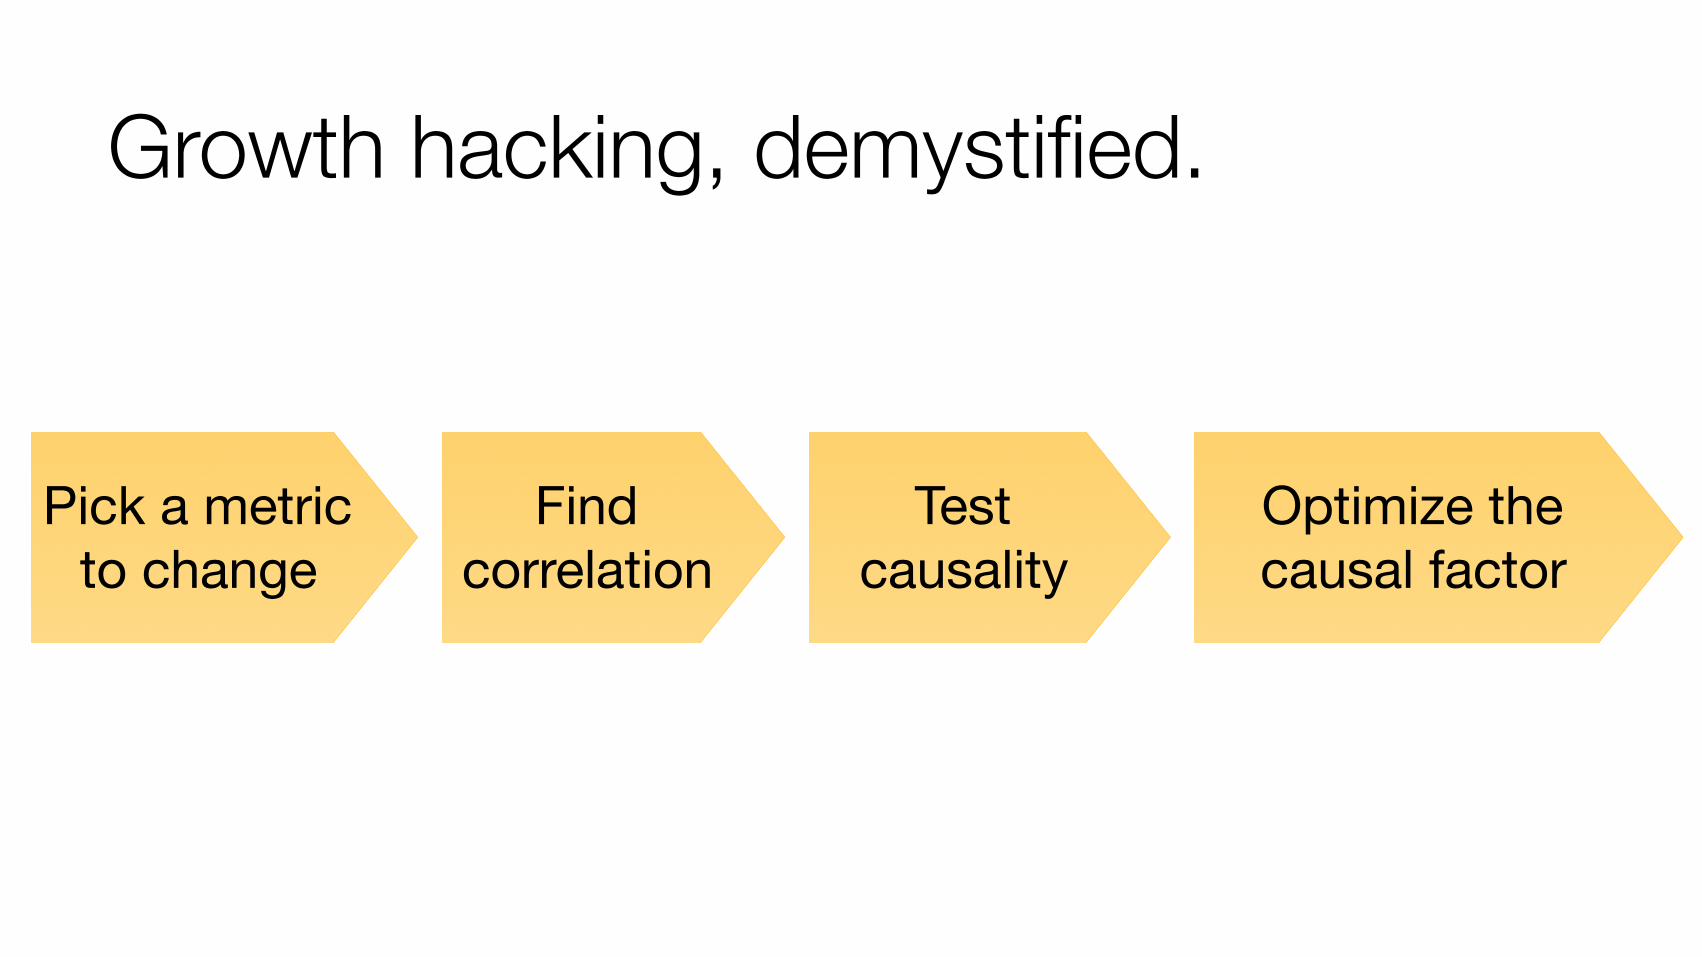
Growth hacking, demystified.
Find correlation
Test causality
Optimize the causal factor
Pick a metric to change

Is social action a leading indicator of donation?
http
://bl
og.ju
stgi
ving.
com
/nine
-reas
ons-
why
-soc
ial-a
nd-m
obile
-are
-the-
futu
re-o
f-fun
drais
ing/
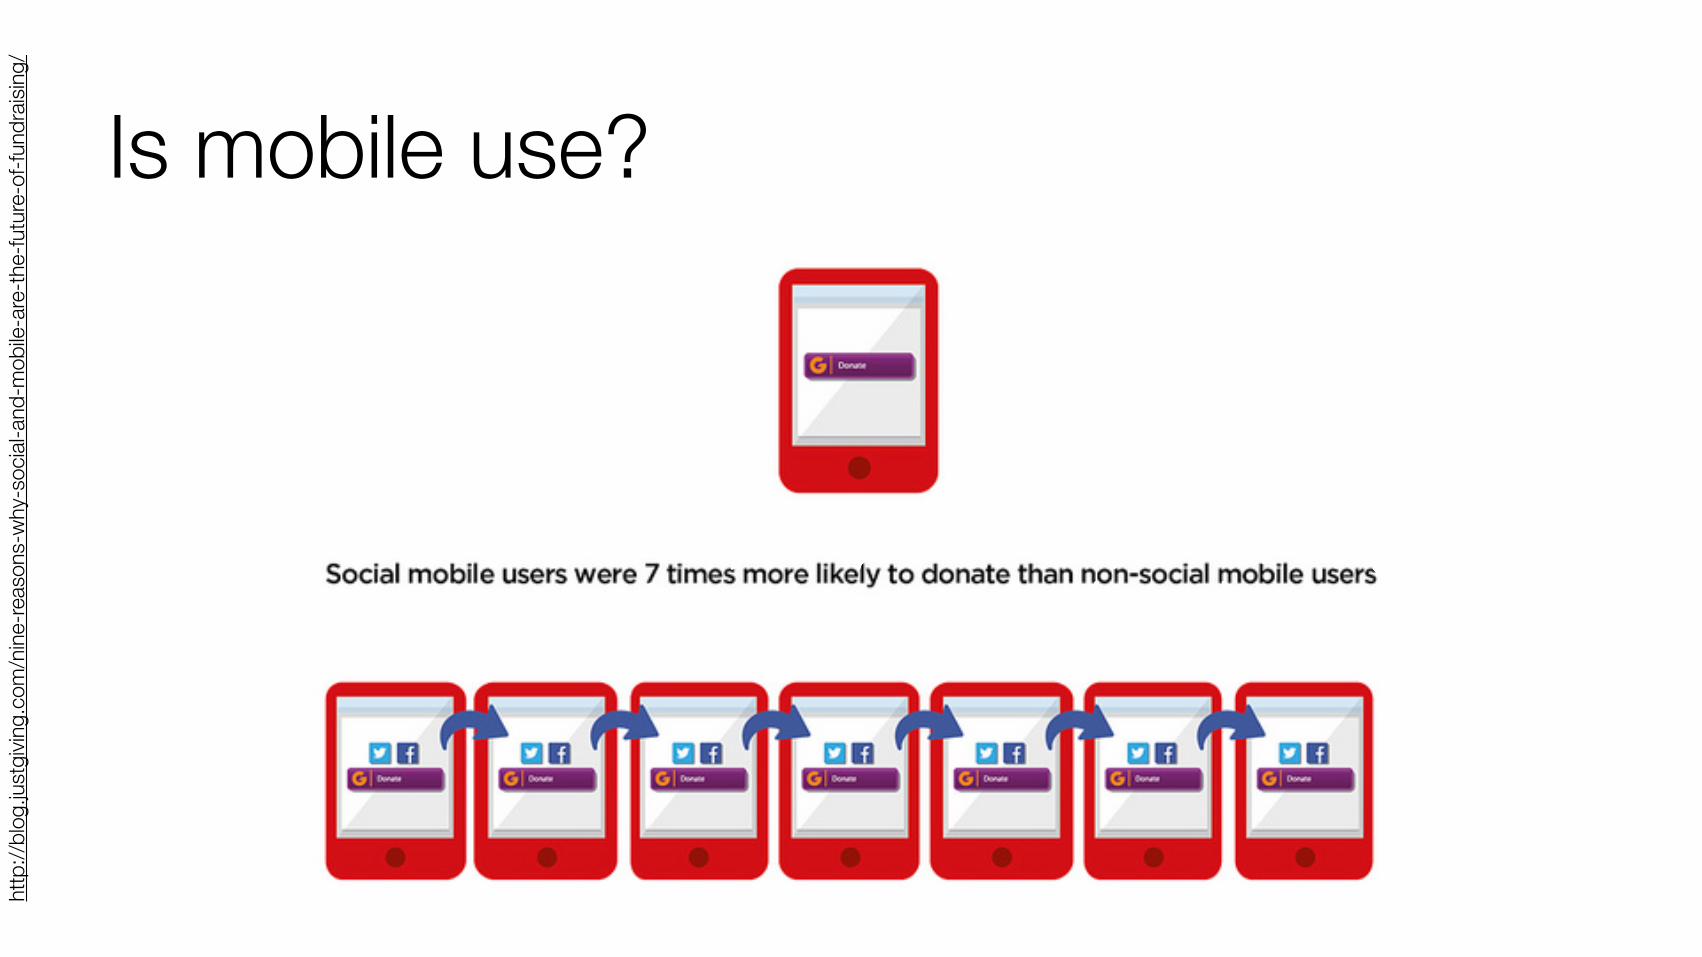
Is mobile use?ht
tp://
blog
.just
givin
g.co
m/n
ine-re
ason
s-w
hy-s
ocial
-and
-mob
ile-a
re-th
e-fu
ture
-of-f
undr
aising
/
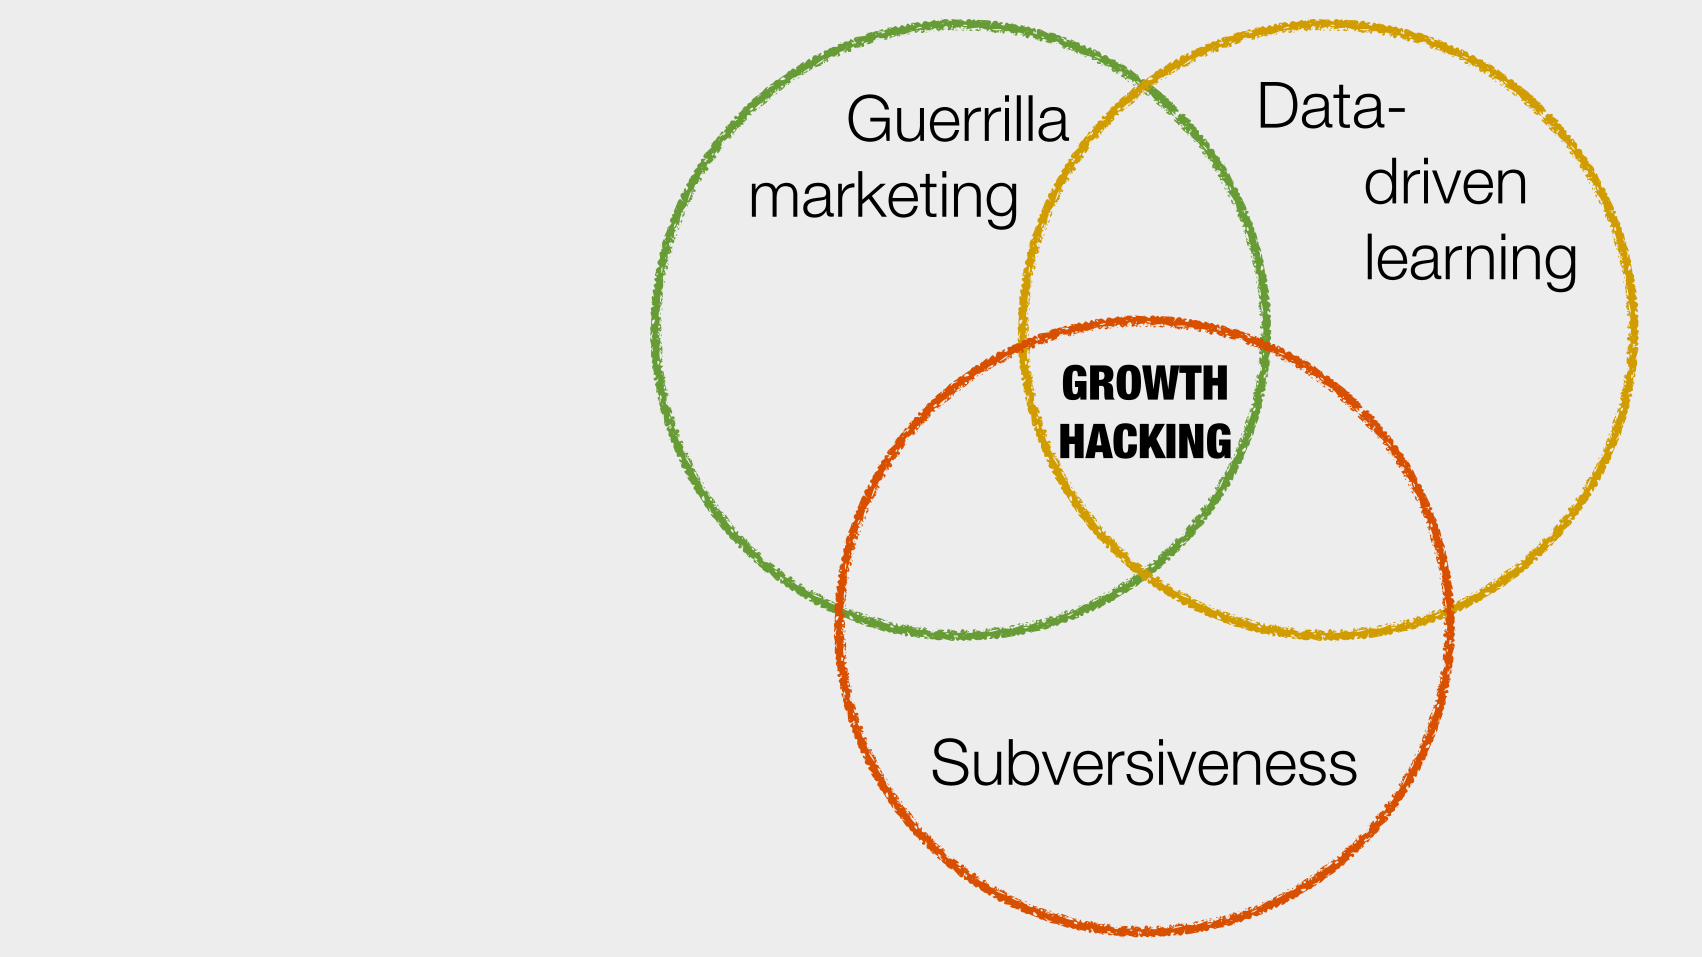
Guerrillamarketing
Data-drivenlearning
Subversiveness
GROWTHHACKING

AirBnB and Craigslist


Take baby steps.

Netflix

Tesla
http://www.hdwallpapersinn.com/wp-content/uploads/2012/12/600-tesla.jpg
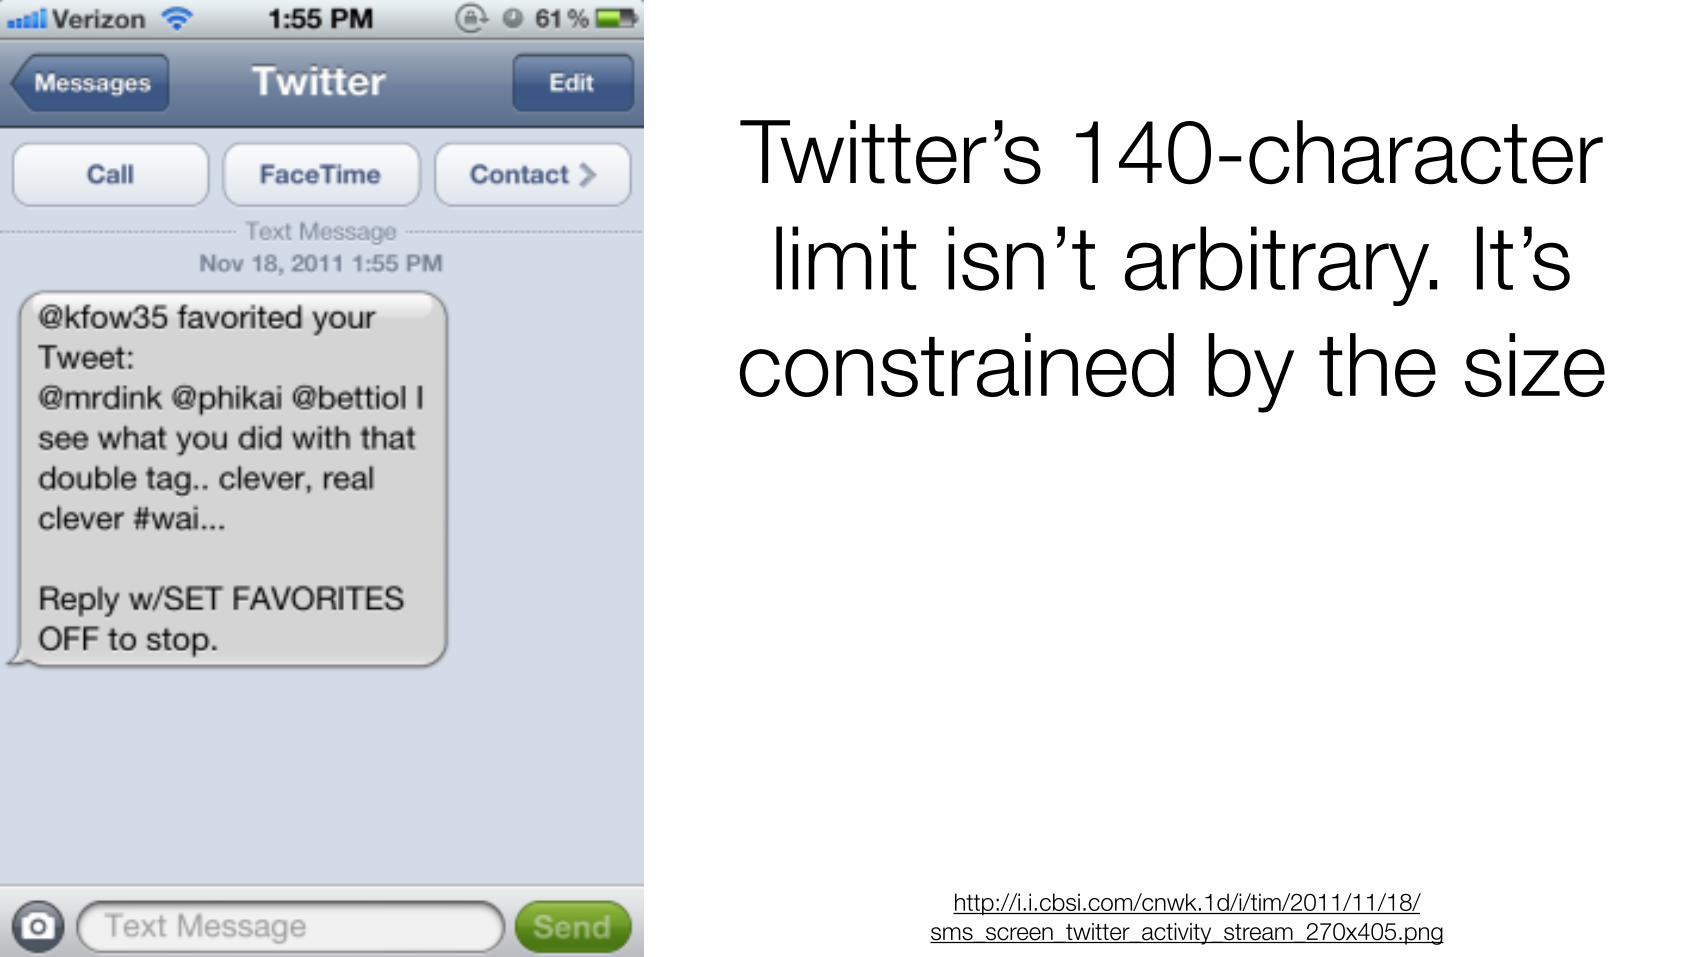
Twitter’s 140-character limit isn’t arbitrary. It’s
constrained by the size
http://i.i.cbsi.com/cnwk.1d/i/tim/2011/11/18/sms_screen_twitter_activity_stream_270x405.png

http://www.flickr.com/photos/bootbearwdc/1243690099/
Think subversively.

To summarize:
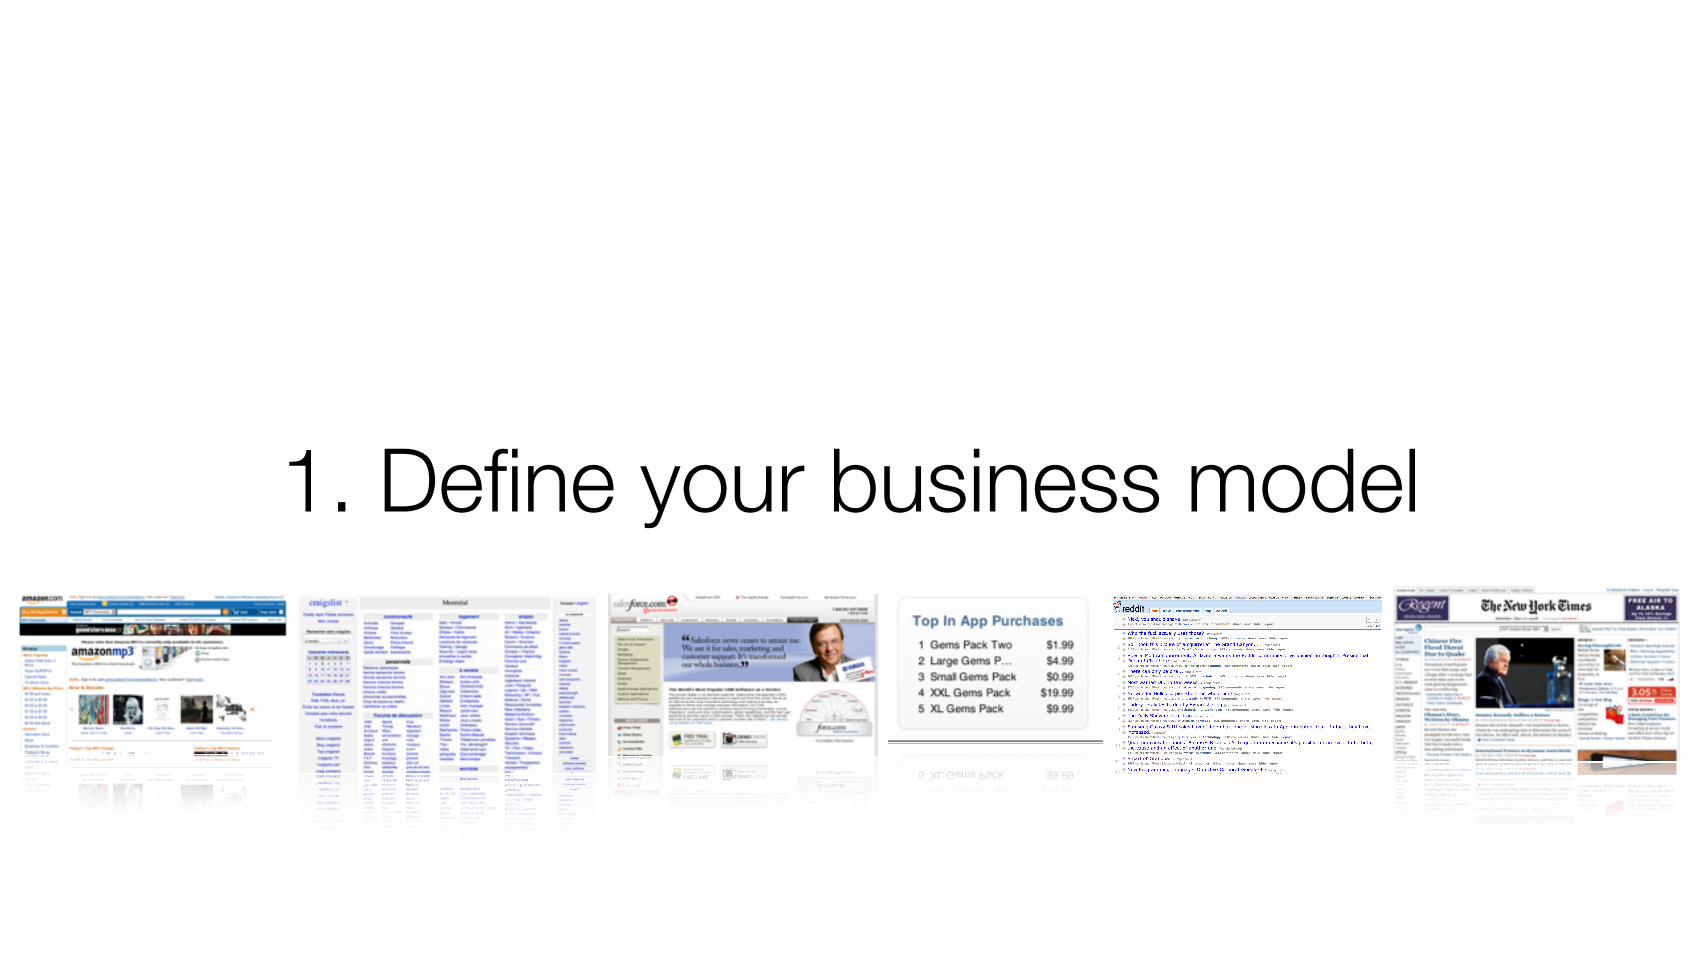
1. Define your business model

2. Draw a system diagram
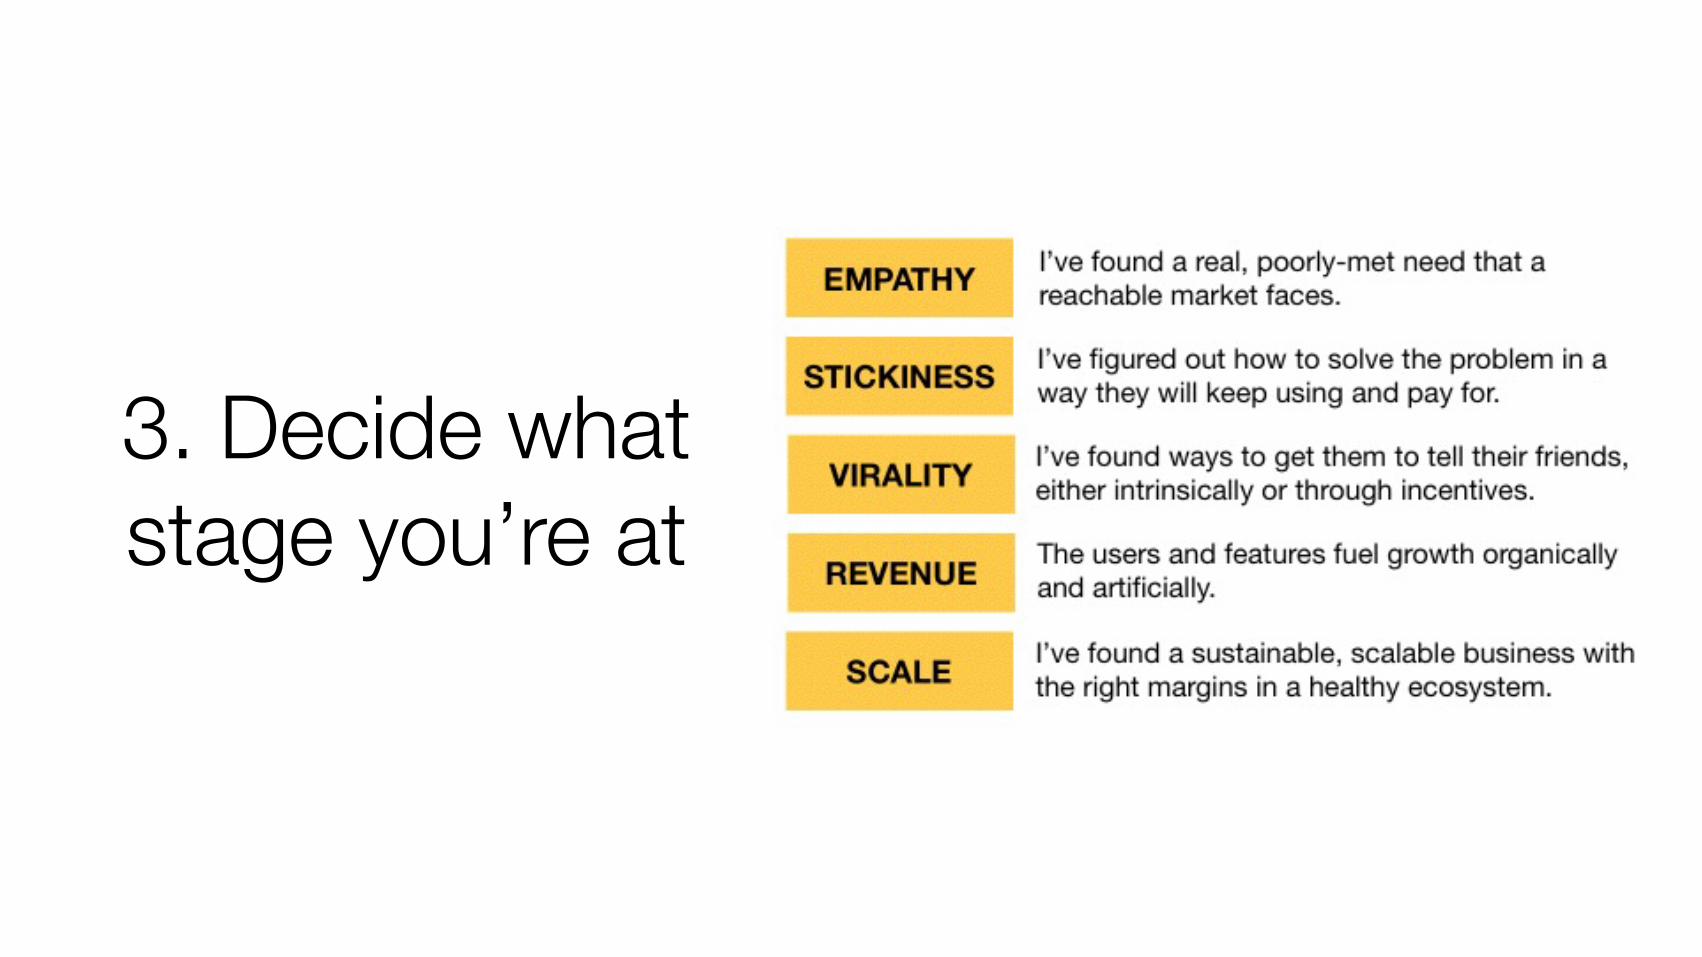
3. Decide what stage you’re at

4. Identify the One Metric That Matters (usually the one that is most broken)
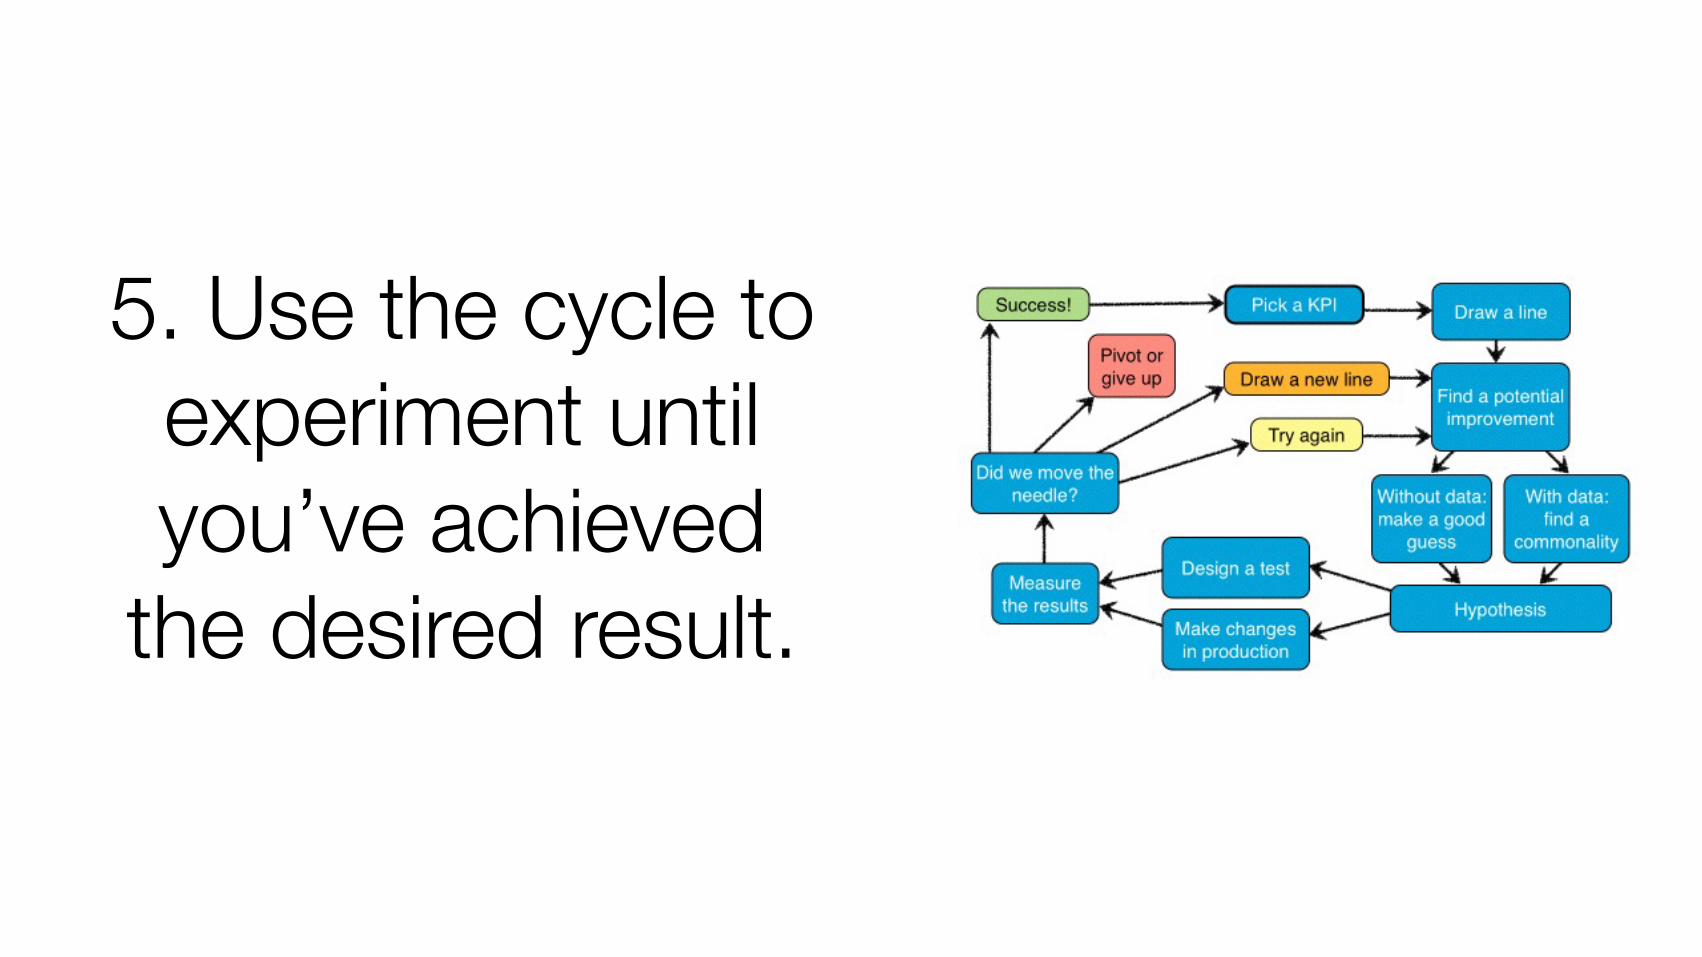
5. Use the cycle to experiment until you’ve achieved
the desired result.
6. Set up monitoring for this metric in case it breaks, and choose a new
OMTM

Conclusions

“The most important figures that one needs for management are unknown or unknowable, but successful management must nevertheless take account of them.”
Lloyd S. Nelson

Pic by Twodolla on Flickr. http://www.flickr.com/photos/twodolla/3168857844

ARCHIMEDES HAD TAKEN
BATHS BEFORE.
Once, a leader convinced others in the absence of data.

Now, a leader knows what questions to ask.

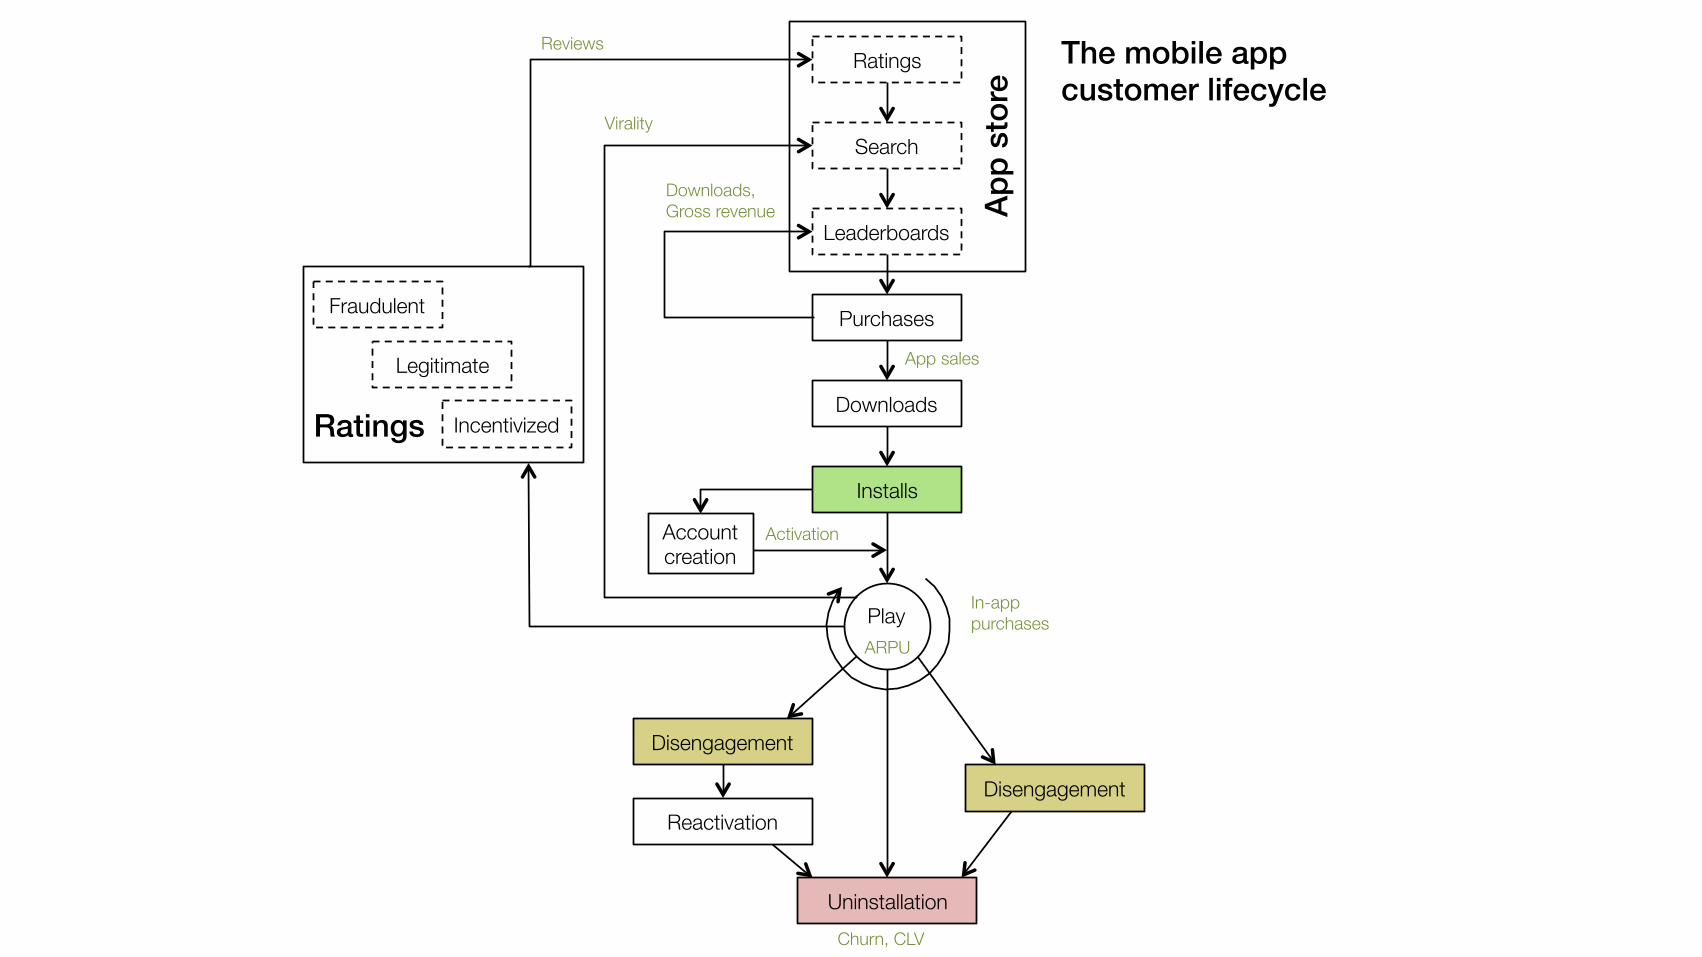
The mobile app !customer lifecycle!
Ratings Reviews
Search
Leaderboards
Purchases
Downloads
Installs
Play
Disengagement
Reactivation
Uninstallation
Disengagement
Account"creation
Virality
Downloads,"Gross revenue
ARPU
App sales
Activation
Churn, CLV
In-app"purchases
App
stor
e!
Incentivized
Legitimate
Fraudulent
Ratings!


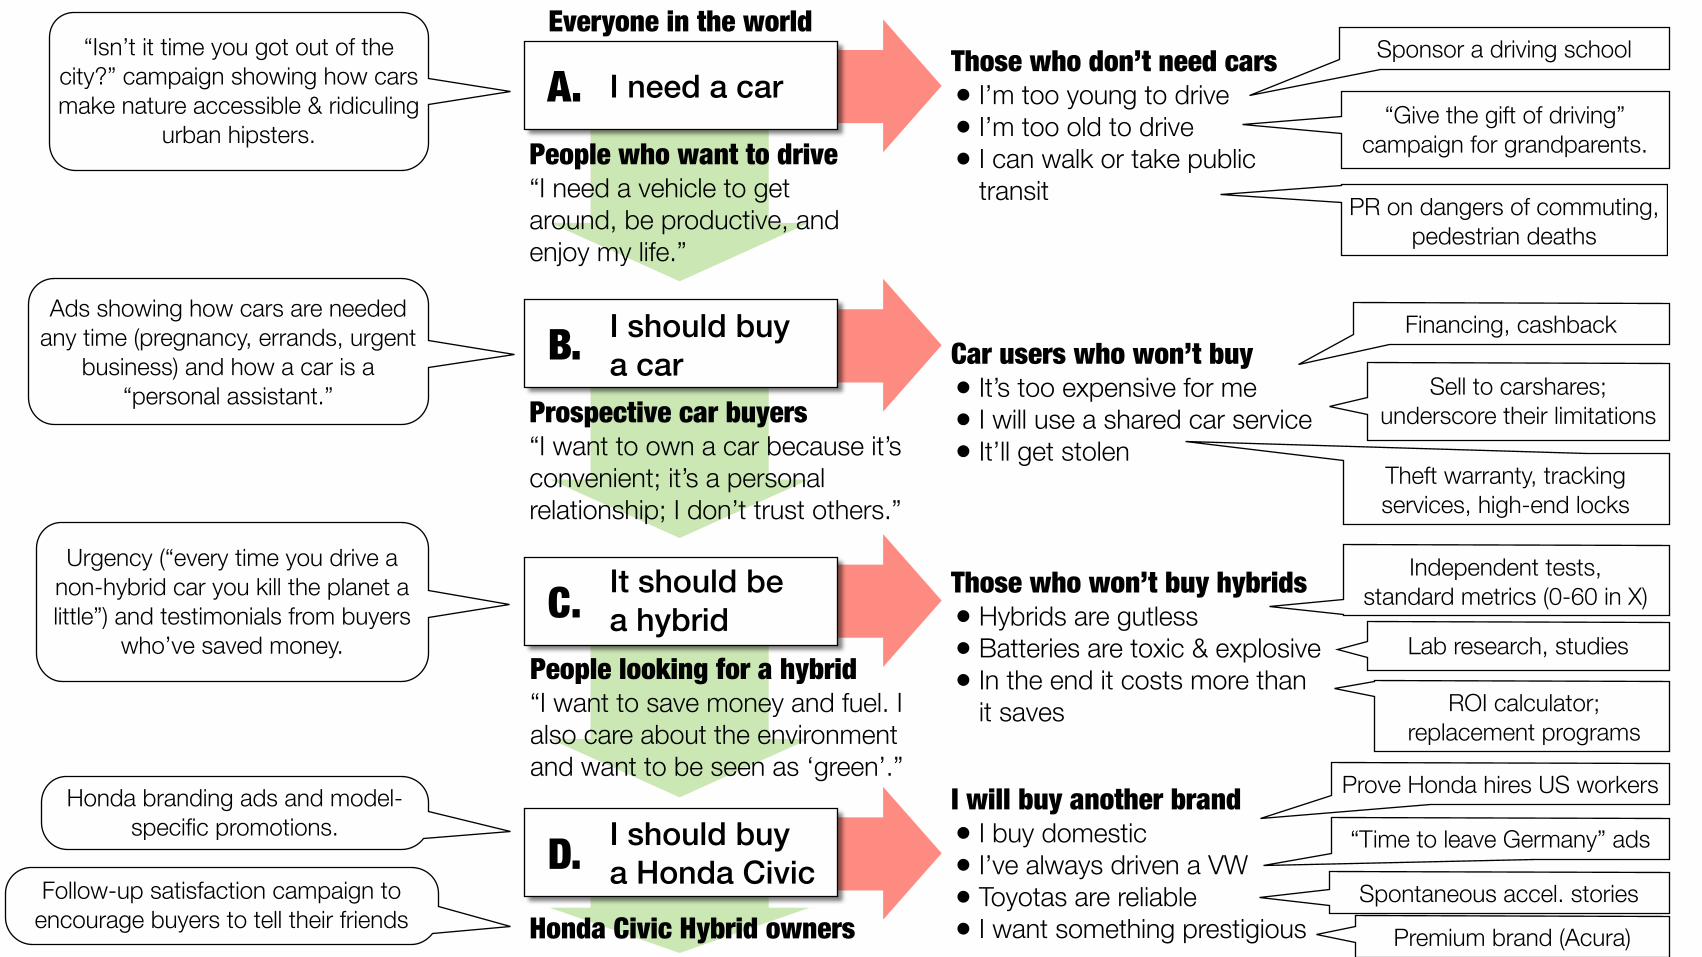
Building message maps

Build a message map.1. Understand the stages a buyer goes through 2. Create benefits; mitigate objections 3. Target the message to the stage the audience is at
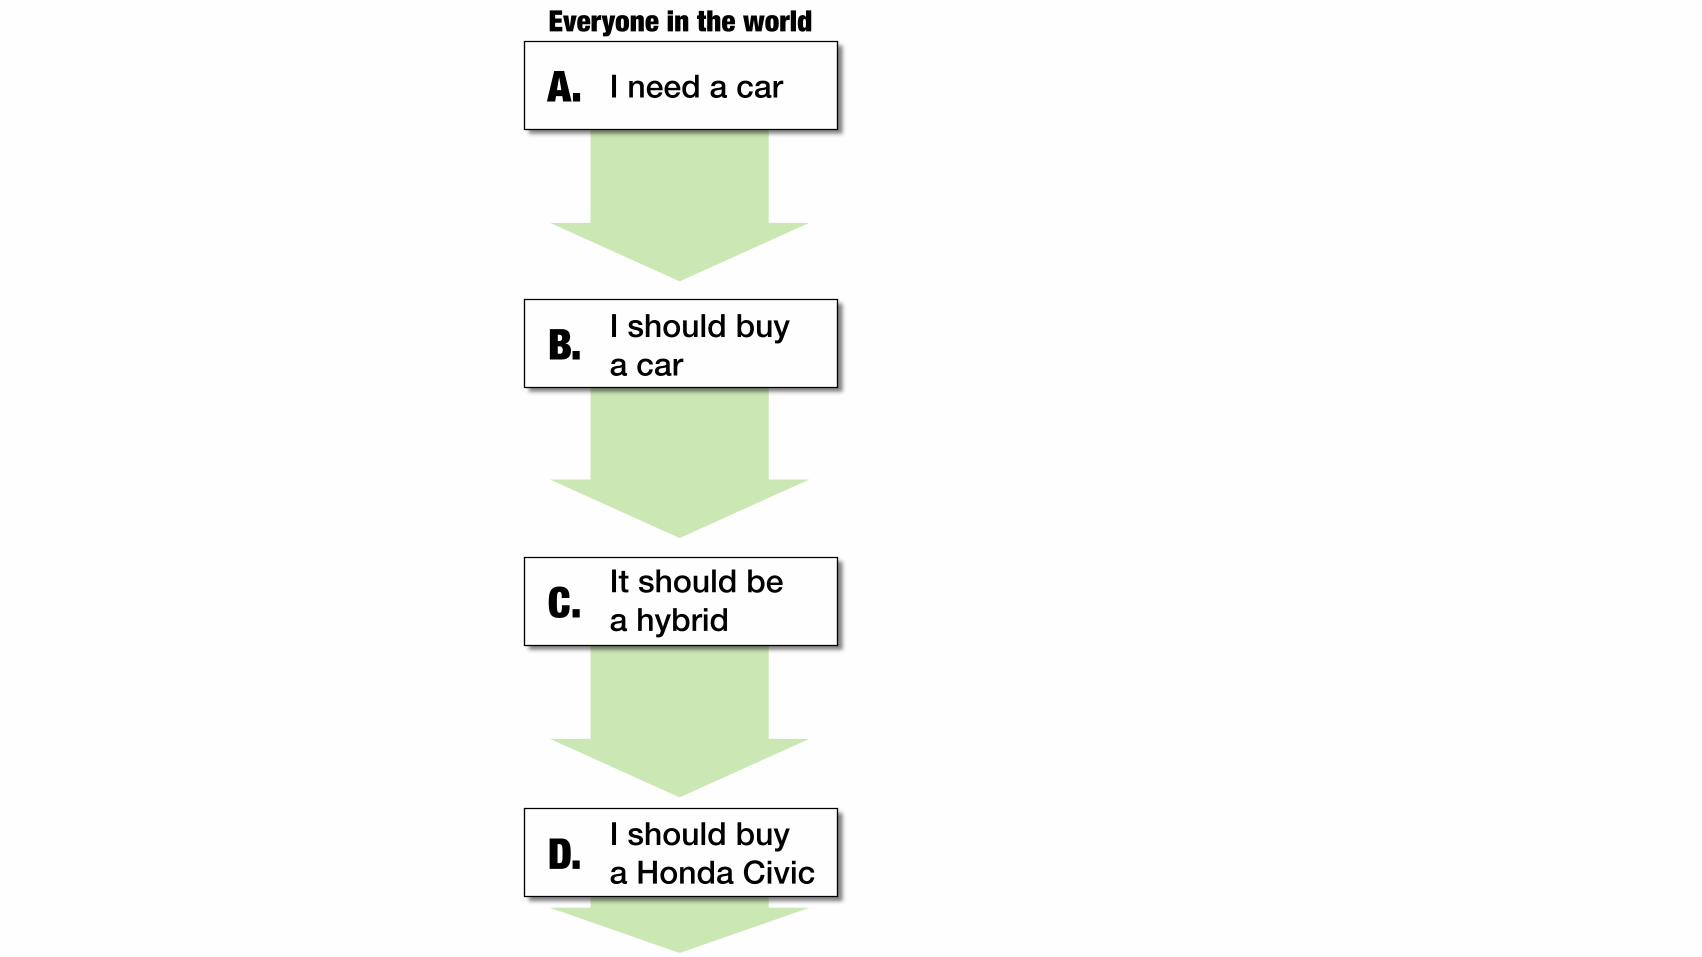
I need a carA.
I should buya carB.
It should bea hybridC.
I should buya Honda CivicD.
Everyone in the world

People who want to drive
Prospective car buyers
People looking for a hybrid
Honda Civic Hybrid owners
I need a carA.
I should buya carB.
It should bea hybridC.
I should buya Honda CivicD.
Everyone in the world

“Isn’t it time you got out of the city?” campaign showing how cars make nature accessible & ridiculing
urban hipsters.
Ads showing how cars are needed any time (pregnancy, errands, urgent
business) and how a car is a “personal assistant.”
Urgency (“every time you drive a non-hybrid car you kill the planet a little”) and testimonials from buyers
who’ve saved money.
Honda branding ads and model-specific promotions.
Follow-up satisfaction campaign to encourage buyers to tell their friends
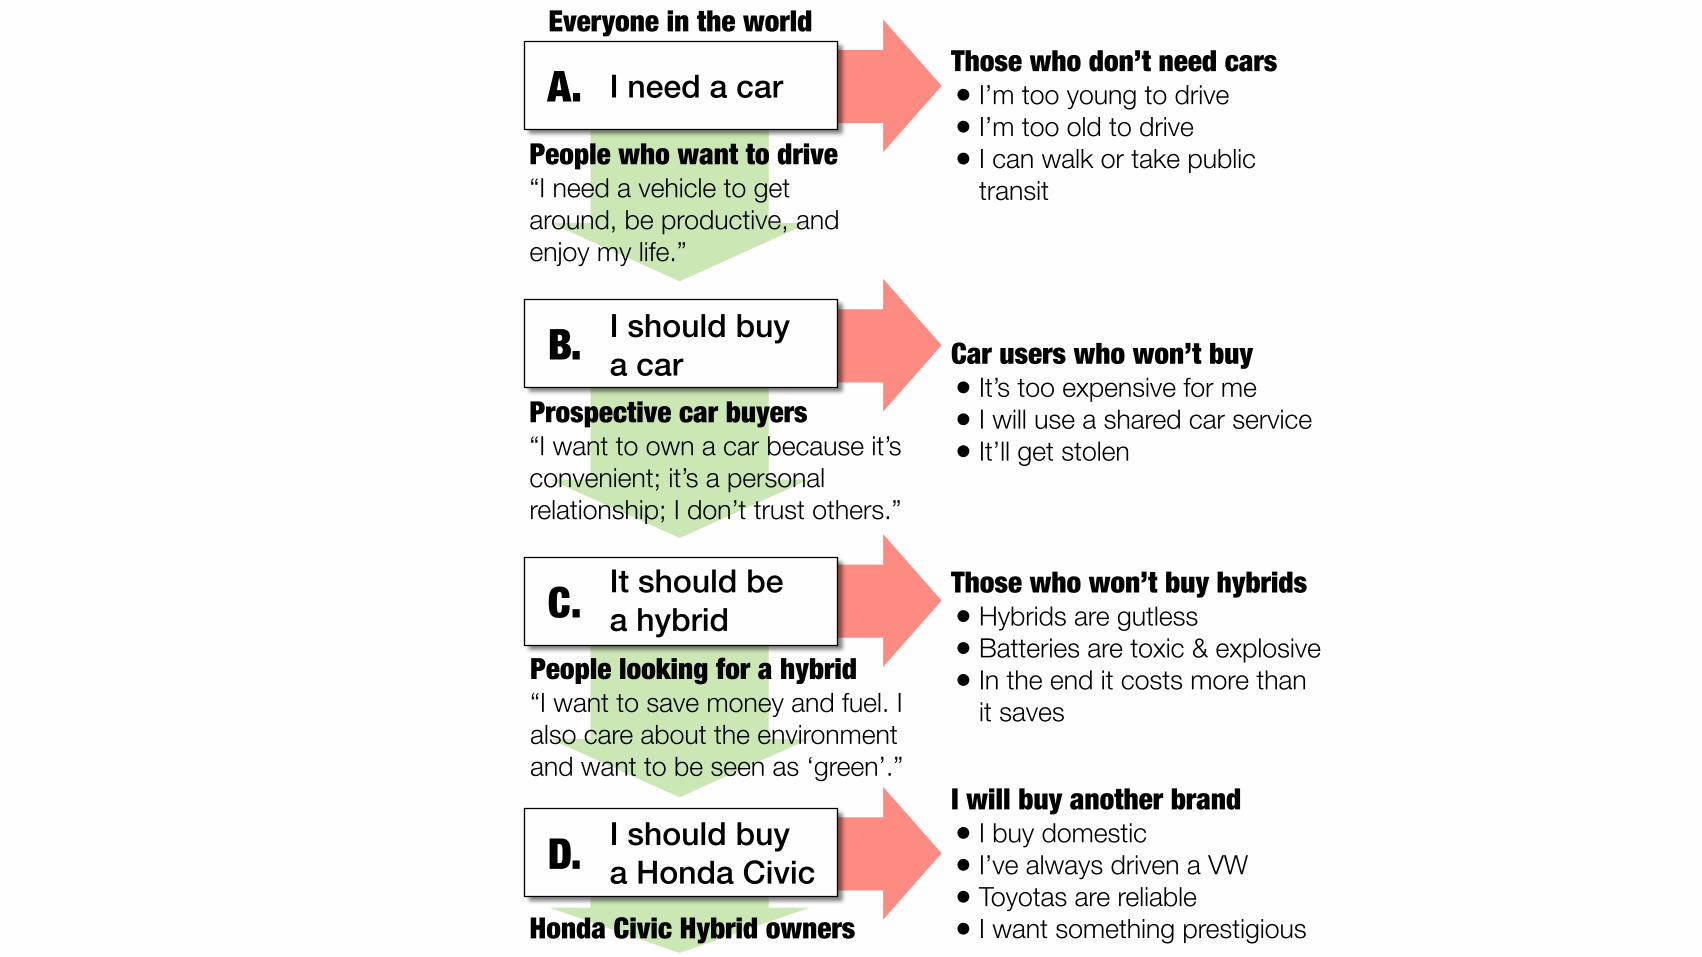
People who want to drive “I need a vehicle to get around, be productive, and enjoy my life.”
Prospective car buyers “I want to own a car because it’s convenient; it’s a personal relationship; I don’t trust others.”
People looking for a hybrid “I want to save money and fuel. I also care about the environment and want to be seen as ‘green’.”
Honda Civic Hybrid owners
I need a carA.
I should buya carB.
It should bea hybridC.
I should buya Honda CivicD.
Everyone in the world
People who want to drive “I need a vehicle to get around, be productive, and enjoy my life.”
Prospective car buyers “I want to own a car because it’s convenient; it’s a personal relationship; I don’t trust others.”
People looking for a hybrid “I want to save money and fuel. I also care about the environment and want to be seen as ‘green’.”
Honda Civic Hybrid owners
Those who don’t need cars • I’m too young to drive • I’m too old to drive • I can walk or take public
transit
Car users who won’t buy • It’s too expensive for me • I will use a shared car service • It’ll get stolen
Those who won’t buy hybrids • Hybrids are gutless • Batteries are toxic & explosive • In the end it costs more than
it saves
I will buy another brand • I buy domestic • I’ve always driven a VW • Toyotas are reliable • I want something prestigious
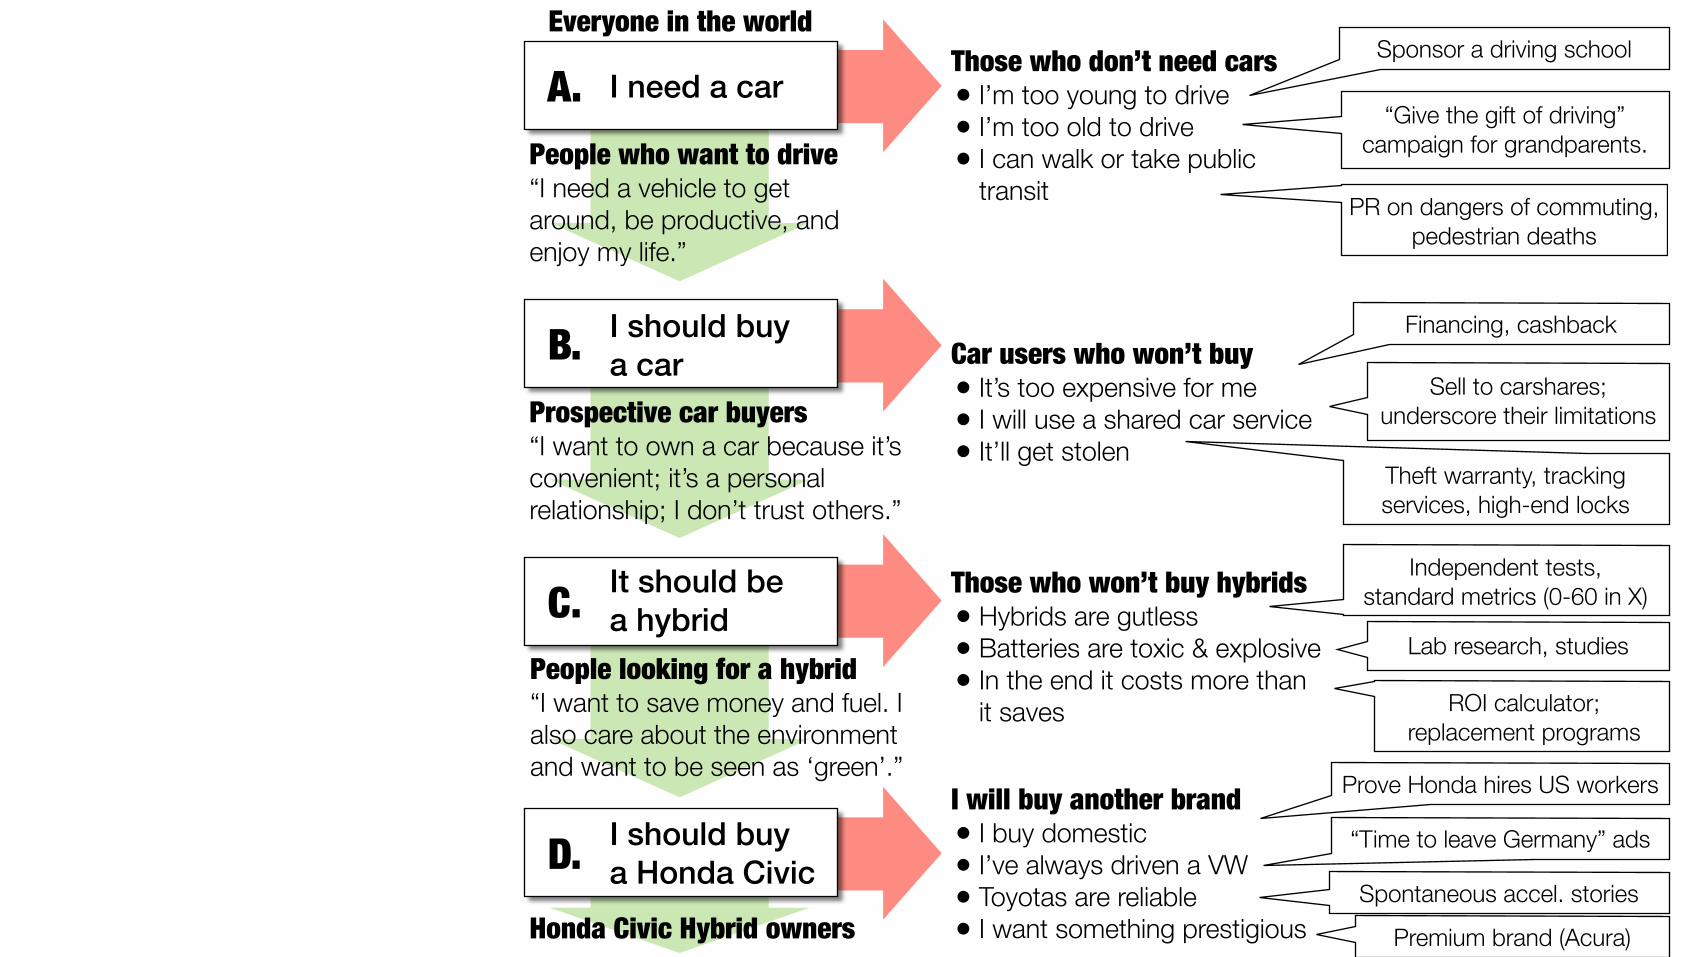
Sponsor a driving school
“Give the gift of driving” campaign for grandparents.
Financing, cashback
Sell to carshares; underscore their limitations
PR on dangers of commuting, pedestrian deaths
Theft warranty, tracking services, high-end locks
Independent tests, standard metrics (0-60 in X)
Lab research, studies
ROI calculator; replacement programs
Prove Honda hires US workers
“Time to leave Germany” ads
Spontaneous accel. stories
Premium brand (Acura)
I need a carA.
I should buya carB.
It should bea hybridC.
I should buya Honda CivicD.
Everyone in the world
“Isn’t it time you got out of the city?” campaign showing how cars make nature accessible & ridiculing
urban hipsters.
Ads showing how cars are needed any time (pregnancy, errands, urgent
business) and how a car is a “personal assistant.”
Urgency (“every time you drive a non-hybrid car you kill the planet a little”) and testimonials from buyers
who’ve saved money.
Honda branding ads and model-specific promotions.
Follow-up satisfaction campaign to encourage buyers to tell their friends
People who want to drive “I need a vehicle to get around, be productive, and enjoy my life.”
Prospective car buyers “I want to own a car because it’s convenient; it’s a personal relationship; I don’t trust others.”
People looking for a hybrid “I want to save money and fuel. I also care about the environment and want to be seen as ‘green’.”
Honda Civic Hybrid owners
Those who don’t need cars • I’m too young to drive • I’m too old to drive • I can walk or take public
transit
Car users who won’t buy • It’s too expensive for me • I will use a shared car service • It’ll get stolen
Those who won’t buy hybrids • Hybrids are gutless • Batteries are toxic & explosive • In the end it costs more than
it saves
I will buy another brand • I buy domestic • I’ve always driven a VW • Toyotas are reliable • I want something prestigious
Sponsor a driving school
“Give the gift of driving” campaign for grandparents.
Financing, cashback
Sell to carshares; underscore their limitations
PR on dangers of commuting, pedestrian deaths
Theft warranty, tracking services, high-end locks
Independent tests, standard metrics (0-60 in X)
Lab research, studies
ROI calculator; replacement programs
Prove Honda hires US workers
“Time to leave Germany” ads
Spontaneous accel. stories
Premium brand (Acura)
I need a carA.
I should buya carB.
It should bea hybridC.
I should buya Honda CivicD.
Everyone in the world