Slide 1- 1 Copyright © 2006 Pearson Education, Inc. Publishing as Pearson Addison-Wesley.
Upload
bernard-stevensCategory
view
213download
0
Slide R.2 - 1 Copyright © 2008 Pearson Education, Inc. Publishing as Pearson Addison-Wesley

Copyright © 2008 Pearson Education, Inc. Publishing as Pearson Addison-Wesley
Functions and Models
OBJECTIVES Determine whether or not a
correspondence is a function. Find function values. Graph functions and determine whether or
not a graph is that of a function. Graph functions that are piecewise defined.
R.2

Slide R.2 - 3 Copyright © 2008 Pearson Education, Inc. Publishing as Pearson Addison-Wesley
DEFINITION:
A function is a correspondence between a first set, called the domain, and a second set, called the range, such that each member of the domain corresponds to exactly one member of the range.
R.2 Functions and Models

Slide R.2 - 4 Copyright © 2008 Pearson Education, Inc. Publishing as Pearson Addison-Wesley
a) Microsoft StockDomain RangeMarch 14, 2006 $27.23March 15, 2006 $27.36March 16, 2006 $27.27March 17, 2006 $27.50
R.2 Functions and Models
Example 1: Determine whether or not each correspondence is a function.
This relationship is a function because each member of the domain corresponds to only one member of the range.
Slide R.2 - 5 Copyright © 2008 Pearson Education, Inc. Publishing as Pearson Addison-Wesley
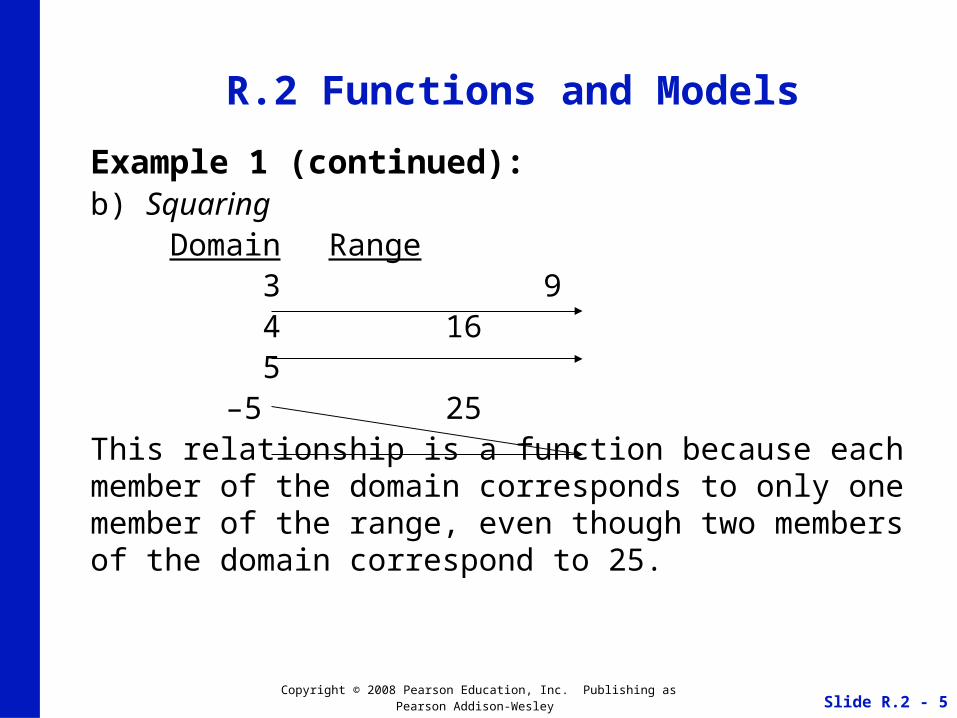
Example 1 (continued): b) Squaring
Domain Range 3 9 4 16 5 –5 25
This relationship is a function because each member of the domain corresponds to only one member of the range, even though two members of the domain correspond to 25.
R.2 Functions and Models

Slide R.2 - 6 Copyright © 2008 Pearson Education, Inc. Publishing as Pearson Addison-Wesley
Example 1 (continued): c) Baseball Teams
Domain RangeArizona DiamondbacksChicago Cubs
White SoxBaltimore Orioles
This relationship is not function because one member of the domain, Chicago, corresponds to two members of the range, Cubs and White Sox.
R.2 Functions and Models
Slide R.2 - 7 Copyright © 2008 Pearson Education, Inc. Publishing as Pearson Addison-Wesley
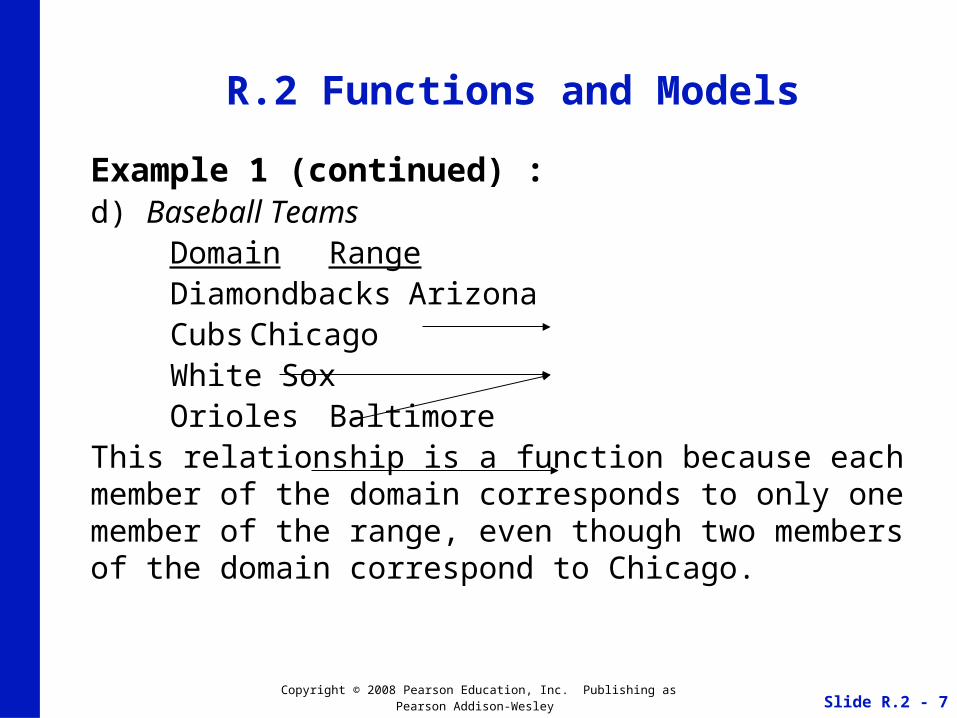
Example 1 (continued) : d) Baseball Teams
Domain RangeDiamondbacks ArizonaCubs ChicagoWhite SoxOrioles Baltimore
This relationship is a function because each member of the domain corresponds to only one member of the range, even though two members of the domain correspond to Chicago.
R.2 Functions and Models

Slide R.2 - 8 Copyright © 2008 Pearson Education, Inc. Publishing as Pearson Addison-Wesley
Example 3: The squaring function, f , is given by
Find
R.2 Functions and Models
.)( 2xxf ).( and ),1( ),( ),( ),1( ),3( hxftfkfkfff
f ( 3) ( 3)2 9
f (1) 12 1
f (k) k2
f k k 2 k
f (1 t) (1 t)2 1 2t t 2
f (x h) (x h)2 x2 2xh h2
Slide R.2 - 9 Copyright © 2008 Pearson Education, Inc. Publishing as Pearson Addison-Wesley
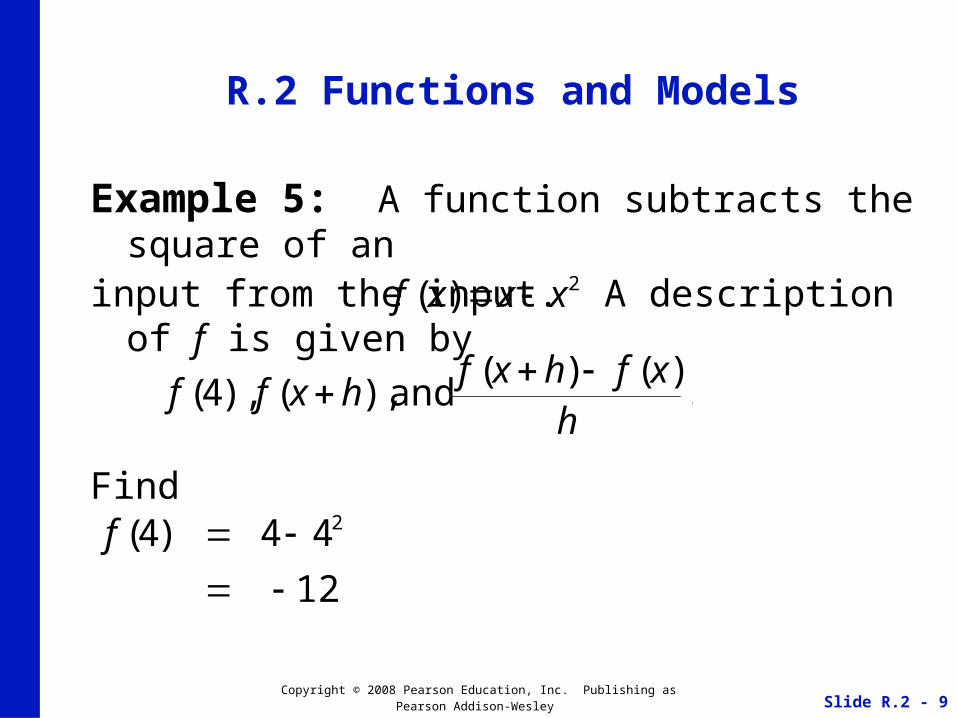
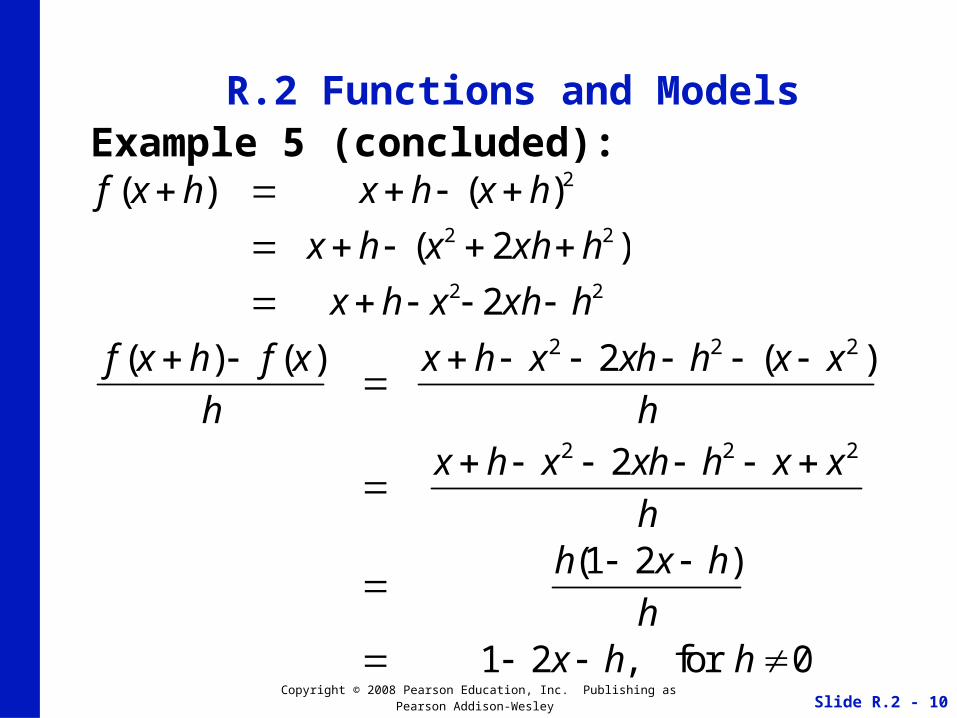
Example 5: A function subtracts the square of an input from the input. A description of f is given by
Find
R.2 Functions and Models
.)( 2xxxf
.)()(
and ),( ),4(h
xfhxfhxff
12
44)4( 2
f
Slide R.2 - 10 Copyright © 2008 Pearson Education, Inc. Publishing as Pearson Addison-Wesley
Example 5 (concluded): R.2 Functions and Models
22
22
2
2
)2(
)()(
hxhxhx
hxhxhx
hxhxhxf
f (x h) f (x)
h
x h x2 2xh h2 (x x2 )
h
x h x2 2xh h2 x x2
h
h(1 2x h)
h 1 2x h, for h 0
Slide R.2 - 11 Copyright © 2008 Pearson Education, Inc. Publishing as Pearson Addison-Wesley
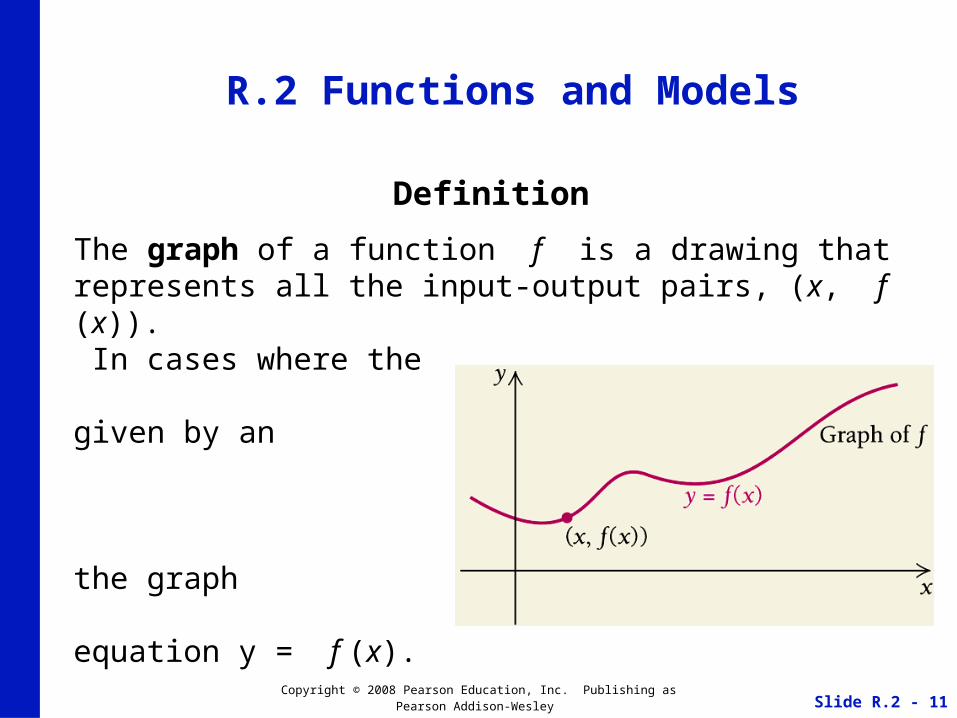
Definition
The graph of a function f is a drawing that represents all the input-output pairs, (x, f (x)). In cases where the function is given by an equation, the graph of a function is the graph of the equation y = f (x).
R.2 Functions and Models

Slide R.2 - 12 Copyright © 2008 Pearson Education, Inc. Publishing as Pearson Addison-Wesley
Example 6: Graph f (x) = x2 –1.
R.2 Functions and Models
Slide R.2 - 13 Copyright © 2008 Pearson Education, Inc. Publishing as Pearson Addison-Wesley
The Vertical Line Test
A graph represents a function if it is impossible to draw a vertical line that intersects the graph more than once.
R.2 Functions and Models
Slide R.2 - 14 Copyright © 2008 Pearson Education, Inc. Publishing as Pearson Addison-Wesley
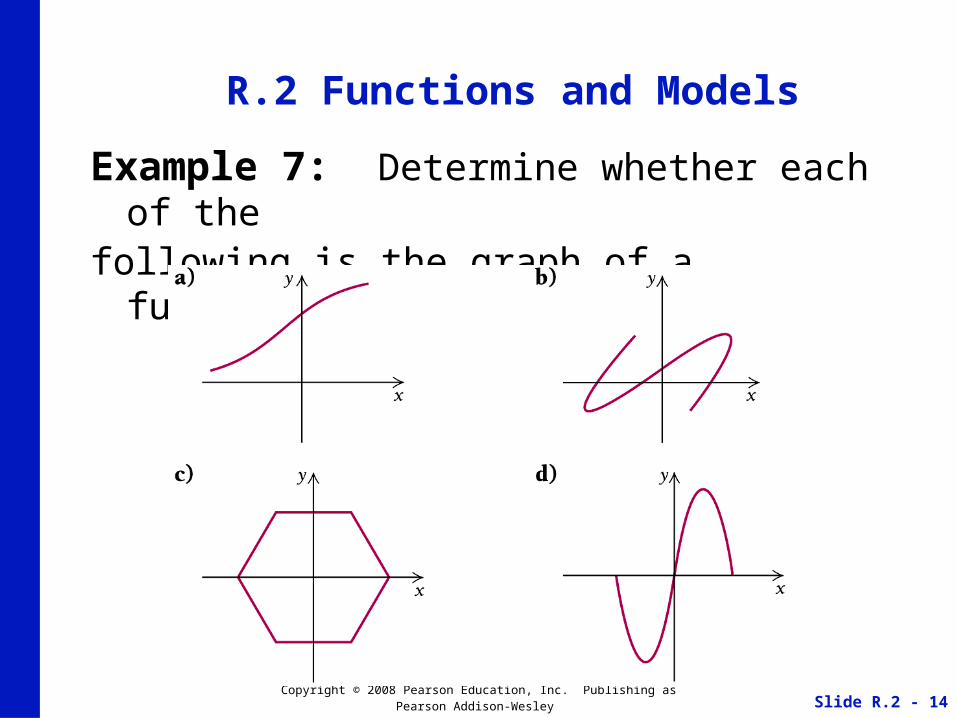
Example 7: Determine whether each of the following is the graph of a function.
R.2 Functions and Models
Slide R.2 - 15 Copyright © 2008 Pearson Education, Inc. Publishing as Pearson Addison-Wesley
Example 7 (concluded): a) The graph is that of a function. It impossible to draw
a vertical line that intersects the graph more than once.
b) The graph is not that of a function. A vertical line (in fact many) can intersect the graph more than once.
c) The graph is not that of a function.
d) The graph is that of a function.
R.2 Functions and Models
Slide R.2 - 16 Copyright © 2008 Pearson Education, Inc. Publishing as Pearson Addison-Wesley
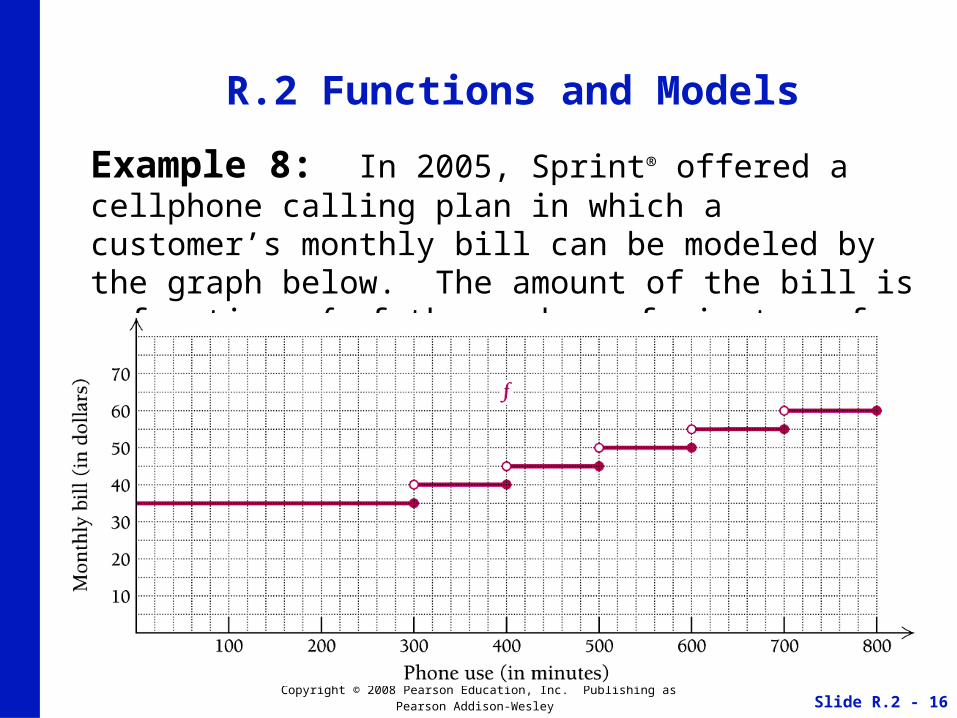
Example 8: In 2005, Sprint® offered a cellphone calling plan in which a customer’s monthly bill can be modeled by the graph below. The amount of the bill is a function f of the number of minutes of phone use.
R.2 Functions and Models
Slide R.2 - 17 Copyright © 2008 Pearson Education, Inc. Publishing as Pearson Addison-Wesley
Example 8 (continued): Each open dot on the graph indicates that the point at that location is not included in the graph.
a) Under this plan, if a customer uses the phone for 360 min, what is his or her monthly bill?what is his or her monthly bill?
b) If a monthly bill is $55, for how many minutes did b) If a monthly bill is $55, for how many minutes did the customer use the phone?the customer use the phone?
R.2 Functions and Models

Slide R.2 - 18 Copyright © 2008 Pearson Education, Inc. Publishing as Pearson Addison-Wesley
Example 8 (concluded): a) To find the bill for 360 min of use, we locate 360 on the
horizontal axis and move directly up to the graph. We then move across to the vertical axis. Thus, the bill is $40.
b) To find the number of minutes of use when a monthly bill is $55, we locate 55 on the vertical axis, move horizontally to the graph, and note that many inputs correspond to 55. If t represents the number of minutes of use, we must have 600 < t ≤ 700.
R.2 Functions and Models

Slide R.2 - 19 Copyright © 2008 Pearson Education, Inc. Publishing as Pearson Addison-Wesley
Example 10: Graph the function defined as follows:
The function is defined such that g(1) = 3 and for all other x-values (that is, for x ≠ 1), we have g(x) = –x + 2. Thus, to graph this function, we graph the line given by g(x) = –x + 2, but with an open dot at the point above x = 1. To complete the graph, we plot the point (1, 3) since g(1) = 3.
R.2 Functions and Models
g(x) 3, for x 1
x 2, for x 1

Slide R.2 - 20 Copyright © 2008 Pearson Education, Inc. Publishing as Pearson Addison-Wesley
Example 10 (concluded):
R.2 Functions and Models