Slide presentation SHB 2008 Q4
44
Handelsbanken January – December 2008 10 February 2009
Transcript of Slide presentation SHB 2008 Q4

HandelsbankenJanuary – December 2008
10 February 2009

2
Handelsbanken Group
SummaryQ4 2008 compared with Q3 2008
Operating profits rose by 39% to SEK 5,216m and by 20% excluding capital gains
Net interest income went up by 13% to SEK 5,474m
Inflow of household deposits +7%, loans to the public increased by 63bn
The Bank had 52% of new loans to Swedish companies and acquired 3,061 new corporate customers during the quarter
Good reputation in the funding market led to low funding costs
Liquidity reserves of more than SEK 300bn
Continued high level of cost-effectiveness in the Swedish branch operations
The Bank issued risk-bearing Tier I capital loans for SEK 2.6bn
Tier I capital ratio calculated according to Basel II rose to 10.5% and return on equity was 23.8%

3
Handelsbanken Group
Summary
January-December 2008 compared with January-December 2007
Operating profits went up by 4% to SEK 15,326m
Income grew more rapidly than expenses
Net interest income rose by 23% to SEK 19,223m
Liquidity was good throughout the period
Record inflow of household deposits, 19%, lending increased by 15%
The number of satisfied customers continued to increase
The board proposes an ordinary dividend of SEK 7.00 per share (8.50)

4
Q4 Q3 ChangeSEK m 2008 2008 %
Net interest income 5,474 4,856Net fee and commission income 1,694 1,656Net gains/losses on financial items at fair value 2,229 483Risk result - insurance 50 55Other income 65 74 Total income 9,512 7,124Staff costs -2,170 -2,015Other expenses -1,430 -1,118Total expenses -3,600 -3,133Profit before loan losses 5,912 3,991Loan losses, net -696 -231Disposal prop. equipmt./ intang. assets 0 -2Operating profit 5,216 3,758 39
Handelsbanken Group
Income statement, Q4 2008 compared to Q3 2008

5
Q4 2008
Q32008
Jan-Dec 2008
RoE total operations, actual tax 24.0% 15.4% 16.2%
RoE total operations, after standard tax 20.0% 15.1% 15.0%
C/I-ratio, before loan losses continuing operations 37.8% 44.0% 44.3%
Earnings per share total operations, SEK 7.31 4.51 19.46
Capital ratio, Basel II 16.0% 15.2% 16.0%
Tier I ratio, Basel II 10.5% 10.0% 10.5%
Change Q4 Tier I ratio, SEK m 5,074
Handelsbanken Group
Key ratios

6
0
1 000
2 000
3 000
4 000
5 000
6 000
Q1 -98
Q3 -98
Q1 -99
Q3 -99
Q1 -00
Q3 -00
Q1 -01
Q3 -01
Q1 -02
Q3 -02
Q1 -03
Q3 -03
Q1 -04
Q3 -04
Q1 -05
Q3 -05
Q1 -06
Q3 -06
Q1 -07
Q3 -07
Q1 -08
Q3 -08
SEK m
Handelsbanken Group
Net interest income, quarterly
From 2004 according to IFRS

7
Average volumes, SEK bn
Q 42008
Change Q3 2008
Change Q4 2007
Branch offices in Sweden
Private 157 7% 22%
Corporate 146 7% 16%
Total 303 7% 19%
Branch offices outside Sweden
Private 41 8% 24%
Corporate 116 12% 7%
Total 157 11% 11%
Other operations 47 -14% -42%
Total 507 6% 6%
Handelsbanken Group
Deposits from the public

8
Handelsbanken Group
Loans to the public
Average volumes, SEK bn
Q42008
ChangeQ3 2008
ChangeQ4 2007
Branch offices in Sweden
Private 472 2% 10%
of which mortgage loans 413 2% 10%
Corporate 488 3% 10%
Total 960 2% 10%
Branch offices outside Sweden
Private 131 8% 21%
Corporate 358 10% 42%
Total 489 9% 36%
Other operations 13 -1% -30%
Total 1,462* 5%* 16%
* Of which currency effect SEK 18.4bn, excl currency effects volume increases by 3%

9
SEK m Q4 Q3 Change %
Brokerage 453 343 32
Mutual funds and custody 317 376 -16
Advisory services 49 58 -16
Insurance 122 125 -2
Payments 564 586 -4
Lending & deposits 248 238 4
Guarantees 124 106 18
Other 126 127 -1
Commission expenses -309 -303 2
Total 1,694 1,656 2
Handelsbanken Group
Fees and commissions, Q4 2008 compared to Q3 2008

10
Handelsbanken Group
Net gains/losses on financial items at fair value
-1 500
-1 000
-500
0
500
1 000
1 500
2 000
2 500
3 000
Q4 Q1 Q2 Q3 Q4
Trading* Stapel 2Available for sale OtherLiquidity portfolio
20082008 2008
SEK m
2008
523
-177
2007
634 483
2229
*Incl fair value option

11
Handelsbanken Group
Expenses, January – December
SEK m 2008 2007ChangeSEK m
Change%
Staff costs -8,114 -7,528 586 7.8
Other expenses -4,688 -4,487 201 4.5
Depreciation -427 -353 74 21
Total expenses -13,229 -12,368 861 7.0
%-points
Expenses outside Sweden 850 6.9
Expenses in Sweden 11 0.1
861 7.0

12
Handelsbanken Group
Expenses, Q4 2008 compared to Q4 2007
SEK m 2008
Q 42007
Q 4ChangeSEK m
Change %
Staff costs -2,170 -1,995 175 8.8
Other expenses -1,309 -1,279 30 2.3
Depreciation -121 -75 46 61.3
Total expenses -3,600 -3,349 251 7.5
%-points
Expenses outside Sweden 270 8.1
Expenses Sweden -19 -0.6
of which IAS19 105 3.1
of which other -124 -3.7
251 7.5

13
Handelsbanken Group
Bad debt and loan losses as a percentage of lending
Proportion of bad debts, net, % Loan loss ratio, %
-0,2
0,0
0,2
0,4
0,6
0,8
1,0
1,2
-98 -99 -00 -01 -02 -03 -04 -05 -06 -07 -08-0,2
0,0
0,2
0,4
0,6
0,8
1,0
1,2
14
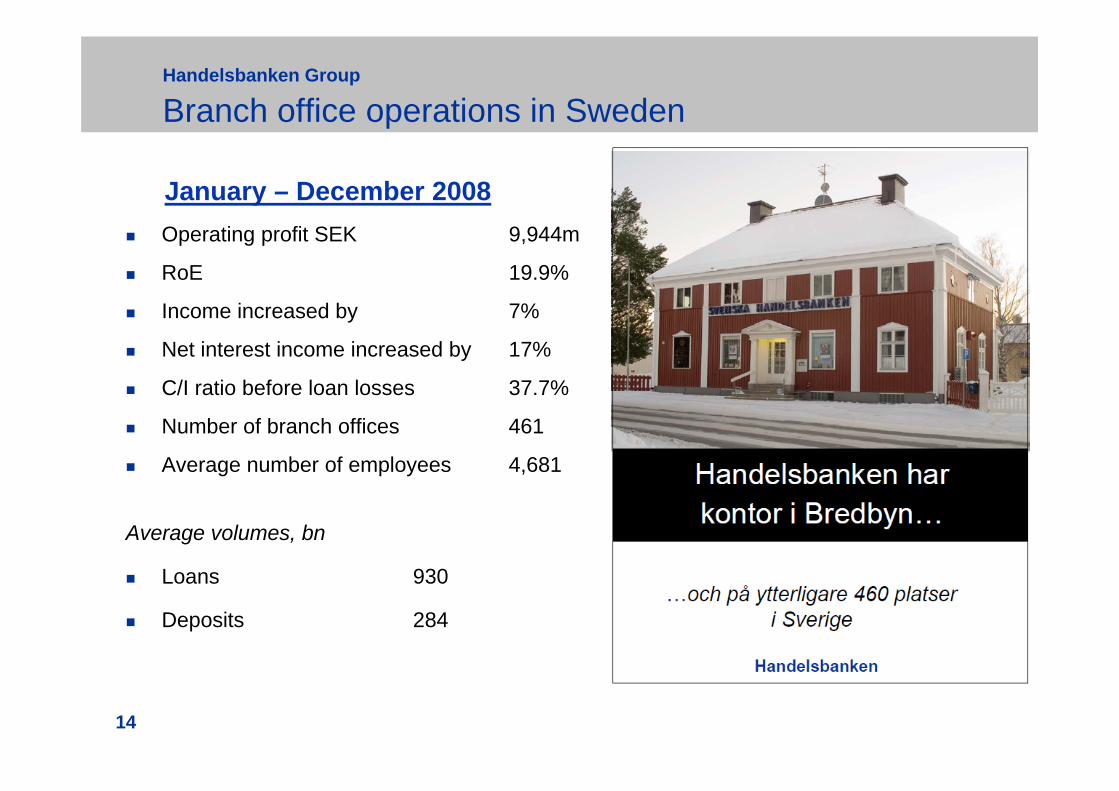
Handelsbanken Group
Branch office operations in Sweden
Operating profit SEK 9,944m
RoE 19.9%
Income increased by 7%
Net interest income increased by 17%
C/I ratio before loan losses 37.7%
Number of branch offices 461
Average number of employees 4,681
Average volumes, bn
Loans 930
Deposits 284
January – December 2008

15
Handelsbanken Group
Change in private deposits in Sweden 2008, quarterly
-5 000 0 5 000 10 000 15 000
Q1
Q2
Q3
Q4
Account deposits Net savings mutual funds
SEK m
Account deposits, change in average balanceMutual fund savings, deposits minus withdrawals during the quarter in funds managed by Handelsbanken Fonder AB
Market share deposits
17.7%
17.1%
16.6%
16.2%
16.0 % in Dec. 2007

16
Handelsbanken Group
New corporate customers in Sweden 2008, quarterly
107
1 620
3 061
836
-
500
1 000
1 500
2 000
2 500
3 000
3 500
Q1 2008 Q2 2008 Q3 2008 Q4 2008
Two thirds of new corporate customers were acquired in Q4

17
Handelsbanken Group
Direct loans to corporates in Sweden, Q4 2008
Source: Statistics SwedenRefers to bank and mortgage loans to non-financial companies in Sweden
Other banks+SEK 10.9bn
Handelsbanken+SEK 11.6bn
In Q4, total bank lending to companies in Sweden increased by SEK 22.5bn
52% 48%

18
Increased time with customers
100120
134 140
0
25
50
75
100
125
150
2006 2007 Spring 2008 Autumn 2008
Handelsbanken Group
Branch operations in Sweden – more time for meeting customers
Source: Frequency measurements and information on number of available staff 2006-2008, Swedish branch operations
Average time spent meetingcustomers has increased by 40% since 2006
Total productivityimprovement of 8%
Freed up time equivalent to 250 full-time employees
C/I ratio in Q4 was 35.4%
Index 2006=100

19
Handelsbanken Group
Branch offices in Sweden – Profit per employee
2008
2006
Profit before loan losses, SEK m 10,778 9,633
Average number of employees 4,681 4,500
Profit per employee, SEK thous. 2,302 2,141
Profit per employee increased by 8% or SEK164 thous. in 2008

20
Operating profit SEK 2,264m
RoE 8,3%
-excl. operating deficit 9,8%
Total income increased by 22%
Net interest income increased by 33%
C/I ratio 59.0%
Number of branch offices 241
Average number of employees 2,785
Average volumes, bn
Loans 433
Deposits 144
January – December 2008
Handelsbanken Group
Branch office operations outside Sweden

21
Average volumes Jan-Dec
2008Jan-Dec
2007Change
%
Denmark, DKK bn 34.5 29.6 17
Finland, EUR m 9,857 8,430 17
Norway, NOK bn 143.8 112.8 27
Great Britain, GBP m 4,812 3,497 38
Rest of the world, SEK bn 68 38 80
Handelsbanken Group
Lending outside Sweden
* Lokalbanken included from 21 October 2008

22
0100200300400500600700800900
1 0001 1001 2001 3001 4001 5001 6001 700
Q1 04
Q2 04
Q3 04
Q4 04
Q1 05
Q2 05
Q3 05
Q4 05
Q1 06
Q2 06
Q3 06
Q4 06
Q1 07
Q2 07
Q3 07
Q4 07
Q1 08
Q2 08
Q3 08
Q4 08
100
120
140
160
180
200
220
Branch offices outside Sweden Number of branch offices within regional banks outside Sweden
SEK m No
Handelsbanken Group
Net interest income outside Sweden, quarterly
*Lokalbanken’s 14 branch offices, included from 21 October 2008

23
0
5
10
15
20
25
30
35
40
45
Y 0 Y 1 Y 2 Y 3 Y 4 Y 5 Y 6 Y 7 Y 8 Y 9 Y 10 Y 11 Y 120
5
10
15
20
25
30
35Branch offices Total income Total expenses
Handelsbanken Group - Regional banks outside Sweden
Income and expenses trend – 147 branches opened 1995-2008
Number of branchoffices, Dec 2008
Average per branch, SEK m*
* Refers to figures for 2000 - 2008

24
0
10 000
20 000
30 000
40 000
50 000
60 000
v 01 v 04 v 07 v 10 v 13 v 16 v 19 v 22 v 25 v 28 v 31 v 34 v 37 v 40 v 43 v 46 v 49 v 52
SEK m
Handelsbanken Group
Net lending in SEK in the Swedish interbank market28 January 2008 – 31 December 2008, weekly
Proportion of bond funding has increased from 29% to 33% since January 2007
At year-end, liquidity reserves of over SEK 300 bn

25
Handelsbanken Group
Summary of the fourth quarter
Highest quarterly result ever
Increase in volumes and good funding position led to higher net interest income
Liquidity reserves of more than SEK 300bn
Tier 1 ratio increased to 10,5% according to Basel II
SEK 2.6bn in new Tier 1 capital loans
Record high increase in lending volume and household deposits and strong inflow of deposits from credit institutions
Loan loss ratio increased to 0.11% during 2008
Return on equity in continuing operations was 23.8% and excluding capital gains it was 20.0%

26
Handelsbanken Group
Dividend
2007 2008Per share, SEK ordinary 8.50 7,00
Per share, SEK additional 5.00
Number of shares class A and B 623.4 623.5
Change, % ordinary dividend 6.3 -17.6
Dividend, SEK m
Class A and B 8,416 4,364
Profit per share, 24.84 19.46
Profit per share, continuing operations 17.39 19.16
Dividend as % of profit per share 54.3 36.0

27
Appendix

28
Q4 Q3 Q2 Q1 Q4SEK m 2008 2008 2008 2008 2007
Net interest income 5,474 4,856 4,494 4,399 4,010Net fee and commission income 1,694 1,656 1,706 1,739 1,956Net gains/losses on financial items at fair value 2,229 483 634 -177 523Risk result - insurance 50 55 71 39 10Other income 65 74 294 55 117Total income 9,512 7,124 7,199 6,055 6,616Staff costs -2,170 -2,015 -1,946 -1,983 -1,995Other expenses -1,430 -1,118 -1,249 -1,318 -1,354Total expenses -3,600 -3,133 -3,195 -3,301 -3,349Profit before loan losses 5,912 3,991 4,004 2,754 3,267Loan losses, net -696 -231 -571 -107 -166Disposal prop. equipmt./ intang. assets 0 -2 0 272 0Operating profit, continuing operations 5,216 3,758 3,433 2,919 3,101Operating profit, discontinued operations 61 70 68 61 177Net gain from disposal of discontinued op. 4,082Operating profit, incl. discont. op. 5,277 3,828 3,501 2,980 7,360
Handelsbanken Group
Income statement, five quarters

29
ChangeSEK m 2008 2007 %
Net interest income 19,223 15,608 23Net fee and commission income 6,795 7,745 -12Net gains/losses on financial items at fair value 3,169 3,045 4Risk result - insurance 215 151 42Other income 488 568 -14Total income 29,890 27,126 10Staff costs -8,114 -7,528 8Other expenses -5,115 -4,840 6Total expenses -13,229 -12,368 7Profit before loan losses 16,661 14,758 13Loan losses, net -1,605 -27Disposal prop. equipmt./ intang. assets 270 1Discontinued operations 260 4,651 -94Operating profit, incl. discont. op. 15,586 19,383 -20
Handelsbanken Group
Income statement, January – December

30
Handelsbanken Group
Loan loss as a percentage of lending
-0,10
-0,05
0,00
0,05
0,10
0,15
0,20
0,25
2003 2004 2005 2006 2007 2008
Handelsbanken Other Swedish banks%
* Only SEB updated with year-end figures, other Swedish banks as at 30 September

31
Handelsbanken Group
Change in net interest income, Q4 2008 compared to Q3 2008
SEK m
Net interest income Q3 2008 4,856
Deposits SEK - margin -266
- volume 82
Lending SEK - margin 236
- volume 37
Volume & margin branch offices outside Sweden 149
Other 380Change in net interest income 618
Net interest income Q4 2008 5,474 12.7%
3M STIBOR ref.rate in the respective quarter.

32
SEK m 2008
compared to 2007
Deposit SEK - margin 161
- volume 731
Lending SEK - margin -215
- volume 533
Volume & margin branch offices outside Sweden 1,387
Other * 1,122
Change in net interest income ex IFRS effects 3,719IFRS effect repurchased bonds -104
Change in net interest income 3,615-
Handelsbanken Group
Change in net interest income, January - December
Ref. rate from 2007 incl. to Q2 2008 incl, 1M STIBOR and in Q3-4, 3M STIBOR has been used

33
SEK m 2005 2006 2007 2008 2009 Total
Q1 191 134 36 -15 4
Q2 185 41 36 -12 5
Q3 153 42 27 3 5
Q4 152 41 -15 4 4
Total 681 258 84 -20 18 1 021
Handelsbanken Group
Effect of repurchased bonds

34
SEK m 2008 2007 Change %
Brokerage 1,676 2,151 -22
Mutual funds and custody 1,559 2,040 -24
Advisory services 192 432 -56
Insurance 520 531 -2
Payments 2,257 2,153 5
Lending & deposits 894 831 8
Guarantees 430 394 9
Other 502 511 -2
Commission expenses -1,235 -1,298 -5
Total 6,795 7,745 -12
Handelsbanken Group
Fees and commissions, January – December

35
Handelsbanken Group
Equity-related commissions, January – December
SEK m
2008 2007 Change %
Brokerage 1,640 2,112 -22
Mutual funds and custody 1,449 1,922 -25
Corporate finance 192 432 -56
Commission expenses -257 -288 -11
Total 3,024 4,178 -28

36
Handelsbanken Group
Oktogonen quarterly 2004 - 2008
-300
-200
-100
0
100
200
300
Q1 200
4Q2 2
004
Q3 200
4Q4 2
004
Q1 200
5Q2 2
005
Q3 200
5Q4 2
005
Q1 200
6Q2 2
006
Q3 200
6Q3 2
006
Q1 200
7Q2 2
007
Q3 200
7Q4 2
007
Q1 200
8Q2 2
008
Q3 200
8Q4 2
008
Expense Adjust for previous yr
SEK m

37
Handelsbanken Group
Expenses, Q4 2008 compared to Q3 2008
SEK m 2008
Q 42008
Q 3Change
SEKmChange
%
Staff costs -2,170 -2,015 155 7.7
Other expenses -1,309 -1,011 298 29.5
Depreciation -121 -107 14 13.1
Total expenses -3 600 -3 133 467 14.9
%-points
Expenses outside Sweden 176 5.6
of which FX-effect 91 2.9
of which Oktogonen 60 1.9
of which other 25 0.8
Expenses Sweden 291 9.3
of which non-recurring costs 107 3.4
of which other 184 5.9
467 14.9

38
Corporation tax on the profit for banking operations
No tax on the administration result and the risk result in the insurance operations, except for
outright risk insurance
The yield split has already been taxed
Corporation tax on yield on shareholders’ equity in the insurance operations
Effective tax burden January-December was 22.1% (26.3% excl SPP sales) and Q4 2008 13.5%
(Q3 26.6% Q 27.7%)
The lower tax rate for 2008 is due to
Profit on sale of property and shares in NCSD AB is not taxed
Changed corporation tax rate from 2009 affects the deferred taxes
Handelsbanken Group
Effective tax burden

39
ChangeSEK bn 2008 2007 %
Loans to the public 1,481 1,293 15Loans to credit institutions 165 185 -11Interest-bearing securities 166 176 -6Other assets 347 205 69
Total assets 2,159 1,859 16
Deposits and borrowing from the public 544 513 6Due to credit institutions 319 293 9Issued securities 896 706 27Other liabilities 325 273 19Shareholders’ equity 75 74 1
Total liabilities and equity 2,159 1,859 16
Handelsbanken Group
Balance sheet, 30 December
40
Average volumes Q4 Q3 Q2 Q1 Q4SEK bn 2008 2008 2008 2008 2007
Branch offices in Sweden 960 938 921 903 876
Branch offices outside Sweden 489 447 410 387 360Private 131 121 115 108 108
Corporate 358 326 295 252 252
Other operations 13 14 15 20 20
Total 1,462 1,399 1,346 1,310 1,256Private 602 568 568 554 539
Corporate 860 813 778 756 717
Handelsbanken Group
Loans to the public, quarterly

41
20%
21%
22%
23%
24%
25%
26%
27%
28%
29%
30%
jan-07 apr-07 jul-07 okt-07 jan-08 apr-08 jul-08 okt-08
Market share, Lending to non-financial companies in Sweden
Handelsbanken Group
Market shares in Sweden, Jan 2007 – Dec 2008
Source: SCB (Statistics Sweden)
29.0%
26.1%
42
Handelsbanken Group
Deposits from the public, quarterly
Average volumes Q4 Q3 Q2 Q1 Q4SEK bn 2008 2008 2008 2008 2007
Branch offices in Sweden 303 283 278 273 256 Private 157 147 141 135 130 Corporate 146 136 137 138 126
Branch offices outside Sweden 157 142 139 140 141 Private 41 38 37 34 33 Corporate 116 104 102 106 108 Other operations 47 54 62 81 81
Total 507 479 479 494 478 Private 199 185 177 169 163 Corporate 308 394 302 325 315

43
Average volumes Q4 Q3 Q2 Q1 Q4SEK bn 2008 2008 2008 2008 2007
Mortgage loans 563 552 540 529 518 Private 413 406 396 386 375 Corporate 150 146 144 143 143
Bank loans 396 385 380 374 358 Private 58 59 57 56 55 Corporate 338 327 323 318 303
Total Branch offices in Sweden 960 938 921 903 876 Private 472 465 454 442 424 Corporate 488 473 467 461 452
Handelsbanken Group
Loans to the public – Branch offices in Sweden, quarterly

44
SEK m 31 Dec
2008 2007 2006 2005 2004 2003
Conditional bonus 3,327 4,824 5,713 4,874 3,552 3,248
% of total insurance assets 12.8 18.0 21.7 20.3 16.7 16.7
Handelsbanken Group
Conditional bonus* in relation to total insurance assets
* Refers to conditional bonus from a customer perspective