Slide 9 - 1 Active Learning Questions Copyright © 2009 Pearson Education, Inc. For use with...
19
Slide 9 - 1 Active Learning Questions Copyright © 2009 Pearson Education, Inc. For use with classroom response systems Chapter 9 Hypothesis Testin g
-
Upload
theresa-stone -
Category
Documents
-
view
215 -
download
2
Transcript of Slide 9 - 1 Active Learning Questions Copyright © 2009 Pearson Education, Inc. For use with...

Slide 9 - 1
Active Learning Questions
Copyright © 2009 Pearson Education, Inc.
For use with classroom response systems
Chapter 9 Hypothesis Testing
Slide 9 - 2
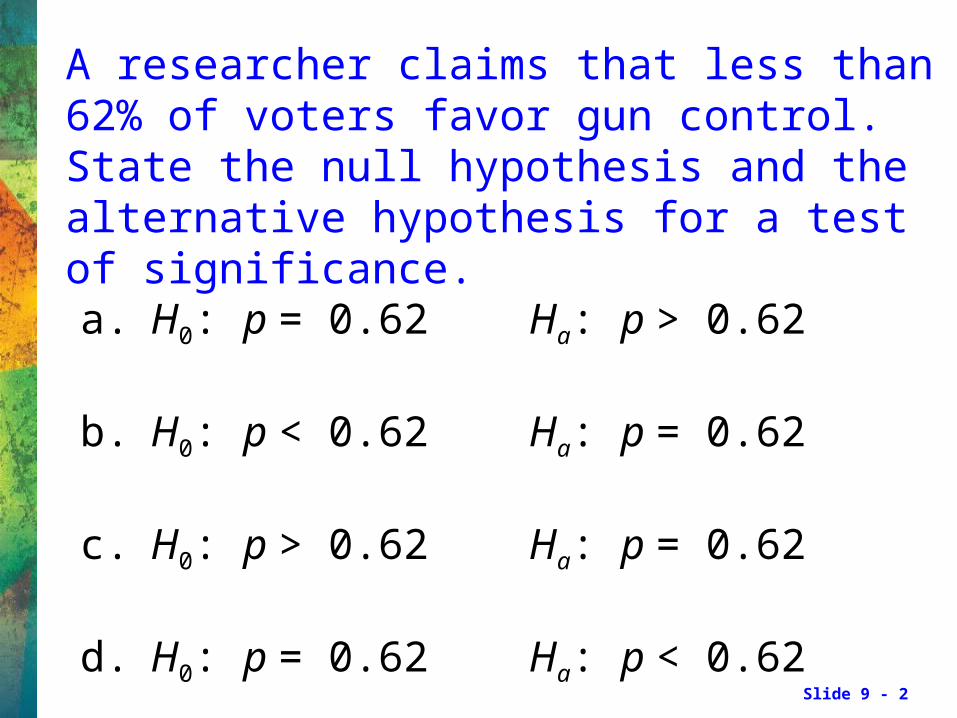
A researcher claims that less than 62% of voters favor gun control. State the null hypothesis and the alternative hypothesis for a test of significance.
a. H0: p = 0.62 Ha: p > 0.62
b. H0: p < 0.62 Ha: p = 0.62
c. H0: p > 0.62 Ha: p = 0.62
d. H0: p = 0.62 Ha: p < 0.62

Slide 9 - 3
A study of a brand of “in the shell” peanuts gives the following table. A significant event at the 0.05 level is a fan getting a bag with how many peanuts?
a. 25, 30, or 35 b. 25, 30, or 55
c. 35, 45, or 50 d. None of the choices
# Peanuts in the bag
25 30 35 40 45 50 55
Probability 0.003 0.02 0.09 0.15 0.45 0.217 0.007

Slide 9 - 4
In 1990, the average math SAT score for students at one school was 510. Five years later, a teacher wants to perform a hypothesis test to determine whether the average math SAT score of students at the school has changed from the 1990 mean of 510. Formulate the null and alternative hypotheses for the study described.
a. H0: = 510 Ha: > 510
b. H0: = 510 Ha: < 510
c. H0: = 510 Ha: ≠ 510
d. H0: ≥ 510 Ha: < 510
Slide 9 - 5
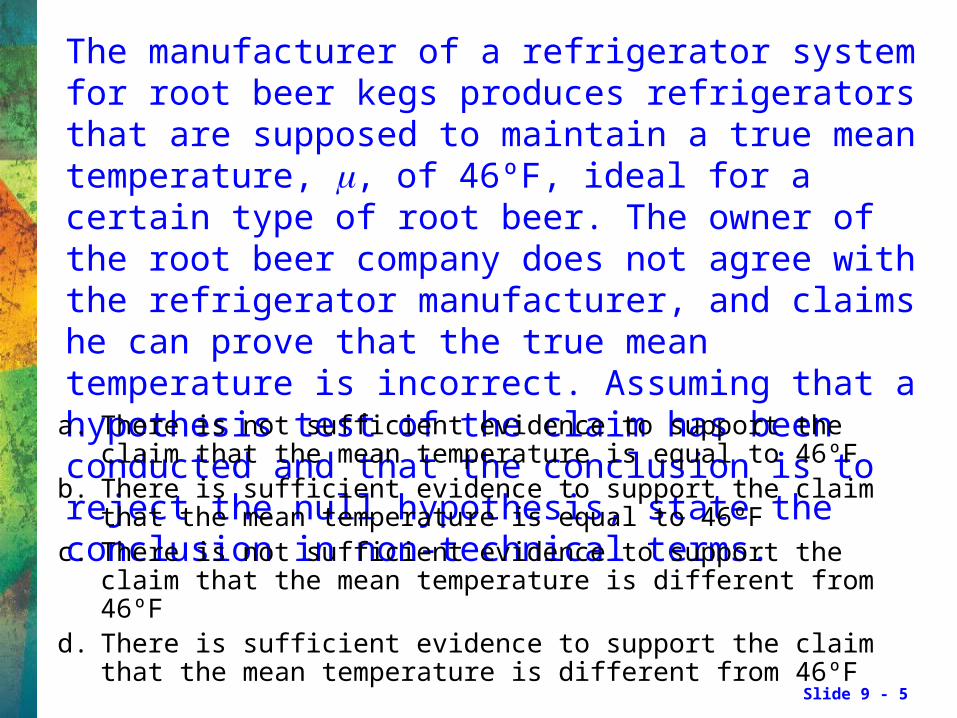
The manufacturer of a refrigerator system for root beer kegs produces refrigerators that are supposed to maintain a true mean temperature, , of 46ºF, ideal for a certain type of root beer. The owner of the root beer company does not agree with the refrigerator manufacturer, and claims he can prove that the true mean temperature is incorrect. Assuming that a hypothesis test of the claim has been conducted and that the conclusion is to reject the null hypothesis, state the conclusion in non-technical terms.
a. There is not sufficient evidence to support the claim that the mean temperature is equal to 46ºF
b. There is sufficient evidence to support the claim that the mean temperature is equal to 46ºF
c. There is not sufficient evidence to support the claim that the mean temperature is different from 46ºF
d. There is sufficient evidence to support the claim that the mean temperature is different from 46ºF

Slide 9 - 6
Ha: > 19, = 8, n = 100; without computing a P-value, determine whether the alternate hypothesis is supported and give a reason for your conclusion.
a. Ha is not supported; is less than 1 standard deviation above the claimed area
b. Ha is not supported; is more than 4 standard deviations above the claimed area
c. Ha is supported; is less than 1 standard deviation above the claimed area
d. Ha is supported; is more than 4 standard deviations above the claimed area
x 23.8,
x
x
x
x

Slide 9 - 7
z = –1.5 for Ha: ≠ claimed value; What is the P-value for the test?
a. 6.68
b. 93.32
c. 0.0668
d. None of the above
Slide 9 - 8
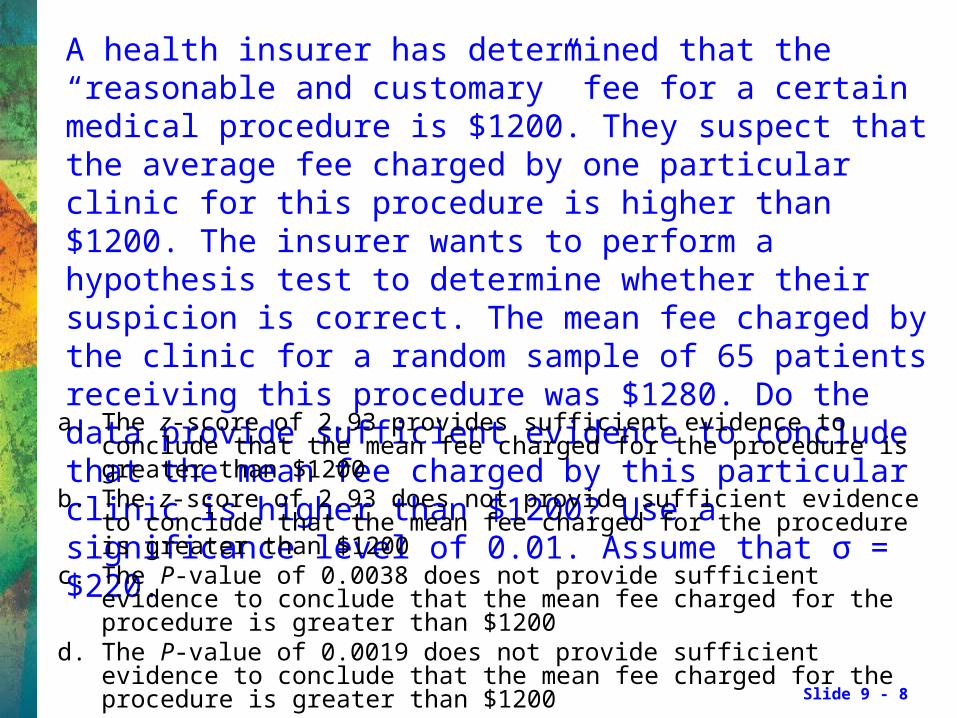
A health insurer has determined that the “reasonable and customary” fee for a certain medical procedure is $1200. They suspect that the average fee charged by one particular clinic for this procedure is higher than $1200. The insurer wants to perform a hypothesis test to determine whether their suspicion is correct. The mean fee charged by the clinic for a random sample of 65 patients receiving this procedure was $1280. Do the data provide sufficient evidence to conclude that the mean fee charged by this particular clinic is higher than $1200? Use a significance level of 0.01. Assume that σ = $220.
a. The z-score of 2.93 provides sufficient evidence to conclude that the mean fee charged for the procedure is greater than $1200
b. The z-score of 2.93 does not provide sufficient evidence to conclude that the mean fee charged for the procedure is greater than $1200
c. The P-value of 0.0038 does not provide sufficient evidence to conclude that the mean fee charged for the procedure is greater than $1200
d. The P-value of 0.0019 does not provide sufficient evidence to conclude that the mean fee charged for the procedure is greater than $1200
Slide 9 - 9
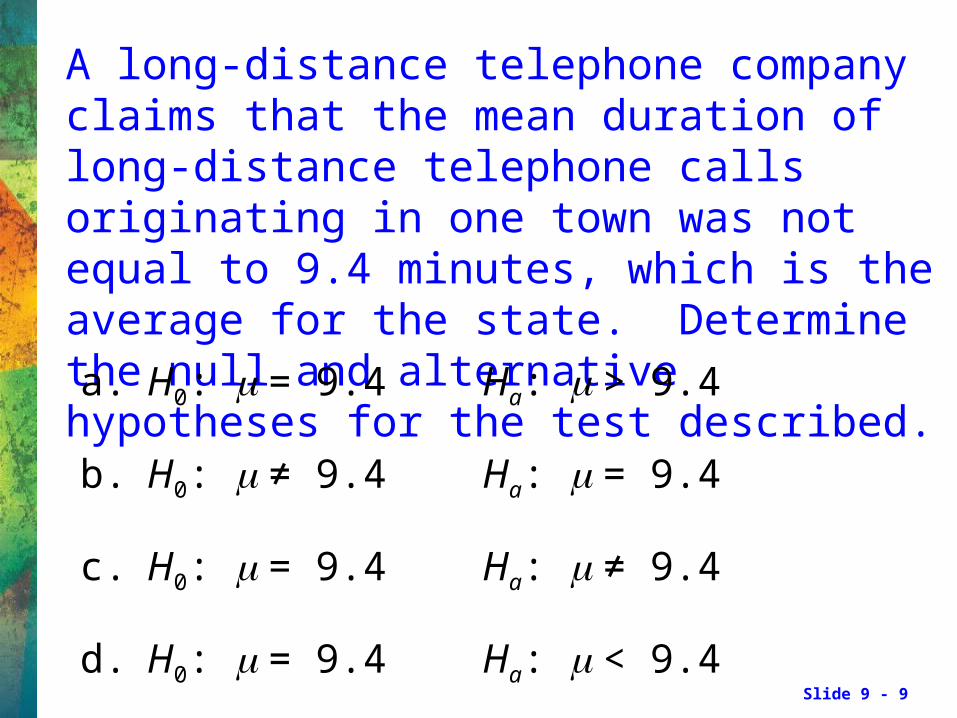
A long-distance telephone company claims that the mean duration of long-distance telephone calls originating in one town was not equal to 9.4 minutes, which is the average for the state. Determine the null and alternative hypotheses for the test described.
a. H0: = 9.4 Ha: > 9.4
b. H0: ≠ 9.4 Ha: = 9.4
c. H0: = 9.4 Ha: ≠ 9.4
d. H0: = 9.4 Ha: < 9.4

Slide 9 - 10
A manufacturer wishes to test the claim that one of its pancake mixes has a mean weight that does not equal 24 ounces as advertised. Determine the conclusion of the hypothesis test assuming that the results of the sampling lead to rejection of the null hypothesis.
a. Support the claim that the mean is greater than 24 oz
b. Support the claim that the mean is not equal to 24 oz
c. Support the claim that the mean is equal to 24 oz
d. Support the claim that the mean is less than 24 oz
Slide 9 - 11
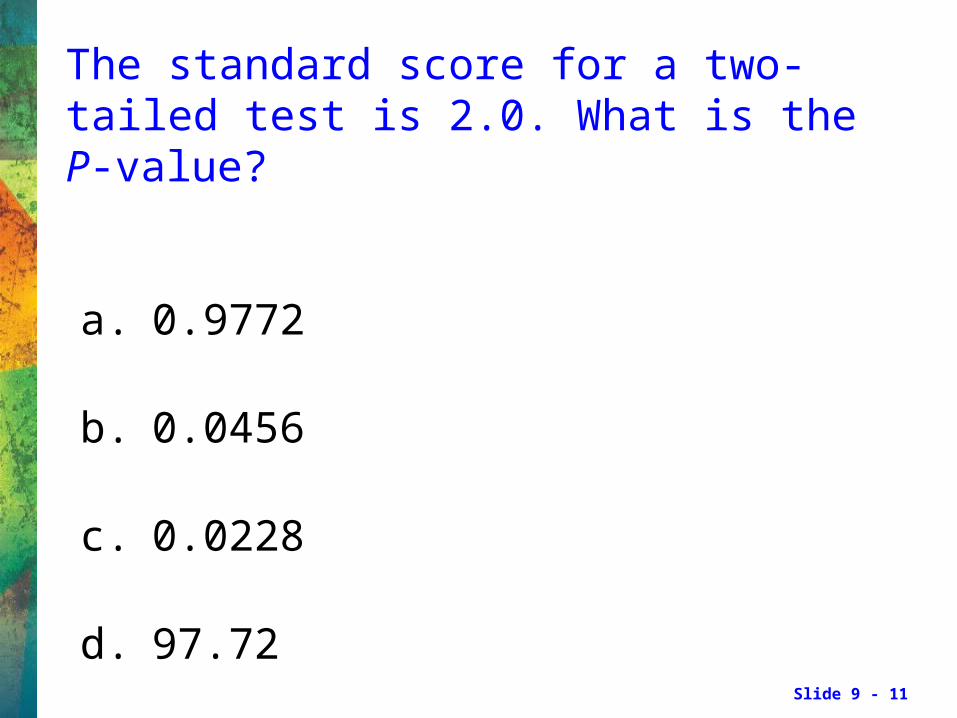
The standard score for a two-tailed test is 2.0. What is the P-value?
a. 0.9772
b. 0.0456
c. 0.0228
d. 97.72
Slide 9 - 12
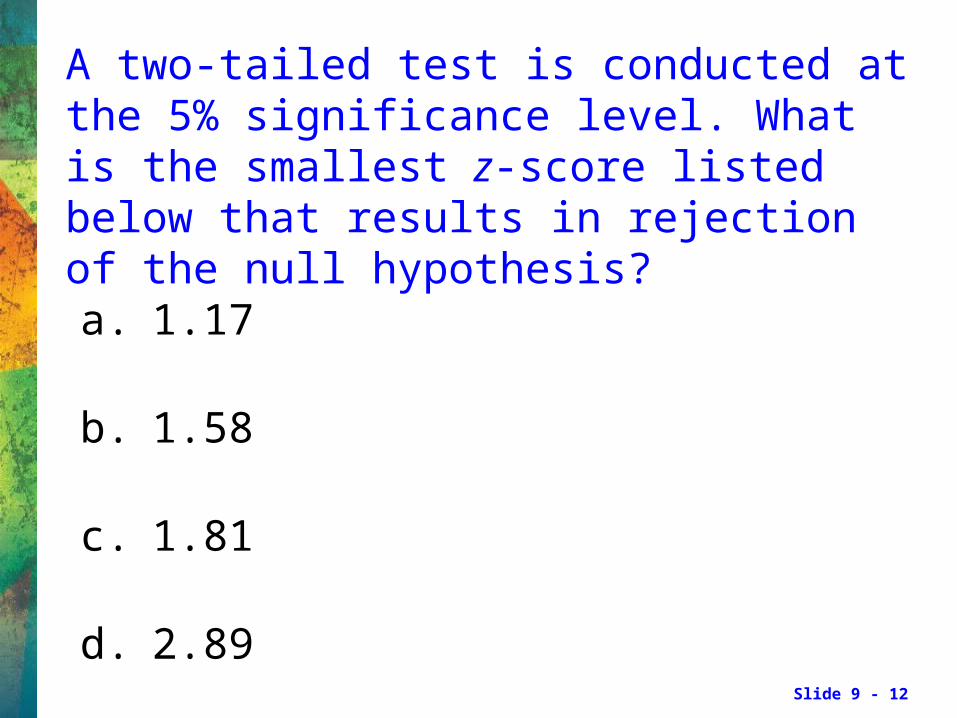
A two-tailed test is conducted at the 5% significance level. What is the smallest z-score listed below that results in rejection of the null hypothesis?
a. 1.17
b. 1.58
c. 1.81
d. 2.89

Slide 9 - 13
A two-tailed test is conducted at the 10% significance level. What is the z-score closest to zero in the list that will result in rejection of the null hypothesis?
a. 1.19
b. –1.54
c. –1.84
d. 2.59
Slide 9 - 14
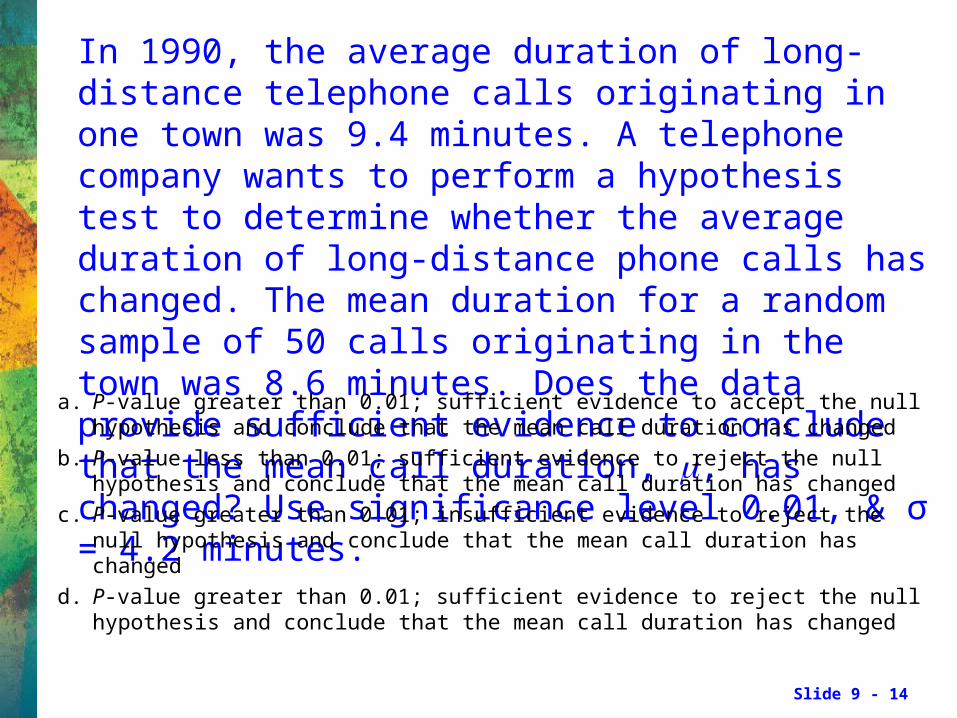
In 1990, the average duration of long-distance telephone calls originating in one town was 9.4 minutes. A telephone company wants to perform a hypothesis test to determine whether the average duration of long-distance phone calls has changed. The mean duration for a random sample of 50 calls originating in the town was 8.6 minutes. Does the data provide sufficient evidence to conclude that the mean call duration, , has changed? Use significance level 0.01, & σ = 4.2 minutes.
a. P-value greater than 0.01; sufficient evidence to accept the null hypothesis and conclude that the mean call duration has changed
b. P-value less than 0.01; sufficient evidence to reject the null hypothesis and conclude that the mean call duration has changed
c. P-value greater than 0.01; insufficient evidence to reject the null hypothesis and conclude that the mean call duration has changed
d. P-value greater than 0.01; sufficient evidence to reject the null hypothesis and conclude that the mean call duration has changed

Slide 9 - 15
At one school, the average amount of time that tenth-graders spend watching television each week is 21 hours. The principal introduces a campaign to encourage the students to watch less television. One year later, the principal wants to perform a hypothesis test to determine whether the average amount of time spent watching television per week has decreased. The hypotheses are: H0: = 21 hours, Ha: < 21 hours. Suppose that the results of the sampling lead to non-rejection of the null hypothesis. Classify that conclusion as a Type I error, a Type II error, or a correct decision, if in fact the mean amount of time, , spent watching television has not decreased. a. Type I error b. Correct decision c. Type II error

Slide 9 - 16
A health insurer has determined that the “reasonable and customary” fee for a certain medical procedure is $1200. They suspect that the average fee charged by one particular clinic for this procedure is higher than $1200. The insurer wants to perform a hypothesis test to determine whether their suspicion is correct. The hypotheses are: H0: = $1200, Ha: > $1200. Explain the meaning of a correct decision.a. Concluding that > $1200 when in fact = $1200 b. Concluding that < $1200 when in fact > $1200 c. Failing to reject the hypothesis that = $1200 when in fact
> $1200 d. Failing to reject the hypothesis that = $1200 when in fact
= $1200 OR concluding that > $1200 when in fact > $1200
Slide 9 - 17
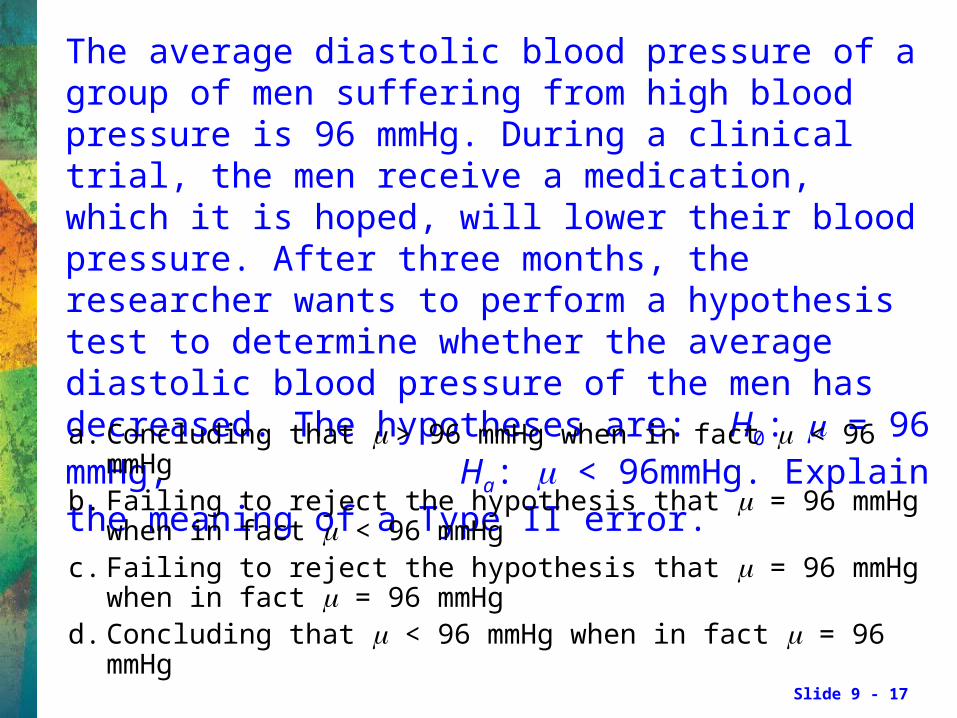
The average diastolic blood pressure of a group of men suffering from high blood pressure is 96 mmHg. During a clinical trial, the men receive a medication, which it is hoped, will lower their blood pressure. After three months, the researcher wants to perform a hypothesis test to determine whether the average diastolic blood pressure of the men has decreased. The hypotheses are: H0: = 96 mmHg, Ha: < 96mmHg. Explain the meaning of a Type II error.
a. Concluding that > 96 mmHg when in fact < 96 mmHg b. Failing to reject the hypothesis that = 96 mmHg when in
fact < 96 mmHgc. Failing to reject the hypothesis that = 96 mmHg when in
fact = 96 mmHg d. Concluding that < 96 mmHg when in fact = 96 mmHg

Slide 9 - 18
A random sample of 139 forty-year-old men contains 26% smokers. Find the P-value to test the claim that the percentage of forty-year-old men that smoke is 22%.
a. 0.2542
b. 0.1401
c. 0.2802
d. 0.1271
Slide 9 - 19
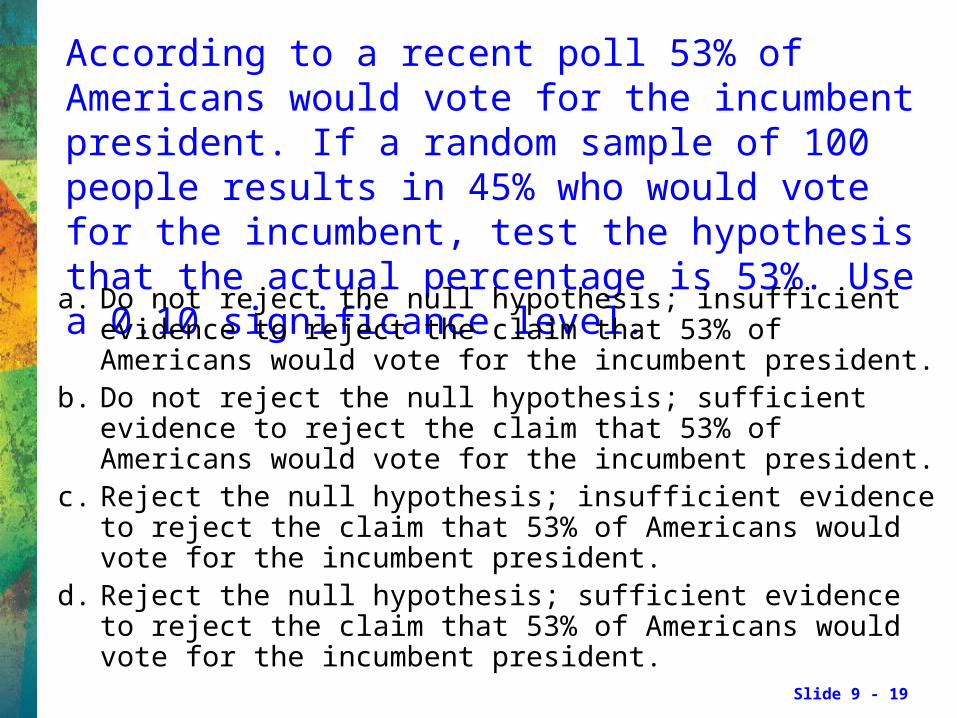
According to a recent poll 53% of Americans would vote for the incumbent president. If a random sample of 100 people results in 45% who would vote for the incumbent, test the hypothesis that the actual percentage is 53%. Use a 0.10 significance level.
a. Do not reject the null hypothesis; insufficient evidence to reject the claim that 53% of Americans would vote for the incumbent president.
b. Do not reject the null hypothesis; sufficient evidence to reject the claim that 53% of Americans would vote for the incumbent president.
c. Reject the null hypothesis; insufficient evidence to reject the claim that 53% of Americans would vote for the incumbent president.
d. Reject the null hypothesis; sufficient evidence to reject the claim that 53% of Americans would vote for the incumbent president.