Slide 1 Patents Pending © SolFocus, Inc. 2010 Solar CPV 201 September 15, 2010 Kelly Desy Manager,...
18
Slide 1 Patents Pending © SolFocus, Inc. 2010 Solar CPV 201 September 15, 2010 Kelly Desy Manager, Government Relations and Public Policy
-
Upload
abigayle-francis -
Category
Documents
-
view
215 -
download
0
Transcript of Slide 1 Patents Pending © SolFocus, Inc. 2010 Solar CPV 201 September 15, 2010 Kelly Desy Manager,...
Slide 1Patents Pending © SolFocus, Inc. 2010
Solar CPV 201
September 15, 2010
Kelly DesyManager, Government Relations and Public Policy
Slide 2Patents Pending © SolFocus, Inc. 2010
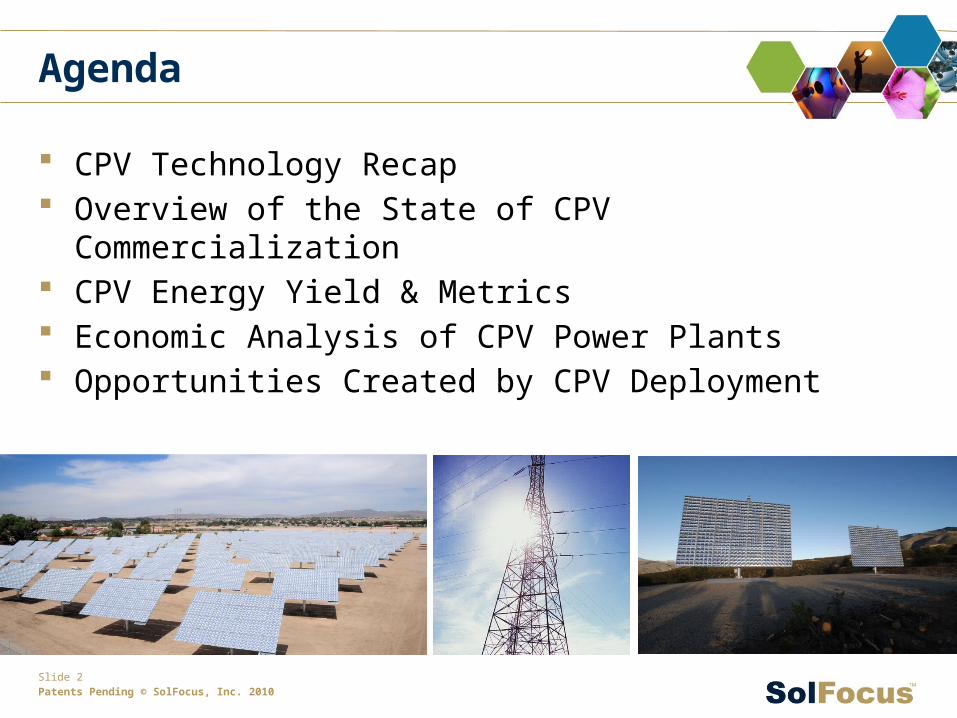
Agenda
CPV Technology Recap Overview of the State of CPV Commercialization CPV Energy Yield & Metrics Economic Analysis of CPV Power Plants Opportunities Created by CPV Deployment

Slide 3Patents Pending © SolFocus, Inc. 2010
CPV Technology Basics
Concentrator Photovoltaic (CPV) Utilizes optics to concentrate sunlight onto
photovoltaic surfaces to generate electricity
Requires sunny conditions with direct sunlight
Dual-axis tracking for consistent energy production throughout the day
Concentrates sunlight >500x onto small, high-efficiency, multi-junction solar cells
>2X efficiency of silicon PV cells
Fresnel lenses (plastic/acrylic)
Reflective optics (glass optics)

Slide 4Patents Pending © SolFocus, Inc. 2010
ManufacturingEquipment
Materials
Developers/EPCs
PowerGenerators
ModuleSuppliers
Cell SuppliersResearch
Organizations & Universities
TrackerSuppliers
CPV Consortium
Slide 5Patents Pending © SolFocus, Inc. 2010
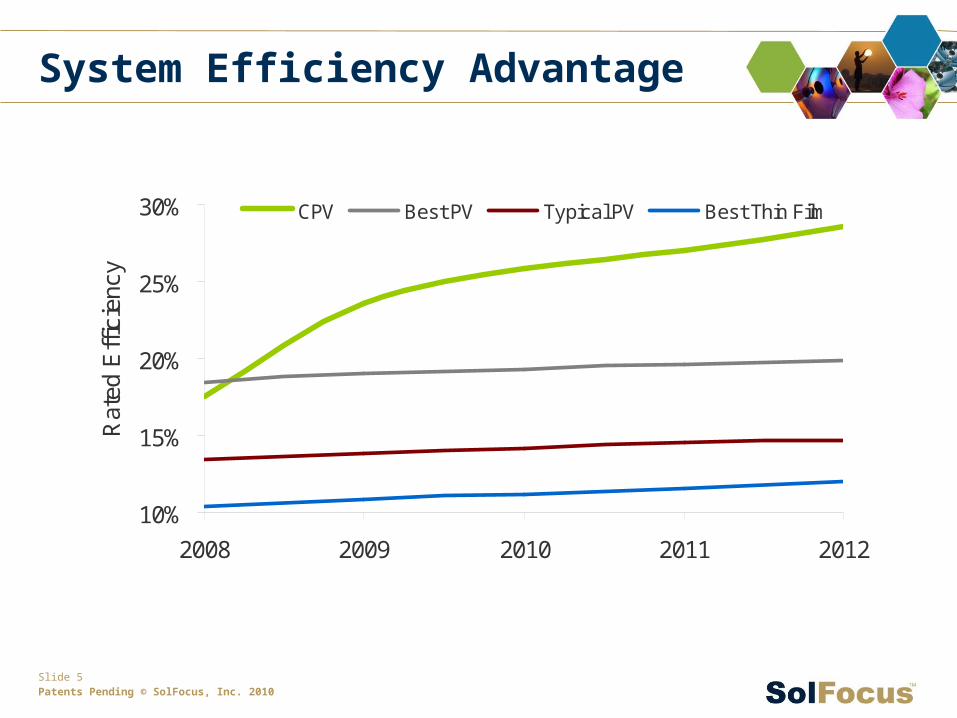
System Efficiency Advantage
10%
15%
20%
25%
30%
2008 2009 2010 2011 2012
Rat
ed E
ffic
ienc
y
CPV Best PV Typical PV Best Thin Film
Slide 6Patents Pending © SolFocus, Inc. 2010
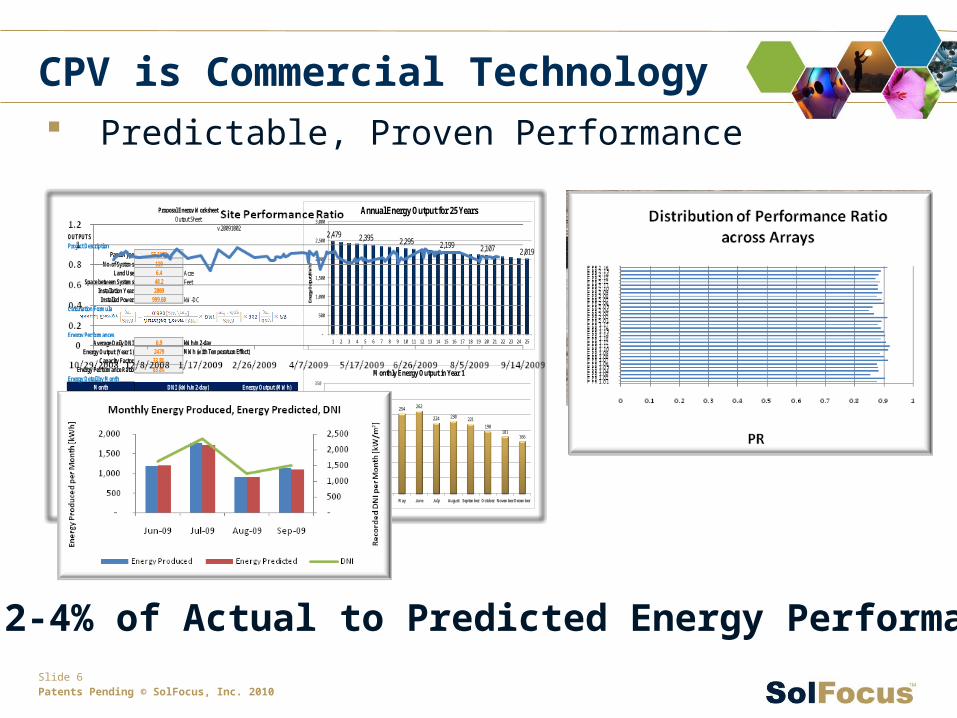
CPV is Commercial Technology Predictable, Proven Performance
OUTPUTSProject Description
Panel Type SF-1100
No. of Systems 119Land Use 6.4 Acre
Space between Systems 48.2 FeetInstallation Year 2009
Installed Power 999.60 kW-DCCalculation Formula
Energy PerformancesAverage Daily DNI 6.9 kWh/m2-day
Energy Output (Year 1) 2479 MWh (with Temperature Effect)Capacity Factor 33.8%
Energy Performance Ratio 83.8%Energy Detail by Month
Month Energy Output (MWh)January 164
February 154March 191April 235May 254June 262July 224
August 230September 221
October 198November 181December 166
Total 2479
DNI (kWh/m2-day)5.45.66.38.0
6.9
8.38.97.37.57.5
Proposal Energy WorksheetOutput Sheet
v.20091002
6.56.15.4
2,479 2,395 2,295 2,199 2,107 2,019
-
500
1,000
1,500
2,000
2,500
3,000
1 2 3 4 5 6 7 8 9 10 11 12 13 14 15 16 17 18 19 20 21 22 23 24 25
Ener
gy O
utpu
t (M
Wh)
Annual Energy Output for 25 Years
164154
191
235254 262
224 230221
198181
166
0
50
100
150
200
250
300
350
January February March April May June July August September October November December
Ener
gy O
utpu
t (M
Wh)
Monthly Energy Output in Year 1
2-4% of Actual to Predicted Energy Performance

Slide 7Patents Pending © SolFocus, Inc. 2010
CPV is Commercial Technology
Validated Reliability, Certifications
IEC 62108
Manufacturer Model Technology Notes
Atlantis Energy ATL 120/125W Photovoltaic Skylight NA
Amonix Inc 7000 Mega Module10,300W High Concentration
Photovoltaic ModuleNA
Concentrix Solar CX-75-III 75 Watt Concentrator PV Module NA
Solaria CMT-190190W Low-Concentrating Polycrystalline PV Module
NA
Solaria Solaria 210210W Low Concentrating
Monocrystalline PV ModuleNA
Solaria Solaria 220220W Low Concentrating
Monocrystalline PV ModuleNA
Solaria Solaria 230230W Low Concentrating
Monocrystalline PV ModuleNA
SolFocus SF-1000P 210W Concentrator PV Module NA
SolFocus SF-1100P 300W Concentrator PV Module NA
CEC Listed

Slide 8Patents Pending © SolFocus, Inc. 2010
CPV is Commercial Technology
Manufacturing Capacity at Scale Production Product Deployed
Source: NREL Report 11/09 Source: NREL Report 11/09 and CPV Today Report 2010
CPV Deployed in 2010Manufacturing Capacity

Slide 9Patents Pending © SolFocus, Inc. 2010
Best performance in Regions with high DNI
Easiest and most flexible Implementation in the Field
Clean Energy with a Superior Environmental Footprint
Lowest Cost of Electricity
CPV Delivers Key Economic Benefits
Slide 10Patents Pending © SolFocus, Inc. 2010
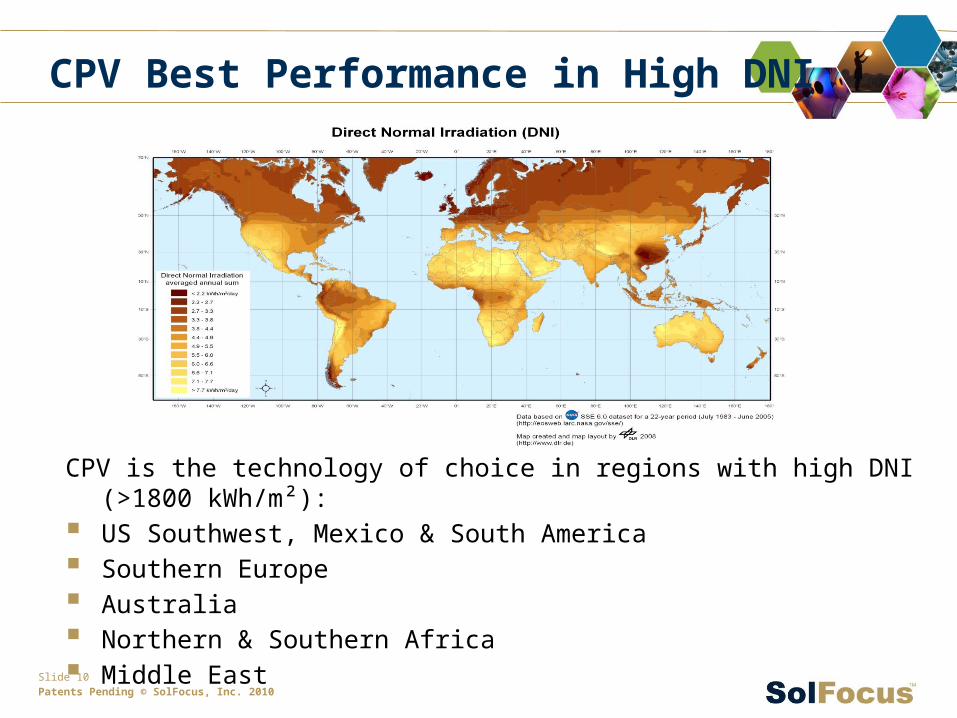
CPV is the technology of choice in regions with high DNI (>1800 kWh/m²): US Southwest, Mexico & South America Southern Europe Australia Northern & Southern Africa Middle East
CPV Best Performance in High DNI
Slide 11Patents Pending © SolFocus, Inc. 2010
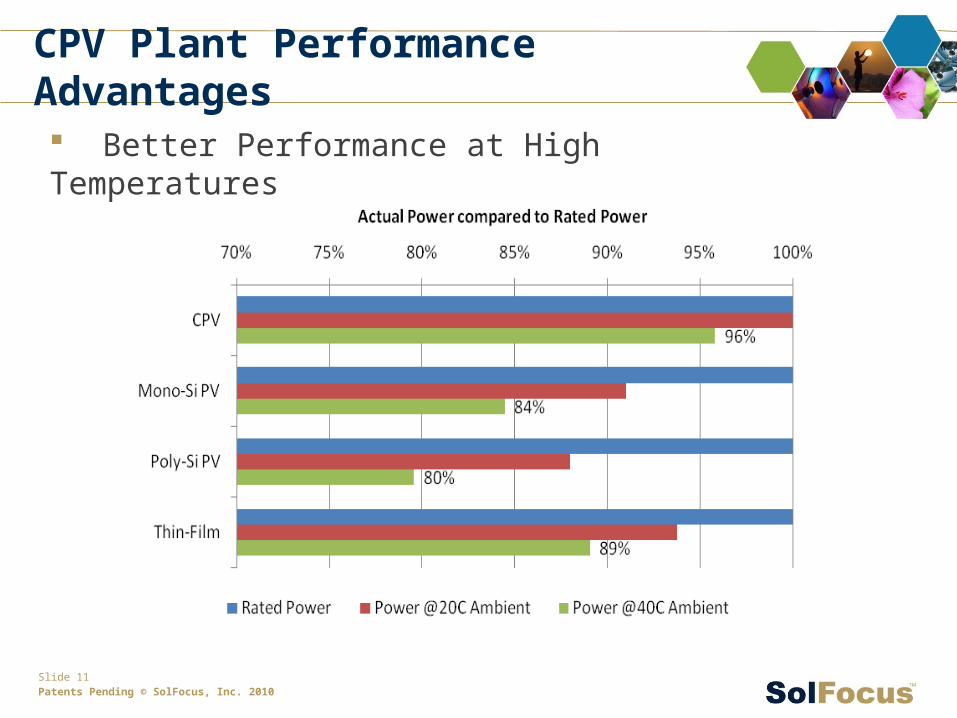
CPV Plant Performance Advantages Better Performance at High Temperatures
Slide 12Patents Pending © SolFocus, Inc. 2010
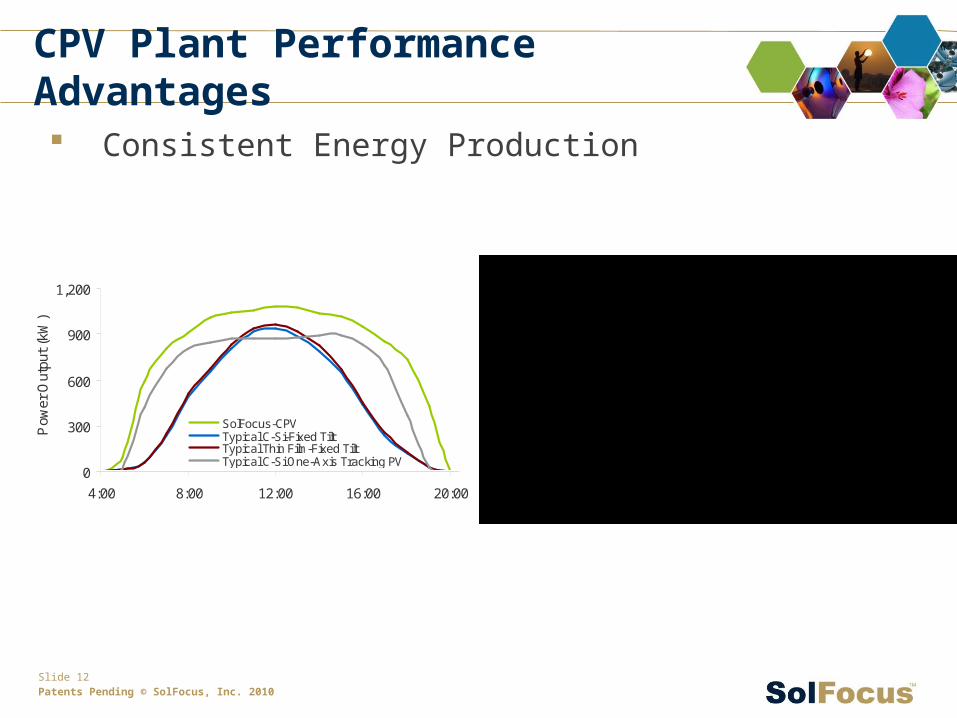
CPV Plant Performance Advantages Consistent Energy Production
0
300
600
900
1,200
4:00 8:00 12:00 16:00 20:00
Pow
er O
utpu
t (k
W)
SolFocus-CPVTypical C-Si-Fixed TiltTypical Thin Film-Fixed TiltTypical C-Si One-Axis Tracking PV
Slide 13Patents Pending © SolFocus, Inc. 2010
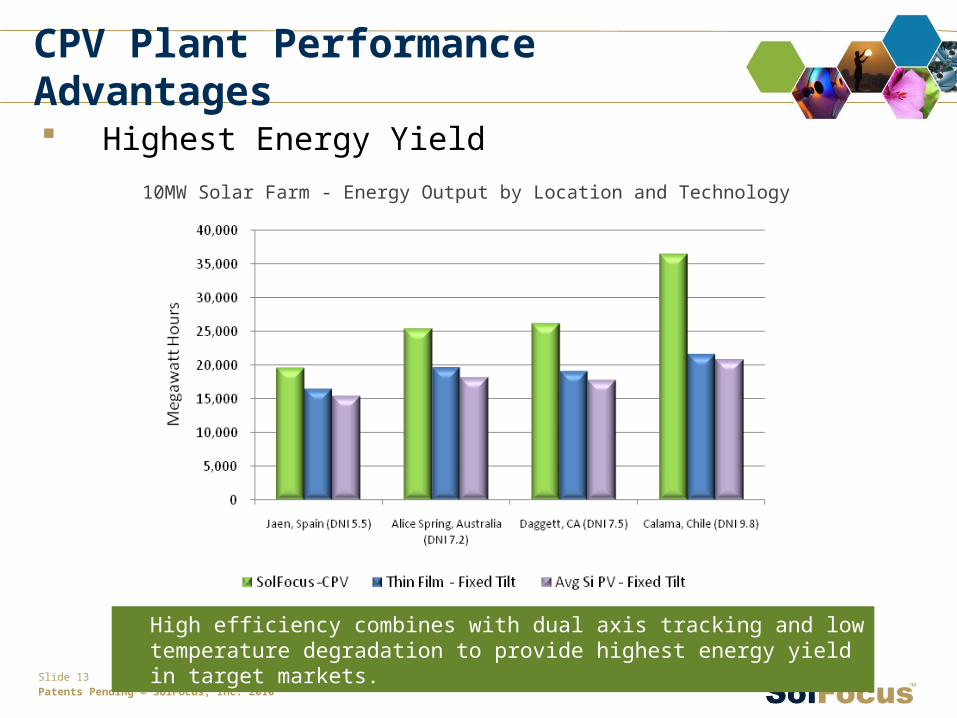
Highest Energy Yield
10MW Solar Farm - Energy Output by Location and Technology
High efficiency combines with dual axis tracking and low temperature degradation to provide highest energy yield in target markets.
CPV Plant Performance Advantages
Slide 14Patents Pending © SolFocus, Inc. 2010
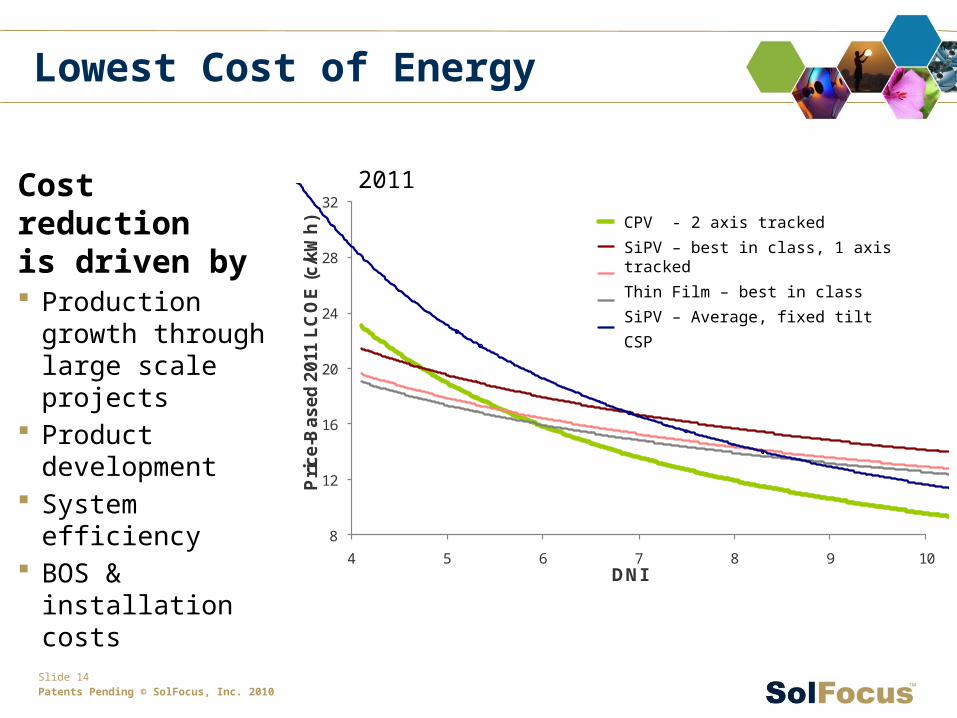
Cost reduction is driven by Production growth
through large scale projects
Product development
System efficiency BOS & installation
costs
Lowest Cost of Energy
8
12
16
20
24
28
32
4 5 6 7 8 9 10
Pri
ce-
Ba
se
d 2
011
LC
OE
(c
/kW
h)
DNI
SolFocus - 2 axis tracked
SunPower - 1 axis tracked
First Solar
C-Si
CSP
CPV - 2 axis tracked
SiPV – best in class, 1 axis tracked
Thin Film – best in class
SiPV – Average, fixed tilt
CSP
2011
This is abetter LCOE CHART TO USE. COST REDUCTION DRIVEN BY:SYSTEM EFFICIENCY IMPROVEMENTSVOLUME MANUFACTURING(NOT SURE WHAT THE OTHERS MEAN)
Slide 15Patents Pending © SolFocus, Inc. 2010
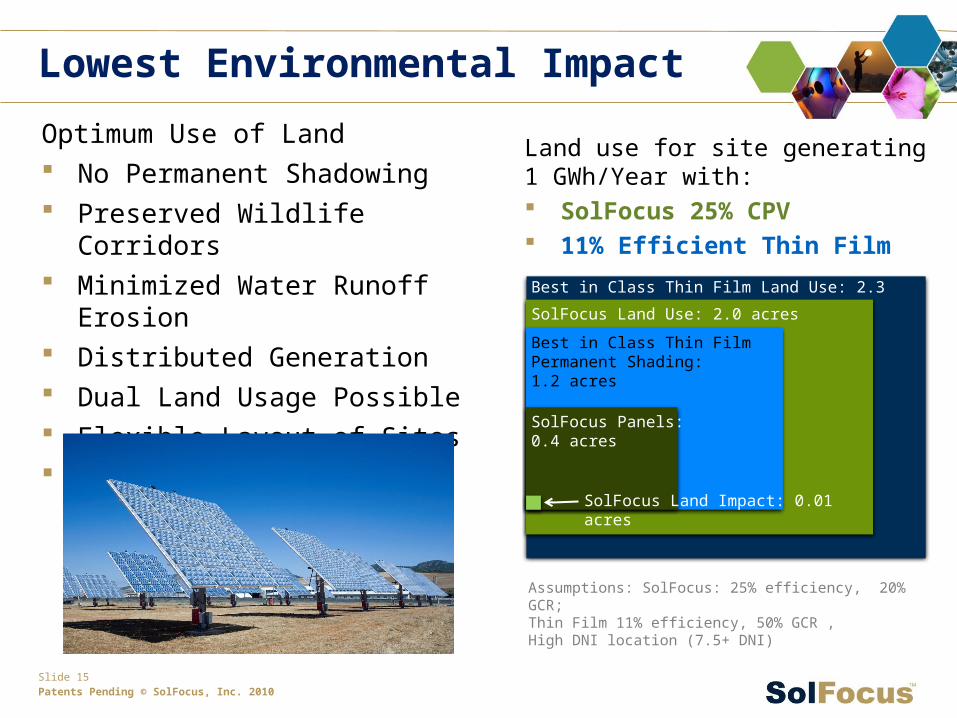
Optimum Use of Land No Permanent Shadowing Preserved Wildlife Corridors Minimized Water Runoff Erosion Distributed Generation Dual Land Usage Possible Flexible Layout of Sites Minimal Land Coverage/Disruption
Lowest Environmental Impact
Best in Class Thin Film Land Use: 2.3 acres
SolFocus Land Use: 2.0 acres
Best in Class Thin FilmPermanent Shading: 1.2 acres
SolFocus Panels: 0.4 acres
Land use for site generating 1 GWh/Year with: SolFocus 25% CPV 11% Efficient Thin Film
SolFocus Land Impact: 0.01 acres
Assumptions: SolFocus: 25% efficiency, 20% GCR; Thin Film 11% efficiency, 50% GCR , High DNI location (7.5+ DNI)

Slide 16Patents Pending © SolFocus, Inc. 2010
Best Cradle-to-Cradle Footprint– Low Lifecycle GHG Intensity– High Recyclability (97%)– Short Energy Payback
No Water Consumption
Lowest Environmental Impact
Slide 17Patents Pending © SolFocus, Inc. 2010
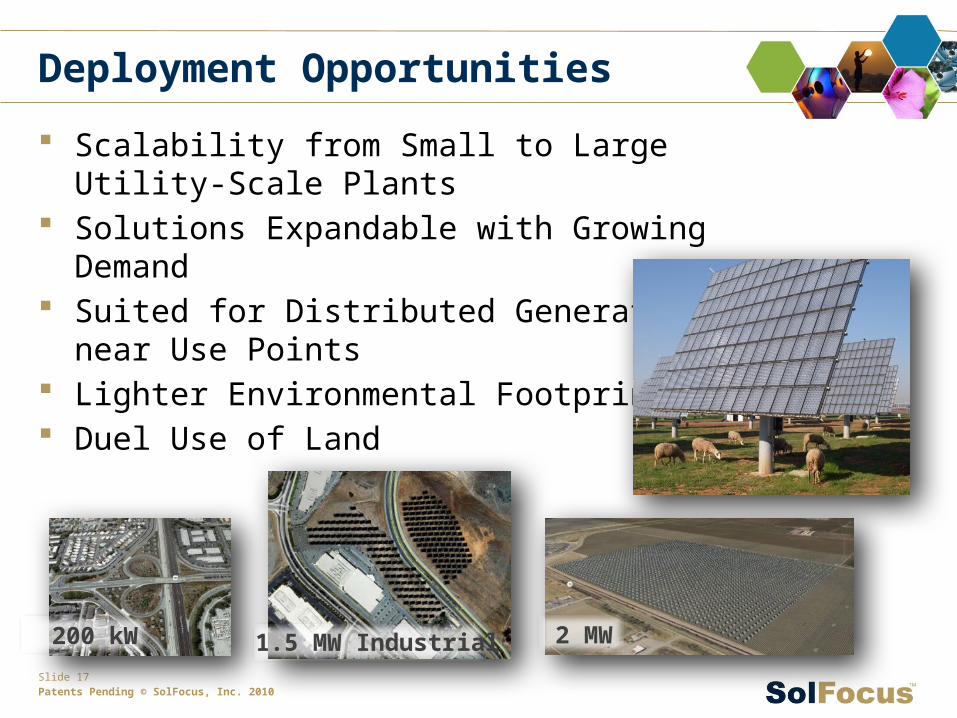
Scalability from Small to Large Utility-Scale Plants Solutions Expandable with Growing Demand Suited for Distributed Generation near Use Points Lighter Environmental Footprint Duel Use of Land
Deployment Opportunities
2 MW200 kW 1.5 MW Industrial
Slide 18Patents Pending © SolFocus, Inc. 2010
THANK YOU!