Slide 1 of 26 Iron Chelator Basics Ali T. Taher, MD Professor of Medicine Haematology-Oncology...
26
Slide 1 of 26 Iron Chelator Basics Ali T. Taher, MD Professor of Medicine Haematology-Oncology Division American University Beirut Medical Center Beirut, Lebanon
-
Upload
junior-hart -
Category
Documents
-
view
231 -
download
0
Transcript of Slide 1 of 26 Iron Chelator Basics Ali T. Taher, MD Professor of Medicine Haematology-Oncology...

Slide 1 of 26
Iron Chelator Basics
Ali T. Taher, MDProfessor of Medicine
Haematology-Oncology DivisionAmerican University Beirut Medical Center
Beirut, Lebanon
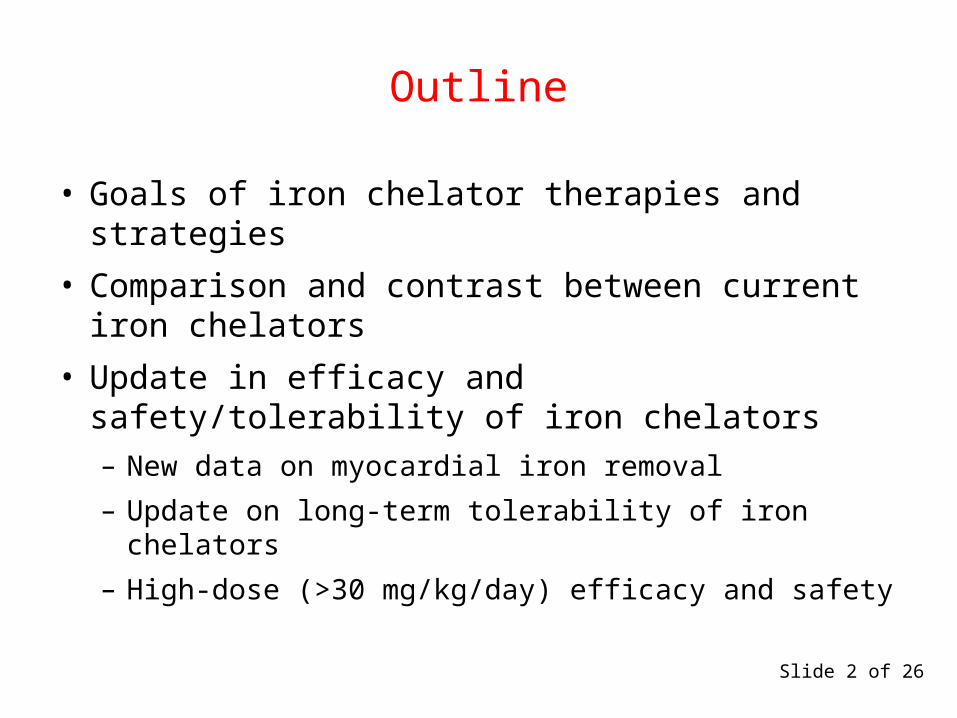
Slide 2 of 26
Outline
• Goals of iron chelator therapies and strategies
• Comparison and contrast between current iron chelators
• Update in efficacy and safety/tolerability of iron chelators– New data on myocardial iron removal
– Update on long-term tolerability of iron chelators
– High-dose (>30 mg/kg/day) efficacy and safety

Slide 3 of 26
Goals of Iron Chelation Therapy
• Maintain iron balance with “safe” tissue iron levels– Prevention
Match transfused iron with chelated (excreted) iron Prevent iron from reaching levels at which tissue damage occurs
– Rescue Remove excess iron—slow process—finite pools Reverse dysfunction
• Detoxification of labile iron—24-hour protection – Extracellular (non–transferrin-bound iron, labile plasma iron)
– Intracellular (labile iron pool)
• Wide therapeutic safety margin of regimen

Slide 4 of 26
Properties of an Ideal Iron Chelator
• To control body iron– High and specific affinity for Fe3+
– High chelating efficiency
• To minimize iron toxicity– 24-hour coverage
– Slow metabolism and elimination rate
– Good tissue penetration with stable iron complex
• Acceptable efficacy–toxicity profile– Clear drug–dose relationship with efficacy and toxicity
– No iron redistribution
• Simplicity and ease of monitoring
• Patient acceptance/compliance– Oral bioavailability
– Suitable for monotherapy

Slide 5 of 26
Decreasing Cellular Toxicity with Chelators
• By inhibiting non–transferrin-bound iron uptake
• By directly chelating labile intracellular iron
• By preventing the incorporation of this iron into new ferritin synthesis
• By intercepting iron derived from lysosomal degradation of ferritin
Porter JB. Am J Hematol. 2007;82:1136-1139.
Effective mechanisms for the action ofchelation therapy

Slide 6 of 26
Overview of Iron ChelatorsProperty Desferrioxamine1 Deferiprone2 Deferasirox3
Usual dose 25–60 mg/kg/d 75 mg/kg/d 20–30 mg/kg/d
Route SC, IV
8–12 h, 5 d/wk
PO
3 times daily
PO
Once daily
Half-life 20–30 min 3–4 h 8–16 h
Excretion Urinary, faecal Urinary Faecal
Adverse effects Local reactions, ophthalmologic, auditory, growth retardation, allergic
GI disturbances, agranulocytosis/neutropenia, arthralgia, elevated liver enzymes
GI disturbances, rash, mild non-progressive creatinine increase, ophthalmologic, auditory, elevated liver enzymes
Status Licensed Not licensed in theUnited States or Canada
Licensed
Approved indications
Treatment of chronic iron overload due to transfusion-dependent anaemias
Thalassaemia major Treatment of chronic iron overload due to frequent blood transfusions
1. Desferrioxamine [PI]. Stein, Switzerland: Novartis Pharma Stein AG; 2007.2. Deferasirox [Summary of Product Characteristics] [PI]. Apotex Europe LTD. 1999. 3. Deferiprone [PI]. West Sussex, UK: Novartis Europharm LT; 2006.
Abbreviations: GI, gastrointestinal; IV, intravenous; PO, by mouth; SC, subcutaneous.

Slide 7 of 26
Thalassaemia International Federation Guidelines for Iron Chelation in -Thalassaemia Major
Treatment Recommendation
Deferasirox • 20 mg/kg/day starting dose in averagely transfused
patients
• 30 mg/kg/day in patients with pre-existing high levels of
iron loading
• 10–15 mg/kg/day for patients with low levels of iron loading
Desferrioxamine • 20–40 mg/kg for children, ≤50–60 mg/kg for adults
• In paediatric patients <3 years of age, recommend reduced
dose and monitoring of growth and bone development
Deferiprone • 75 mg/kg/day
• May be combined with desferrioxamine if desferrioxamine
monotherapy is ineffective
http://www.thalassaemia.org.cy/archive.asp

Slide 8 of 26
Cardiac T2* and Risk of Cardiac DysfunctionLe
ft V
entr
icul
ar E
ject
ion
Fra
ctio
n (%
)
0
50
70
40
30
20
10
60
80
90
0 20 40 60 9080 10010 30 50 70
Cardiac T2* (ms)
Severe cardiac ironSevere cardiac ironMinimal liver ironMinimal liver iron
Severe liver ironSevere liver ironMinimal cardiac ironMinimal cardiac iron
With permission from Anderson LJ, et al. Eur Heart J. 2001;22:2171-2179.

Slide 9 of 26
Cardiac T2* and Risk of Cardiac Dysfunction
Cardiac T2* (ms)
0
50
70
40
30
20
10
60
80
1 3 5 7 10 11 12 13 14 15 16 17 18 199 202 4 6 8
Per
cen
tag
e o
f A
sses
smen
ts w
ith
L
VE
F <
56%
Abbreviation: LVEF, left ventricular ejection fraction.With permission from Westwood MA, et al. J Cardiovasc Magn Reson. 2005;7:46-47.

Slide 10 of 26
Mean Change in LIC and Cardiac T2* During 6 Months of Therapy with
DFSa in TM Patients
6
8
10
12
14
16
18
20
22
Baseline 6 monthsStudy US04, preliminary data.aDosage: 30–40 mg (given over 18 months).Abbreviations: DFS, deferasirox; dw, dry weight; LIC, liver iron concentration; TM, thalassaemia major.With permission from Wood J, et al. Blood. 2007;110:abstr 2781.
Changes in cardiac T2* and LIC (mean ± SE)
Car
dia
c T
2*
(ms
)L
IC (
mg
/g d
w)
Cardiac T2* (P = .0136)LIC (P = .0027)

Slide 11 of 26
Effect on Oxidant-Stress and Inflammation—DFS vs DFO
Mean Decline at 1 Year
Markers DFS DFO P valueTx vs Baseline
P valueDFS vs DFO
Malondialdehyde -21% -25% P = .006 ns
C-reactive protein -51%-27%
+8.6%+34%
NAa
P = .02b
P = .02c
a P values not provided.b Confounded by differences in baseline values and missing baseline data.c Controlled for confounding differences and missing baseline data.Abbreviations: DFO, desferrioxamine; DFS, deferasirox.Walter PB, et al. Haematologica. 2008;93:817-825.

Slide 12 of 26
Effect on Oxidant-Stress and Inflammation—DFS vs DFO Conclusions
• Liver iron concentrations and ferritin declined significantly in both treatment groups, paralleling a significant decline in malondialdehyde
• C-reactive protein decreased significantly only in patients receiving DFS, although this finding should be interpreted with caution
Abbreviations: DFO, desferrioxamine; DFS, deferasirox.Walter PB, et al. Haematologica. 2008;93:817-825.

Slide 13 of 26
Deferasirox—3.5 Years of Data
Trial Patient Population Phase Design N End-Points
106 Paediatric Thal II Single armDFS 10 mg/kg/d
40 1° safety
2° LIC by SQUID
107 Adult, paediatric
Thal III Randomized DFS 530 mg/kg/d vs
DFO 2060 mg/kg/d
586 1° LIC by biopsy or SQUID
2° tolerability
108 Adult,paediatric
Thal, MDS, rare anaemias
II Single arm DFS 530 mg/kg/d
86 thal
98 other
1° LIC by biopsy or SQUID2° tolerability
109 Adult, paediatric
SCD II Randomized DFS1030 mg/kg/d vs
DFO 2060 mg/kg/d
195 1° safety2° LIC by SQUID
• 652 patients have received DFS for a median of 3.4 years (range 0–4.5)
• Extension studies: 312 patients crossed over from DFO to DFS: median of 2.2 years on DFS (range 0–2.9)
• Efficacy analysis based on DFS extension trials: β-thalassaemia: 421; other anaemias: 231
Abbreviations: DFO, desferrioxamine; DFS, deferasirox; LIC, liver iron concentration; SCD, sickle cell disease; SQUID, superconducting quantum interference device; Thal, thalassaemia.. Cappellini MD, et al. ASH 2007. December 8-10, 2007. Poster 967. Porter J, et al. ASH 2007. December 8-10, 2007. Poster 968.

Slide 14 of 26
Median Change in Serum Ferritin Levels from Baseline (By Initial Dose Group)
−1500
−1000
-500
0
500
1000
2 4 6 8 10 12 14 16 18 20 22 24 26 28 30 32 34 36 38 40 42
Time Since Start of Treatment (months)
Med
ian
Ch
ang
e in
Ser
um
Fer
riti
n L
evel
s (µ
g/L
)
0
Core Extension
5–10 (n = 227) 20 (n = 182) 30 (n = 243)Initial deferasirox dose, mg/kg/day
Studies 106–109With permission from Porter J, et al. ASH 2007. December 8-10, 2007. Poster 968.

Slide 15 of 26
Deferasirox—Long-Term Efficacy
• Long-term data highlights– The importance of regularly monitoring serum ferritin levels
– Ensuring that patients receive the appropriate deferasirox dose, based on iron burden and transfusional iron intake to reach therapeutic goal
• In general, serum ferritin levels decreased at deferasirox doses of 30 mg/kg/day and were maintained at doses of 20–25 mg/kg/day
• Treating to a target serum ferritin level of 500 μg/L is a realistic goal
Porter J, et al. ASH 2007; December 8-10, 2007.

Slide 16 of 26
Most Common (> 4% overall) Drug-Related Adverse Events During 3.5 Years of
Treatmenta
Adverse event Frequency, n (%) Severity, n (%)
Mild Moderate Severe
Nausea 99 (10.3) 84 (8.7) 14 (1.5) 1 (0.1)
Diarrhoea 86 (8.9) 68 (7.1) 16 (1.7) 2 (0.2)
Vomiting 60 (6.2) 46 (4.8) 13 (1.3) 1 (0.1)
Abdominal pain 50 (5.2) 36 (3.7) 10 (1.0) 4 (0.4)
Rash 50 (5.2) 28 (2.9) 19 (2.0) 3 (0.3)
Upper abdominal pain 48 (5.0) 37 (3.8) 10 (1.0) 1 (0.1)
aTotal number of patients: 964.With permission from Cappellini MD, et al. ASH 2007. December 8-10, 2007. Poster 967.
Drug-related adverse events during deferasirox treatment were generally transient and of mild-to-moderate severity
Studies 106–109

Slide 17 of 26
Serum Creatinine Increase During 3.5 Years of Treatment
2 Consecutive Serum Creatinine Values >33%
Above Baseline
2 Consecutive Serum Creatinine Values >33% Above Baseline
and Beyond the ULN
β-thalassaemia (n = 680)
284 (41.8%) 39 (5.7%)
Other anaemias (n = 284)
92 (32.4%) 36 (12.7%)
• No patient has developed progressive increases in serum creatinine values >2 x ULN
• 2 patients discontinued due to stable creatinine increases of 1.5 x ULN and confounding circumstances (concomitant cyclosporin and multiple infections, respectively)
With permission from Cappellini MD, et al. ASH 2007. December 8-10, 2007. Poster 967.
Studies 106–109 Abbreviation: ULN, upper limit of normal.

Slide 18 of 26
Hepatic Safety During 3.5 Years of Treatment
• 8 patients (0.8%) experienced an ALT value at 2 consecutive visits that exceeded 10 x ULN; ALT already exceeded ULN at baseline in 6 of these patients
• Discontinuation– 1 patient due to recurrent episodes of proteinuria
– 12 patients due to increases in transaminases
• Drug-induced liver toxicity was suspected in 2 patients with early onset and positive re-challenge
• In patients who showed increased LIC, underchelation was the likely explanation in at least some of the cases
Studies 106–109 Abbreviations: ALT, alanine transaminase; LIC, liver iron concentration; ULN, upper limit of normal.Cappellini MD, et al. ASH 2007. December 8-10, 2007. Poster 967.

Slide 19 of 26
Deferasirox >30 mg/kg/dEfficacy
Population n Relative Change vs Levels Before Dose
Escalation (%)
Absolute Change vs Levels Before Dose
Escalation (µg/L)
P value
All patients 223 – 9.4 – 407 <.001
β-thalassaemia 195 – 12.0 – 437 <.001
Sickle cell disease 23 – 0.6 – 26 NS
Other anaemias 5 – 11.0 – 703 –
Adults 117 – 6.8 – 304 0.009
Paediatrics 103 – 15.2 – 572 <.001
P values based on paired Wilcoxon test; absolute serum ferritin changes vs pre-escalation.Abbreviation: NS, nonsignificant.
Median of relative and absolute change in serum ferritin levels at last observed assessment after dose escalation to >30 mg/kg/day, by subgroup (efficacy population)
With permission from Taher A, et al. Thalassemia International Federation 2008. October 8-11, 2008. Abstract CHE40.

Slide 20 of 26
Deferasirox >30 mg/kg/daySafety
Adverse event Frequency, n (%)
Before Dose Escalation After Dose Escalation
Median exposure (wk) 115.4 36.1
ALT increase 12 (5.4) 7 (3.1)
Vomiting 17 (7.6) 6 (2.7)
Abdominal pain 15 (6.7) 3 (1.3)
Abdominal pain upper 3 (1.3) 3 (1.3)
Nausea 24 (10.7) 3 (1.3)
Serum creatinine increase 13 (5.8) 3 (1.3)
Rash 19 (8.5) 2 (0.9)
Diarrhoea 12 (5.4) 2 (0.9)
Most common drug-related adverse events, as assessed by investigators (observed in >1 patient after dose escalation to >30 mg/kg/day)
Abbreviation: ALT, alanine transaminase.With permission from Taher A, et al. Thalassemia International Federation 2008. October 8-11, 2008. Abstract CHE40.

Slide 21 of 26
Deferasirox >30 mg/kg/daySerum Creatinine
Serum creatinine levels remained unchanged after dose escalation
>30 mg/kg/day (overall population)
0
20
40
60
80
100
120
− 9 − 6 − 3 Baseline 3 6 9 12 15 18
Dose escalation to>30 mg/kg/day
Time (months)
Ser
um
Cre
atin
ine
Leve
ls (
µm
ol/L
)
With permission from Taher A, et al. Thalassemia International Federation 2008. October 8-11, 2008. Abstract CHE40.

Slide 22 of 26
Deferasirox >30 mg/kg/day—ALTAdverse Events
• 12 patients (5.4%) had ALT levels 5 x ULN at 2 consecutive assessments at least 7 days apart, 10 of whom had ALT >ULN prior to receiving deferasirox
• 1 patient, who had ALT >ULN prior to deferasirox treatment, had ALT values 10 x ULN at 2 consecutive visits after dose escalation
Abbreviations: ALT, alanine aminotransferase; ULN, upper limit of normal.

Slide 23 of 26
Long-Term Efficacy—DFP vs DFO vs DFP + DFO
(N = 64 patients with β-thalassaemia)
Mean T2* Myocardial Iron (msec)
DFO
DFPa DFP + DFOb
23.77 35.77 38.05
(+/- 13) (+/- 18.3) (+/- 15.3)
aDFO vs DFP: P = .02bDFO vs DFO + DFO: P = .001Dosages: DFO (30–50 mg/kg/d, >5 d/wk); DFP (75 mg/kg/d); DFO (30–50 mg/kg/d, >5 d/wk) + DFP (75 mg/kg/d)Abbreviations: DFO, desferrioxamine; DFP, deferiprone.
Perifanis V, et al. Int J Hematol. 2007;86:385-389.

Slide 24 of 26
Long-Term Efficacy—DFP vs DFO vs DFP + DFO
(N = 64 patients with β-thalassaemia)
Mean T2* Hepatic Iron (msec)
DFOa DFP DFP + DFOb
8.16 3.29 11.3
(+/- 8.4) (+/- 2.5) (+/- 10.9)
aDFP vs DFO: P = .014bDFP vs DFO + DFP: P = .003Dosages: DFO (30–50 mg/kg/d, >5 d/wk); DFP (75 mg/kg/d); DFO (30–50 mg/kg/d, >5 d/wk) + DFP (75 mg/kg/d)Abbreviations: DFO, desferrioxamine; DFP, deferiprone.
Perifanis V, et al. Int J Hematol. 2007;86:385-389.

Slide 25 of 26
Long-Term Efficacy— DFP vs DFO vs DFP + DFO
Conclusions
• DFO had significantly higher myocardial iron than DFP and DFP + DFO
• DFP had significantly higher hepatic iron than DFO and DFP + DFO
• DFO + DFP appears to combine the different benefits of DFO and DFP with respect to cardiac and hepatic iron
Abbreviations: DFO, desferrioxamine; DFP, deferiprone.Perifanis V, et al. Int J Hematol. 2007;86:385-389.

Slide 26 of 26
Conclusions
• Ease of administration, ensuring compliance, is an important property in choosing an iron chelator
• DFS at dose of 30 mg is efficacious and safe with newer dosing being studied (up to 40 mg)
• Treatment of iron overload may initially require higher doses to achieve iron balance
• Maintaining iron balance with “safe” tissue iron levels may require lower dose levels
• Dosage for an individual patient is determined by number of blood transfusions received and patient’s iron burden