Slide 1 Web viewThis slide highlights some of the transitional challenges ex ... of recruiting...
34
Slide 1 Labour market conditions in the Patterson region 16 October 2014 Presenter: Ivan Neville Branch Manager Labour Market Research and Analysis Branch www.em ploym ent.gov.au Labourm arketconditionsin the Patterson region 16 October2014 Presenter: Ivan Neville Branch M anager LabourM arketResearch and AnalysisBranch
Transcript of Slide 1 Web viewThis slide highlights some of the transitional challenges ex ... of recruiting...

Slide 1
Labour market conditions in the Patterson region
16 October 2014
Presenter: Ivan NevilleBranch ManagerLabour Market Research and Analysis Branch
www.employment.gov.au
Labour market conditions in the Patterson region
16 October 2014Presenter: Ivan Neville
Branch ManagerLabour Market Research and Analysis Branch

Slide 2
Patterson Region
The Patterson Employment Service Area comprises of the following 8 Local Government Areas:Blayney LGABoorowa LGACabonne LGACowra LGAHarden LGAOrange LGAWeddin LGAYoung LGA
The Patterson ESA makes up around 37 per cent of the Central West SA4
Patterson Region

Slide 3
What has Changed?
Patterson
12 months ago Now
Unemployment rate 5.9% 6.0%
Participation rate (15 - 64 years old) 75.1% 76.8%
Average duration of unemployment 40 Weeks 63 Weeks
Income support recipients (15-64 years old) 21% 21%
Total Employment 96,600 102,500
Employment in Manufacturing 5,700 5,000
What has changed?Source: ABS, Census of Population and Housing, 2011; Department of Employment, Small Area Labour Markets, June 2014; ABS Labour Force Survey, August 2014; Department of Employment, Administrative data, June 2014; ABS Estimated Resident Population, 2011

Slide 4
Age distribution
Age distributionSource: ABS, Estimated Residential Population, 2007-2012
The Patterson age distribution is similar to other regional areas around Australia. Younger people make up a smaller proportion of the population compared with Australia.
The under 50 years age group grew 3 per cent in the five years to 2012, whilst the 50 years and over age group grew by 11 per cent.
Age distribution
Source: ABS, Estimated Residential Population, 2007-2012
0%
1%
2%
3%
4%
5%
6%
7%
8%PattersonAustralia
3% growthUnder 50 years
11% growth50 years and over

Slide 5
Losing your brightest and best?...
Losing your brightest and best?...Source: ABS, Census of Population and Housing, 2011
Of the people who moved away from the Patterson region, 18 per cent belonged to the 25-34 year old age group.
Of the people who remained behind 9 per cent belonged to the 25-34 year old age group.
Of those 25-34 year olds who moved away, more than one third are currently employed in a higher skilled job and more than 1 in 4 had completed a bachelor degree or higher.
For those aged 25-34 who stayed behind, 25 per cent were currently employed in a higher skilled job and only 13 per cent had completed a bachelor degree or higher.
Losing your brightest and best?...25-34 years
Source: ABS, Census of Population and Housing, 2011
Stayed Behind Moved Away
• 25% employed in higher skilled job• 13% completed bachelor degree or
higher
• 38% employed in higher skilled job• 27% completed bachelor degree or
higher
18% aged 25-34 years9% aged 25-34 years

Slide 6
…But returning with skills and experience?
35-44 years
…But returning with skills and experience?Source: ABS, Census of Population and Housing, 2011
Of the people who moved into the Patterson region, 17 per cent belonged to the 35-44 year old age group.
Of the people who were there longer than 5 years, 13 per cent belonged to the 35-44 year old age group.
Of those 35-44 year olds who moved into the region, nearly half are currently employed in a higher skilled job and nearly one third have completed a bachelor degree or higher.
For those aged 35-44 who were there longer than 5 years, 33 per cent were currently employed in a higher skilled job and only 17 per cent had completed a bachelor degree or higher.
…But returning with skills and experience?35-44 years
Source: ABS, Census of Population and Housing, 2011
Here for over 5 years Moved In
• 33% employed in higher skilled job• 17% completed bachelor degree or
higher
• 44% employed in higher skilled job• 30% completed bachelor degree or
higher
17% aged 35-44 years13% aged 35-44 years
Slide 7
Unemployment rate
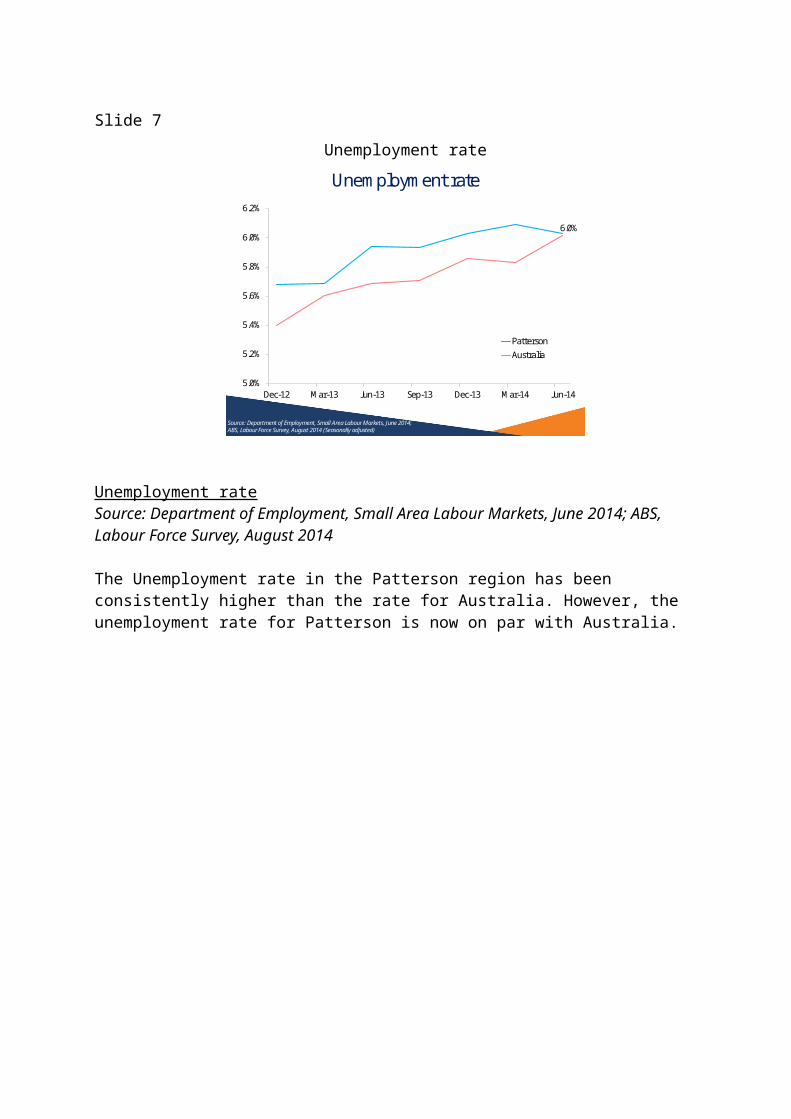
Unemployment rateSource: Department of Employment, Small Area Labour Markets, June 2014; ABS, Labour Force Survey, August 2014
The Unemployment rate in the Patterson region has been consistently higher than the rate for Australia. However, the unemployment rate for Patterson is now on par with Australia.
Source: Department of Employment, Small Area Labour Markets, June 2014;ABS, Labour Force Survey, August 2014 (Seasonally adjusted)
Unemployment rate
6.0%
5.0%
5.2%
5.4%
5.6%
5.8%
6.0%
6.2%
Dec-12 Mar-13 Jun-13 Sep-13 Dec-13 Mar-14 Jun-14
PattersonAustralia

Slide 8
Pockets of disadvantage
RegionUnemployment rate
June 2013 June 2014Blayney LGA 5.2% 5.4%
Boorowa LGA 3.3% 5.2%Cabonne LGA 4.1% 3.9%
Cowra LGA 10.7% 9.4%Harden LGA 3.4% 5.4%Orange LGA 5.7% 5.3%Weddin LGA 6.7% 5.7%Young LGA 6.1% 8.9%Patterson 5.9% 6.0%
Pockets of disadvantageSource: Department of Employment, Small Area Labour Markets, June 2014
Overall the unemployment rate in Patterson has slightly increased in the year to June 2014. The Cowra and Young Local Government Areas have the highest rates of unemployment (9.4 per cent and 8.9 per cent respectively).

Slide 9
High average duration of unemployment
Region
Long-term unemployed
(52 weeks or more)
Average duration of unemployment
Persons Proportion of all unemployed August 2014 Change in the
past 12 months
Central West 3,000 44% 63 weeks + 23 weeks
New South Wales 52,300 24% 48 weeks + 5 weeks
Australia 157,600 22% 40 weeks + 4 weeks
High average duration of unemploymentSource: ABS, Labour Force Survey, August 2014, 12 month averages of original data Long-term unemployed are those who have been unemployed for 52 weeks or more. The proportion of unemployed persons who were long-term unemployed in the Central West SA4 (44 per cent) was larger compared with New South Wales (24 per cent) and Australia (22 per cent). The average duration of unemployment in the Central West SA4 (63 weeks) was higher than New South Wales SA4 (48 weeks) and Australia (40 weeks).

Slide 10
Youth unemployment
In line with national average but hiding challenges faced by young people
Region
Youth unemployment rate(15-24 years) Participation rate
(August 2014)August 2014 August 2013
Central West 13.2% 13.2% 70.5%
New South Wales 12.1% 11.7% 63.8%
Australia 12.9% 12.0% 66.5%
Youth unemployment - In line with national average but hiding challenges faced by young peopleSource: ABS, Labour Force Survey, August 2014, 12 month averages of original data
The unemployment rate for persons aged 15-24 years in Central West is 13.2 per cent, slightly higher compared with both the State (12.1 per cent) and National (12.9 per cent) figures.
In addition, the participation rate for those aged 15-24 years in Central West was higher (70.5 per cent) compared with New South Wales (63.8 per cent) and Australia (66.5 per cent).

Slide 11
High levels of disengagement among young adult females
(20-24 year olds who are not studying)
High levels of disengagement among young adult femalesSource: ABS, Census of Population and Housing, 2011 At the time of the 2011 Census, 18 per cent of young adults (persons aged 20 to 24 years) in Patterson were neither working or studying. This figure was notably higher when compared with Australia (13 per cent).
For young adult males in Patterson, 6 per cent were not in the labour force and not studying and a further 6 per cent were unemployed and not studying.
For young adult females in Patterson, 19 per cent were not in the labour force and not studying and a further 5 per cent were unemployed and not studying.
High levels of disengagement among young adult females
(20-24 year olds who are not studying)
Source: ABS, Census of Population and Housing, 2011
10%6% 5% 4% 6% 5% 6% 4%
10%23%
5%
16%6%
19%
6% 11%
0%
5%
10%
15%
20%
25%
30%
35%
Male Female Male Female Male Female Male Female
Cowra LGA Orange LGA Patterson Australia
Not in the labour force Unemployed

Slide 12
Females aged 20-24 heavily reliant on income support payments
Cowra LGA Orange LGA Patterson Australia
% on Income support payments 56% 37% 40% 26%
% on Unemployment benefits 14% 6% 9% 6%
% on Disability payments 8% 4% 5% 2%
% on Parenting (PPS +PPP)
payments26% 16% 18% 7%
Females aged 20-24 heavily reliant on income support paymentsSource: Department of Employment, administrative data, June 2014; ABS Estimated Resident Population, 2012
In Patterson, females aged 20-24 years are heavily reliant on income support payments:• 40 per cent are on income support payments (compared with 26 per cent for Australia).• 9 per cent are on unemployment benefits (compared with 6 per cent for Australia).• 5 per cent are on disability payments (compared with 2 per cent for Australia).• 18 per cent are on parenting payments (compared with 7 per cent for Australia).

Slide 13
Nearly one third of 15-24 year olds are at risk
Nearly one third of 15-24 year olds are at riskSource: ABS, Census of Population and Housing, 2011
At the time of the 2011 Census, there were 10,000 15-24 year olds in the Patterson region, of whom 4,700 were not studying. • Of the 4,700 who were not studying, those who did not complete year 12, whether they’re
employed or not employed, are vulnerable and may have difficulty entering the labour market
Note: Not stated records for FT/PT Student Status, Labour Force Status and Highest Year of School Completed have not been included.
Population (15-24 years):10,000
Not Studying:4,700(47%)
Studying:5,300(53%)
Not Employed:1,200(12%)
Employed:3,500(35%)
CompletedYear 12:
1,700(17%)
Did Not CompleteYear 12:
1,800(18%)
CompletedYear 12:
400(4%)
Did Not CompleteYear 12:
800(8%)
Source: ABS, Census of Population and Housing, 2011
Nearly one third of 15-24 year olds are at risk

Slide 14
Indigenous labour market outcomes
RegionProportion of
WAP indigenous
Indigenous Non-Indigenous
Unemployment Rate
Participation Rate
Unemployment Rate
Participation Rate
Cowra LGA 7% 19.8% 52.5% 6.4% 71.3%
Orange LGA 5% 16.7% 53.0% 4.1% 77.6%
Patterson 4% 18.1% 52.7% 4.7% 75.2%
Australia 2% 17.2% 55.9% 5.5% 76.4%
Indigenous labour market outcomesSource: ABS, Census of Population and Housing, 2011
The proportion of the working age population that identified as Indigenous in Patterson was 4 per cent, higher compared with Australia. The proportion was higher for the Cowra LGA (7 per cent).
Those who identify as Indigenous often have worse labour market outcomes compared with their non-indigenous counterparts. The unemployment rate for Indigenous people in Patterson was 18.1 per cent, significantly higher compared with the Non-Indigenous unemployment rate (4.7 per cent). The participation rate for Indigenous people was also far lower (18.1 per cent) compared with Non-Indigenous people (75.3 per cent).

Slide 15
Lower educational attainment
RegionCompleted Yr 12 Attained Advanced Diploma,
Diploma or Certificate III & IV Level
Attained Bachelor Degree or Higher2011 2006
Blayney LGA 56% 49% 43% 17%Boorowa LGA 60% 53% 36% 18%Cabonne LGA 58% 54% 40% 20%
Cowra LGA 49% 48% 36% 12%Harden LGA 54% 53% 45% 10%Orange LGA 61% 55% 38% 23%Weddin LGA 57% 54% 35% 22%Young LGA 53% 48% 33% 17%Patterson 58% 53% 38% 20%Australia 75% 69% 30% 35%
Lower educational attainment – persons aged 25-34 yearsSource: ABS, Census of Population and Housing, 2011 At the time of the 2011 Census, the proportion of 25 to 34 year olds in the Patterson region who had completed Year 12 or equivalent was 58 per cent. Job seekers who have not completed Year 12 and have limited experience in the workforce are likely to lack many basic employability skills that employers value and look for in applicants, particularly for lower skilled vacancies and entry level positions such as apprenticeships and traineeships. At the time of the 2011 Census, the proportion of 25 to 34 year olds who had attained an Advanced Diploma, Diploma or Certificate level III or IV in Patterson (38 per cent) was larger than the national average (38 per cent) while the proportion who had attained a Bachelor Degree or higher (20 per cent) was far lower than the National average (35 per cent).

Slide 16
Educational attainment & labour market outcomes
Educational attainment & labour market outcomesSource: ABS, Census of Population and Housing, 2011 There is a strong relationship between educational attainment and employment outcomes. For those aged 25 to 34 years in the Patterson region, there were high unemployment rates for those who had completed Certificate I & II but had not completed Year 12 (12.6 per cent) and those who had not completed Year 12 or a post school qualification (12.8 per cent).
Unemployment rates are considerably lower for those who have completed a tertiary education at the Bachelor Degree, Advanced Diploma and Diploma Level. It should also be noted that employment outcomes are better for those who have attained Certificate Levels III or IV. This emphasises the importance of post school education in gaining employment.
Educational attainment & labour market outcomesPatterson region, persons aged 25-34 years
Source: ABS, Census of Population and Housing, 2011
1.7% 1.8%3.8%
4.9%
12.6% 12.8%
88.4% 86.5% 88.5%
75.8%71.9%
66.2%
0.0%
10.0%
20.0%
30.0%
40.0%
50.0%
60.0%
70.0%
80.0%
90.0%
100.0%
0.0%
5.0%
10.0%
15.0%
20.0%
25.0%
BachelorDegree or
higher
AdvancedDiploma and
Diploma Level
Certificate III& IV Level
Year 12 orequivalent
Certificate I &II Level
Below Year 12
Unemployment Rate
Participation Rate

Slide 17
Employment by industry
Employment by industrySource: ABS, Census of Population and Housing, 2011
The largest employing industries in the Patterson region are Health Care and Social Assistance, Retail Trade and Agriculture, Forestry and Fishing.
Employment by industryPatterson
(Working age population)
Source: ABS, Census of Population and Housing, 2011
14%
11%
10%
9%
9%
7%
6%
6%
5%
12%
11%
2%
9%
8%
9%
7%
7%
2%
0% 5% 10% 15%
Health Care and Social Assistance
Retail Trade
Agriculture, Forestry and Fishing
Manufacturing
Education and Training
Construction
Public Administration and Safety
Accommodation and Food Services
Mining
PattersonAustralia

Slide 18
Employment growth for largest industries
Employment growth for largest industriesSource: ABS, Census of Population and Housing, 2006 and 2011
Employment in Mining has increased significantly in the 5 years to 2011. Strong growth was also seen in the Health Care and Social Assistance industry.
Employment growth for largest industriesPatterson, 2006-2011
Source: ABS, Census of Population and Housing, 2006 and 2011
830
780
320
270
120
50
-120
-440
-720
-1000 -500 0 500 1000
Health Care and Social Assistance
Mining
Education and Training
Construction
Accommodation and Food Services
Public Administration and Safety
Retail Trade
Manufacturing
Agriculture, Forestry and Fishing

Slide 19
Most new jobs will be in the services sector
Most new jobs will be in the services sectorSource: Department of Employment, Projections to November 2018
The Health Care and Social Assistance industry (1,800) is projected to create the most new jobs in the Central West Region in the five years to November 2018. This was followed by Education and Training (1,200) and Accommodation and Food Services (1,000).
1800
1200
1000
900
700
400
300
100
-100
-500 0 500 1000 1500 2000
Health Care and Social Assistance
Education and Training
Accommodation and Food Services
Retail Trade
Construction
Agriculture, Forestry and Fishing
Public Administration and Safety
Mining
Manufacturing
Most new jobs will be in the services sectorCentral West, five years to November 2018
Source: Department of Employment, Projections to November 2018

Slide 20
Transitional changes
Transitional challengesSource: ABS, Census of Population and Housing, 2011
This slide highlights some of the transitional challenges ex-domestic appliance manufacturing industry workers may face when attempting to regain employment. Although Hospitality Workers and Personal Carers and Assistants are among the occupations which have grown the most from 2006 to 2011, they will in general offer a lower salary and fewer hours per week than occupations in the Domestic appliance manufacturing industry.
Transitional challenges
Domestic appliance manufacturingMedian weekly full-time income:
$800 - $999Average hours per week: 40
Male: 79%
Personal Carers and AssistantsMedian weekly full-time income: $600 - $799
Average hours per week: 30Male: 18%
Hospitality workersMedian weekly full-time income: $600 - $799
Average hours per week: 24Male: 21%
Source: ABS, Census of Population and Housing, 2011

Slide 21
Hints for workers recently made redundant
Hints for workers recently made redundant
• Consider a wide range of job opportunities• Re-training is likely to be required• Promote adaptability• Act quickly• Be positive and enthusiastic
Hints for workers recently made redundantSource: Department of Employment, Survey of Employers’ Recruitment Experiences
• Consider a wide range of job opportunities• Re-training is likely to be required• Promote adaptability• Act quickly• Be positive and enthusiastic

Slide 22
Recruitment activity
Recruitment activity
• 56 per cent of employers had recruited in the
last 12 months
• Two thirds of employers did not change their
staff numbers
• More vacancies available in the region
compared with the start of the year
Recruitment activitySource: Department of Employment, Survey of Employers’ Recruitment Experiences, Patterson ESA, June 2014; Department of Employment, Vacancy Report, August 2014
56 per cent of employers had recruited in the last 12 months.
Two thirds of employers did not change their staff numbers.
A very small proportion of vacancies were not filled (1.2 per cent).

Slide 23
The recruitment process
In Patterson
The recruitment process – in PattersonSource: Department of Employment, Survey of Employers’ Recruitment Experiences, Patterson ESA, June 2014
On average employers in Patterson received 7 (6.8) applicants per vacancy.
Of these applicants on average only 2 (2.4) were interviewed.
Of these interviewed applicants only 1 (1.5) was suitable for the vacancy.
The reasons applicants did not get an interview were:- Lack of relevant experience- Poorly written/presented application- Insufficient qualifications or training- Basic employability skills
The recruitment processIn Patterson
Average number of applicants per vacancy
7Average number of
applicants interviewed
2
Average number of interviewed applicants
who were suitable
2
Why people don’t get an Interview?- Lack of relevant experience- Poorly written/presented application- Insufficient qualifications or training- Basic employability skills
Not Interviewed
Source: Department of Employment, Survey of Employers’ Recruitment Experiences, Patterson ESA, June 2014

Slide 24
Reasons applicants didn’t get an interview
Reasons applicants didn’t get an interviewSource: Department of Employment, Survey of Employers’ Recruitment Experiences, Patterson ESA, June 2014
The biggest reason applicants didn’t get an interview in the Patterson region was due to the applicant’s lack of relevant experience (50 per cent). This was followed by insufficient qualifications or training (14 per cent), lack of soft skills (14 per cent) and poorly written/presented application (14 per cent).
50%
14% 14% 14%11% 9%
5%
0%
10%
20%
30%
40%
50%
60%
Lack of relevantexperience
Insufficientqualifications or
training
Lack of soft skills Poorlywritten/presented
application
Applicant locatedoverseas/
interstate/ out ofarea
Applicant notavailable for
required workhours
Application notgood enough
64% of applicants didn’t get an
interview
Reasons applicants didn’t get an interview
Source: Department of Employment, Survey of Employers’ Recruitment Experiences, Patterson ESA, June 2014

Slide 25
Personality traits and employability skills
Employers in Patterson viewed as essential
Personality traits and employability skills employers in Patterson viewed as essentialSource: Department of Employment, Survey of Employers’ Recruitment Experiences, Patterson ESA, June 2014
Employers in Patterson viewed the following employability skills and personality traits as essential:
Employability skills:• Interpersonal/Social Skills• Communication• Customer Service Skills
Personality traits:• Reliability, Honesty and Work Ethic• Enthusiasm/positive attitude• Presentation
Personality traits and employability skills Employers in Patterson viewed as essential
Communication
Reliability, Honesty & Work Ethic
Enthusiasm/positive attitude
Presentation
Personality Traits considered most essential
Employability Skillsconsidered most essential
Customer Service Skills
Interpersonal/Social Skills
Source: Department of Employment, Survey of Employers’ Recruitment Experiences, Patterson ESA, June 2014

Slide 26
Almost half of employers do not formally advertise vacancies
Almost half of employers do not formally advertise vacancies in PattersonSource: Department of Employment, Survey of Employers’ Recruitment Experiences, Patterson ESA, June 2014
Just over half of recruiting employers (51 per cent) used formal methods to advertise for vacancies (i.e. Internet, Newspaper)
The other half (49 per cent) of recruiting employers used Informal methods ONLY to recruit for vacancies (i.e. Word of Mouth, Approached by job seeker)
Formal methods
Internet
Newspaper
Almost half of employers do not formally advertise vacancies
52%
Informal methods ONLY
Word of Mouth
Approached by Job seeker
47%
53%
Source: Department of Employment, Survey of Employers’ Recruitment Experiences, Patterson ESA, June 2014
51%
49%

Slide 27
Recruitment outlook encouraging
Recruitment outlook encouraging
• One third of employers expected to recruit
• Many employers in Education (44 per cent)
and Health Care (26 per cent) expect to
increase staff numbers
• Broad range of occupations expected to be
available
Recruitment outlook encouragingSource: Department of Employment, Survey of Employers’ Recruitment Experiences, Patterson ESA, June 2014
One third of employers expected to recruit in the 12 months following the survey.
Many employers in Education (44 per cent) and Health Care (26 per cent) expect to increase staff numbers.
Broad range of occupations expected to be available.

Slide 28
Single greatest concern for employers
Single greatest concern for employersSource: Department of Employment, Survey of Employers’ Recruitment Experiences, Patterson ESA, June 2014
The single greatest concern for employers in Patterson was demand/economy (39 per cent). A large proportion of employers (20 per cent) reported No concerns.
9 per cent of employers expected recruitment or retention difficulty/skill shortages in the future.
39%
20%
10%
9%
4%
3%15%
Demand/ economy
No concerns
Cash flow/ Costs/ Wages
Recruitment or retentiondifficulty/ skill shortagesCompetition (including highAustralian dollar)Paperwork/ regulation/ redtapeOther
Single greatest concern for employers
Source: Department of Employment, Survey of Employers’ Recruitment Experiences, Patterson ESA, June 2014

Slide 29
Conclusion
Conclusion
• Labour market conditions solido Unemployment across Patterson holding steadyo Total employment in the region has increased in
the last 12 monthso Pockets of disadvantageo Duration of unemployment remains a concern
• Challengeso Disengaged groups: youth, less educated,
Indigenous and long term unemployedo Transitioning to the Services sector
• Opportunitieso Future recruitment expectations encouragingo Growth industries such as Health Care and Social
Assistanceo Broad range of occupations likely to be available
• Job seekers need to have…o Employability skillso Higher levels of education and trainingo Broader job search techniques
• Ongoing collaboration with key stakeholders essential
Conclusion• Labour market conditions solid
o Unemployment across Patterson holding steadyo Total employment in the region has increased in the last 12 monthso Pockets of disadvantageo Duration of unemployment remains a concern
• Challengeso Disengaged groups: youth, less educated, Indigenous and long term unemployedo Transitioning to the Services sector
• Opportunities o Future recruitment expectations encouragingo Growth industries such as Health Care and Social Assistanceo Broad range of occupations likely to be available
• Job seekers need to have…o Employability skillso Higher levels of education and trainingo Broader job search techniques

• Ongoing collaboration with key stakeholders essential
Slide 30
Further information
Further Information
More information on labour market conditions and other research on small areas can be found on these websites:- www.employment.gov.au/regionalreports - www.lmip.gov.au - www.employment.gov.au/SkillShortages - www.employment.gov.au/australianjobs - www.joboutlook.gov.au
Further Information
More information on labour market conditions and other research on small areas can be found on these websites:- www.employment.gov.au/regionalreports - www.lmip.gov.au - www.employment.gov.au/SkillShortages - www.employment.gov.au/australianjobs - www.joboutlook.gov.au

Slide 31
If you have any questions about the presentation please contact the Recruitment Analysis and Employer Surveys sections on 1800 059 439 or email [email protected]

Slide 32