Slide 1 Ivan Neville Branch Manager Ipswich and West ... Market Research and Analysis Branch. Slide...
18
Slide 1 Health Care and Social Assistance Ipswich and West Moreton Health Alliance Ivan Neville Branch Manager Labour Market Research and Analysis Branch
Transcript of Slide 1 Ivan Neville Branch Manager Ipswich and West ... Market Research and Analysis Branch. Slide...

Slide 1
Health Care and Social Assistance
Ipswich and West Moreton Health Alliance
Ivan NevilleBranch ManagerLabour Market Research and Analysis Branch

Slide 2
Current Australian Labour Market Conditions
• Over the year to July 2012, employment has increased
by just 66 000 (0.6 per cent), reflecting recent softness
• At 5.2 per cent, the unemployment rate is less than half
that of the Euro Area (11.2 per cent)
• The participation rate (at 65.2 per cent) has come off
its historic high, but remains above its decade average
of 64.8 per cent
Source: ABS Labour Force Survey, cat. no. 6291.0.55.003, seasonally adjusted data

Slide 3
Labour Market Indicators – July 2012
Source: ABS, Labour Force Survey, cat. no. 6202.0. Labour force data for Queenslandand Australia are seasonally adjusted, while data for Ipswich and South East Qld arethree-month averages of original estimates. All Youth (15-24) unemployment rates arein 12 month averages.
IpswichSouth East
QldQld Aus
Unemployment Rate (%) 4.7 5.4 5.8 5.2
Annual Employment Growth (%) -0.9 -0.4 0.0 0.6
Participation Rate (%) 67.6 66.6 66.5 65.2
Youth Unemployment Rate (%) 12.6 12.1 11.9 12.1
Ipswich recorded comparatively solid labour market conditions in July 2012, particularly in light of the subdued conditions recorded at the State and national level. Indeed, despite recording negative employment growth of 0.9 per cent over the previous year, the regions unemployment rate of 4.7 per cent remained well below the national average of 5.2 per cent, and the level recorded for Queensland (5.8 per cent). Meanwhile, the participation rate for the region stood at 67.6 per cent, above both levels recorded for Queensland and Australia. That said, the youth (15-24) remain disadvantaged, with an unemployment rate of 12.6 per cent, above the levels recorded for the age group at the state and national level. The labour market indicators for South East Queensland show that the region’s performance is consistent with state and national trends. Despite negative annual employment growth, all other indicators reflect state and national trends.
In terms of the Labour Force Regions used in the ABS Labour Force Survey, ‘South East Queensland’ is the amalgam of the Brisbane Major Statistical Region and the Sunshine Coast, Gold Coast and West Moreton Statistical Regions). Brisbane City is the local government area (LGA), while South East Queensland includes Brisbane City plus the LGAs of Gold Coast City, Ipswich City, Lockyer Valley Regional Council, Logan City, Moreton Bay Regional Council, Redland City, Scenic Rim Regional Council, Somerset Regional Council and Sunshine Coast Regional Council.

Slide 4
Health Care and Social Assistance - AustraliaEmployment Level (‘000) - May 2002 to May 2012
Source: ABS Labour Force Survey, cat. no. 6291.0.55.003 (trend)
916.0 915.8964.7
994.3
1059.9 1077.11110.9
1201.91237.4
1305.81359.9
0
200
400
600
800
1000
1200
1400
1600
May-02 May-03 May-04 May-05 May-06 May-07 May-08 May-09 May-10 May-11 May-12
This slide shows the ongoing strength and resilience of the Health Care and Social Assistance industry. Indeed, as shown by this graph, the industry continued to grow during the global financial crisis (GFC). More recently, over the year to May 2012, Health Care and Social Assistance has remained strong despite the subdued broader labour market conditions, with employment rising by 4.1 per cent compared with 0.7 per cent for all industries. Indeed, over the period employment in the industry rose by 54 100, the largest increase of all industries.

Slide 5
Employment growth by Industry over last 5 years (‘000)
-74.0
-17.0
-4.3
5.3
8.8
10.1
14.7
17.9
18.4
24.1
36.2
47.3
50.3
52.1
72.2
121.4
131.7
171.3
282.8
-100 -50 0 50 100 150 200 250 300
Manufacturing
Information Media and Telecommunications
Agriculture, Forestry and Fishing
Retail Trade
Wholesale Trade
Transport, Postal and Warehousing
Arts and Recreation Services
Financial and Insurance Services
Rental, Hiring and Real Estate Services
Other Services
Administrative and Support Services
Accommodation and Food Services
Construction
Electricity, Gas, Water and Waste Services
Public Administration and Safety
Education and Training
Mining
Professional, Scientific and Technical Services
Health Care and Social Assistance
Source: ABS Labour Force Survey, cat. no. 6291.0.55.003 (trend)
As shown by this graph, Health Care and Social Assistance recorded the strongest growth of any industry over the five years to May 2012, rising from 1 077 100 to 1 359 900, an increase of 282 800, or 26.3 per cent. This industry was responsible for 26.6 per cent of Australia’s growth over this period and has grown more than twice as much as other industries such as Mining and Education and Training.

Slide 6
Health Care and Social AssistanceCurrent Employment Level (‘000) by Sector – May 2012
30.0
46.5
108.9
135.6
154.6
208.7
210.3
389.7
0 50 100 150 200 250 300 350 400 450
Other Health Care Services
Pathology and Diagnostic Imaging Services
Child Care Services
Medical Services
Allied Health Services
Other Social Assistance Services
Residential Care Services
Hospitals
Source: ABS Labour Force Survey, cat. no. 6291.0.55.003 (DEEWR trend)
The Hospitals sector is the largest employing sector in Health Care and Social Assistance, responsible for employing 389 700 people, or 30.3 per cent of total employment in the industry. Notably, this sector recorded the largest rise in employment over the past five years for any Health Care and Social Assistance sector, increasing by 48 000 or 14.1 per cent. Other sectors that recorded strong growth over the five years to May 2012 include Other Social Assistance Services (rising by 47 700, or 29.6 per cent), Residential Care Services (rising 45 400, or 27.5 per cent) and Allied Health Services (rising 39 200, or 34.0 per cent). At the 3 digit level, ‘Other Health Care Services’ includes Ambulance Services, Blood Bank Operation, Health Assessment Services and Health Care Services not otherwise defined. ‘Allied Health Services’ includes Dentistry, Orthodontics, Optometry, Physiotherapy, Chiropractic and Speech Pathology. ‘Other Social Assistance Services’ includes adoption service, youth welfare service, disabilities assistance service, welfare counselling and aged care assistance service.

Slide 7
Health Care and Social AssistanceHigher skilled Occupations
OccupationPersons Employed
(2011)
Registered Nurses 209 400
Generalist Medical Practitioners 46 200
Welfare Support Workers 29 400
Enrolled and Mothercraft Nurses 29 100
Medical Technicians 21 300
Medical Imaging Professionals 17 500
Social Workers 16 700
Psychologists 16 000
Source: ABS Labour Force Survey cat. no. 6291.0.55.003, four quarter average (custom data request)
Registered Nurses is the highest employing occupation not only amongst the high skilled occupations in the Health Care and Social Assistance industry, but for all occupational groups in the industry, employing 209 400 people (or 15.9 per cent of the industry’s total employment).

Slide 8
Health Care and Social AssistanceLower skilled Occupations
OccupationPersons Employed
(2011)
Aged and Disabled Carers 103 200
Child Carers 87 100
Nursing Support and Personal Care Workers 85 400
Receptionists 74 900
Kitchenhands 24 000
Dental Assistants 21 200
General Clerks 19 400
Commercial Cleaners 16 600
Source: ABS Labour Force Survey cat. no. 6291.0.55.003, four quarter average (custom data request)
While there are a large number of higher skilled jobs in Health, such as doctors and nurses (see previous page), there are also a large number of lower skilled jobs such as receptionists, kitchen hands and commercial cleaners. Notably, the top four lower skilled occupations in Health Care and Social Assistance employ 350 600 people, accounting for 26.6 per cent of total employment in the industry. The five largest occupational groups in Health Care and Social Assistance account for 560 100, or 42.5 per cent, of persons employed in the industry. These are Registered Nurses, Aged and Disable Carers, Child Carers, Nursing Support and Personal Care Workers and Receptionists.

Slide 9
Health Care and Social Assistance in SE Qld
Source: ABS Labour Force Survey, cat.no. 6291.0.55.003 (four quarter average)
• Health Care and Social Assistance employs 191 700
people, or 12 per cent of the workforce
• Employment increased by 13 000, or 7 per cent
over the past year
• 40 per cent work part time
• 77 per cent are female
• 44 per cent aged 45 years and over
Health Care and Social Assistance has a higher proportion of mature-age workers (45+), and is above the all industries average in this region. However, as a result of this, the industry is underrepresented in the 15-24 age category – partly attributable to the education requirements for many of the higher skilled occupations within the industry. An ageing workforce is one factor that can contribute to, or exacerbate, current or expected labour shortages in a particular occupation, and thus may pose problems for the industry in the coming decades. Across Australia, the age profile in this industry has become older over the past decade. In February 2002, 12.5 per cent of the Health Care and Social Assistance workforce was aged 55+, compared with 20.4 per cent in February 2012. Health Care and Social Assistance and All Industries comparisons for workforce characteristics in South East Queensland: Health All Industries Full Time (%) 60.3 70.5 Part Time (%) 39.7 29.5 Males (%) 22.6 53.4 Females (%) 77.4 46.6 Age Shares Youth (15-24) 10.9 18.2 Prime Age (25-44) 44.7 45.5 Mature Age (45 and over) 44.4 36.3

Slide 10
Health Care and Social Assistance - AustraliaEducational Attainment - Share of Employment (%)
Source: ABS, Education and Work, cat. No. 6227.0 (May 2011, Custom Data Request)
8.7
12.5
21.2
3.2
2.5
17.6
14.4
41.2
78.8
0 10 20 30 40 50 60 70 80
Year 10 or below
Year 11 or 12
Without a non-school qualification
Certificate or level not defined
Certificate I and II
Certificate III and IV
Advanced Diploma and Diploma
Bachelor Degree or Higher
With a non-school qualification
Nearly 80 per cent (78.8 per cent) of employees in the Health Care and Social Assistance industry hold a non-school qualification, well above the 62.6 per cent for all industries. The largest proportion of these hold a ‘Bachelor Degree or Higher’, with 41.2 per cent of employees falling within this level of educational attainment, well above the 27.0 per cent for all industries. Health Care and Social Assistance also has a lower proportion of people with a year 12 or below level of qualification, with just 21.2 per cent of employees falling into this category, compared to 37.4 per cent for all industries. Notably, Health Care and Social Assistance has just 12.5 per cent of its employment with year 11 or 12 as their highest level of qualification, compared to 22.2 per cent for all industries.

Slide 11
Labour Market Outcomes by Educational Attainment for 25 to 34 year olds – SE Qld
Source: ABS, Census of Population and Housing, 2006
2.5
3.7
3.1
4.6
10.9
9.4
88.6
85.1
90.6
81.578.5
71.5
0
10
20
30
40
50
60
70
80
90
100
0.0
2.0
4.0
6.0
8.0
10.0
12.0
Bachelor Degree or higher
Advanced Diploma and Diploma
Cert III and IV (includes VET)
Year 12 or equivalent Cert I and II Below Year 12
Par
tici
pat
ion
rat
e (
%)
Un
em
plo
yme
nt
rate
(%)
Unemployment rate (LHS) Participation rate (RHS)
This graph shows labour market outcomes (unemployment and participation rates) by level of education at the national level, for those aged 25-34. As shown by this graph, those with a higher level of education experience more favourable labour market outcomes than those with a lower level of education. This highlights the importance of post-school qualifications, especially at the Certificate III/IV level and above, which, as the previous slide shows, are in demand in the Health Care and Social Assistance industry. (Note: Data are from the 2006 Census and apply to the population aged 25 to 34 only, Australia-wide. Non-school qualifications are given precedence – i.e. Highest levels of school completed apply only to those who stated that they have no non-school qualification.)

Slide 12
Recruitment Difficulty - AustraliaOccupations difficult to fill in the Health Care and Social Assistance industry by skill level
Source: DEEWR, Survey of Employers’ Recruitment Experiences
Registered Nurses Early Childhood (Pre-primary School) Teachers
Generalist Medical Practitioners Welfare Support Workers
Enrolled and Mothercraft Nurses Counsellors
Child Carers Nursing Support and Personal Care Workers
Aged and Disabled Carers Receptionists
Dental Assistants General Clerks
Higher skills, qualification or experience
Lower skills, qualification or experience
In the 12 months to December 2011, 51 per cent of employers anticipated recruitment difficulty in the 12 months following the survey, slightly higher than across all industries (46 per cent). Potential sources of labour to help fulfil these potential job openings include Males and persons aged 15-44, due to the fact that these groups are underrepresented in the Health Care and Social Assistance Industry compared to the All Industries averages. In terms of skill shortages, the Health Care and Social Assistance industry has experienced significant and relatively widespread shortages of skilled workers over the last decade. In 2012, however, shortages were markedly less evident with employers finding it easier to fill their vacancies with suitably qualified workers, partly reflecting increased training. Nonetheless, shortages persist for Sonographers, Optometrists, Audiologists, Midwives, Enrolled Nurses, Child Care Centre Managers and Child Care Workers. An ageing workforce is one factor that can contribute to, or exacerbate, current or expected labour shortages or recruitment difficulties in a particular occupation, and thus may pose problems for the industry in the coming decades.

Slide 13
Health Care: strong future growth
Source: DEEWR Industry Employment projections, 2012
-85.6
4.6
5.5
6.7
7.8
17.0
17.7
17.9
18.4
18.5
30.9
31.2
42.0
50.4
61.3
103.7
108.2
131.2
241.8
-150 -100 -50 0 50 100 150 200 250 300
Manufacturing
Information Media and Telecommunications
Agriculture, Forestry and Fishing
Rental, Hiring and Real Estate Services
Arts and Recreation Services
Wholesale Trade
Administrative and Support Services
Electricity, Gas, Water and Waste Services
Other Services
Financial and Insurance Services
Accommodation and Food Services
Public Administration and Safety
Transport, Postal and Warehousing
Retail Trade
Education and Training
Mining
Professional, Scientific and Technical Services
Construction
Health Care and Social Assistance
While the labour market outlook, in the near-term, is subdued, some industries are expected to perform better than others. In the five years to 2016-17, job growth is expected to be particularly concentrated in four industries: Health Care and Social Assistance, Construction, Professional Scientific and Technical Services, and Mining. These industries are expected to provide around 584 900 new jobs, or almost two thirds (63.9 per cent) of the employment growth over the five years to 2016-17. Notably, employment in Health Care and Social Assistance is projected to increase by 241 800, contributing 26.4 per cent of Australia’s total projected employment growth over the period. Manufacturing is the only industry projected to decline in overall employment numbers over the coming five years, falling by 85 600.

Slide 14
Projected Sectoral Growth (‘000) to 2016-17
6.0
11.9
23.5
24.0
31.1
34.5
39.0
63.1
0 10 20 30 40 50 60 70
Other Health Care Services
Pathology and Diagnostic Imaging Services
Child Care Services
Medical Services
Allied Health Services
Other Social Assistance Services
Residential Care Services
Hospitals
Source: DEEWR Industry Employment projections, 2012
Projected industry sector growth in Health Care and Social Assistance to 2016-17 is broadly in line with the size of the relevant sectors, with the largest sectors projected to grow the most. Employment in the Hospitals sector is projected to increase by 63 100 or 15.4 per cent, the most of any sector within Health Care and Social Assistance, and indeed any sector across all industries. Notably, Residential Care Services is projected to record the second largest growth of any sector in Health Care and Social Assistance over the five years to 2016-17. Employment in the sector is projected to increase by 39 000 or 18.2 per cent, well above the 7.2 per cent employment growth projected for all industries.
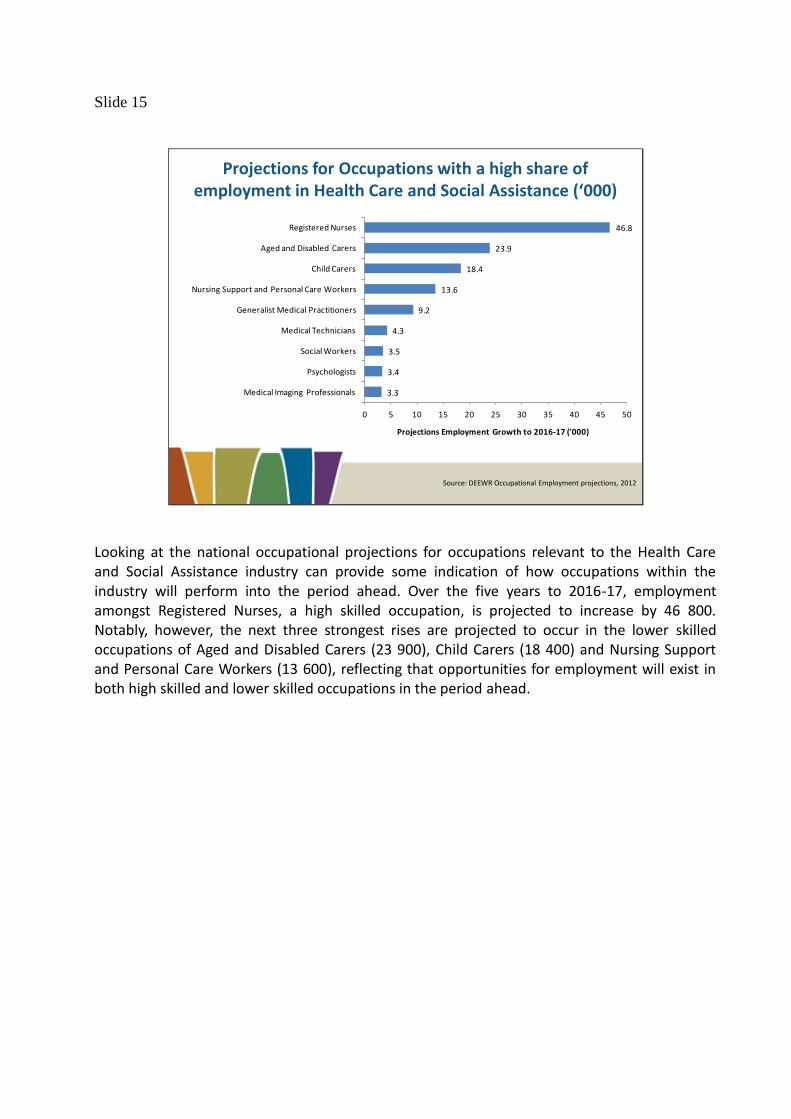
Slide 15
Projections for Occupations with a high share of employment in Health Care and Social Assistance (‘000)
Source: DEEWR Occupational Employment projections, 2012
3.3
3.4
3.5
4.3
9.2
13.6
18.4
23.9
46.8
0 5 10 15 20 25 30 35 40 45 50
Medical Imaging Professionals
Psychologists
Social Workers
Medical Technicians
Generalist Medical Practitioners
Nursing Support and Personal Care Workers
Child Carers
Aged and Disabled Carers
Registered Nurses
Projections Employment Growth to 2016-17 ('000)
Looking at the national occupational projections for occupations relevant to the Health Care and Social Assistance industry can provide some indication of how occupations within the industry will perform into the period ahead. Over the five years to 2016-17, employment amongst Registered Nurses, a high skilled occupation, is projected to increase by 46 800. Notably, however, the next three strongest rises are projected to occur in the lower skilled occupations of Aged and Disabled Carers (23 900), Child Carers (18 400) and Nursing Support and Personal Care Workers (13 600), reflecting that opportunities for employment will exist in both high skilled and lower skilled occupations in the period ahead.

Slide 16
Projected Industry Employment Growth in SE Qld
Source: DEEWR Regional Employment projections, 2012
37.2
22.6
22.0
11.0
10.3
10.1
9.7
5.8
4.7
4.4
4.0
3.7
2.5
1.8
1.7
1.1
0.5
-0.9
-9.2
-20.0 -10.0 0.0 10.0 20.0 30.0 40.0
Health Care and Social Assistance
Professional, Scientific, Technical Services
Construction
Retail Trade
Education and Training
Transport, Postal and Warehousing
Mining
Accommodation and Food Services
Public Administration and Safety
Administrative and Support Services
Financial and Insurance Services
Other Services
Electricity, Gas, Water, Waste Services
Information Media, Telecommunications
Wholesale Trade
Rental, Hiring and Real Estate Services
Arts and Recreation Services
Agriculture, Forestry, Fishing
Manufacturing
Health Care and Social Assistance will dominate employment growth in the five years to 2016-17 in South East Queensland, increasing by 37 200. In fact employment growth in this region is generally expected to reflect the broader national trends, with Professional, Scientific and Technical Services; Construction; and Education and Training, all projected to make substantial contributions. Manufacturing, like in most regions in Australia, is projected to decline.
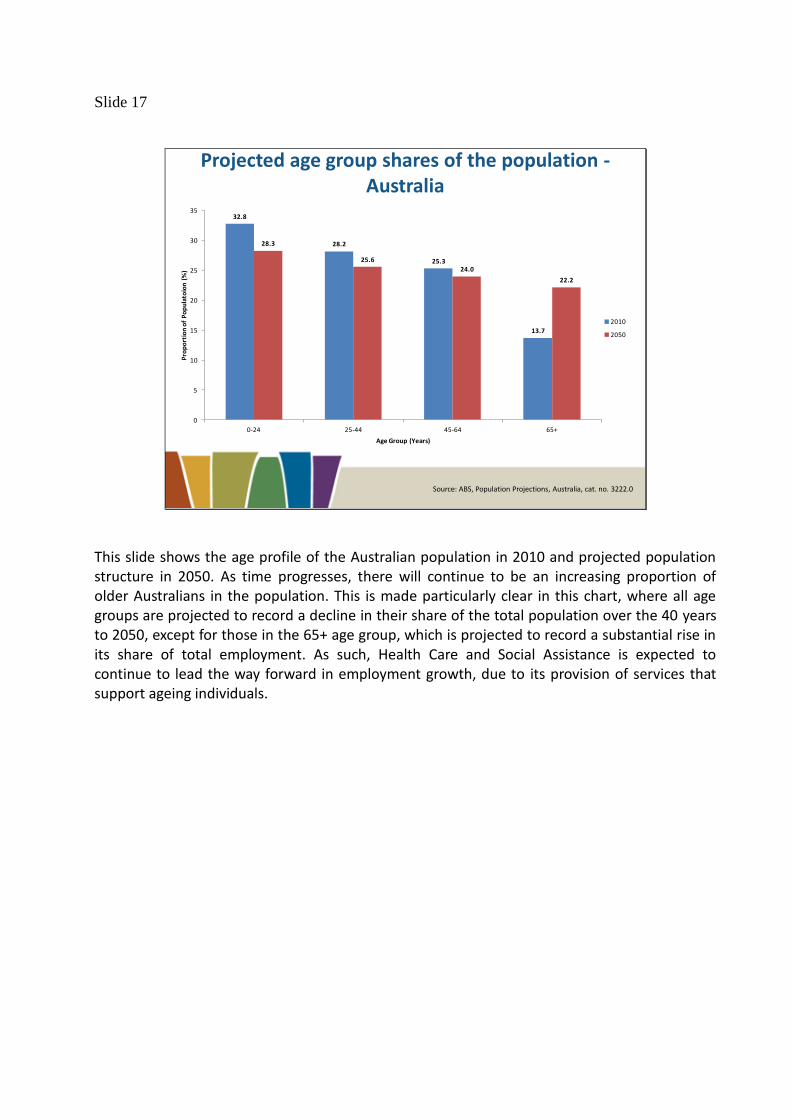
Slide 17
Projected age group shares of the population -Australia
Source: ABS, Population Projections, Australia, cat. no. 3222.0
32.8
28.2
25.3
13.7
28.3
25.6
24.0
22.2
0
5
10
15
20
25
30
35
0-24 25-44 45-64 65+
Pro
po
rtio
n o
f P
op
ula
toio
n (
%)
Age Group (Years)
2010
2050
This slide shows the age profile of the Australian population in 2010 and projected population structure in 2050. As time progresses, there will continue to be an increasing proportion of older Australians in the population. This is made particularly clear in this chart, where all age groups are projected to record a decline in their share of the total population over the 40 years to 2050, except for those in the 65+ age group, which is projected to record a substantial rise in its share of total employment. As such, Health Care and Social Assistance is expected to continue to lead the way forward in employment growth, due to its provision of services that support ageing individuals.

Slide 18
Conclusion• Health Care and Social Assistance is Australia’s largest employing
industry, having recorded the largest increase in employment of anyindustry over the last 10 years
• The industry has an older age profile, and is highly educated andhighly skilled
• There are currently skill shortages and recruitment difficulties in theindustry
• The industry is projected to continue to grow strongly into thefuture, in line with Australia’s ageing population
• Training and education is essential, in light of the ageing workforceand skill requirements, to ensure that increased demands in theindustry can be met in the future