Slide 1 Auckland District Health Board Emergency Department performance summary January to June 2011...
18
slide 1 Auckland District Health Board Emergency Department performance summary January to June 2011 Prepared by Tim Parke, Margaret Dotchin, John McTaggart and Tim Denison 10 July 2011
-
Upload
lucas-cole -
Category
Documents
-
view
213 -
download
0
Transcript of Slide 1 Auckland District Health Board Emergency Department performance summary January to June 2011...

slide 1
Auckland District Health BoardEmergency Department performance summaryJanuary to June 2011
Prepared by Tim Parke, Margaret Dotchin, John McTaggart and Tim Denison10 July 2011

slide 2
Jan
Feb
Mar
Apr
May Jun Jul
Aug
Sep
Oct
Nov
Dec
Jan
Feb
Mar
Apr
May Jun Jul
Aug
Sep
Oct
Nov
Dec
Jan
Feb
Mar
Apr
May Jun Jul
Aug
Sep
Oct
Nov
Dec
Jan
Feb
Mar
Apr
May Jun
35%
45%
55%
65%
75%
85%
95%
Overall - AED & CED Combined Performance
% < 6 Hours Overall % < 6 Hours ED Discharge % < 6 Hours Admitted to WardBaseline % < 6 Hour Overall Baseline % < 6 Hour ED Disch Baseline % < 6 Hour Admit to WardGoal
% <
6 H
our E
mer
genc
y De
part
men
t Sta
y
2008 2009 2010 2011
Overall Performance to 6 hour goal - 2008 to 2011
In June 2011, 95% of patients
had an Emergency
Department stay of less than 6
hours

slide 3
Jan MarMay Jul
Sep
Nov Jan MarMay Jul
Sep
Nov Jan MarMay Jul
Sep
Nov Jan MarMay
35%
45%
55%
65%
75%
85%
95%
AED 6-Hour Performance
% < 6 Hours AED All % < 6 Hours ED Discharge % < 6 Hour Admit to Ward Baseline % < 6 Hour All AED Baseline % < 6 Hour AED Disch Baseline % < 6 Hour Admit to WardGoal
% <
6 H
our E
mer
genc
y De
part
men
t Sta
y
2008 2009 2010 2011
For the month of June 2011 AED
reached the 95% goal
Adult Performance to 6 hour goal - 2008 to 2011

slide 4
Jan
Feb
Mar
Apr
May Jun Jul
Aug
Sep
Oct
Nov
Dec
Jan
Feb
Mar
Apr
May Jun Jul
Aug
Sep
Oct
Nov
Dec
Jan
Feb
Mar
Apr
May Jun Jul
Aug
Sep
Oct
Nov
Dec
Jan
Feb
Mar
Apr
May Jun
35%
45%
55%
65%
75%
85%
95%
Starship 6-Hour Performance
% < 6 Hours CED All % < 6 Hours CED Disch % < 6 Hours Admit to Ward Baseline % < 6 Hour All CED Baseline % < 6 Hour CED Disch Baseline % < 6 Hour Admit to WardGoal
% <
6 H
our E
mer
genc
y De
part
men
t Sta
y
2008 2009 2010 2011
For Starship, March 2011 was
the best ever performance
over 95%
Starship Performance to 6 hour goal - 2008 to 2011

slide 5
200801
200803
200805
200807
200809
200811
200901
200903
200905
200907
200909
200911
201001
201003
201005
201007
201009
201011
201101
201103
2011050.00
1.00
2.00
3.00
4.00
5.00
6.00
7.00
8.00
9.00
0
500
1000
1500
2000
2500
3000
3500
4000
4500
5000
Adult (AED) Average Monthly LOSEvents (excl DNW) Average of EDLOS Hrs
Year - Month (YYYYMM)
Hou
rs -
Mon
thly
Ave
rage
ED
LO
S
Mon
thly
Pre
sent
ation
s (Ex
cludi
ng D
NW
)
Adult ED Presentations and Average Length of Stay
Jan-June 2011 saw a 10.5% increase in
presentations compared to
Jan-June 2010
ED Length of Stay reduces by 44% in 2 years despite record presentations.
June 2011 average LOS 3.6
hours, compared to
June 2009, 6.4 hours

slide 6
Overall performance – Jan to June 2011
Overall AED CED
QuarterOct – Dec 2010 78% 73% 85%
QuarterJan-March 2011 88% 86% 91%
Quarter Apr – Jun 2011 95% 95% 95%
A significantly improved performance from 2010, especially in the April to June quarter

slide 7
An upward trend for both quarters, lifting to 95% in April to June.
Five occurrences of 100% performance
Adult and Starship – Jan to June 2011
Adult Emergency Department Children’s Emergency Department
An significant upward trend during the period, lifting to 95% in April to June. Six occurrences of 100% performance

slide 8
Activities completed - January to June 2011
Adult activities completed – January to June 2011 The Medical Bed Manager has been based on Level two till 7 pm. This has reduced the 6 hr breeches in the late afternoon when the department is very
busy. Implemented ED discharge nurse on weekend. Information of the 6 hrs target has been clearly communicated to all ED and APU staff to reiterate that it was the individual staff member’s responsibility
to achieve the 6 hr target for the patients in their care. The emails were put in all communication books in both departments. This was just part of a series of staff communication to increase staff focus and improve compliance.
6 Hr target compliance board were set up in ED to show daily 6 hr compliance. These have been of great interest to the staff. The establishment of an ED Short Stay Unit. Room 8 has been designated as the ED short stay unit. The patients in ED who are designated as short stay
(SS) will, as always, meet the short stay criteria which are on the ED website. Once a patient is designated SS they move into this room and no acute patients will now be admitted to room 8. The nurse in room 8 will be the Short Stay nurse. This room will remain open at all times.
Engagement with SMO’s, RMO’s and nurses on a one on one basis by Clinical Director, Nurse Advisor or Level 2 Clinical Leader . Use of the Transition Lounge for discharged ED patients who are waiting on private transportation to take them home, and improved measurement for
this patient group with the use of a ‘Ready to go’ intent in CMS Specific communications from the ED Clinical Director to ED SMOs regarding the 6 hour target, with the primary message being that the duty SMO must
ensure that within the limits of safe practice, no patients breech the 6 hour target unnecessarily. This means ensuring; a) all appropriate SS patients are quickly identified and designated b) suitable patients are moved rapidly to APU after specialty review c) regular review of all ED patients to ensure care is progressing d) allocation of ED patients waiting to be seen to staff where necessary e) rigorous application of the ED house rules on referral f) follow up with IP specialties who have not reviewed a referral within 1hr
A 6 hour compliance report sent to the ED senior team daily to allow follow up on days where the compliance has been below benchmark to enable the team look retrospectively for remediable factors
A change to the electronic ED whiteboard so that the purple colour which designates the patient in ED for 5 hrs has been changed to 4 hrs. This provides more warning that the patients need to have a plan to get out of ED before the 6 hr timeframe is crossed. Implementation date March 4

slide 9
Adult activities completed – January to June 2011 Hands on support of AED Flow Charge Nurse to reduce ‘roadblocks’ to transfer of patients to inpatient wards All Nurse Advisors are working with Charge Nurses to provide an action plan to improve ward responses to transfer of patients, handovers and discharge
management A “Never say No” campaign is underway to focus on timely handover of patient admissions and transfers to ward in General Medicine, Orthopaedics and
General Surgery Services. Handover hotline introduced for ward nursing staff. Metrics identified and published for wards on their time taken to transfer patients to the ward, with the goal of 100% of patients transferred to the ward
within 30 minutes from when the bed is available Documentation and rationale to be given by Duty Managers for any patients awaiting bed allocation in AED as of 0600 hours every morning to identify
barriers to patients getting inpatient beds overnight A daily action plan response tool has been introduced for Nurse Advisors to standardise daily checks and build communication throughout the day Instructions that should the Duty Manager have any issues with out of hours staff in terms of refusal to flex where able, closure of beds or keeping beds
for patients that it should be escalated for follow up with the Nurse Advisors and Nurse Director Duty Managers and Bed Managers continue to review in full regularly the Bed Status at a Glance board for bed requests, particularly when on rounds at
night where we know we have some improvement work to be done on times from bed request to acknowledgement. Charge Nurses to identify patients that could be outlied to enable smoother out of hours transfer of patients to release acute bed for higher acuity AED
patient in specialty wards. Communication to Charge Nurses via Nurse Advisors regarding proactive “pulling” of patients to wards once bed allocated The Orderly supervisor has made signs to remind all Orderlies to tell the clerks to take the patient off the board as soon as they take the patient out of
ED Increase engagement of Clinical Directors by CMO and Medical Director through communication and ‘call to action’ Support of General Medicine through diversion of patients to medical subspecialties Attendance of Medical Director and CMO at handover meetings Support of MRT resource to Level 8 operating rooms to improve access to image intensifiers. Proactive Management from Nurse Advisors and Service Managers with more involvement from them in Acute patient flow either at ward level or
indeed assisting with patient transfer to wards from AED Full time Charge Nurse (improvement specialist role) to focus on reducing delays to Gen Med discharges through hands on support and introduction of
discharge co-ordination responsibility within ward nursing team. Demand is being matched to resourcing to ensure allocation of orderlies in ED and APU to reduce transfer delays. Valuing patient time poster campaign
Activities completed - January to June 2011

slide 10
Adult activities completed – January to June 2011 Five day rapid improvement event conducted to focus on further solutions for improvement in process from decision to admit to transfer to
inpatient ward Triggers identified for elective surgery cancellation. Improved access to transit care nurse support especially after hours. Introduce APU flex beds to reduce bed block for patients requiring short inpatient admission. Review winter plan to ensure winter bed model meets expected demand. Service Reviews underway across General Surgery and General Medicine in order to increase specialty resource 7 days per week Four Nurse Specialists were employed as per the business case. These roles are in addition to the 2 Nurse Practitioners and 1 Clinical Nurse
Specialist already employed. New roster will be introduced which will give NS/NP cover from 8 am to midnight 7 days a week. Continue work on weekend resourcing to meet variable demand.
Activities completed - January to June 2011

slide 11
Starship activities completed – January to June 2011 quarter The Staged Starship Capacity Plan has been updated to improve response times when hospital capacity is reached Ward 25AB on a Tuesday from 1500hrs until Friday 1500hrs will flex up by 4 beds. Daily morning meetings to review the daily exceptions report showing all patients that exceed 6 hours –commenced mid-February. The purpose is
to identify events that prevented children leaving CED within the 6 hours – all managers engaged with finding solutions to road blocks. Plan to trial the use of a cell phone for the wards afterhours shift coordinator, to facilitate quicker response times Increased Senior Nursing in CED by 2 FTE . The role of these nurses is to improve flow through CED - aim is for these nurses to complete training
programme to become CED Nurse Practitioners Improved clinical data collect captured via electronic white board. Streamlining information relevant to CED and patient flow through department –
Electronic white board replaced the traditional manual white board. This has reduced duplication and ensure data is up to date CNA allocated to Starship to focus on ward issues surround timely transfer of children from CED Introduction of the push/pull model for transferring children to the wards – nurses communicate between them as to who is best situated to ensure
timely transfer of patient Charge Nurses have been alerted of the ongoing urgency to meet the 6 hour target. Specific examples of perceived behaviours of nurses in the
inpatient wards that is impeding patient flow have been discussed Introduced use of Estimated Discharge Dates in Wards 24A and 25A/B – 90%+ have EDD – rolling out now to other wards Ward 24B project to reduce bed turnaround showed reduction in time from 120 minutes to 90 minutes – rolling out now to other wards Focus on CHIPS data quality and transitioning to Electronic Whiteboards for inpatient wards –enabling ward staff to view time accurate data from
CED, aid prediction of transfer of patients and for CED to view ward activity in relation to bed availability – aim for majority of wards to have electronic white boards by June 2011 and appropriate data field specific to their area
Improved measurement and identification of clinical short stay children in CED Wider communication of the weekly dashboard reports with key performance metrics used to monitor changes implemented to reduce roadblocks
to patient flow Review of process for admitting patients from CED to wards – focus group including registrars to occur to identify specific issues Improve measurement accuracy through better communication with Clinicians – both verbal and electronic Focus on reducing the 1 hour transfer from CED to Ward time Focus on the timeliness and process for preparing/booking children for inpatient stay Effective daily “ready to go’ meeting – with emphasis on predicting discharges and pre-planning flow of elective and acute patients into inpatient
wards. To plan in advance actions to take to prevent bed block Improve process efficiency and visibility of patients and bed status through:
• Introduction of electronic whiteboards in all inpatient settings• Improve CHIPS data accuracy • Improved visibility and predictability of Electives
Activities completed - January to June 2011

slide 12
Appendix 1Additional information

slide 13
May
-11
Mar
-11
Jan-
11N
ov-1
0Se
p-10
Jul-10
May
-10
Mar
-10
Jan-
10N
ov-0
9Se
p-09
Jul-09
May
-09
Mar
-09
Jan-
09
9876543210
Hours
__X=1.656
2009 2010 2011
1 Hour Goal1111
1
1
1
11
11
1
11
1
Avg Hours AED Bed Request to Ward Admission
Low is Good
AED Bed Request to Admission Time
A drop from 7 hours in 2009 to
move a patient to the ward from the
time of the ED bed request to just over 1 hour for the last four months to June
2011

slide 14
AED length of stay
10
5
0
10
5
0
1211109876543210
10
5
0
201101
6 hr Time (hrs)
Perc
ent
201102
201103
Panel variable: AdmitYrMonth
AED Length of Stay - Histogram of 6 hr Time (hrs)
There has been a significant drop in March in the number of ‘long stayers’ in AED – very few patients now spend longer than 8 hours in AED.
slide 15
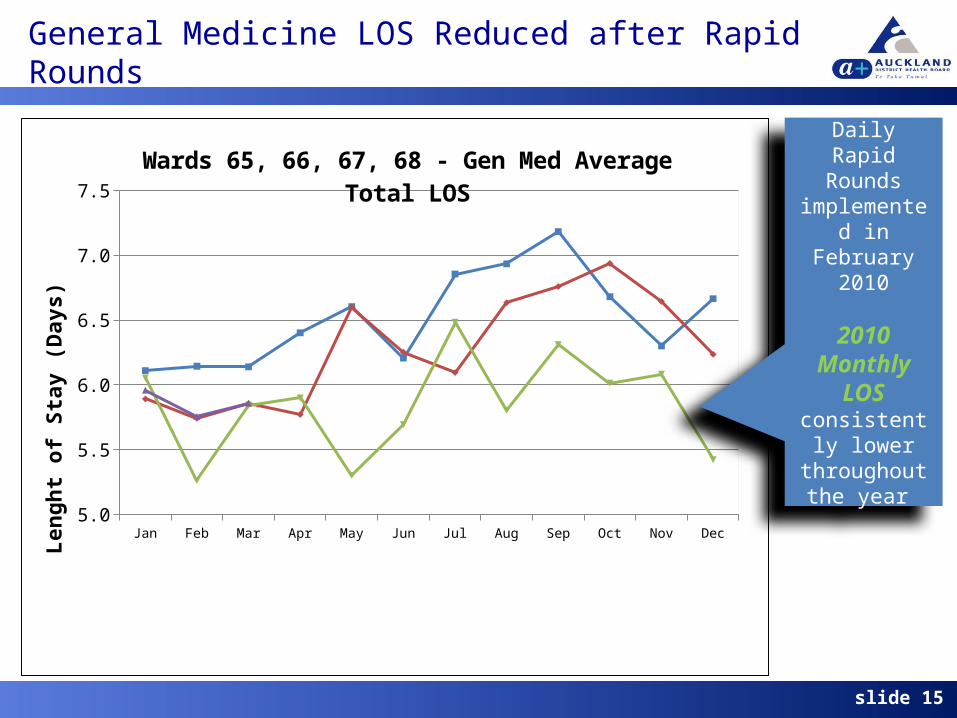
General Medicine LOS Reduced after Rapid Rounds
Jan Feb Mar Apr May Jun Jul Aug Sep Oct Nov Dec
2008
6.10989583333333
6.14348169191
92
6.13954238731656
6.40141325536064
6.60389229910714
6.20690349842769
6.85507565492322
6.93385496671787
7.18301051902
24
6.68031212664277
6.30062483426146
6.66506123058539
2009
5.89117699430199
5.74169180492712
5.85692447148476
5.77100398756423
6.59933958178668
6.25172554347826
6.09530267295598
6.63389843557526
6.75851315789474
6.93675294612795
6.64358974358974
6.23559135166094
2010
6.05373757904243
5.26247086247086
5.84358119235837
5.89944299768518
5.30119834010
84
5.69315986511201
6.48285530352838
5.80405288763339
6.31103475103734
6.01326246519
87
6.08279088576528
5.42218450894712
2011
5.95906411498709
5.75664393373195
5.85741747181965
NaN NaN NaN NaN NaN NaN NaN NaN NaN
5.3
5.8
6.3
6.8
7.3
Wards 65, 66, 67, 68 - Gen Med Average Total LOS
Len
gh
t o
f S
tay
(D
ay
s)
Daily Rapid Rounds
implemented in February 2010
2010 Monthly LOS
consistently lower
throughout the year

slide 16
Orthopaedics LOS Reduced by 1 day on Wards
AfterBefore
14
12
10
8
6
4
2
0
Before or After Rapid Rounds Implementation
LOS D
ays 7.92041
9.07548
5.1465
6.1972
Orthopaedics Total Length of Stay Discharges from Wards 75 & 77Before = 1/1/08 to 14/06/10; After = 14/06/10 to 08/03/11 Daily Rapid
Rounds implemented in mid June 2010
Average LOSBefore: 9.07After: 7.92
Median LOSBefore: 6.19After: 5.14
slide 17
03/0
1/20
1110
/01/
2011
17/0
1/20
1124
/01/
2011
31/0
1/20
1107
/02/
2011
14/0
2/20
1121
/02/
2011
28/0
2/20
1107
/03/
2011
14/0
3/20
1121
/03/
2011
28/0
3/20
1104
/04/
2011
11/0
4/20
1118
/04/
2011
25/0
4/20
1102
/05/
2011
09/0
5/20
1116
/05/
2011
23/0
5/20
1130
/05/
2011
06/0
6/20
1113
/06/
2011
20/0
6/20
1127
/06/
2011
2.53
3.54
4.55
5.56
6.5
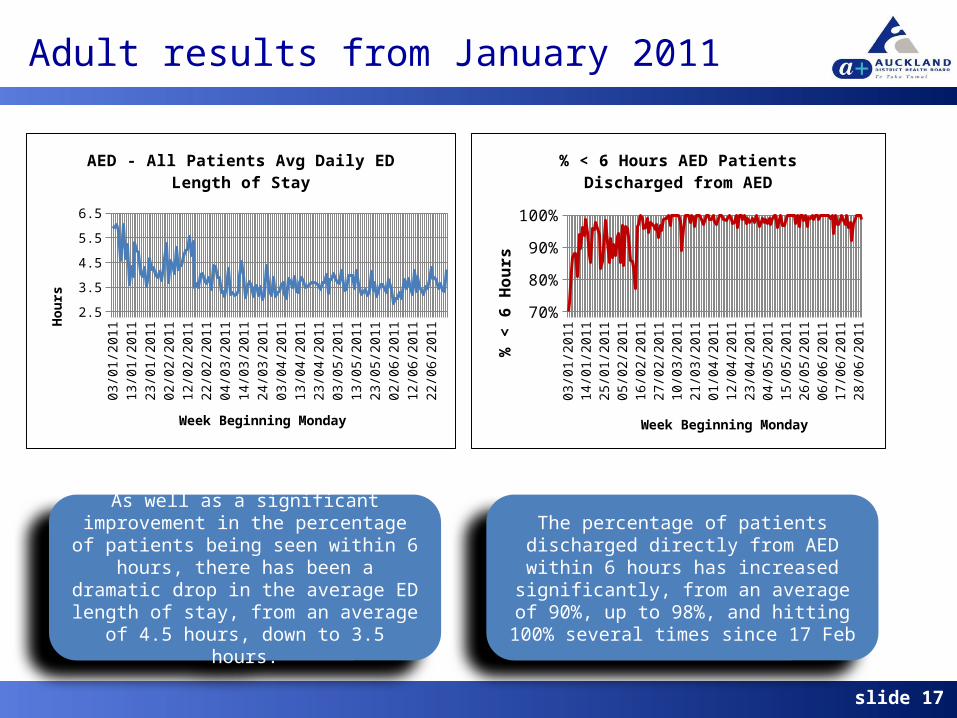
AED - All Patients Avg Daily ED Length of Stay
Week Beginning Monday
Hour
s
03/0
1/20
1111
/01/
2011
19/0
1/20
1127
/01/
2011
04/0
2/20
1112
/02/
2011
20/0
2/20
1128
/02/
2011
08/0
3/20
1116
/03/
2011
24/0
3/20
1101
/04/
2011
09/0
4/20
1117
/04/
2011
25/0
4/20
1103
/05/
2011
11/0
5/20
1119
/05/
2011
27/0
5/20
1104
/06/
2011
12/0
6/20
1120
/06/
2011
28/0
6/20
11
70%
75%
80%
85%
90%
95%
100%
% < 6 Hours AED Patients Discharged from AED
Week Beginning Monday
% <
6 H
ours
As well as a significant improvement in the percentage of patients being seen within 6
hours, there has been a dramatic drop in the average ED length of stay, from an average of
4.5 hours, down to 3.5 hours.
The percentage of patients discharged directly from AED within 6 hours has increased
significantly, from an average of 90%, up to 98%, and hitting 100% several times since 17
Feb
Adult results from January 2011

slide 18
01/0
1/20
1108
/01/
2011
15/0
1/20
1122
/01/
2011
29/0
1/20
1105
/02/
2011
12/0
2/20
1119
/02/
2011
26/0
2/20
1105
/03/
2011
12/0
3/20
1119
/03/
2011
26/0
3/20
1102
/04/
2011
09/0
4/20
1116
/04/
2011
23/0
4/20
1130
/04/
2011
07/0
5/20
1114
/05/
2011
21/0
5/20
1128
/05/
2011
04/0
6/20
1111
/06/
2011
18/0
6/20
1125
/06/
2011
0
1
2
3
4
5
6
7
8
9
Referral to Inpatient Specialty to time patient leaves ED (admitted, discharged, transferred)
Hou
rs
There has been a significant drop in the time taken for the Inpatient Specialty to see the
patient and then for the movement out of ED, from an average of 3 hours down to 2 hours
There has been a sustained improvement in performance since mid January, moving from an average of 4 hours from the time of Bed
Request to Ward transfer, to an average of just over 1 hour since mid- February
Adult Time to ward
03/0
1/20
1110
/01/
2011
17/0
1/20
1124
/01/
2011
31/0
1/20
1107
/02/
2011
14/0
2/20
1121
/02/
2011
28/0
2/20
1107
/03/
2011
14/0
3/20
1121
/03/
2011
28/0
3/20
1104
/04/
2011
11/0
4/20
1118
/04/
2011
25/0
4/20
1102
/05/
2011
09/0
5/20
1116
/05/
2011
23/0
5/20
1130
/05/
2011
06/0
6/20
1113
/06/
2011
20/0
6/20
1127
/06/
2011
0
1
2
3
4
5
6
7
Hours from Bed Request to Ward Transfer
Week Beginning Monday
Hou
rs