Slide 0. slide 1 Business Cycles Business Cycles – Business cycles are 2-year to 5-year...
18
slide 1
-
Upload
archibald-harvey -
Category
Documents
-
view
213 -
download
0
Transcript of Slide 0. slide 1 Business Cycles Business Cycles – Business cycles are 2-year to 5-year...

slide 1

slide 2
Business CyclesBusiness Cycles
Business Cycles
– Business cycles are 2-year to 5-year fluctuations around trends in real GDP and other related variables
– A recession is a large fall in the growth of real GDP and related variables
•A depression is an especially large recession

slide 3
Business CyclesBusiness Cycles

slide 4
Real GDP Growth in the United StatesReal GDP Growth in the United States
-4
-2
0
2
4
6
8
10
1960 1965 1970 1975 1980 1985 1990 1995 2000
Percent change from 4 quarters
earlierAverage growth
rate = 3.5%

slide 5
Recessions in the U.S. since World War IIRecessions in the U.S. since World War II
Year and quarter of peak in RGDP
Number of quarters until trough in RGDP
Change in RGDP, peak to trough (%)
1948:4
1953:2
1957:3
1960:1
1970:3
1973:4
1980:1
1981:3
1990:2
2
3
2
3
1
5
2
4
3
-1.7
-2.7
-3.7
-1.6
-1.1
-3.4
-2.2
-2.9
-1.5No simple regular or cyclical pattern: output changes very considerably in size and spacing

slide 6
Behavior of the Components of Behavior of the Components of Output in RecessionsOutput in Recessions
Component of GDP
Average Share in GDP (%)
Average Share in fall in GDP in recessions relative to normal growth (%)
Consumption Durables Nondurables Services
Investment Residential Business Fixed Inventories
Net Export
Gov’t Purchases
8.425.829.5
4.710.70.7
-0.4
20.6
15.611.29.1
20.911.740.6
-12.3
3.3
Fluctuations are distributed very unevenly over the components of output
slide 7
Cyclical Behavior of Cyclical Behavior of Key Macroeconomic VariablesKey Macroeconomic Variables
Procyclical variable
– An economic variable that moves in the “same” direction as aggregate economic activity
industrial production, consumption, investment, employment, real wage, inflation, stock prices
Countercyclical variable
– An economic variable that moves in the “opposite” direction as aggregate economic activity
unemployment

slide 8
Cyclical behavior of the index of Cyclical behavior of the index of industrial productionindustrial production

slide 9
Cyclical behavior of consumption Cyclical behavior of consumption and investmentand investment

slide 10
Cyclical behavior of civilian Cyclical behavior of civilian employmentemployment

slide 11
Cyclical behavior of the Cyclical behavior of the unemployment rateunemployment rate

slide 12
Cyclical behavior of average labor Cyclical behavior of average labor productivity and the real wageproductivity and the real wage

slide 13
Supply shocksSupply shocks
A supply shock alters production costs, affects the prices that firms charge. (also called price shocks)
Examples of adverse supply shocks: Bad weather reduces crop yields, pushing up
food prices. Workers unionize, negotiate wage increases. New environmental regulations require firms
to reduce emissions. Firms charge higher prices to help cover the costs of compliance.
(Favorable supply shocks lower costs and prices.)

slide 14
CASE STUDY: CASE STUDY: The 1970s oil shocksThe 1970s oil shocks
Early 1970s: OPEC coordinates a reduction in the supply of oil.
Oil prices rose11% in 1973 68% in 1974 16% in 1975
Such sharp oil price increases are supply shocks because they significantly impact production costs and prices.
slide 15
1PSRAS1
Y
P
AD
LRAS
YY2
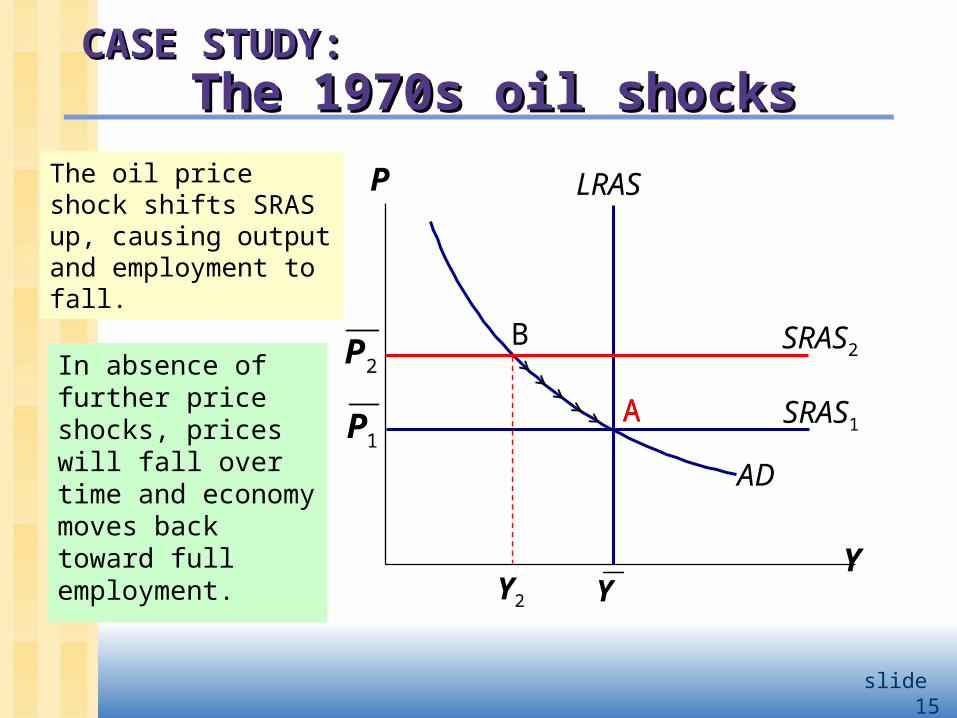
The oil price shock shifts SRAS up, causing output and employment to fall.
A
BIn absence of further price shocks, prices will fall over time and economy moves back toward full employment.
2PSRAS2
CASE STUDY: CASE STUDY: The 1970s oil shocksThe 1970s oil shocks
A

slide 16
CASE STUDY: CASE STUDY: The 1970s oil shocksThe 1970s oil shocks
Predicted effects of the oil price shock:• inflation • output • unemployment
…and then a gradual recovery. 0%
10%
20%
30%
40%
50%
60%
70%
1973 1974 1975 1976 1977
4%
6%
8%
10%
12%
Change in oil prices (left scale)
Inflation rate-CPI (right scale)
Unemployment rate (right scale)

slide 17
CASE STUDY: CASE STUDY: The 1970s oil shocksThe 1970s oil shocks
Late 1970s:
As economy was recovering, oil prices shot up again, causing another huge supply shock!!! 0%
10%
20%
30%
40%
50%
60%
1977 1978 1979 1980 1981
4%
6%
8%
10%
12%
14%
Change in oil prices (left scale)
Inflation rate-CPI (right scale)
Unemployment rate (right scale)

slide 18
CASE STUDY: CASE STUDY: The 1980s oil shocksThe 1980s oil shocks
1980s: A favorable supply shock--a significant fall in oil prices.
As the model would predict, inflation and unemployment fell:
-50%
-40%
-30%
-20%
-10%
0%
10%
20%
30%
40%
1982 1983 1984 1985 1986 1987
0%
2%
4%
6%
8%
10%
Change in oil prices (left scale)
Inflation rate-CPI (right scale)
Unemployment rate (right scale)