Slicing The Knowledge Based Economy in Brazil, China and ...€¦ · SAP 124 GER Mahindra BT 113 JV...
27
Globelics Academy June 1, 2004 Slicing The Knowledge Based Economy in Brazil, China and India: A Tale of 3 Software Industries FRANCISCO VELOSO (Carnegie Mellon University & UCP) ANTONIO J BOTELHO (Center for New Economy and Technology, PUC-RIO) TED TSCHANG (Singapore Management University and ADBi) ALICE AMSDEN (Massachusetts Institute of Technology) GIANCARLO STEFANUTO (SOFTEX) – in Brazil Chapter
Transcript of Slicing The Knowledge Based Economy in Brazil, China and ...€¦ · SAP 124 GER Mahindra BT 113 JV...
Globelics Academy June 1, 2004
Slicing The Knowledge Based Economy in Brazil, China and India:
A Tale of 3 Software Industries
FRANCISCO VELOSO (Carnegie Mellon University & UCP)ANTONIO J BOTELHO(Center for New Economy and Technology, PUC-RIO)TED TSCHANG(Singapore Management University and ADBi)ALICE AMSDEN (Massachusetts Institute of Technology)GIANCARLO STEFANUTO(SOFTEX) – in Brazil Chapter

The International Software Market
How to ride the global software & services market?– Value for 2001: USD 300 Billion– Value for 2008: USD 900 Billion (estimate)
Packaged software market– Sales of $ 196 Billion in 2001– Traded share of sales is 15%
Software related services – Market smaller than products– Traded share is 35%
Offshore / outsourcing (BPO) exhibits strongest growth– in the US, 25% per year– In Europe, it will double between 2002 and 2005
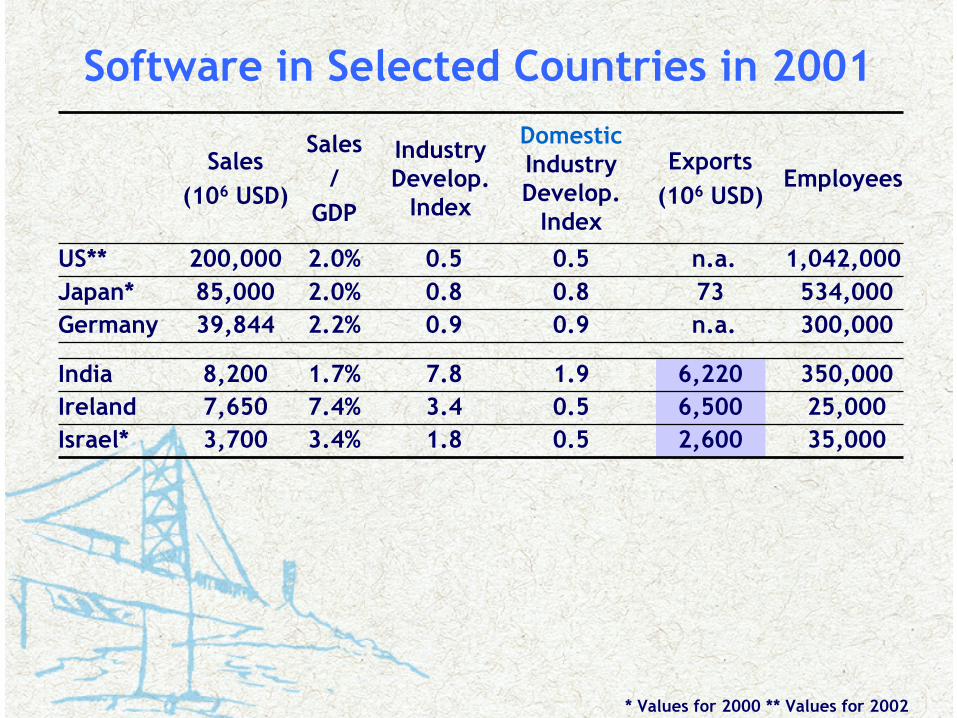
Software in Selected Countries in 2001
35,000 2,6000.51.8 3.4%3,700Israel*25,000 6,5000.53.4 7.4%7,650Ireland 350,000 6,2201.97.8 1.7%8,200India
300,000 n.a. 0.90.9 2.2%39,844Germany534,000 730.80.8 2.0%85,000Japan*
1,042,000 n.a. 0.50.5 2.0%200,000US**
EmployeesExports
(106 USD)
DomesticIndustry Develop.
Index
Industry Develop.
Index
Sales/
GDP
Sales(106 USD)
* Values for 2000 ** Values for 2002

Single Track?
Emerging Prescriptions from the 3 I’s?
Nurture a Strong Human Capital Base
Foster Entrepreneurship
Develop a Large Export Base
Establish Strong Anchor to the US Market– Export Base– Multinational Investment
Leverage the US Links– Diaspora– English– Culture

Size and Growth of Software
8,2007,4007,700Sales in 2001
3906951,100Sales in 1992
40%30%24%Annual Growth Rate
IndiaChinaBrazilMillion of USD*
*Conversions of Local Currency to USDEvolution of values in USD highly influenced by exchange rate fluctuations during decade

Software in Selected Countries in 2001
35,000 2,6000.51.8 3.4%3,700Israel*
25,000 6,5000.53.4 7.4%7,650Ireland
n.a.35 1.11.1 1.8%7,694Korea158,000 1002.22.2 1.5%7,700Brazil
n.a.n.a. 0.20.2 <0.2%<1,000Mexico15,000350.40.4 0.5%1,340Argentina*
n.a.349 0.60.7 1.2%3,801Taiwan186,000 4001.71.8 0.6%7,400China
350,000 6,2201.97.8 1.7%8,200India
300,000 n.a. 0.90.9 2.2%39,844Germany534,000 730.80.8 2.0%85,000Japan*
1,042,000 n.a. 0.50.5 2.0%200,000US**
EmployeesExports
(106 USD)
DomesticIndustry Develop.
Index
Industry Develop.
Index
Sales/
GDP
Sales(106 USD)
* Values for 2000 ** Values for 2002

Preconditions:Education, Research and Technology
2nd1st5th3rdWorld Rank (2001)Population
170159292700/ 106 pop (1997)NS&Eng Grad
51644585/ 1,000 pop (2001)PCs
3.9%5.7%8.3%7.9%% GDP (2001)ICT Expenses
6932101180/ 106 pop (2000)IT Graduates
71,00041,00017,84751,236Total / Year (2000)IT Graduates
176,000203,23850,233199,057Total / Year (1997)NS&Eng Grad
IndiaChinaBrazilUSUnits (year)Variable
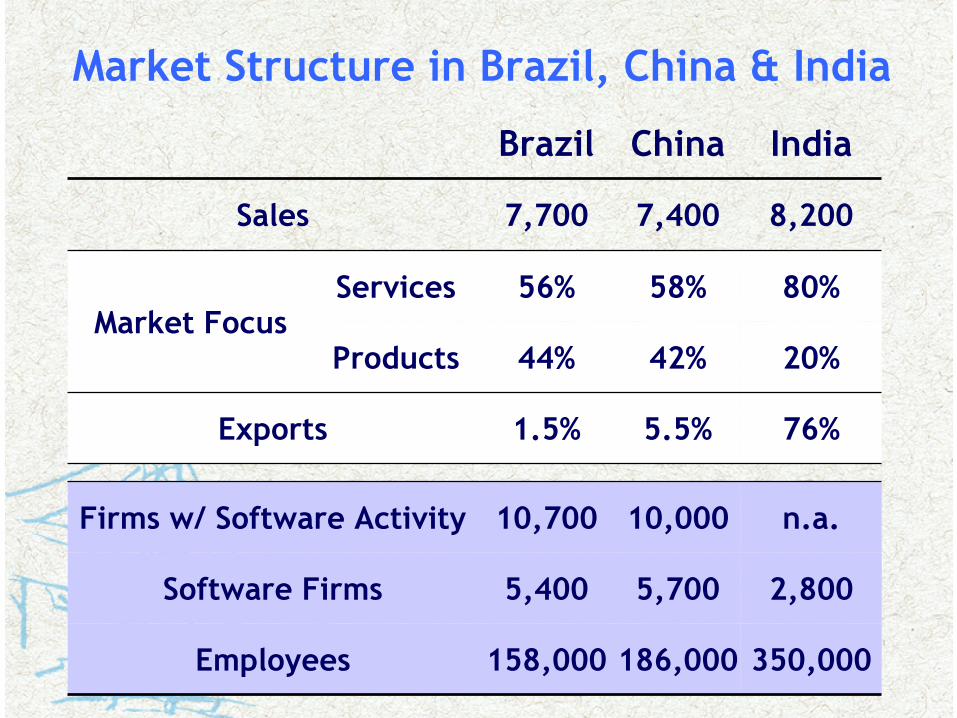
Market Structure in Brazil, China & India
8,2007,4007,700Sales
350,000186,000158,000Employees
2,8005,7005,400Software Firms
n.a.10,00010,700Firms w/ Software Activity
76%5.5%1.5%Exports
20%42%44%ProductsMarket Focus
80%58%56%Services
IndiaChinaBrazil

Leading Firms in the 3 Nations CHINAINDIABRAZIL
US26InformixIN64MasconBR52ProcedaUS30SybaseIN66MphasisBR57CITSUS58OracleIN82I-Flex BR62DBAUS65MicrosoftIN84NIITBR64CPqDUS78IBMIN84MascotBR72MicrosigaCN93TopJV94HCL PerotUS77ConsistCN94CVICIN96PentasoftBR104PolitecCN107YianTaiJV113Mahindra BTGER124SAPCN115T.DongFangIN126SilverlineUS182OracleCN125ChangTianIN153PatniUS194AccentureCN126ChongRanIN277HCL TechBR204CPMCN134DongFangIN357SatyamUS240EDSCN175LegendIN481WiproUS260Comp. As.CN186PuTianIN535InfosysBR372SERPROCN438FounderIN813TCSUS362Microsoft
OriginSalesCompanyOriginSalesCompanyOriginSalesCompany

Understanding Role of Multinationals
Local competitors in products and services– May affect local producers – but also strengthens market
• e.g. SAP competes with local ERP Producers
– The realities…• Stronger in Brazil• Moderate in China and India
Local market as base for development in international arena– Supports local industry and is welcomed
• e.g. Siemens PBX in Brazil or TI development center in India
– The realities• Strong in India• Moderate to low in Brazil and China

India – China – Brazil Considerations
•Export Higher Level Services in Verticals
•Export Products
•Export Services•Hardware Links•Multinationals
•Business Process Outsourcing
•High Level Export Services
Opportunities
•Small Firms•International Visibility
•No Active Policy
•Domestic Market•Strong Client Sectors
•Verticals –Prod+Serv
•ProductsBrazil
•Process Capability•Small Firms•Open Market Experience
•Government Action•Strong Domestic Market
•System Integration
•ProductsChina
•Wage Pressure•Domain Knowledge•Low-End Competition
• Deep Labor Pool• English•Process Maturity• Global Links
•Low Tech Services
•ExportsIndia
BarriersDifferentiatorsFocus

Conclusions & Takeaways for 3 Nations
Large and over-developed industries– Sell USD 8 Billion in Software– Annual growth rates on the order of 30%
Preconditions for past success & bright future– Demand at home and/or abroad– Human and financial capital– Government policy - can have stifling or leveraging effects
Industry development may follow different paths– Critical to find the right development anchor!– Strong service exports for India– Vibrant domestic products/services for Brazil and China
Challenges ahead remain…– Competition between nations will become more acute– Important to leverage industry strengths – Multinationals will play increasing role– NO SET WINNERS!

Paths for China and India
CHINA: A low level but strengthening industry
Sector Linkages – Users and manufacturersExport Services – Replacing India in low levelSpillovers of multinational interest in China
NEED: Process Capabilities & International Marketing
INDIA: Tension between value and volume
Climbing service value chain & enter product marketsInvest in BPO, ITES and other Face multinational competition with domestics
NEED: Product/Domain Knowledge

What About Brazil?

The Brazilian Software Industry
0%
5%
10%
15%
20%
25%
CAGR 1991/2001
GDP (USD) IT (USD) SW (USD)*
4.1Software Services
(Outsourcing, Development, Integration and Consultancy)
3.6Software Products (Package, Custom and Embedded)
7.7Total Software (Products and Services)
Billion of USD
Sales in 2001
* 1992/2001

Indicators of Domestic Competitiveness
11%~300%Growth 1995-2000 (%)
3.8%8%R&D / Sales* (%)
1130Average Salary (103 R$/Year)
2697VA / Employee (103R$)
IndustrySoftware
*Probably Includes Substantial Costs Associated to Product Development
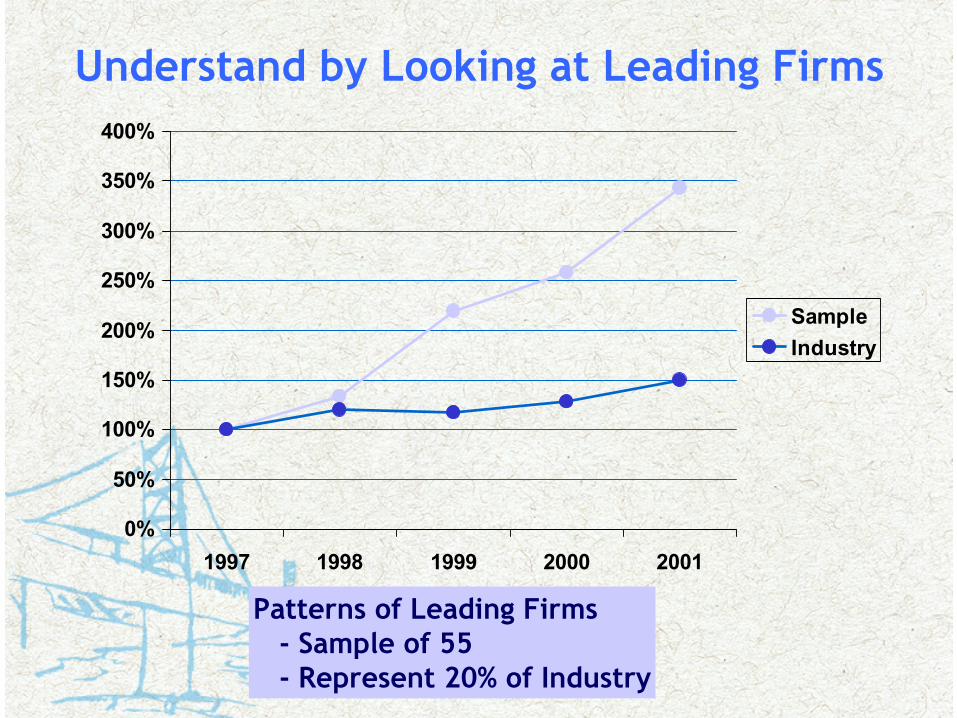
Understand by Looking at Leading Firms
0%
50%
100%
150%
200%
250%
300%
350%
400%
1997 1998 1999 2000 2001
SampleIndustry
Patterns of Leading Firms - Sample of 55- Represent 20% of Industry

Nature of the Leading Firms
14%7%Low Value Services
62%35%High Value Services
42%Services
10%20%Customizable Product
13%34%Embedded/Component
58%Products
Share of Revenue
Share of FirmsBusiness Model
Share of Firms
Main Revenue Source
Sample: 56 Firms

The Promise of the Domestic Market
The existence of Lead Sectors– Banking– Telecom– e-Government– Niche Startups
Internationalized and Competitive
Large IT investment – 30% of Brazil Total
Important Market for Software companies– Foreign, Local Large & Small-Specialized
Test bed for Innovation
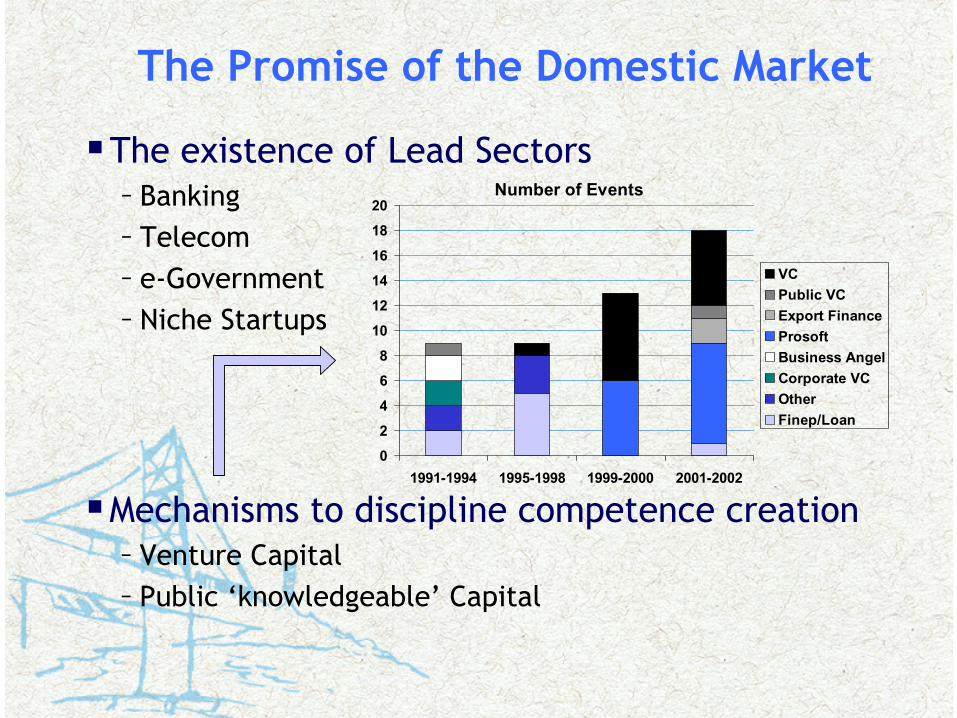
The Promise of the Domestic Market
The existence of Lead Sectors– Banking– Telecom– e-Government– Niche Startups
Mechanisms to discipline competence creation– Venture Capital– Public ‘knowledgeable’ Capital
Number of Events
0
2
4
6
8
10
12
14
16
18
20
1991-1994 1995-1998 1999-2000 2001-2002
VCPublic VCExport FinanceProsoftBusiness AngelCorporate VCOtherFinep/Loan

The Effects of External Financing
Definition of a Clear Business Model– Preparation of Detailed Business Plans– Work with Outside Consultants– Positive Impact of both Private and Public VC
Restructuring of the Management Structure– Hiring of Professional Managers– Restructuring of Management Responsibilities
An Example of a Lead Firm: Modulo– One of the top 30 Brazilian Firms– Got 2 rounds of VC financing from 1997 to 2001– From security software development to security component– Hired former CEO of American Express Latin America– Files Reports according to US GAAP rules

The Curse of the Domestic Market
Fast Growth of Domestic DemandLarge Captive Markets – Private and PublicJump to Foreign SolutionsHigh Interest Rates
Anti-Specialization Bias– Diversified activities for growing regional market – Not specialized work for whole country
Poor Institutions– Limited cooperation and no voice for the industry– Absence of a structured development policy
Small National Firms– Difficult to compete with foreign firms locally– Difficult to compete in international market

Going Abroad
Software Exports
0102030405060708090
100
1995 2000
Mill
ions
of U
SD
Export Strategy
Other6% VAR's
16%
Delegations Abroad
28% Internal/MNC Channels
50%
Software Exports
0500
10001500200025003000350040004500
Brazil1995
Brazil2000
China2000
India2000
Mill
ions
of U
SD

Lessons from Brazilian Observations
Alternative paths to the export path– Rely on Lead Client Sectors– Develop mechanisms that induce competence structuring
Recognize pitfalls created by domestic orientation– Anti-specialization bias– Limits to growth…
Important Challenges Remain– Have not succeeded the test of internationalization– Leaders in vertical segments are entering in higher level segments
more populated with large international suppliers
But outsourcing up scaling trend should benefit Brazil– Domain knowledge requirements and experience…

Development Paths for Brazil
BRAZIL: Exploring the International Market
Secure vertical Service exports (higher level)Exploit component & embedded softw. ProductsStimulate investment of software multinationalsStrengthen national positions…
NEED: Larger players – integrationNEED: Process certification or reputationNEED: International marketing/visibility – FlagNEED: Policy to influence specialization pattern

Policy Mechanisms and Tools for Brazil
Services Driven Policy– Process qualification– Use purchasing power to generate critical mass– Export benefits– Policy to support Multinational investment Brazil
Product Driven Policy– Stimulate Technology Transfer at all levels– Foster Entrepreneurial Capability– Support Development Costs– Generate export and foreign Installation benefits
Generic Policy– Continue support for ‘smart disciplining capital’– Create incentives for mergers– Continue education support – Help to generate ‘national software flag’– Reduce ‘Brazil Cost’
Thank You!
Support for this research:
Softex, IBM, Intel, Ministry of Science & Technology – BrazilADBi – India and China