Sleep Quality and Quality of Life in Adults with Type 2 Diabetes
53
Dr. Dr. S. M. Niaz Mowla S. M. Niaz Mowla ID NO ID NO : : 14-98060-3 14-98060-3 Department of Public Health Department of Public Health American International University- Bangladesh American International University- Bangladesh (AIUB) (AIUB) Banani, Dhaka- 1213 Banani, Dhaka- 1213 Sleep Quality and Quality of Life in Adults with Type 2 Sleep Quality and Quality of Life in Adults with Type 2 Diabetes Diabetes
-
Upload
dr-s-m-niaz-mowla -
Category
Healthcare
-
view
202 -
download
2
Transcript of Sleep Quality and Quality of Life in Adults with Type 2 Diabetes
Dr. Dr. S. M. Niaz MowlaS. M. Niaz MowlaID NOID NO: : 14-98060-314-98060-3
Department of Public HealthDepartment of Public HealthAmerican International University- Bangladesh (AIUB)American International University- Bangladesh (AIUB)
Banani, Dhaka- 1213Banani, Dhaka- 1213
Sleep Quality and Quality of Life in Adults with Sleep Quality and Quality of Life in Adults with Type 2 DiabetesType 2 Diabetes
2014 2035
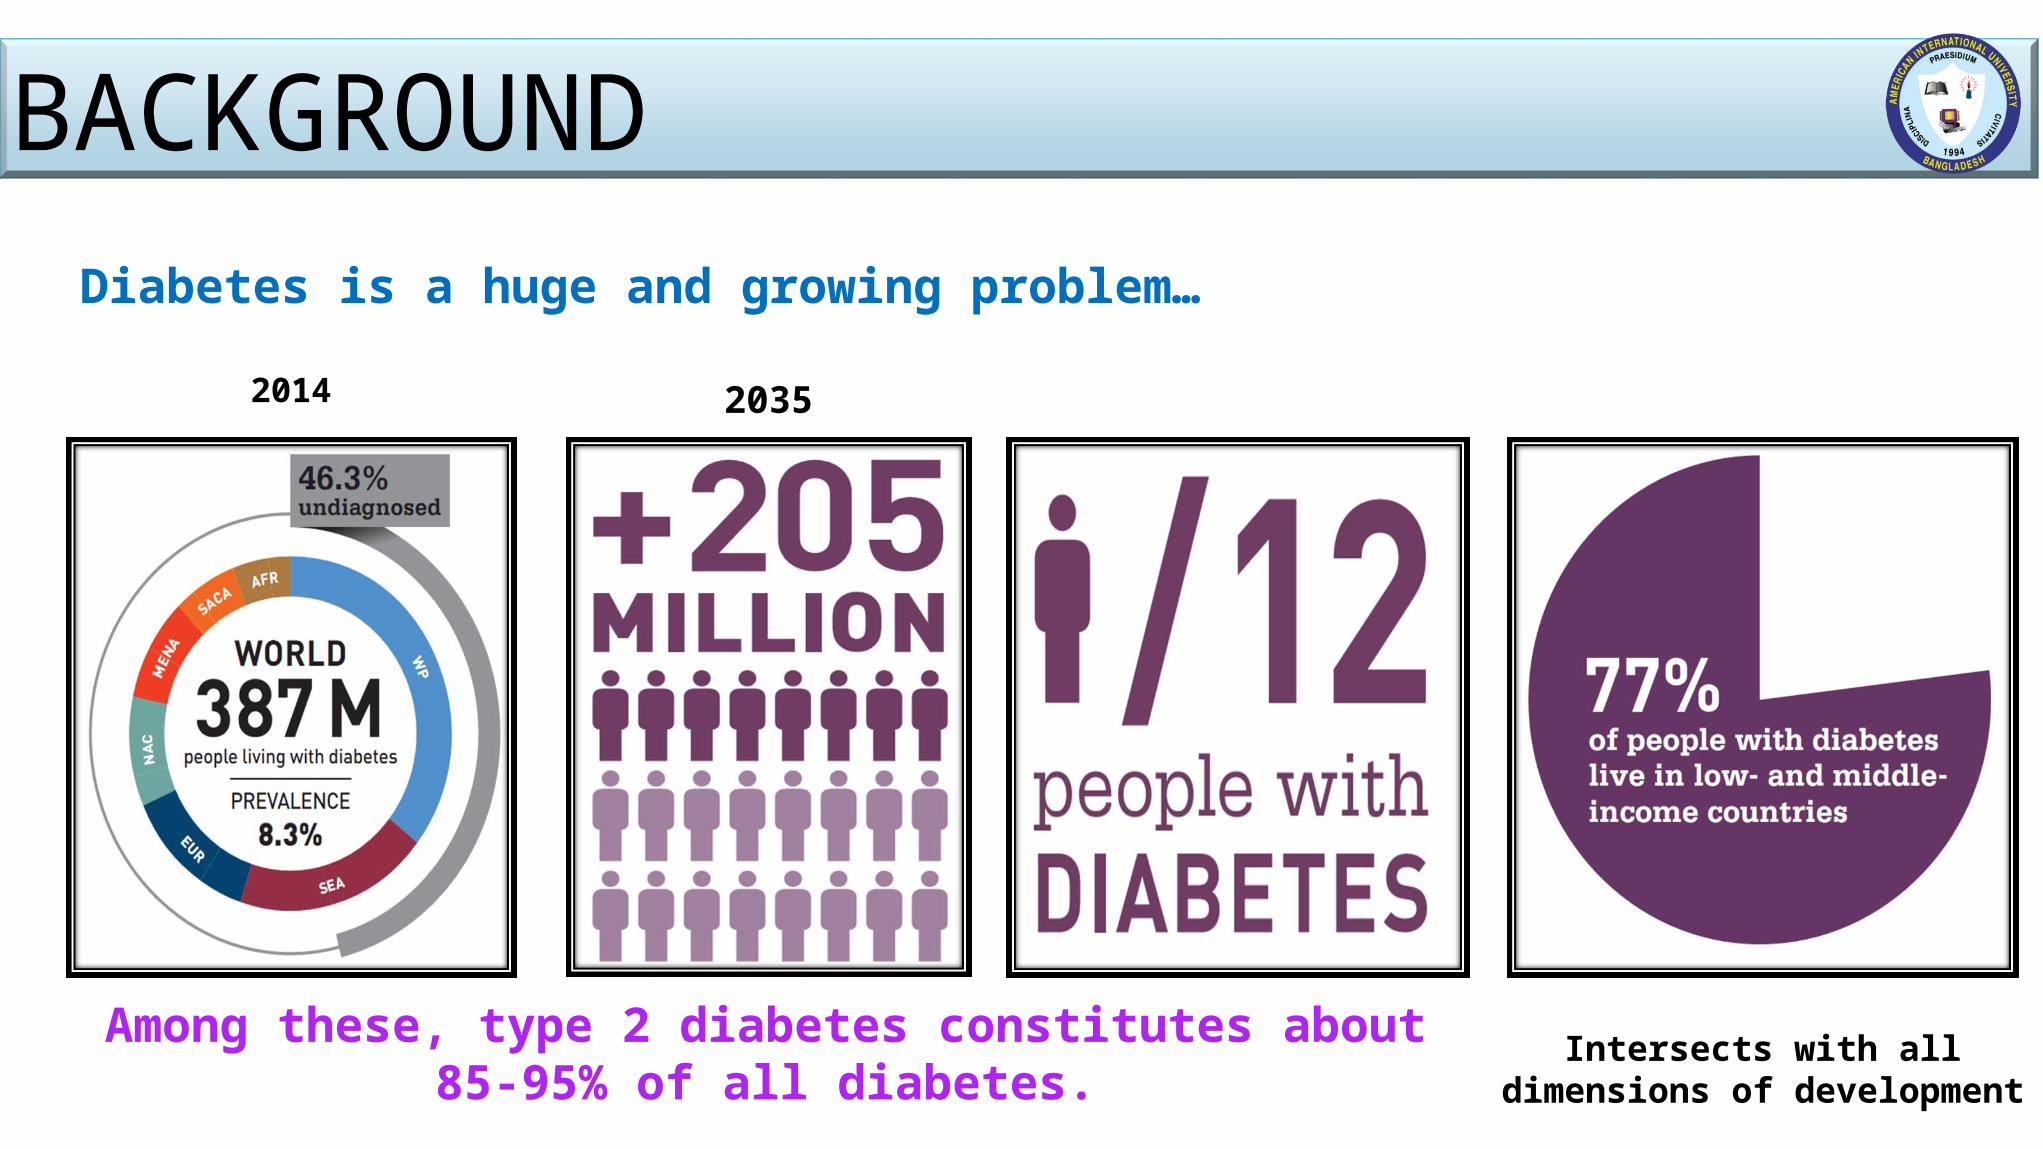
Diabetes is a huge and growing problem…
Intersects with all dimensions of development
BACKGROUND
Among these, type 2 diabetes constitutes about 85-95% of all diabetes.
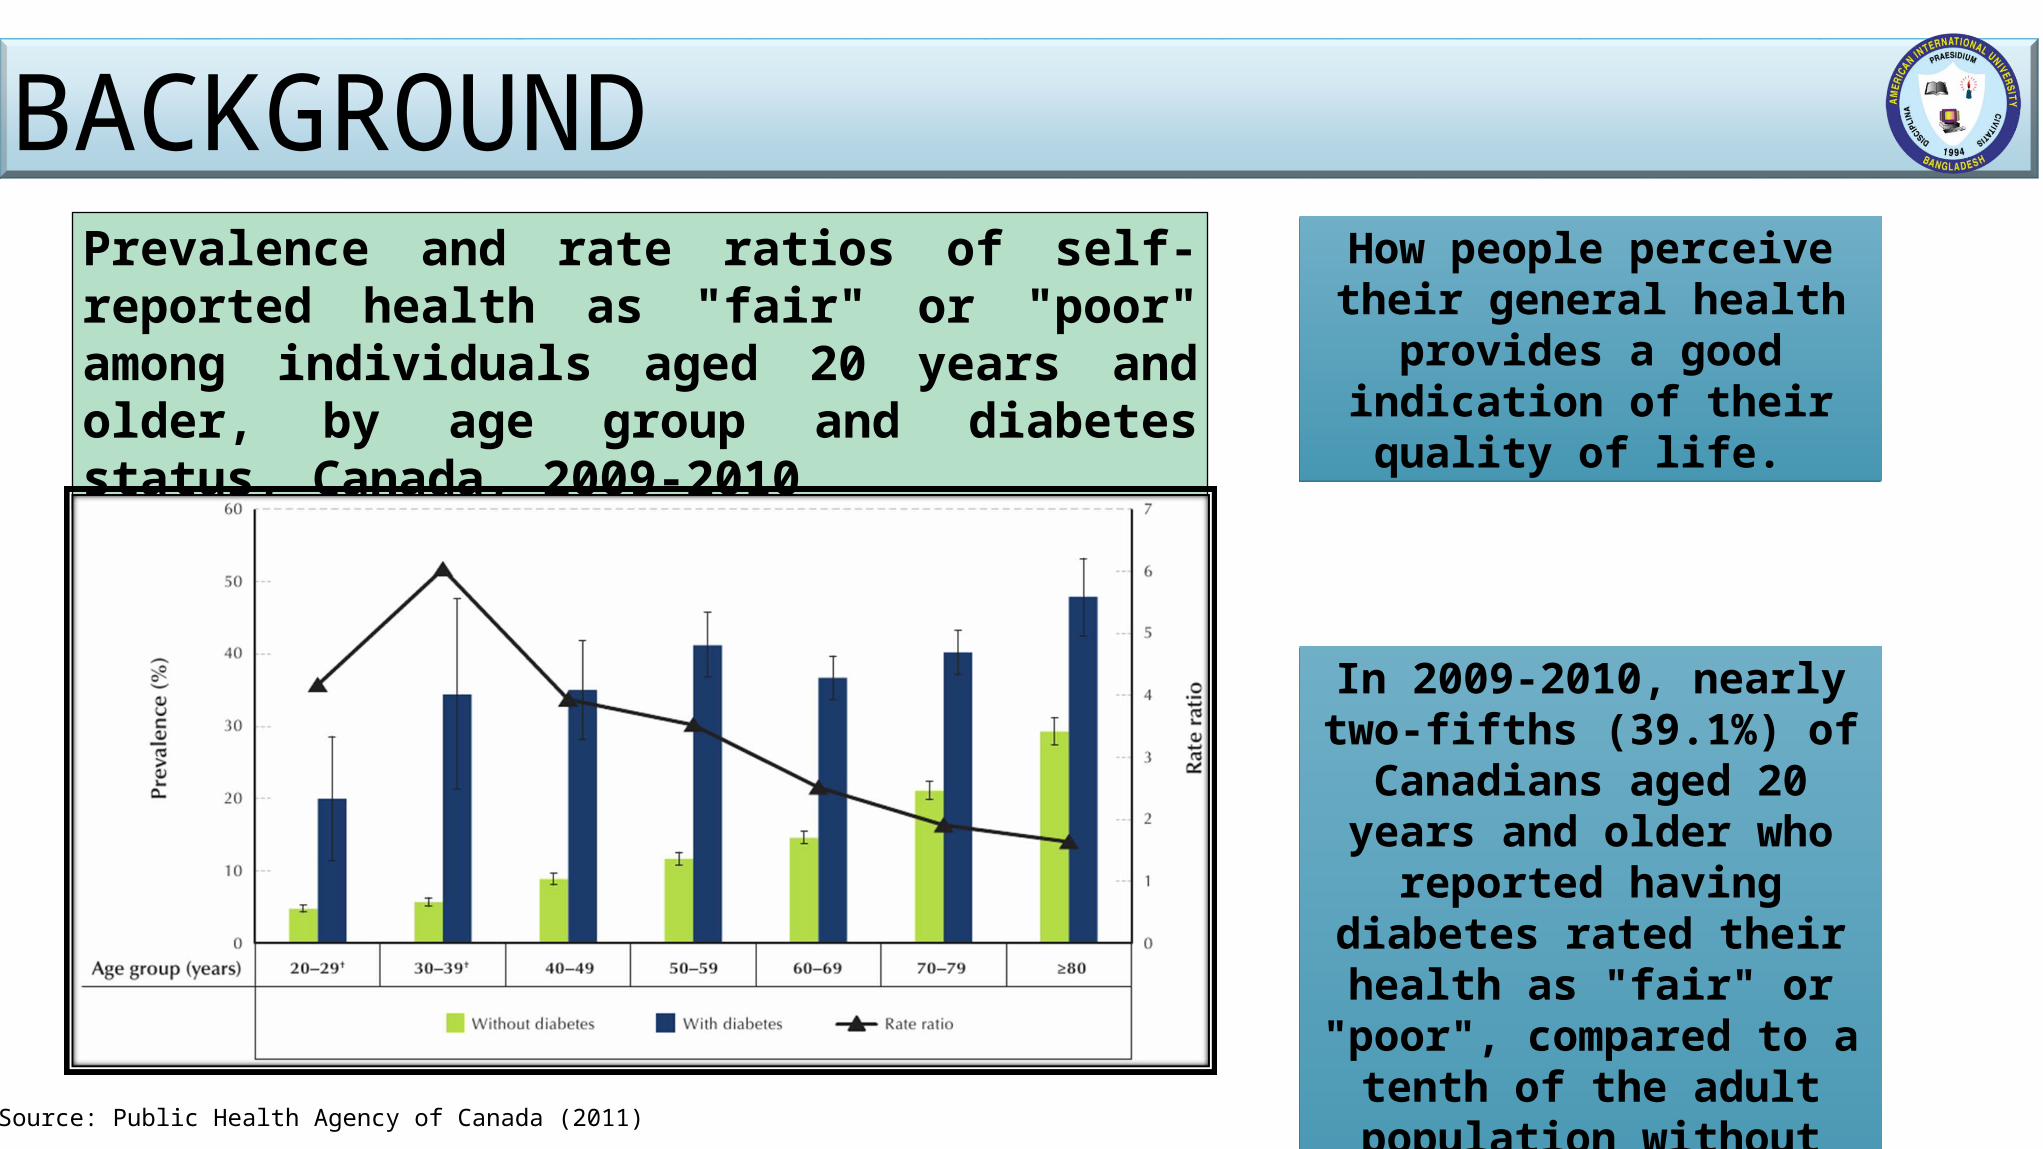
BACKGROUNDPrevalence and rate ratios of self-reported health as "fair" or "poor" among individuals aged 20 years and older, by age group and diabetes status, Canada, 2009-2010
How people perceive their general health provides a good
indication of their quality of life.
In 2009-2010, nearly two-fifths (39.1%) of Canadians aged 20 years and older who reported
having diabetes rated their health as "fair" or "poor", compared to a tenth of the adult population without
diabetes (10.3%).
Source: Public Health Agency of Canada (2011)
BACKGROUNDHRQOL is an important outcome- To evaluate the impact of the disease and its
treatment on individuals and health care costs.People with type 2 diabetes have a worse quality of life than people with no
diabetes.
Poor sleep is prevalent in T2DM and inversely associated with quality of life. Sleep quality is an important clinical consideration for two major reasons. 1.Complaints about sleep quality are common.2.Poor sleep quality can be an important symptom of many sleep and medical chronic
disorders.
BACKGROUNDThis study was a baseline survey which will-
Initiate further specific study and explore new idea for the policy makers and service providers and diabetes educators,
--- to play a key role in assessing sleep and providing easy to improve sleep hygiene and quality of life,
---to emphasize of screening new patients for sleep problems, making a suggesting sleep hygiene strategies as part of diabetes management.
JUSTIFICATION OF THE STUDYStudies showed- T2DM adversely affect both well being and physical functioning, contributing to
decrease HRQOL as well as sleep quality. These studies were carried out in Europe, the USA and Japan. Do not represent population across the globe. Particularly those from Indian subcontinent. Not clear whether the results are applicable to the Bangladeshi population.About 80% of T2DM occur in developing world.9th leading cause of death in Bangladesh. (CDC in Bangladesh factsheet, 2014)
In 2030- BD will hold the 8th position according to the total cases of DM in adult population. Time to determine the sleep quality and quality of life in adults with T2DM patients in BD for a more
comprehensive and intensive approach to diabetic care as diabetes depends on ethnicity.
RESEARCH QUESTIONS
How is the sleep quality in adults with type 2 diabetes? How is the quality of life in adults with type 2 diabetes?
OBJECTIVES General ObjectivesGeneral ObjectivesTo find out the sleep quality and quality of life in adults with Type 2 Diabetes. Specific ObjectivesSpecific ObjectivesTo assess the sleep quality in adults with type 2 diabetes using Pittsburg
Sleep Quality Index.To assess quality of life of the respondents using SF-36 v2TM. To determine the association between sleep quality and quality of life among
the respondents.
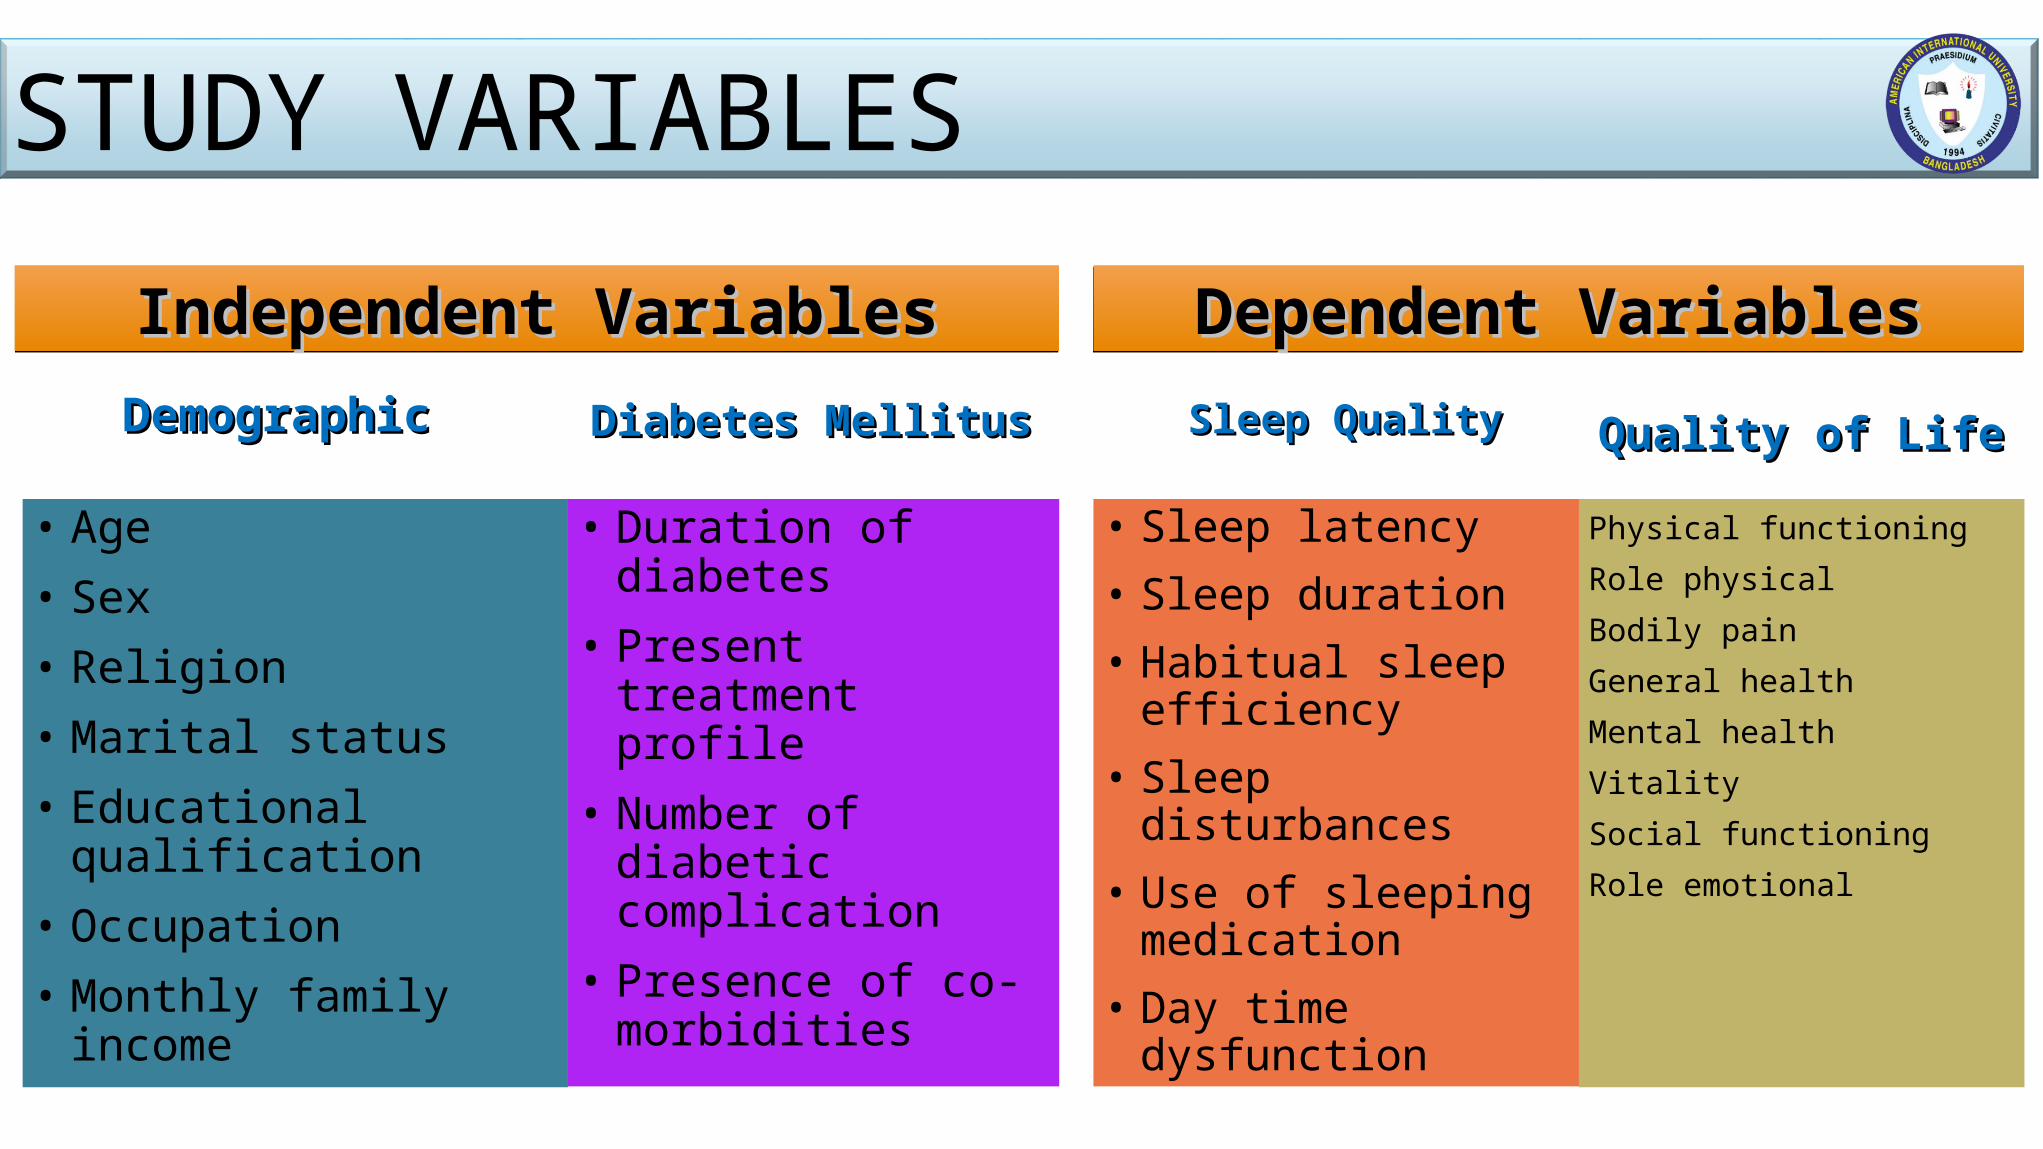
Independent VariablesIndependent Variables Dependent VariablesDependent Variables
• Age • Sex• Religion• Marital status• Educational qualification• Occupation• Monthly family income
• Duration of diabetes • Present treatment
profile • Number of diabetic
complication • Presence of co-
morbidities
DemographicDemographic Diabetes MellitusDiabetes Mellitus
• Sleep latency• Sleep duration• Habitual sleep
efficiency• Sleep disturbances• Use of sleeping
medication• Day time dysfunction
Physical functioning
Role physical
Bodily pain
General health
Mental health
Vitality
Social functioning
Role emotional
Sleep QualitySleep Quality Quality of LifeQuality of Life
STUDY VARIABLES
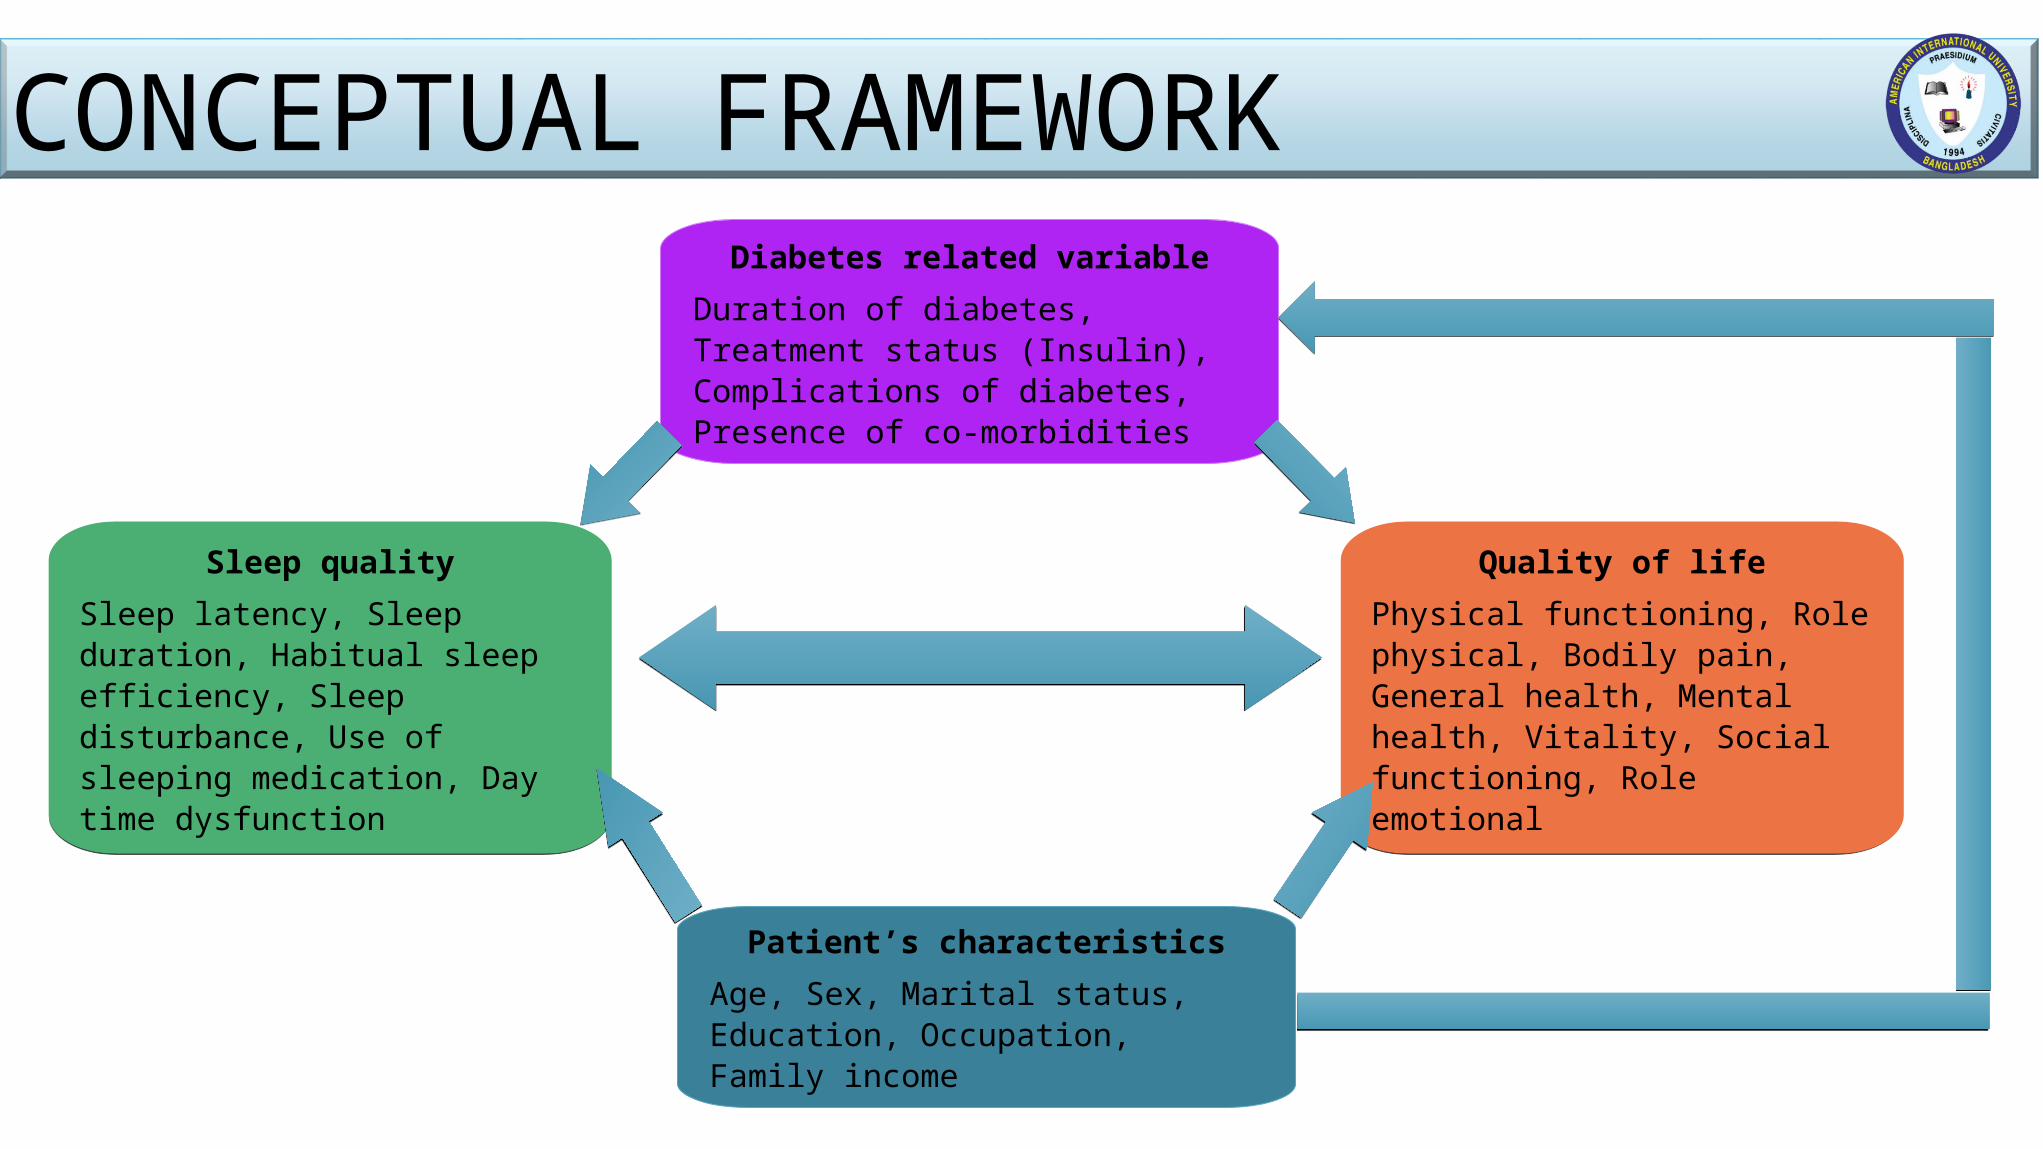
Diabetes related variableDuration of diabetes, Treatment status (Insulin), Complications of diabetes, Presence of co-morbidities
Patient’s characteristicsAge, Sex, Marital status, Education, Occupation, Family income
Sleep qualitySleep latency, Sleep duration, Habitual sleep efficiency, Sleep disturbance, Use of sleeping medication, Day time dysfunction
Quality of lifePhysical functioning, Role physical, Bodily pain, General health, Mental health, Vitality, Social functioning, Role emotional
CONCEPTUAL FRAMEWORK
METHODOLOGY Study DesignStudy DesignA cross sectional study. Study TimeStudy TimeThe total study period was six months, commencing from July, 2015.
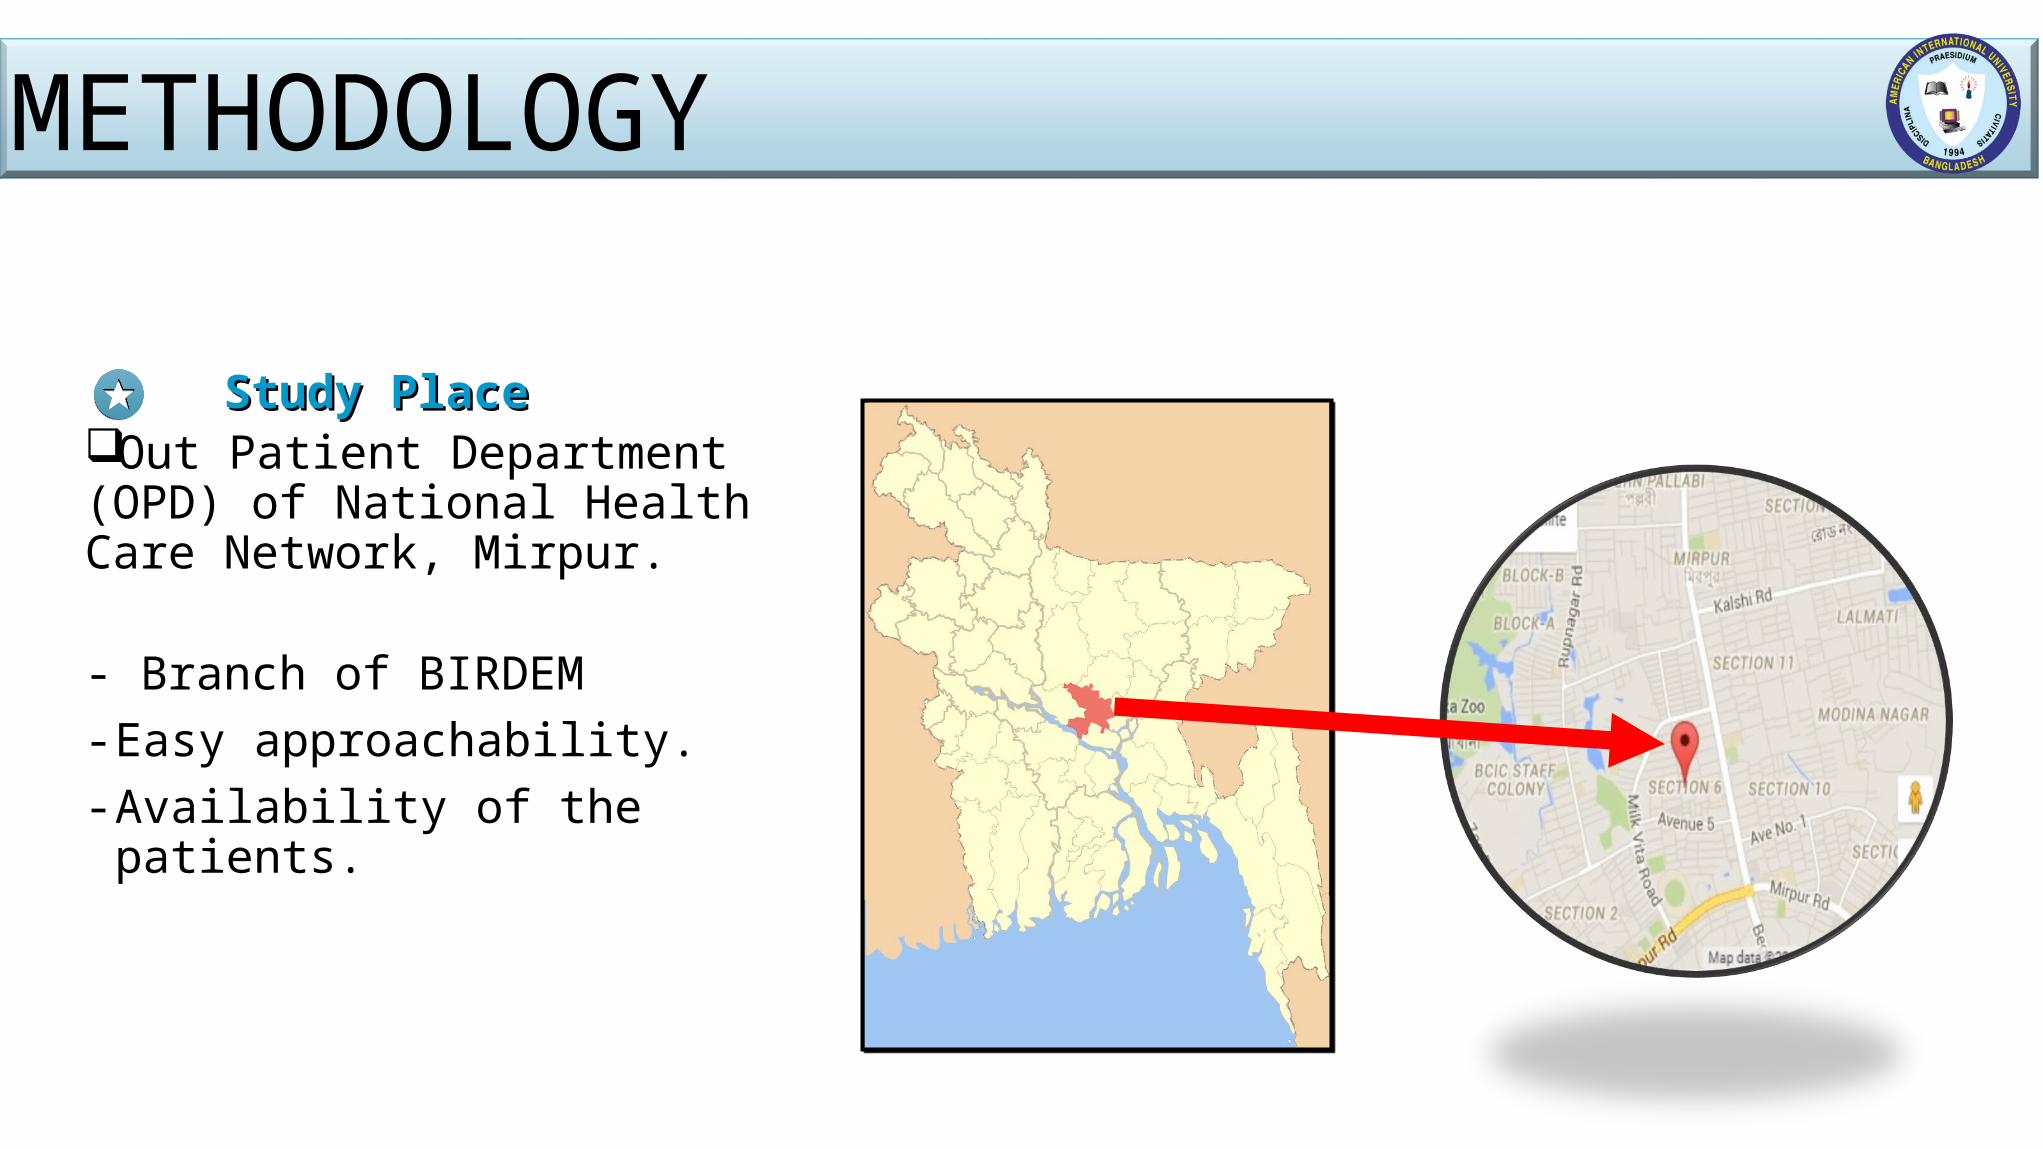
Study Place Study Place Out Patient Department (OPD) of National Health Care Network, Mirpur.
- Branch of BIRDEM- Easy approachability.- Availability of the patients.
METHODOLOGY
Inclusion CriteriaInclusion Criteria Age – (25 - 60 years). Duration of Diabetes more than 1 years.Attending the National Healthcare Network, Mirpur hospital. Exclusion CriteriaExclusion CriteriaType 1 diabetes. Diagnosed sleep disorder prior to diabetes. Diabetes with pregnancy. Inability to communicate due to physical and mental health.
METHODOLOGY
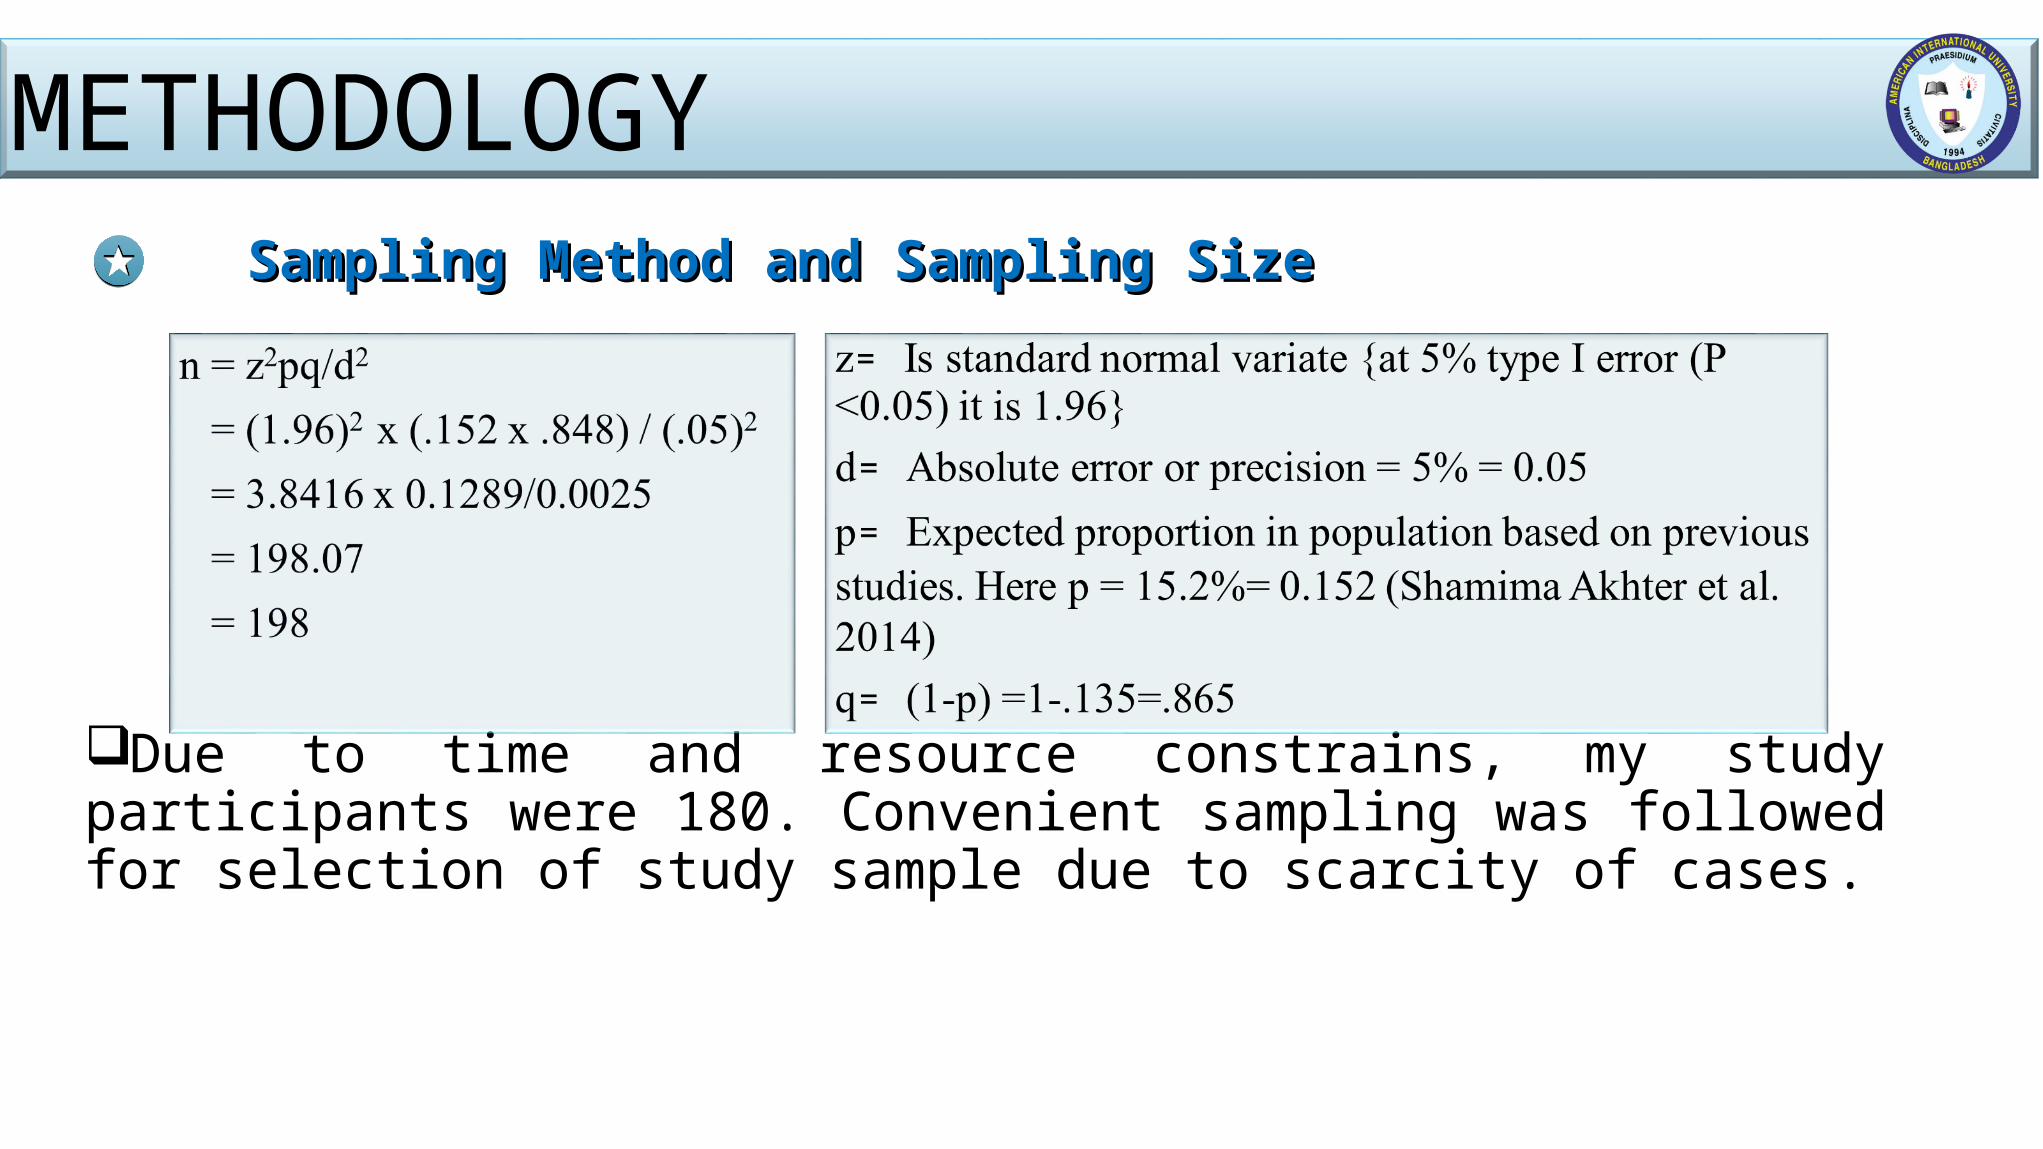
Sampling Method and Sampling SizeSampling Method and Sampling Size
Due to time and resource constrains, my study participants were 180. Convenient sampling was followed for selection of study sample due to scarcity of cases.
METHODOLOGY
Data Collection InstrumentsData Collection Instruments A semi- structured questionnaire and checklist was used to collect data. The questionnaire was prepared by following SF-36 version 2 to assess the
HRQOL and PSQI to assess the sleep quality.It was prepared in English and then translated to Bangla.
Data Collection ProcedureData Collection ProcedureFace to face interview.Record review.
METHODOLOGY
Data Processing and Analysis PlanData Processing and Analysis Plan
At the end of each day of data collection each questionnaire was checked to see whether the questionnaire is filled completely and consistently.
Then they were stored after giving appropriate identification number. The data were analyzed in computer with SPSS 20.0 version. After meticulous cleaning and editing of the data, an analysis plan was
structured with relevance to study objective.
METHODOLOGY
Data Processing and Analysis Plan (Cont…)Data Processing and Analysis Plan (Cont…)
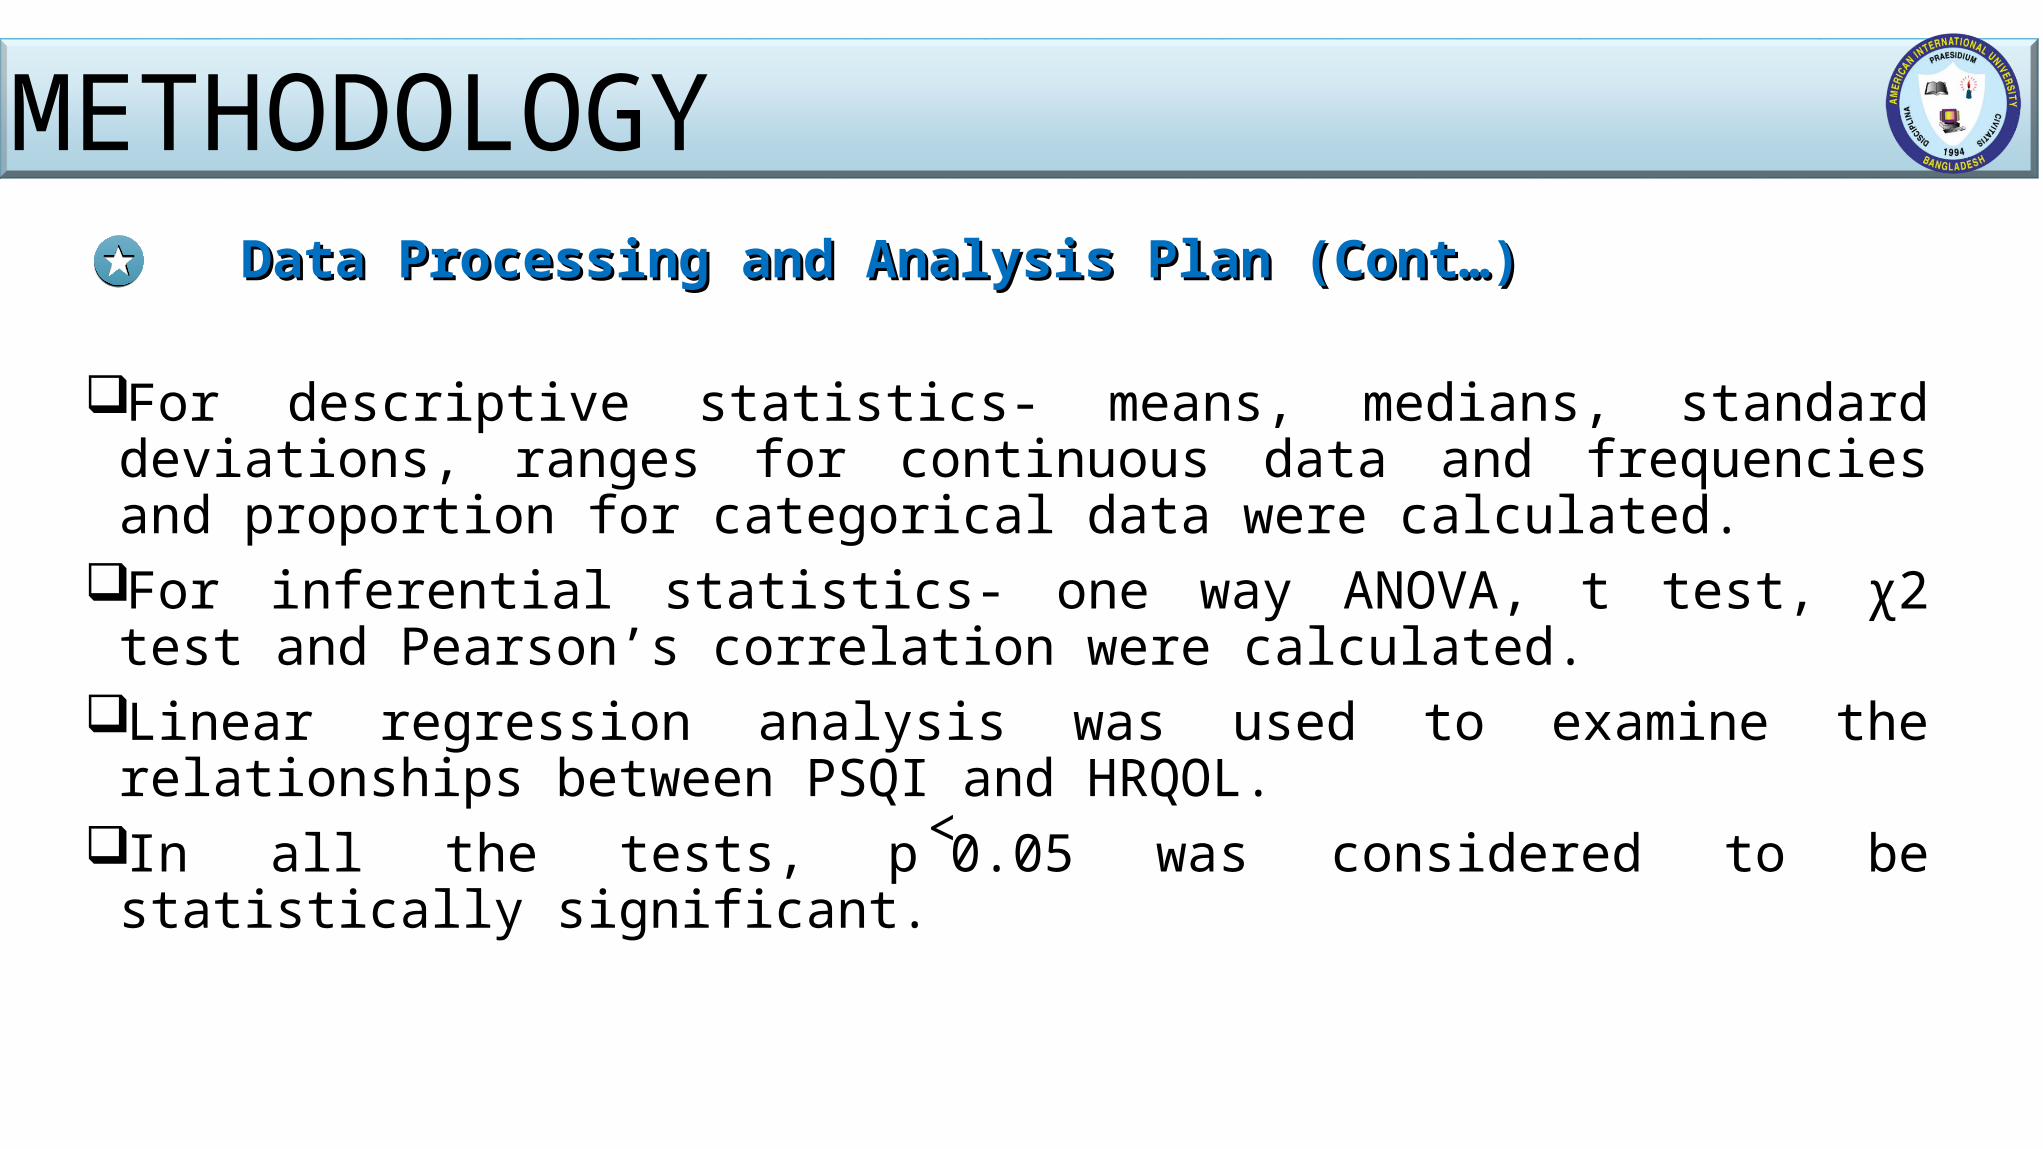
For descriptive statistics- means, medians, standard deviations, ranges for continuous data and frequencies and proportion for categorical data were calculated.
For inferential statistics- one way ANOVA, t test, χ2 test and Pearson’s correlation were calculated.
Linear regression analysis was used to examine the relationships between PSQI and HRQOL.
In all the tests, p˂0.05 was considered to be statistically significant.
METHODOLOGY
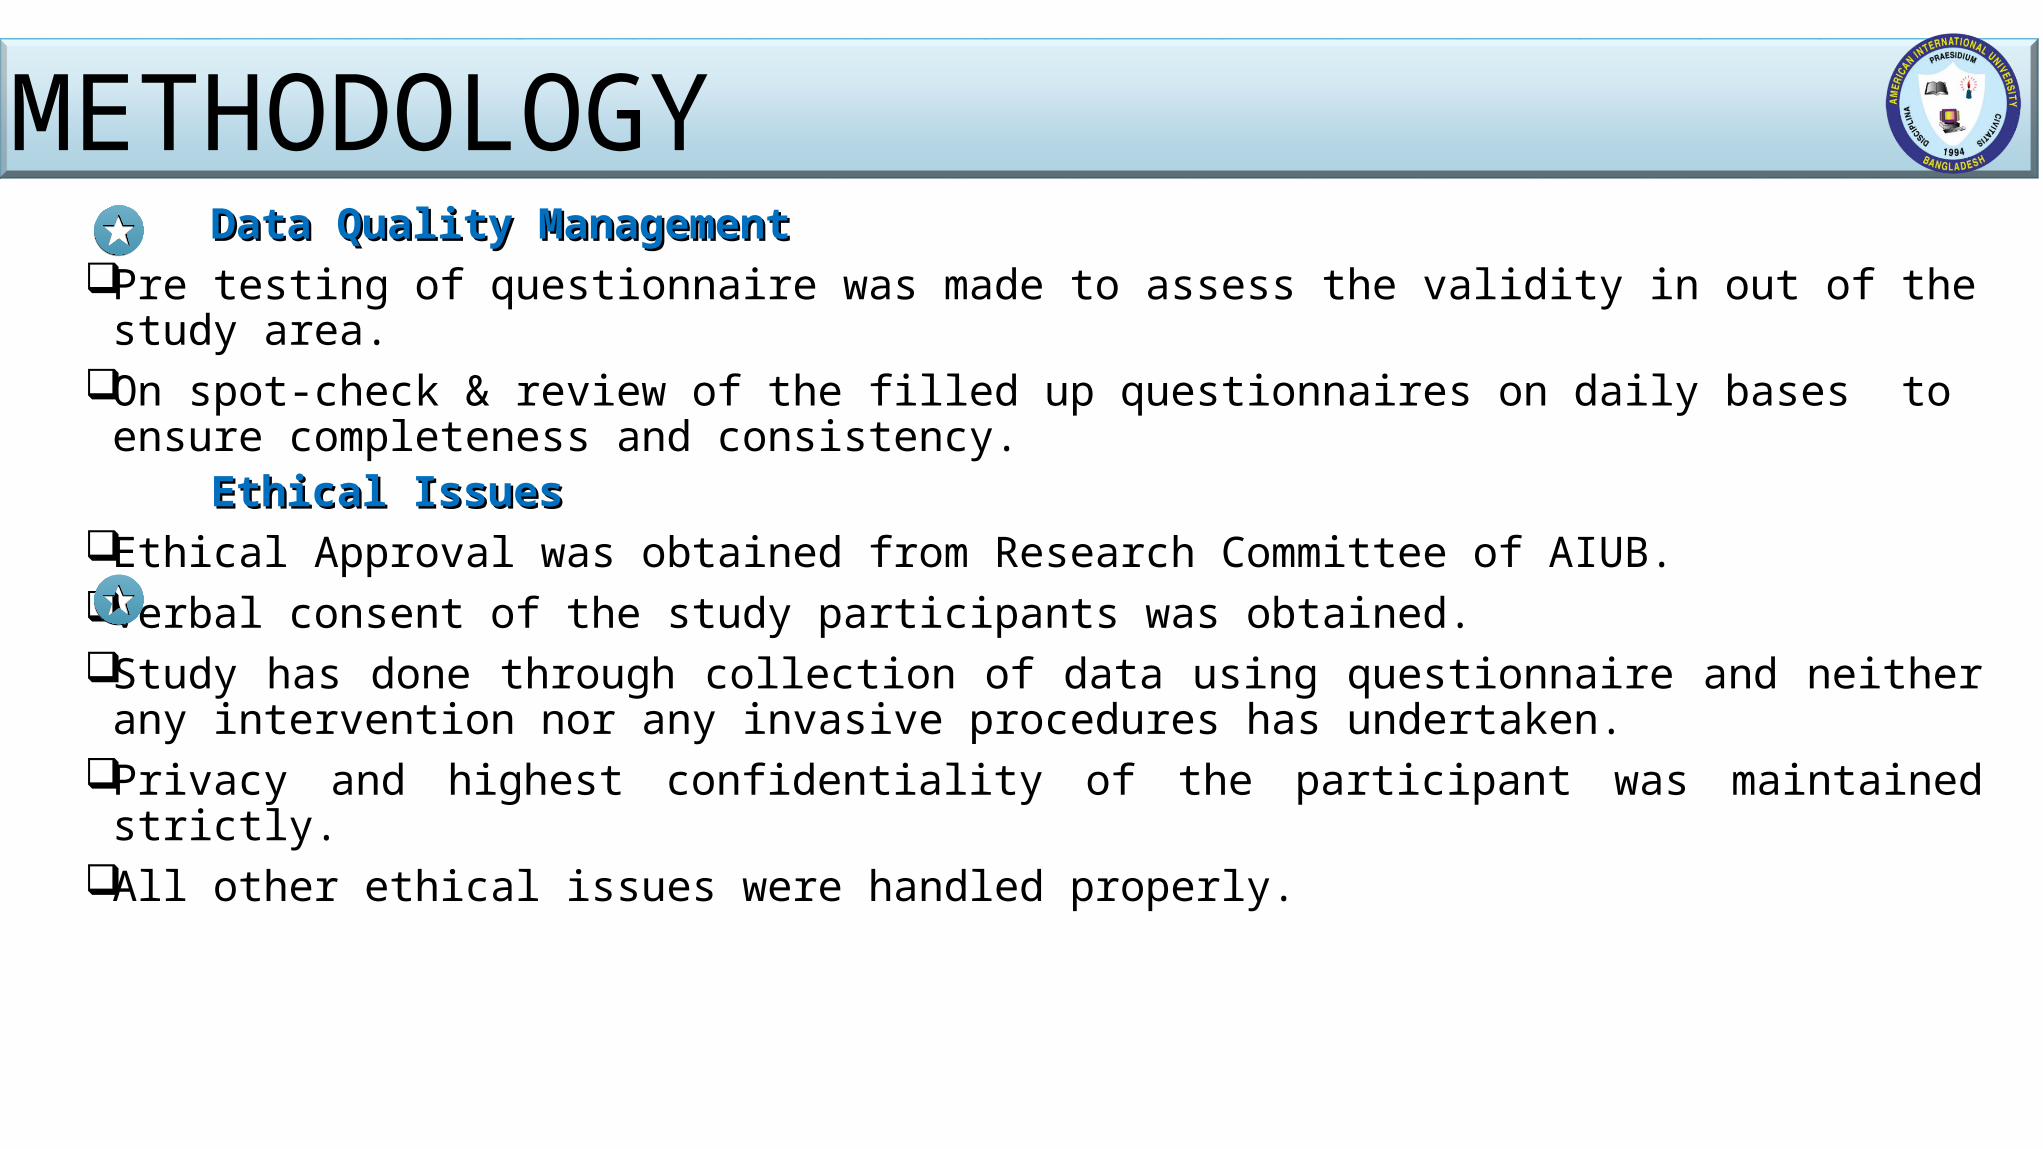
Data Quality ManagementData Quality ManagementPre testing of questionnaire was made to assess the validity in out of the study area. On spot-check & review of the filled up questionnaires on daily bases to ensure completeness
and consistency. Ethical IssuesEthical IssuesEthical Approval was obtained from Research Committee of AIUB.Verbal consent of the study participants was obtained. Study has done through collection of data using questionnaire and neither any intervention nor
any invasive procedures has undertaken. Privacy and highest confidentiality of the participant was maintained strictly.All other ethical issues were handled properly.
METHODOLOGY
Limitation of the StudyLimitation of the Study
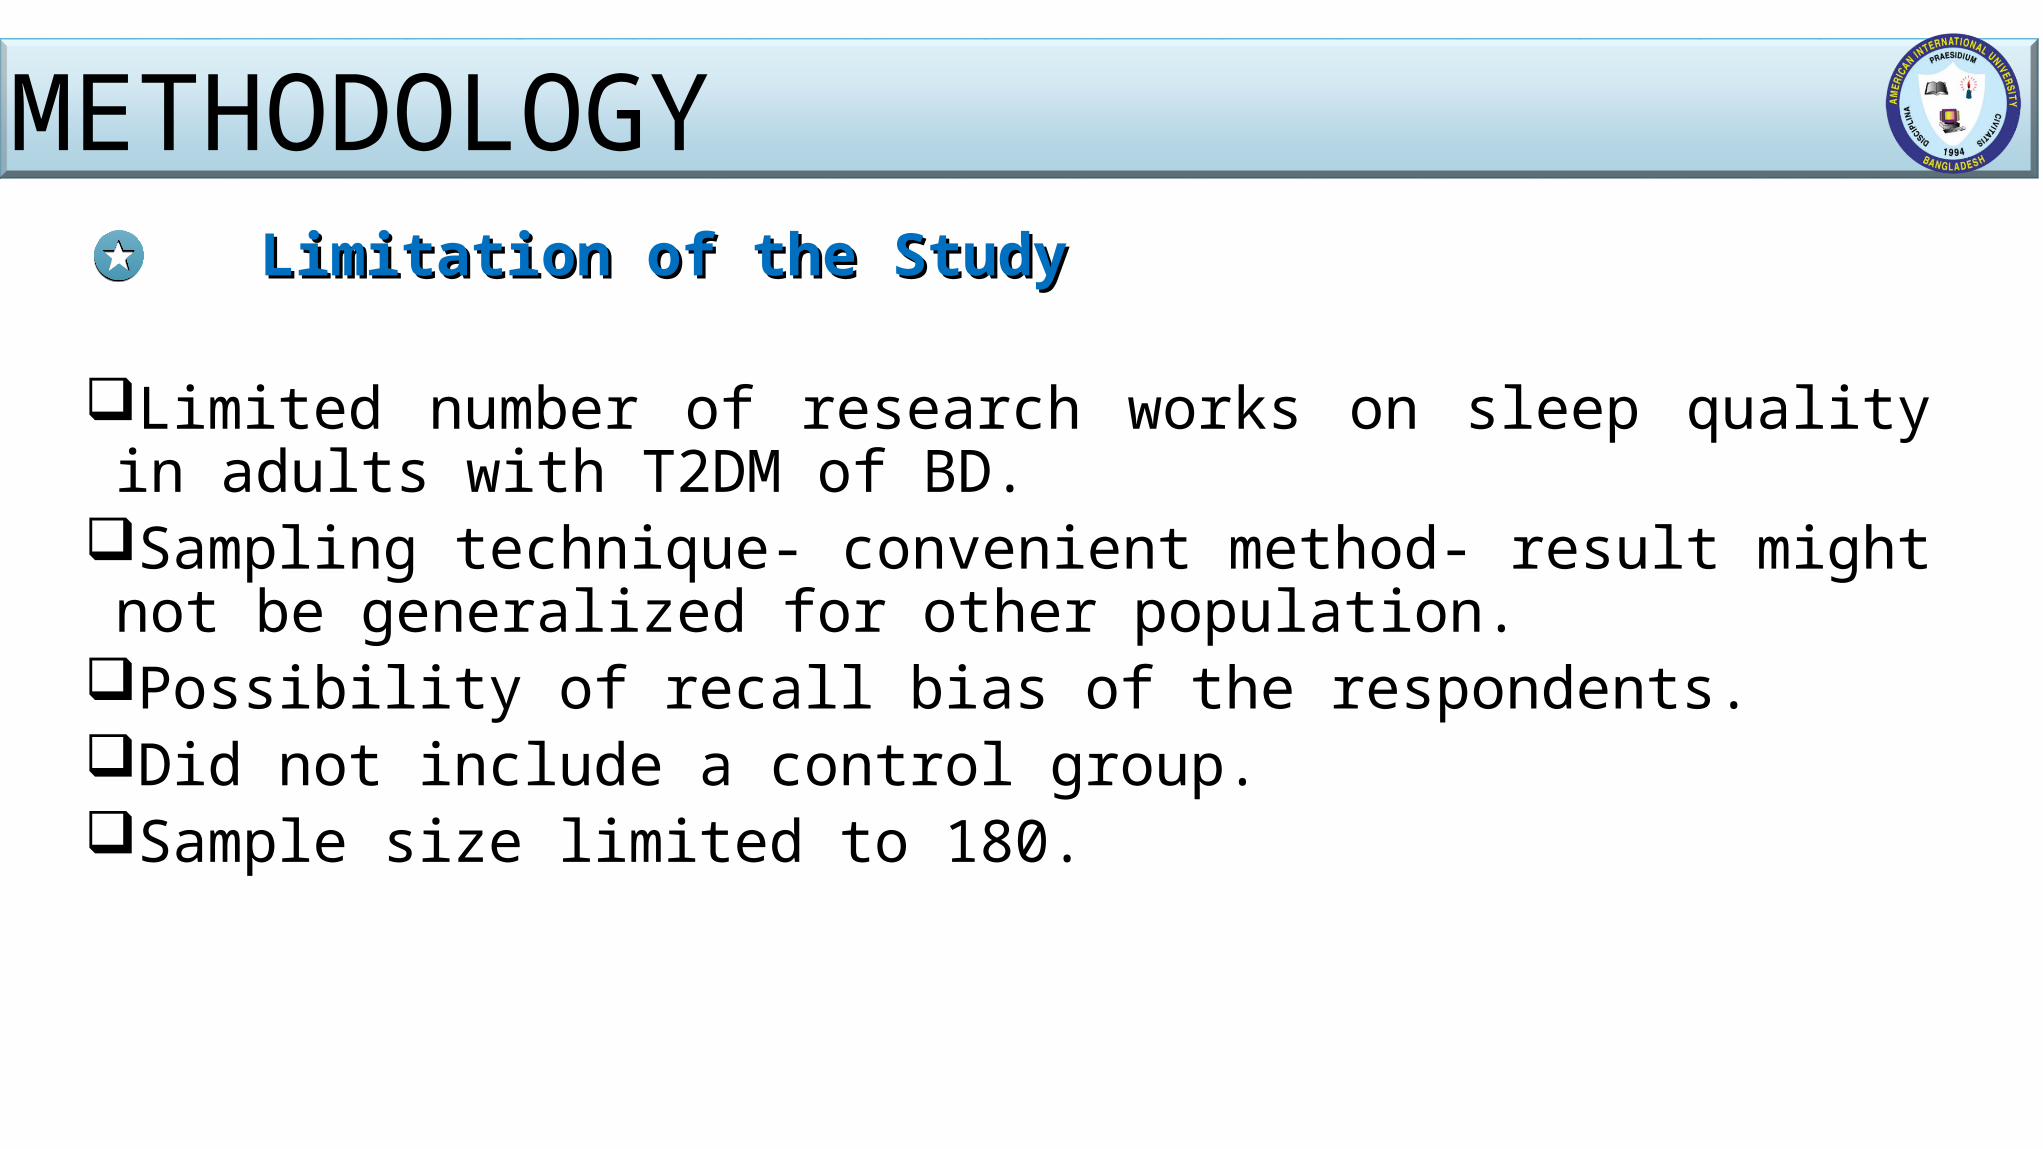
Limited number of research works on sleep quality in adults with T2DM of BD.
Sampling technique- convenient method- result might not be generalized for other population.
Possibility of recall bias of the respondents. Did not include a control group. Sample size limited to 180.
METHODOLOGY

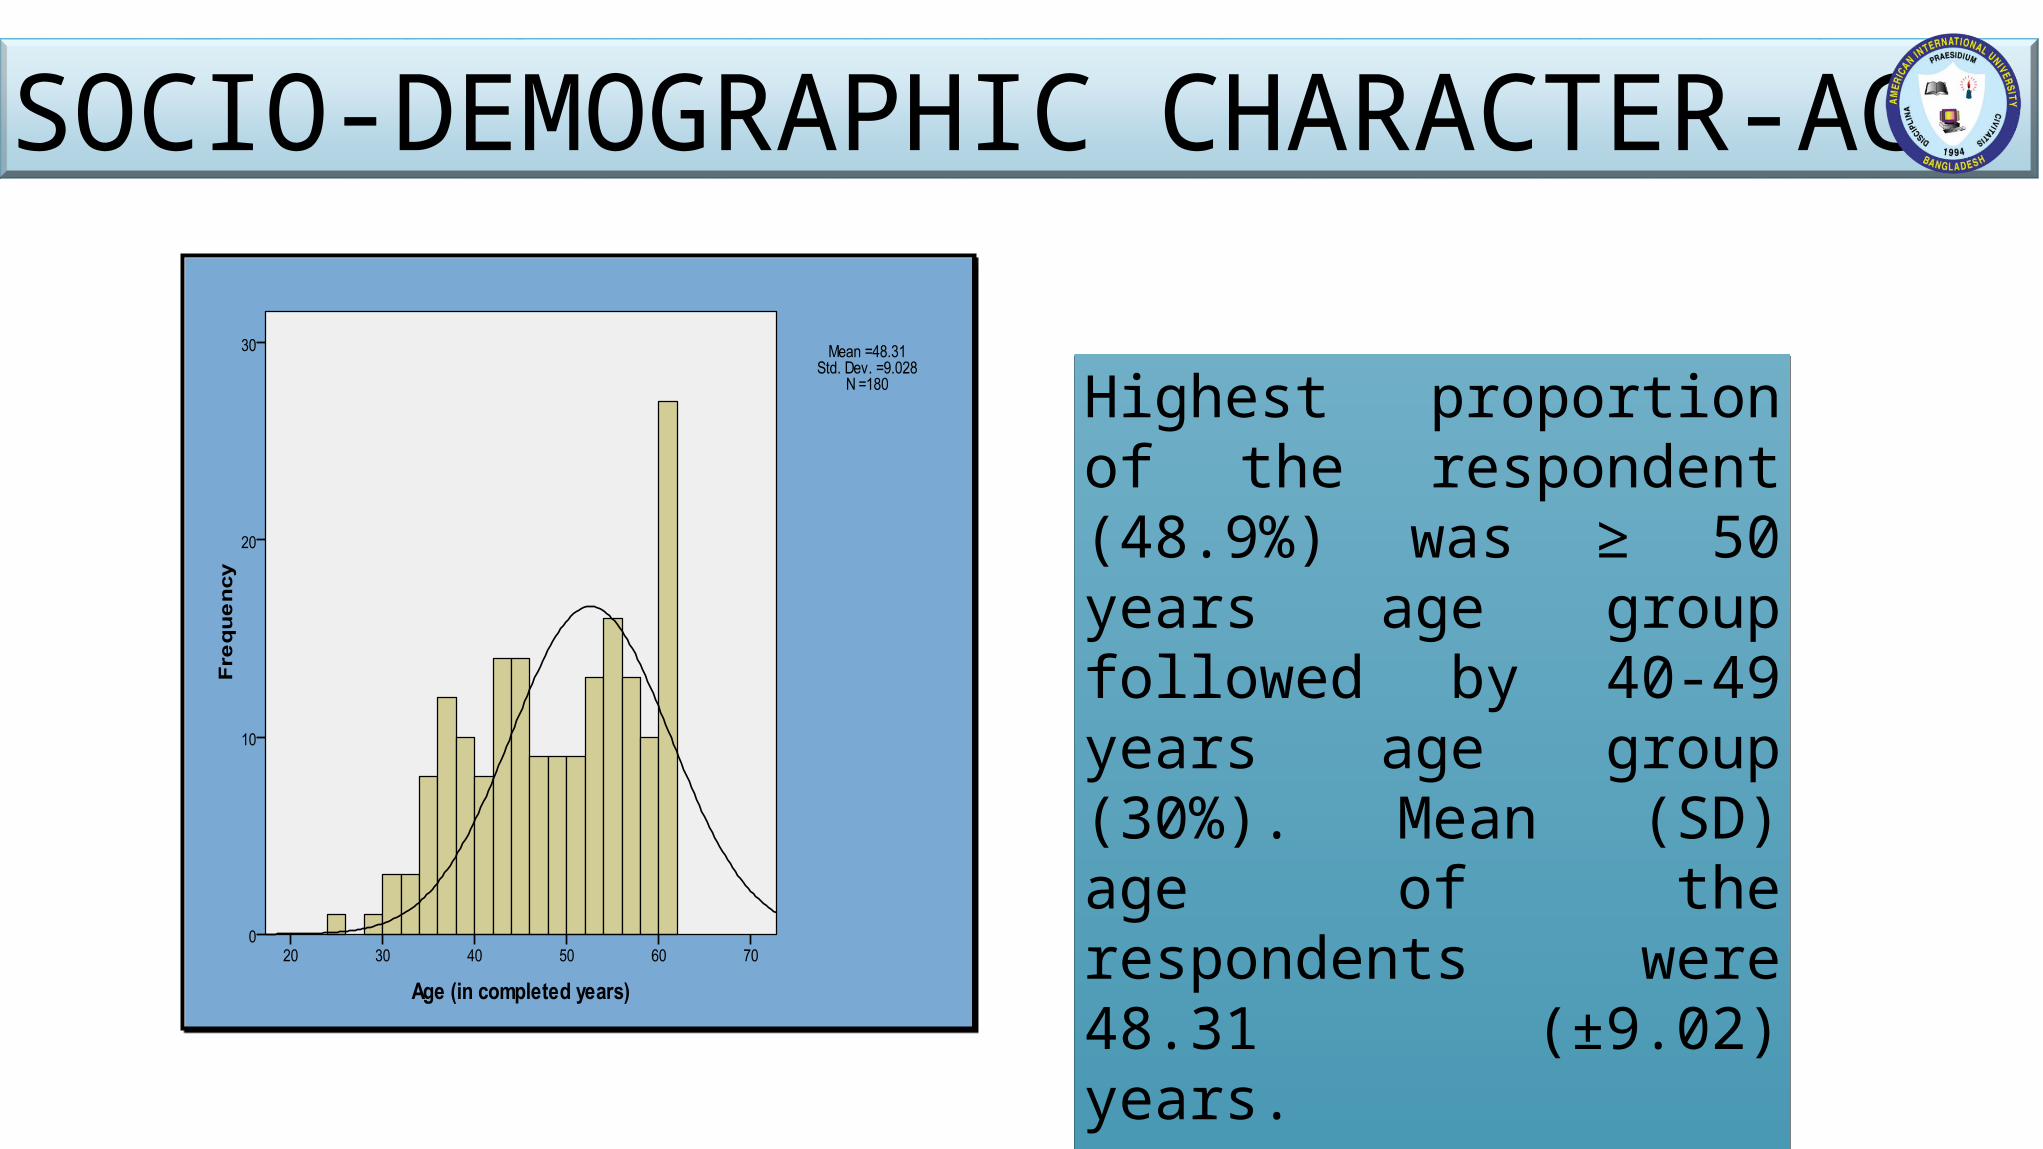
Highest proportion of the respondent (48.9%) was ≥ 50 years age group followed by 40-49 years age group (30%). Mean (SD) age of the respondents were 48.31 (±9.02) years.
SOCIO-DEMOGRAPHIC CHARACTER-AGE
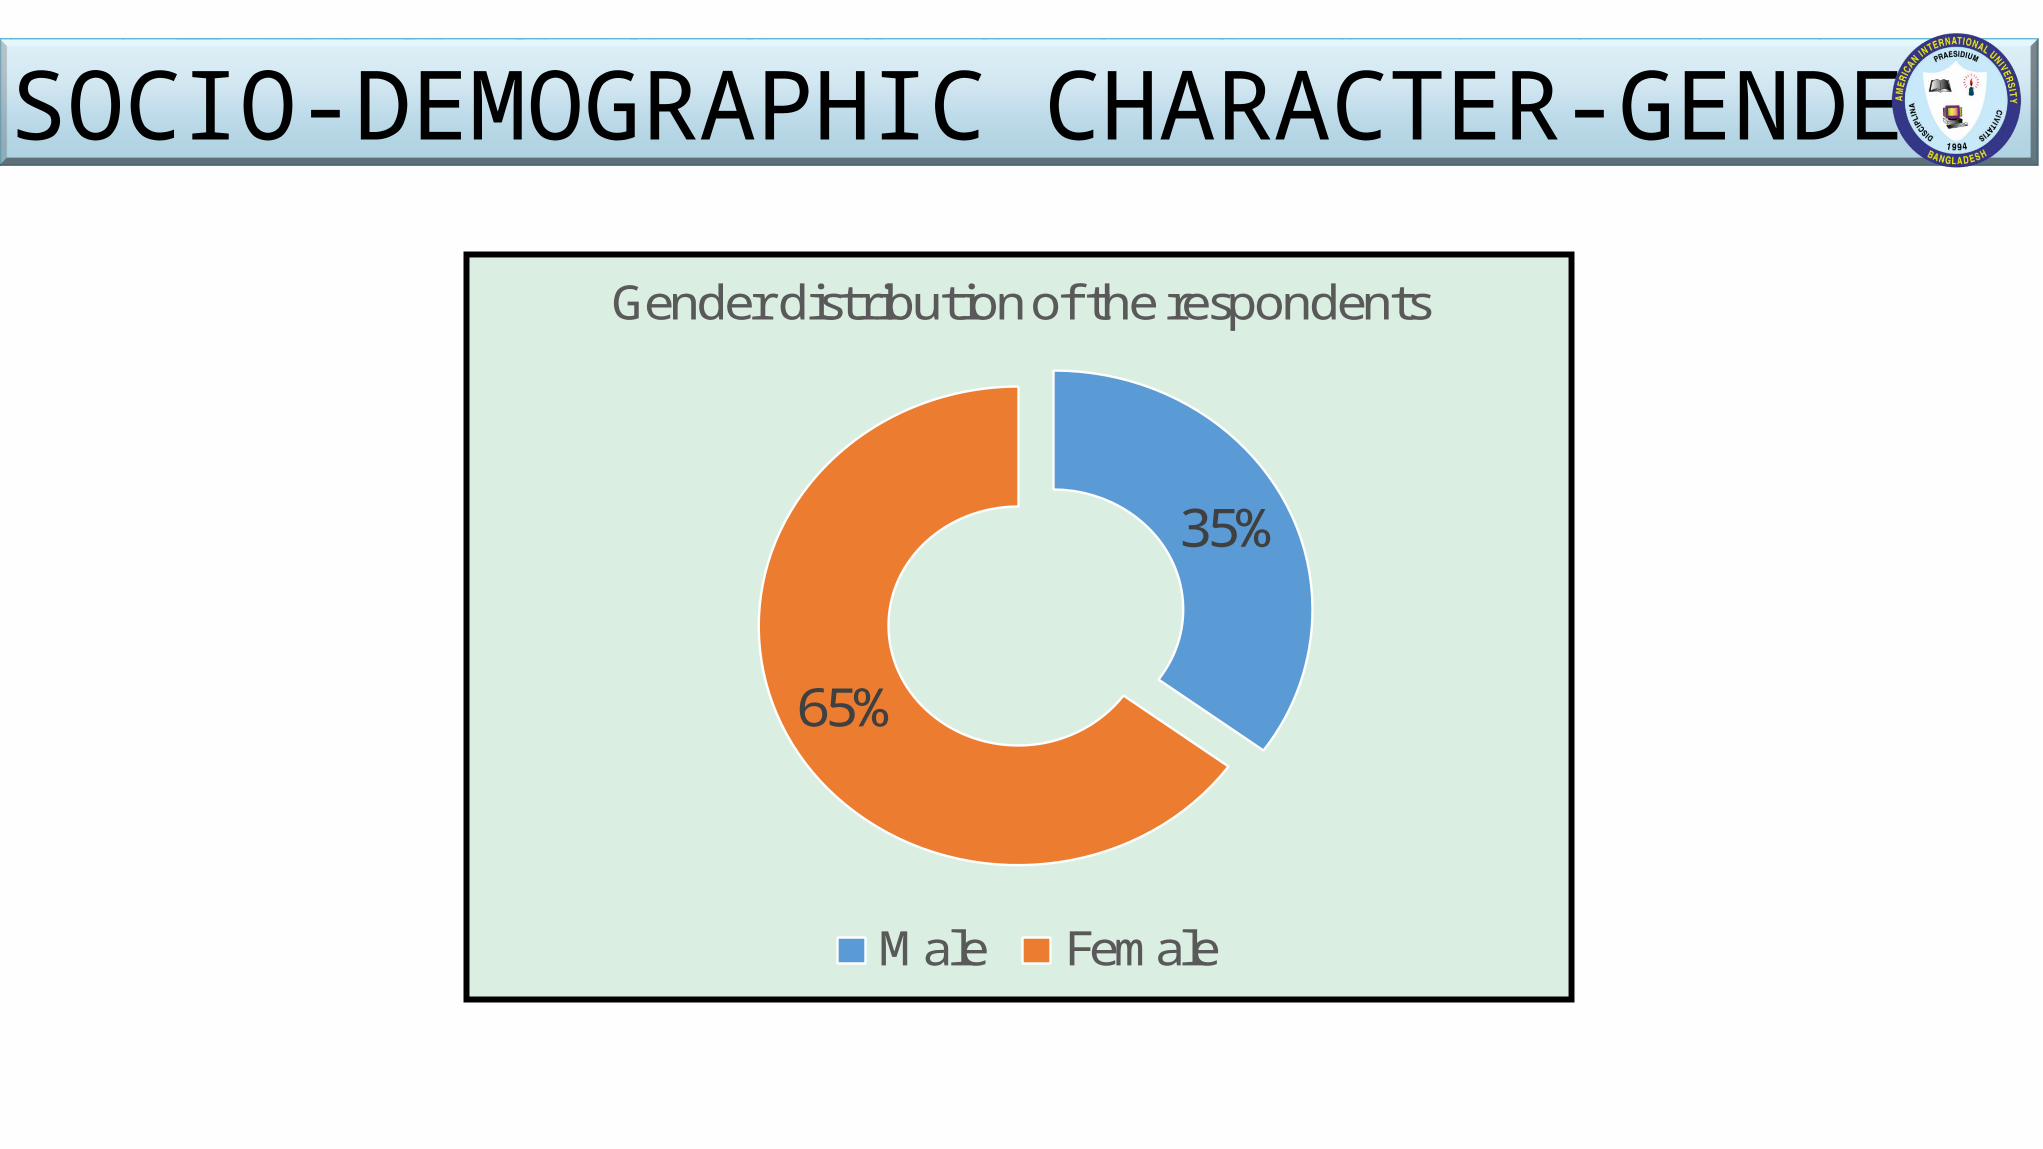
35%
65%
Gender distribution of the respondents
Male Female
SOCIO-DEMOGRAPHIC CHARACTER-GENDER
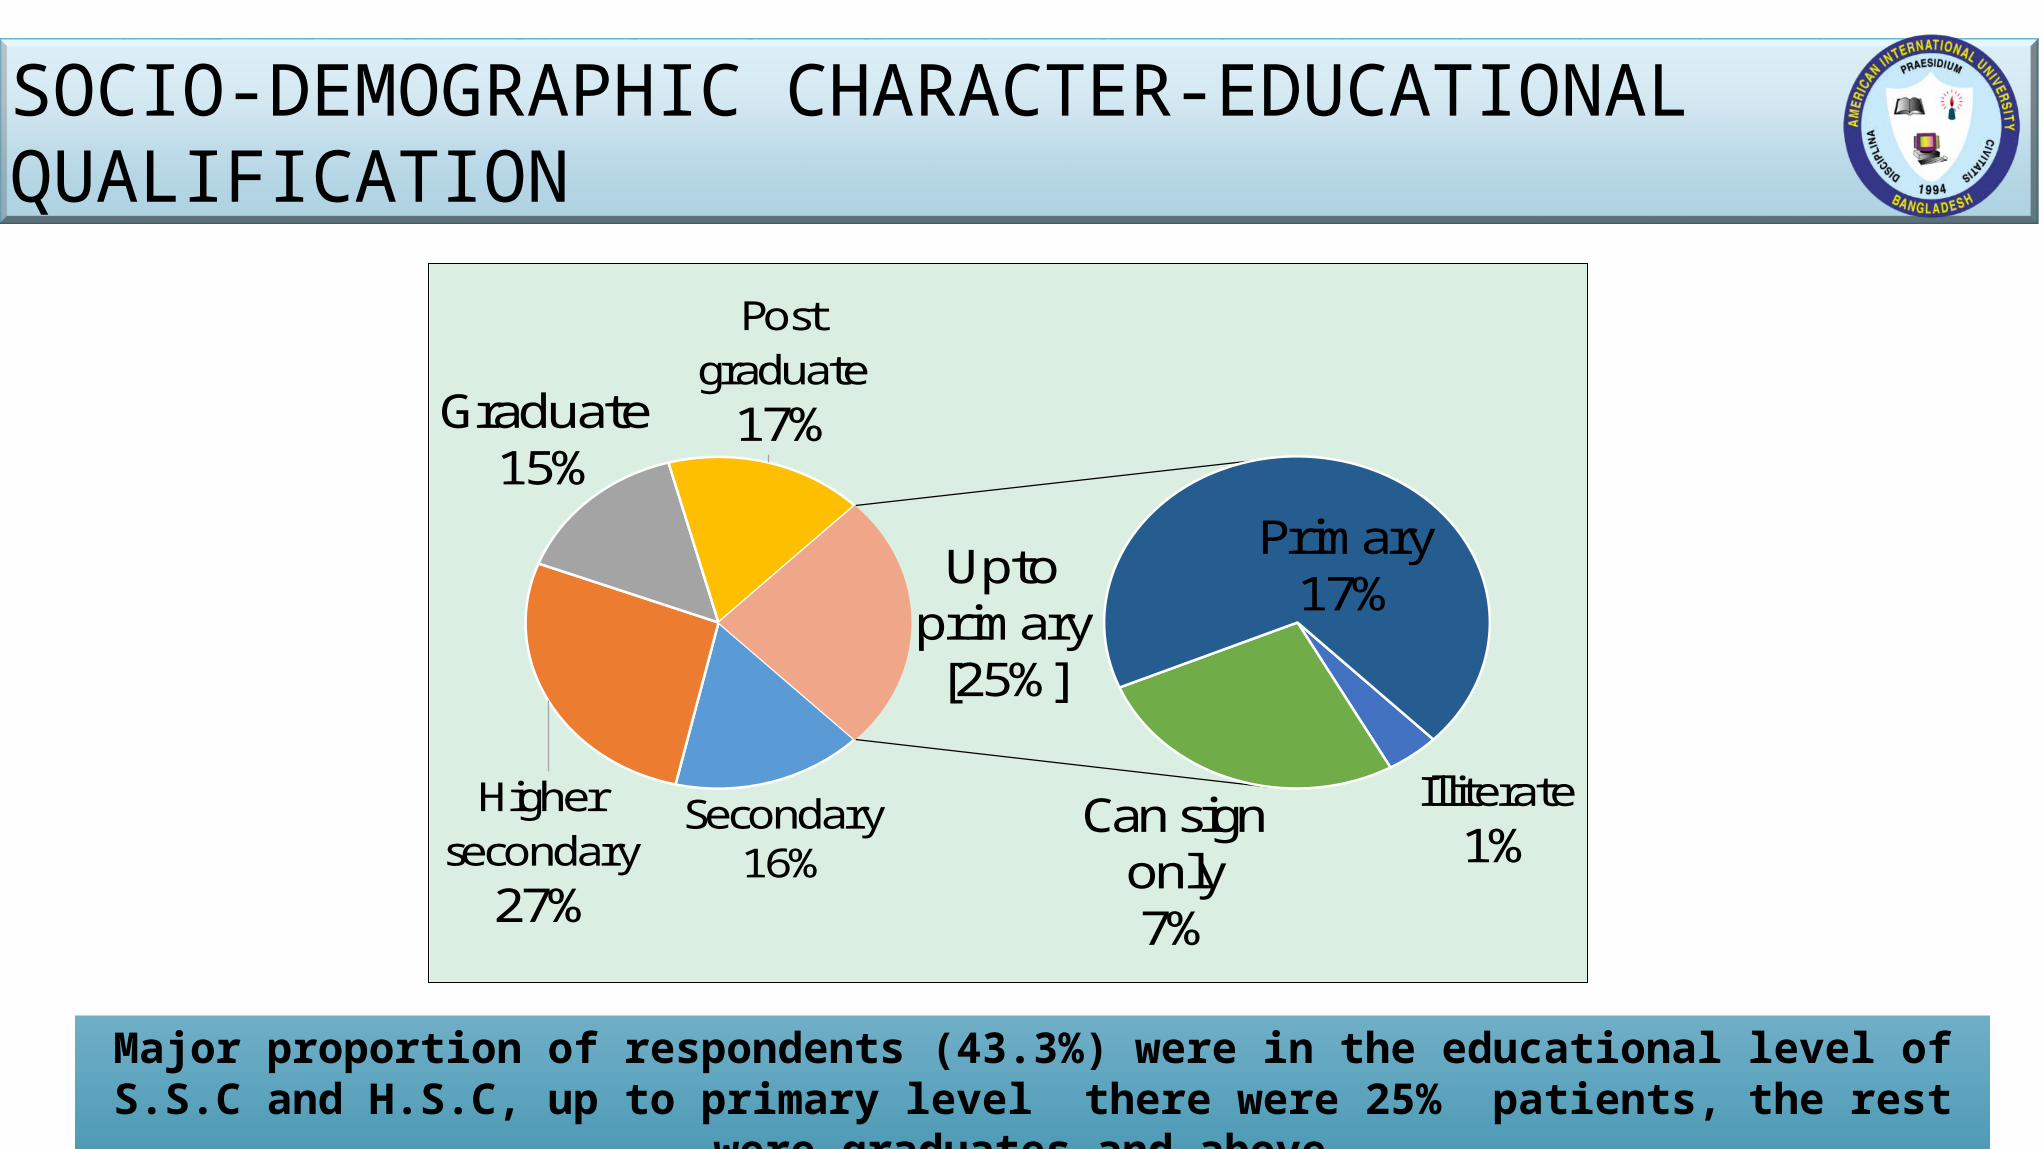
Secondary16%
Higher secondary
27%
Graduate15%
Post graduate
17%
Illiterate1%
Can sign only7%
Primary17%Upto
primary[25%]
Major proportion of respondents (43.3%) were in the educational level of S.S.C and H.S.C, up to primary level there were 25% patients, the rest were graduates and above.
SOCIO-DEMOGRAPHIC CHARACTER-EDUCATIONAL QUALIFICATION
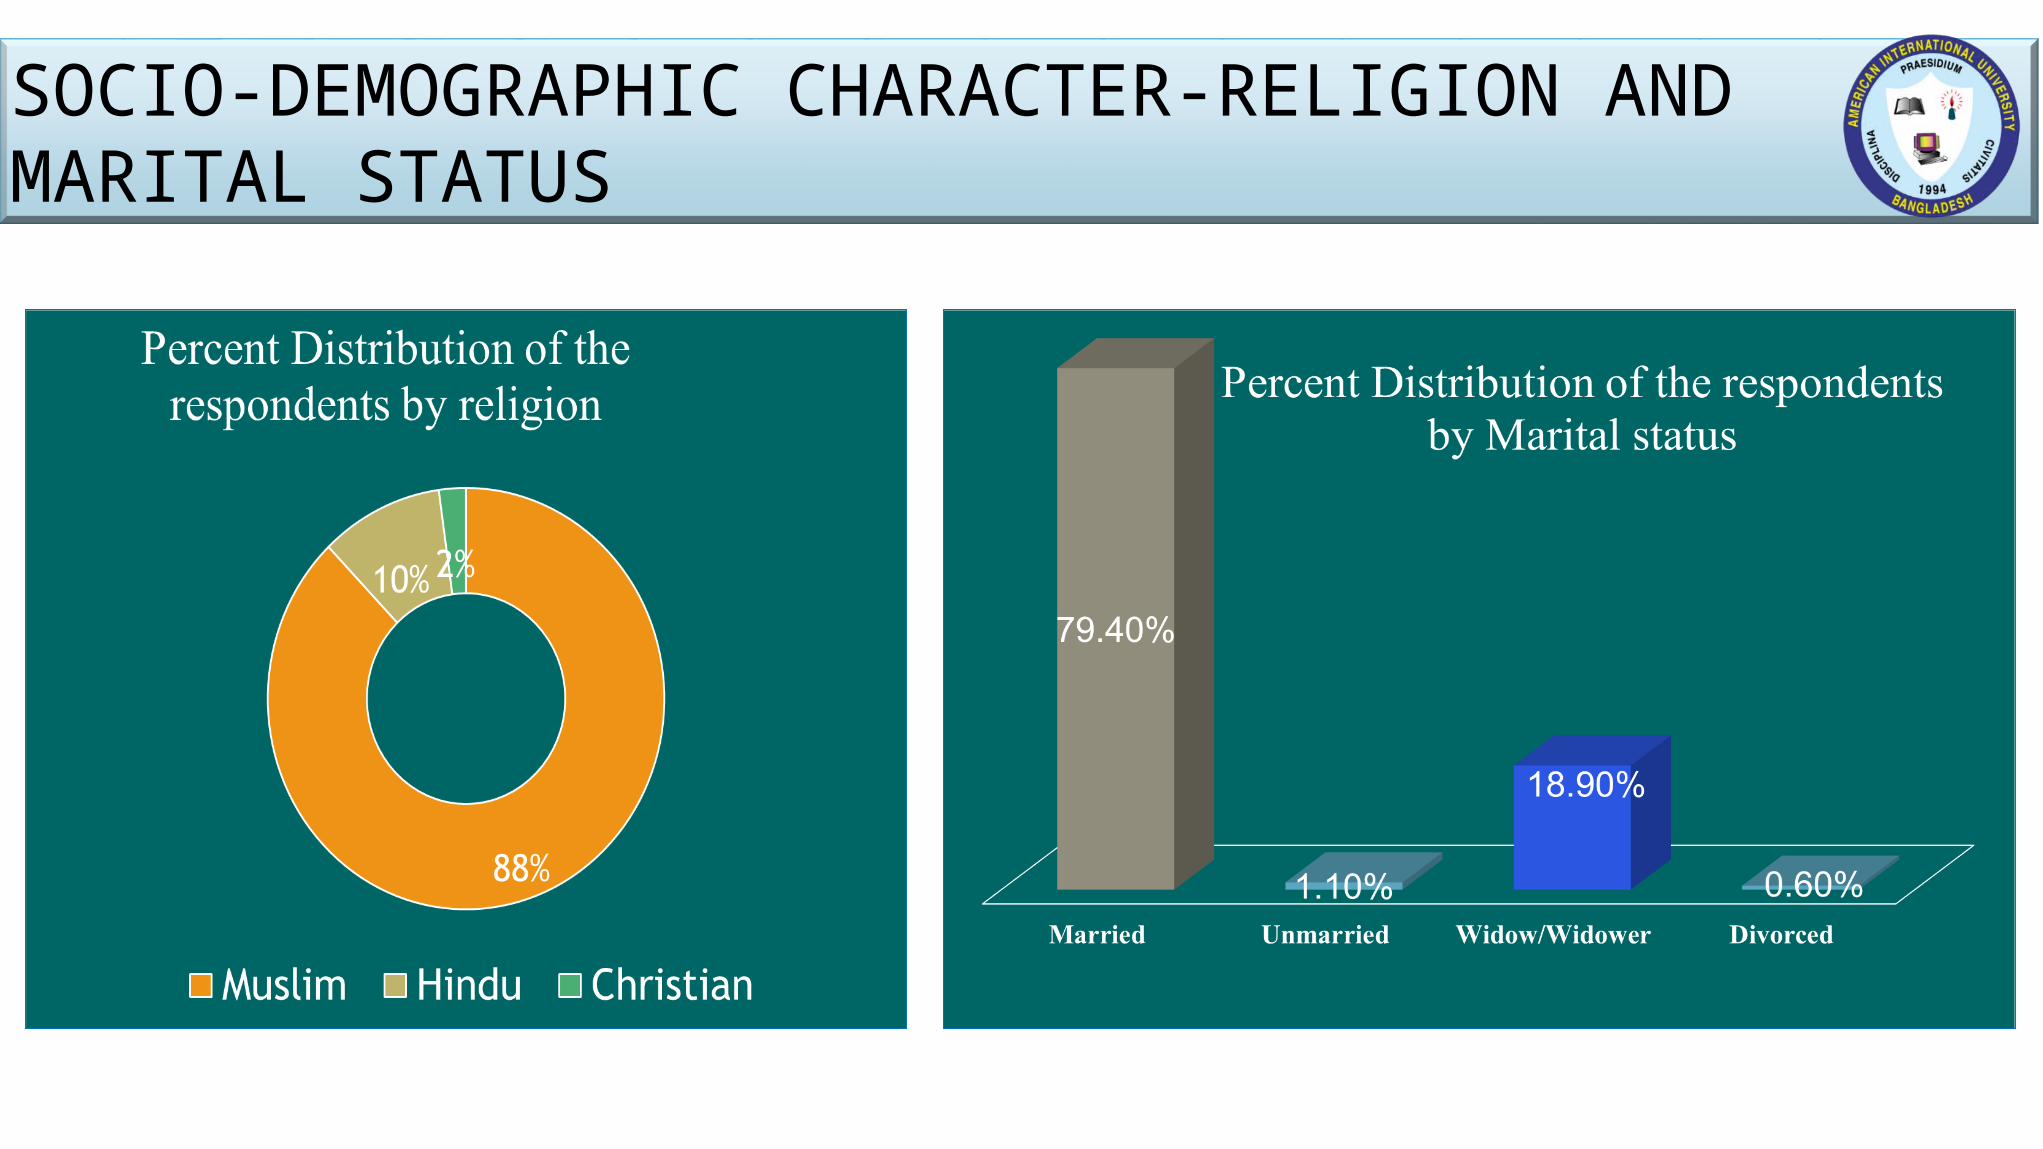
SOCIO-DEMOGRAPHIC CHARACTER-RELIGION AND MARITAL STATUS
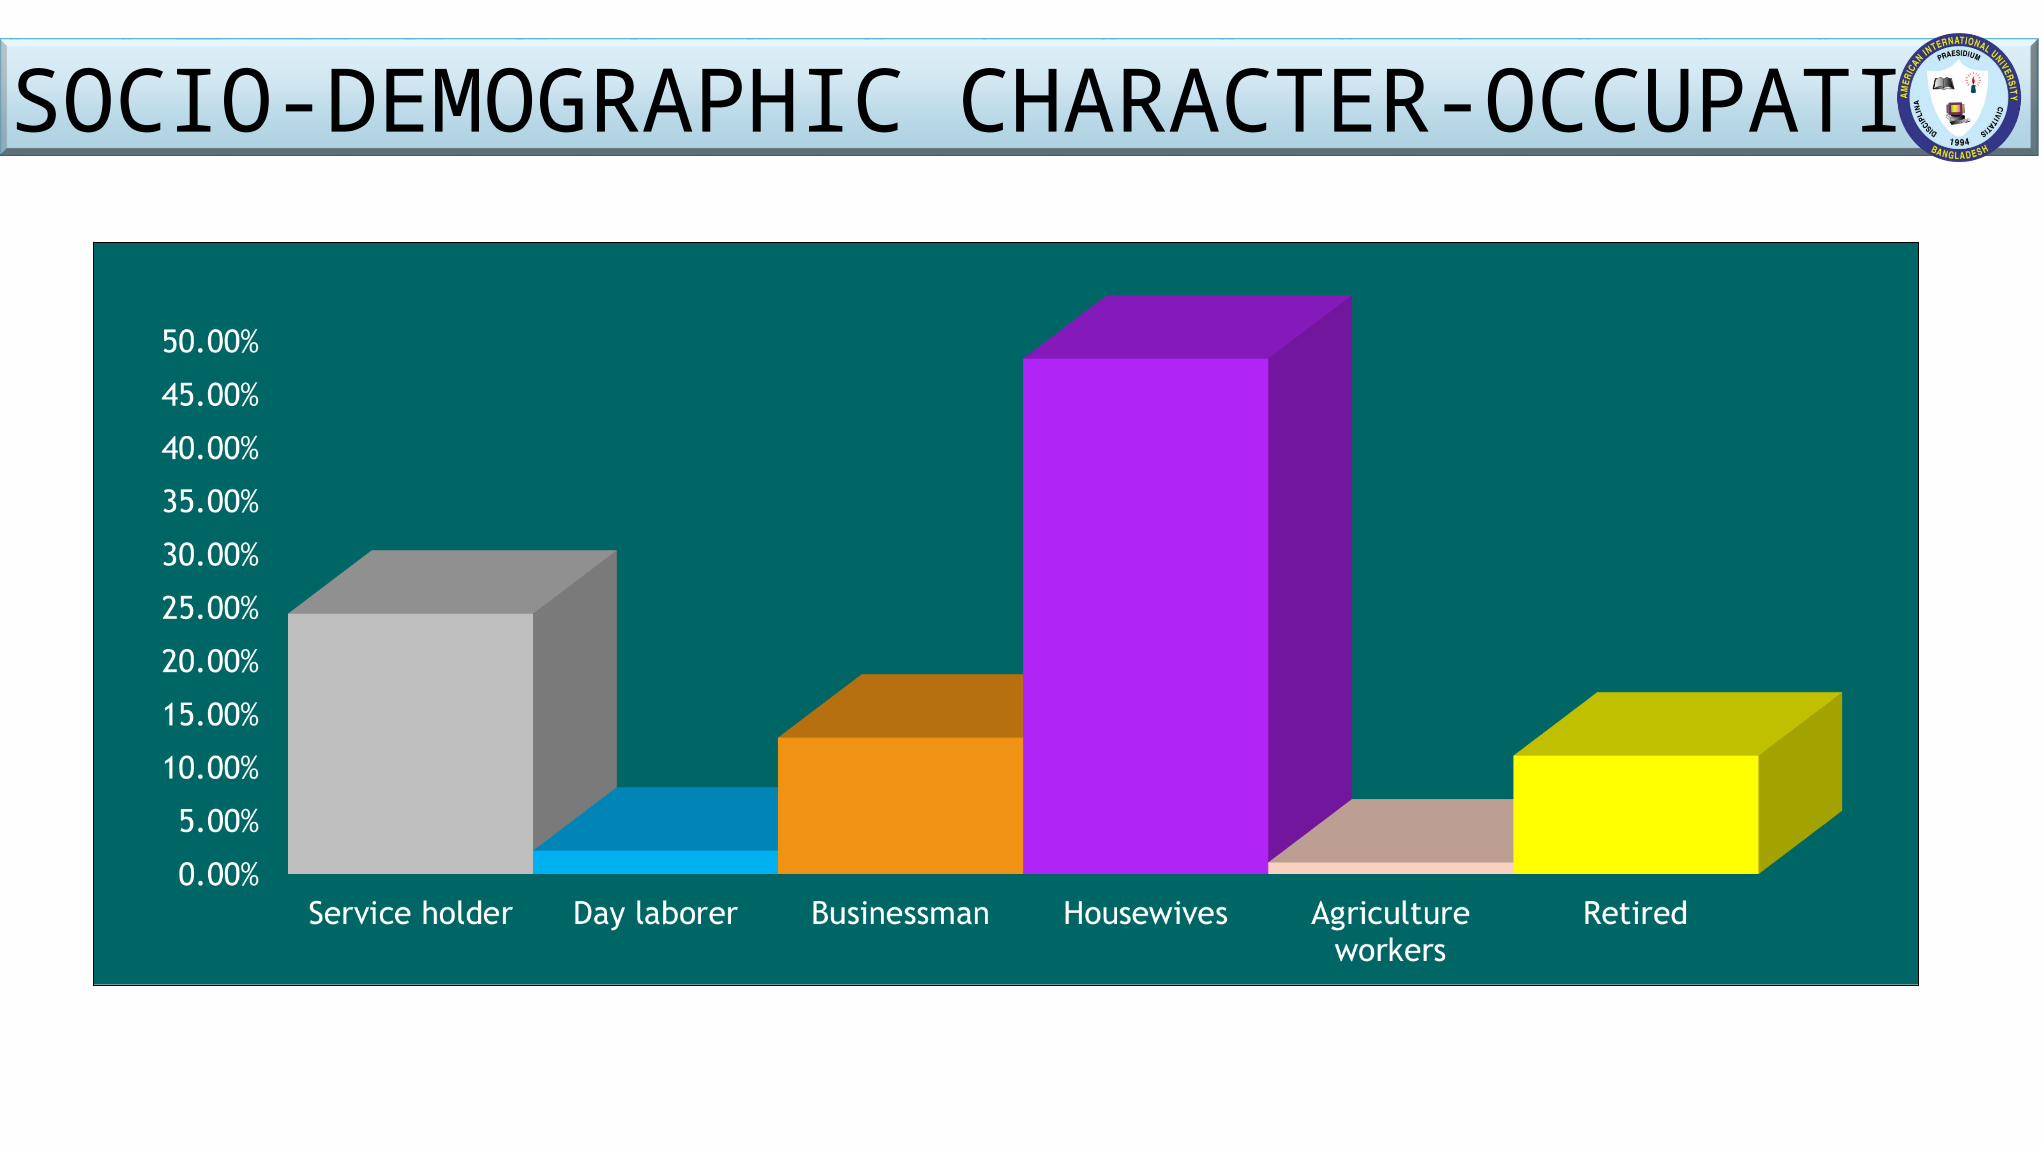
SOCIO-DEMOGRAPHIC CHARACTER-OCCUPATION
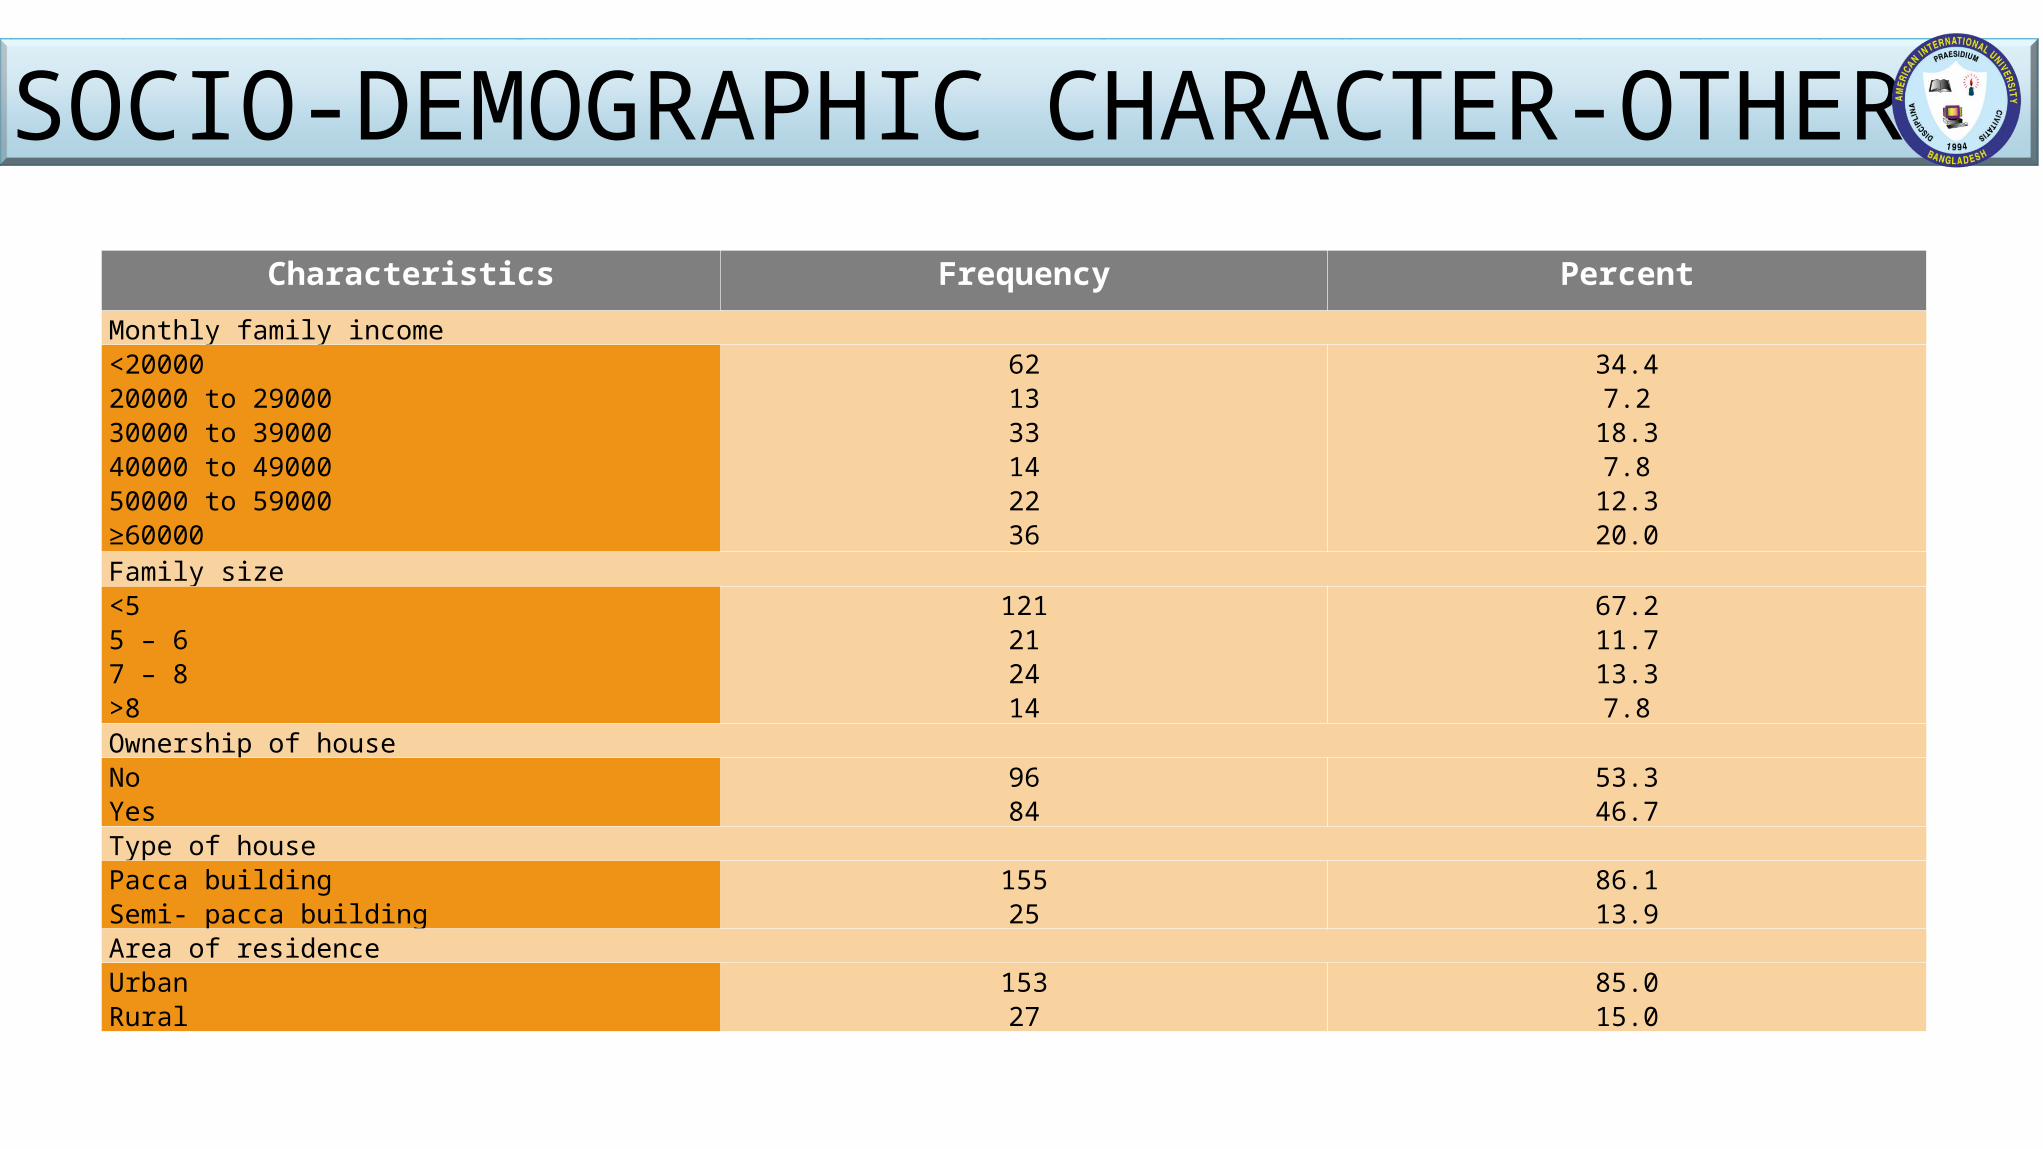
Characteristics Frequency PercentMonthly family income<2000020000 to 2900030000 to 3900040000 to 4900050000 to 59000≥60000
621333142236
34.47.2
18.37.8
12.320.0
Family size <55 – 67 – 8>8
121212414
67.211.713.37.8
Ownership of houseNoYes
9684
53.346.7
Type of housePacca buildingSemi- pacca building
15525
86.113.9
Area of residenceUrbanRural
15327
85.015.0
SOCIO-DEMOGRAPHIC CHARACTER-OTHERS
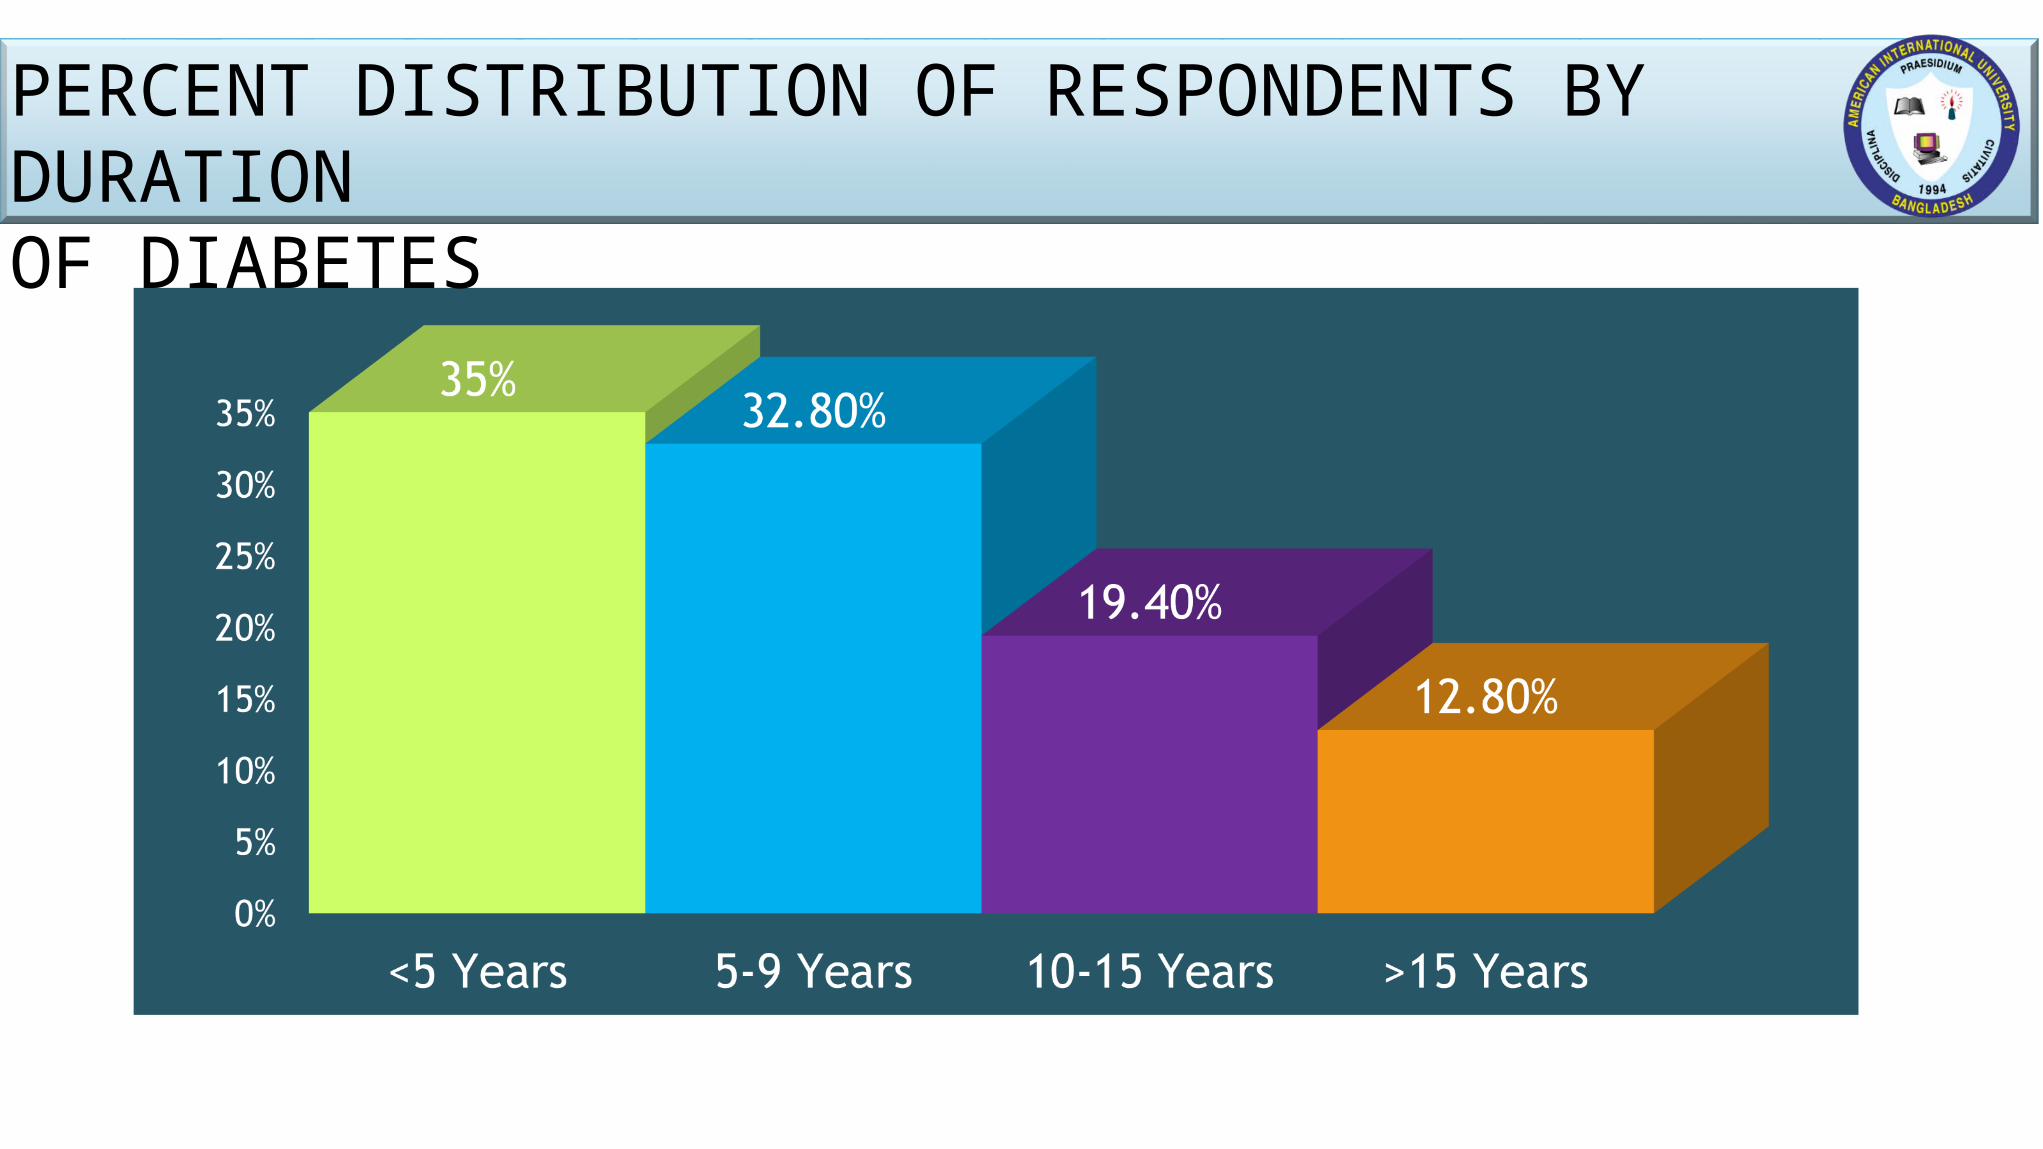
PERCENT DISTRIBUTION OF RESPONDENTS BY DURATION OF DIABETES
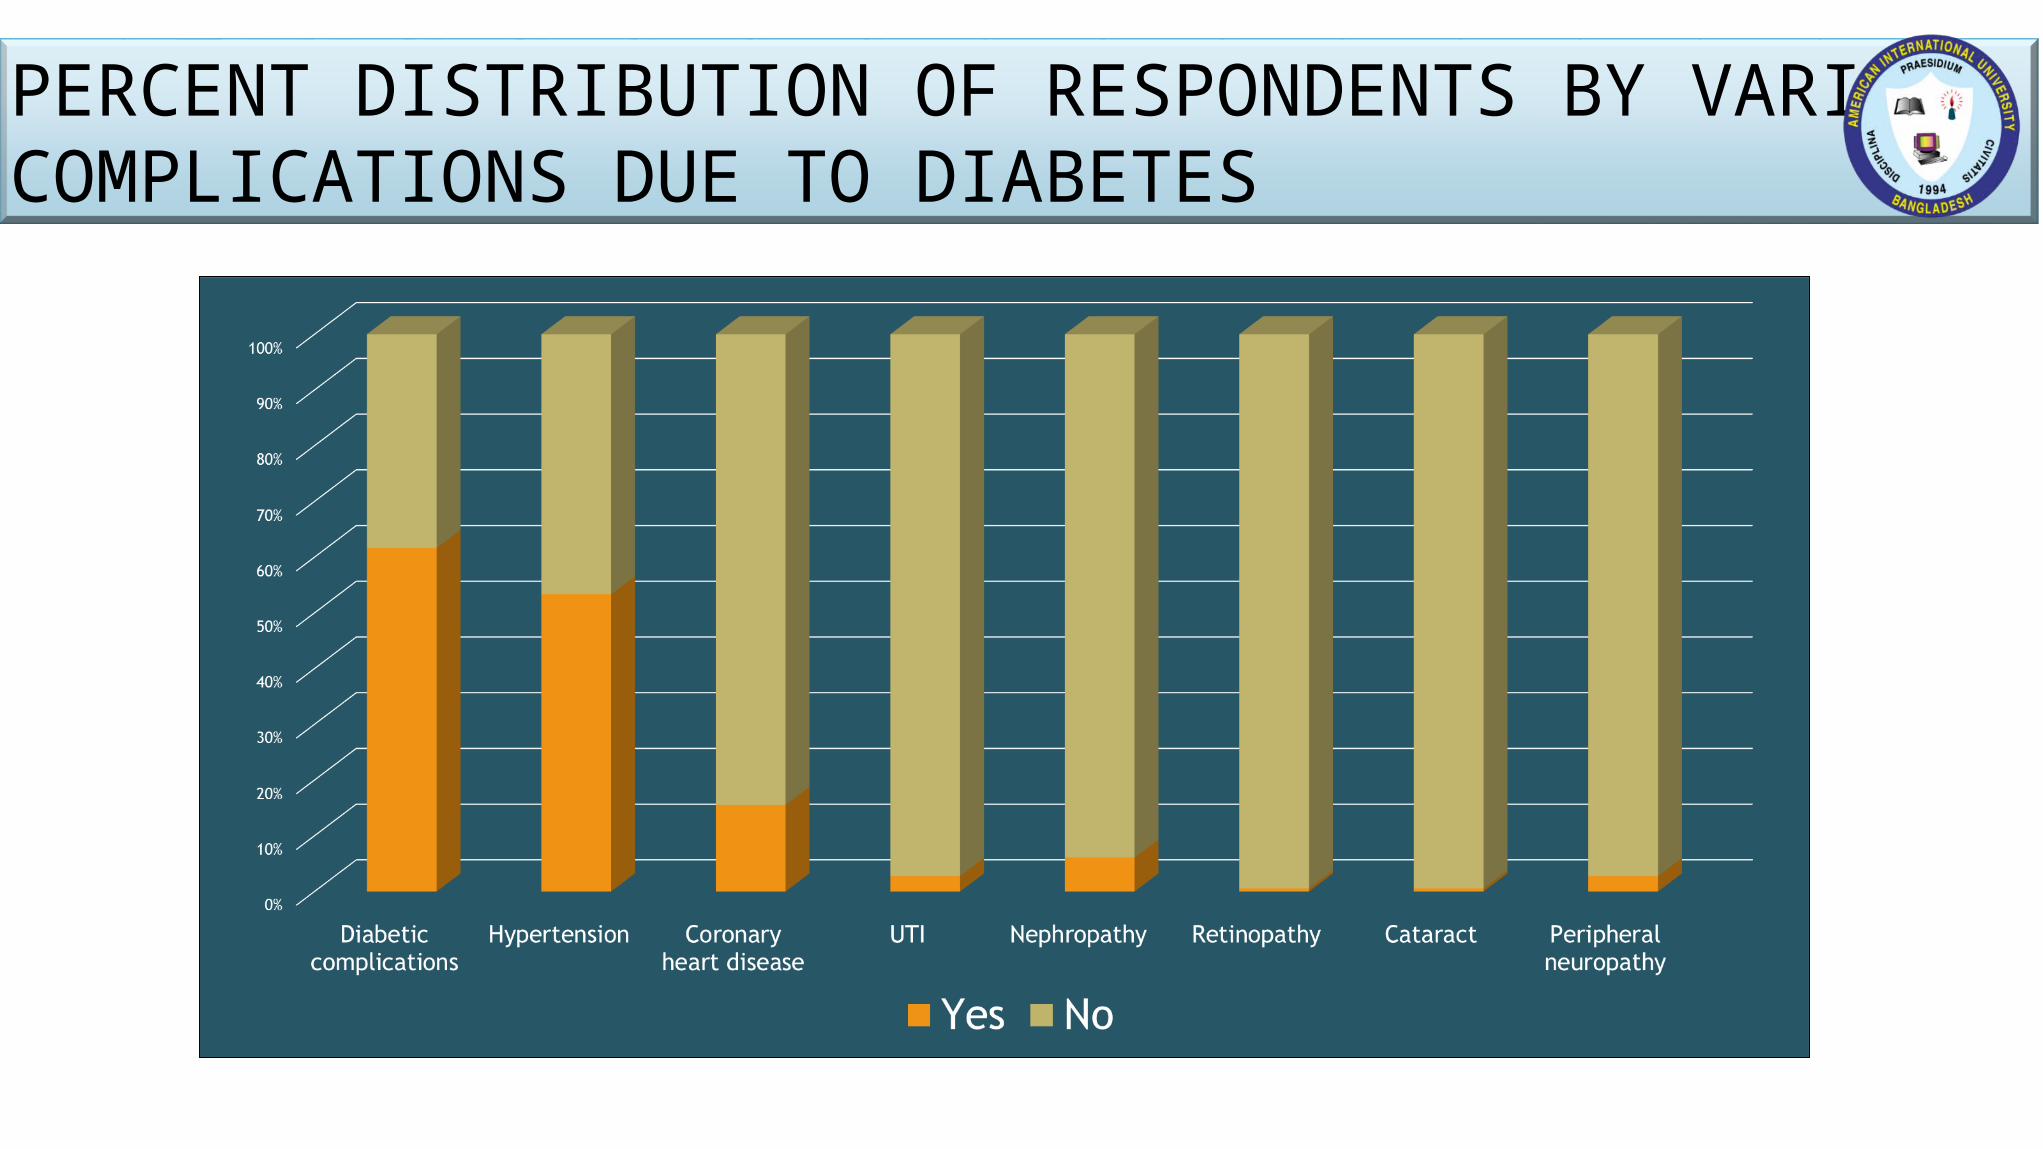
PERCENT DISTRIBUTION OF RESPONDENTS BY VARIOUS COMPLICATIONS DUE TO DIABETES
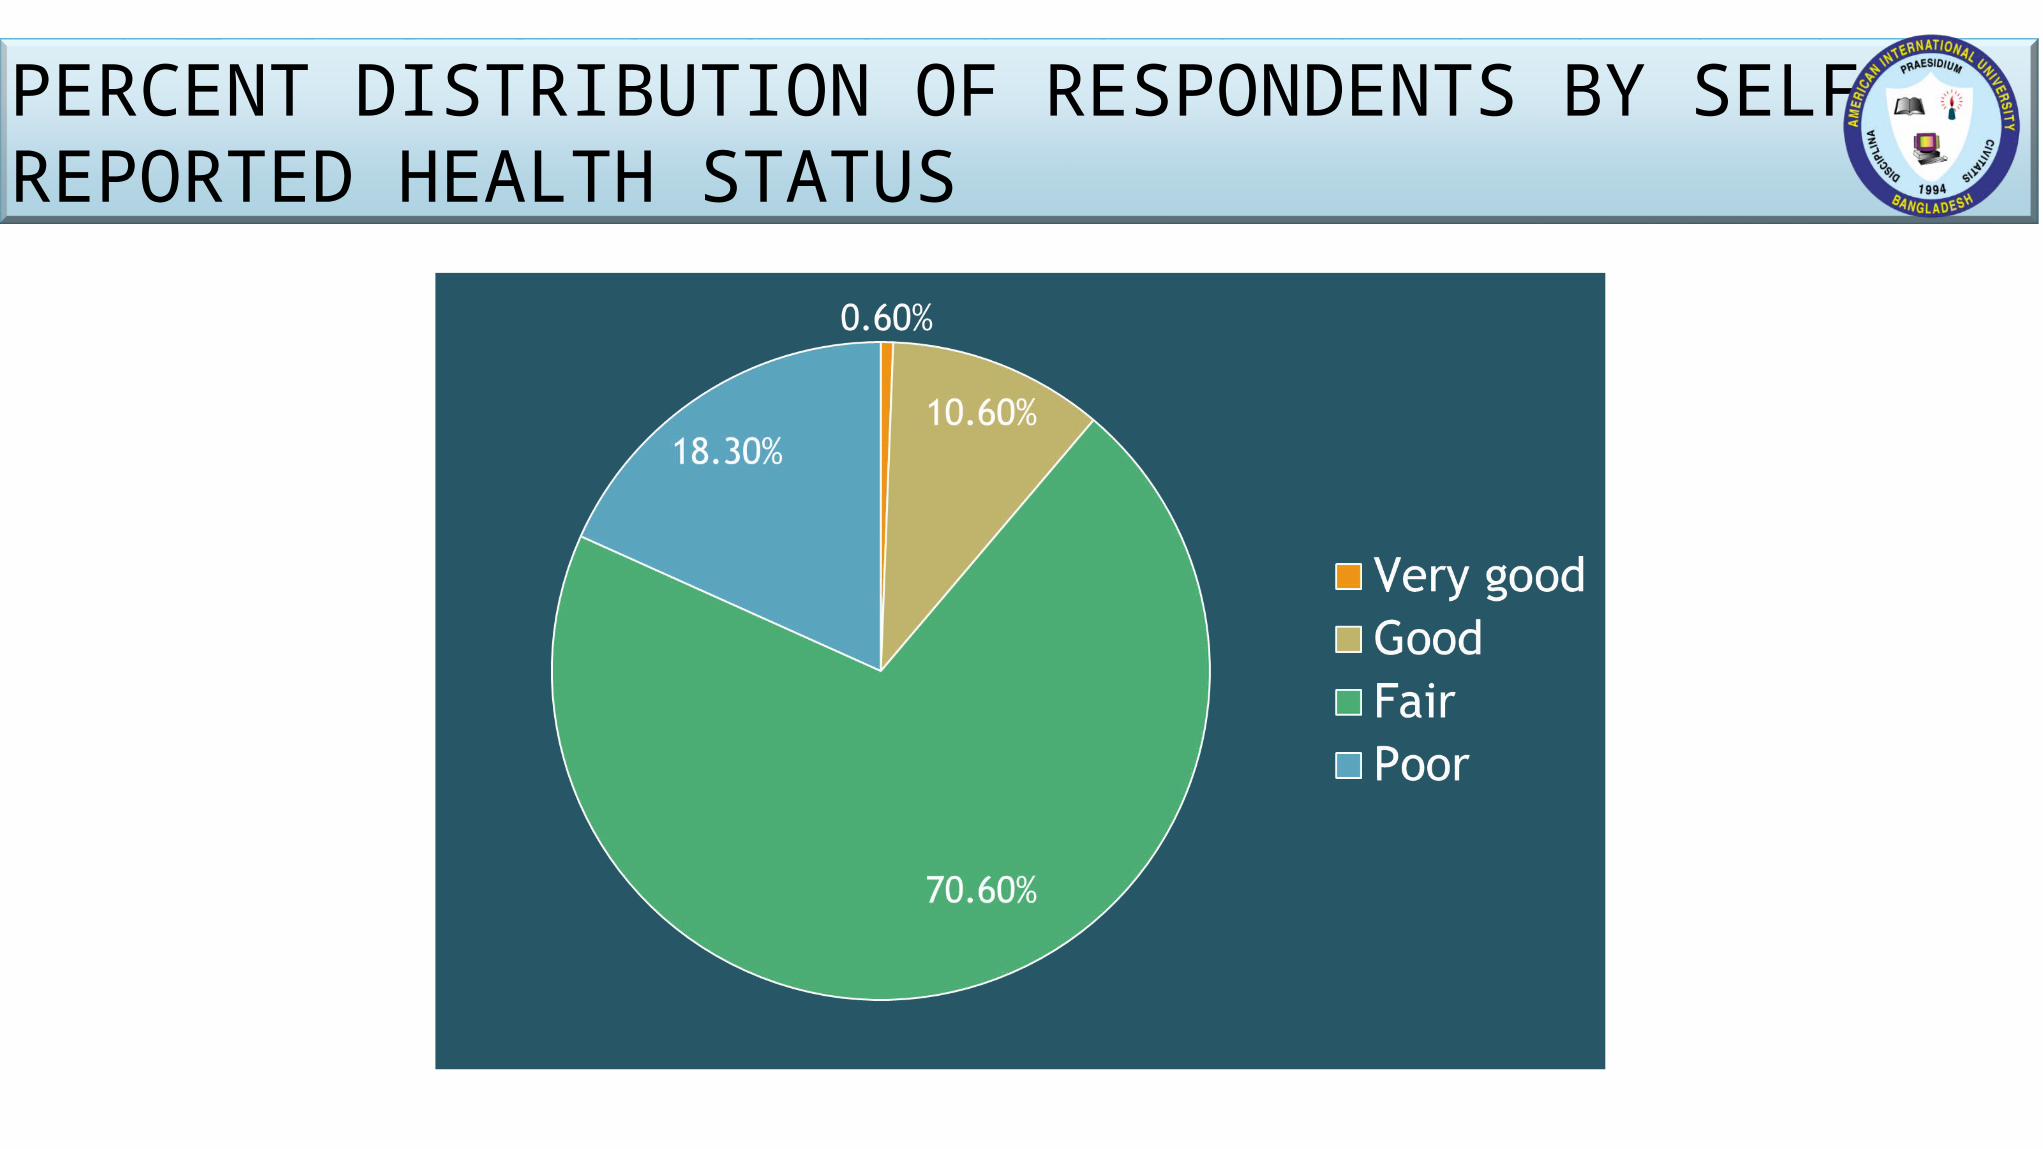
PERCENT DISTRIBUTION OF RESPONDENTS BY SELF REPORTED HEALTH STATUS
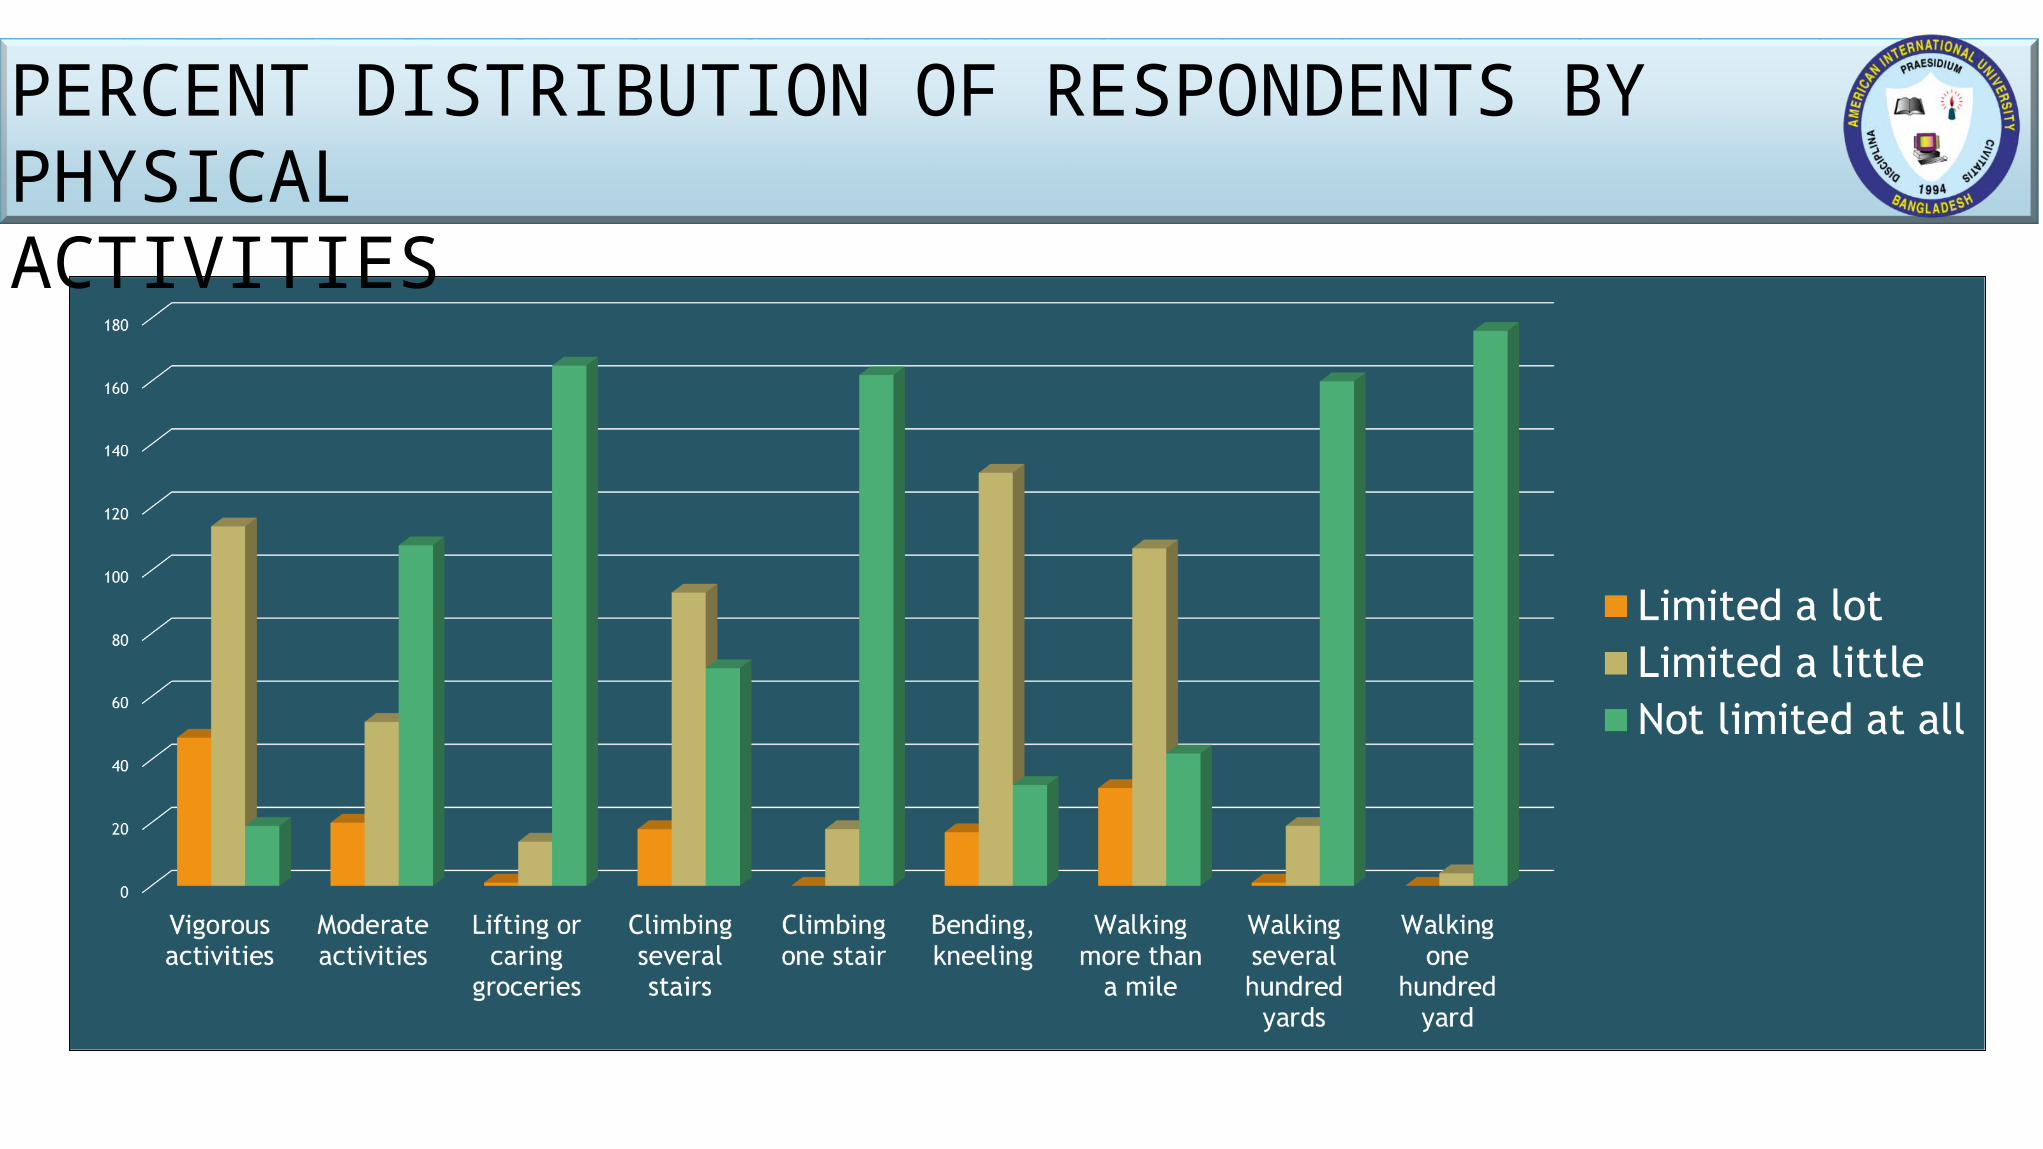
PERCENT DISTRIBUTION OF RESPONDENTS BY PHYSICALACTIVITIES
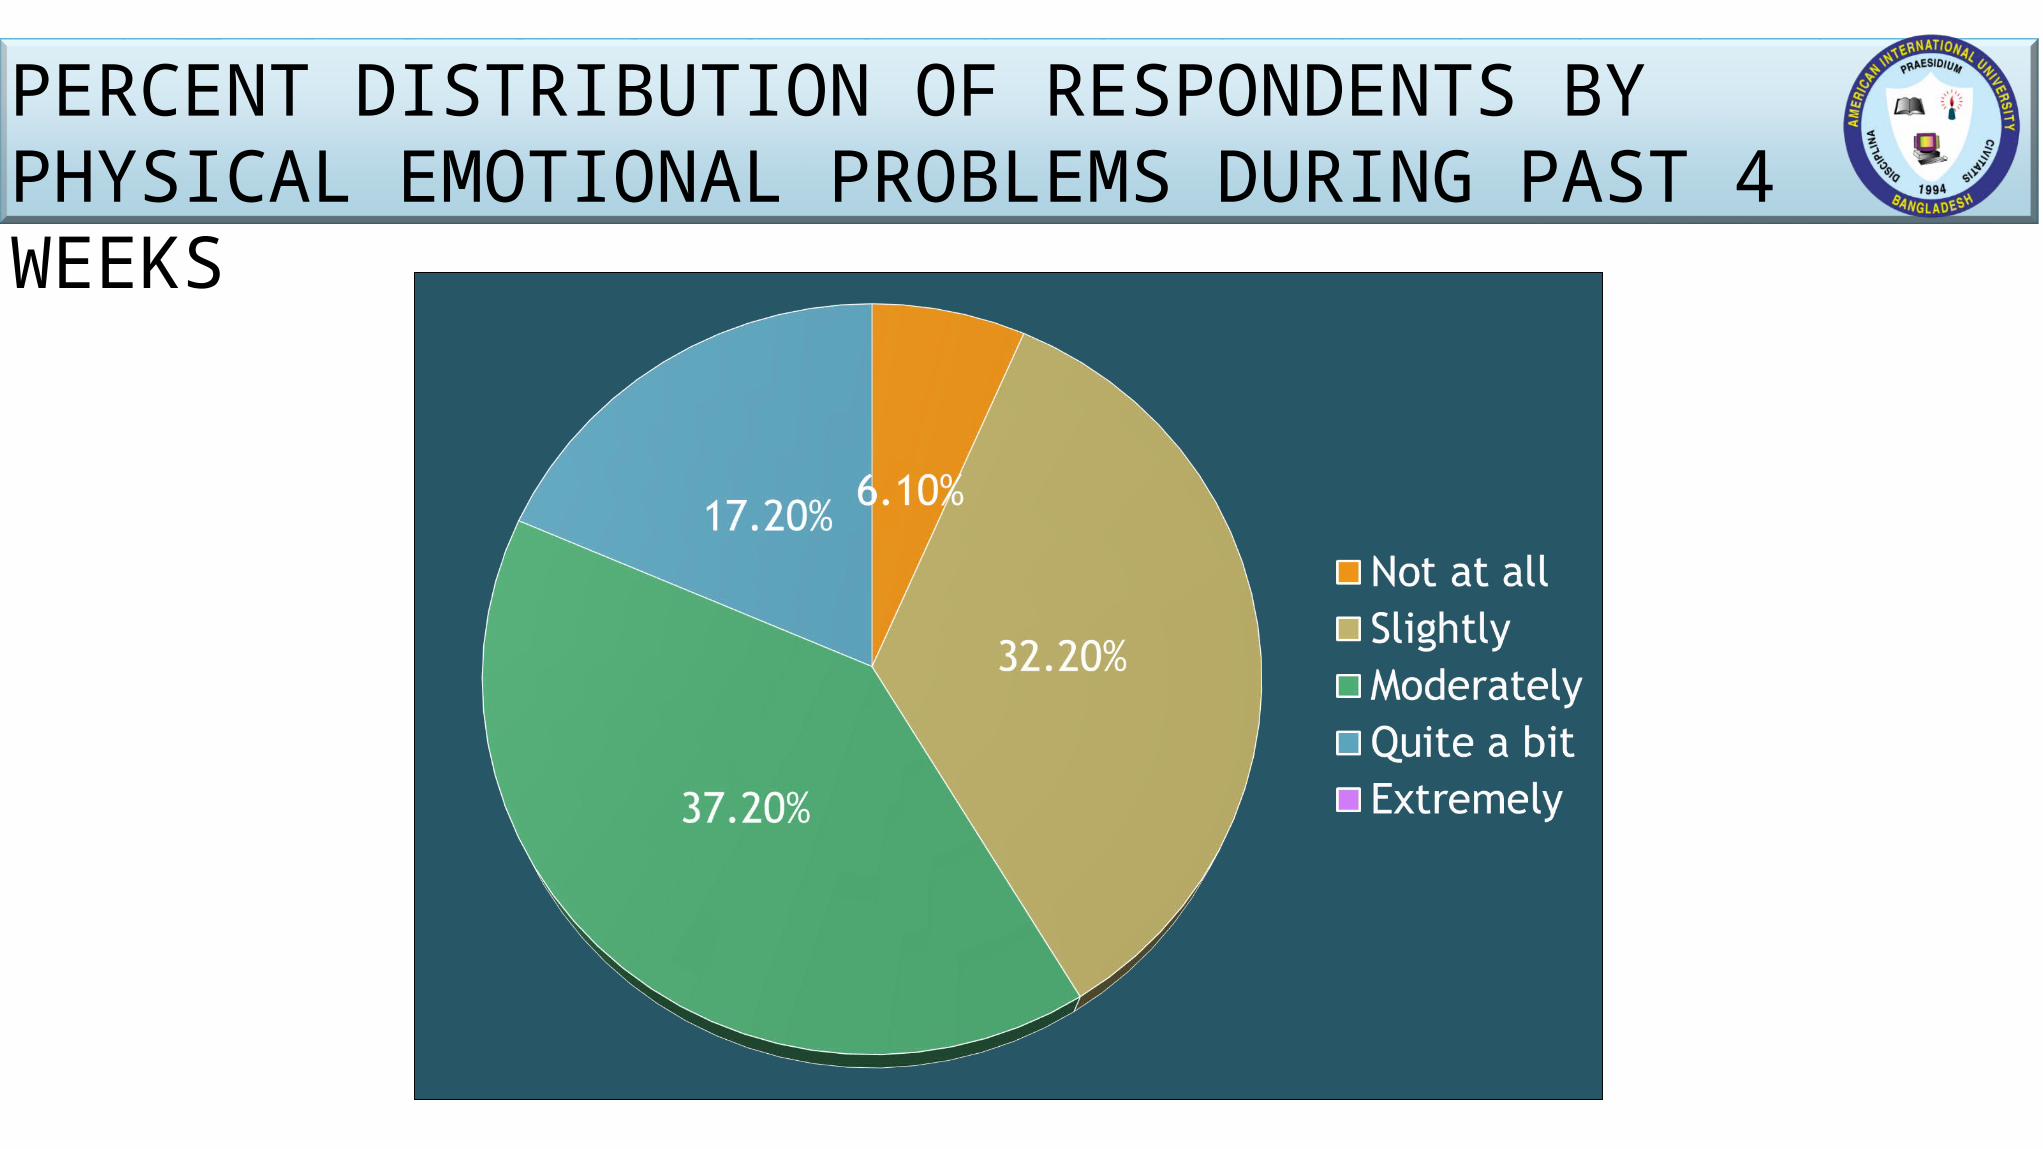
PERCENT DISTRIBUTION OF RESPONDENTS BY PHYSICAL EMOTIONAL PROBLEMS DURING PAST 4 WEEKS
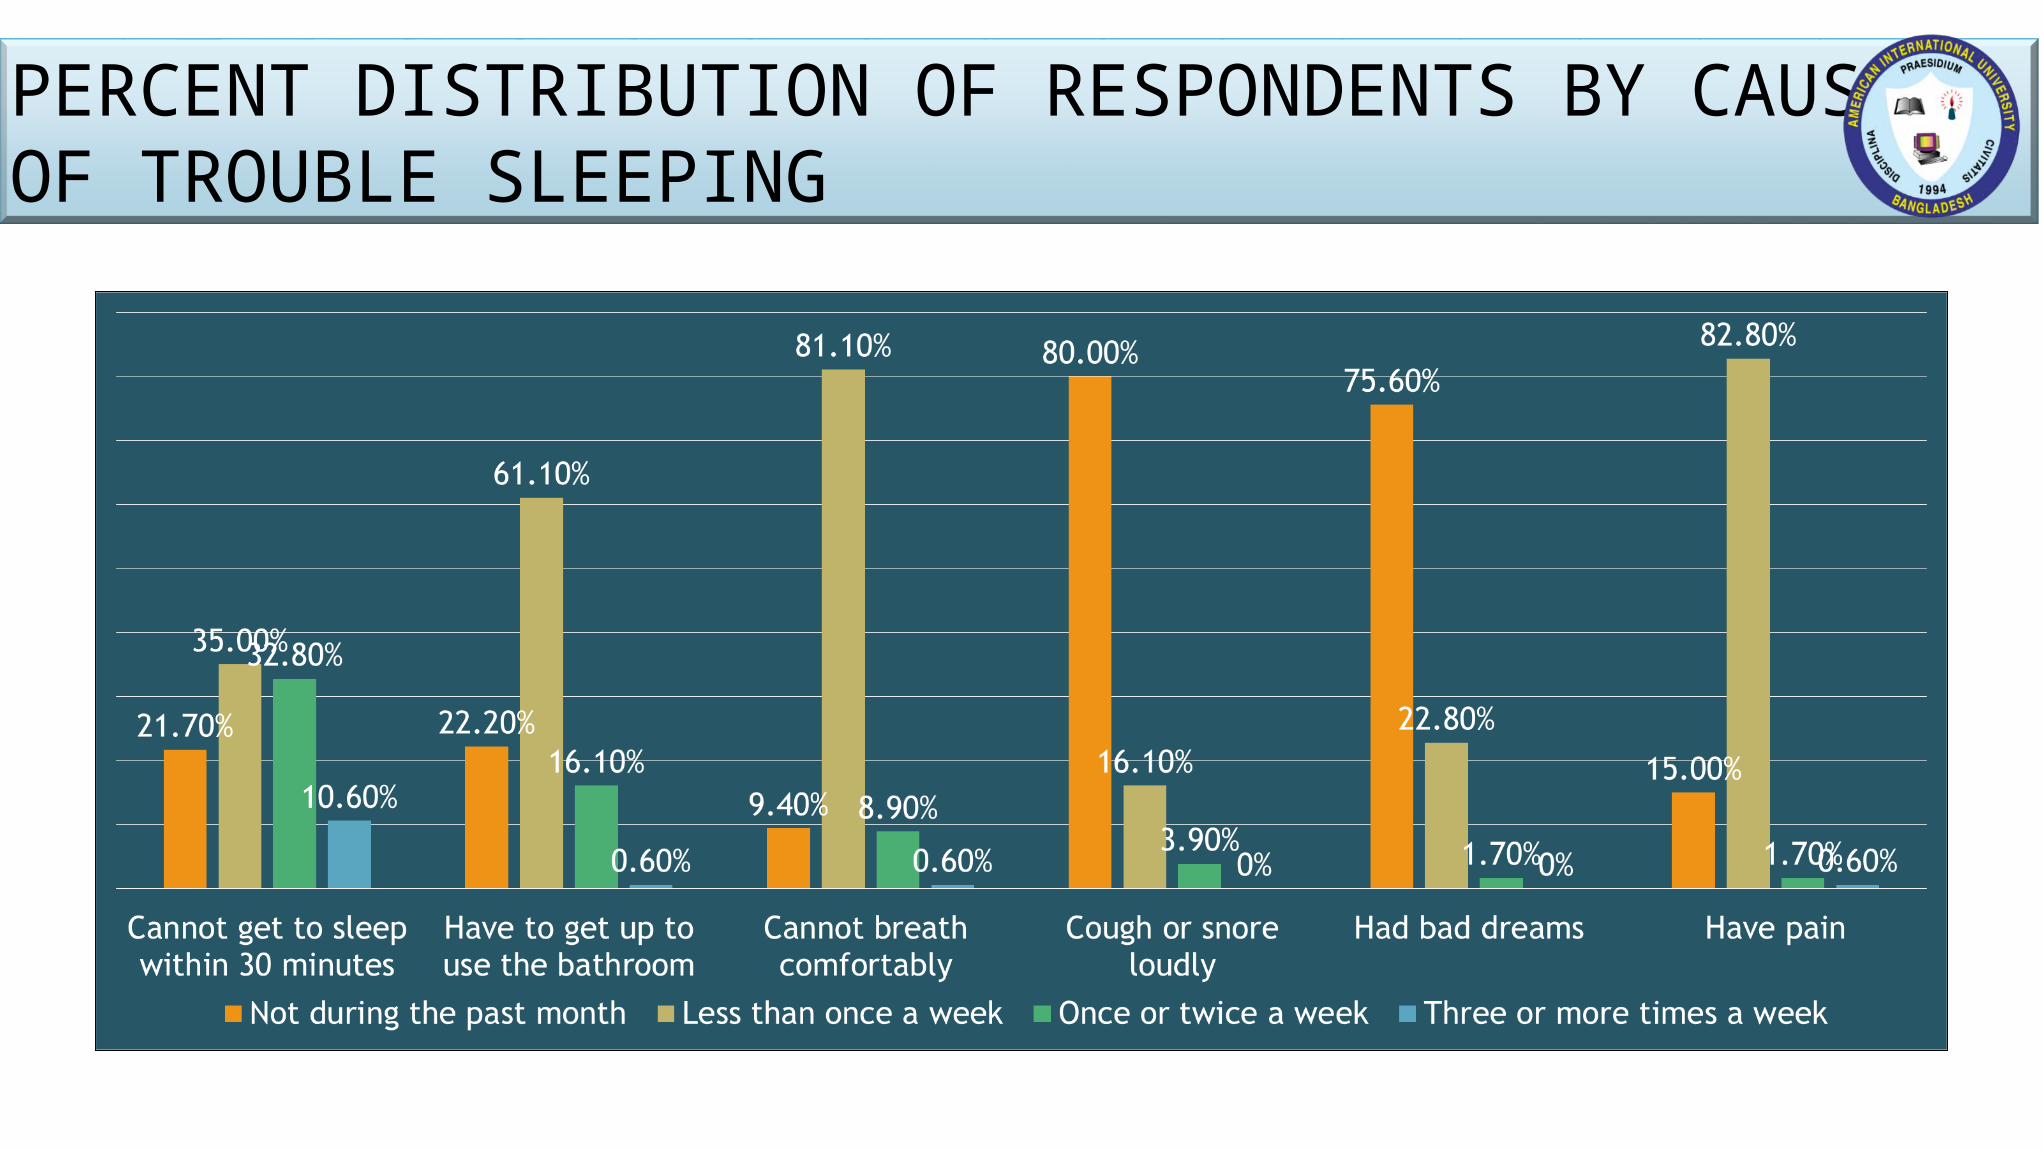
PERCENT DISTRIBUTION OF RESPONDENTS BY CAUSES OF TROUBLE SLEEPING
Characteristics Possible maximum score
Mean (SD) Median Range
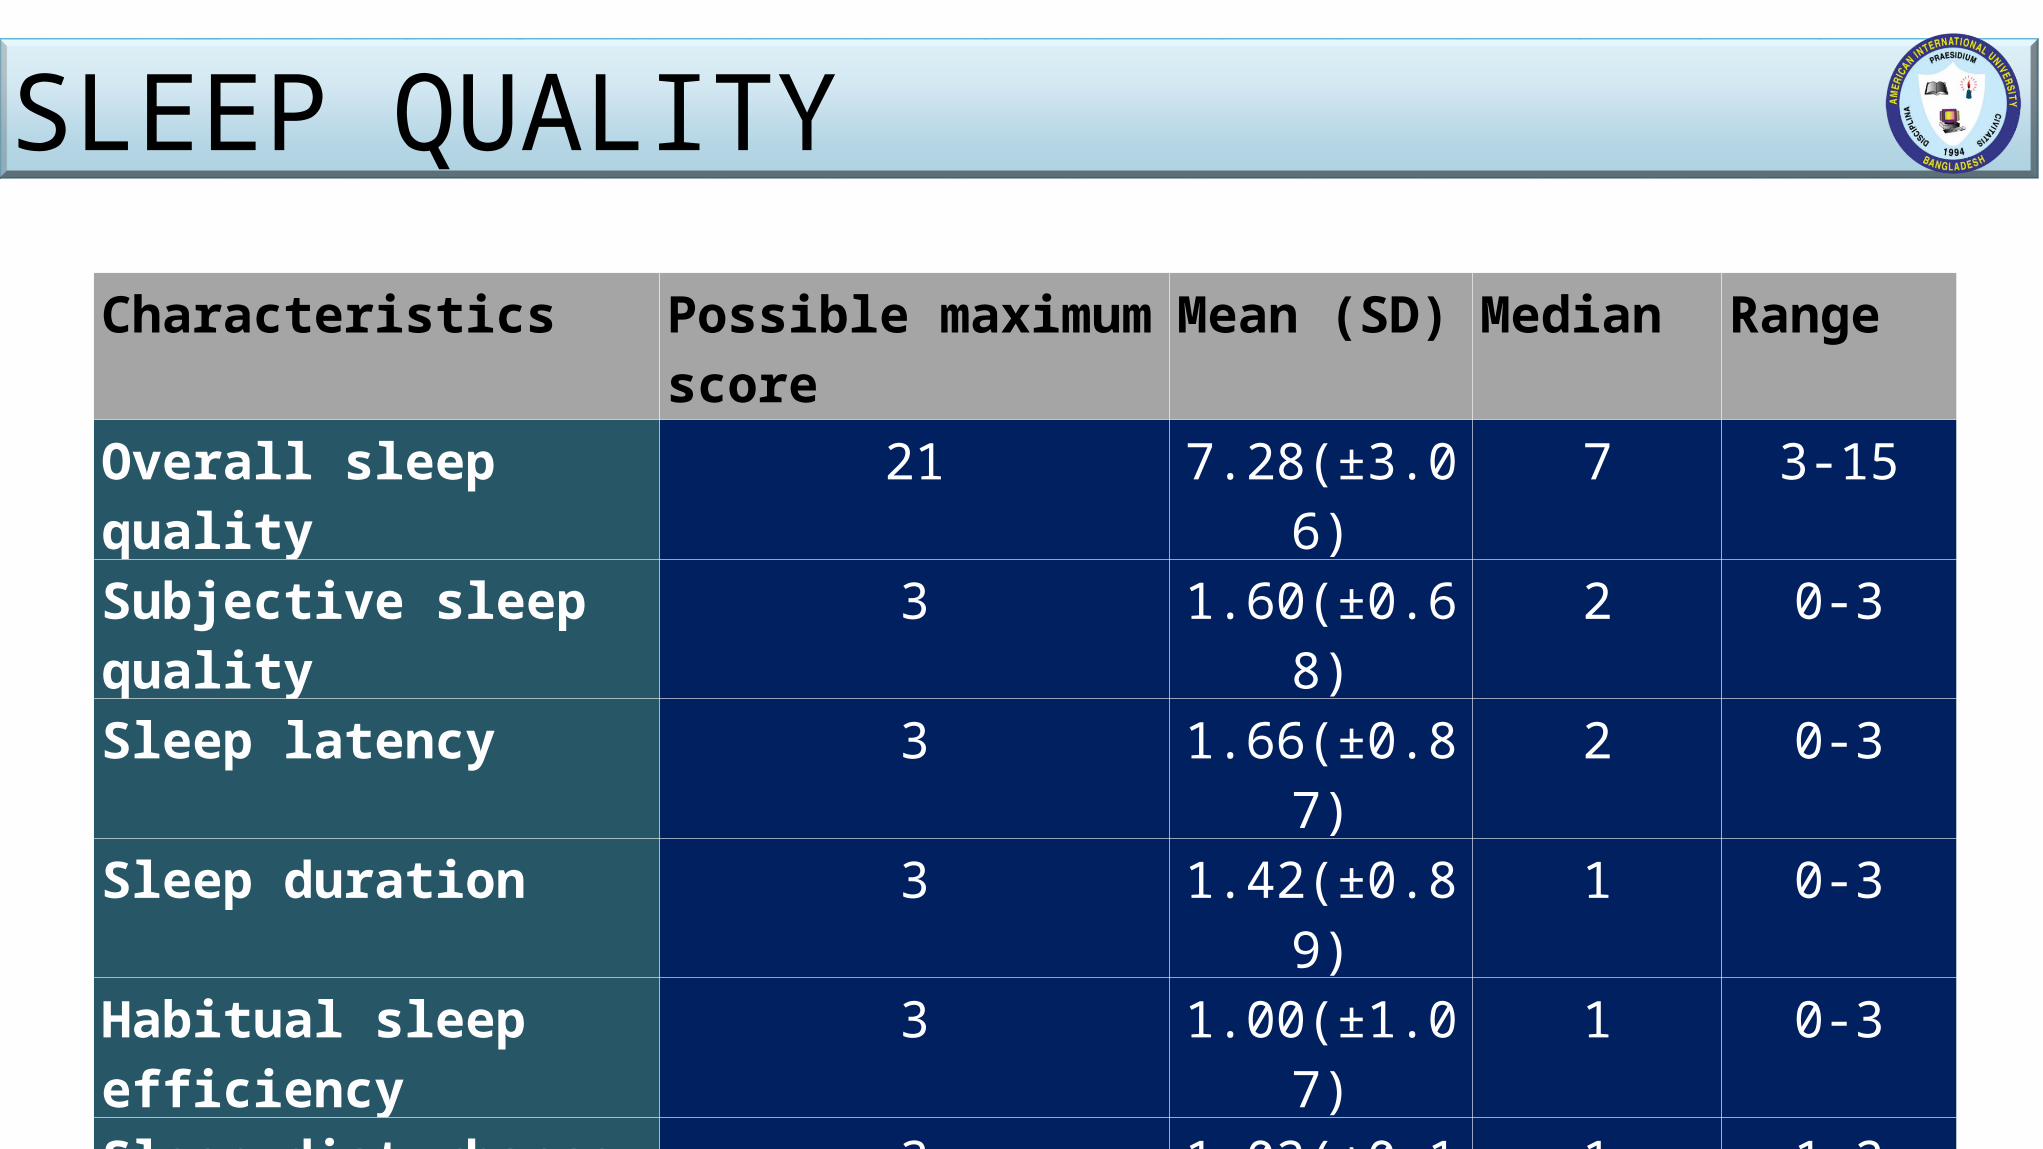
Overall sleep quality 21 7.28(±3.06) 7 3-15Subjective sleep quality 3 1.60(±0.68) 2 0-3Sleep latency 3 1.66(±0.87) 2 0-3Sleep duration 3 1.42(±0.89) 1 0-3Habitual sleep efficiency 3 1.00(±1.07) 1 0-3
Sleep disturbance 3 1.02(±0.14) 1 1-2Use of sleep medication 3 0.93(±1.01) 1 0-3Day time dysfunction 3 1.06(±0.46) 1 0-3
SLEEP QUALITY
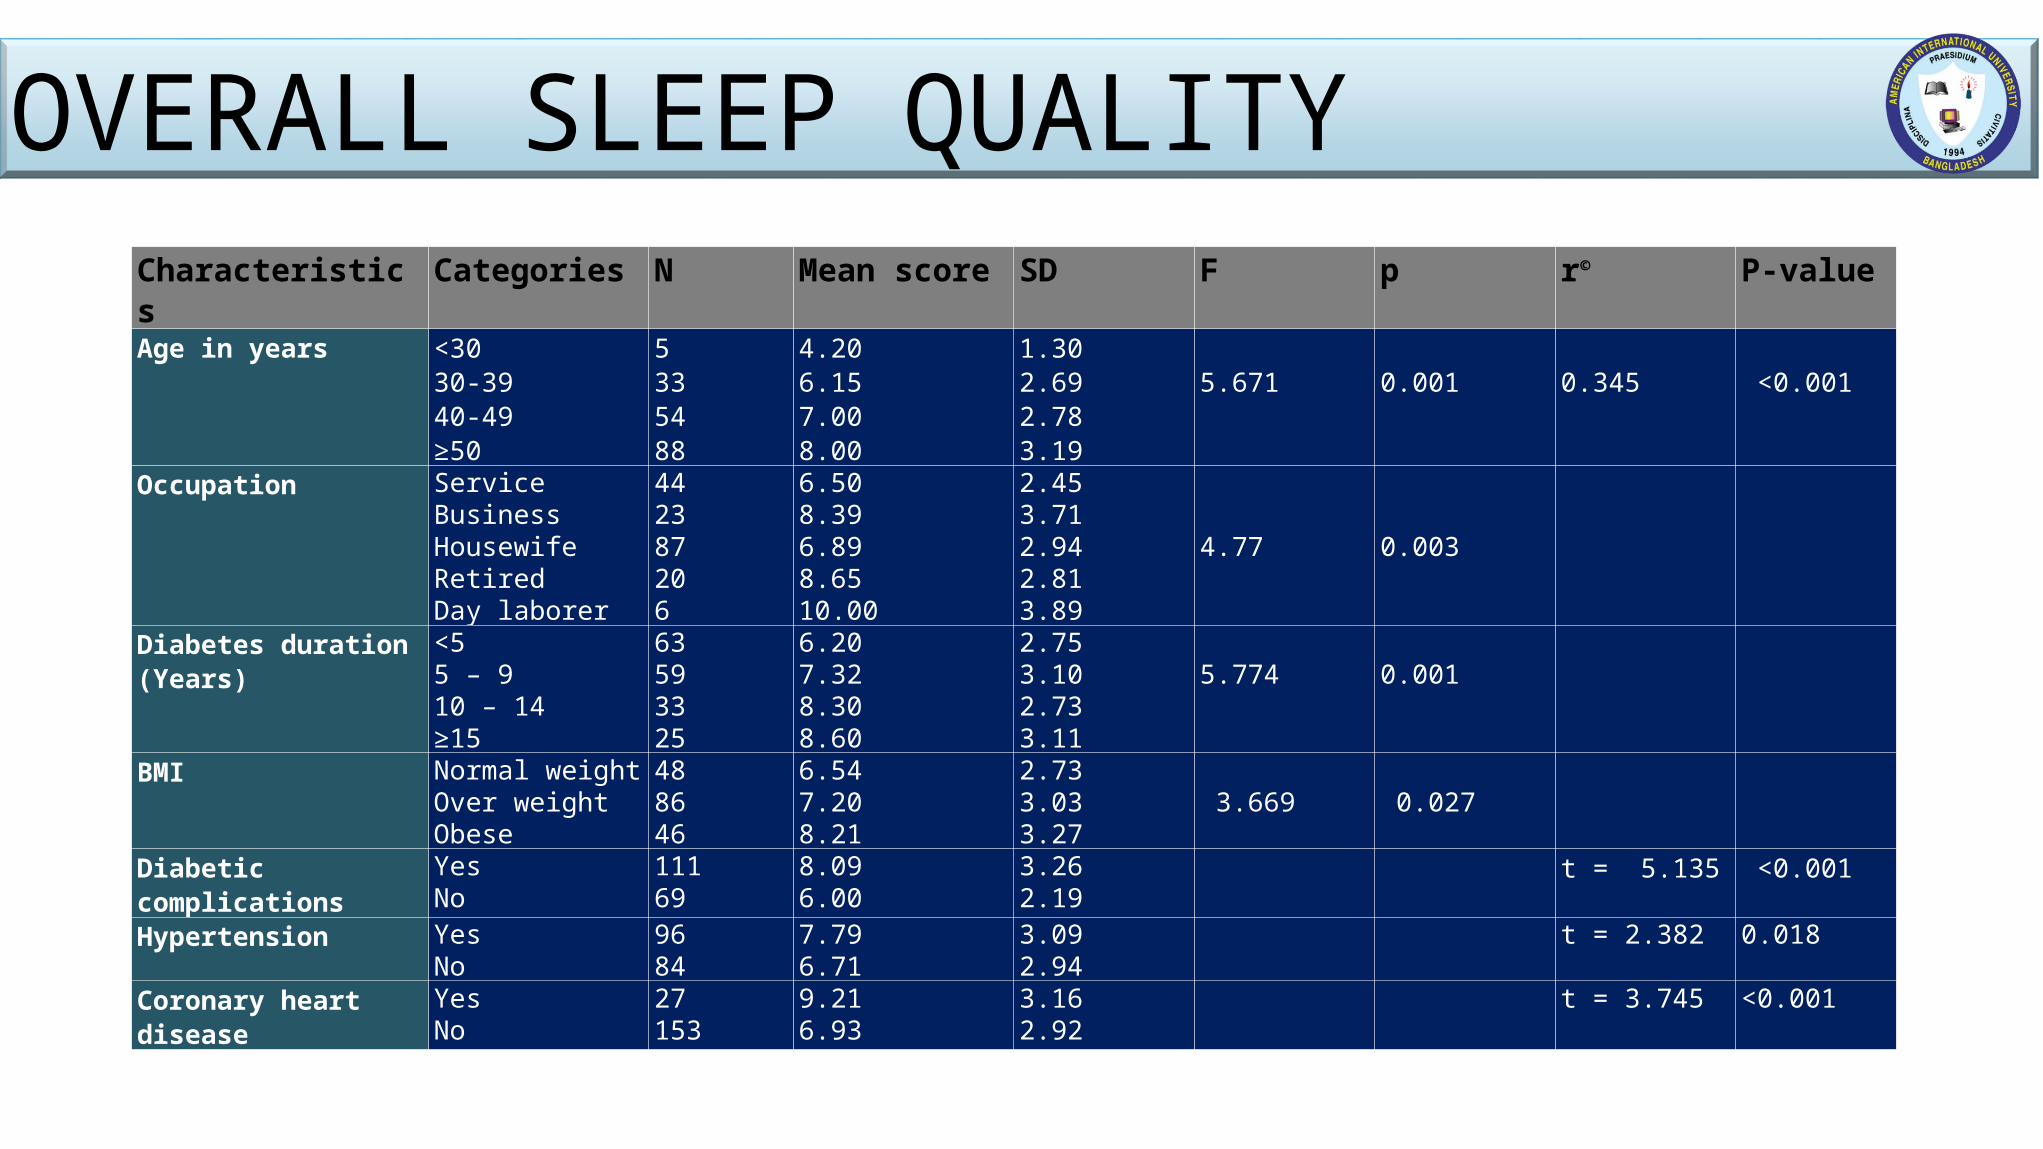
Characteristics Categories N Mean score SD F p r©
P-value
Age in years <30 30-39 40-49 ≥50
5335488
4.206.157.008.00
1.302.692.783.19
5.671
0.001
0.345
<0.001
Occupation ServiceBusinessHousewifeRetiredDay laborer
442387206
6.508.396.898.6510.00
2.453.712.942.813.89
4.77
0.003
Diabetes duration (Years)
<5 5 – 9 10 – 14 ≥15
63593325
6.207.328.308.60
2.753.102.733.11
5.774
0.001
BMI Normal weightOver weightObese
488646
6.547.208.21
2.733.03 3.27
3.669
0.027
Diabetic complications YesNo
11169
8.096.00
3.262.19
t = 5.135 <0.001
Hypertension YesNo
9684
7.796.71
3.092.94
t = 2.382 0.018
Coronary heart disease YesNo
27153
9.216.93
3.162.92
t = 3.745 <0.001
OVERALL SLEEP QUALITY
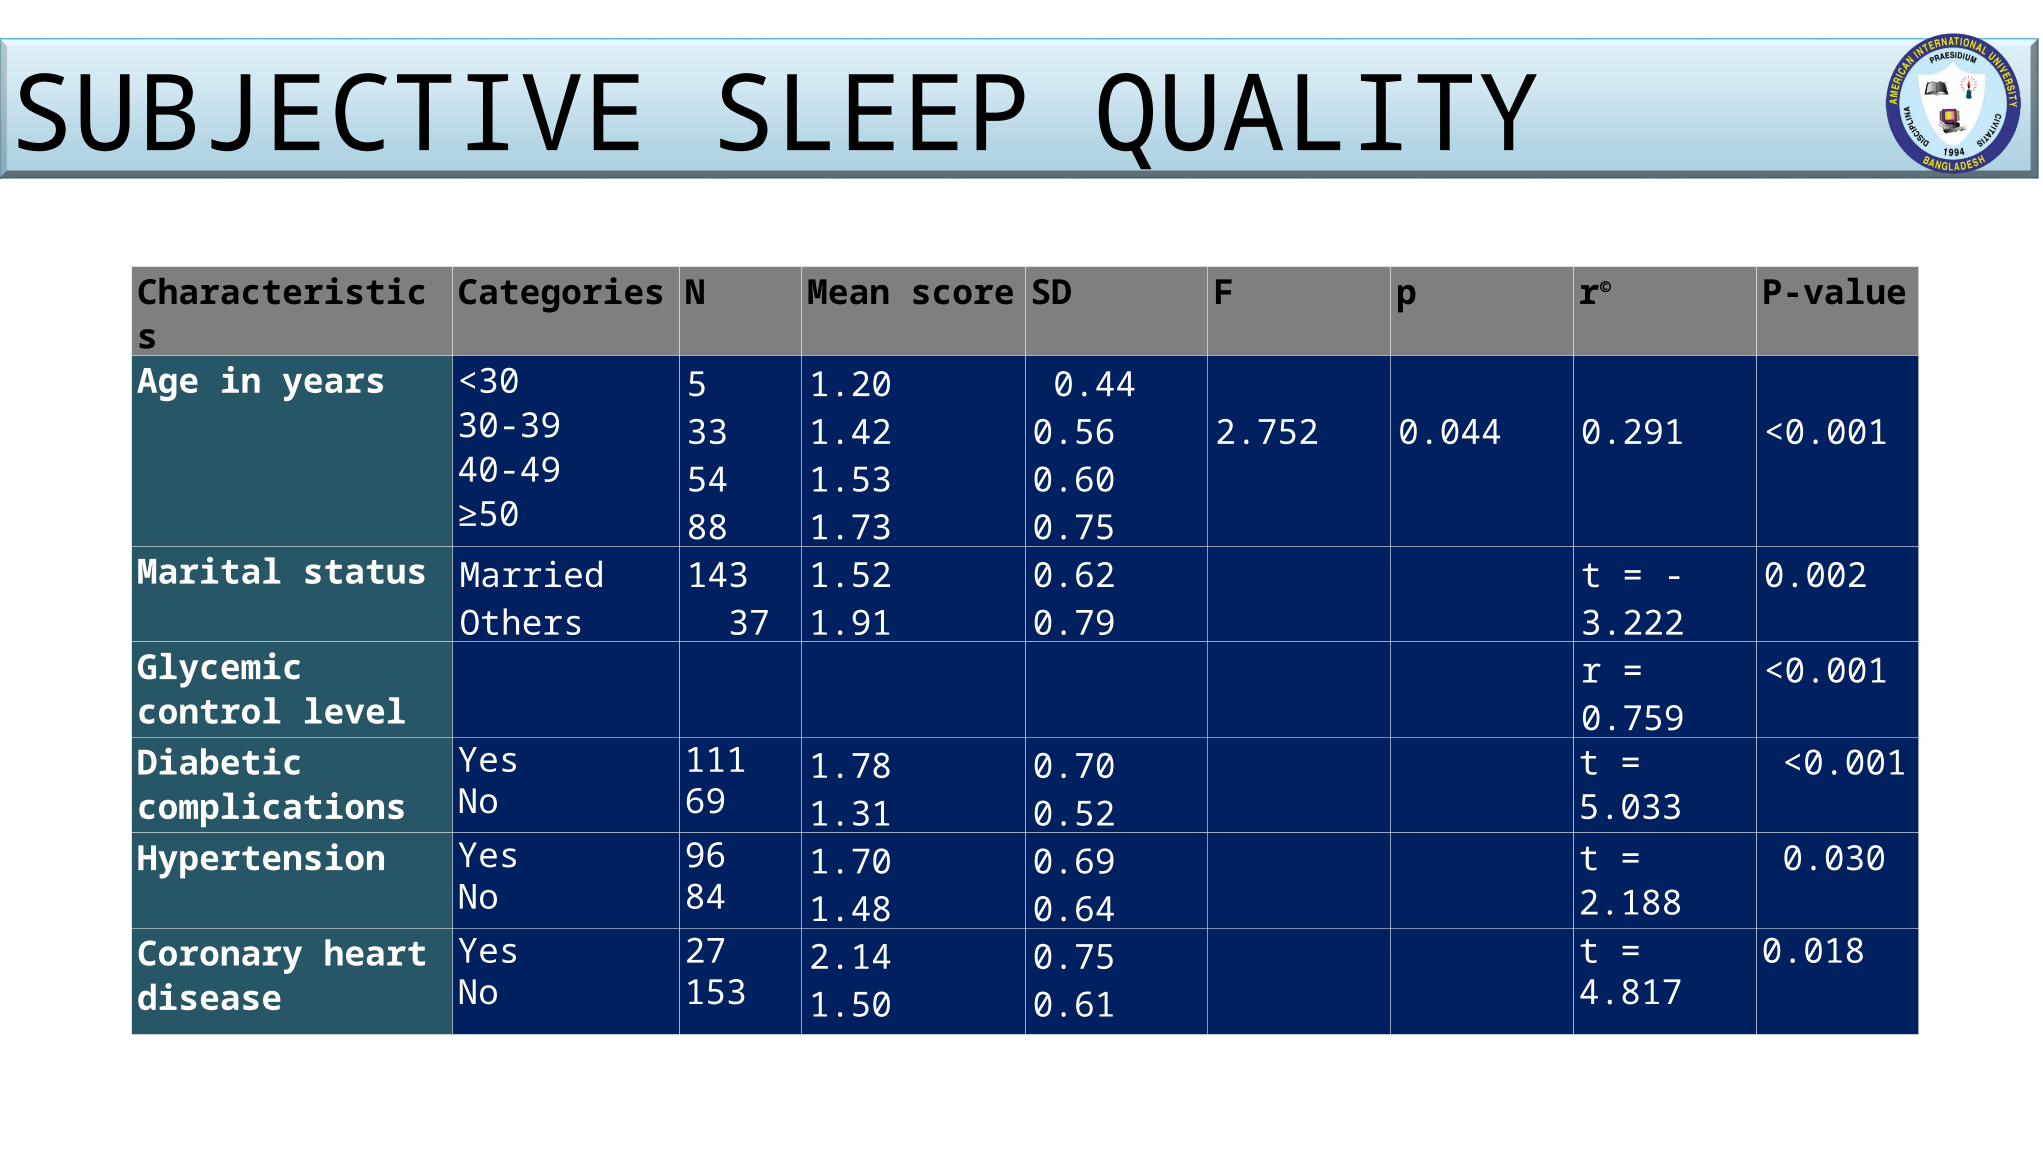
Characteristics Categories N Mean score SD F p r©
P-value
Age in years <30 30-39 40-49 ≥50
5335488
1.201.421.531.73
0.440.560.600.75
2.752
0.044
0.291
<0.001
Marital status MarriedOthers
143 37
1.521.91
0.620.79
t = -3.222 0.002
Glycemic control level
r = 0.759 <0.001
Diabetic complications
YesNo
11169
1.781.31
0.700.52
t = 5.033 <0.001
Hypertension YesNo
9684
1.701.48
0.690.64
t = 2.188 0.030
Coronary heart disease
YesNo
27153
2.141.50
0.750.61
t = 4.817 0.018
SUBJECTIVE SLEEP QUALITY
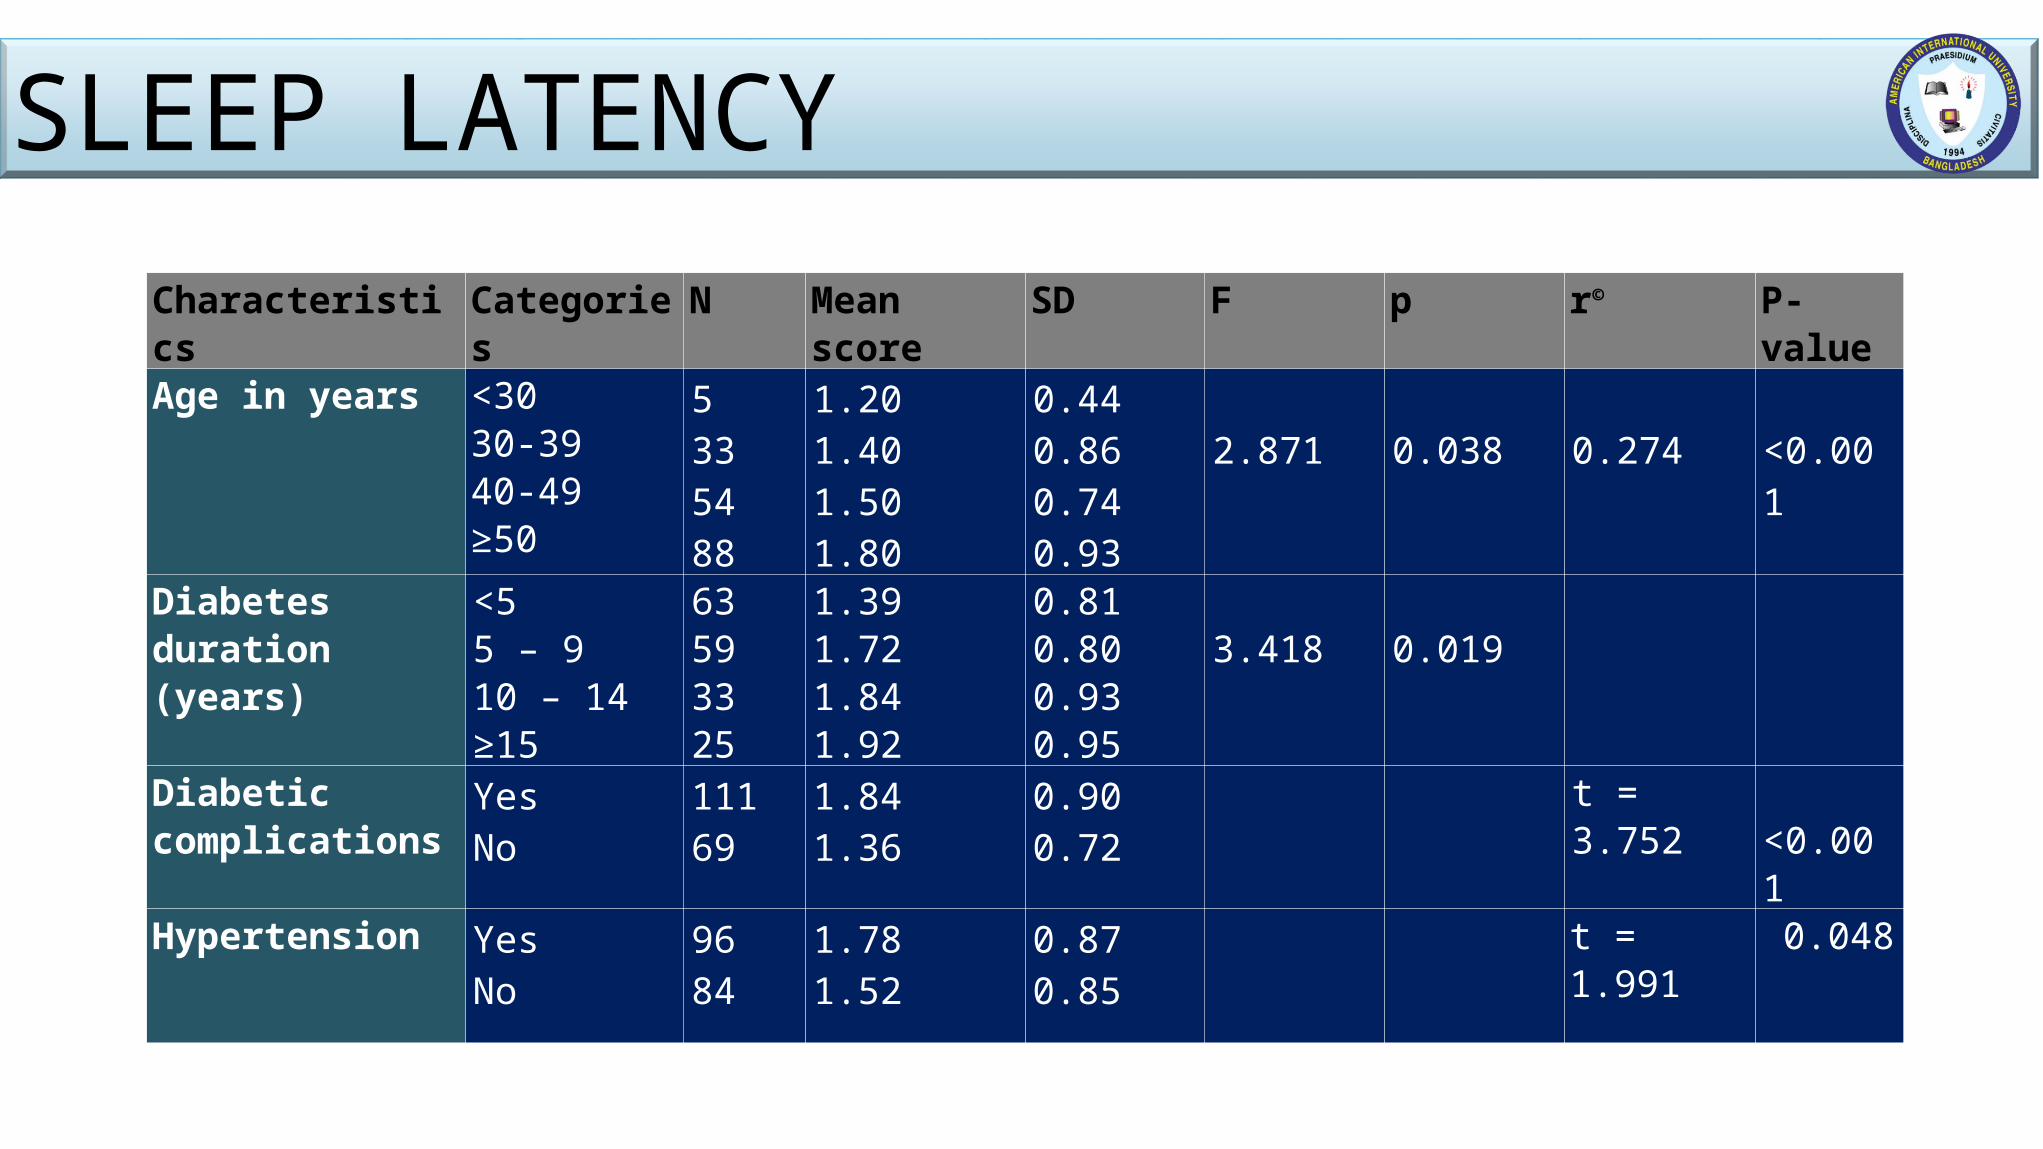
Characteristics Categories N Mean score SD F p r©
P-value
Age in years <30 30-39 40-49 ≥50
5335488
1.201.401.501.80
0.440.860.740.93
2.871
0.038
0.274
<0.001
Diabetes duration (years)
<5 5 – 9 10 – 14 ≥15
63593325
1.391.721.841.92
0.810.800.930.95
3.418
0.019
Diabetic complications
YesNo
11169
1.841.36
0.900.72
t = 3.752 <0.001
Hypertension YesNo
9684
1.781.52
0.870.85
t = 1.991 0.048
SLEEP LATENCY

SOCIO-DEMOGRAPHICAL CHARACTERISTICS AND SLEEP QUALITY
Characteristics Sleep quality Total n(%) χ2 P-valuePoor sleeper Good sleepern(%) n(%)
SexMaleFemale
46(73.0)71(60.7)
17(27.0)46(39.3)
63117
0.098 0.105
Marital statusMarriedOthers
87(60.8)30(81.1)
56(39.2)7(18.9)
14337
0.021 0.022
Educational statusUp to primaryS.S.C to H.S.CGraduates and above
30(66.7)52(66.7)35(61.4)
15(33.3)26(33.3)22(38.6)
457857
0.427 0.789
Area of residenceUrbanRural
103(67.3)14(51.9)
50(32.7)13(48.1)
15327
2.414 0.120
Type of housePaccaSemi-pacca
104(67.1)13(52.0)
51(32.9)12(48.0)
15525
2.157 0.142
DIABETES PROFILE OF THE RESPONDENTS AND SLEEP QUALITY
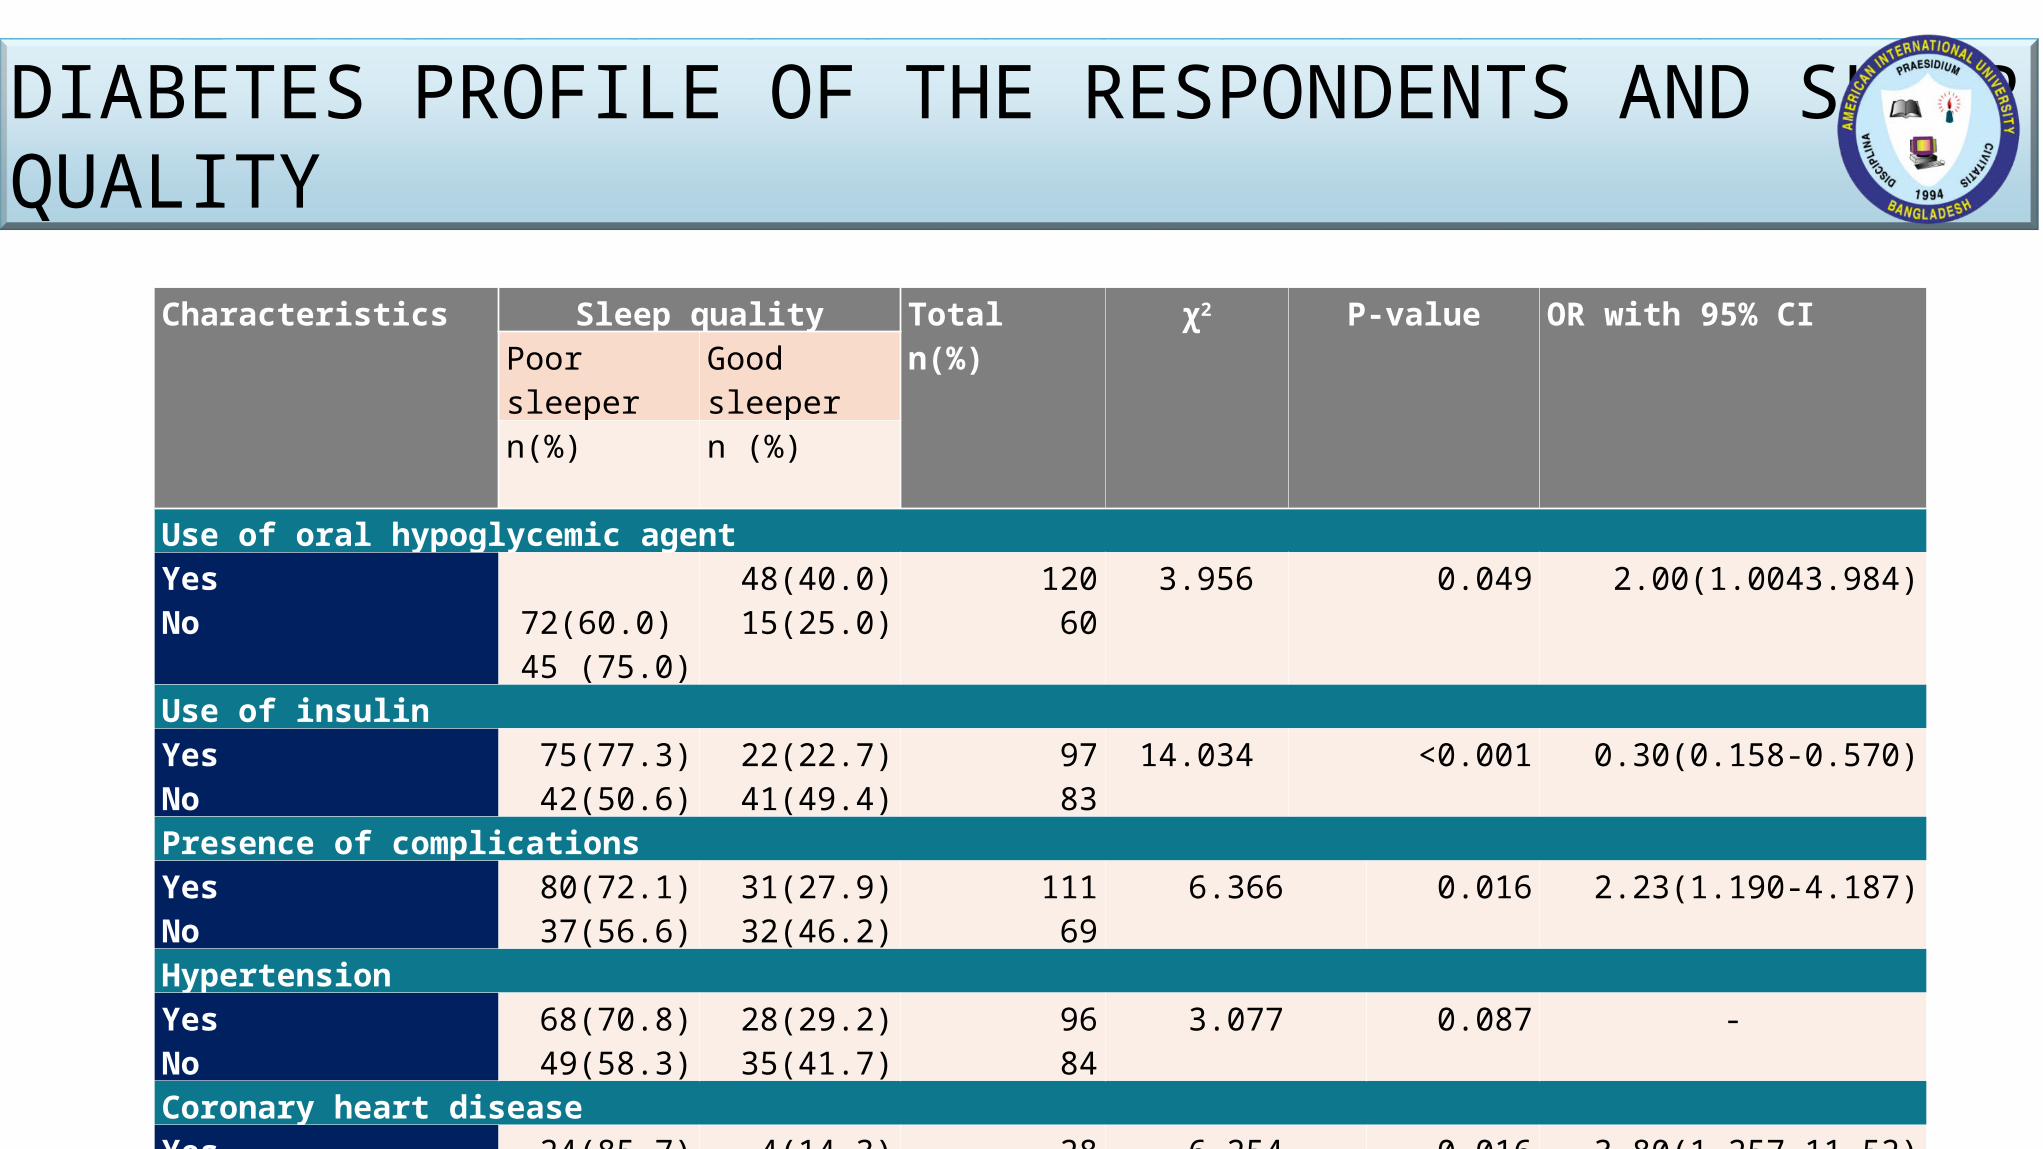
Characteristics Sleep quality Totaln(%)
χ2 P-value OR with 95% CIPoor sleeper Good sleepern(%) n (%)
Use of oral hypoglycemic agentYesNo
72(60.0) 45 (75.0)
48(40.0) 15(25.0)
120 60
3.956 0.049 2.00(1.0043.984)
Use of insulinYesNo
75(77.3)42(50.6)
22(22.7)41(49.4)
9783
14.034 <0.001 0.30(0.158-0.570)
Presence of complicationsYesNo
80(72.1)37(56.6)
31(27.9)32(46.2)
11169
6.366 0.016 2.23(1.190-4.187)
HypertensionYesNo
68(70.8)49(58.3)
28(29.2)35(41.7)
9684
3.077 0.087 -
Coronary heart diseaseYesNo
24(85.7)93(61.2)
4(14.3)59(38.8)
28152
6.254 0.016 3.80(1.257-11.52)
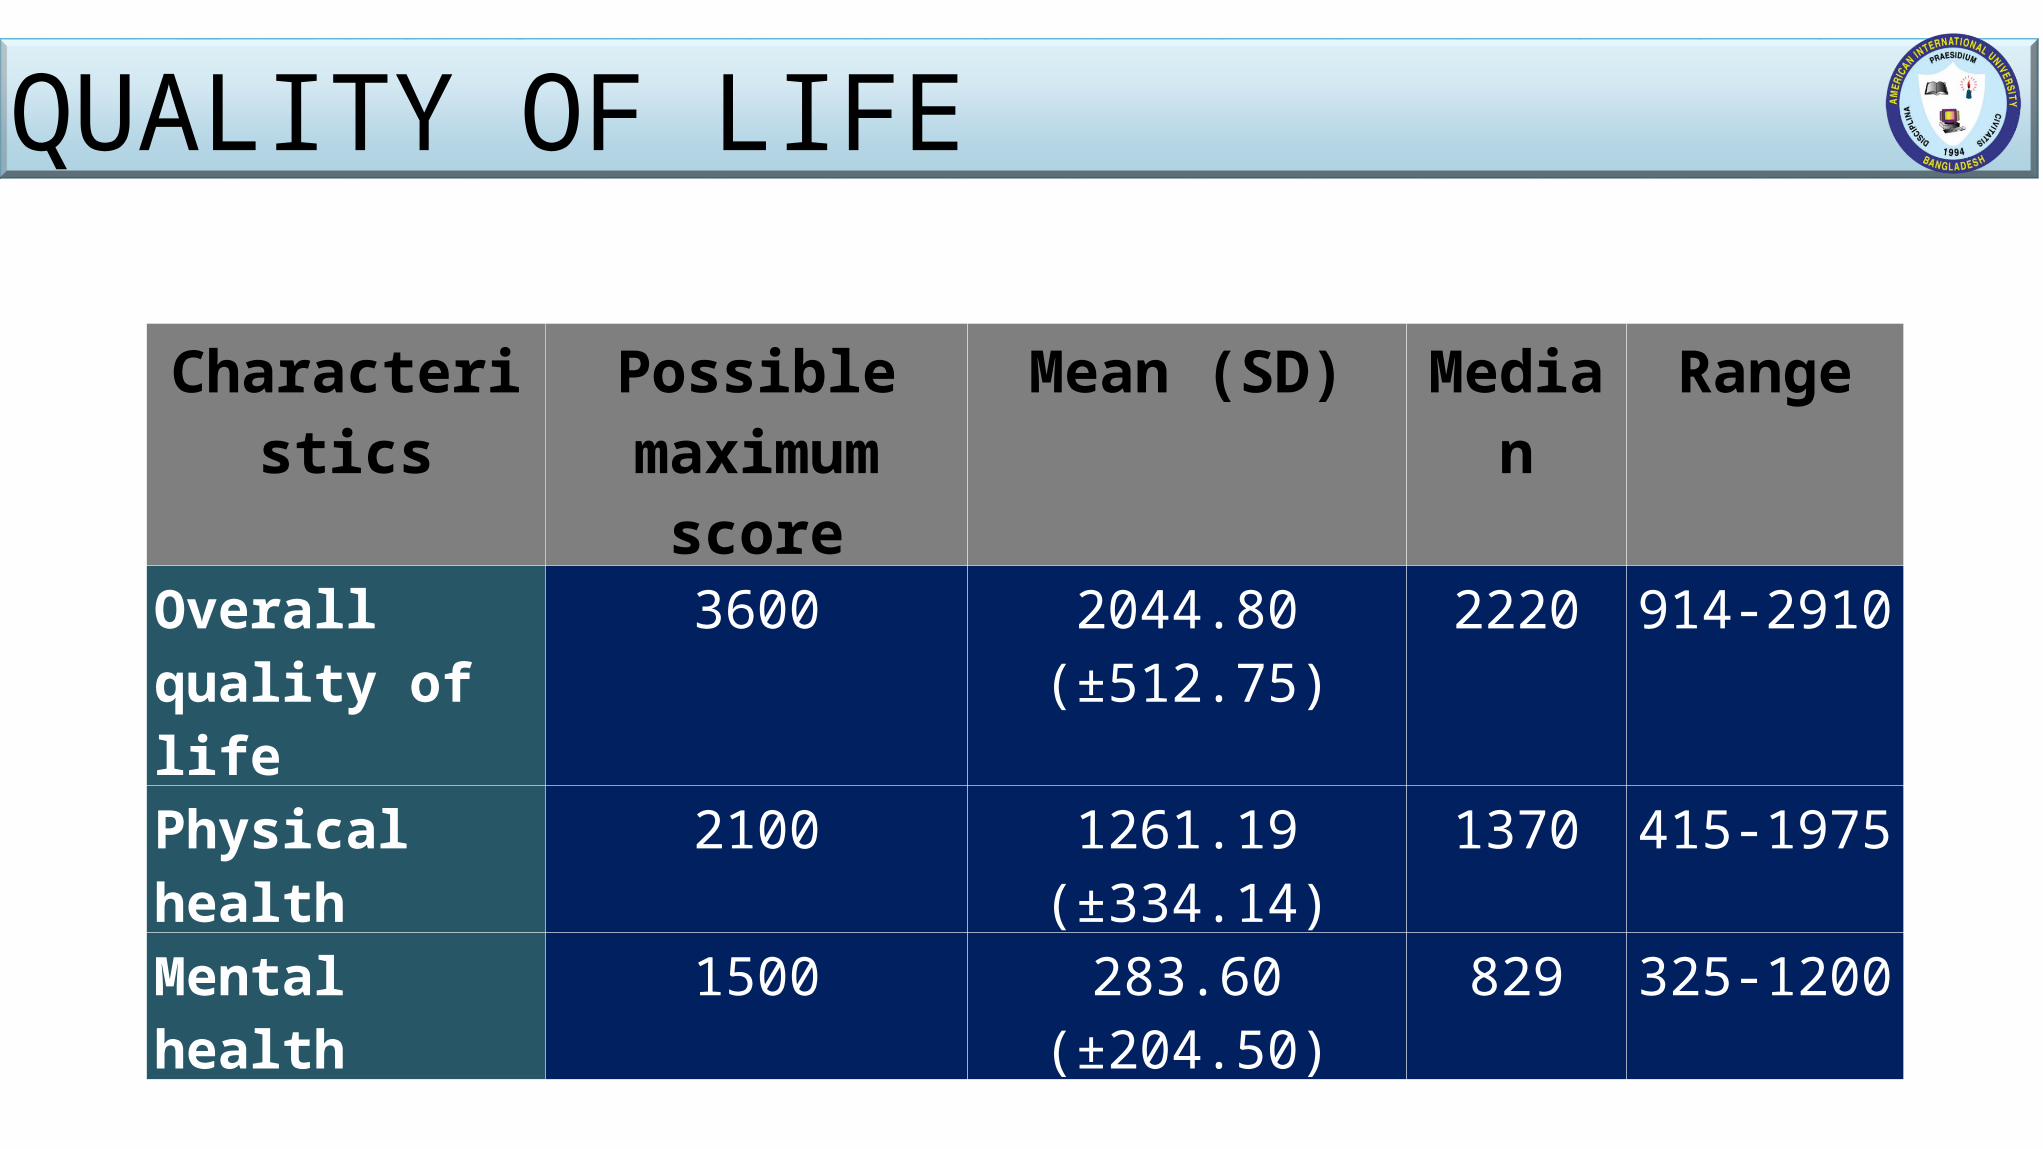
Characteristics Possible maximum score
Mean (SD) Median Range
Overall quality of life
3600 2044.80 (±512.75) 2220 914-2910
Physical health 2100 1261.19 (±334.14) 1370 415-1975
Mental health 1500 283.60 (±204.50) 829 325-1200
QUALITY OF LIFE
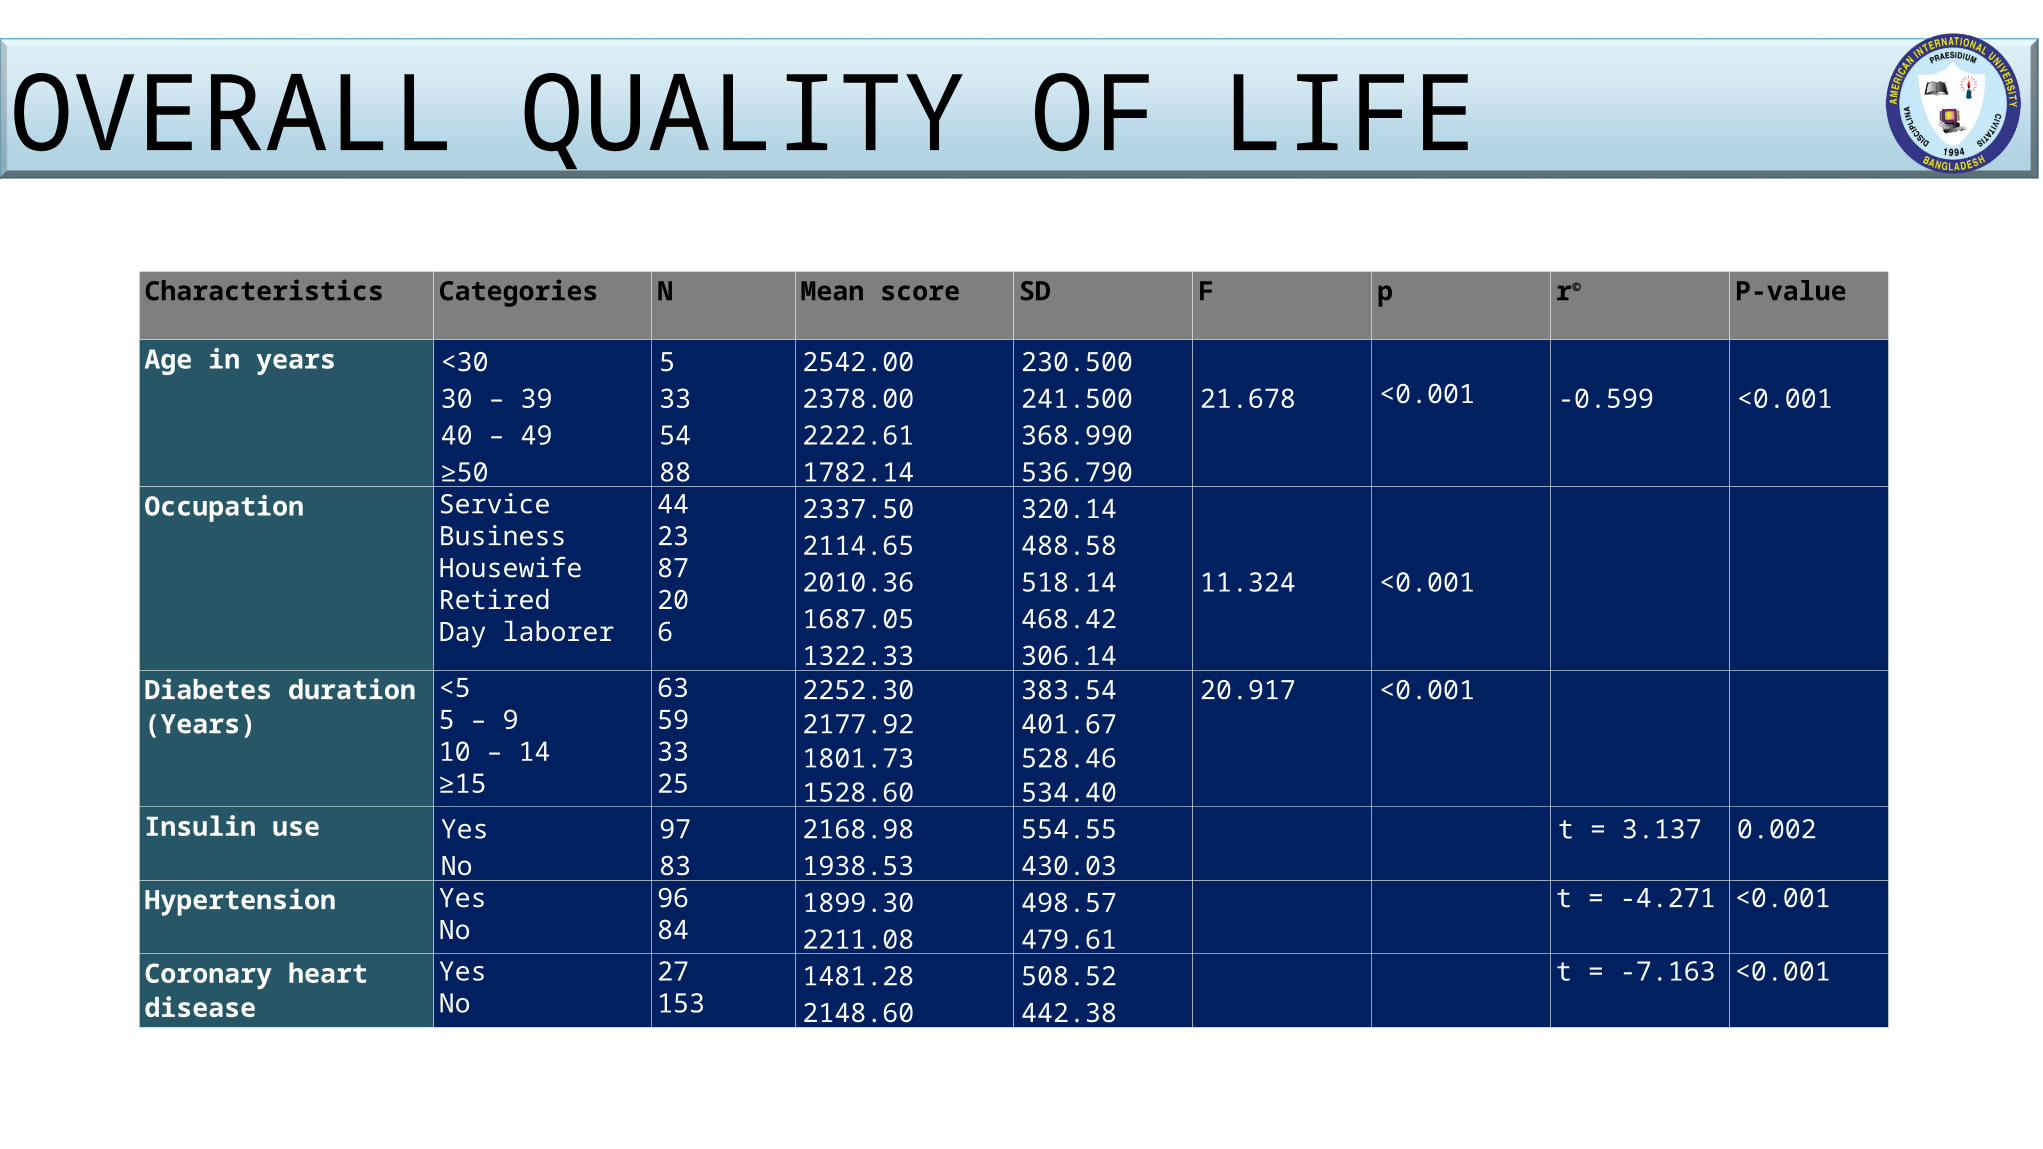
Characteristics Categories N Mean score SD F p r©
P-value
Age in years <30 30 – 39 40 – 49 ≥50
5335488
2542.002378.002222.611782.14
230.500241.500368.990536.790
21.678 <0.001
-0.599
<0.001
Occupation ServiceBusinessHousewifeRetiredDay laborer
442387206
2337.502114.652010.361687.051322.33
320.14488.58518.14468.42306.14
11.324
<0.001
Diabetes duration (Years)
<5 5 – 9 10 – 14 ≥15
63593325
2252.302177.921801.731528.60
383.54401.67528.46534.40
20.917 <0.001
Insulin use YesNo
9783
2168.981938.53
554.55430.03
t = 3.137 0.002
Hypertension YesNo
9684
1899.302211.08
498.57479.61
t = -4.271 <0.001
Coronary heart disease YesNo
27153
1481.282148.60
508.52442.38
t = -7.163 <0.001
OVERALL QUALITY OF LIFE
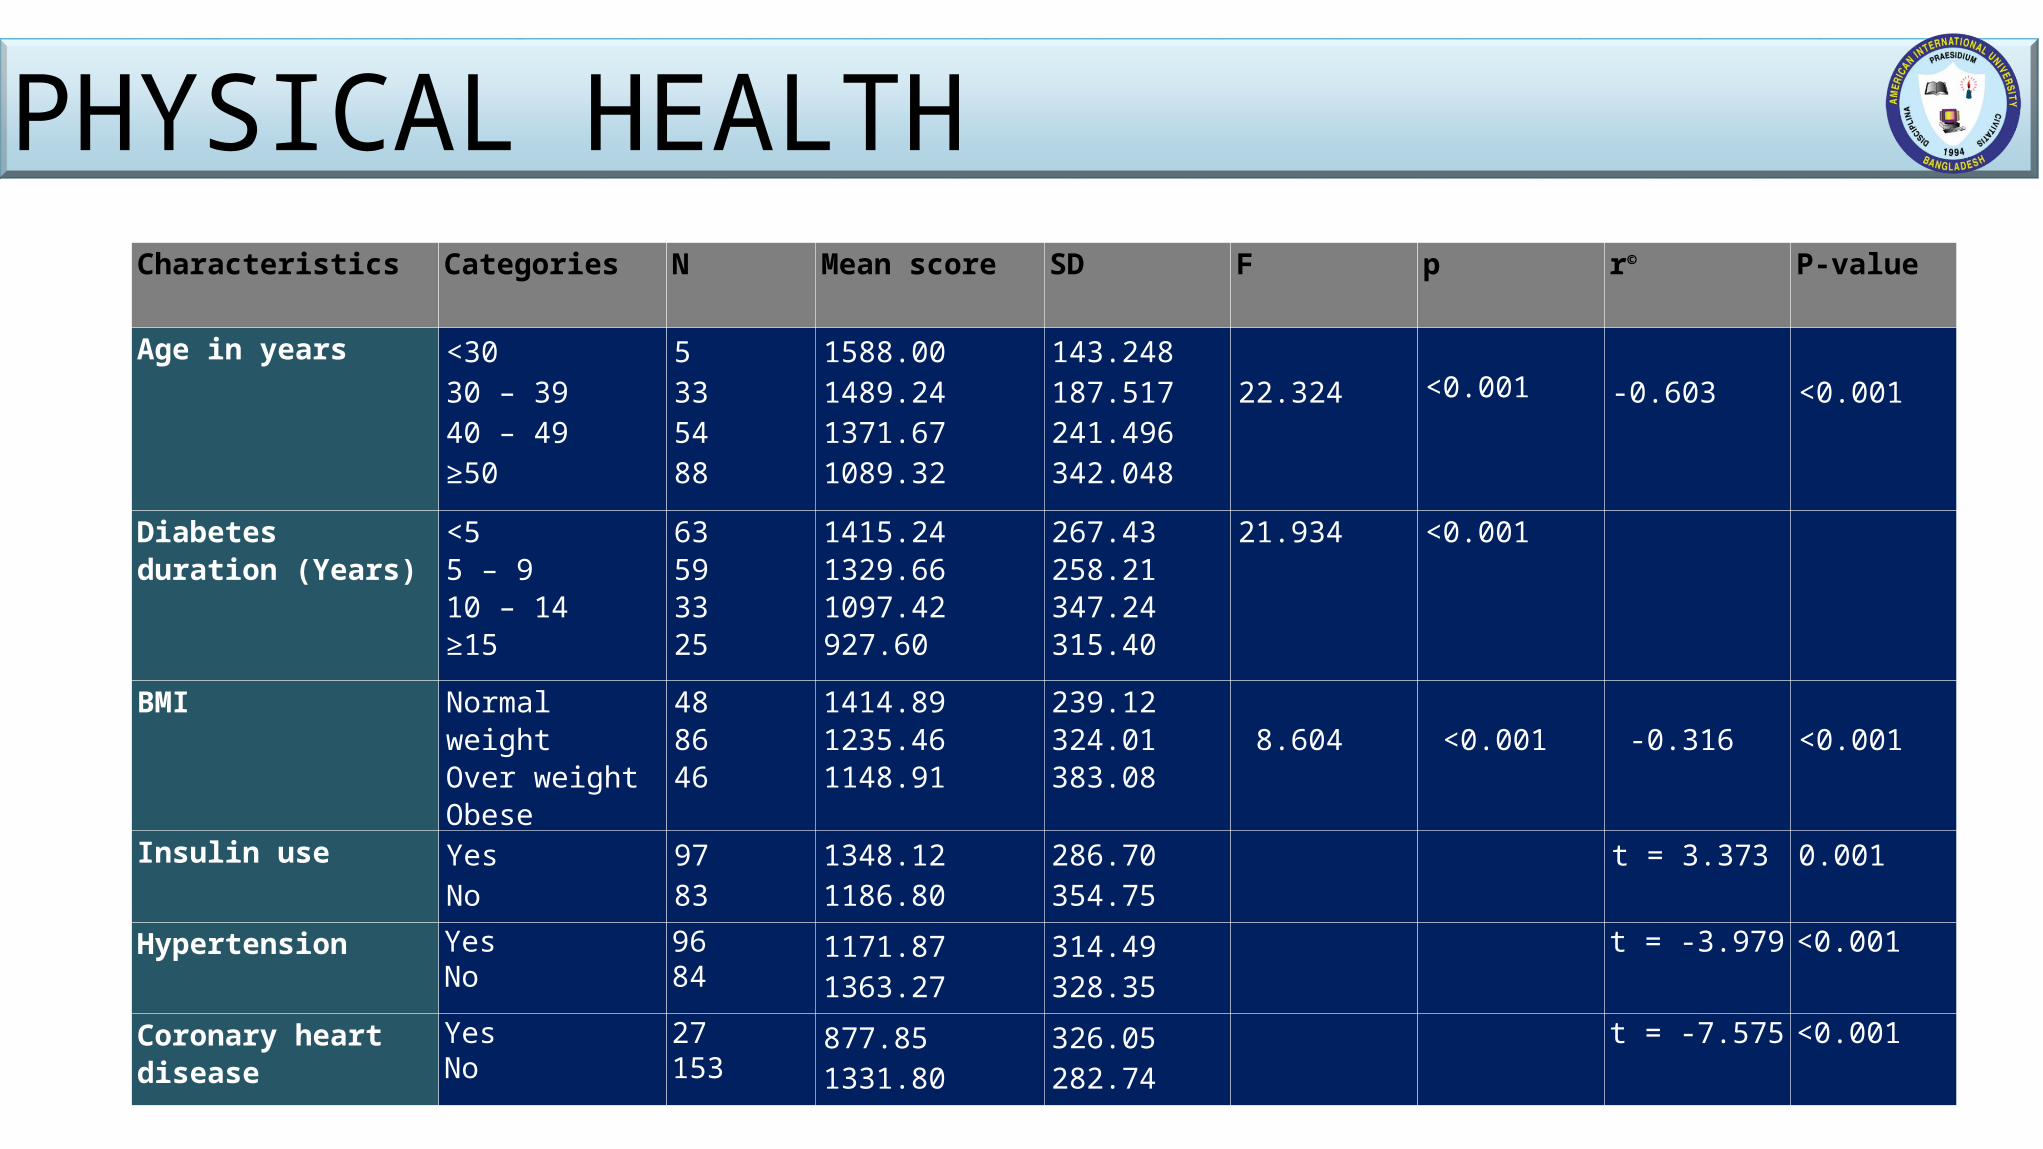
Characteristics Categories N Mean score SD F p r©
P-value
Age in years <30 30 – 39 40 – 49 ≥50
5335488
1588.001489.241371.671089.32
143.248187.517241.496342.048
22.324 <0.001
-0.603
<0.001
Diabetes duration (Years)
<5 5 – 9 10 – 14 ≥15
63593325
1415.241329.661097.42927.60
267.43258.21347.24315.40
21.934 <0.001
BMI Normal weightOver weightObese
488646
1414.891235.461148.91
239.12324.01383.08
8.604
<0.001
-0.316
<0.001
Insulin use YesNo
9783
1348.121186.80
286.70354.75
t = 3.373 0.001
Hypertension YesNo
9684
1171.871363.27
314.49328.35
t = -3.979 <0.001
Coronary heart disease YesNo
27153
877.851331.80
326.05282.74
t = -7.575 <0.001
PHYSICAL HEALTH
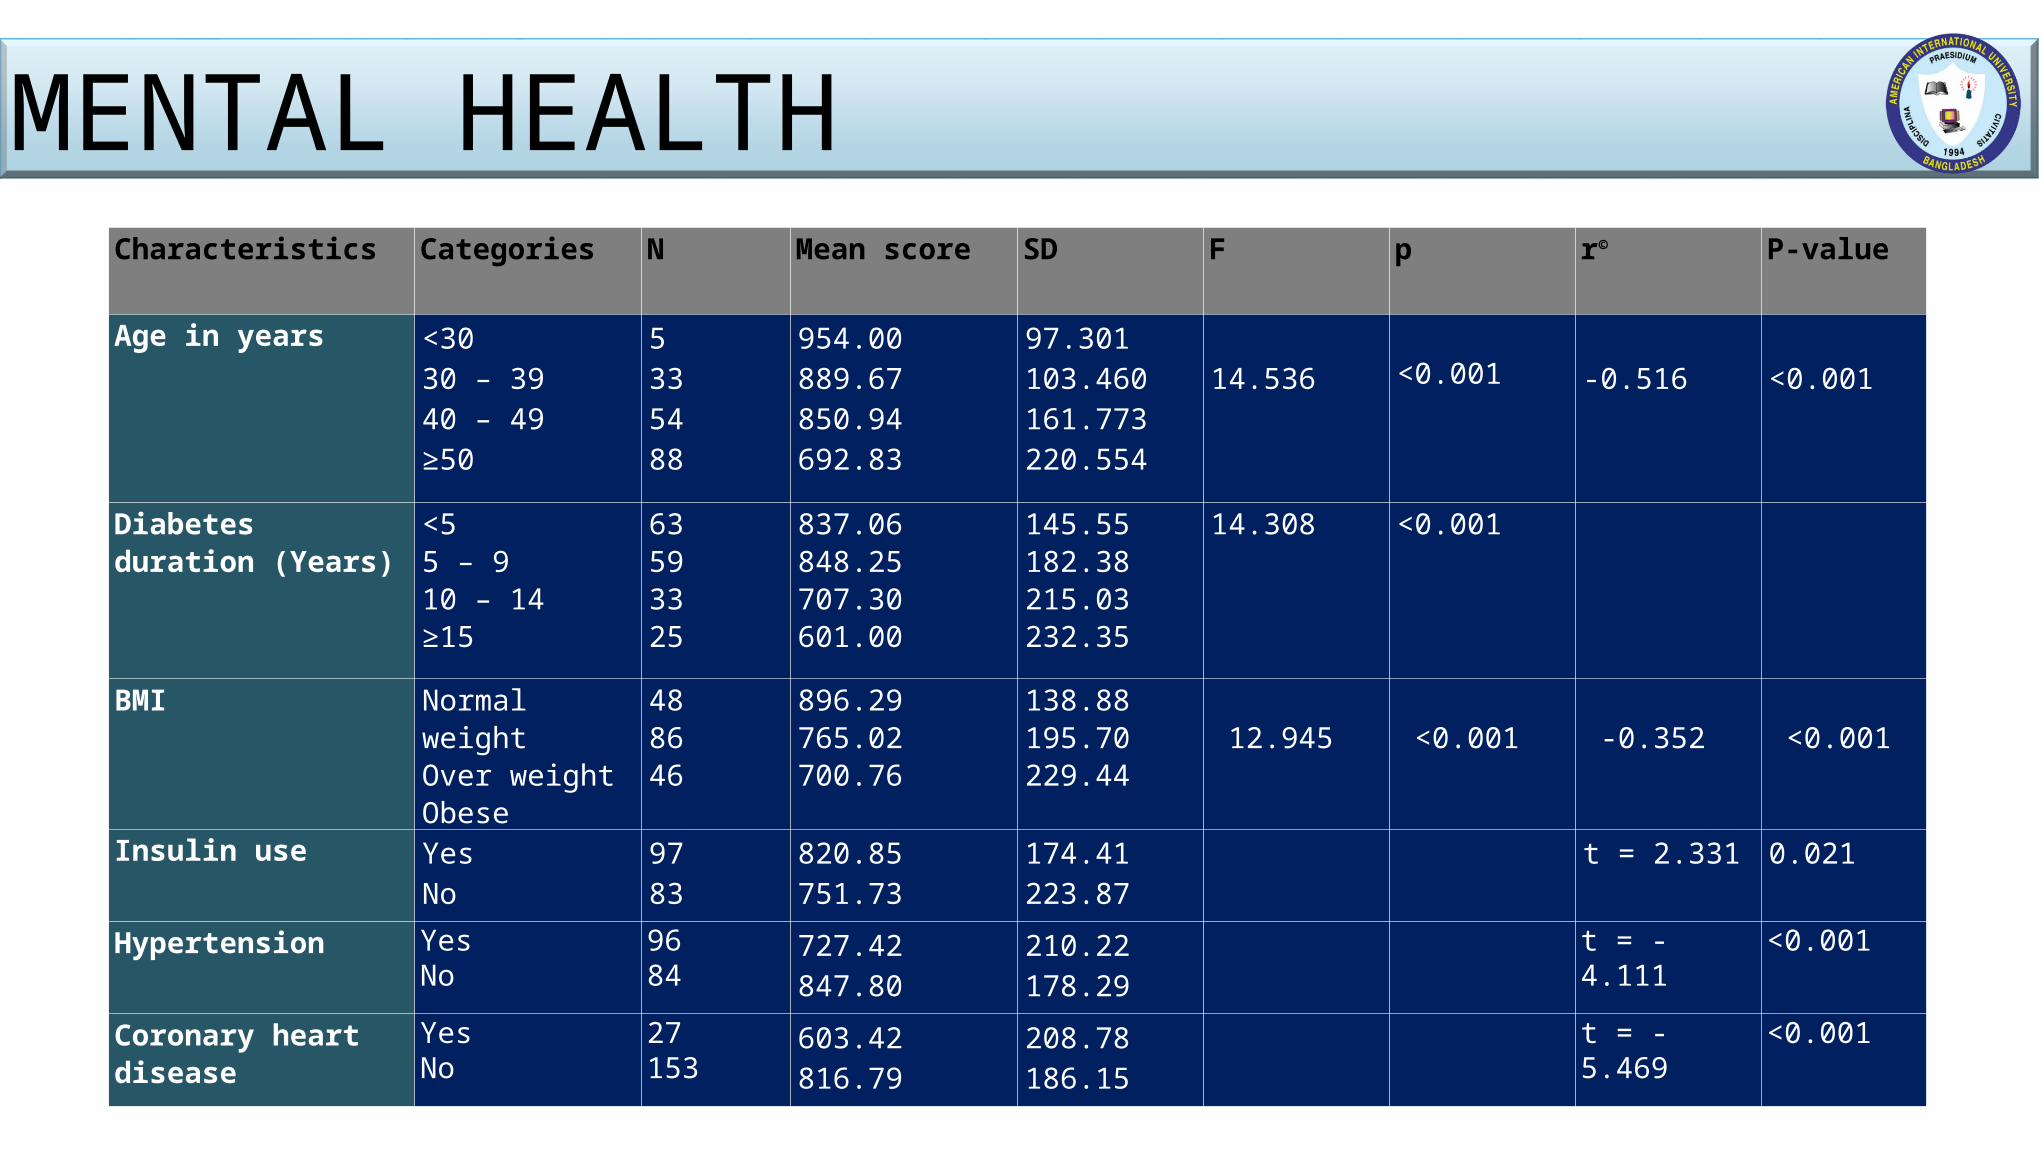
Characteristics Categories N Mean score SD F p r©
P-value
Age in years <30 30 – 39 40 – 49 ≥50
5335488
954.00889.67850.94692.83
97.301103.460161.773220.554
14.536 <0.001
-0.516
<0.001
Diabetes duration (Years)
<5 5 – 9 10 – 14 ≥15
63593325
837.06848.25707.30601.00
145.55182.38215.03232.35
14.308 <0.001
BMI Normal weightOver weightObese
488646
896.29765.02700.76
138.88195.70229.44
12.945
<0.001
-0.352
<0.001
Insulin use YesNo
9783
820.85751.73
174.41223.87
t = 2.331 0.021
Hypertension YesNo
9684
727.42847.80
210.22178.29
t = -4.111 <0.001
Coronary heart disease YesNo
27153
603.42816.79
208.78186.15
t = -5.469 <0.001
MENTAL HEALTH
Sleep quality Quality of lifeOverall Physical health Mental health
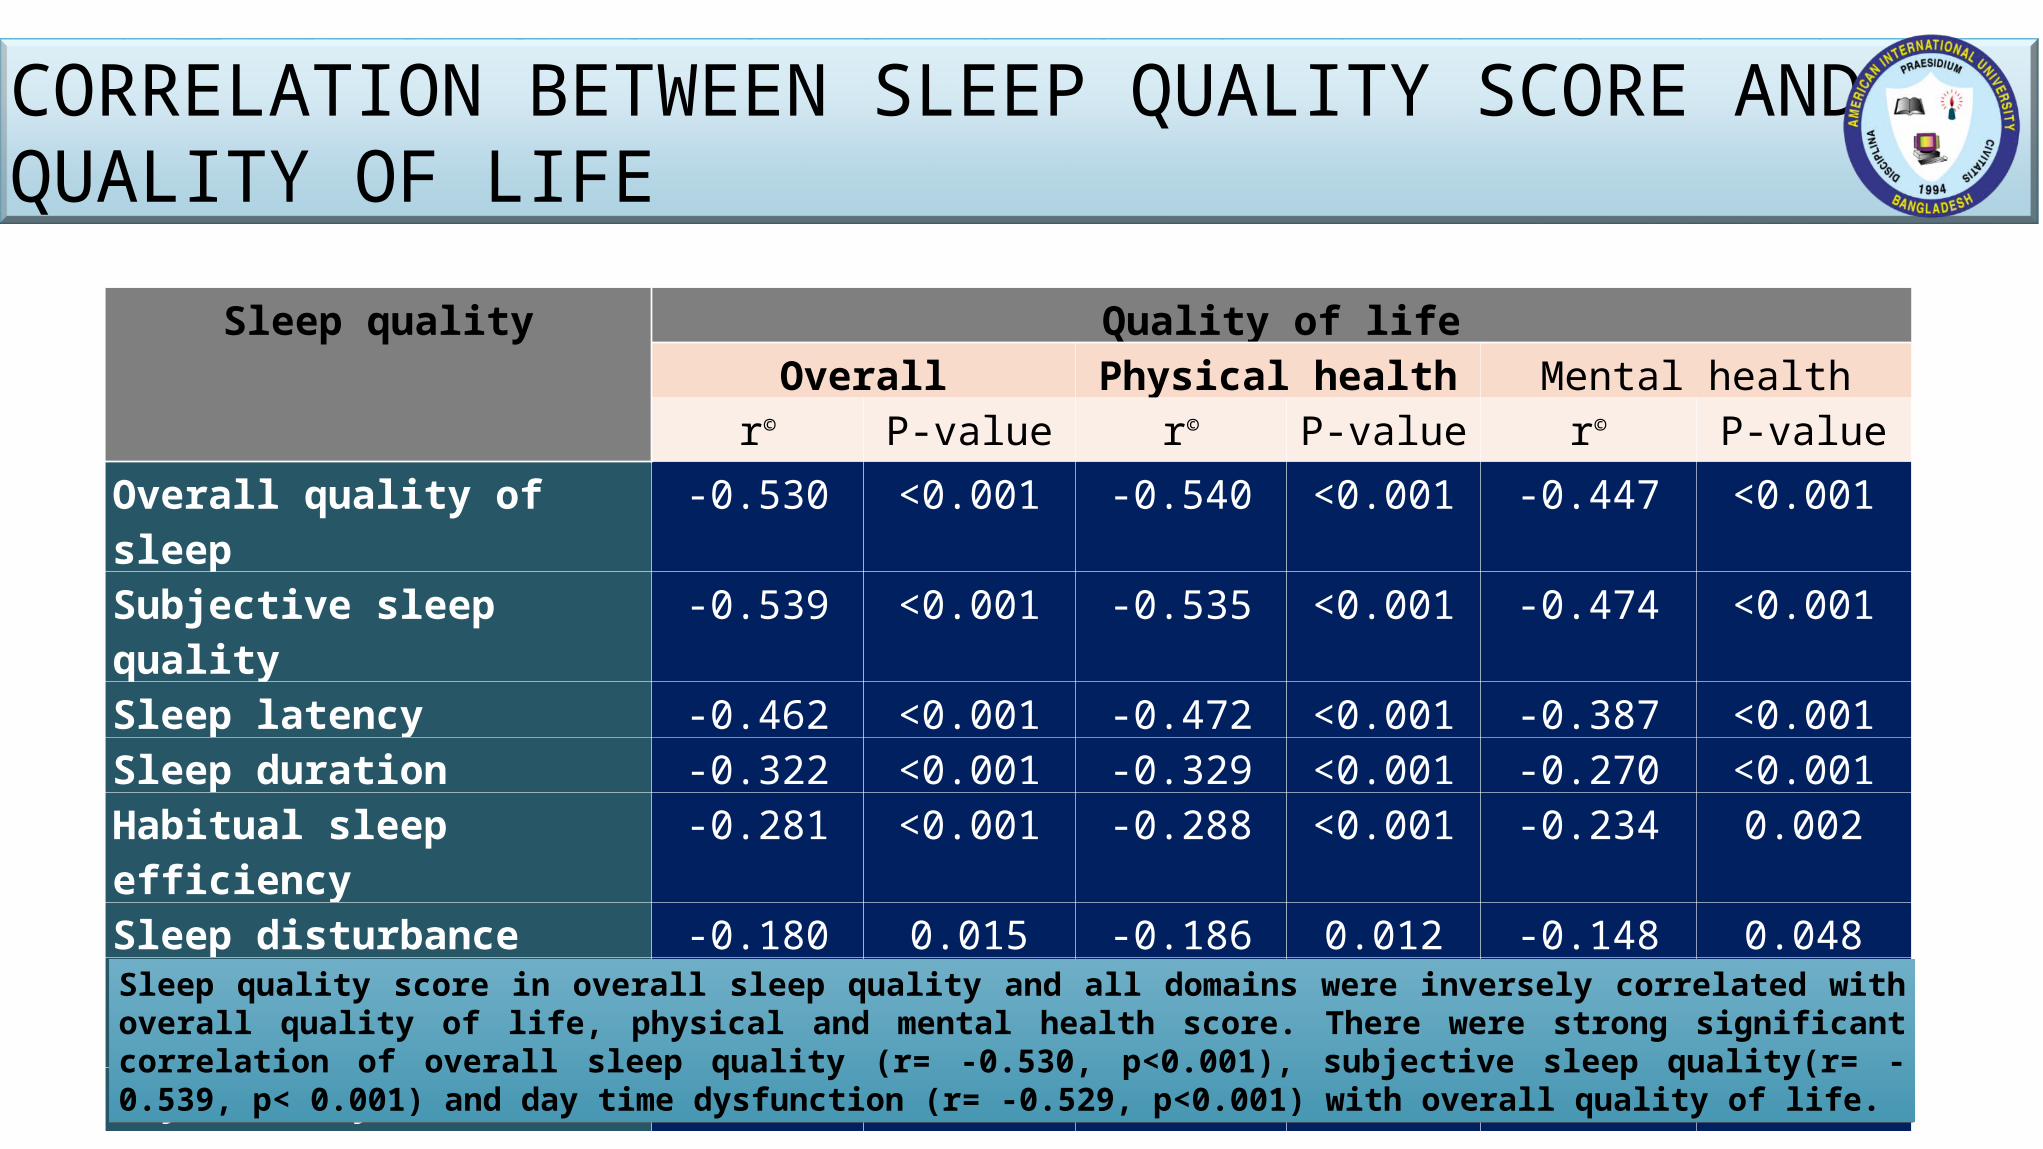
r© P-value r© P-value r© P-valueOverall quality of sleep -0.530 <0.001 -0.540 <0.001 -0.447 <0.001Subjective sleep quality -0.539 <0.001 -0.535 <0.001 -0.474 <0.001Sleep latency -0.462 <0.001 -0.472 <0.001 -0.387 <0.001Sleep duration -0.322 <0.001 -0.329 <0.001 -0.270 <0.001Habitual sleep efficiency -0.281 <0.001 -0.288 <0.001 -0.234 0.002Sleep disturbance -0.180 0.015 -0.186 0.012 -0.148 0.048Use of sleep medication -0.284 <0.001 -0.312 <0.001 -0.201 0.007Day time dysfunction -0.529 <0.001 -0.499 <0.001 -0.511 <0.001
Sleep quality score in overall sleep quality and all domains were inversely correlated with overall quality of life, physical and mental health score. There were strong significant correlation of overall sleep quality (r= -0.530, p<0.001), subjective sleep quality(r= -0.539, p< 0.001) and day time dysfunction (r= -0.529, p<0.001) with overall quality of life.
CORRELATION BETWEEN SLEEP QUALITY SCORE AND QUALITY OF LIFE
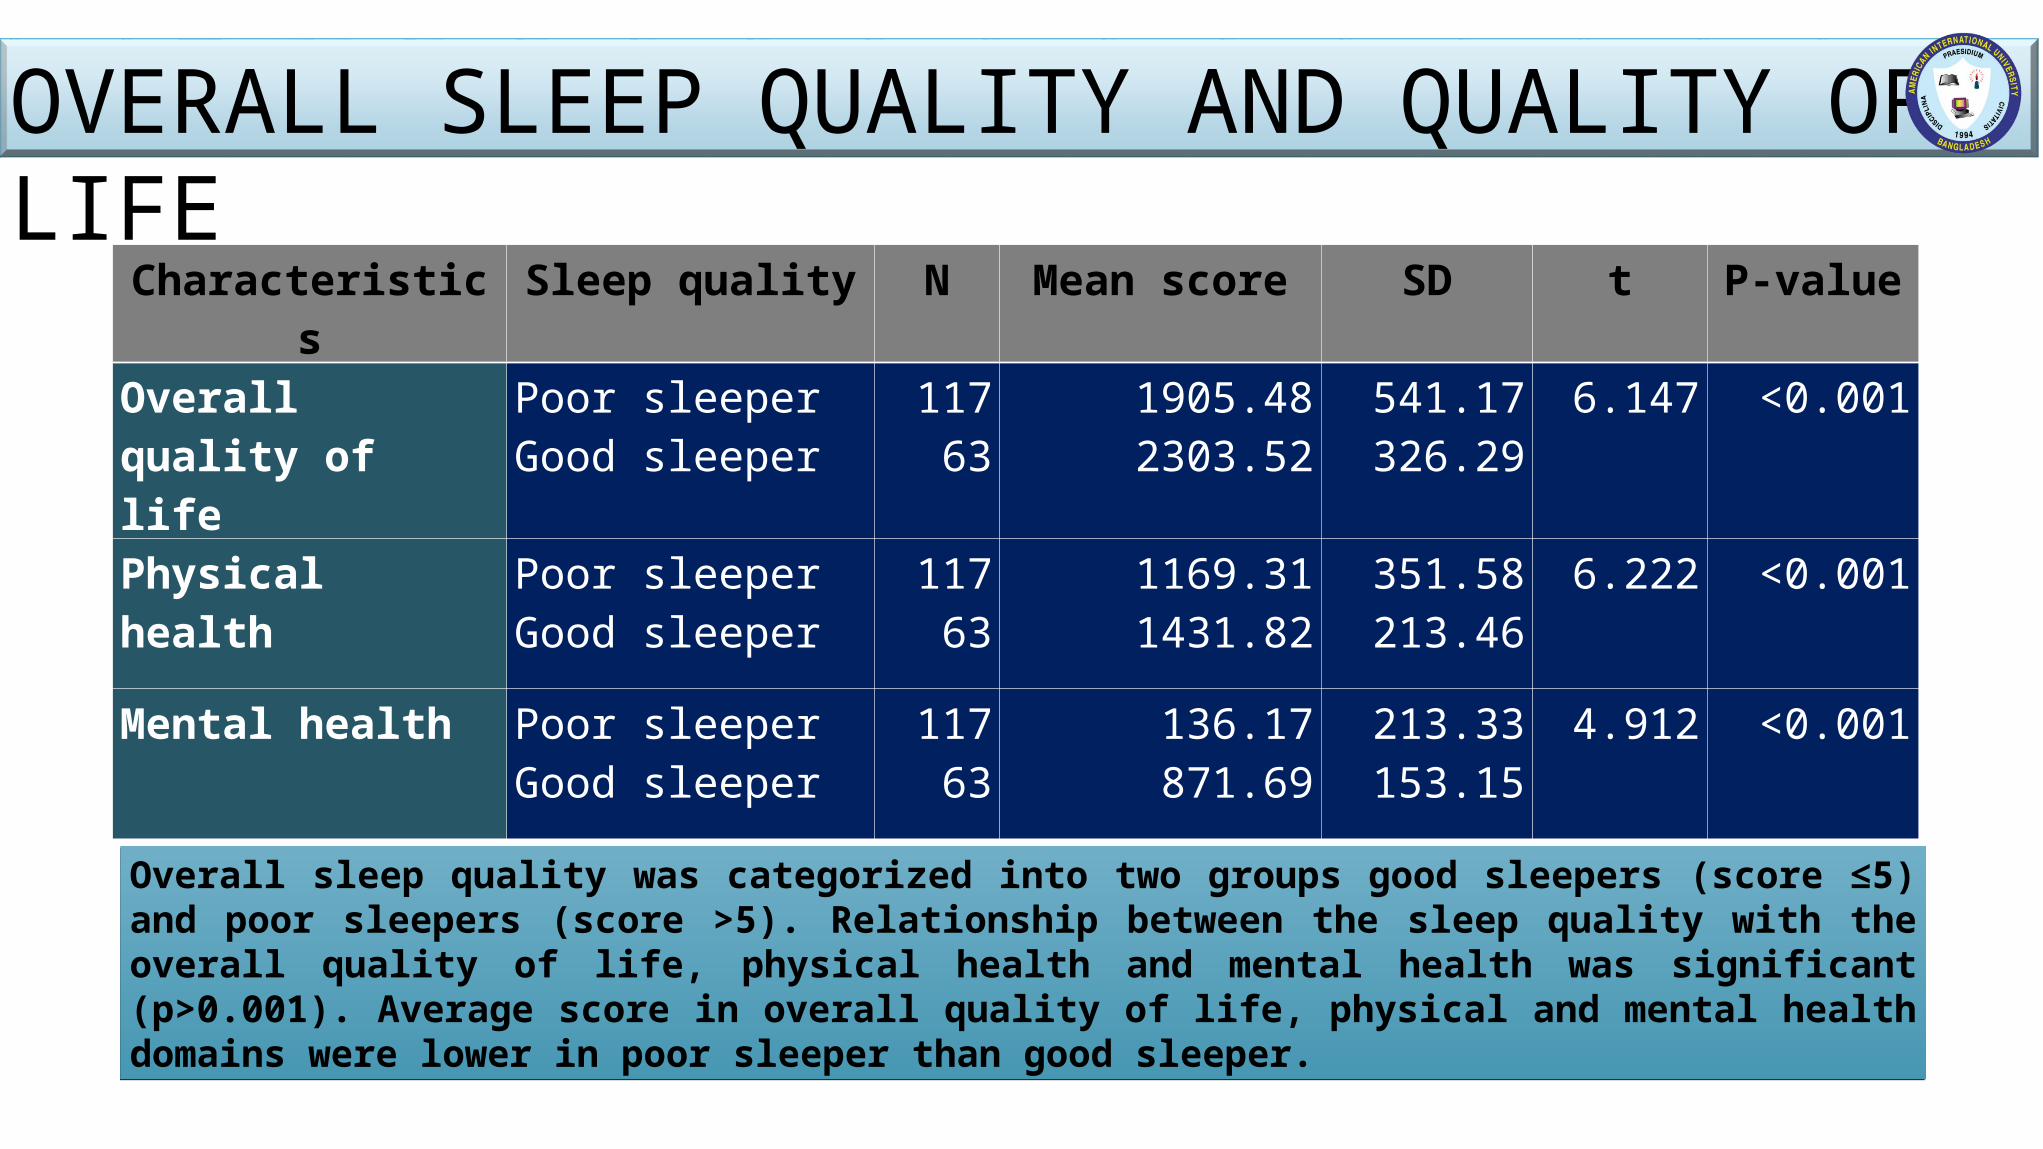
Overall sleep quality was categorized into two groups good sleepers (score ≤5) and poor sleepers (score >5). Relationship between the sleep quality with the overall quality of life, physical health and mental health was significant (p>0.001). Average score in overall quality of life, physical and mental health domains were lower in poor sleeper than good sleeper.
Characteristics Sleep quality N Mean score SD t P-value
Overall quality of life
Poor sleeperGood sleeper
11763
1905.482303.52
541.17326.29
6.147 <0.001
Physical health Poor sleeperGood sleeper
11763
1169.311431.82
351.58213.46
6.222 <0.001
Mental health Poor sleeperGood sleeper
11763
136.17871.69
213.33153.15
4.912 <0.001
OVERALL SLEEP QUALITY AND QUALITY OF LIFE
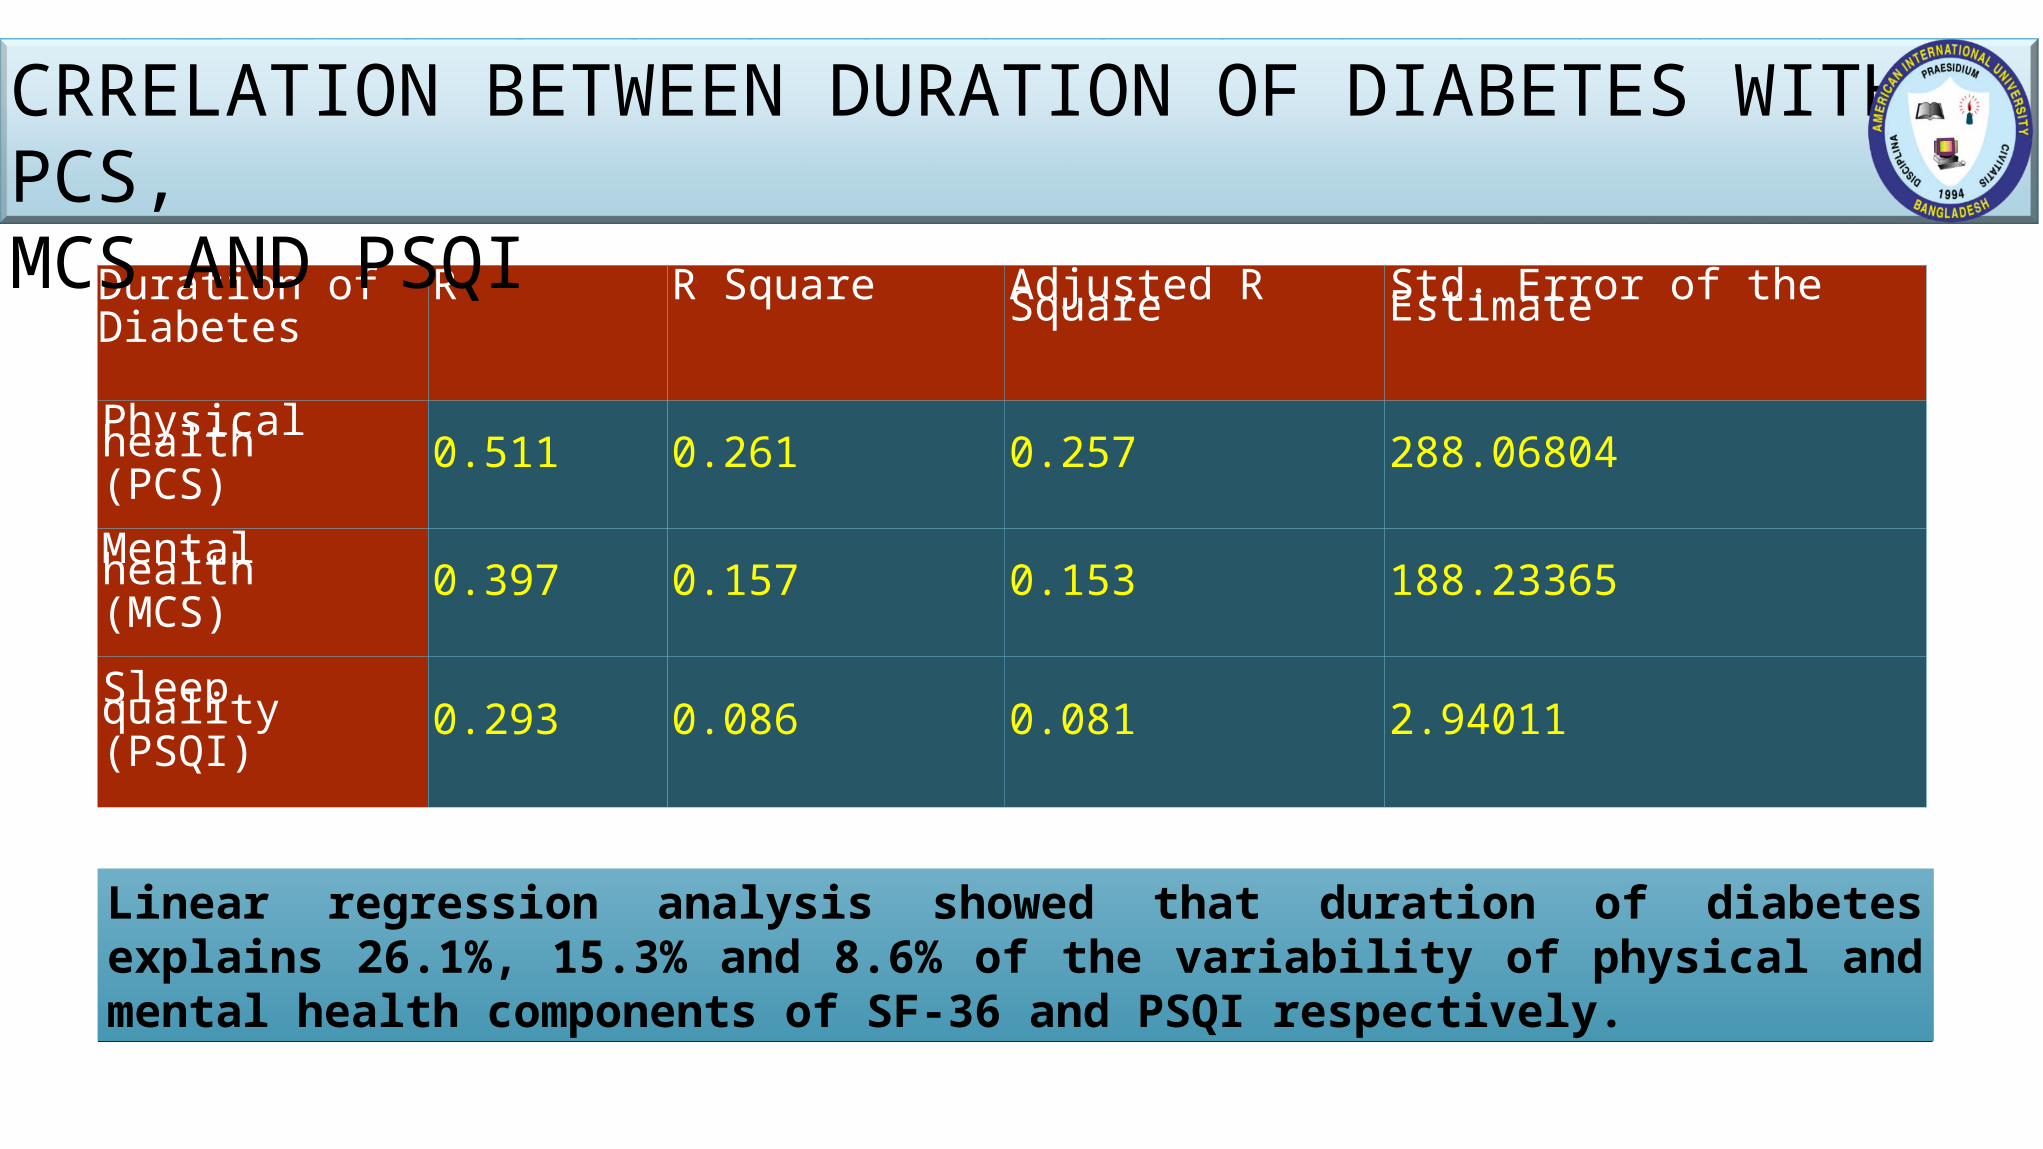
Linear regression analysis showed that duration of diabetes explains 26.1%, 15.3% and 8.6% of the variability of physical and mental health components of SF-36 and PSQI respectively.
Duration of Diabetes
R R Square Adjusted R Square Std. Error of the Estimate
Physical health(PCS) 0.511 0.261 0.257 288.06804
Mental health(MCS) 0.397 0.157 0.153 188.23365
Sleep quality(PSQI) 0.293 0.086 0.081 2.94011
CRRELATION BETWEEN DURATION OF DIABETES WITH PCS,MCS AND PSQI
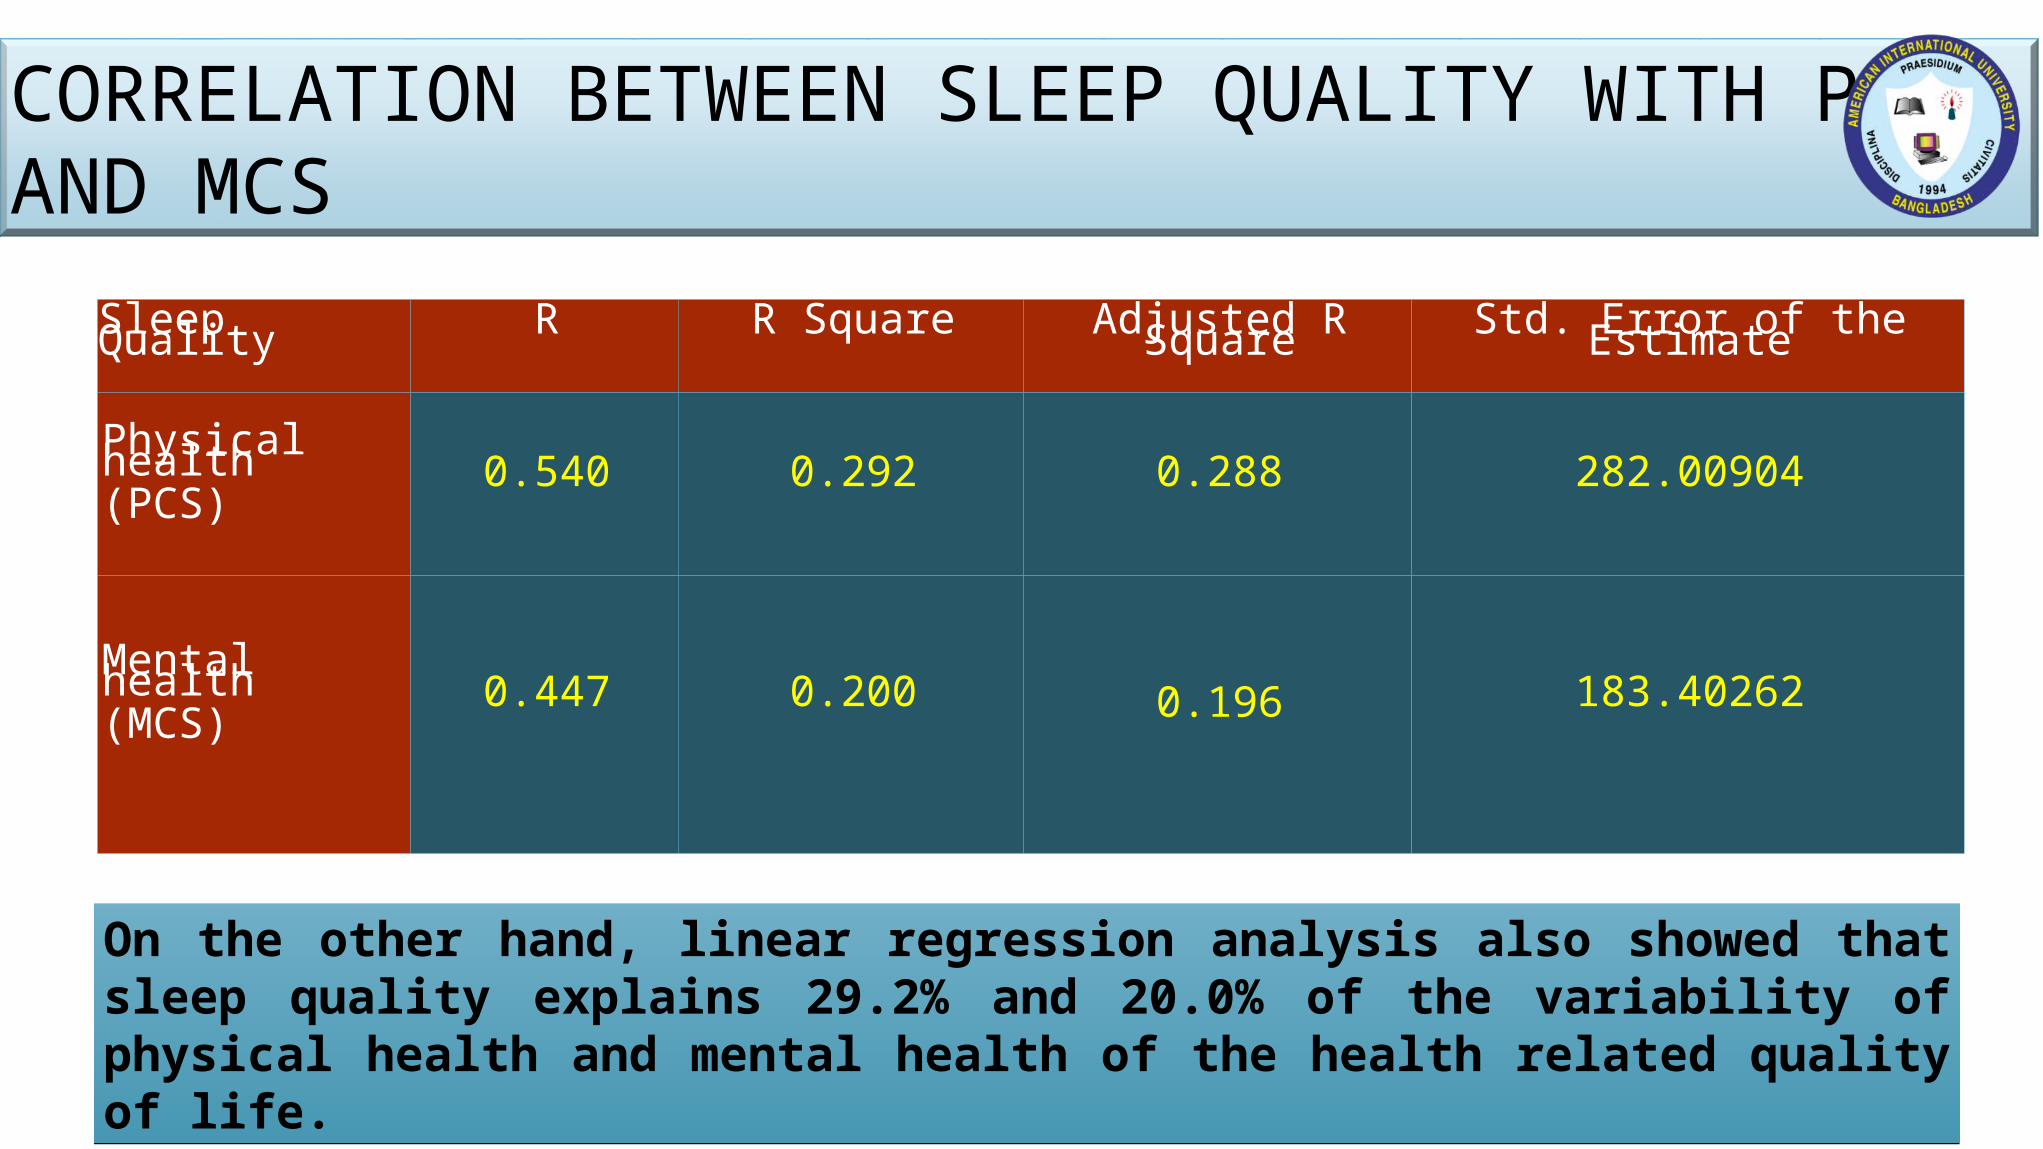
On the other hand, linear regression analysis also showed that sleep quality explains 29.2% and 20.0% of the variability of physical health and mental health of the health related quality of life.
Sleep Quality R R Square Adjusted R Square Std. Error of the Estimate
Physical health(PCS) 0.540 0.292 0.288 282.00904
Mental health (MCS) 0.447 0.200 0.196 183.40262
CORRELATION BETWEEN SLEEP QUALITY WITH PCS AND MCS
The purpose of this study was to examine the relationship between sleep quality and health-related of life in adults with type 2 diabetes.
To our knowledge, this is the first systematic investigation to find out the association between poor sleep and quality of life in T2DM in Bangladesh.
For this purpose, we interviewed one eighty individuals with type 2 diabetes through a semi-structured questionnaires and check list assessing sleep quality, health-related quality of life, comorbidities.
CONCLUSION
117 participants (65%) were poor sleepers (global PSQI >5). (Comparatively, previous studies have identified between 45% and 67% of persons with type 2 diabetes to have poor sleep quality and/or difficulty initiating or maintaining sleep.)
Poor sleeper had significantly poorer SF-36 PCS and MCS and poorer functioning on each of the 8 domains of the SF-36 (all p<0.001).
Poor sleeper tended to be aged, to be female, and to have more comorbidities.
CONCLUSION
Overall quality of life is better in females than male but they are mentally compromised.
Both sleep quality and quality of life were better in married persons than others.
HRQOL was associated with age, years since diabetes diagnosis, number of comorbidities, number of diabetic complications, insulin use.
On an average, the respondents who were suffering from diabetes ≥15 years had lower score in overall quality of life, physical and mental health.
Overall quality of life was highest in younger (15-29 years) and lowest in elderly subjects (over 50 years). Life quality decreased with increasing age.
CONCLUSION
These results suggest that poor sleep is common among persons with type 2 diabetes and that poor sleep quality is associated with HRQOL and diabetes-related quality of life, in particular satisfaction with and impact of treatment.
This study suggested that adequate sleep quality and quantity should be considered a fundamental component of a healthy lifestyle, like weight control and physical activity.
CONCLUSION
Ensure sleep hygiene strategies as part of diabetes management.
Ensure control blood sugar level with appropriate treatment for every type 2 diabetes patients.
Strategies should be designed to early diagnosis of diabetes and aggressive management of blood pressure, hyperlipidaemia and albuminuria should be ensured.
A comprehensive nationwide study about sleep quality and quality of life of type 2 diabetes patients should be conducted.
RECOMMENDATION
My SupervisorAll respected faculties of MPH, AIUB
All my wonderful batch-mates of MPHNHN, MIRPUR
ICDDR,BMy lovely family
&
Finally, American International University- Bangladesh (AIUB)
ACKNOWLEDGEMENT