Sleep Market Panel - rmdassets.com · dispense therapeutic sleep apnea equipment to patients 21% o...
21
Results for June 2016 Sleep Market Panel
Transcript of Sleep Market Panel - rmdassets.com · dispense therapeutic sleep apnea equipment to patients 21% o...

Results for June 2016
Sleep Market Panel

©ResMed 2016 I 2
o This is a monthly trending report of panel member data along with
additional analysis by:
Sleep labs affiliated with Hospitals vs. Independent Labs
o Hospital - Labs affiliated with hospitals
o Independent - Labs that are stand alone entities
Sleep labs conducting HSTs vs. Non-HST labs
o HST - Labs reported conducting at least ONE home sleep test a month
o Non-HST - Labs reported conducting NO home sleep tests
Notes:

©ResMed 2016 I
Panel Member Profile, June 2016
o In June, a total of 153 labs from 37 states submitted their data (6 are new panel
members)
2% 2% 1% 2% 2% 1% 1% 2% 1% 2% 1% 1%
53% 45% 55% 53% 53%
52% 56% 53%
47% 50% 49% 55%
44% 50%
42% 43% 43% 47% 43% 44%
52% 47% 43% 42%
0%
10%
20%
30%
40%
50%
60%
70%
80%
90%
100%
July Aug Sep Oct Nov Dec Jan Feb Mar Apr May Jun
Sleep Lab Business Model Trend
Independent/Stand AloneAffiliated with Hospital/Medical Group - Hospital BasedAffiliated with Hospital/Medical Group - Managed by outside entityAffiliated with Hospital/Medical Group - Physcian Free-Standing
Note: No representation from Alaska or Hawaii
June 2016 Data Collected from 37 States
State Represented in June
Not Represented
3

©ResMed 2016 I
Panel Member Profile, June 2016
o Lab sizes ranged from 1–15
beds, with an overall average
of 4.4 beds and a median of
4 beds
o In June, 13% of labs
dispense therapeutic sleep
apnea equipment to patients
o The percentage of labs
dispensing sleep equipment
averaged 17% in the last 12
months Jul'15 - Jun'16
0
2
4
6
8
10
12
14
16
88% of sleep labs have ≤ 6 beds
Nu
mb
er B
ed
s p
er
Sle
ep
Lab
Distribution of Beds per Sleep Lab
14% 16%
13% 15% 16%
21%
15%
22% 19%
21%
15% 13%
0%
5%
10%
15%
20%
25%
30%
35%
40%
Jul Aug Sep Oct Nov Dec Jan Feb Mar Apr May Jun
Percent of Sleep Labs Dispensing Sleep Apnea Equipment
4

©ResMed 2016 I
Sleep Labs Planning to Add Beds Next Month
o 3.9% of total labs planned to add
more beds to their facility in June
o The percentage of total labs
planning to add beds in the next
month averaged 2% in the last
12 months Jul'15 - Jun'16
3%
2% 2%
0%
3%
2%
1%
2%
0% 0%
1% 1% 1%
4%
7%
5%
4%
2%
0% 0%
2%
0%
3%
9%
2% 3%
3%
2%
3%
2%
1% 1%
1% 0%
2%
4%
-2%
0%
2%
4%
6%
8%
10%
12%
Sleep Labs Adding Beds Next Month By Business Model
Hospital Labs Inpedendent Labs All Labs
Jul Aug Sep Oct Nov Dec Jan Feb Mar Apr May June
5

©ResMed 2016 I
Split-Night Studies and Auto-scoring
o In June, 20% of overnight tests
were conducted as split-night
studies
o The percent of split-night
studies conducted over the last
12 months Jul'15 - Jun'16
averaged 22%
o In June, 18% of labs reported
using Auto-scoring or
Computer Assisted Scoring
o The percent of labs using Auto-
scoring over the last 12 months
Jul'15 - Jun'16 averaged 14%
14% 11%
14% 15% 11%
13% 15% 15%
12% 16% 16%
18%
0%
5%
10%
15%
20%
25%
30%
35%
40%
Jul Aug Sep Oct Nov Dec Jan Feb Mar Apr May Jun
Percent of Sleep Labs Utilizing Auto-scoring Software
23% 24% 24% 21% 20% 20%
23% 23% 21% 22% 23%
20%
0%
5%
10%
15%
20%
25%
30%
35%
40%
Jul Aug Sep Oct Nov Dec Jan Feb Mar Apr May Jun
Overnight Tests Conducted as Split-Night Studies
6

©ResMed 2016 I
Volume of In-lab Overnight Sleep Testing Per Bed
o In June, labs conducted an
average of 14.5 in-lab
overnight tests per bed, with a
range of 1-34
o The number of tests
conducted per bed in the last
12 months Jul'15 - Jun'16
averaged 15
0
5
10
15
20
25
30
35Distribution of # Overnight Studies per Bed
Average tests per bed = 14.5
# St
ud
ies
pe
r B
ed
15 14 14
15 14
15 13 13
14 14 15 15
0
5
10
15
20
Jul Aug Sep Oct Nov Dec Jan Feb Mar Apr May Jun
Average Monthly In-Lab Tests Per Bed #
Stu
die
s p
er
Bed
7
©ResMed 2016 I
Home Sleep Testing (HST)
78%
66% 69%
75%
67%
76% 76% 78%
71%
78% 75%
78%
40%
45%
50%
55%
60%
65%
70%
75%
80%
85%
90%
Jul Aug Sep Oct Nov Dec Jan Feb Mar Apr May Jun
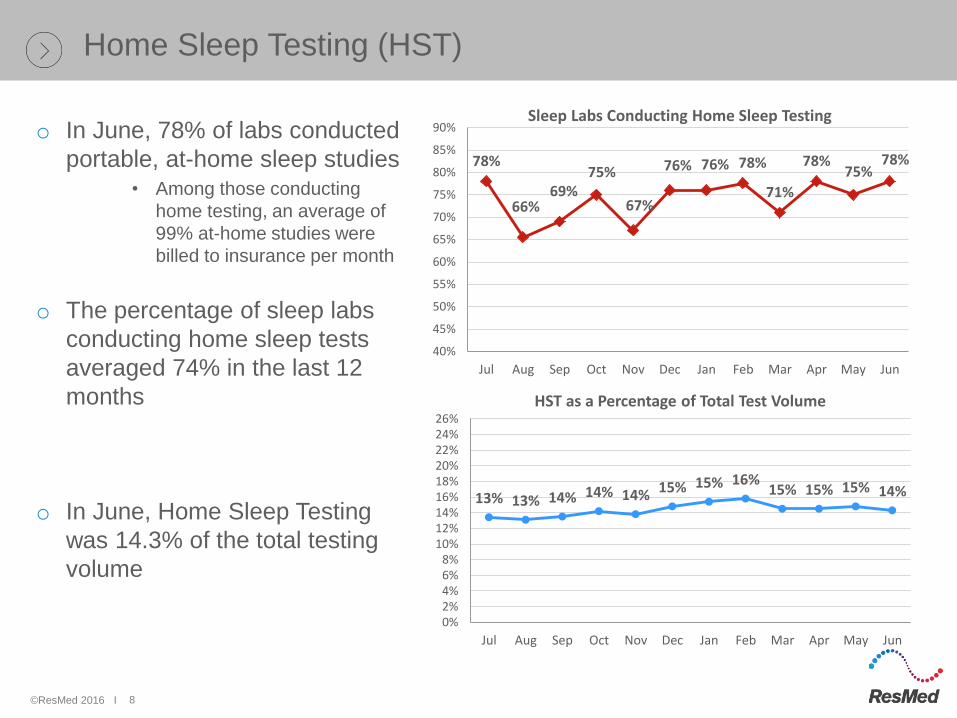
Sleep Labs Conducting Home Sleep Testing o In June, 78% of labs conducted
portable, at-home sleep studies • Among those conducting
home testing, an average of
99% at-home studies were
billed to insurance per month
o The percentage of sleep labs
conducting home sleep tests
averaged 74% in the last 12
months
o In June, Home Sleep Testing
was 14.3% of the total testing
volume
13% 13% 14% 14% 14% 15% 15% 16% 15% 15% 15% 14%
0%2%4%6%8%
10%12%14%16%18%20%22%24%26%
Jul Aug Sep Oct Nov Dec Jan Feb Mar Apr May Jun
HST as a Percentage of Total Test Volume
8

©ResMed 2016 I
Average Monthly Testing Volume Conducted Per Lab
(In-Lab + HST): By Business Model
88
69
79
89
68
74 72 73 68
71
83
72
97 93 93
97 100
95
87 88
97 92 90 88 93
78
84
93
78 81
78 78 78 80 86
78
20
30
40
50
60
70
80
90
100
110
120
Jul Aug Sep Oct Nov Dec Jan Feb Mar Apr May Jun
# o
f To
tal S
leep
Tes
ts
Total Volume of Sleep Tests Conducted Hospital Labs vs. Independent Labs
Hospital Lab Independent Lab All Sleep Labs
o In June, the average number of
total sleep tests were: – Hospital Labs: 72
– Independent Labs: 88
– All Labs: 78
o The number of tests conducted
per lab in the last 12 months
Jul'15 - Jun'16 averaged: – Hospital Labs: 76
– Independent Labs: 93
– All Labs: 82
9

©ResMed 2016 I
Average Monthly Testing Volume Conducted Per Lab
(In-Lab + HST): HST vs. Non-HST Labs
105 101
104 107
94 92 90 89
94 91
101
88
54
33
40
50
42
47 41 42 41
45 44 48
93
78
84
93
78 81
78 78 78 80 86
78
20
30
40
50
60
70
80
90
100
110
120
Jul Aug Sep Oct Nov Dec Jan Feb Mar Apr May Jun
# o
f To
tal S
leep
Tes
ts
Total Volume of Sleep Tests Conducted Labs Conducting HST vs. Non- HST Labs
HST Labs Non-HST Labs All Sleep Labs
o In June, the average number of
total sleep tests were: – HST Labs: 88
– Non-HST Labs: 48
– All Labs: 78
o The number of tests conducted
per lab in the last 12 months
Jul'15 - Jun'16 averaged: – HST Labs: 96
– Non-HST Labs: 44
– All Labs: 82
10

©ResMed 2016 I
Average Monthly Volume of In-Lab Tests vs. HSTs Conducted Per
Lab
80
68 72
79
67 69 66 66 67 68
73
67
13
10
12
13
11 12
12 12 11 12
13
11
0
10
20
30
40
50
60
70
80
90
100
Jul Aug Sep Oct Nov Dec Jan Feb Mar Apr May Jun
# o
f Sl
eep
Tes
ts b
y Te
st M
eth
od
Total Volume of Sleep Tests Conducted
HST
In-Lab
o In June, the average number of
sleep tests per lab by test
method: – In-Lab: 67
– HST: 11
o The number of tests conducted
per lab in the last 12 months
Jul'15 - Jun'16 averaged: – In-Lab: 70
– HST: 12
11

©ResMed 2016 I
Volume of In-lab Sleep Tests Conducted Per Lab
80
68
72
79
67 69
66 66 67 68
73 67
66
49
60 64
50
56
49 48 50 51 55 53
10
20
30
40
50
60
70
80
90
100
Jul Aug Sep Oct Nov Dec Jan Feb Mar Apr May Jun
# o
f O
vern
igh
t Sl
eep
Tes
ts P
lus
HST
Volume of In-Lab Testing Per Lab
Mean
Median
o In June, the number of sleep
In-lab tests per lab: • Mean: 67
• Median: 53
• Range: 2-250
o The average number of tests
conducted per lab in the last 12
months Jul'15 - Jun'16 was 70
12

©ResMed 2016 I
Volume of Home Sleep Testing
17 16
17 18
16 16 16 16 16
16
17
15
9 9 9
11
8 8 9 9 9
8
11 11
2
4
6
8
10
12
14
16
18
20
Jul Aug Sep Oct Nov Dec Jan Feb Mar Apr May Jun
Avg
. # o
f H
om
e Sl
eep
Tes
ts C
on
du
cted
Volume of Home Sleep Testing Per Lab
Mean
Median
o Among those conducting
home testing in June, the
number of sleep tests
conducted per lab: • Mean: 15
• Median: 11
• Range: 1-93
o The average monthly number
of home tests conducted per
lab in the last 12 months,
Jul'15 - Jun'16 was 16
Range of Home Sleep Studies Conducted Per Lab
Jul Aug Sep Oct Nov Dec Jan Feb Mar Apr May Jun
1-80 1-101 1-110 1-155 1-110 1-149 1-157 1-153 1-106 1-129 1-186 1-93
Base: Labs conducting HST
13

©ResMed 2016 I 14
0%
10%
20%
30%
40%
50%
60%
70%
80%
90%
100%
o In June, cancellations per lab
averaged 9, with a range of 0-97 per
lab
o Cancellations per bed averaged 1.9
with a range of 0-16 per bed
o Cancellations as a percentage of
studies conducted averaged 14%,
with a range of 0%-89%
Volume of Patient Cancellations
Distribution of Cancellations as % of Total Tests Conducted
Can
cella
tio
ns
as %
of
Tota
l Te
sts
Co
nd
uct
ed
“Cancellation” is defined as an appointment
that is dropped and not rescheduled.
Average cancellations as a
percentage of studies = 14%

©ResMed 2016 I
PAP Device Scripting
o In June, 45% of sleep studies resulted in
a script for a PAP device
58.1%
29.9%
12.0%
PAP Device Scripting Split
CPAP APAP Bilevel
15

©ResMed 2016 I
Billing
o In June, 54% of sleep studies
were billed to private health
insurance and 31% were billed to
Medicare (traditional and/or
managed)
o 39% of labs reported tracking
insurance pre-authorizations
• Among those labs, an
average of 61% of studies
required pre-authorization,
with a range of 1-100%
50% 51% 51% 53% 53% 56%
47% 51% 54% 50% 53% 54%
33% 32% 33% 32% 28%
28%
35% 33% 30% 33%
33% 31%
16% 15% 14% 14% 18% 15% 16% 15% 15% 15% 13% 15%
1% 2% 2% 1% 1% 1% 1% 1% 1% 1% 2% 0%
Jul Aug Sep Oct Nov Dec Jan Feb Mar Apr May Jun0%
10%
20%
30%
40%
50%
60%
70%
80%
90%
100%
Billing Split Private insurance Medicare Medicaid Out of pocket

©ResMed 2016 I 17
oMonthly comparisons (month-to-month percent change) can
only be made using data from the exact same sleep labs.
o In the slides that follow, we refer to sleep labs who provided
their data for 2 months in a row as “repeat panel members”
Month-to-Month Trending
Jun- Jul
Jul- Aug
Aug- Sep
Sep- Oct
Oct- Nov
Nov- Dec
Dec- Jan
Jan- Feb
Feb- Mar
Mar- Apr
Apr- May
May- Jun
Number of Repeat Panel Members
142 111 126 133 117 128 130 129 144 140 125 124

©ResMed 2016 I
Month-to-Month Changes in Volume of In-lab Overnight Sleep Testing
4% 0%
-2%
5%
-5%
7%
-13%
8% 7%
0% 3%
1%
-50%
-40%
-30%
-20%
-10%
0%
10%
20%
30%
40%
50%
Volume of In-Lab Sleep Testing Month-to-Month % Change
% M
on
th-t
o-M
on
th C
han
ge
o For repeat panel members,
the volume of in-lab sleep
tests increased 1% from
May'16 - Jun'16
o There was a 1% increase
in monthly testing volume
over the last 12 months,
Jul'15 - Jun'16
18
Jun- Jul- Aug- Sep- Oct- Nov- Dec- Jan- Feb- Mar- Apr- May- Jul Aug Sep Oct Nov Dec Jan Feb Mar Apr May Jun

©ResMed 2016 I
Month-to-Month Changes in Volume of Home Sleep Testing
-1% -1%
6% 4% 0%
16%
-10%
6% 4%
-5%
5% 5%
-50%
-40%
-30%
-20%
-10%
0%
10%
20%
30%
40%
50%
Volume of Home Sleep Testing Month-to-Month % Change
% M
on
th-t
o-M
on
th C
han
ge
o For repeat panel members,
there was an increase of
5% in Home Sleep Testing
volumes from
May'16 - Jun'16
o On average, there was a
2% increase in monthly
testing volume over the last
12 months, Jul'15 - Jun'16
19
Jun- Jul- Aug- Sep- Oct- Nov- Dec- Jan- Feb- Mar- Apr- May- Jul Aug Sep Oct Nov Dec Jan Feb Mar Apr May Jun

©ResMed 2016 I
Month-to-Month Changes in Volume of Patient Cancellations
-2% -1% -4%
-16%
10%
3%
-7%
0%
-10% -5%
1% 4%
-50%
-40%
-30%
-20%
-10%
0%
10%
20%
30%
40%
50%
Volume of Patient Cancellations Month-to-Month % Change
% M
on
th-t
o-M
on
th C
han
ge
o For repeat panel
members, there was a 4%
increase in the number of
cancellations from
May'16 - Jun'16
o There was a 2% decrease
in cancellations on
average in the last 12
months, Jul'15 - Jun'16
20
Jun- Jul- Aug- Sep- Oct- Nov- Dec- Jan- Feb- Mar- Apr- May- Jul Aug Sep Oct Nov Dec Jan Feb Mar Apr May Jun

©ResMed 2016 I
Month to Month Change in % of Sleep Studies Resulting in Scripts
-5% -3% -1%
0%
-1%
0% 0% 0% 2% 0% 1%
-2%
-50%
-40%
-30%
-20%
-10%
0%
10%
20%
30%
40%
50%
Month to Month Change in % of Sleep Studies Resulting in Scripts
% M
on
th-t
o-M
on
th C
han
ge
o For repeat panel
members, there was a
2% decrease in the
percent of sleep studies
resulting in scripts from
May'16 - Jun'16
o On average, there was a
1% decrease in number
of studies resulting in
scripts in the last 12
months, Jul'15 - Jun'16
21
Jun- Jul- Aug- Sep- Oct- Nov- Dec- Jan- Feb- Mar- Apr- May- Jul Aug Sep Oct Nov Dec Jan Feb Mar Apr May Jun