SLAMS / NAMS / PAMS NETWORK REVIEW GUIDANCESLAMS/NAMS/PAMS NETWORK REVIEW GUIDANCE REVISED FINAL...
68
United States Office of Air Quality EPA-454/R-98-003 Environmental Protection Planning and Standards March 1998 Agency Research Triangle Park, NC 27711 Air SLAMS / NAMS / PAMS NETWORK REVIEW GUIDANCE
Transcript of SLAMS / NAMS / PAMS NETWORK REVIEW GUIDANCESLAMS/NAMS/PAMS NETWORK REVIEW GUIDANCE REVISED FINAL...

United States Office of Air Quality EPA-454/R-98-003Environmental Protection Planning and Standards March 1998Agency Research Triangle Park, NC 27711Air
SLAMS / NAMS / PAMS NETWORK REVIEW
GUIDANCE

SLAMS/NAMS/PAMS NETWORK REVIEW GUIDANCE
REVISED FINAL REPORT
Prepared for:
Edward Hanks (MD-14)Monitoring and Quality Assurance Group
Emissions, Monitoring, and Analysis DivisionU.S. Environmental Protection Agency
Research Triangle Park, North Carolina 27711
March 27, 1998
ii
TABLE OF CONTENTS
Section Page
List of Tables . . . . . . . . . . . . . . . . . . . . . . . . . . . . . . . . . . . . . . . . . . . . . . . . . . . . . . . . . . . . . . iii
1.0 INTRODUCTION . . . . . . . . . . . . . . . . . . . . . . . . . . . . . . . . . . . . . . . . . . . . . . . . . . . . . 1-11.1 PURPOSE OF GUIDANCE DOCUMENT . . . . . . . . . . . . . . . . . . . . . . . . . . 1-21.2 ORGANIZATION . . . . . . . . . . . . . . . . . . . . . . . . . . . . . . . . . . . . . . . . . . . . . 1-3
2.0 REGULATORY REQUIREMENTS AND OTHER DATA NEEDS . . . . . . . . . . . . . . . 2-12.1 APPENDIX D REQUIREMENTS . . . . . . . . . . . . . . . . . . . . . . . . . . . . . . . . . 2-1
2.1.1 Monitoring Objectives and Spatial Scales . . . . . . . . . . . . . . . . . . . . . . 2-12.1.2 Number of SLAMS Sites . . . . . . . . . . . . . . . . . . . . . . . . . . . . . . . . . . 2-42.1.3 Core SLAMS Monitoring Stations for PM . . . . . . . . . . . . . . . . . . . . 2-52.52.1.4 NAMS PM Design Criteria . . . . . . . . . . . . . . . . . . . . . . . . . . . . . . . 2-72.52.1.5 PAMS Design Criteria . . . . . . . . . . . . . . . . . . . . . . . . . . . . . . . . . . . 2-10
2.2 APPENDIX E REQUIREMENTS . . . . . . . . . . . . . . . . . . . . . . . . . . . . . . . . 2-122.3 OTHER AMBIENT AIR MONITORING DATA NEEDS . . . . . . . . . . . . . . 2-14
3.0 NETWORK REVIEW PROCEDURE . . . . . . . . . . . . . . . . . . . . . . . . . . . . . . . . . . . . . . 3-13.1 NETWORK REVIEW TEAM AND PREPARATION . . . . . . . . . . . . . . . . . . 3-13.2 NETWORK MODIFICATIONS . . . . . . . . . . . . . . . . . . . . . . . . . . . . . . . . . . 3-33.3 GUIDANCE TO DETERMINE CONFORMANCE WITH APPENDIX D
AND SPECIAL MONITORING REQUIREMENTS . . . . . . . . . . . . . . . . . . . 3-53.3.1 Number and Location of Monitors . . . . . . . . . . . . . . . . . . . . . . . . . . . 3-53.3.2 Checklists and Other Discussion Topics . . . . . . . . . . . . . . . . . . . . . . . 3-7
3.4 GUIDANCE TO DETERMINE CONFORMANCE WITH APPENDIX EREQUIREMENTS . . . . . . . . . . . . . . . . . . . . . . . . . . . . . . . . . . . . . . . . . . . . . 3-8
3.5 SUMMARY OF FINDINGS . . . . . . . . . . . . . . . . . . . . . . . . . . . . . . . . . . . . . 3-9
4.0 NETWORK REVIEW CHECKLISTS . . . . . . . . . . . . . . . . . . . . . . . . . . . . . . . . . . . . . . 4-1
5.0 REFERENCES . . . . . . . . . . . . . . . . . . . . . . . . . . . . . . . . . . . . . . . . . . . . . . . . . . . . . . . . 5-1
APPENDIX A EXAMPLE AIRS REPORTSAPPENDIX B EXAMPLE MAPS SHOWING EMISSION SOURCESAPPENDIX C REENGINEERING AIR MONITORING NETWORKSAPPENDIX D REFERENCE AND EQUIVALENT METHOD ANALYZERS
iii
LIST OF TABLES
Number Page
2-1 Relationship Among Monitoring Objectives and Scales of Representativeness . . . . . . . . . . . . . . . . . . . . . . . . . . . . . . . . . . . . . . . . . . . 2-2
2-2 Summary of Spatial Scales for SLAMS and Required Scales for NAMS . . . . . . . . . . . 2-32-3 State and Local Air Monitoring Stations Criteria for SO . . . . . . . . . . . . . . . . . . . . . . 2-422-4 Required Number of Core SLAMS for PM Sites According to MSA Population . . . 2-52.52-5 NAMS Monitoring Network Criteria . . . . . . . . . . . . . . . . . . . . . . . . . . . . . . . . . . . . . 2-82-6 National Air Monitoring Station Criteria for SO . . . . . . . . . . . . . . . . . . . . . . . . . . . . 2-922-7 Goals of Number of PM NAMS by Region . . . . . . . . . . . . . . . . . . . . . . . . . . . . . . . 2-92.52-8 PAMS Minimum Monitoring Network Requirements . . . . . . . . . . . . . . . . . . . . . . . . 2-112-9 Summary of Probe and Monitoring Path Siting Criteria . . . . . . . . . . . . . . . . . . . . . . 2-13

Statement
At the date of the finalization of this document (March 1998), revisions to the AmbientAir Quality Surveillance regulations as contained in CFR40 part 58 for the criteria pollutantssulfur dioxide (SO ) and lead (Pb) were in the final process of being implemented. Promulgation2
of the revision to the Pb regulation is expected by June 1998 and the revised SO regulation by2
December 1998. Please note, in order to be expedient in the preparation of this document, theproposed revisions to the guidance for Pb and SO were incorporated into the content.2
iv

1-1
1.0 INTRODUCTION
The Code of Federal Regulations, Title 40, Part 58 (40 CFR Part 58) contains the U.S.1
Environmental Protection Agency's (EPA) ambient air quality surveillance regulations. Section 58.20
requires States to provide for the establishment of air quality surveillance systems in their State
Implementation Plans (SIP). The air quality surveillance system consists of a network of monitoring
stations designated as State and Local Air Monitoring Stations (SLAMS), which measure ambient
concentrations of those pollutants for which standards have been established in 40 CFR Part 50.
SLAMS, National Air Monitoring Stations (NAMS), which are a subset of SLAMS, and
Photochemical Monitoring Stations (PAMS) must meet the requirements of 40 CFR Part 58,
Appendices A (Quality Assurance Requirements), C (Ambient Air Quality Monitoring Methodology),
D (Network Design Criteria), and E (Probe and Path Siting Criteria). Conformance with the
requirements of Appendices A and C is determined in part through periodic systems audits and
national performance audits which are required in Section 2.4 of Appendix A. Conformance with the
requirements of Appendices D and E is determined during the annual review of the air quality
surveillance system which States are required to provide for in 40 CFR 58.20(d). It is important to
note that this guidance focuses on an annual review of ambient monitoring networks (that is, the
number of monitoring stations, the types of stations, location of stations, and specific probe and open
path siting criteria). Guidance on agencies' quality assurance programs is not intended as part of this
network review guidance.
The annual network review is used to determine how well the network is achieving its
required air monitoring objectives, how well it is meeting data users needs, and how it should be
modified (e.g., through termination of existing stations, relocation of stations, or establishment of new
stations) to continue to meet its monitoring objectives and data needs. The main purpose of the
review is to improve the network to ensure that it provides adequate, representative, and useful air
quality data. Ambient air quality data from the network are used for a variety of purposes including
making national ambient air quality standards (NAAQS) attainment/nonattainment designations;
determining maximum concentration locations; determining the effectiveness of air pollution control
programs; evaluating the effects of air pollution levels on public health; tracking the progress of SIPs;

1-2
providing dispersion modeling support; developing responsible, cost-effective control strategies;
reconciling emission inventories; and developing air quality trends. In addition to these data uses or
needs, the annual network review should consider the adequacy of the network in meeting additional
performance objectives, including providing data for tracking State performance, measuring acidic
deposition and species concentrations in rainfall, measuring visibility and related parameters,
providing research information, and providing public information in general. These additional data
needs are discussed in more detail in Section 2.3.
1.1 PURPOSE OF GUIDANCE DOCUMENT
Because 40 CFR Part 58 does not specify network review criteria, the nature of the network
review has differed from Region to Region. The purpose of this network review guidance is to
provide the Part 58 regulatory background and appropriate technical criteria which form the basis for
the network review as well as to provide EPA's plans and strategies concerning non-regulatory data
needs which should be considered during the conduct of the annual network review. This guidance
is intended for Regional Office use in evaluating State and local agency networks, and it may also be
useful to State and local agencies in preparing for a network review. This guidance represents a
compilation of approaches currently practiced in the Regions. Its contents should not be viewed as
a prescriptive requirement that must be followed in its entirety but rather as a framework for
promoting national uniformity in the evaluation of State and local agency monitoring networks. EPA
Regional Offices and State and local agencies may identify additional items that need to be addressed
during the network review that will supplement this guidance and allow for dealing, on a case-by-case
basis, with significant network deficiencies which are identified during the course of the network
review. This guidance should be reviewed periodically to ensure that the policies and procedures
remain current and appropriate, and revised whenever the network design and siting criteria are
changed or more cost-effective and innovative procedures are developed.
1-3
1.2 ORGANIZATION
Section 2.0 of this guidance contains a summary of the regulatory requirements contained in
Appendices D and E as well as a description of other ambient air monitoring data needs that should
be considered during the network review. Section 3.0 provides an overview of network review
procedures to determine conformance with Appendix D and E requirements. Section 4.0 contains
an example checklist for conducting a network review. Section 5.0 includes a list of references.

2-1
2.0 REGULATORY REQUIREMENTS AND OTHER DATA NEEDS
2.1 APPENDIX D REQUIREMENTS
This section highlights the network design requirements and guidance included in Appendix
D of Part 58. Appendix D contains information on the concepts of ambient air monitoring network2
design for establishing the SLAMS, NAMS, and PAMS. It addresses monitoring objectives, criteria
for selecting general locations for monitoring stations, and guidance on the number and location of
NAMS, PAMS, and core stations for PM . The concepts and guidance contained in Appendix D2.5
as well as other non-regulatory EPA data needs should be considered in evaluating the adequacy of
the SLAMS/NAMS/PAMS networks.
2.1.1 Monitoring Objectives and Spatial Scales
Appendix D of Part 58 calls for the SLAMS monitoring network to be designed to meet a
minimum of six basic ambient air monitoring objectives. These six primary SLAMS objectives are
as follows:
(1) to determine highest concentrations expected to occur in the area covered by the
network;
(2) to determine representative concentrations in areas of high population density;
(3) to determine the impact on ambient pollution levels of significant sources or source
categories;
(4) to determine general background concentration levels;
(5) to determine the extent of Regional pollutant transport among populated areas, and
in support of secondary standards; and
(6) to determine the welfare-related impacts in more rural and remote areas (such as
visibility impairment and effects on vegetation).
The goal in designing the SLAMS networks is to establish monitoring stations that will provide data
to meet these monitoring objectives and as input to EPA and States to improve environmental
decisions.
2-2
Appendix D also provides guidance concerning the concept of spatial scales of
representativeness that individual stations in a SLAMS network should represent. Ideally, the
SLAMS monitor should be located such that the air quality of the volume of sampled air be
representative of the air quality over the entire area that the monitoring station is intended to
represent. The typical spatial scales of representativeness associated with most ambient monitoring
objectives are microscale, middle scale, neighborhood scale, urban scale, and regional scale. During
the station selection process, the goal is to match the spatial scale represented by the sample of
monitored air at a given location with the spatial scale most appropriate for the monitoring objective
of that respective station.
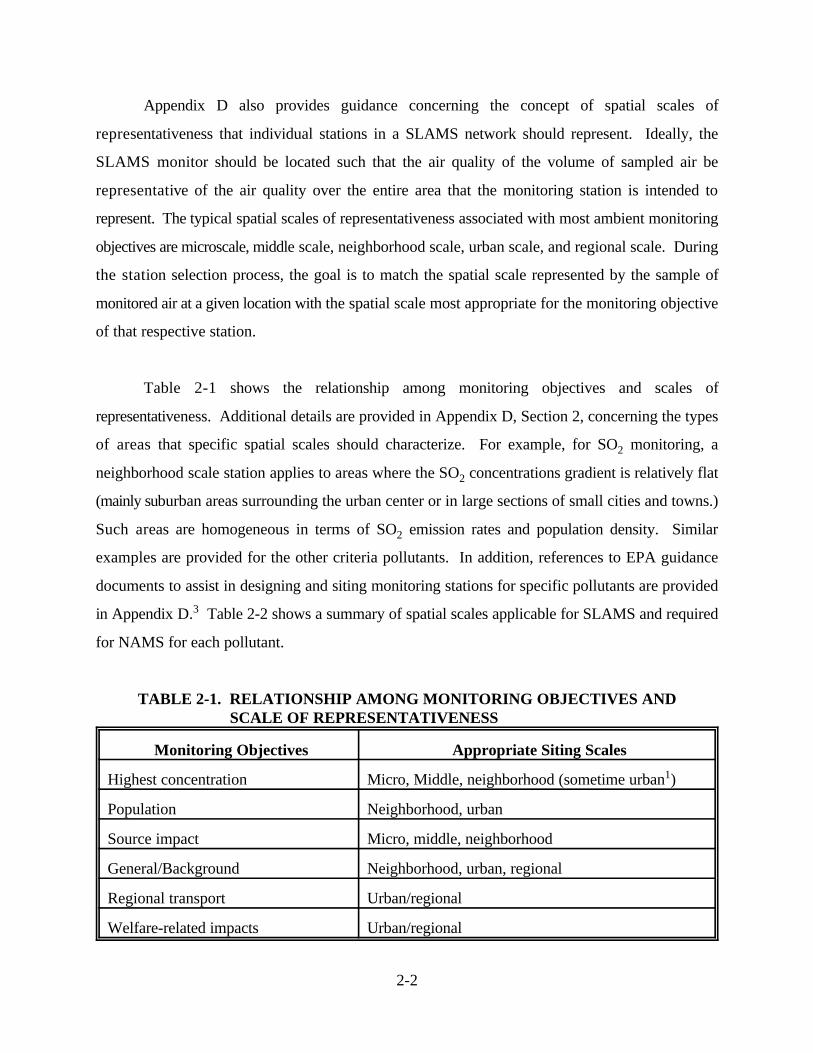
Table 2-1 shows the relationship among monitoring objectives and scales of
representativeness. Additional details are provided in Appendix D, Section 2, concerning the types
of areas that specific spatial scales should characterize. For example, for SO monitoring, a2
neighborhood scale station applies to areas where the SO concentrations gradient is relatively flat2
(mainly suburban areas surrounding the urban center or in large sections of small cities and towns.)
Such areas are homogeneous in terms of SO emission rates and population density. Similar2
examples are provided for the other criteria pollutants. In addition, references to EPA guidance
documents to assist in designing and siting monitoring stations for specific pollutants are provided
in Appendix D. Table 2-2 shows a summary of spatial scales applicable for SLAMS and required3
for NAMS for each pollutant.
TABLE 2-1. RELATIONSHIP AMONG MONITORING OBJECTIVES AND SCALE OF REPRESENTATIVENESS
Monitoring Objectives Appropriate Siting Scales
Highest concentration Micro, Middle, neighborhood (sometime urban )1
Population Neighborhood, urban
Source impact Micro, middle, neighborhood
General/Background Neighborhood, urban, regional
Regional transport Urban/regional
Welfare-related impacts Urban/regional
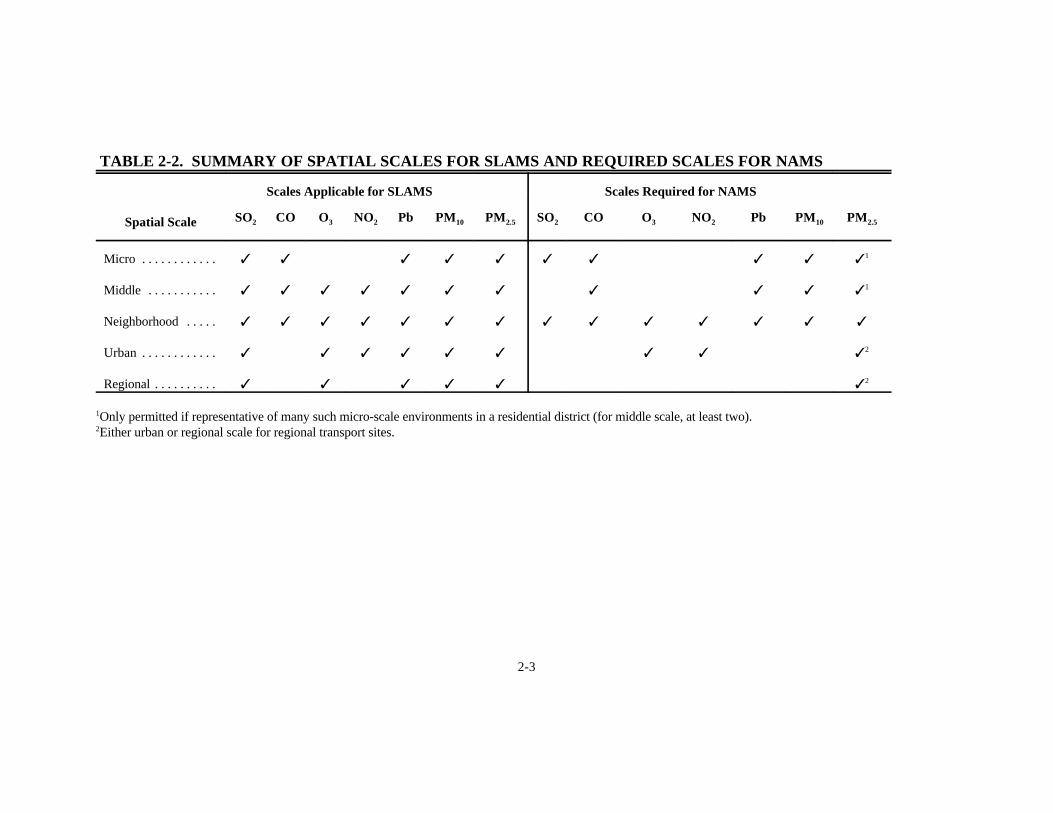
TABLE 2-2. SUMMARY OF SPATIAL SCALES FOR SLAMS AND REQUIRED SCALES FOR NAMS
Spatial Scale
Scales Applicable for SLAMS Scales Required for NAMS
SO CO O NO Pb PM PM SO CO O NO Pb PM PM2 3 2 10 2.5 2 3 2 10 2.5
Micro . . . . . . . . . . . .
Middle . . . . . . . . . . .
Neighborhood . . . . .
Urban . . . . . . . . . . . .
Regional . . . . . . . . . .
T T T T T T T T T T
T T T T T T T T T T T
T T T T T T T T T T T T T T
T T T T T T T T T
T T T T T T
1
1
2
2
Only permitted if representative of many such micro-scale environments in a residential district (for middle scale, at least two).1
Either urban or regional scale for regional transport sites.2
2-3

2-4
2.1.2 Number of SLAMS Sites
Appendix D to 40 CFR Part 58 does not contain criteria for determining the total number of
stations in the SLAMS networks except that a minimum number of SLAMS lead, SO , and PM4 5 62 2.5
sites are prescribed. Concerning the number of lead SLAMS monitors, EPA is requiring State and4
local agencies to focus their network design efforts on establishing lead monitoring stations around
lead stationary sources which generate or have the potential to generate exceedances of the quarterly
lead NAAQS. A number of these sources have been identified through EPA's ongoing lead NAAQS
attainment strategy, and ambient air monitoring stations have already been established around them.
Sources around which lead monitoring networks should be established are those emitting five or more
tons per year or smaller stationary sources which may be problematic based on the size of the facility
and their proximity to populated neighborhoods. EPA recommends a minimum of two lead sites per
source, one to measure stack impacts and the second to measure fugitive emissions. Other factors
such as topography, source type, proximity and locations of nearby populations may affect the
number of stations in the network.
Concerning the number of SLAMS SO monitors, a minimum number are required for those25
counties not within the boundaries of any Consolidated Metropolitan Statistical Area/Metropolitan
Statistical Area (CMSA/MSA). In addition, as listed in Table 2-3, a minimum number of SO2
SLAMS are required for targeted sources of SO emissions. Other than these requirements, EPA2
believes that the optimum size of a particular SLAMS network involves tradeoffs among data needs
and available resources which can best be resolved during the network design process.
TABLE 2-3. STATE AND LOCAL AIR MONITORING STATIONS CRITERIA FOR SO 2
Area SO Emissions (tons/year) Minimum Number of SO2 2Stations
Counties (or parts of >100,000 2counties) not included in any 20,000-100,000 1CMSA/MSA <20,000 0

2.1.3 Core SLAMS Monitoring Stations for PM2.5
Community-oriented core SLAMS PM sites are a subset of the SLAMS PM network that2.5 2.5
are sited to represent community-wide air quality and are located within monitoring planning areas
(MPAs). Such sites are located where people live, work, and play, as opposed to areas of expected
maximum concentrations from specific source emissions. MPAs are generally oriented toward areas
with populations greater than 200,000, but those portions of a State that are not associated with
MSAs can be considered as a single MPA. Within each MPA, the responsible air pollution control
agency shall install the following core PM sites:2.5
(a) At least two core PM SLAMS per MSA with population greater than 500,0002.5
sampling everyday, unless exempted by the Regional Administrator, including at least
one station in a population-oriented area of expected maximum concentration and at
least one station in an area of poor air quality and at least one additional core monitor
collocated at a PAMS site if the MPA is also a PAMS area.
(b) At least one core PM SLAMS per MSA with population greater than 200,000 and2.5
less than or equal to 500,000 sampling every third day.
(c) Additional core PM SLAMS per MSA with population greater than 1 million,2.5
sampling every third day, as specified in Table 2-4.
TABLE 2-4. REQUIRED NUMBER OF CORE SLAMS PM SITES2.5
ACCORDING TO MSA POPULATIONMSA Population Minimum Required No. of Core Sites1
>1M 3>2M 4>4M 6>6M 8>8M 10
Core SLAMS at PAMS are in addition to these numbers.1
____________________________
2-5

2-6
The site situated in the area of expected maximum concentration is termed a category a core
SLAMS site. The site located in the area of poor air quality with high population density or
representative of maximum population impact is analogous to NAMS, "category b." This second site
is a category b core SLAMS site.
Those MPAs that are substantially impacted by several different and geographically disjoint
local sources of fine particulate should have separate core sites to monitor each influencing source
region.
Within each MPA, one or more required core SLAMS may be exempted by the Regional
Administrator. This may be appropriate in areas where the highest concentration is expected to occur
at the same location as the area of maximum or sensitive population impact, or areas with low
concentrations (e.g., highest concentrations are less than 80 percent of the NAAQS). When only one
core monitor for PM is included in an MPA or optional Community Monitoring Zone (CMZ),2.5
however, a "category a" core site is strongly preferred to determine community-oriented PM2.5
concentrations in areas of high average PM concentration.2.5
In addition to the required core sites described in section 2.8.1.3 of 40 CFR Part 58 Appendix
D, the State shall also install and operate on an every third day sampling schedule at least one
SLAMS to monitor for regional background and at least one SLAMS to monitor regional transport.
These monitoring stations may be at a community-oriented site and their requirement may be satisfied
by a corresponding SLAMS monitor in an area having similar air quality in another State. The State
shall also be required to establish additional SLAMS sites based on the total population outside the
MSA(s) associated with MPAs that contain required core SLAMS. There shall be one such
additional SLAMS for each 200,000 people. The minimum number of SLAMS may be deployed
anywhere in the State to satisfy the SLAMS monitoring of small scale impacts which may not be
community-oriented or for regional transport. Detailed guidance on designing monitoring networks
for PM is contained in reference 7. The document defines concepts and terms of network design,2.5
presents a methodology for defining planning areas and community monitoring zones, identifies data
2-7
resources and the uses of those resources for network design, and provides some practical examples
of applying the guidance.
A table showing the required minimum number of CORE PM SLAMS and other PM2.5 2.5
SLAMS monitoring sites by State and by MSA/PMSA/Remainder of State is contained on EPA's
Ambient Monitoring Technology Information Web page. The table is listed under the PM2.5
Monitoring/Network Design area. The address is www.epa.gov/ttn/amtic/pmstg.html.
2.1.4 NAMS Design Criteria
Appendix D also describes monitoring objectives and criteria for determining the number and
location of NAMS and PAMS. The primary objective of the NAMS is to monitor in areas where the
pollutant concentration and population exposure are expected to be the highest consistent with the
averaging time of the NAAQS. The NAMS are a subset of SLAMS that focus on urban and
multisource areas. Criteria for determining the number of stations in the NAMS network are
specified in Appendix D and summarized in Table 2-5 and 2-6.
The PM NAMS are a subset of the core SLAMS and other regional transport SLAMS.2.5
They are intended as long-term monitoring stations concentrated in metropolitan areas. A target
range of 200 to 300 NAMS PM stations nationwide has been specified in the regulations. MSAs2.5
with a population greater than 1 million must have at least one PM NAMS. The total number is2.5
based on recommendations of EPA Regional Offices in partnership with State and local agencies.
Criteria for selecting the stations include the number and type of sources, ambient concentration of
particulate matter, and regional transport. Table 2-7 shows the target number of NAMS PM2.5
stations per Region.
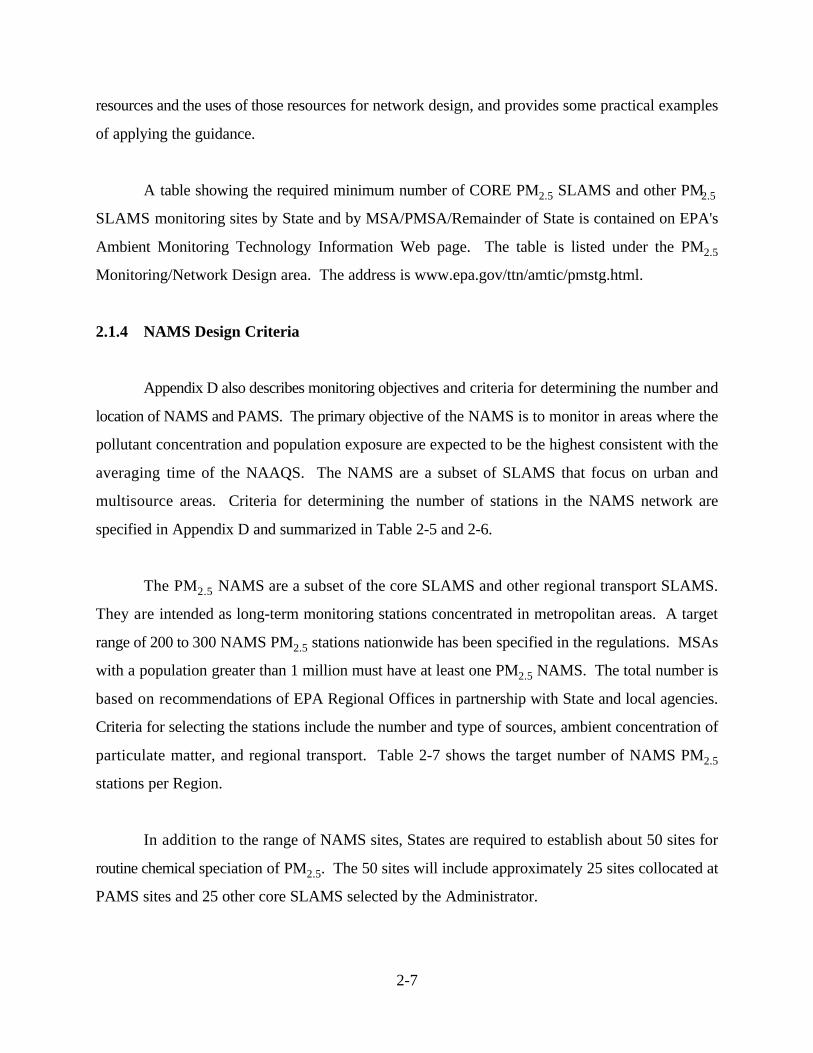
In addition to the range of NAMS sites, States are required to establish about 50 sites for
routine chemical speciation of PM . The 50 sites will include approximately 25 sites collocated at2.5
PAMS sites and 25 other core SLAMS selected by the Administrator.

TABLE 2-5. NAMS MONITORING NETWORK CRITERIA
Approximate Number of Stations Per Area
Pollutant UA/CMSA/MSA High Concentration Medium Concentration Low Concentration a a a
CO >500,000 $2 NA NA NA
Lead 1 NA NA NAfirst or second largestCMSA/MSA within each EPA
Region
b
NO >1,000,000 $2 NA NA NA2
Ozone >200,000 $2 NA NA NA
PM >1,000,000 -- 6-10 4-8 2-410a
500,000 - 1,000,000 -- 4-8 2-4 1-2
250,000 - 500,000 -- 3-4 1-2 0-1
100,000 - 250,000 1-2 0-1 0
For PMa10
24 Hr 1 MAX Value (µg/m ) Annual Arithmetic Mean (µg/m )st 3
$ 180 (high) $ 60$ 120 (medium) $ 40# 119 (low) # 39
3
In addition, one NAMS population-oriented site is required in each populated area (either a MSA/CMSA, town or county) where lead violations have been measuredb
over the most recent 8 calendar quarters.
2-8

2-9
TABLE 2-6. NATIONAL AIR MONITORING STATION CRITERIA FOR SO2
CMSA/MSA Population SO Emission (tons/year) Number SO Stations2
Minimum Required2
>1,000,000 200,000 3100,000-200,000 2
0-100,000 1
200,000-1,000,000 >200,000 3100,000-200,000 220,000-100,000 1
>20,000 0
50,000-200,000 >100,000 220,000-100,000 1
<20,000 0
TABLE 2-7. GOALS FOR NUMBER OF PM NAMS BY REGION2.5
EPA Region Number of NAMS Percent of National Totala
1 . . . . . . . . . . . . . . . . . . . . . 15 to 20 6 to 8
2 . . . . . . . . . . . . . . . . . . . . . 20 to 30 8 to 12
3 . . . . . . . . . . . . . . . . . . . . . 20 to 25 8 to 10
4 . . . . . . . . . . . . . . . . . . . . . 35 to 50 14 to 20
5 . . . . . . . . . . . . . . . . . . . . . 35 to 50 14 to 20
6 . . . . . . . . . . . . . . . . . . . . . 25 to 35 10 to 14
7 . . . . . . . . . . . . . . . . . . . . . 10 to 15 4 to 6
8 . . . . . . . . . . . . . . . . . . . . . 10 to 15 4 to 6
9 . . . . . . . . . . . . . . . . . . . . . 25 to 40 10 to 16
10 . . . . . . . . . . . . . . . . . . . . 10 to 15 4 to 6
Total . . . . . . . . . . . . . . . . . . 205-295 100
Each region will have one to three NAMS having the monitoring of regional transport as a primarya
objective.

2-10
2.1.5 PAMS Design Criteria
The PAMS also constitute a subset of the SLAMS and may be located coincident to SLAMS
or NAMS sites, as appropriate. 40 CFR Part 58 requires States to establish PAMS as part of their
SIP monitoring networks in the most problematic ozone nonattainment areas. While the SLAMS and
NAMS address only criteria pollutants, the PAMS stations sample for speciated volatile organic
compounds (VOCs) including carbonyls, ozone, oxides of nitrogen (NO ), and surface (10-meter)x
and upper air meteorological parameters. The principal reasons for requiring the collection of
additional ambient air pollutant and meteorological data are the lack of attainment of the ozone
NAAQS nationwide and the need for a more comprehensive air quality database for ozone and its
precursors.
The PAMS monitoring objectives are to supply information sufficient to (1) develop
responsible and cost-effective ozone control strategies; (2) provide appropriate data support for
photochemical grid modeling efforts; (3) allow the reconciliation of emissions inventories; (4) enable
characterization of ozone, ozone precursor, and meteorological trends; (5) provide for improved
assessments of ozone attainment; and (6) provide a measure of information for determining
population exposure.
In contrast to the SLAMS and NAMS network design and siting criteria, which are pollutant
specific, PAMS design considerations are site specific. Design criteria for PAMS are based on
selection of an array of site locations relative to ozone precursor source areas and predominant wind
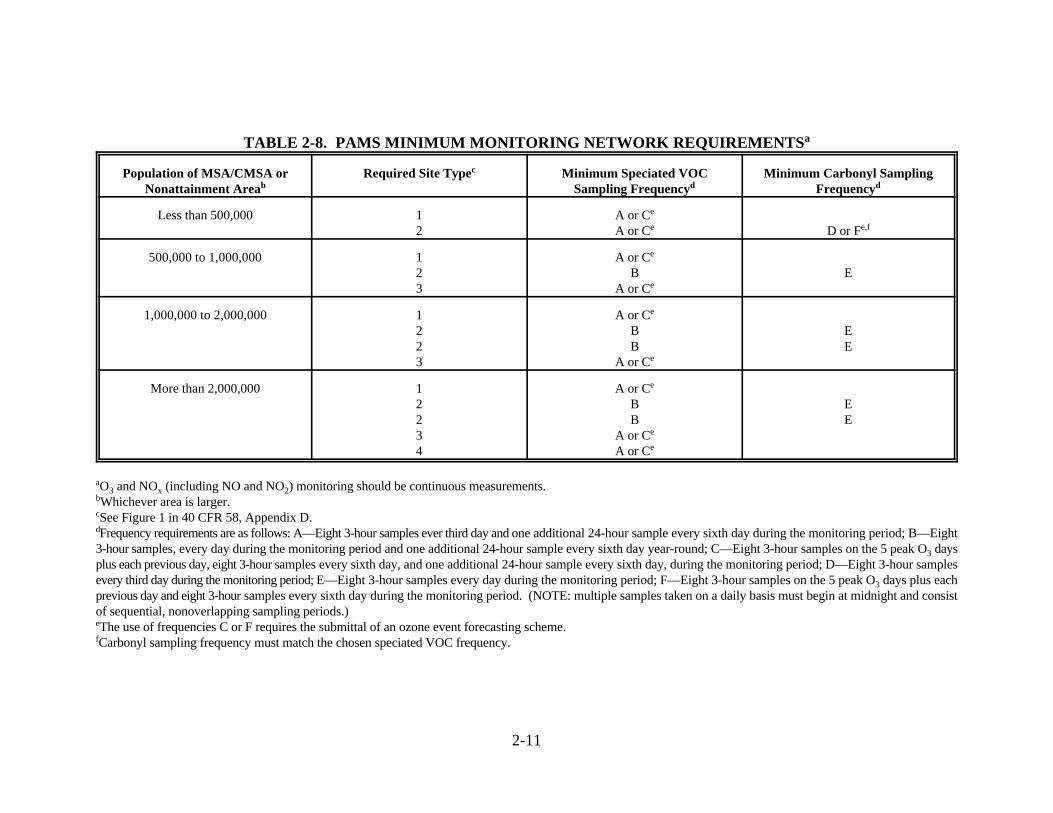
directions associated with high ozone events. A maximum of five PAMS sites is required in an
affected nonattainment area depending on the population of the MSA/CMSA or nonattainment area,
whichever is larger. Minimum network requirements are outlined in Table 2-8. As noted in the table,
the use of sampling frequencies C or F requires the submittal of an ozone event (peak day) forecasting
scheme. The ozone event forecasting and monitoring scheme should be submitted as part of the
PAMS network description required by Sections 58.40 and 58.41 and should be reviewed during each
annual network review specified in 58.20(d). More specific guidance on PAMS network design is
provided in the Updates to sections of the Implementation Manual which are regularly issued. For
2-11
TABLE 2-8. PAMS MINIMUM MONITORING NETWORK REQUIREMENTSa
Population of MSA/CMSA or Required Site Type Minimum Speciated VOC Minimum Carbonyl SamplingNonattainment Area Sampling Frequency Frequencyb
c
d d
Less than 500,000 1 A or C2 A or C D or F
e
e e,f
500,000 to 1,000,000 1 A or C2 B E3 A or C
e
e
1,000,000 to 2,000,000 1 A or C2 B E2 B E3 A or C
e
e
More than 2,000,000 1 A or C2 B E2 B E3 A or C4 A or C
e
e
e
O and NO (including NO and NO ) monitoring should be continuous measurements.a3 x 2
Whichever area is larger.b
See Figure 1 in 40 CFR 58, Appendix D.c
Frequency requirements are as follows: A—Eight 3-hour samples ever third day and one additional 24-hour sample every sixth day during the monitoring period; B—Eightd
3-hour samples, every day during the monitoring period and one additional 24-hour sample every sixth day year-round; C—Eight 3-hour samples on the 5 peak O days3plus each previous day, eight 3-hour samples every sixth day, and one additional 24-hour sample every sixth day, during the monitoring period; D—Eight 3-hour samplesevery third day during the monitoring period; E—Eight 3-hour samples every day during the monitoring period; F—Eight 3-hour samples on the 5 peak O days plus each3previous day and eight 3-hour samples every sixth day during the monitoring period. (NOTE: multiple samples taken on a daily basis must begin at midnight and consistof sequential, nonoverlapping sampling periods.)The use of frequencies C or F requires the submittal of an ozone event forecasting scheme.e
Carbonyl sampling frequency must match the chosen speciated VOC frequency.f

2-12
example, Appendix N, the PAMS Technical Assistance Document, was last issued in October 1994
in draft form, but updates to sections of the TAD have been ongoing. A major revision of the TAD
is to be issued in 1998. Check EPA's website for the most current version available.
2.2 APPENDIX E REQUIREMENTS
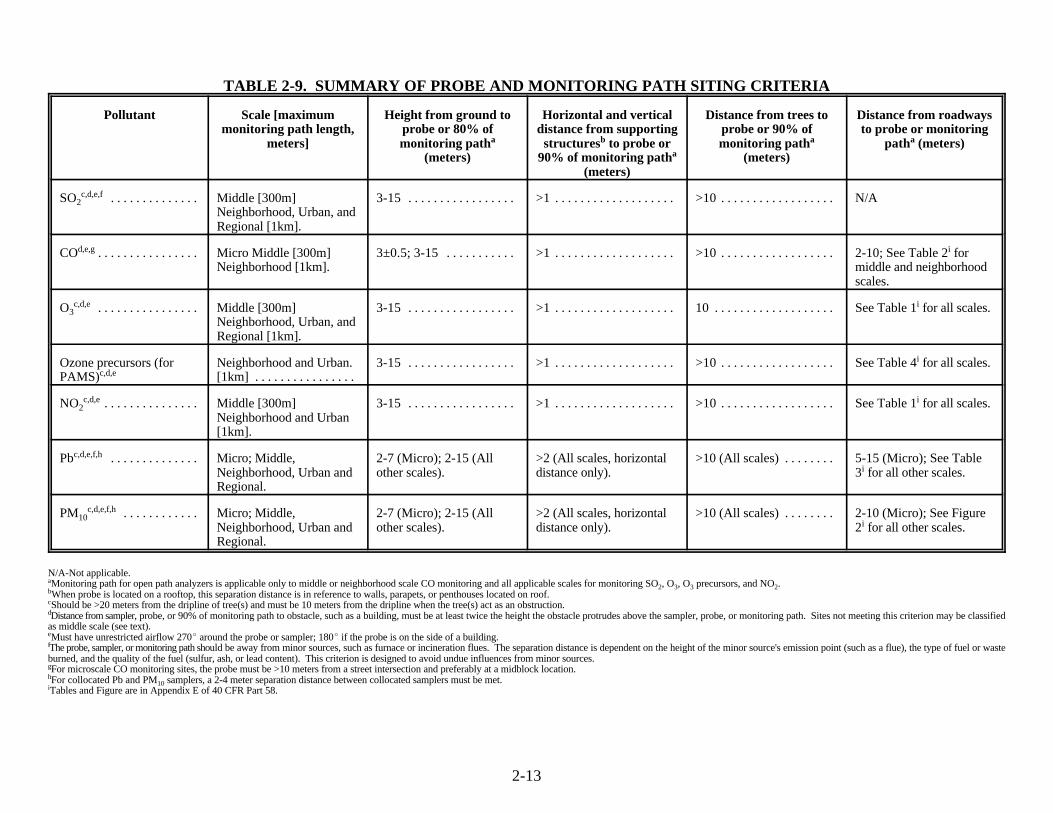
Appendix E contains siting criteria to be applied to ambient air quality analyzers or samplers8
after the general site location has been selected based on the monitoring objectives and spatial scales
of representativeness presented in Appendix D and summarized in Section 2.1 of this guidance. The
siting criteria presented in Appendix E are summarized in Table 2-9.
EPA believes that most sampling probes or monitors can be located so that they meet the
Appendix E siting requirements. Some existing stations, however, may not meet these requirements
and yet still produce useful data for some purposes. EPA will consider written requests from the
State to waive one or more siting criteria for some monitoring stations provided that the State can
demonstrate the following: (1) the site is as representative of the monitoring area as it would be if
siting criteria were met; and (2) the siting criteria cannot be met because of physical constraints (e.g.,
inability to locate the required type of station the necessary setback distance from roadways or
obstructions). Waivers may be granted to existing SLAMS if one of these criteria are met; waivers
may be granted for new SLAMS only if both criteria are met. Written requests for waivers must be
submitted to the Regional Administrator. For NAMS, the request will be forwarded to the
Administrator or the Administrator's designee.
For all SLAMS or NAMS sites the sampling lines and probe material must be borosilicate
glass, FEP teflon, or their equivalent. For those SLAMS designated as PAMS for VOC and carbonyl
sampling, only borosilicate glass, stainless steel, or their equivalent are acceptable probe materials.
Also, sampling probes for reactive gas monitors at SLAMS or NAMS must have a sample residence
time less than 20 seconds.
2-13
TABLE 2-9. SUMMARY OF PROBE AND MONITORING PATH SITING CRITERIA
Pollutant Scale [maximum Height from ground to Horizontal and vertical Distance from trees to Distance from roadwaysmonitoring path length, probe or 80% of distance from supporting probe or 90% of to probe or monitoring
meters] monitoring path structures to probe or monitoring path path (meters)a
(meters) 90% of monitoring path (meters)b
a
(meters)
a a
SO . . . . . . . . . . . . . .2c,d,e,f Middle [300m] 3-15 . . . . . . . . . . . . . . . . .
Neighborhood, Urban, andRegional [1km].
>1 . . . . . . . . . . . . . . . . . . . >10 . . . . . . . . . . . . . . . . . . N/A
CO . . . . . . . . . . . . . . . .d,e,g Micro Middle [300m] 3±0.5; 3-15 . . . . . . . . . . .Neighborhood [1km]. middle and neighborhood
>1 . . . . . . . . . . . . . . . . . . . >10 . . . . . . . . . . . . . . . . . . 2-10; See Table 2 fori
scales.
O . . . . . . . . . . . . . . . .3c,d,e Middle [300m] 3-15 . . . . . . . . . . . . . . . . .
Neighborhood, Urban, andRegional [1km].
>1 . . . . . . . . . . . . . . . . . . . 10 . . . . . . . . . . . . . . . . . . . See Table 1 for all scales.i
Ozone precursors (for Neighborhood and Urban. 3-15 . . . . . . . . . . . . . . . . .PAMS) [1km] . . . . . . . . . . . . . . . .c,d,e
>1 . . . . . . . . . . . . . . . . . . . >10 . . . . . . . . . . . . . . . . . . See Table 4 for all scales.i
NO . . . . . . . . . . . . . . .2c,d,e Middle [300m] 3-15 . . . . . . . . . . . . . . . . .
Neighborhood and Urban[1km].
>1 . . . . . . . . . . . . . . . . . . . >10 . . . . . . . . . . . . . . . . . . See Table 1 for all scales.i
Pb . . . . . . . . . . . . . .c,d,e,f,h Micro; Middle, 2-7 (Micro); 2-15 (All >2 (All scales, horizontal >10 (All scales) . . . . . . . .Neighborhood, Urban and other scales). distance only). 3 for all other scales.Regional.
5-15 (Micro); See Tablei
PM . . . . . . . . . . . .10c,d,e,f,h Micro; Middle, 2-7 (Micro); 2-15 (All >2 (All scales, horizontal >10 (All scales) . . . . . . . .
Neighborhood, Urban and other scales). distance only). 2 for all other scales.Regional.
2-10 (Micro); See Figurei
N/A-Not applicable.Monitoring path for open path analyzers is applicable only to middle or neighborhood scale CO monitoring and all applicable scales for monitoring SO , O , O precursors, and NO .a
2 3 3 2When probe is located on a rooftop, this separation distance is in reference to walls, parapets, or penthouses located on roof.b
Should be >20 meters from the dripline of tree(s) and must be 10 meters from the dripline when the tree(s) act as an obstruction.c
Distance from sampler, probe, or 90% of monitoring path to obstacle, such as a building, must be at least twice the height the obstacle protrudes above the sampler, probe, or monitoring path. Sites not meeting this criterion may be classifiedd
as middle scale (see text).Must have unrestricted airflow 270 around the probe or sampler; 180 if the probe is on the side of a building.e
The probe, sampler, or monitoring path should be away from minor sources, such as furnace or incineration flues. The separation distance is dependent on the height of the minor source's emission point (such as a flue), the type of fuel or wastef
burned, and the quality of the fuel (sulfur, ash, or lead content). This criterion is designed to avoid undue influences from minor sources.For microscale CO monitoring sites, the probe must be >10 meters from a street intersection and preferably at a midblock location.g
For collocated Pb and PM samplers, a 2-4 meter separation distance between collocated samplers must be met.h10
Tables and Figure are in Appendix E of 40 CFR Part 58.i
2-14
2.3 OTHER AMBIENT AIR MONITORING DATA NEEDS
In addition to the 40 CFR Part 58 Appendix D and E regulatory network requirements
pertaining to the number and location of ambient air monitoring stations established by State and local
agencies, there are a number of other ambient air monitoring data needs and uses that should be
considered when conducting State annual network reviews. EPA addresses some of these additional
ambient air data needs in its 1997 strategic plan, "Preparing for a New Era of Environmental
Protection," which was developed in response to the Government Performance and Results Act9
(GPRA). The strategic plan addresses EPA's mission, goals, strategies to meet those goals, and
performance measures for determining progress towards those goals.
EPA's clean air objectives focus on improving ambient air quality and visibility, reducing
emissions of toxic and other air pollutants, bringing all areas of the country into compliance with
national air quality standards, and reducing acid rain. EPA will measure performance in these areas
by directly measuring concentrations of air pollutants, calculating and estimating emissions of air
pollutants, measuring acidic deposition and concentrations in rainfall, measuring visibility, and
tracking the number and status of nonattainment areas.
Examples of additional monitoring data needs or performance measures and indicators to be
used or reported include trends in air quality for each of the criteria pollutants; number of days when
one or more air quality standards is exceeded in the nation's largest metropolitan areas, change in
average annual visibility impairment in national parks and wilderness areas (Class I areas), average
annual sulfate and nitrate concentrations in rainfall, and concentration and dry deposition of sulfate
and nitrate in particles. To help meet these data needs, the EPA, in conjunction with the
Environmental Commission of the States (ECOS), has established the National Environmental
Performance Partnership System (NEPPS). In 1997, nearly half the States have Performance
Partnership Agreements (PPAs) in place with EPA. Through these agreements, EPA and States
determine together what work, including the collection of ambient air quality data, will be performed
on an annual basis and how that work will be accomplished. Conformance with the air monitoring
performance measures contained in these PPAs should also be determined during the annual review.

2-15
A checklist for determining conformance with (non-regulatory) special monitoring program
requirements such as these is included in Section 4.

3-1
3.0 NETWORK REVIEW PROCEDURE
3.1 NETWORK REVIEW TEAM AND PREPARATION
Network review participants should include Regional Office and State agency personnel who
are experienced in conducting network reviews and are familiar with the procedures described in this
guidance. Regional Office participants might include the State Programs or Air Monitoring Section
or Branch Chief; the SLAMS, NAMS, and/or PAMS Coordinators; the AIRS contact; and the
Quality Assurance Officer. State agency participants might include field technicians, engineers,
chemists, air modelers, AIRS data processors, and other computer specialists.
Depending on available resources, network reviews may be conducted off-site (when
resources are limited) or on-site (when resources permit). In either case, sufficient information must
be provided to determine conformance of the network with regulatory network design and siting
requirements specified in 40 CFR Part 58, Appendices D and E as well as to determine conformance
of the network design and siting requirements specified for all special ambient air monitoring
networks.
Because the conduct of comprehensive network reviews is resource-intensive, it may be
necessary to prioritize agencies and/or pollutants to be reviewed. The following criteria are suggested
for the selection process:
Determine if the agency is operating and maintaining the required number of monitors asdescribed in 40 CFR Part 58 in a manner which reflects the regulation's intentDetermine if the agency is meeting the number of monitors required by all special monitoringnetworks (e.g., visibility, wet and dry deposition)Determine if the agency is operating existing special network monitors in accordance withapplicable documented requirementsConsider when the last review was conductedConsider areas where attainment/nonattainment redesignations are taking place or are likelyto take placeConsider results of special studies, saturation sampling, point source oriented ambientmonitoring, etc.Consider agencies which have proposed network modifications since the last network review

3-2
Consider agencies and networks which have not had any modifications or reviews in recenthistory that may have experienced significant population or emissions increases
In addition, pollutant-specific priorities may be considered (e.g., newly designated ozone
nonattainment areas, PM "problem areas", etc.).10
Once the agencies have been selected for review, significant data and information pertaining
to the review should be compiled and evaluated. Such information might include the following:
1. network files for the selected agency (including updated site information and site photographs)
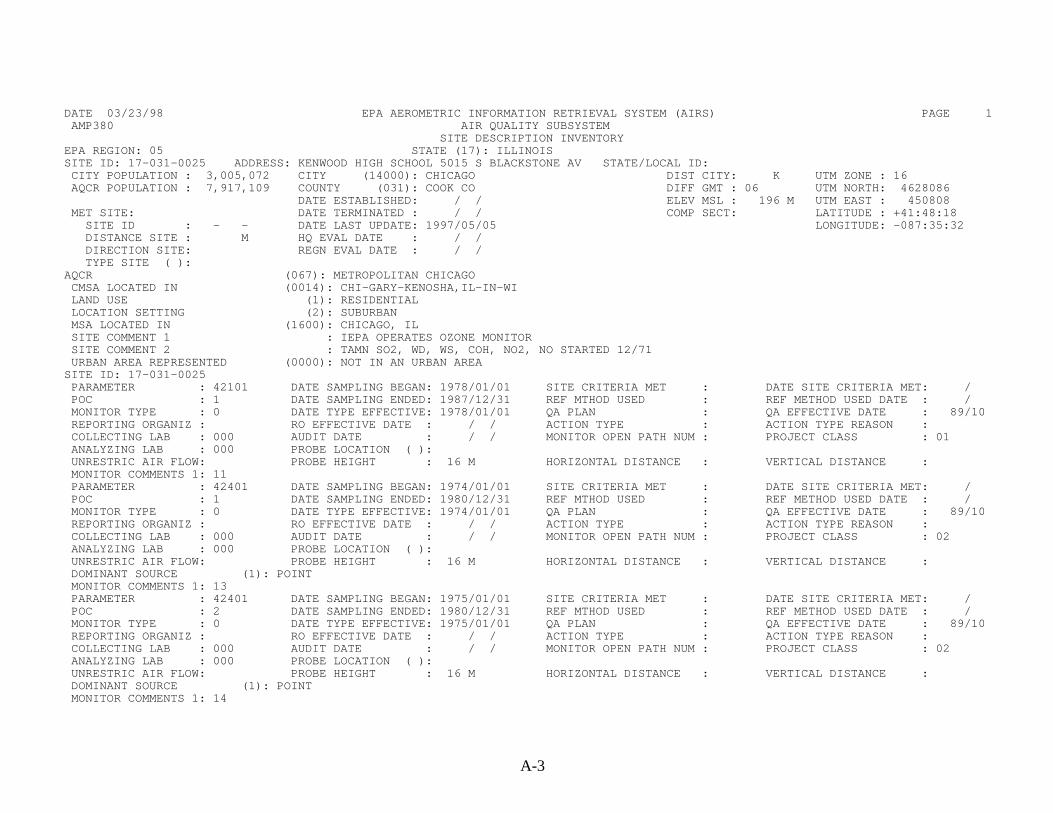
A. AIRS reports (See Appendix A)- AMP220, Monitoring Network Report- AMP225, PAMS Network Report- AMP380, Site Description Inventory- AMP390, Site Monitor Status- AMP450, Quick Look Report- AIRS Graphics Maps
B. air quality summaries for the past five years for the monitors in the network
C. emissions trends reports for major metropolitan area
D. emission information, such as emission density maps for the region in which the monitor islocated, and emission maps showing the major sources of emissions (see Appendix B)
E. National Weather Service summaries for monitoring network area
F. Topographical maps
2. Check information for last revision data
3. Check information for consistency
4. Note discrepancies on checklist and resolve with agency during network review. Any
discrepancies between the Agency network description and AIRS network description should
3-3
be noted and resolved with the agency during the review. Files and/or photographs that need
to be updated should also be identified.
5. Note whether the description of the network included in the QA Plan(s) is (are) correct. If not,
the description(s) should be updated.
AIRS Executive may be used to provide an executive summary of AIRS information that can
be viewed quickly and easily on a PC. AIRS Executive contains a subset of data extruded from AIRS
and is a useful tool in looking at certain site and air quality data.
3.2 NETWORK MODIFICATIONS
Modifications to the SLAMS, NAMS, and PAMS networks are addressed in 40 CFR 58.25,
58.36, and 58.46, respectively. Under Section 58.25, States are required to annually develop and
implement schedules to modify the SLAMS network to eliminate any unnecessary stations or to
correct any inadequacies indicated by the annual network review required by 58.20(d). During the
annual review, any changes to the NAMS network identified by the EPA and/or proposed by the
State and agreed to by the EPA will also be evaluated. As specified in Section 58.36, the State is
given one year (until the next annual review) to implement the appropriate changes to the NAMS
network. As part of the annual network review, evaluations of the special networks established as
partnership agreements between EPA and States should also be conducted. Modifications to these
networks should be recommended as a result of this annual review.
An important objective of the network modification process is determining whether or not
sufficient ambient air quality information and data are being provided by the regulatory and other
special monitoring networks to satisfy the principal data needs. If sufficient air quality data are not
being collected, the deficient areas must be identified and corrective action taken to resolve the
problem. Conversely, if it is determined that excessive data are being collected (e.g., there are
redundant sites resulting in data that agree closely), then efforts need to be taken to determine where
disinvestment should be made and on what schedule.

3-4
Network modifications may be initiated by the Regional Offices or proposed by the State and
agreed to by the EPA. Network modifications may result from revisions to the Part 58 regulations,
systems audits, site visits, or performance evaluations; special studies/saturation sampling; population
increases/decreases; air quality concentrations consistently recorded below the NAAQS; loss of
permission to use a site; demolition of a building which is used for monitoring; building construction;
growth of trees; changes in roadways; change in neighborhood type of use, etc. In addition,
modification may result from revisions to EPA/State PPAs.
In 1996, the Emissions, Monitoring and Analysis Division of EPA's Office of Air Quality
Planning and Standards initiated a series of meetings, conference calls, and other correspondence with
EPA Regions and State and local agencies for the purpose of "Re-Engineering" or restructuring the
ambient air monitoring program. The first phase of this re-engineering process was designed to
identify ambient monitoring program elements that could be modified over the short-term to generate
cost savings to be directed toward new PM monitoring efforts. 2.5
The EPA, with input from Regional Offices and State and local agencies, identified a number
of actions to be considered to generate savings which could be directed towards new monitoring
efforts such as PM or expanded ozone monitoring.2.5
The full report of the Reengineering Air Monitoring Networks Phase I results is included as
Appendix C. The report includes a summary of the work group efforts to provide suggestions for
modifying or reengineering the existing air monitoring networks. The report also includes a
discussion on potential savings for PAMS and criteria pollutants, the need for an improved oxides
of nitrogen database, and the need for implementing a new PM monitoring network. Additional2.5
topics addressed include the operation of several NARSTO Northeast sites by government and
private sector/academic groups, the management of the CASTNET program, the development of a
population-based exposure network for monitoring radioactivity of atmospheric aerosols, and the
importance of an increased emphasis on PAMS data analysis. The report closes with a discussion of
the topic "Continuing Reengineering Objectives."

3-5
3.3 GUIDANCE TO DETERMINE CONFORMANCE WITH APPENDIX D ANDSPECIAL MONITORING REQUIREMENTS
With regard to Appendix D requirements, the network reviewer must determine the adequacy
of the network in terms of number and location of monitors. Specifically, (1) is the agency meeting
the number of monitors required by the Part 58 Appendix D design criteria requirements?; and (2)
are the monitors properly located based on the monitoring objectives and spatial scales of
representativeness presented in Appendix D? For special monitoring networks, conformance
determinations would be conducted in accordance with program documents applicable to the special
networks.
3.3.1 Number and Location of Monitors
For SLAMS, which are not identified as NAMS or PAMS, the number of monitors required is
not specified in the regulations but rather is determined by the Regional Office and State agencies on
a case-by-case basis to meet the monitoring objectives specified in Appendix D. Adequacy of the
network may be determined by using a variety of tools, including the following:
analyses of historical monitoring datamaps of emission densitiesdispersion modelingspecial studies/saturation samplingbest professional judgementSIP requirementsrevised monitoring strategies (e.g., new regulations, lead strategy, reengineering air monitoringnetwork)monitoring network maps and network descriptions with site objectives defined
Information needed to make these determinations includes the following types of data:
emission inventory- State based- AIRS

3-6
meteorologicalclimatologicaltraffictopographicalhistorical- population- economic activityprojections- population- economic activityphotographs of current and potential sitescitizen complaints and public interest in monitoring networkenforcement actions
For NAMS, areas to be monitored must be selected based on urbanized population and pollutant
concentration levels. To determine whether the number of NAMS is adequate, the number of NAMS
operating is compared to the number of NAMS specified in 40 CFR 58 Appendix D and summarized
in Table 2-5 in this guidance. The number of NAMS operating can be determined from the AMP220
report in AIRS. The number of monitors required based on concentration levels and population can
be determined from the AMP450 report and the latest census population data.
For PAMS, the required number and type of monitoring sites and sampling requirements are
based on the population of the affected MSA/CMSA or ozone nonattainment area (whichever is
larger). PAMS minimum monitoring network requirements are summarized in Table 2-8.
For SLAMS, the location of monitors is not specified in the regulations, but is determined by
the Regional Office and State agencies on a case-by-case basis to meet the monitoring objectives
specified in Appendix D. Adequacy of the location of monitors can only be determined on the basis
of stated objectives. Many, if not all, of the tools and data listed in Section 3.3.1 for assessing the
adequacy of the number of monitors are also useful for assessing the adequacy of monitor locations.
In particular, maps, graphical overlays, and GIS-based information is extremely helpful in visualizing
or assessing the adequacy of monitor locations. Plots of potential emissions and/or historical
monitoring data versus monitor locations are especially useful. When questions arise about the

3-7
adequacy of a particular location, modeling or special studies (including saturation monitoring
studies) may be appropriate.
For NAMS, locations are based on the objectives specified in Appendix D, Section 3. Most
often, these locations are those that have high concentrations and large population exposure.
Population information may be obtained from the latest census data and ambient monitoring data from
the AMP450 Quick Look Report. If the zip codes for various monitoring locations are obtained, use
of electronic media census information and GIS-based information can be more easily combined with
ambient monitoring data.
For PAMS, there is considerable flexibility when locating each PAMS within a nonattainment
area or transport region. The three fundamental criteria which need to be considered when locating
a final PAMS site are: (1) sector analysis - the site needs to be located in the appropriate downwind
(or upwind) sector (approximately 45 ) using appropriate wind directions; (2) distance - the sites
should be located at distances appropriate to obtain a representative sample of the areas precursor
emissions and represent the appropriate monitoring scale; and (3) proximate sources.
For special monitoring for PPA, visibility, wet and dry deposition, etc., program documents
applicable to the network must be reviewed to determine the goals and specific siting criteria for the
network. Conformance with monitoring objective determinations of the special network should be
conducted using procedures similar to those used for Appendix D evaluations (i.e., are the number
of monitors appropriate and are the monitors properly located).
3.3.2 Checklists and Other Discussion Topics
Checklists are provided in Section 4.0 to assist network reviewers (SLAMS, NAMS, and PAMS
and special monitoring) in conducting the review. In addition to the items included in the checklists,
other subjects for possible discussion as part of the network review and overall adequacy of the
monitoring program include:

3-8
installation of new monitorsrelocation of existing monitorssiting criteria problems and suggested solutionsproblems with data submittals and data completenessmaintenance and replacement of existing monitors and related equipmentdata quality and other quality assurance problemsair quality studies and special monitoring programsother issues- proposed regulations- funding- etc.
3.4 GUIDANCE TO DETERMINE CONFORMANCE WITH APPENDIX EREQUIREMENTS
Applicable siting criteria for SLAMS, NAMS, and PAMS are specified in 40 CFR 58, Appendix
E. Because of limited travel funds, the number of on-site visits may have to be distributed as
resources permit (e.g., 5 to 20 percent of sites visited per year). The on-site visit itself consists of
the physical measurements and observations needed to determine compliance with the Appendix E
requirements, such as height above ground level, distance from trees, paved or vegetative ground
cover, etc.
Prior to the site visit, the reviewer should obtain and review the following:
most recent hard copy of site description (including any photographs)data on the seasons with the greatest potential for high concentrations for specified pollutantspredominant wind direction by season
The following materials should be brought to the site under review:
1. field notebook2. tape measure, measuring wheel, and/or range measuring system3. compass or clinometer4. camera with normal lens or video camcorder5. most recent hard copy of site description

3-9
6. copy of Appendix E probe siting criteria regulations7. review checklist for applicable pollutant(s)8. data on seasons for greatest pollutant concentrations and predominant wind direction(s) by
season
The checklist provided in Section 4.0 is also intended to assist the reviewer in determining
conformance with Appendix E. In addition to the items on the checklist, the reviewer should also do
the following:
ensure that the manifold and inlet probe are cleanestimate probe and manifold inside diameters and lengthsinspect the shelter for weather leaks, safety, and securitycheck equipment for missing parts, frayed cords, etc.check that monitor exhausts are not likely to be reentrained by the inletrecord findings in field notebook and/or checklisttake photographs/videotape in the 8 directionsdocument site conditions, with additional photographs/videotape
3.5 SUMMARY OF FINDINGS
Upon completion of the network review, a written network evaluation should be prepared. The
evaluation should include any deficiencies identified in the review, corrective actions needed to
address the deficiencies, and a schedule for implementing the corrective actions. The kinds of
discrepancies/deficiencies to be identified in the evaluation include discrepancies between the Agency
network description and the AIRS network description; and deficiencies in the number, location,
and/or type of monitors. The network evaluation should also highlight examples of what the network
does well, especially if deficiencies are relatively minor. Regions are encouraged to send copies of
the SLAMS, NAMS, and PAMS network reviews to OAQPS's Monitoring and Quality Assurance
Group.

4-1
4.0 NETWORK REVIEW CHECKLISTS
The following checklists are intended to assist reviewers in conducting a network review. The
checklist will help the reviewer to determine if the NAMS/SLAMS/PAMS regulatory network
conforms with the network design and siting requirements specified in Appendices D and E and with
other special monitoring requirements. Section I of the checklist includes general information on the
network. Section II addresses conformance with Appendix D requirements. Section III includes
pollutant-specific evaluation forms to address conformance with Appendix E requirements. Section
IV addresses conformance with special monitoring program requirements. In addition to completing
the checklist during the network review, the action items cited in Section 3.4 should also be used as
a guide during an onsite visit of a monitoring station.

NETWORK REVIEW CHECKLIST
SECTION I - GENERAL INFORMATION
Reviewer: Review Date:1. State or Local Agency:
Address
Contact
Telephone Number
2. Type of network review (check all that apply)9SLAMS 9NAMS 9PAMS 9SPM 9Othera
3. Network Summary DescriptionNumber of sites currently operating or temporarily inoperative (#30 days) Site type
SLAMS NAMS PAMS SPM Other TOTAL Collocated Index(excluding
NAMS/PAMS)
a
CO ---
Pb ---NO2
O3
PM2.5
PM ---10
SO2
VOC --- ---Carbonyls --- ---NOy
Surface MetUpper AirMet4. Network Description
Date of most current official network description? Yes No
Copy available for review? 9 9For each site, are the following items included: AIRS Site ID 9 9 Sampling and Analysis Method 9 9 Operative Schedule 9 9 Monitoring Objective 9 9 Scale of Representativeness 9 9 Zip Code 9 9 Information on three closest roads 9 9 Any Proposed Changes 9 9
5. Date of last network review?
4-2

4-3
6. Modifications made since last network reviewNumber of Monitors
Added Deleted RelocatedCO PbNO2O3PM2.5PM10SO2Total Suspended ParticulateFor PAMS:
VOCCarbonylsNOySurface MetUpper Air Met
7. Network Design and SitingSummarize any nonconformance with the requirements of 40 CFR 58, Appendices D and E found inSections II and III, and/or with other requirements found in Section IV.
AIRS Site ID Site Type Reason for NonconformanceCOPbNO2O3PM2.5PM10SO2VOCCarbonylsNOySurface MetUpper Air Met
8. List problems found, actions to be taken, corrective measures, etc. called for in the last network reviewthat still have not been addressed.
Visibility, wet/dry deposition, etc.a

4-4
SECTION II - EVALUATION OF CONFORMANCE WITH APPENDIX D REQUIREMENTSYes No
1. Is the Agency meeting the number of monitors required based on 40 CFR Part 58requirements?SLAMSNAMSPAMS
If no, explain:
Yes No2. Is the Agency operating existing monitors according to 40 CFR Part 58 requirements?
SLAMSNAMSPAMS
If no, explain:
Yes No3. Are monitors properly located based on monitoring objectives and spatial scales of
representativeness specified in Appendix D?SLAMSNAMSPAMS
If no, explain:
Yes No4. For PAMS, when C or F sampling frequency is used, has an ozone event forecasting
scheme been submitted and reviewed?
If no, explain:
Network Design/Review Determined by (check all that apply) Dispersion modeling Special studies (including saturation sampling) Best professional judgement Other (specify )
Comment (for example, SO dispersion modeling for urbanized area A; PM saturation study for urbanized2 10area B, etc.)
Evaluation was based on the following information (check all that apply):
emission inventory data traffic data AIRS site reports meteorological data topographic data site photographs, videotape, etc. climatological data historical data other (specify )

4-5
SECTION III - EVALUATION OF CONFORMANCE WITH APPENDIX E REQUIREMENTSIIIA - CARBON MONOXIDE NAMS/SLAMS SITE EVALUATION
Agency Site Name :
Make and Model # : of Instrument
Site Address :
City & State :
AIRS Site ID :
Date :
Observed by :
CRITERIA* REQUIREMENTS* OBSERVED CRITERIA MET?Yes No
Horizontal and Vertical 3 ±½ m for microscaleProbe Placement (Par. 4.1)
3-15 m for middle andneighborhood scale
Spacing from Obstructions 270 or 180 if on side of(Par. 4.2) buildingSpacing from Roads 2-10 m from edge of nearest(Par. 4.3) traffic lane for microscale;
10 m from intersection,preferably at midblockSee Table 1 for middle andneighborhood scale
Spacing from Trees (Par 4.4) Should be 10 m from N/Adripline of trees if tree is 5mabove sampler and is betweenthe probe and the road
Comments
*Citations from 40 CFR 58, Appendix E.

4-6
IIIB - LEAD NAMS/SLAMS SITE EVALUATION
Agency Site Name :
Make and Model # : of Instrument
Site Address :
City & State :
AIRS Site ID :
Date :
Observed by : CRITERIA* REQUIREMENTS* OBSERVED CRITERIA MET?
Yes NoVertical Probe Placement 2-7 m above ground for(Par. 7.1) microscale
2-15 m above ground for otherscales
Obstructions on Roof 2 m from walls, parapets,(Par. 7.2) penthouses, etc.Obstacle Distance (Par. 7.2) 2 x height differentialUnrestricted Airflow At least 270 (except for street(Par. 7.2) canyon sites)Furnace or Incinerator Flues N/A(Par. 7.2)
Recommended that none are inthe vicinity
Spacing from Station to 5-15 m for microscaleRoad (Par. 7.3)
See Table 4 for other scalesSpacing from Trees Microscale and middle scale(Par. 7.4) must not be any trees between
source (vehicles) and samplerNeighborhood scale should be N/A20 m from dripline of treesNeighborhood scale must be
10 m if trees are anobstruction
Comments
*Citations from 40 CFR 58, Appendix E.
4-7
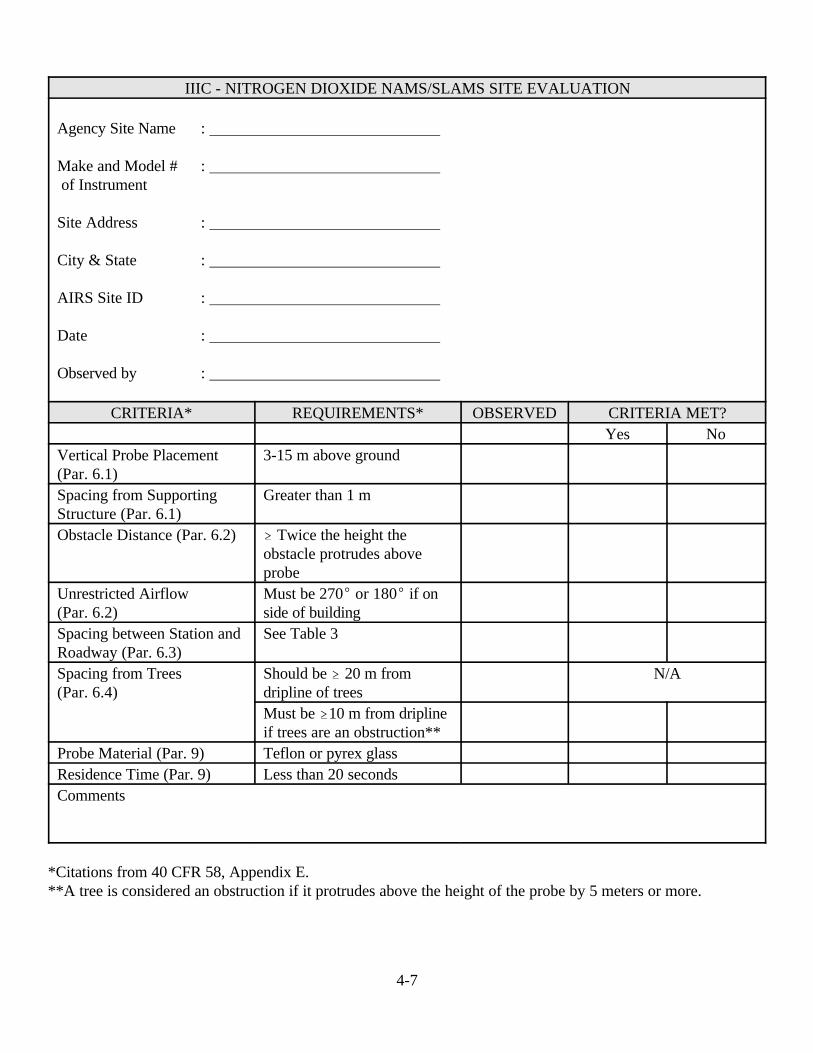
IIIC - NITROGEN DIOXIDE NAMS/SLAMS SITE EVALUATION
Agency Site Name :
Make and Model # : of Instrument
Site Address :
City & State :
AIRS Site ID :
Date :
Observed by :
CRITERIA* REQUIREMENTS* OBSERVED CRITERIA MET?Yes No
Vertical Probe Placement 3-15 m above ground (Par. 6.1)Spacing from Supporting Greater than 1 mStructure (Par. 6.1)Obstacle Distance (Par. 6.2) Twice the height the
obstacle protrudes aboveprobe
Unrestricted Airflow Must be 270 or 180 if on(Par. 6.2) side of buildingSpacing between Station and See Table 3Roadway (Par. 6.3)Spacing from Trees Should be 20 m from N/A(Par. 6.4) dripline of trees
Must be 10 m from driplineif trees are an obstruction**
Probe Material (Par. 9) Teflon or pyrex glassResidence Time (Par. 9) Less than 20 secondsComments
*Citations from 40 CFR 58, Appendix E.**A tree is considered an obstruction if it protrudes above the height of the probe by 5 meters or more.

4-8
IIID - OZONE NAMS/SLAMS SITE EVALUATION
Agency Site Name :
Make and Model # : of Instrument
Site Address :
City & State :
AIRS Site ID :
Date :
Observed by :
CRITERIA* REQUIREMENTS* OBSERVED CRITERIA MET?Yes No
Vertical Probe Placement 3-15 m above ground (Par. 5.1)Spacing from Supporting Greater than 1 mStructure (Par. 5.1)Obstacle Distance (Par. 5.2) Twice the height the
obstacle protrudes aboveprobe
Unrestricted Airflow Must include predominant(Par. 5.2) wind. 180 if on side of
building. Otherwise 270Spacing between Station and See Table 2Roadway (Par. 5.3)Spacing from Trees Should be 20 m from N/A(Par. 5.4) dripline
Must be 10 m if blockingdaytime wind from urbancore
Probe Material (Par. 9) Teflon or pyrex glassResidence Time (Par. 9) Less than 20 secondsComments
*Citations from 40 CFR 58, Appendix E.

4-9
IIIE - PM NAMS/SLAMS SITE EVALUATION2.5
Agency Site Name :
Make and Model # : of Instrument
Site Address :
City & State :
AIRS Site ID :
Date :
Observed by :
CRITERIA* REQUIREMENTS* OBSERVED CRITERIA MET?Yes No
Vertical Probe Placement 2-7 m above ground for(Par. 8.1) microscale
2-15 m above ground for otherscales
Obstructions on Roof 2 m from walls, parapets,penthouses, etc.
Spacing from Trees Should be 20 m from dripline N/A(Par. 8.2) of trees
Must be 10 m from dripline iftrees are an obstruction**
Obstacle Distance (Par. 8.2) 2 x height differential (streetcanyon sites exempt)
Unrestricted Airflow At least 270 including the(Par. 8.2) predominant wind directionFurnace or Incinerator Flues N/A(Par. 8.2)
Recommended that none are inthe vicinity
Distance between Collocated 1 to 4 mMonitors (Appendix A,Par. 3.5.2)Spacing from Station to See Par. 8.3 and/or Figure 2 ofRoad (Par. 8.3) Appendix EPaving (Par. 8.4) N/AArea should be paved or have
vegetative ground coverComments
*Citations from 40 CFR 58, Appendix E.**A tree is considered an obstruction if the distance between the tree(s) and the sampler is less than the height thatthe tree protrudes above the sampler.

4-10
IIIF - PM NAMS/SLAMS SITE EVALUATION10
Agency Site Name :
Make and Model # : of Instrument
Site Address :
City & State :
AIRS Site ID :
Date :
Observed by :
CRITERIA* REQUIREMENTS* OBSERVED CRITERIA MET?Yes No
Vertical Probe Placement 2-7 m above ground for(Par. 8.1) microscale
2-15 m above ground for otherscales
Obstructions on Roof 2 m from walls, parapets,penthouses, etc.
Spacing from Trees Should be 20 m from dripline N/A(Par. 8.2) of trees
Must be 10 m from dripline iftrees are an obstruction**
Obstacle Distance (Par. 8.2) 2 x height differential (streetcanyon sites exempt)
Unrestricted Airflow At least 270 including the(Par. 8.2) predominant wind directionFurnace or Incinerator Flues N/A(Par. 8.2)
Recommended that none are inthe vicinity
Distance between Collocated 2 to 4 mMonitors (Appendix A,Par. 3.3)Spacing from Station to See Par. 8.3 and/or Figure 2 ofRoad (Par. 8.3) Appendix EPaving (Par. 8.4) N/AArea should be paved or have
vegetative ground coverComments
*Citations from 40 CFR 58, Appendix E.**A tree is considered an obstruction if the distance between the tree(s) and the sampler is less than the height thatthe tree protrudes above the sampler.

4-11
IIIG - SULFUR DIOXIDE NAMS/SLAMS SITE EVALUATION
Agency Site Name :
Make and Model #of Instrument :
Site Address :
City & State :
AIRS Site ID :
Date :
Observed by :
CRITERIA* REQUIREMENTS* OBSERVED CRITERIA MET?Yes No
Horizontal and Vertical 3-15 m above groundProbe Placement (Par. 3.1)
> 1 m from supportingstructureAway from dirty, dusty areasIf on side of building, should N/Abe on side of prevailingwinter wind
Spacing from Obstructions 1 m from walls, parapets,(Par. 3.2) penthouses, etc.
If neighborhood scale, probemust be at a distance twicethe height the obstacleprotrudes above probe
270 arc of unrestrictedairflow around verticalprobes and wind during peakseason must be included inarc180 if on side of buildingNo furnace or incineration N/Aflues or other minor sourcesof SO should be nearby2
Spacing from Trees Should be 20 m from N/A(Par. 3.3) dripline of trees
10 m when trees act as anobstruction
*Citations from 40 CFR 58, Appendix E.

4-12
SECTION IV - EVALUATION OF CONFORMANCE WITH SPECIAL MONITORING PROGRAMREQUIREMENTS
Applicable Program (e.g., visibility, wet deposition, dry deposition) :
Make and Model #of Instruments :
Agency Site Name :
Site Address :
City & State :
AIRS Site ID :
Date :
Observed by :
References for Requirements : (e.g., visibility, SOPs including siting criteria)Are checklists, review forms included in references for requirements?
Yes No SomeIf some or yes, give number of forms . Attach complete forms to sheet.Include additional criteria below.
CRITERIA REQUIREMENT REFERENCE OBSERVED CRITERIA MET?Yes No N/A
Comments

5-1
5.0 REFERENCES
1. Code of Federal Regulations, Title 40, Part 58, "Ambient Air Quality surveillance and DataReporting," U.S. Government Printing Office, 1997.
2. Code of Federal Regulations, Title 40, Part 58, Appendix D, Network Design for State andLocal Air Monitoring Stations (SLAMS), National Air Monitoring Stations (NAMS), andPhotochemical Assessment Monitoring Stations (PAMS), U.S. Government Printing Office,1997.
3. Code of Federal Regulations, Title 40, Part 58, Appendix D, Section 6. References, NetworkDesign for State and Local Air Monitoring Stations (SLAMS), National Air Monitoring Stations(NAMS), and Photochemical Assessment Monitoring Stations (PAMS), U.S. GovernmentPrinting Office, 1997.
4. "Ambient Air Quality Surveillance for Lead," Proposed Direct Final Rule. Contained in EPA'sAMTIC web page, under Regulations/Proposed Regulations Parts 50, 53, 58, documentdescription is "Revision to Lead NAAQS will be final 15 days after comment period if noadverse comments are received."
5. "Requirements for Implementation Plans and Ambient Air Quality Surveillance for Sulfur Oxides(Sulfur Dioxide) National Ambient Air Quality Standards," Federal Register, Vol. 60, No. 44,March 7, 1995, pp. 12492-12519.
6. "Revised Requirements for Designation of Reference and Equivalent Methods for PM2.5 andAmbient Air Quality Surveillance for Particulate Matter; Final Rule," Federal Register, Vol. 62,No. 138, July 18, 1997.
7. U.S. Environmental Protection Agency. Guidance for Network Design and Optimum SiteExposure for PM and PM . Prepared by Desert Research Institute, U.S. EPA/OAQPS,2.5 10NOAA, December 15, 1997.
8. Code of Federal Regulations, Title 40, Part 58, Appendix E, Probe Siting Criteria for AmbientAir Quality Monitoring, U.S. Government Printing Office, 1997.
9. "Preparing for a New Era of Environmental Protection," U.S. EPA, 1997.

APPENDIX A
AMP220AMP225AMP380AMP390AMP450
A-1
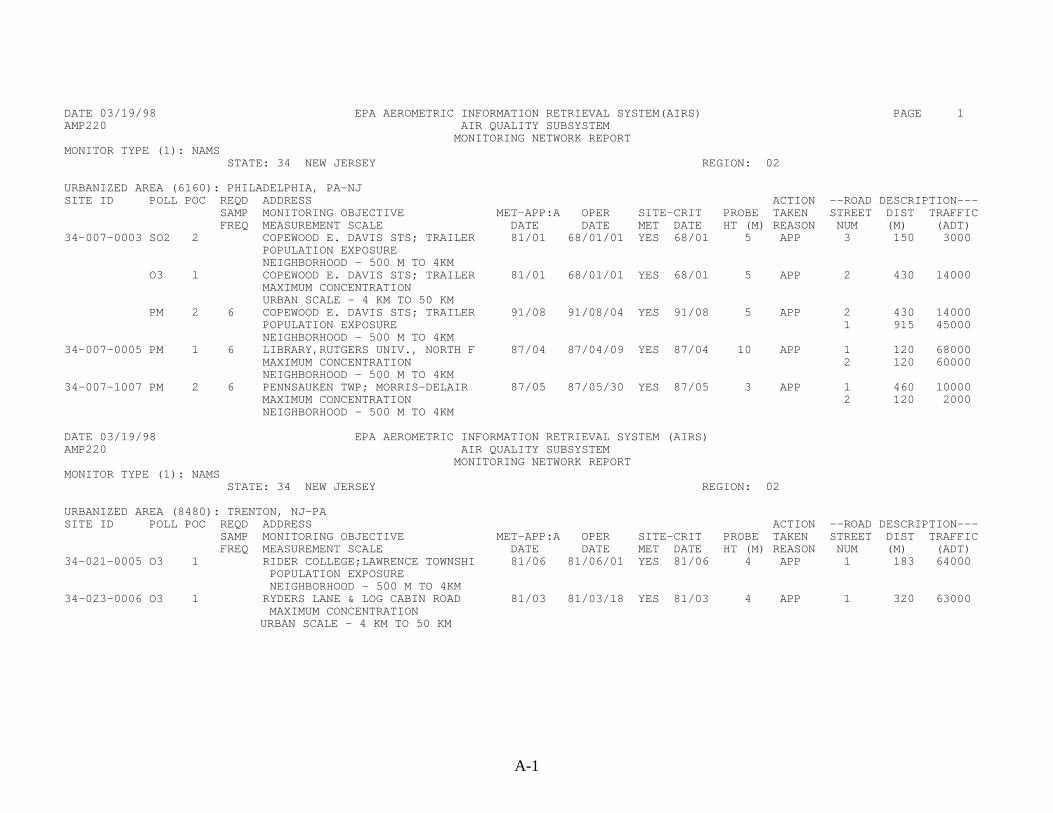
DATE 03/19/98 EPA AEROMETRIC INFORMATION RETRIEVAL SYSTEM(AIRS) PAGE 1AMP220 AIR QUALITY SUBSYSTEM MONITORING NETWORK REPORTMONITOR TYPE (1): NAMS STATE: 34 NEW JERSEY REGION: 02
URBANIZED AREA (6160): PHILADELPHIA, PA-NJSITE ID POLL POC REQD ADDRESS ACTION --ROAD DESCRIPTION--- SAMP MONITORING OBJECTIVE MET-APP:A OPER SITE-CRIT PROBE TAKEN STREET DIST TRAFFIC FREQ MEASUREMENT SCALE DATE DATE MET DATE HT (M) REASON NUM (M) (ADT)34-007-0003 SO2 2 COPEWOOD E. DAVIS STS; TRAILER 81/01 68/01/01 YES 68/01 5 APP 3 150 3000 POPULATION EXPOSURE NEIGHBORHOOD - 500 M TO 4KM O3 1 COPEWOOD E. DAVIS STS; TRAILER 81/01 68/01/01 YES 68/01 5 APP 2 430 14000 MAXIMUM CONCENTRATION URBAN SCALE - 4 KM TO 50 KM PM 2 6 COPEWOOD E. DAVIS STS; TRAILER 91/08 91/08/04 YES 91/08 5 APP 2 430 14000 POPULATION EXPOSURE 1 915 45000 NEIGHBORHOOD - 500 M TO 4KM34-007-0005 PM 1 6 LIBRARY,RUTGERS UNIV., NORTH F 87/04 87/04/09 YES 87/04 10 APP 1 120 68000 MAXIMUM CONCENTRATION 2 120 60000 NEIGHBORHOOD - 500 M TO 4KM34-007-1007 PM 2 6 PENNSAUKEN TWP; MORRIS-DELAIR 87/05 87/05/30 YES 87/05 3 APP 1 460 10000 MAXIMUM CONCENTRATION 2 120 2000 NEIGHBORHOOD - 500 M TO 4KM
DATE 03/19/98 EPA AEROMETRIC INFORMATION RETRIEVAL SYSTEM (AIRS) AMP220 AIR QUALITY SUBSYSTEM MONITORING NETWORK REPORTMONITOR TYPE (1): NAMS STATE: 34 NEW JERSEY REGION: 02
URBANIZED AREA (8480): TRENTON, NJ-PASITE ID POLL POC REQD ADDRESS ACTION --ROAD DESCRIPTION--- SAMP MONITORING OBJECTIVE MET-APP:A OPER SITE-CRIT PROBE TAKEN STREET DIST TRAFFIC FREQ MEASUREMENT SCALE DATE DATE MET DATE HT (M) REASON NUM (M) (ADT)34-021-0005 O3 1 RIDER COLLEGE;LAWRENCE TOWNSHI 81/06 81/06/01 YES 81/06 4 APP 1 183 64000 POPULATION EXPOSURE NEIGHBORHOOD - 500 M TO 4KM34-023-0006 O3 1 RYDERS LANE & LOG CABIN ROAD 81/03 81/03/18 YES 81/03 4 APP 1 320 63000 MAXIMUM CONCENTRATION
URBAN SCALE - 4 KM TO 50 KM

A-2
DATE 03/23/98 EPA AEROMETRIC INFORMATION RETRIEVAL SYSTEM (AIRS) PAGE 1 AMP225 AIR QUALITY SUBSYSTEM PAMS MONITORING NETWORK REPORTMONITOR TYPE (6): PAMS METEORLOGICAL AND VOC REGION: 09 STATE (06): CALIFORNIA ( ):SITE-INFORMATION----------------------- MONITOR INFORMATION------------------------------------------------------------------------SITE-ID ADDRESS CITY, STATETYPE SITE / DESCRIPTION ROAD # / DATE EFFECTIVE SITE CRIT MET PARAMETER / DESCRIPTION POC DISTANCE PROBE SAMPLING APP DATE ACTION TYPE ROAD (#) / NAME / TRAFFIC FLOW SAMPLING FREQUENCY DESCRIPTION ROAD (M) HT(M) BEGAN AS PAMS ACTION REASON ---------------------------------------- ------------------------------ --- -------- ----- -------- --------- ------------- 06-019-4001 (42600) REACTIVE OXIDES OF N 1 (1) 10 6 06/07/95 06/07/95 Y 9240 S. RIVERBEND, PARLIER 93648 DAILY: 24 - 1 HR SAMPLES -PAMS (2) 800 APP PARLIER, CA 96(3) MAX OZONE CONCENT (42601) NITRIC OXIDE 1 (1) 10 6 01/01/94 06/07/95 Y DAILY: 24 - 1 HR SAMPLES -PAMS (2) 800 DAILY: 24 - 1 HR SAMPLES -PAMS (2) 800 96 96 APP(1) SMITH, 000500 ADT (42603) OXIDES OF NITROGEN 1 (1) 10 6 01/01/94 06/07/95 Y(2) MANNING AVE., 013051 ADT DAILY: 24 - 1 HR SAMPLES -PAMS (2) 800 APP 96 (43101) TOTAL HYDROCARBONS 1 (1) 10 6 06/07/95 06/07/95 Y DAILY: 24 - 1 HR SAMPLES -PAMS (2) 800 APP 96- - - (61101) WIND SPEED 1 (1) 10 6 07/21/87 06/07/95 Y 9240 S. RIVERBEND, PARLIER 93648 DAILY: 24 - 1 HR SAMPLES -PAMS (2) 800 APP PARLIER, CA 96 (61102) WIND DIRECTION 1 (1) 10 6 07/21/87 06/07/95 Y DAILY: 24 - 1 HR SAMPLES -PAMS (2) 800 APP 96 (62101) OUTDOOR TEMPERATURE 1 (1) 10 6 06/07/95 06/07/95 Y DAILY: 24 - 1 HR SAMPLES -PAMS (2) 800 APP 96 (62201) RELATIVE HUMIDITY 1 (1) 10 6 06/07/95 06/07/95 Y DAILY: 24 - 1 HR SAMPLES -PAMS (2) 800 APP
9240 S. RIVERBEND, PARLIER 93648 (63301) SOLAR RADIATION 1 (1) 10 6 06/07/95 06/07/95 Y PARLIER, CA DAILY: 24 - 1 HR SAMPLES -PAMS (2) 800 APP 96 (63302) ULTRVIOLET RADIATION 1 (1) 10 6 06/07/95 06/07/95 Y DAILY: 24 - 1 HR SAMPLES -PAMS (2) 800 APP 96 (64101) BAROMETRIC PRESSURE 1 (1) 10 6 06/07/95 06/07/95 Y
A-3
DATE 03/23/98 EPA AEROMETRIC INFORMATION RETRIEVAL SYSTEM (AIRS) PAGE 1 AMP380 AIR QUALITY SUBSYSTEM SITE DESCRIPTION INVENTORYEPA REGION: 05 STATE (17): ILLINOISSITE ID: 17-031-0025 ADDRESS: KENWOOD HIGH SCHOOL 5015 S BLACKSTONE AV STATE/LOCAL ID: CITY POPULATION : 3,005,072 CITY (14000): CHICAGO DIST CITY: K UTM ZONE : 16 AQCR POPULATION : 7,917,109 COUNTY (031): COOK CO DIFF GMT : 06 UTM NORTH: 4628086 DATE ESTABLISHED: / / ELEV MSL : 196 M UTM EAST : 450808 MET SITE: DATE TERMINATED : / / COMP SECT: LATITUDE : +41:48:18 SITE ID : - - DATE LAST UPDATE: 1997/05/05 LONGITUDE: -087:35:32 DISTANCE SITE : M HQ EVAL DATE : / / DIRECTION SITE: REGN EVAL DATE : / / TYPE SITE ( ):AQCR (067): METROPOLITAN CHICAGO CMSA LOCATED IN (0014): CHI-GARY-KENOSHA,IL-IN-WI LAND USE (1): RESIDENTIAL LOCATION SETTING (2): SUBURBAN MSA LOCATED IN (1600): CHICAGO, IL SITE COMMENT 1 : IEPA OPERATES OZONE MONITOR SITE COMMENT 2 : TAMN SO2, WD, WS, COH, NO2, NO STARTED 12/71 URBAN AREA REPRESENTED (0000): NOT IN AN URBAN AREASITE ID: 17-031-0025 PARAMETER : 42101 DATE SAMPLING BEGAN: 1978/01/01 SITE CRITERIA MET : DATE SITE CRITERIA MET: / POC : 1 DATE SAMPLING ENDED: 1987/12/31 REF MTHOD USED : REF METHOD USED DATE : / MONITOR TYPE : 0 DATE TYPE EFFECTIVE: 1978/01/01 QA PLAN : QA EFFECTIVE DATE : 89/10 REPORTING ORGANIZ : RO EFFECTIVE DATE : / / ACTION TYPE : ACTION TYPE REASON : COLLECTING LAB : 000 AUDIT DATE : / / MONITOR OPEN PATH NUM : PROJECT CLASS : 01 ANALYZING LAB : 000 PROBE LOCATION ( ): UNRESTRIC AIR FLOW: PROBE HEIGHT : 16 M HORIZONTAL DISTANCE : VERTICAL DISTANCE : MONITOR COMMENTS 1: 11 PARAMETER : 42401 DATE SAMPLING BEGAN: 1974/01/01 SITE CRITERIA MET : DATE SITE CRITERIA MET: / POC : 1 DATE SAMPLING ENDED: 1980/12/31 REF MTHOD USED : REF METHOD USED DATE : / MONITOR TYPE : 0 DATE TYPE EFFECTIVE: 1974/01/01 QA PLAN : QA EFFECTIVE DATE : 89/10 REPORTING ORGANIZ : RO EFFECTIVE DATE : / / ACTION TYPE : ACTION TYPE REASON : COLLECTING LAB : 000 AUDIT DATE : / / MONITOR OPEN PATH NUM : PROJECT CLASS : 02 ANALYZING LAB : 000 PROBE LOCATION ( ): UNRESTRIC AIR FLOW: PROBE HEIGHT : 16 M HORIZONTAL DISTANCE : VERTICAL DISTANCE : DOMINANT SOURCE (1): POINT MONITOR COMMENTS 1: 13 PARAMETER : 42401 DATE SAMPLING BEGAN: 1975/01/01 SITE CRITERIA MET : DATE SITE CRITERIA MET: / POC : 2 DATE SAMPLING ENDED: 1980/12/31 REF MTHOD USED : REF METHOD USED DATE : / MONITOR TYPE : 0 DATE TYPE EFFECTIVE: 1975/01/01 QA PLAN : QA EFFECTIVE DATE : 89/10 REPORTING ORGANIZ : RO EFFECTIVE DATE : / / ACTION TYPE : ACTION TYPE REASON : COLLECTING LAB : 000 AUDIT DATE : / / MONITOR OPEN PATH NUM : PROJECT CLASS : 02 ANALYZING LAB : 000 PROBE LOCATION ( ): UNRESTRIC AIR FLOW: PROBE HEIGHT : 16 M HORIZONTAL DISTANCE : VERTICAL DISTANCE : DOMINANT SOURCE (1): POINT MONITOR COMMENTS 1: 14

A-4
DATE 03/23/98 EPA AEROMETRIC INFORMATION RETRIEVAL SYSTEM (AIRS) PAGE 1 AMP390 AIR QUALITY SUBSYSTEM SITE MONITOR STATUS REPORT CURRENT VALUES FOR SITE 17-031-0026 : REGION: 05 STATE: ILLINOIS ADDRESS: CERMAK PMG STATION 735 W HARRISON DISTANCE CITY: 001 KM ELEVATION MSL: 180 M COMPASS SECTOR SE LONGITUDE 87:38:42 W LATITUDE 41:52:24 N METHOD OF DET: UTM ZONE 16 UTM EASTING 446469 UTM NORTHING 4635707 SCALE: EST OF ACC: MSA: (1600) CHICAGO, IL AQCR: (067) METROPOLITAN CHICAGO CITY: (14000) CHICAGO LAND USE: (7) MOBILE LOCATION-SETTING: (1) URBAN AND CENTE SUPPORT AGENCY: (001) ILLINOIS ENVIRONMENTAL PROTECT HQ EVAL DATE: / / RG EVAL DATE: / / PAMS INFORMATION: TYPE PAMS SITE (1) () (2) () (3) () MSA REP. (0) (0) (0) CMSA REP. (0) (0) (0) PAMS MET SITE TYPE: MET AIRS ID: TANGENT STREET NUM (1) 1 (2) 2 (3) (4) (5) (6) STREET NAME DAN RYAN HARRISON TYPE ROAD (2) EXPRESSWAY (5) THRU ST OR TRAFFIC FLOW 261200 8600 0 0 0 0 YR OF TRAF FLOW 1991 1979 DIR TO STREET E N PARAMETER-POC 12136-1 12154-1 12164-1 MONITOR TYPE-DATE 0 - 1986/01/01 3 - 1988/09/01 3 - 1990/01/05 NON-ATTAINMENT AREA - - - URBAN AREA REPRESENTED (1601) CHICAGO, IL-NORTHWESTERN (1601) CHICAGO, IL-NORTHWESTERN (1601) CHICAGO, IL-NORTHWESTERN ACTION TAKEN ACTION REASON COLLECTING LAB 003 - COOK COUNTY DEPARTMENT OF 001 - ILLINOIS ENVIRONMENTAL PR 001 - ILLINOIS ENVIRONMENTAL PR ANALYZING LAB 003 - COOK COUNTY DEPARTMENT OF 001 - ILLINOIS ENVIRONMENTAL PR 001 - ILLINOIS ENVIRONMENTAL PR REPORT ORGANIZATION 003 - COOK COUNTY DEPARTMENT OF 001 - ILLINOIS ENVIRONMENTAL PR 001 - ILLINOIS ENVIRONMENTAL PR REPORT ORG DATE 1995/01/01 1988/09/01 1990/01/05 DOMINANT SOURCE MEASUREMENT SCALE PROBE HEIGHT 8 METERS 0 METERS 5 METERS PROBE LOCATION HORIZONTAL DISTANCE 0 METERS 0 METERS 0 METERS VERTICAL DISTANCE 0 METERS 0 METERS 0 METERS SITING CRITERIA-DATE - / - / - / REF METHOD-DATE - / - / - / QA PLAN-DATE - 89/10 - 89/10 - 89/10 DATE SAMPLING BEGAN 1986/01/01 1988/09/01 1990/01/05 DATE SAMPLING ENDED / / / / / / AUDIT DATE / / / / / / MONITORING OBJECTIVE (1) MAXIMUM CONCENTRATION PAMS REQ SF UNRESTRICTED AIR FLOW TYPE OBSTRUCTION: (1) (2) (3) (1) (2) (3) (1) (2) (3) HEIGHT OBSTRUCTION: 0 M 0 M 0 M 0 M 0 M 0 M 0 M 0 M 0 M DISTANCE: 0 M 0 M 0 M 0 M 0 M 0 M 0 M 0 M 0 M DIRECTION: STREET NUMBER (1) (2) (3) (1) (2) (3) (1) (2) (3) DISTANCE ROAD 0 M 0 M 0 M 0 M 0 M 0 M 0 M 0 M 0 M

A-5
DATE 03/23/98 EPA AEROMETRIC INFORMATION RETRIEVAL SYSTEM (AIRS) PAGE 1 AMP450EX AIR QUALITY SUBSYSTEM QUICK LOOK PROCESSING SUMMARY REPORT- TSP RECORDS EXTRACTED: 0 PB RECORDS EXTRACTED: 0 CO RECORDS EXTRACTED: 0 SO2 RECORDS EXTRACTED: 0 NO2 RECORDS EXTRACTED: 0 O3 RECORDS EXTRACTED: 0 PM10 RECORDS EXTRACTED: 160 OTHER RECORDS EXTRACTED: 0DATE 03/23/98 EPA AEROMETRIC INFORMATION RETRIEVAL SYSTEM (AIRS) PAGE 1 AMP450 AIR QUALITY SUBSYSTEM QUICK LOOK REPORT PM-10 TOTAL 0-10UM (81102) ALABAMA UNITS: 001 UG/CU METER (25 C) P SCHEDULED WTD O M REP NUM NUM % NUM ----MAXIMUM VALUES----- VALS > 150 ARITH SITE ID C T CITY COUNTY ADDRESS YR ORG OBS OBS OBS REQ 1ST 2ND 3RD 4TH MEAS EST MEAN METH ___________________________________________________________________________________________________________________________________ 01-015-0001 1 2 ANNISTON CALHOUN CO 309 EAST 8TH STREET 94 011 56 56 89 63 46 44 43 42 0 0.00 24? 063 01-015-0001 1 2 ANNISTON CALHOUN CO 309 EAST 8TH STREET 95 011 59 59 94 63 68 62 56 43 0 0.00 23 063 01-015-0001 1 2 ANNISTON CALHOUN CO 309 EAST 8TH STREET 96 011 53 53 83 64 40 31 29 29 0 0.00 19? 063 01-015-0001 1 2 ANNISTON CALHOUN CO 309 EAST 8TH STREET 97 011 57 57 90 63 51 49 47 47 0 0.00 23 063 01-033-1002 1 2 MUSCLE SHO COLBERT CO WILSON DAM RD AND 2ND 94 011 55 55 87 63 57 39 39 38 0 0.00 20? 063 01-033-1002 1 2 MUSCLE SHO COLBERT CO WILSON DAM RD AND 2ND 95 011 57 57 90 63 55 49 42 41 0 0.00 22 063 01-033-1002 1 2 MUSCLE SHO COLBERT CO WILSON DAM RD AND 2ND 96 011 54 54 84 64 48 46 32 31 0 0.00 18 063 01-033-1002 1 2 MUSCLE SHO COLBERT CO WILSON DAM RD AND 2ND 97 011 59 59 94 63 44 41 39 39 0 0.00 19 063 01-049-1002 1 2 FORT PAYNE DE KALB CO 1500 WILLIAMS AVE. N. 94 011 53 53 84 63 50 45 38 37 0 0.00 25? 063 01-049-1002 1 2 FORT PAYNE DE KALB CO 1500 WILLIAMS AVE. N. 95 011 52 51 81 63 71 68 49 48 0 0.00 26? 063 01-049-1002 1 2 FORT PAYNE DE KALB CO 1500 WILLIAMS AVE. N. 96 011 44 44 69 64 50 45 42 39 0 0.00 21? 063 01-049-1002 1 2 FORT PAYNE DE KALB CO 1500 WILLIAMS AVE. N. 97 011 52 52 83 63 51 49 49 47 0 0.00 23? 063 01-053-0002 1 2 BREWTON ESCAMBIA C BELLVILLE AVE.BREWTON 94 011 60 60 95 63 69 52 44 44 0 0.00 27 063 01-053-0002 1 2 BREWTON ESCAMBIA C BELLVILLE AVE.BREWTON 95 011 61 61 97 63 63 51 47 46 0 0.00 27 063 01-053-0002 1 2 BREWTON ESCAMBIA C BELLVILLE AVE.BREWTON 96 011 60 60 94 64 50 41 40 40 0 0.00 24 063 01-053-0002 1 2 BREWTON ESCAMBIA C BELLVILLE AVE.BREWTON 97 011 61 61 97 63 55 51 46 46 0 0.00 26 063 01-055-0008 3 2 GADSDEN ETOWAH CO 3200 WALNUT ST 94 011 59 59 94 63 73 57 50 49 0 0.00 31 063 01-055-0008 3 2 GADSDEN ETOWAH CO 3200 WALNUT ST 95 011 60 60 95 63 65 60 53 51 0 0.00 30 063 01-055-0008 3 2 GADSDEN ETOWAH CO 3200 WALNUT ST 96 011 59 59 92 64 55 47 43 42 0 0.00 23 063 01-055-0008 3 2 GADSDEN ETOWAH CO 3200 WALNUT ST 97 011 55 55 87 63 63 58 53 52 0 0.00 28 063 01-055-0008 4 2 GADSDEN ETOWAH CO 3200 WALNUT ST 94 011 52 52 83 63 69 51 50 48 0 0.00 29? 063 01-055-0008 4 2 GADSDEN ETOWAH CO 3200 WALNUT ST 95 011 48 48 76 63 72 63 46 45 0 0.00 29? 063 01-055-0008 4 2 GADSDEN ETOWAH CO 3200 WALNUT ST 96 011 49 49 77 64 57 50 45 40 0 0.00 24? 063 01-055-0008 4 2 GADSDEN ETOWAH CO 3200 WALNUT ST 97 011 42 42 67 63 56 51 47 44 0 0.00 25? 063 01-059-0001 1 2 RUSSELLVIL FRANKLIN C NORTH ALABAMA HOSPITA 94 011 57 57 90 63 61 44 43 42 0 0.00 22 063 01-059-0001 1 2 RUSSELLVIL FRANKLIN C NORTH ALABAMA HOSPITA 95 011 60 60 95 63 57 45 43 42 0 0.00 23 063 01-059-0001 1 2 RUSSELLVIL FRANKLIN C NORTH ALABAMA HOSPITA 96 011 60 60 94 64 50 45 34 33 0 0.00 19 063 01-059-0001 1 2 RUSSELLVIL FRANKLIN C NORTH ALABAMA HOSPITA 97 011 61 61 97 63 49 43 41 40 0 0.00 21 063 01-069-0002 1 2 DOTHAN HOUSTON CO EAST HIGHLAND ST., BO 94 011 56 56 89 63 97 63 55 53 0 0.00 28 063 ? INDICATES THAT THE MEAN DOES NOT SATISFY SUMMARY CRITERIA

APPENDIX B
COUNTY EMISSIONS SUMMARY MAPS
MAPS OF MONITORS AND EMISSION SOURCES
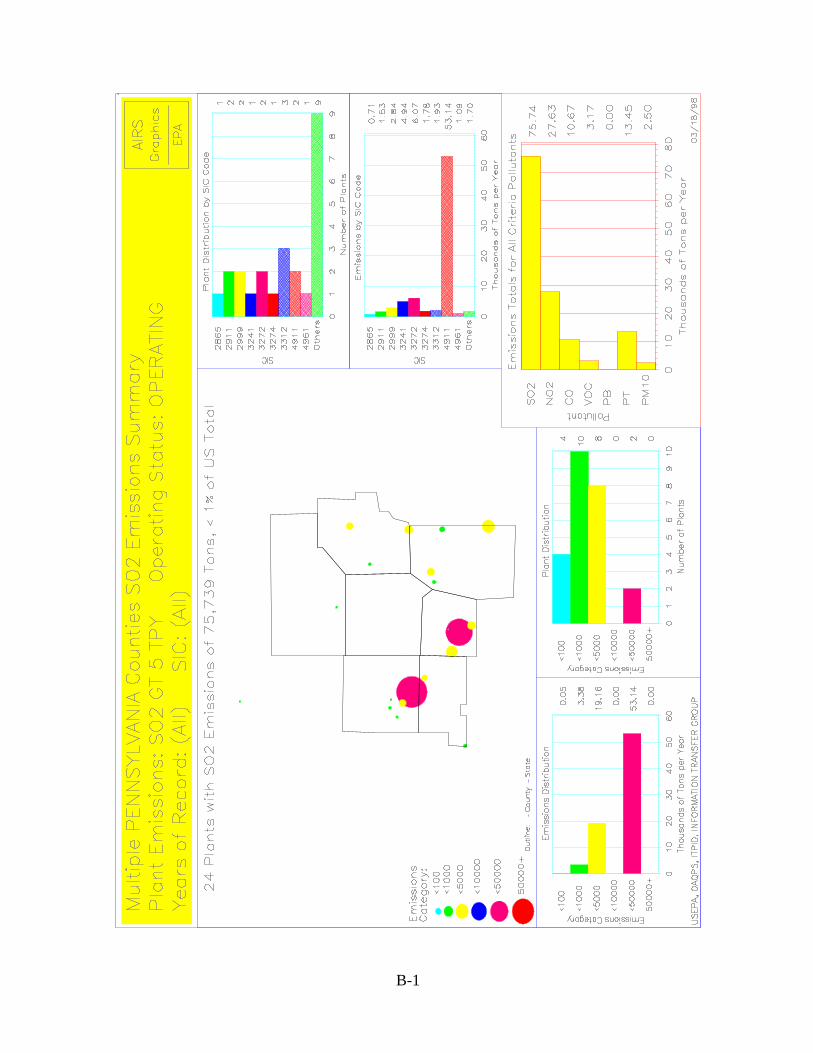
B-1
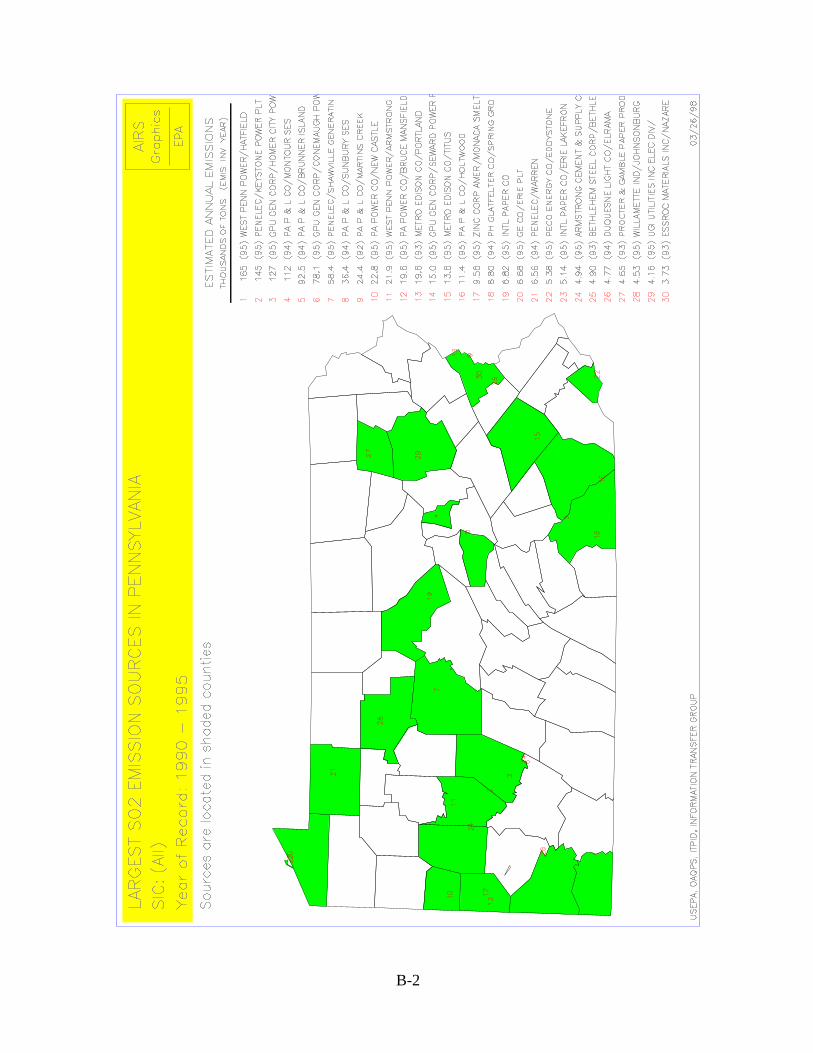
B-2

B-3

B-4
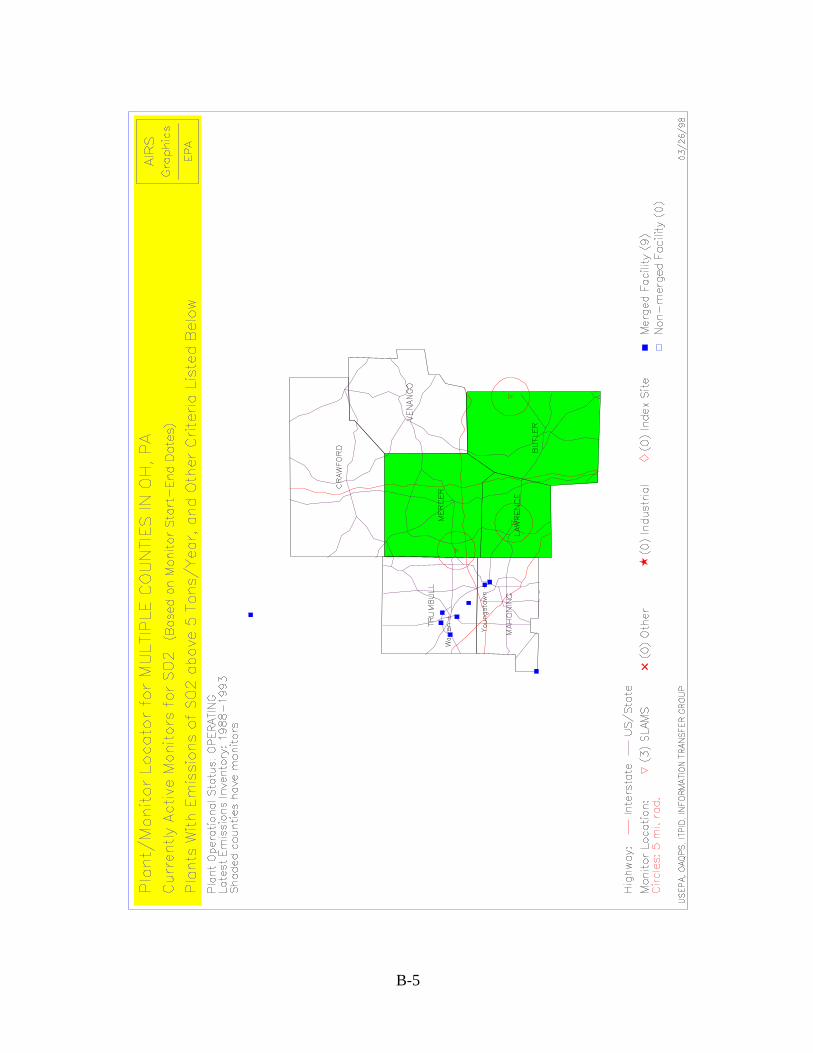
B-5
APPENDIX C
REENGINEERING AIR MONITORING NETWORKS
C-1
Reengineering Air Monitoring Networks
Phase I results - [Short-term measures which may be implemented immediately (FY-97), orshortly thereafter]:
Photochemical Assessment Monitoring Stations (PAMS)
Many commenters on the reengineering project noted that significant savings could be realized by reducingthe sampling frequency for carbonyl compounds at the PAMS #2 Sites. For example, decreasing the carbonylsampling frequency to four 3-hour samples every third day, retaining the year-round 24-hour sample, and addinga component to monitor on five peak ozone days plus each previous day, could save an agency as much as 60%on their carbonyl sampling alone. Additionally, reductions in VOC sampling at the PAMS #1, #3, and #4 canisterSites to a similar frequency, could save approximately 25% at each of those sites. To effect such changes, anagency would need to apply for a revision to its PAMS Network Plan; this request could minimally take the formof a letter proposing the adoption of these changes and specifying the particular 3-hour periods which would bemonitored. It would be important, however, to maintain the same monitoring frequencies/periods at #1, #3 and#4 Sites in the same network and/or transport area. It also should be noted that there are some questions on thequality of carbonyl data. Efforts need to be extended to improve data quality.
For the FY-97 season, the following action is therefore recommended:
Solicit PAMS plan amendment letters from the affected PAMS States and local agencies which reducecarbonyl sampling at PAMS #2 Sites; and, reduce VOC sampling at other PAMS Sites using canisters.
Criteria Pollutants
Most State and local agencies who commented on the reengineering straw man indicated that they had alreadyconducted analyses to optimize their monitoring networks, eliminating unnecessary sites where possible andretaining sites necessary for their programs (e.g., assessing air quality violations, conducting trend analyses,addressing citizen complaints, and maintaining geographic coverage). Only those State and local agencies whohave not completed this type of network modification will realize savings from implementing the straw manrecommendations for their State and Local Air Monitoring Stations (SLAMS). The EPA would encourage anyagency who has not conducted such network evaluation and modification to implement similar optimizationmeasures.
Substantial decreases in ambient lead levels and reduced sulfur dioxide emissions are the basis for ongoingmodifications to the monitoring regulations for lead (e.g., virtual elimination of mobile source oriented leadmonitoring) and sulfur dioxide, respectively. These modifications are in varying stages of progress and have thepotential to free resources for emerging monitoring needs. Similarly, very few violations of the nitrogen dioxidestandard have been recorded. Combined with the fact that existing NAMS/SLAMS Nitrogen Oxides (NOx)instruments are biased high (i.e., they record values higher than true Nitrogen Dioxide (NO ), it is reasonable to2initiate reductions in NO monitoring used for comparisons to the NAAQS (as opposed to PAMS locations where2estimates of ozone precursors are desired). We do not feel that a rule change is needed for reducing NO sites2as the requirements are minimal, and some number of sites are needed for air quality trends and emissions

C-2
tracking. Accordingly, we still require retaining existing NAMS and PAMS NOx monitoring sites. Similarly,several CO sites have been recording very low values on a consistent basis. Although specific guidance is notyet available, we will be receptive to common sense case-by-case recommendations that are based on situationswhere measurements reflect high repetitions (i.e., several sites in a well-mixed air basin), low values, and /or lowpopulation densities. Our suggested targets in Table 1 assume that those sites consistently measuring less than60% of the NAAQS would be removed.
Finally, the PM-10 monitoring efforts must be reduced (not eliminated) as greater emphasis (and resources)will be required for PM2.5 monitoring. A basic guideline for PM-10 is to retain all NAMS sites for long-termtrends, and only those other sites that measure greater than 60% of the annual PM-10 standard to reach a nationalgoal of roughly 494 NAMS/SLAMS PM-10 sites for 2000 and beyond. A similar approach could be used forspecial purpose PM-10 sites.
We recognize that our national goals do not fit precisely with the State by State plans, and many of ourassumptions fall short in addressing local situations. Clearly, we need strong communications for us tocollectively meet these National targets. Guidance for reconfiguring the networks is underway, and we will meetwith Regional Office and State/local agencies to tailor modifications that balance the realities of State/localprograms with a shift in National priorities. In addition, many commenters pointed out that we should not expectmajor resource savings from these criteria pollutant monitoring programs because several changes had beeninitiated by State and local agencies.
Rural PAMS, Reactive Oxides of Nitrogen (NOy), speciated PM-2.5 and dataanalysis
Nitrogen/NOy
The PAMS program produces a wealth of VOC measurements, but has only marginally improved our nitrogen(NOx, NOy) data base. Given the importance of NOx and NOy in detecting emissions trends for NOx controlstrategies and assisting the use of observational based models and other characterization methods, we suggestedthat improved nitrogen measurements be considered as part of our reengineering proposal. It remains our opinionthat improved nitrogen measurements are a worthwhile enhancement to PAMS. However, we received very littlefeedback in this area. Our level of proactivity is dictated largely on your responses and needs. Consequently,without strong support from the user community, we can effect only minor changes. At this time, measurementsof total reactive oxides of nitrogen (NOy) are encouraged at PAMS, but are not required. Conceivably, reductionin carbonyl and VOC sampling and analysis frequencies could free resources for NOy monitoring. However,implementing a new PM-2.5 monitoring network is the highest priority across monitoring programs. The EPArecognizes the limitation of many of the current NOx instruments as well as the value of NOy data. Nitrogenmeasurements clearly are valuable for emissions tracking and characterization analysis (e.g., observationalmodeling). The EPA will explore identifying grant support for NOy monitoring in future allocations of PAMS§105 grant monies.
Rural/background stations
Some comments were received regarding the need for the addition of “rural” monitoring sites. Given theresource load arising from implementing PM-2.5 monitoring, resources for additional PAMS rural sites are not
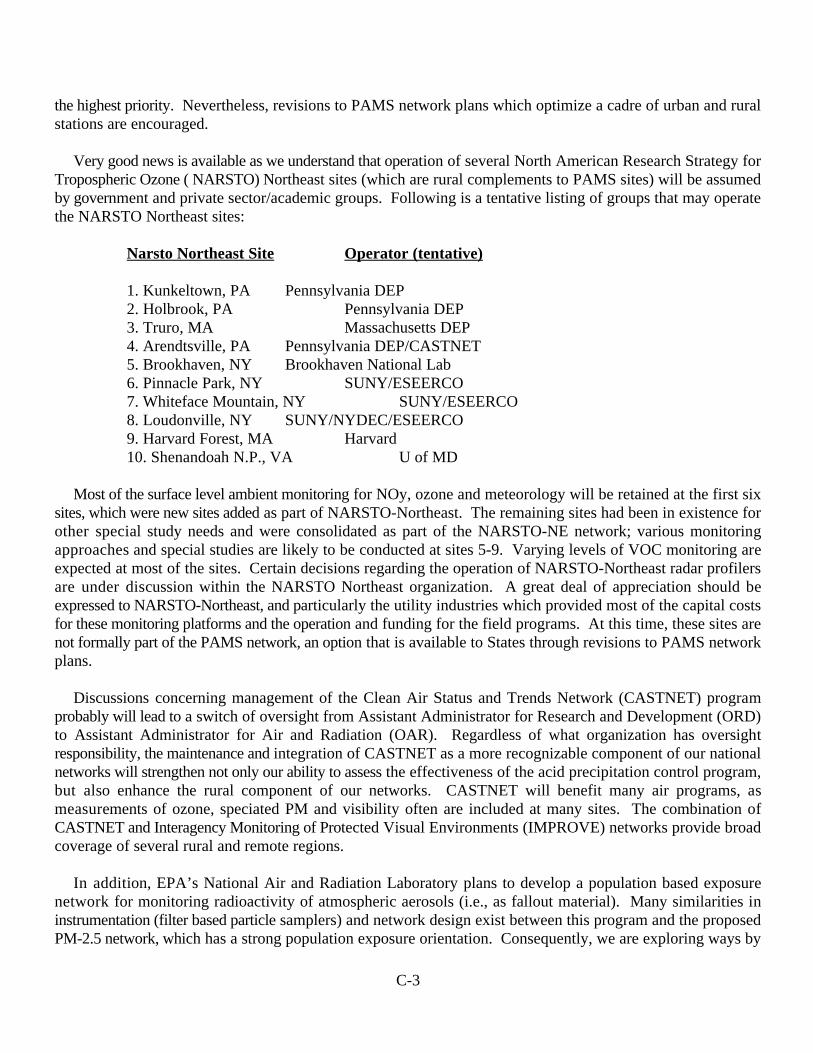
C-3
the highest priority. Nevertheless, revisions to PAMS network plans which optimize a cadre of urban and ruralstations are encouraged.
Very good news is available as we understand that operation of several North American Research Strategy forTropospheric Ozone ( NARSTO) Northeast sites (which are rural complements to PAMS sites) will be assumedby government and private sector/academic groups. Following is a tentative listing of groups that may operatethe NARSTO Northeast sites:
Narsto Northeast Site Operator (tentative)
1. Kunkeltown, PA Pennsylvania DEP2. Holbrook, PA Pennsylvania DEP3. Truro, MA Massachusetts DEP4. Arendtsville, PA Pennsylvania DEP/CASTNET5. Brookhaven, NY Brookhaven National Lab6. Pinnacle Park, NY SUNY/ESEERCO7. Whiteface Mountain, NY SUNY/ESEERCO8. Loudonville, NY SUNY/NYDEC/ESEERCO9. Harvard Forest, MA Harvard10. Shenandoah N.P., VA U of MD
Most of the surface level ambient monitoring for NOy, ozone and meteorology will be retained at the first sixsites, which were new sites added as part of NARSTO-Northeast. The remaining sites had been in existence forother special study needs and were consolidated as part of the NARSTO-NE network; various monitoringapproaches and special studies are likely to be conducted at sites 5-9. Varying levels of VOC monitoring areexpected at most of the sites. Certain decisions regarding the operation of NARSTO-Northeast radar profilersare under discussion within the NARSTO Northeast organization. A great deal of appreciation should beexpressed to NARSTO-Northeast, and particularly the utility industries which provided most of the capital costsfor these monitoring platforms and the operation and funding for the field programs. At this time, these sites arenot formally part of the PAMS network, an option that is available to States through revisions to PAMS networkplans.
Discussions concerning management of the Clean Air Status and Trends Network (CASTNET) programprobably will lead to a switch of oversight from Assistant Administrator for Research and Development (ORD)to Assistant Administrator for Air and Radiation (OAR). Regardless of what organization has oversightresponsibility, the maintenance and integration of CASTNET as a more recognizable component of our nationalnetworks will strengthen not only our ability to assess the effectiveness of the acid precipitation control program,but also enhance the rural component of our networks. CASTNET will benefit many air programs, asmeasurements of ozone, speciated PM and visibility often are included at many sites. The combination ofCASTNET and Interagency Monitoring of Protected Visual Environments (IMPROVE) networks provide broadcoverage of several rural and remote regions.
In addition, EPA’s National Air and Radiation Laboratory plans to develop a population based exposurenetwork for monitoring radioactivity of atmospheric aerosols (i.e., as fallout material). Many similarities ininstrumentation (filter based particle samplers) and network design exist between this program and the proposedPM-2.5 network, which has a strong population exposure orientation. Consequently, we are exploring ways by
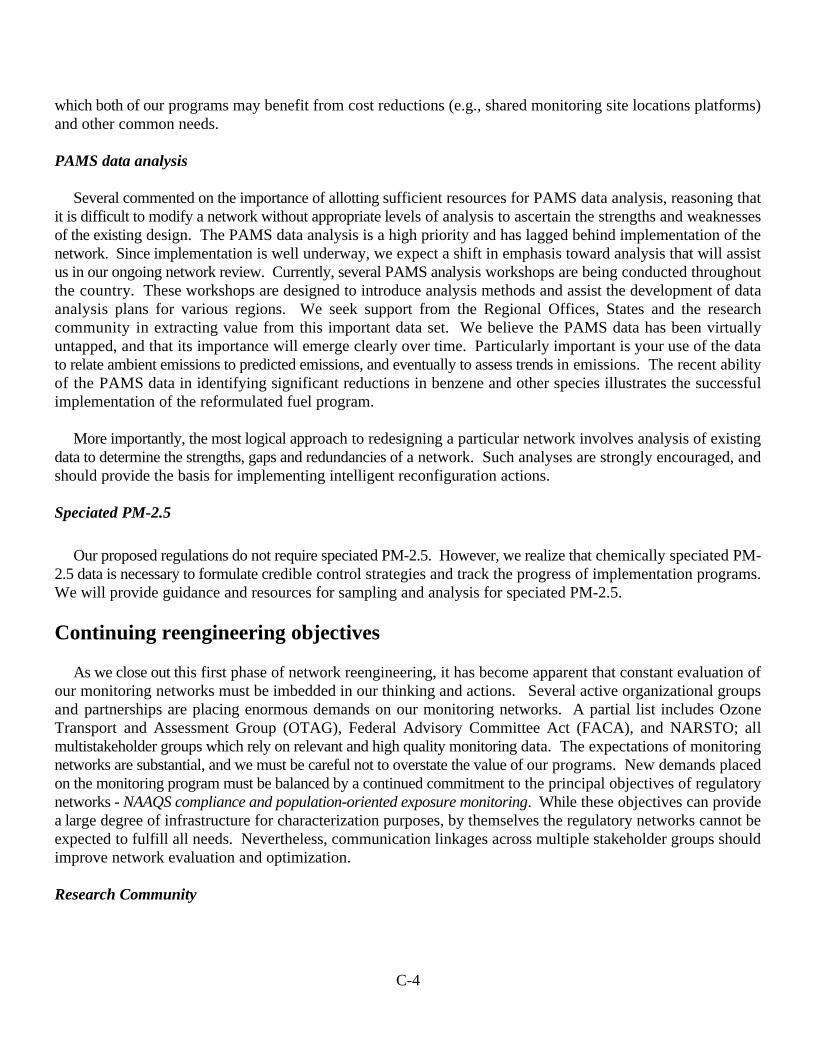
C-4
which both of our programs may benefit from cost reductions (e.g., shared monitoring site locations platforms)and other common needs.
PAMS data analysis
Several commented on the importance of allotting sufficient resources for PAMS data analysis, reasoning thatit is difficult to modify a network without appropriate levels of analysis to ascertain the strengths and weaknessesof the existing design. The PAMS data analysis is a high priority and has lagged behind implementation of thenetwork. Since implementation is well underway, we expect a shift in emphasis toward analysis that will assistus in our ongoing network review. Currently, several PAMS analysis workshops are being conducted throughoutthe country. These workshops are designed to introduce analysis methods and assist the development of dataanalysis plans for various regions. We seek support from the Regional Offices, States and the researchcommunity in extracting value from this important data set. We believe the PAMS data has been virtuallyuntapped, and that its importance will emerge clearly over time. Particularly important is your use of the datato relate ambient emissions to predicted emissions, and eventually to assess trends in emissions. The recent abilityof the PAMS data in identifying significant reductions in benzene and other species illustrates the successfulimplementation of the reformulated fuel program.
More importantly, the most logical approach to redesigning a particular network involves analysis of existingdata to determine the strengths, gaps and redundancies of a network. Such analyses are strongly encouraged, andshould provide the basis for implementing intelligent reconfiguration actions.
Speciated PM-2.5
Our proposed regulations do not require speciated PM-2.5. However, we realize that chemically speciated PM-2.5 data is necessary to formulate credible control strategies and track the progress of implementation programs.We will provide guidance and resources for sampling and analysis for speciated PM-2.5.
Continuing reengineering objectives
As we close out this first phase of network reengineering, it has become apparent that constant evaluation ofour monitoring networks must be imbedded in our thinking and actions. Several active organizational groupsand partnerships are placing enormous demands on our monitoring networks. A partial list includes OzoneTransport and Assessment Group (OTAG), Federal Advisory Committee Act (FACA), and NARSTO; allmultistakeholder groups which rely on relevant and high quality monitoring data. The expectations of monitoringnetworks are substantial, and we must be careful not to overstate the value of our programs. New demands placedon the monitoring program must be balanced by a continued commitment to the principal objectives of regulatorynetworks - NAAQS compliance and population-oriented exposure monitoring. While these objectives can providea large degree of infrastructure for characterization purposes, by themselves the regulatory networks cannot beexpected to fulfill all needs. Nevertheless, communication linkages across multiple stakeholder groups shouldimprove network evaluation and optimization.
Research Community

C-5
The relationship to NARSTO-Northeast, as described above, has provided benefits by expanding PAMScompatible networks into rural locations and adding quality nitrogen measurements. The NARSTO nationalassessment will produce two especially relevant papers, one on monitoring methods and a second on networks.While these papers will take a highly critical look at our regulatory programs, the insight from and ourparticipation in these efforts (expected in mid-1998) should provide valuable guidance commensurate with thatprovided by the 1991 National Academy of Sciences Report.
We should not overlook the very important contributions from the Southern Oxidant Study (SOS) community.Monitoring methods development (particularly NOy), observational analysis approaches and the importance ofthe rural component in the interacting spatial and temporal scales affecting air quality are a small sample of theSOS contributions that impact our work in a very direct way. To further strengthen the dialogue with themonitoring research community, Dr. James Price of the Texas Natural Resources Conservation Committee(TNRCC) will organize a workshop of experts in the Fall of 1997, after the PAMS data analysis workshops havebeen conducted. Our objective is to establish a more continuous and organized dialogue with the expertcommunity to assist us in regular evaluation and improvement of our networks toward improved regulatorydecisionmaking.
OTAG/FACA
While the analysis phase of OTAG is winding down during this transition period to decision making, the widearray of data analysis and model evaluation studies should serve as examples for continued analysis that isrequired for intelligent reengineering. Consistent with OTAG and the advice from the scientific community, theFACA activities demand a critical look at the monitoring networks ability to characterize air quality over broadand interacting spatial and temporal scales. In addition, FACA demands that we address the integration ofnetworks across pollutant categories. While monitoring is germane to nearly every FACA topic, several specificFACA subtopic groups or issue papers address the role of monitoring, monitoring incentives, areas of violation(AOV), and monitoring State Implementation Plan System (SIPs).
State/Local agency/EPA activities
We will continue our communications with State/local agencies and regional EPA offices through State andTerritorial Air Pollution Program Administrators (STAPPA)/ Association of Local Air Pollution Control Officials(ALAPCO), Standing Air Monitoring Work Group (SAMWG), and other meeting venues to solicit advice onmonitoring networks. Several PAMS data analysis workshops for EPA regional office and State/local staff arescheduled for this spring and summer. The Winter Monitoring workshop for EPA Regional Offices in lateFebruary and the April SAMWG meeting in upstate New York focus on PM-2.5, reengineering, quality assuranceand PAMS data analysis. Several recent and upcoming STAPPA/ALAPCO, (Mid-Atlantic Regional AirManagement Association (MARAMA), Northeast States for Coordinated Air Use Management (NESCAUM)and Western States Air Resources Council (WESTAR) meetings have or will include monitoring topics as keyagenda items. In addition, we will continue to explore partnerships with the private sector, and try to build onthe successful NARSTO-Northeast program. High quality monitoring data benefits all stakeholders as it directlyimproves our basis for understanding and decision making. Such an advantage is well worth the costs attendantwith data collection and analysis.
APPENDIX D
REFERENCE AND EQUIVALENT METHOD ANALYZERS

D-1
Carbon Monoxide Analyzers
Non-Specific SpecificCode Description Code Description
011 Non Dispersive Infra-Red 008 Non Dispersive Infra-Red Bendix8501-5CA
012 Non Dispersive Infra-RedBeckman 866
018 Non Dispersive Infra-RedMSA 202S
033 Non Dispersive Infra-RedHoriba AQM-10,11,12
041 Non Dispersive Infra-RedMonitor Labs 8310
048 Non Dispersive Infra-RedHoriba 300E/300SE
050 Non Dispersive Infra-RedMass CO-1
051 Non Dispersive Infra-RedDasibi 3003
054 Non Dispersive Infra-RedThermo Electron 48
066 Non Dispersive Infra-RedMonitor Labs 8830
067 Non Dispersive Infra-RedDasibi 3008
088 Non Dispersive Infra-RedMonitor Labs ML 9830
093 Non Dispersive Infra-RedAPI Model 300 Gas Filter

D-2
NO Analyzers2
Non-Specific SpecificCode Description Code Description
011 Colorimetric 084 Sodium Arsenite Method098 TGS-ANSA Method
014 Chemiluminescence 021 ChemiluminescenceMonitor Labs 8440E
022 ChemiluminescenceBendix 8101-C
025 ChemiluminescenceCSI 1600
031 ChemiluminescenceMeloy NA530R
034 ChemiluminescenceBeckman 952A
035 ChemiluminescenceThermo Electron 14B/E
037 ChemiluminescenceThermo Electron 14D/E
038 ChemiluminescenceBendix 8101-B
040 ChemiluminescencePhilips PW9762/02
042 ChemiluminescenceMonitor Labs 8840
074 ChemiluminescenceThermo EI Model 42
082 ChemiluminescenceAPI Model 200
083 ChemiluminescenceMonitor Labs 8841
089 ChemiluminescenceDasibi EC Model 2108
090 ChemiluminescenceLear Siegler or Monitor Labs ML9841, 9841A
104 ChemiluminescenceEnvironment S.A. AC31M
102 Open Path DOASOpsis Model AR500
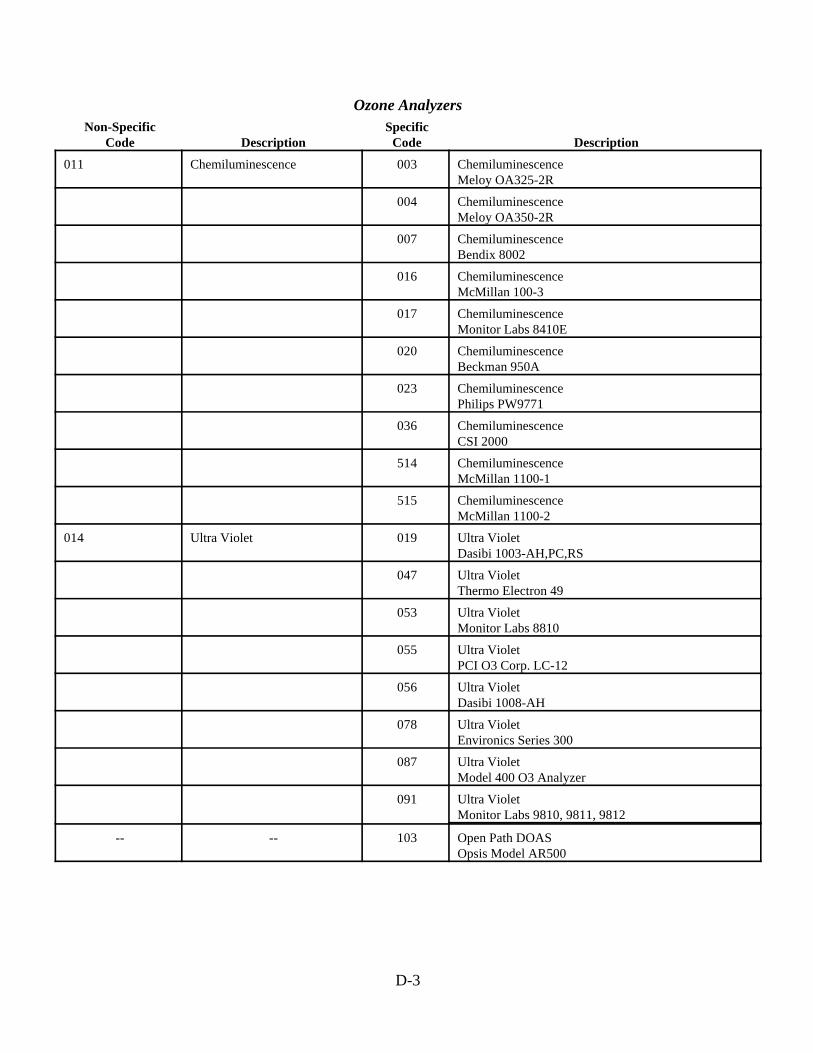
D-3
Ozone AnalyzersNon-Specific Specific
Code Description Code Description
011 Chemiluminescence 003 ChemiluminescenceMeloy OA325-2R
004 ChemiluminescenceMeloy OA350-2R
007 ChemiluminescenceBendix 8002
016 ChemiluminescenceMcMillan 100-3
017 ChemiluminescenceMonitor Labs 8410E
020 ChemiluminescenceBeckman 950A
023 ChemiluminescencePhilips PW9771
036 ChemiluminescenceCSI 2000
514 ChemiluminescenceMcMillan 1100-1
515 ChemiluminescenceMcMillan 1100-2
014 Ultra Violet 019 Ultra VioletDasibi 1003-AH,PC,RS
047 Ultra VioletThermo Electron 49
053 Ultra VioletMonitor Labs 8810
055 Ultra VioletPCI O3 Corp. LC-12
056 Ultra VioletDasibi 1008-AH
078 Ultra VioletEnvironics Series 300
087 Ultra VioletModel 400 O3 Analyzer
091 Ultra VioletMonitor Labs 9810, 9811, 9812
-- -- 103 Open Path DOASOpsis Model AR500

D-4
SO Analyzers2
Non-Specific SpecificCode Description Code Description
014 Coulometric 010 CoulometricPhilips PW9755
511 CoulometricPhilips PW9700
016 Flame Photometric 006 Flame PhotometricMeloy SA185-2A
030 Flame PhotometricBendix 8303
032 Flame PhotometricMeloy SA285E
513 Flame PhotometricMonitor Labs 8450
020 Pulsed Fluorescent 009 UV FluorescentThermo Electron 43
060 UV FluorescentThermo Electron 43A or 43B
077 UV FluorescentAPI Model 100
022 Conductance Asarco 024 ConductanceAsarco 500
023 UV Stimulated 029 UV FluorescenceFluorescence Beckman 953
039 UV FluorescenceMonitor Labs 8850
046 UV FluorescenceMeloy SA700
061 UV FluorescenceDasibi 4108
075 UV FluorescenceMonitor Labs 8850S
077 UV FluorescenceAPI Model 100
084 UV FluorescenceEnvironment S.A. AF21M
092 UV FluorescenceLear Siegler or Monitor Labs Model ML9850
095 UV FluorescenceCSI Model 5700
100 UV FluorescenceAPI Model 100A
-- -- 101 Open Path DOASOpsis Model AR 500