Sl. No. Comments Replies
15
Transcript of Sl. No. Comments Replies


Sl. No. Comments Replies
1.
Further evidence is required to support the benchmark calculation
The PDD has established the Additionality of the project based both on barrier analysis and investment analysis. Investment barrier is one of the barriers identified by the PP to demonstrate the Additionality of the project. PP has chosen project IRR to demonstrate the Additionality of the project. Project IRR, being nothing but the return earned by the project, has to be compared with a benchmark or cut-off rate to determine the adequacy of the return. PP has chosen WACC as the benchmark. The EB has sought further evidence on the benchmark calculation. Since the project is financed by both equity and loan, the appropriate cut-off rate is the WACC, because WACC alone represents the weighted average of the costs of various sources of financing in the financial structure of the project. In other words, WACC represents the minimum rate of return which the project should earn to merit consideration, as failure to earn the minimum rate of return is indicative of the erosion in the value of shareholders’ investment. Therefore, no other benchmark is more suitable than WACC in cases where project IRR is used to demonstrate the Additionality. Being a weighted average cost of various sources of finance, the benchmark computation takes into account the rate of interest on term loan and working capital as envisaged at the time of conceptualization of the project (as assumed in the DPR). As regards equity, the project being new, PP has taken into account the post-tax return of 16% allowed by the Chattisgarh Electricity Regulatory Commission (CERC) for bio-mass power projects. As per the present dispensation, the project has to remit Dividend Distribution Tax at the rate of
1 Income Tax Act, 1961
2 Clause 2 (percentage of profits to be transferred to reserves), sub clause (iii), Companies (Transfer of Profits to Reserves) Rules, 1975, Ministry of Corporate Affairs, Govt. of India.
http://www.mca.gov.in/MinistryWebsite/dca/actsbills/rules/CToPtRR1975.pdf http://www.mca.gov.in/MinistryWebsite/dca/actsbills/actsbills.html
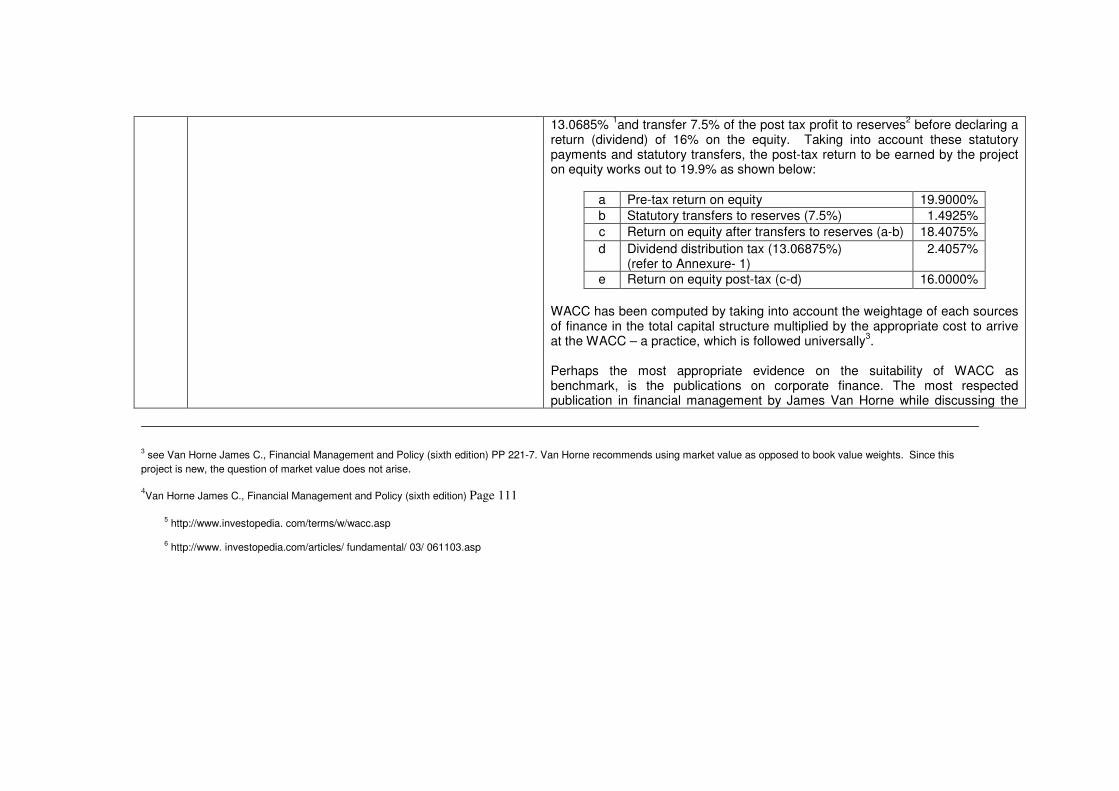
13.0685% 1and transfer 7.5% of the post tax profit to reserves
2 before declaring a
return (dividend) of 16% on the equity. Taking into account these statutory payments and statutory transfers, the post-tax return to be earned by the project on equity works out to 19.9% as shown below:
a Pre-tax return on equity 19.9000%
b Statutory transfers to reserves (7.5%) 1.4925%
c Return on equity after transfers to reserves (a-b) 18.4075%
d Dividend distribution tax (13.06875%) (refer to Annexure- 1)
2.4057%
e Return on equity post-tax (c-d) 16.0000%
WACC has been computed by taking into account the weightage of each sources of finance in the total capital structure multiplied by the appropriate cost to arrive at the WACC – a practice, which is followed universally
3.
Perhaps the most appropriate evidence on the suitability of WACC as benchmark, is the publications on corporate finance. The most respected publication in financial management by James Van Horne while discussing the
3 see Van Horne James C., Financial Management and Policy (sixth edition) PP 221-7. Van Horne recommends using market value as opposed to book value weights. Since this
project is new, the question of market value does not arise. 4Van Horne James C., Financial Management and Policy (sixth edition) Page 111
5 http://www.investopedia. com/terms/w/wacc.asp
6 http://www. investopedia.com/articles/ fundamental/ 03/ 061103.asp
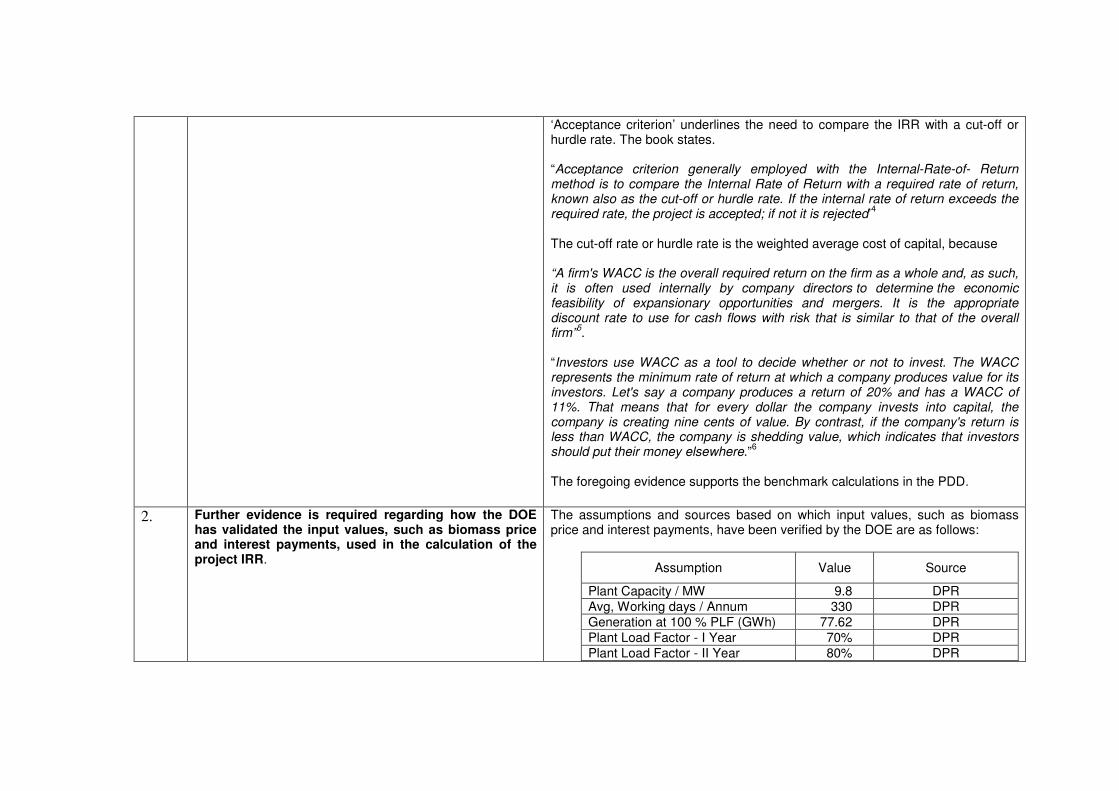
‘Acceptance criterion’ underlines the need to compare the IRR with a cut-off or hurdle rate. The book states. “Acceptance criterion generally employed with the Internal-Rate-of- Return method is to compare the Internal Rate of Return with a required rate of return, known also as the cut-off or hurdle rate. If the internal rate of return exceeds the required rate, the project is accepted; if not it is rejected’
4
The cut-off rate or hurdle rate is the weighted average cost of capital, because “A firm's WACC is the overall required return on the firm as a whole and, as such, it is often used internally by company directors to determine the economic feasibility of expansionary opportunities and mergers. It is the appropriate discount rate to use for cash flows with risk that is similar to that of the overall firm”
5.
“Investors use WACC as a tool to decide whether or not to invest. The WACC represents the minimum rate of return at which a company produces value for its investors. Let's say a company produces a return of 20% and has a WACC of 11%. That means that for every dollar the company invests into capital, the company is creating nine cents of value. By contrast, if the company's return is less than WACC, the company is shedding value, which indicates that investors should put their money elsewhere.”
6
The foregoing evidence supports the benchmark calculations in the PDD.
2. Further evidence is required regarding how the DOE has validated the input values, such as biomass price and interest payments, used in the calculation of the project IRR.
The assumptions and sources based on which input values, such as biomass price and interest payments, have been verified by the DOE are as follows:
Assumption Value Source
Plant Capacity / MW 9.8 DPR
Avg, Working days / Annum 330 DPR
Generation at 100 % PLF (GWh) 77.62 DPR
Plant Load Factor - I Year 70% DPR
Plant Load Factor - II Year 80% DPR
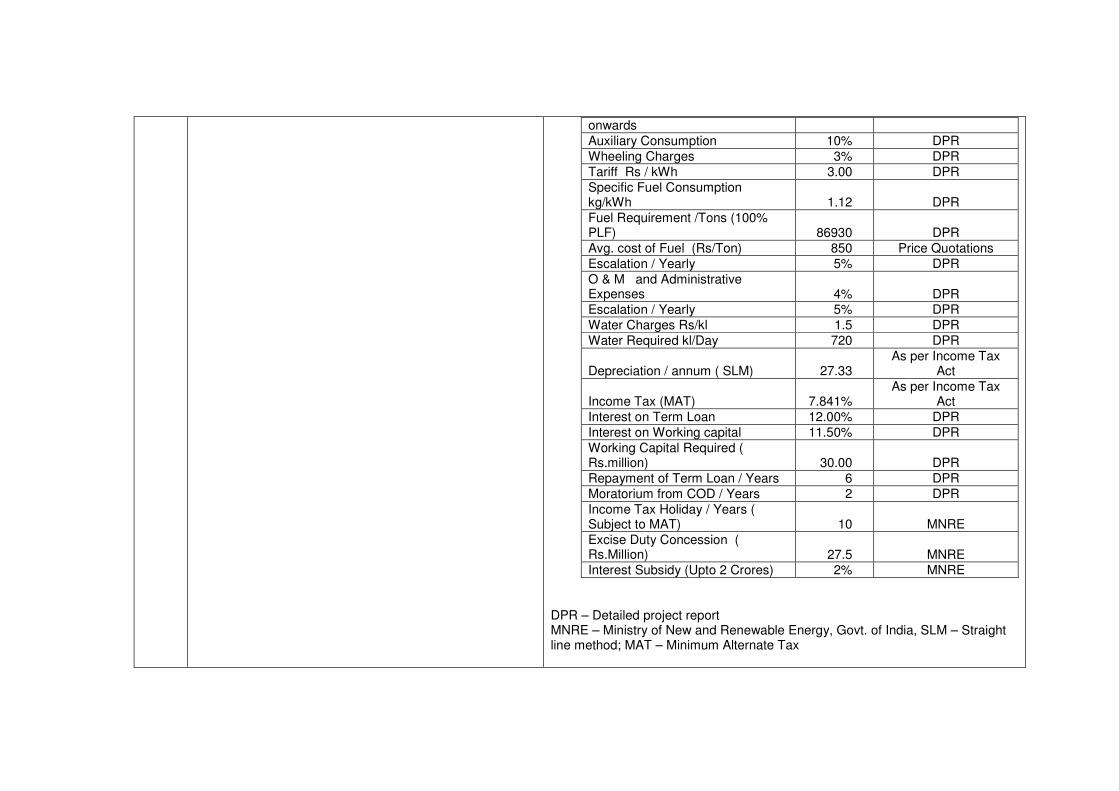
onwards
Auxiliary Consumption 10% DPR
Wheeling Charges 3% DPR
Tariff Rs / kWh 3.00 DPR
Specific Fuel Consumption kg/kWh 1.12 DPR
Fuel Requirement /Tons (100% PLF) 86930 DPR
Avg. cost of Fuel (Rs/Ton) 850 Price Quotations
Escalation / Yearly 5% DPR
O & M and Administrative Expenses 4% DPR Escalation / Yearly 5% DPR
Water Charges Rs/kl 1.5 DPR
Water Required kl/Day 720 DPR
Depreciation / annum ( SLM) 27.33 As per Income Tax
Act
Income Tax (MAT) 7.841% As per Income Tax
Act
Interest on Term Loan 12.00% DPR
Interest on Working capital 11.50% DPR
Working Capital Required ( Rs.million) 30.00 DPR
Repayment of Term Loan / Years 6 DPR
Moratorium from COD / Years 2 DPR
Income Tax Holiday / Years ( Subject to MAT) 10 MNRE
Excise Duty Concession ( Rs.Million) 27.5 MNRE Interest Subsidy (Upto 2 Crores) 2% MNRE
DPR – Detailed project report MNRE – Ministry of New and Renewable Energy, Govt. of India, SLM – Straight line method; MAT – Minimum Alternate Tax
Relevant evidences in respect of the above assumptions have been verified by DOE.
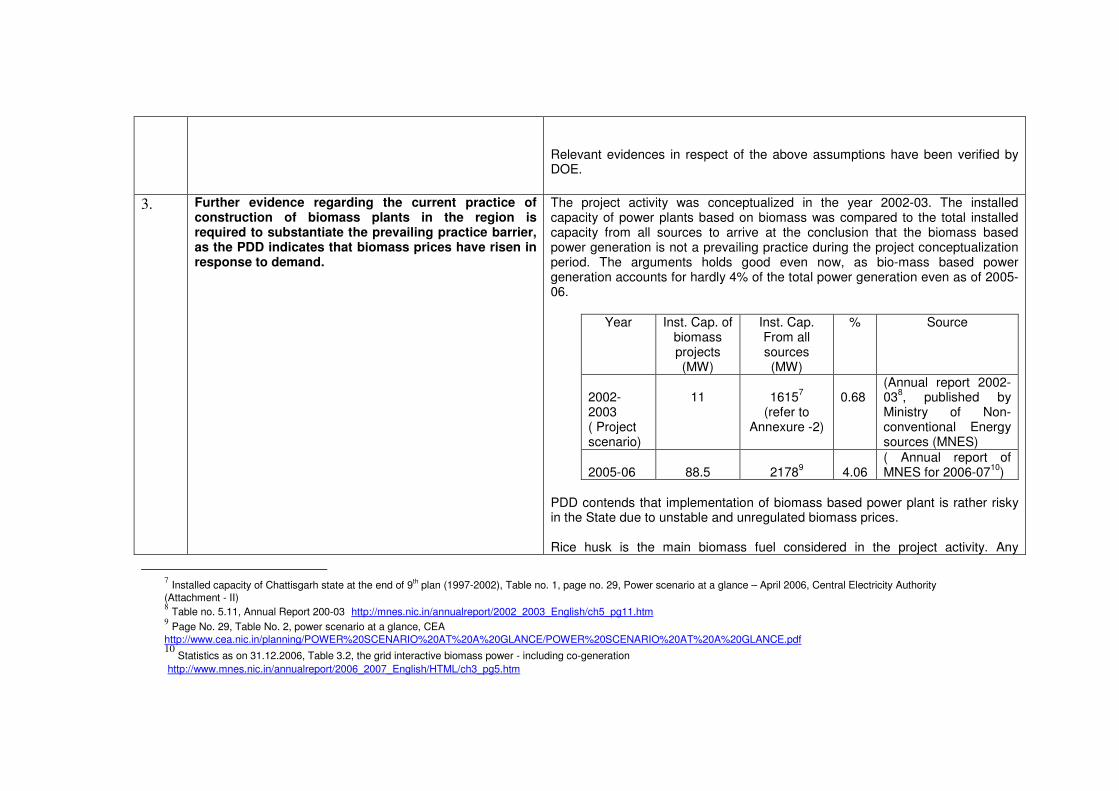
3. Further evidence regarding the current practice of construction of biomass plants in the region is required to substantiate the prevailing practice barrier, as the PDD indicates that biomass prices have risen in response to demand.
The project activity was conceptualized in the year 2002-03. The installed capacity of power plants based on biomass was compared to the total installed capacity from all sources to arrive at the conclusion that the biomass based power generation is not a prevailing practice during the project conceptualization period. The arguments holds good even now, as bio-mass based power generation accounts for hardly 4% of the total power generation even as of 2005-06.
Year Inst. Cap. of biomass projects (MW)
Inst. Cap. From all sources (MW)
% Source
2002-2003 ( Project scenario)
11
1615
7
(refer to Annexure -2)
0.68
(Annual report 2002-03
8, published by
Ministry of Non-conventional Energy sources (MNES)
2005-06
88.5
2178
9
4.06
( Annual report of MNES for 2006-07
10)
PDD contends that implementation of biomass based power plant is rather risky in the State due to unstable and unregulated biomass prices. Rice husk is the main biomass fuel considered in the project activity. Any
7 Installed capacity of Chattisgarh state at the end of 9
th plan (1997-2002), Table no. 1, page no. 29, Power scenario at a glance – April 2006, Central Electricity Authority
(Attachment - II) 8 Table no. 5.11, Annual Report 200-03 http://mnes.nic.in/annualreport/2002_2003_English/ch5_pg11.htm
9 Page No. 29, Table No. 2, power scenario at a glance, CEA
http://www.cea.nic.in/planning/POWER%20SCENARIO%20AT%20A%20GLANCE/POWER%20SCENARIO%20AT%20A%20GLANCE.pdf 10
Statistics as on 31.12.2006, Table 3.2, the grid interactive biomass power - including co-generation
http://www.mnes.nic.in/annualreport/2006_2007_English/HTML/ch3_pg5.htm

increase in the cost of rice husk would adversely affect the project viability. An increase of 5% in the cost of fuel, for example, would reduce the IRR from 9.89% to 8.63%. Price of biomass is not regulated by any agency and is driven by market forces. The cost of biomass fuel at the time of project planning stage was around Rs. 650 per tonne (as per DPR) and during start of project implementation, it went up to Rs.850 to Rs.1000 per tonne ( As per price quotations submitted to DOE) and the proponent has considered Rs.850 per tonne for the purpose of financial evaluation. The cost of biomass is likely to increase as new commercial opportunity is created with the establishment of the biomass based power generation. The baseline scenario is not the same as project, as the fossil fuels enjoy relatively fixed and stable fuel prices
11. This is evident from the number of
coal based plants planned in the State. The rise in biomass prices are attributable to two factors, viz., increase in the basic cost and increase in the cost of collection as well as transportation charges. The labour charges for collection and handling of biomass has been going up every year, which impacts the price of biomass. Equally important is the transportation cost. The diesel price had gone up almost by about 80%
12 between
2002 and 2007. Since, trucks are the main source of transportation of biomass, the increase in the cost of fossil fuel used by the trucks increase in the price of biomass. The biomass price risk has been experienced by almost all projects in the state. The registered biomass CDM projects in the Chattisgarh state ‘8.5 MW biomass based power project (Ref No. 0369)’, ‘ISA Power 8 MW (Gross) Renewable Sources Biomass Power Project (Ref. No.0725)‘, ‘Ecofren Power 8 MW Renewable Sources Biomass Power Project (Ref. No. 0726)’, ‘Biomass based power plant at siltara, Raipur, Chattisgarh (Ref No. 0926) – 7.5 MW’ and ‘9.8 MW Biomass Based Power Plant at Lahari Power & Steels Limited in Champa-Janjgir District, Chattisgarh (Ref. No.1199)’ have also identified the biomass price risk as one of the critical barriers for the projects.
11
Coal India Limited regulates and fixes price of coal in India, CIL revised the price of coal last on 15.06.2004. 12
The historical price of diesel from Indian oil web site is considered for estimation. The Kolkata city diesel prices are considered appropriate, which is the nearest city to Chattisgarh
among the other listed cities in the table. Web link: http://www.iocl.com/Diesel_prices.aspx

Thus, not only that bio-mass based power plants are not a common practice in the State of Chattishgarh but also such projects face additional risk of price escalation.
4. Further corrections in the calculation of project emission, as stated in page 28, column 7, as the unit of the NCV of coal should be kcal/kg instead of kcal/kWh. This correction has to be made also in the corresponding excel file annex B.
The PDD as well as Annex B (emission reduction sheet) has been corrected.
5. Regarding project emissions, the fuel consumptions evaluation are based on an assumed 86,930 total consumption of mixed fuel at full capacity load (see excel file annex B). This has to be justified and correctly documented by stating the source, the rated fuel mix, the NCV of the fuels, the assumed power plant efficiency, etc.
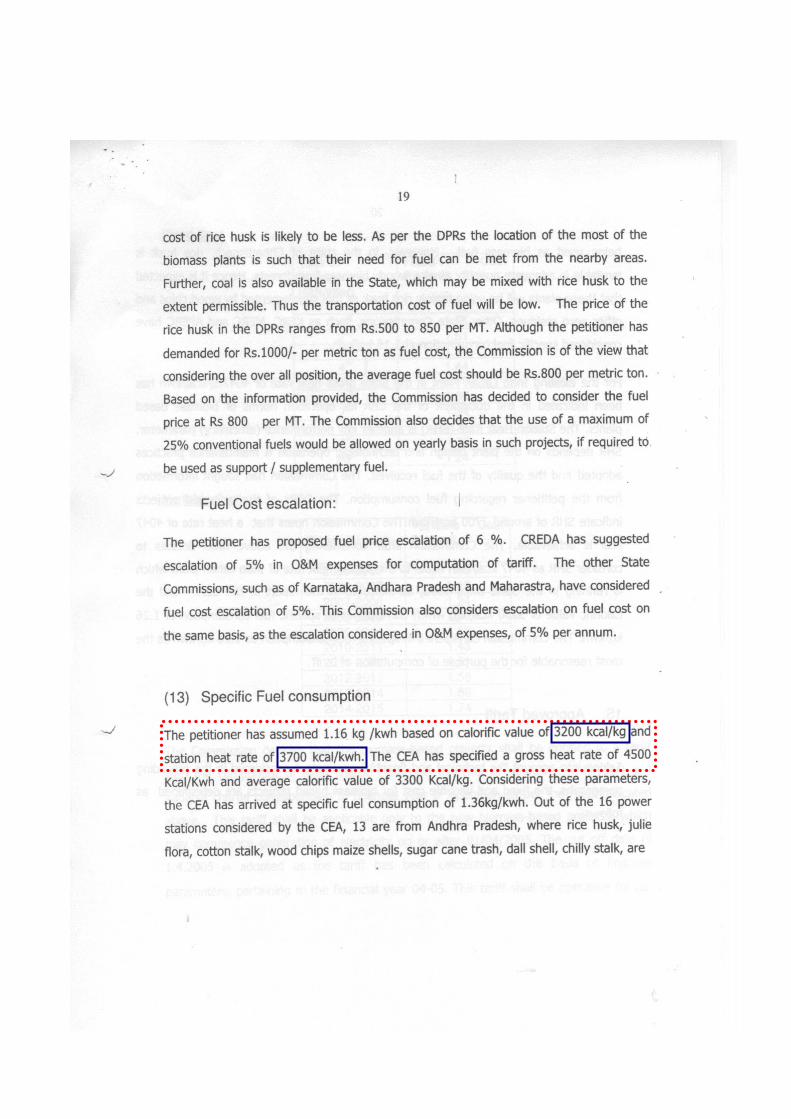
The project emissions have been calculated based on the assumption of 10% coal consumption in the total fuel consumption of the project per year. The total fuel requirement of project has been estimated based on the fuel mix, calorific value and station heat rate and plant efficiency. The following are the assumptions and respective values, based on which the total fuel requirement of the project has been estimated.
Parameter Value Unit
Station Heat Rate 3700 kcal/kWh
Fuel consumption
Rice Husk 90 %
Coal 10 %
Gross Calorific Value (GCV)
Rice Husk 3200 kcal/kg
Coal 4200 kcal/kg
Weighted average GCV 3300 kcal/kg
Specific Fuel consumption 1.12 kg/kWh
Gross Electricity generation 77616 MWh/y

Total fuel consumption 86930 tonnes
The spread sheet for the above calculations is included as part of Annex – B (Emission reduction sheet)
Station Heat Rate and calorific values
The Station Heat Rate and Rice husk calorific values have been considered based on CERC Tariff Order - clause 14, sub clause (13), page no. 19 ( refer to Annexure-3). The gross calorific value of coal
13 is based on the information
published by the Ministry of coal.
Specific fuel consumption and electricity generation
The specific fuel consumption and electricity generation are computed values. The gross electricity generation of project is calculated based on 330 days of operation.
6. The statement that “However, the study concluded that no negative impacts are possible from the proposed project activity. Satisfied with the study and Environmental Management Plan (EMP) proposed to implement during construction and operation Govt. of India has issued its consent for implementation of project activity” is not correct and has to be deleted. The EIA identified some adverse impacts on the environment.
The statement has been deleted and necessary corrections have been made in the PDD.
13
Gross calorific value of ‘E’ grade coal is considered; http://www.coal.nic.in/point4.html


Annexure – 1
Source of Dividend Distribution Tax (DDT) – Extracts from Direct Taxes Ready Reckoner – Taxmann’s 2004-05

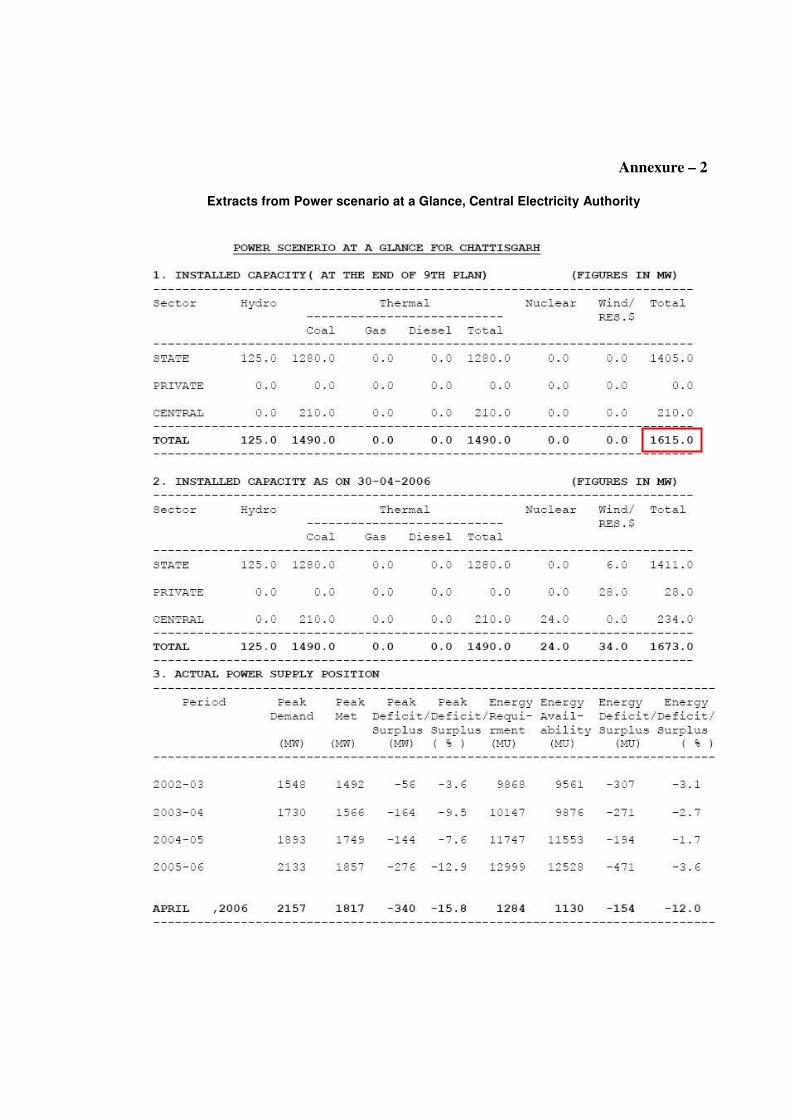
Annexure – 2
Extracts from Power scenario at a Glance, Central Electricity Authority

Annexure - 3
Extracts from Chattisgarh Electricity Regulatory Commission (CERC) tariff order