Skis on the roof or on the slope?: Mobility improvement options for the Colorado I-70 Mountain...
30
Skis on the roof or on the slope?: Mobility improvement options for the Colorado I-70 Mountain Corridor Tammy Blackburn Paul Kazemersky May 4, 2007
-
date post
21-Dec-2015 -
Category
Documents
-
view
219 -
download
2
Transcript of Skis on the roof or on the slope?: Mobility improvement options for the Colorado I-70 Mountain...

Skis on the roof or on the slope?:Mobility improvement options for the Colorado I-70 Mountain Corridor
Tammy BlackburnPaul KazemerskyMay 4, 2007
Outline
Problem Proposed Solutions Changing Parameters Costs and Benefits NPV of Alternatives
I-70 is the only divided highway that crosses Colorado from the east to west
Source: Mapquest

I-70 provides access to most of the ski resorts in Colorado and its more populated mountain
communities

I-70 sees high levels of congestion

I-70 has several major problem points
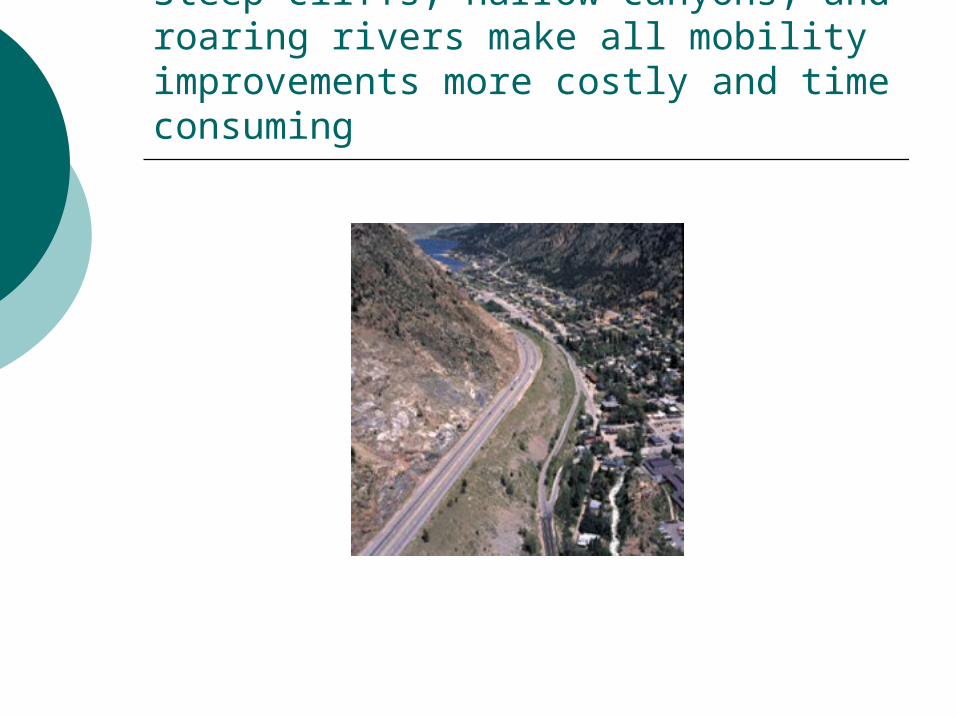
Steep cliffs, narrow canyons, and roaring rivers make all mobility improvements more costly and time consuming

The Colorado Department of Transportation (CDOT) identified 20 possible solutions to alleviate congestion and accommodate future growth
AlternativeCapital Costs ($M)
O&M Costs Highway Year 2025 ($M)
O&M Costs Transit Year 2025 ($M)
Transit Fare Box Revenue Year 2025 ($M)
Annual Transit Subsidy (O&M-Fare) Year 2025
No Action N/A 17 N/A N/A N/AMinimal Action 1,308 17 31 16 16Rail with IMC 4,915 17 135 83 52AGS 6,149 17 180 86 95Dual-Mode Bus in Guideway 3,468 17 94 74 20Diesel Bus in Guideway 3,264 17 99 69 306-Lane Highway 55 mph 2,405 20 N/A N/A N/A6-Lane Highway 65 mph 2,648 25 N/A N/A N/AReversible/HOV/HOT Lanes 2,520 22 N/A N/A N/A6-Lane Highway with Rail and IMC 6,400 20 142 88 54---Build Transit and Preserve for Highway 6,147 17 135 83 52---Build Hwy and Preserve for Transit 2,759 20 N/A N/A N/A6-Lane Highway with AGS 8,540 20 200 95 105---Build Transit and Preserve for Highway 8,321 17 180 86 95---Build Hwy and Preserve for AGS Transit 2,601 20 N/A N/A N/A6-Lane Highway with Dual-Mode Bus 4,275 20 83 75 9---Build Transit and Preserve for Highway 4,008 17 94 74 20---Build Hwy and Preserve for Transit 2,640 20 N/A N/A N/A6-Lane Highway with Diesel Bus 4,071 20 93 72 21---Build Transit and Preserve for Highway 3,803 17 99 69 30---Build Hwy and Preserve for Transit 2,640 20 N/A N/A N/A

CDOT believes that 4 billion in 2004 dollars is the upper threshold for capital improvements
(millions)
CDOT Limit 4,000Identified Project Funds 1,600
-------Unfunded Balance 2,600

Modes vary in their carrying capacity
Alternative or Mode Seats per Vehicle Vehicles per Train (Peak) Max PassengersRail 60 10 600AGS 96 2 192IMC 75 2 150Dual-Mode Bus in Guideway 65 1 65Diesel Bus in Guideway 40 1 40Bus in mixed traffic 40 1 40Tour bus 40 1 40Shuttle van 10 1 10
Source: TranSystems Colorado Maglev Project, J.F. Sato and Associates

The length of improvements vary with the alternatives

What happens with a 4 billion dollar cap?
AlternativeCapital Costs ($M)
O&M Costs Highway Year 2025 ($M)
O&M Costs Transit Year 2025 ($M)
Transit Fare Box Revenue Year 2025 ($M)
Annual Transit Subsidy (O&M-Fare) Year 2025
No Action N/A 17 N/A N/A N/AMinimal Action 1,308 17 31 16 16Rail with IMC 4,915 17 135 83 52AGS 6,149 17 180 86 95Dual-Mode Bus in Guideway 3,468 17 94 74 20Diesel Bus in Guideway 3,264 17 99 69 306-Lane Highway 55 mph 2,405 20 N/A N/A N/A6-Lane Highway 65 mph 2,648 25 N/A N/A N/AReversible/HOV/HOT Lanes 2,520 22 N/A N/A N/A6-Lane Highway with Rail and IMC 6,400 20 142 88 54---Build Transit and Preserve for Highway 6,147 17 135 83 52---Build Hwy and Preserve for Transit 2,759 20 N/A N/A N/A6-Lane Highway with AGS 8,540 20 200 95 105---Build Transit and Preserve for Highway 8,321 17 180 86 95---Build Hwy and Preserve for AGS Transit 2,601 20 N/A N/A N/A6-Lane Highway with Dual-Mode Bus 4,275 20 83 75 9---Build Transit and Preserve for Highway 4,008 17 94 74 20---Build Hwy and Preserve for Transit 2,640 20 N/A N/A N/A6-Lane Highway with Diesel Bus 4,071 20 93 72 21---Build Transit and Preserve for Highway 3,803 17 99 69 30---Build Hwy and Preserve for Transit 2,640 20 N/A N/A N/A
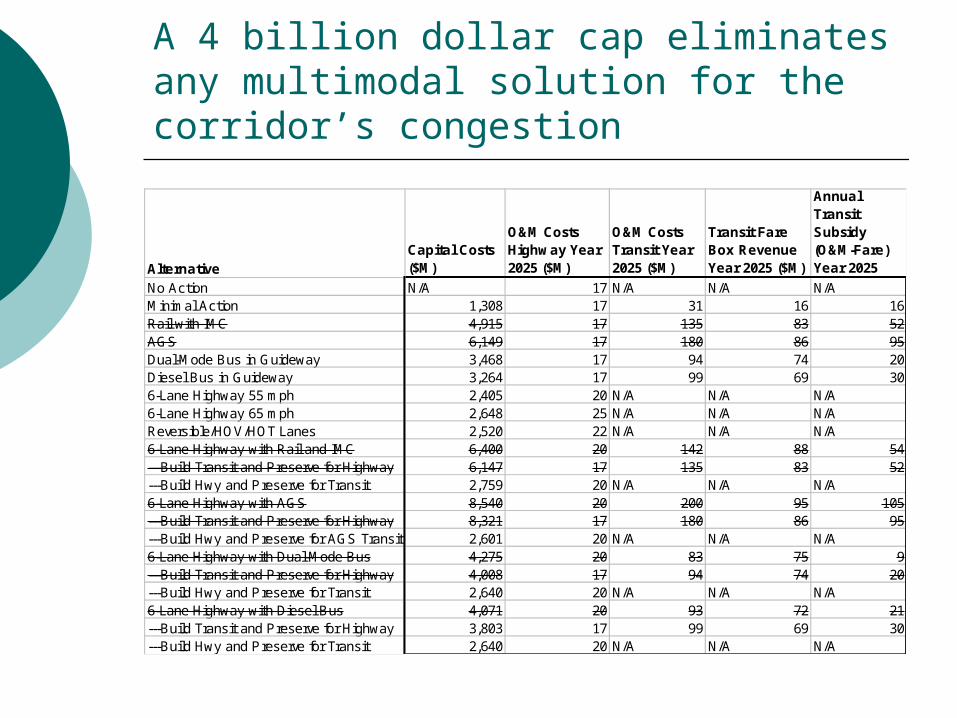
A 4 billion dollar cap eliminates any multimodal solution for the corridor’s congestion
AlternativeCapital Costs ($M)
O&M Costs Highway Year 2025 ($M)
O&M Costs Transit Year 2025 ($M)
Transit Fare Box Revenue Year 2025 ($M)
Annual Transit Subsidy (O&M-Fare) Year 2025
No Action N/A 17 N/A N/A N/AMinimal Action 1,308 17 31 16 16Rail with IMC 4,915 17 135 83 52AGS 6,149 17 180 86 95Dual-Mode Bus in Guideway 3,468 17 94 74 20Diesel Bus in Guideway 3,264 17 99 69 306-Lane Highway 55 mph 2,405 20 N/A N/A N/A6-Lane Highway 65 mph 2,648 25 N/A N/A N/AReversible/HOV/HOT Lanes 2,520 22 N/A N/A N/A6-Lane Highway with Rail and IMC 6,400 20 142 88 54---Build Transit and Preserve for Highway 6,147 17 135 83 52---Build Hwy and Preserve for Transit 2,759 20 N/A N/A N/A6-Lane Highway with AGS 8,540 20 200 95 105---Build Transit and Preserve for Highway 8,321 17 180 86 95---Build Hwy and Preserve for AGS Transit 2,601 20 N/A N/A N/A6-Lane Highway with Dual-Mode Bus 4,275 20 83 75 9---Build Transit and Preserve for Highway 4,008 17 94 74 20---Build Hwy and Preserve for Transit 2,640 20 N/A N/A N/A6-Lane Highway with Diesel Bus 4,071 20 93 72 21---Build Transit and Preserve for Highway 3,803 17 99 69 30---Build Hwy and Preserve for Transit 2,640 20 N/A N/A N/A
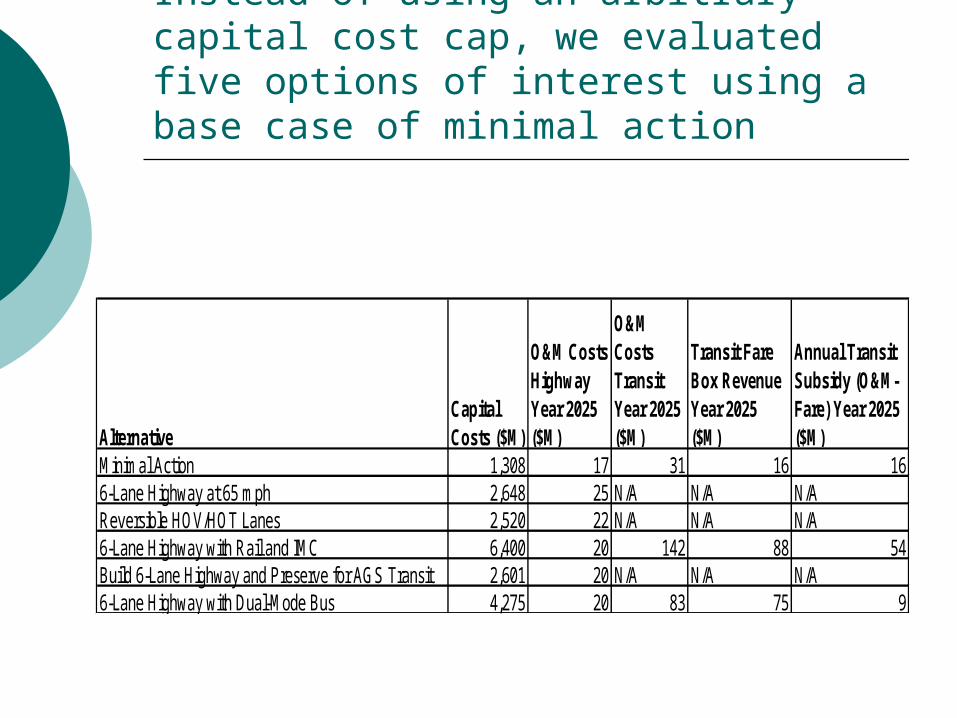
Instead of using an arbitrary capital cost cap, we evaluated five options of interest using a base case of minimal action
AlternativeCapital Costs ($M)
O&M Costs Highway Year 2025 ($M)
O&M Costs Transit Year 2025 ($M)
Transit Fare Box Revenue Year 2025 ($M)
Annual Transit Subsidy (O&M-Fare) Year 2025 ($M)
Minimal Action 1,308 17 31 16 166-Lane Highway at 65 mph 2,648 25 N/A N/A N/AReversible HOV/HOT Lanes 2,520 22 N/A N/A N/A6-Lane Highway with Rail and IMC 6,400 20 142 88 54Build 6-Lane Highway and Preserve for AGS Transit 2,601 20 N/A N/A N/A6-Lane Highway with Dual-Mode Bus 4,275 20 83 75 9
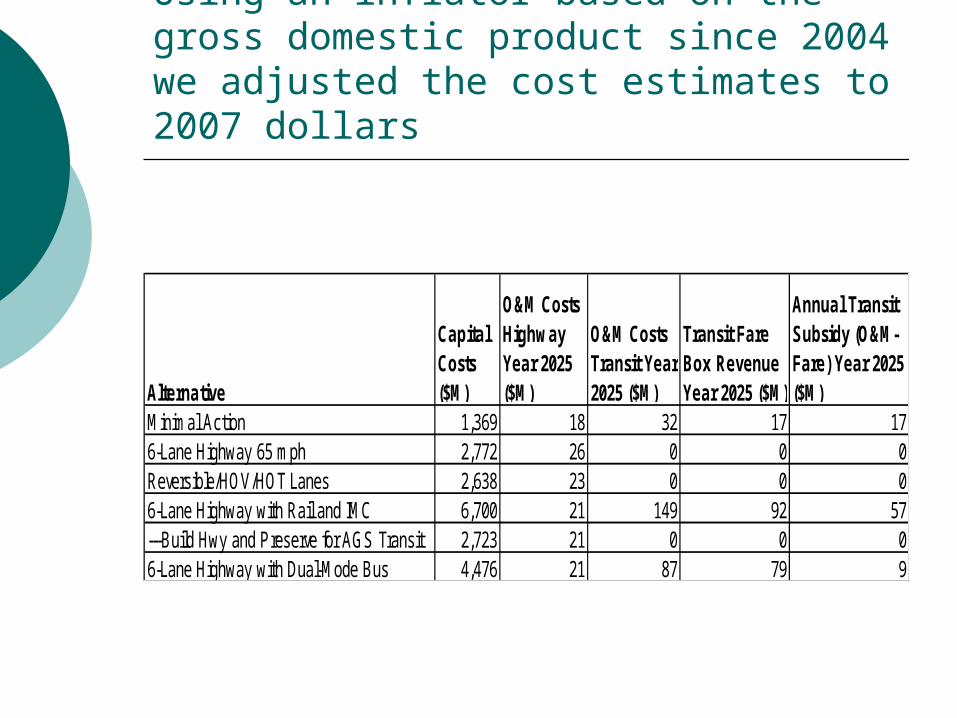
Using an inflator based on the gross domestic product since 2004 we adjusted the cost estimates to 2007 dollars
Alternative
Capital Costs ($M)
O&M Costs Highway Year 2025 ($M)
O&M Costs Transit Year 2025 ($M)
Transit Fare Box Revenue Year 2025 ($M)
Annual Transit Subsidy (O&M-Fare) Year 2025 ($M)
Minimal Action 1,369 18 32 17 176-Lane Highway 65 mph 2,772 26 0 0 0Reversible/HOV/HOT Lanes 2,638 23 0 0 06-Lane Highway with Rail and IMC 6,700 21 149 92 57---Build Hwy and Preserve for AGS Transit 2,723 21 0 0 06-Lane Highway with Dual-Mode Bus 4,476 21 87 79 9

We adjusted several parameters to gain insight into the sensitivity of CDOT’s findings
Ridership Numbers Fare Charges

CDOT projected transit fares based on 10¢ a mile per passenger in 2000 dollars
From LocationTo Metro Denver
To Clear Creek/Gilpin Counties
To Grand County
To Summit County
To Eagle County
To Garfield County
Metro Denver N/A 5 7 8 14 20Clear Creek/Gilpin Counties 5 2.5 5 5 8 14Grand County 7 5 2.5 7 10 16Summit County 8 5 7 2.5 6 10Eagle County 14 8 10 6 2.5 6Garfield County 20 14 16 10 6 N/A
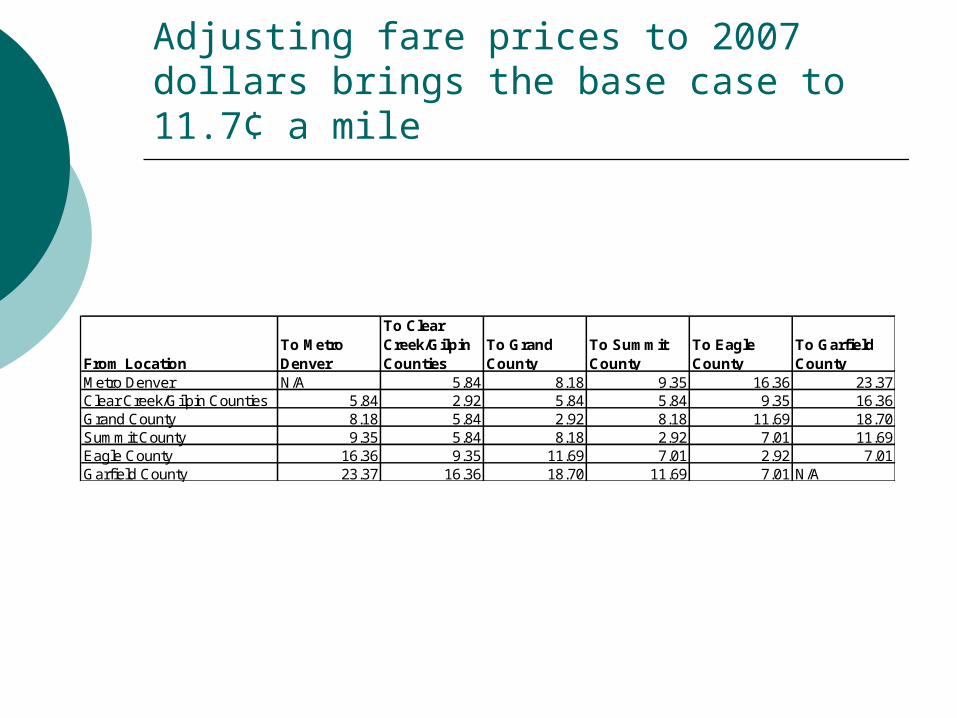
Adjusting fare prices to 2007 dollars brings the base case to 11.7¢ a mile
From LocationTo Metro Denver
To Clear Creek/Gilpin Counties
To Grand County
To Summit County
To Eagle County
To Garfield County
Metro Denver N/A 5.84 8.18 9.35 16.36 23.37Clear Creek/Gilpin Counties 5.84 2.92 5.84 5.84 9.35 16.36Grand County 8.18 5.84 2.92 8.18 11.69 18.70Summit County 9.35 5.84 8.18 2.92 7.01 11.69Eagle County 16.36 9.35 11.69 7.01 2.92 7.01Garfield County 23.37 16.36 18.70 11.69 7.01 N/A
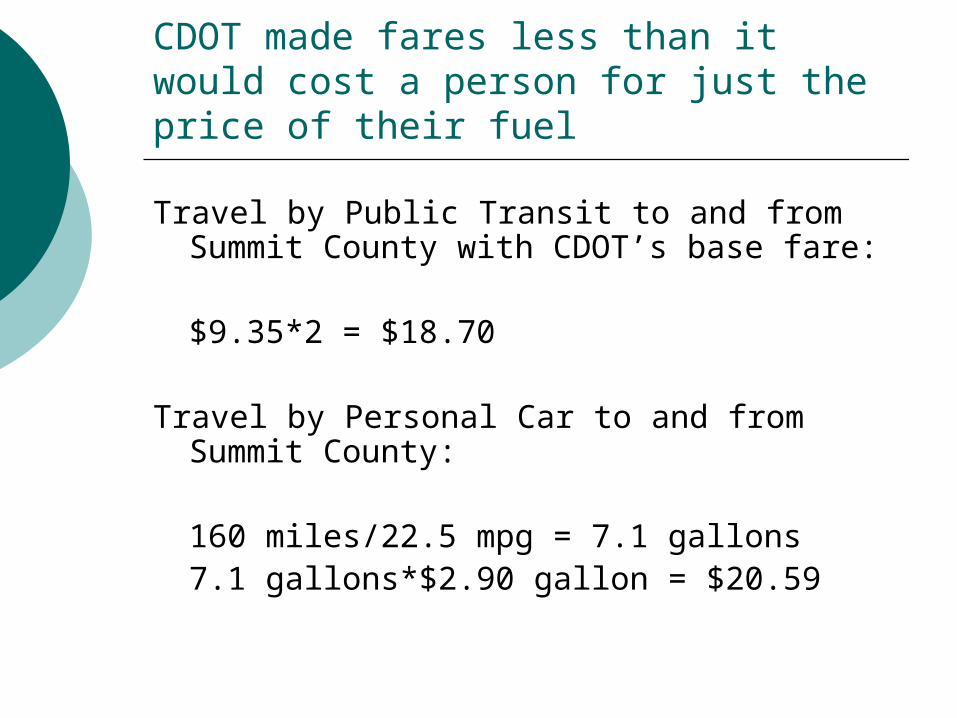
CDOT made fares less than it would cost a person for just the price of their fuel
Travel by Public Transit to and from Summit County with CDOT’s base fare:
$9.35*2 = $18.70
Travel by Personal Car to and from Summit County:
160 miles/22.5 mpg = 7.1 gallons 7.1 gallons*$2.90 gallon = $20.59
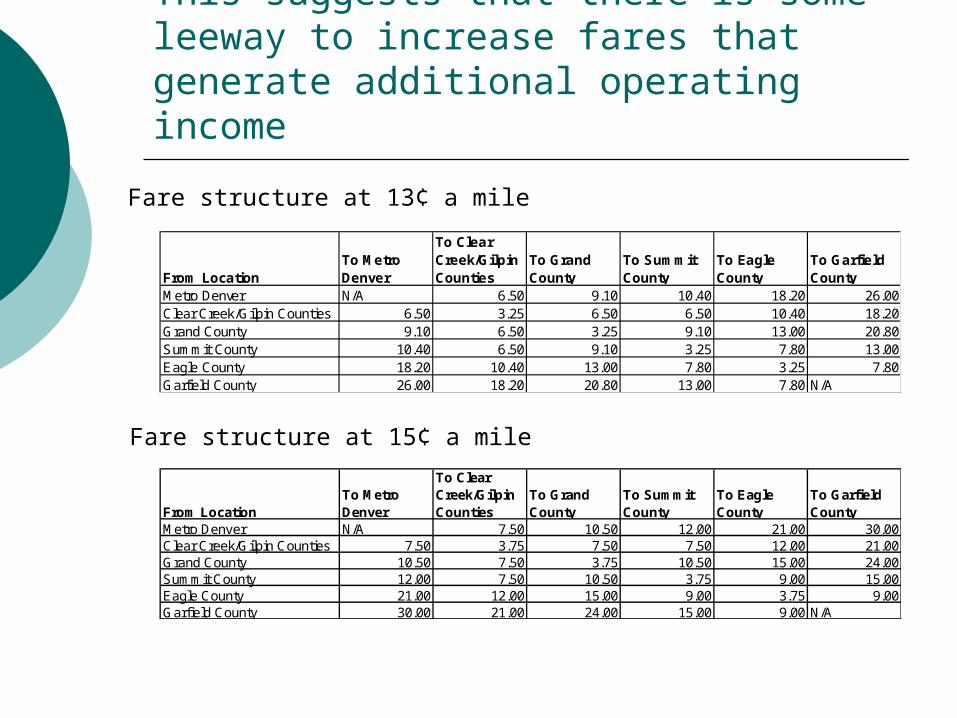
This suggests that there is some leeway to increase fares that generate additional operating income
From LocationTo Metro Denver
To Clear Creek/Gilpin Counties
To Grand County
To Summit County
To Eagle County
To Garfield County
Metro Denver N/A 6.50 9.10 10.40 18.20 26.00Clear Creek/Gilpin Counties 6.50 3.25 6.50 6.50 10.40 18.20Grand County 9.10 6.50 3.25 9.10 13.00 20.80Summit County 10.40 6.50 9.10 3.25 7.80 13.00Eagle County 18.20 10.40 13.00 7.80 3.25 7.80Garfield County 26.00 18.20 20.80 13.00 7.80 N/A
Fare structure at 13¢ a mile
From LocationTo Metro Denver
To Clear Creek/Gilpin Counties
To Grand County
To Summit County
To Eagle County
To Garfield County
Metro Denver N/A 7.50 10.50 12.00 21.00 30.00Clear Creek/Gilpin Counties 7.50 3.75 7.50 7.50 12.00 21.00Grand County 10.50 7.50 3.75 10.50 15.00 24.00Summit County 12.00 7.50 10.50 3.75 9.00 15.00Eagle County 21.00 12.00 15.00 9.00 3.75 9.00Garfield County 30.00 21.00 24.00 15.00 9.00 N/A
Fare structure at 15¢ a mile
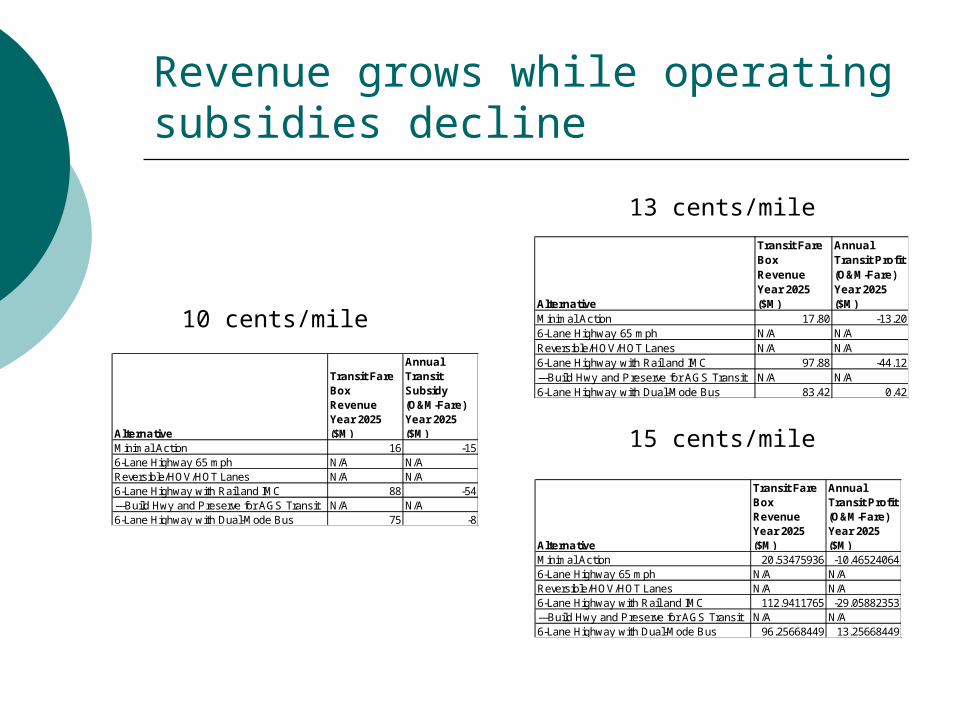
Revenue grows while operating subsidies decline
Alternative
Transit Fare Box Revenue Year 2025 ($M)
Annual Transit Subsidy (O&M-Fare) Year 2025 ($M)
Minimal Action 16 -156-Lane Highway 65 mph N/A N/AReversible/HOV/HOT Lanes N/A N/A6-Lane Highway with Rail and IMC 88 -54---Build Hwy and Preserve for AGS Transit N/A N/A6-Lane Highway with Dual-Mode Bus 75 -8
Alternative
Transit Fare Box Revenue Year 2025 ($M)
Annual Transit Profit (O&M-Fare) Year 2025 ($M)
Minimal Action 17.80 -13.206-Lane Highway 65 mph N/A N/AReversible/HOV/HOT Lanes N/A N/A6-Lane Highway with Rail and IMC 97.88 -44.12---Build Hwy and Preserve for AGS Transit N/A N/A6-Lane Highway with Dual-Mode Bus 83.42 0.42
Alternative
Transit Fare Box Revenue Year 2025 ($M)
Annual Transit Profit (O&M-Fare) Year 2025 ($M)
Minimal Action 20.53475936 -10.465240646-Lane Highway 65 mph N/A N/AReversible/HOV/HOT Lanes N/A N/A6-Lane Highway with Rail and IMC 112.9411765 -29.05882353---Build Hwy and Preserve for AGS Transit N/A N/A6-Lane Highway with Dual-Mode Bus 96.25668449 13.25668449
10 cents/mile
13 cents/mile
15 cents/mile

To differentiate our analysis from CDOT’s we explored ridership numbers
AlternativeEstimated Passengers
Minimal Action 17,112,2996-Lane Highway 65 mph N/AReversible/HOV/HOT Lanes N/A6-Lane Highway with Rail and IMC 94,117,647---Build Hwy and Preserve for AGS Transit N/A6-Lane Highway with Dual-Mode Bus 80,213,904
Alternative Estimated PassengersMinimal Action 18,823,5296-Lane Highway 65 mph N/AReversible/HOV/HOT Lanes N/A6-Lane Highway with Rail and IMC 103,529,412---Build Hwy and Preserve for AGS Transit N/A6-Lane Highway with Dual-Mode Bus 88,235,294
Alternative Estimated PassengersMinimal Action 20,534,7596-Lane Highway 65 mph N/AReversible/HOV/HOT Lanes N/A6-Lane Highway with Rail and IMC 112,941,176---Build Hwy and Preserve for AGS Transit N/A6-Lane Highway with Dual-Mode Bus 96,256,684
CDOT’s Estimate
10% More
20% More
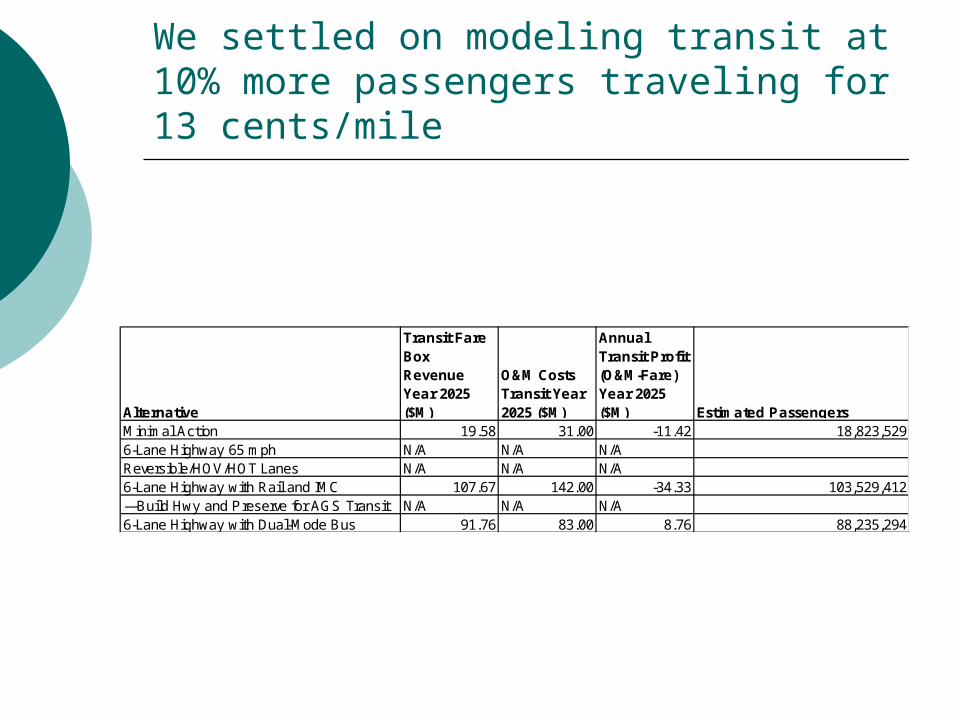
We settled on modeling transit at 10% more passengers traveling for 13 cents/mile
Alternative
Transit Fare Box Revenue Year 2025 ($M)
O&M Costs Transit Year 2025 ($M)
Annual Transit Profit (O&M-Fare) Year 2025 ($M) Estimated Passengers
Minimal Action 19.58 31.00 -11.42 18,823,5296-Lane Highway 65 mph N/A N/A N/AReversible/HOV/HOT Lanes N/A N/A N/A6-Lane Highway with Rail and IMC 107.67 142.00 -34.33 103,529,412---Build Hwy and Preserve for AGS Transit N/A N/A N/A6-Lane Highway with Dual-Mode Bus 91.76 83.00 8.76 88,235,294

Standing for Cost-Benefit Analysis
Affected County Residents State Residents Tourists Business interests Local and interstate freight interest

Each alternative has a different ability to accommodate demand
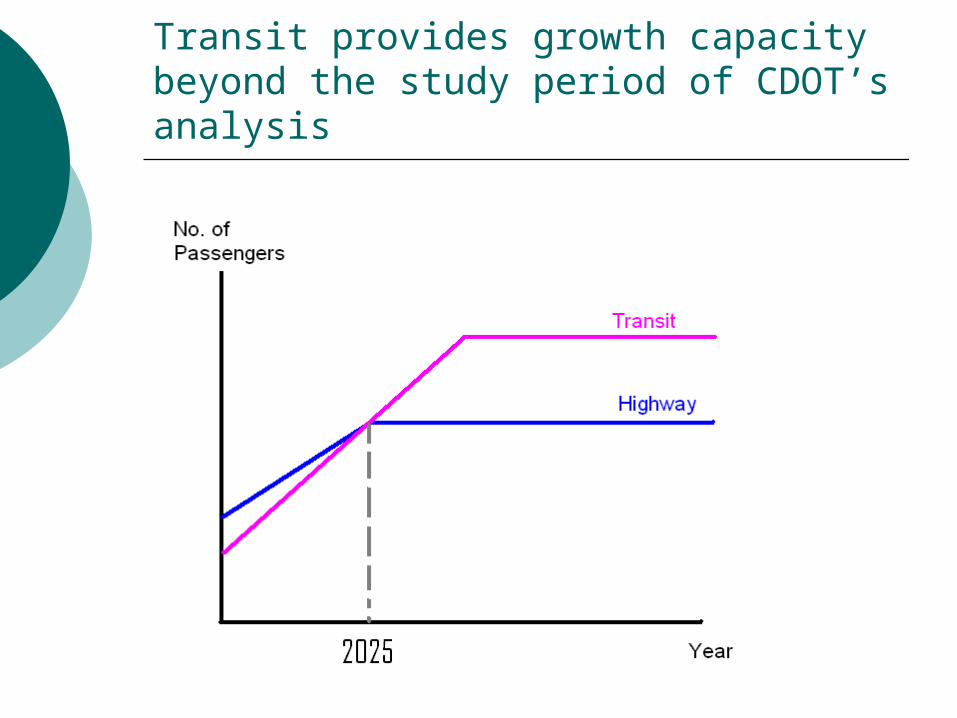
Transit provides growth capacity beyond the study period of CDOT’s analysis
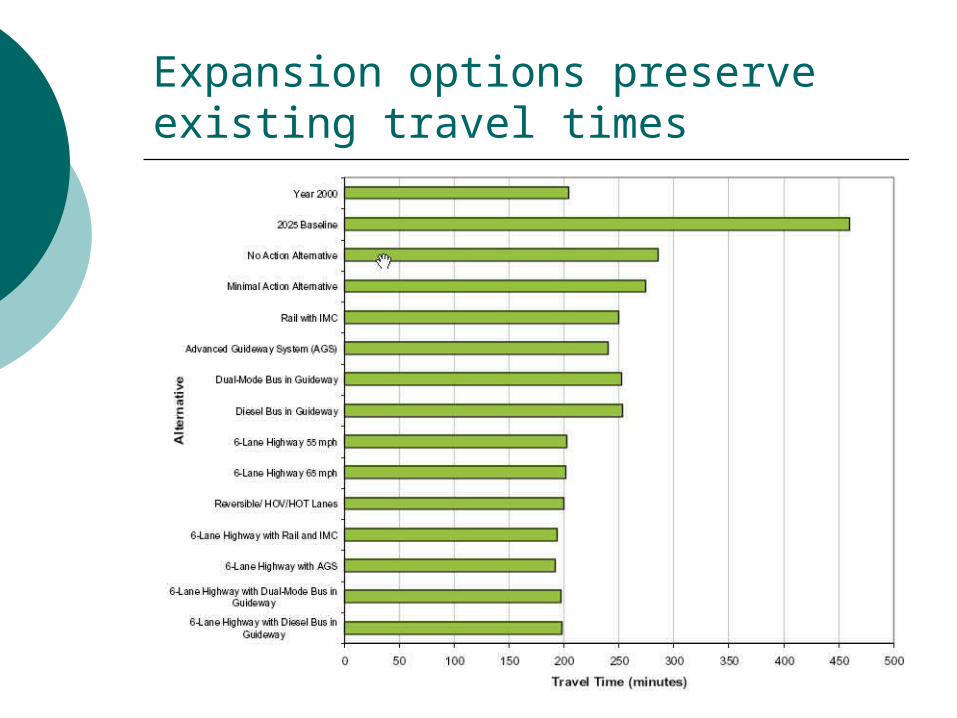
Expansion options preserve existing travel times
Methodology of Ranking Alternatives
Took numbers in 2000 dollars and converted them to 2006 dollars
Then inflated by 3% a year
Applied varying social discount rates and compared it to a constant social discount rate

With a constant NPV, building a highway and preserving a right of way for an Advanced Guideway System has the greatest NPV
NPV Alternative Social Discount Rate8,199 Build Hwy and Preserve for AGS Transit 0.075,818 6-Lane Highway with Dual-Mode Bus 0.074,100 Reversible/HOV/HOT Lanes 0.073,852 6-Lane Highway with Rail and IMC 0.072,757 6-Lane Highway 65 mph 0.072,378 Minimal Action 0.07

Applying different social discount rates on the ability of an alternative to increase capacity leads to a high NPV for multimodal solutions
NPV Alternative Social Discount Rate7,892 6-Lane Highway with Rail and IMC 0.035,655 6-Lane Highway with Dual-Mode Bus 0.044,258 6-Lane Highway 65 mph 0.073,957 Reversible/HOV/HOT Lanes 0.073,943 Build Hwy and Preserve for AGS Transit 0.072,556 Minimal Action 0.15