Undo & Redo - GPF · 1 Undo & Redo โดย กองทุนบ าเหน็จบ านาญข้าราชการ (กบข.) มติ ครม. กรณี Undo

Sketcholution: Interaction Histories for Sketching
Zhenpeng Zhao1 , William Benjamin2 , Niklas Elmqvist1,3∗, Karthik Ramani2
1Department of Computer Science, University of Maryland, College Park, MD, USA; 2School ofMechanical Engineering, Purdue University, West Lafayette, IN, USA; 3College of Information
Studies, University of Maryland, College Park, MD, USA
Abstract
We present Sketcholution, a method for automatically creating visual histories ofhand-drawn sketches. Such visual histories are useful for a designer to reflect ona sketch, communicate ideas to others, and fork from or revert to an earlier pointin the creative process. Our approach uses a bottom-up agglomerative cluster-ing mechanism that groups adjacent frames based on their perceptual similaritywhile maintaining the causality of how a sketch was constructed. The resultingaggregation dendrogram can be cut at any level depending on available displayspace, and can be used to create a visual history consisting of either a comic stripof highlights, or a single annotated summary frame. We conducted a user studycomparing the speed and accuracy of participants recovering causality in a sketchhistory using comic strips, summary frames, and simple animations. Althoughanimations with interaction may seem better than static graphics, our results showthat both comic strip and summary frame significantly outperform animation.
Keywords: sketching, interaction history, animation, summaries, user study
1. Introduction
Sketching is commonly defined as rapidly created freehand drawing that is notintended to yield finished work, but rather to visually explore ideas [1], and is a
∗Corresponding author. University of Maryland, College Park, 2117H Hornbake Building,South Wing, College Park, MD 20742, USA. Phone: +1 (301) 405-7414, Fax: +1 (301) 314-9245.
Email addresses: [email protected] (Zhenpeng Zhao1), [email protected](William Benjamin2), [email protected] (Niklas Elmqvist1,3), [email protected] (KarthikRamani2)
Preprint submitted to International Journal of Human-Computer Studies May 18, 2015

(a) Comic strip (6 frames). (b) Summary frame (events 1-6).
Figure 1: Our two Sketcholution visual history mechanisms illustrating the evolution of a sketch.
common tool for early design and creativity, regardless of discipline [2]. Whilepen and paper remains the most common medium for such activities, digital mediafor sketching has several compelling benefits beyond paper. One such is the abilityto capture not just the final state of a sketch, but also every intermediate statealong the way. Based on this idea, we propose Sketcholution, an automatic visualinteraction history of how a sketch has evolved over time (Figure 1). Whereas apaper-based visual history would require the designer to take regular photocopiesor digital pictures of the sketch being worked on, Sketcholution runs unobtrusivelyin the background of the digital sketch tool, capturing every single stroke made bythe designer. This interaction history can then be played back, stroke by stroke,to show how the sketch was created and evolved over time. This would allow thedesigner to, for example, recall progress made during an earlier sketch session,communicate a particular idea to a collaborator or stakeholder, or access an earlierversion of a sketch to either revert to or fork from that version (similar to sourcecontrol systems).
Animation with interactive control is a seemingly obvious choice over staticrepresentation given that animations have been shown to improve understandingof spatiotemporal information [3, 4]. However, merely playing back an animationof the interaction history for a sketch is not necessarily the optimal presentationmethod. Complex animations can be difficult to perceive accurately [5] and arealso potentially time-consuming to view in their entirety. For that reason, wepropose two new static techniques for automatically summarizing sketch historycaptured during one or several design sessions: a comic strip of representativeframes (or highlights) during the history, and a summary frame that annotates thechanges made to the sketch in a single image. Both approaches rely on a bottom-up agglomerative clustering algorithm [6] that combines adjacent frames (each
2

representing a stroke) into frame aggregates while retaining the causal sequenceof the interaction history. The decision of which frames to combine depends on thedistance between consecutive frames as computed by a frame distance function.The resulting aggregation dendrogram can be cut at any level to yield a desirednumber of frames (for comic strips), or a particular distance threshold betweenevents (for summary frames).
To determine which history presentation—animation, comic strip, or summaryframe—is most efficient, we conducted a user study comparing the completiontime of participants recovering the causal sequence of visual components in asketch. Results show that both comic strip and summary are significantly fasterthan animation. These results also provide compelling evidence to the controversysurrounding animation for comprehension [7].
2. Related Work
Our sketch captury and summary mechanism lies at the intersection of sketch-ing, early design, and interaction histories. Below we review relevant work inthese research areas.
2.1. Sketching and CognitionA sketch is a rapidly created freehand drawing that is not intended to create
finished work, but rather to visually explore ideas [1, 2]. Sketches can be usedin the design of electrical, mechanical, scientific, mathematical, and software arti-facts [8]. For this reason, sketches are often used for idea generation and recordingin early design—see below.
The order in which we sketch and draw reflects how we think. Taylor andTversky [9] studied how people create regional maps and observed that the or-der in which people draw reflects their mental organization of the space. Re-gions which had features at multiple scales were depicted starting with larger fea-tures first followed by smaller ones. Sketches themselves have a definite structuresimilar to language and consists of basic elements such as lines and blobs [10].Tversky [11] showed that the order of sketching elements reveals the designer’sunderlying conceptual organization.
2.2. Sketching for Early DesignDesign is a gradual, iterative process, often beginning from ill-defined or dif-
ficult problems that are decomposed, explored, and integrated in turns to yieldmany possible solutions [12]. Sketches play an important role in externalizing
3

ideas during early design [2], providing a “visible graphic memory” (p. 127) thatfacilitates creativity by providing an easily accessible database of generated ideasand by stimulating building on earlier ideas. Studies show that pictorial repre-sentations in general, and sketching in particular, is more effective than any otherrepresentations during early phases of ideation and creativity [13]. Furthermore,pen and paper remain the most common tools for sketching in early design [1].Greenberg et al. [14] present a collection of methods to illustrate how to designwith sketching.
Nevertheless, with the recent proliferation of pen-input devices, many effortshave been made to develop sketch-based interfaces for early design in a widevariety of domains such as architecture [15], automotive design [16], and soft-ware design [17]. These approaches all aim at replicating the good properties ofpaper—such as minimal learning curve, natural and precise interaction, and phys-ical affordances—while retaining the unique benefits afforded by digital media,such as replication and composition of sketches.
2.3. Interaction Logs and Graphical HistoriesInteraction logs and histories are common in human-computer interaction due
to their relation to undo and redo operations, and modern user applications typi-cally support multi-level versions of these, sometimes of a selective nature [18].Similarly, navigation histories are central to web browsers, allowing users to eas-ily go back and forward while browsing the Web. Heer et al. [19] carefully reviewthe design space of interaction histories; we refer to their survey for further de-tails on interaction capture and recall. Compared to Heer et al., our work targets adifferent media type and uses an aggregation algorithm to chunk the history.
Interaction data can be used to even greater effect. Graphical histories do notjust maintain a list or stack of interactions, but also show them using a graphicalsummary [20]. This is most commonly done using a thumbnail image of previ-ous state [19, 21], and allows for capturing interactions over time [22]. In recentwork, Heer et al. [19] propose a comic strip-style graphical history using thumb-nails of previous visualizations. Further, recent work has shown that augmentingsketch histories with contextual information such as pictures audio and videosimproves the effectiveness of sketching for communication in early design [23].Proper segmentation with users’ guidance makes the graphical history eaisier tounderstand [24].
Beyond interaction data, histories have also been used for summarizing othermedia types. For example, histories for binary image files can be modeled using adirected acyclic graph to store temporal and semantic relationships [25]. For video
4

histories, Barnes et al. [26] proposed continuous zooming to support navigationin time. Building on this, Ajmal et al. [27] give a comprehensive introduction tovideo summarization techniques, of which cluster-based and color-based methodsare partially similar to our proposed aggregation approach. Eccles et al. [28] in-tegrated geotemporal information into storytelling and presented stories with datasuch as behaviors and events. However, compared to all of the above techniques,our aggregation approach is different, our data type is sketch strokes, and we alsofocus on presentation techniques for the cluster data, which we evaluate with auser study.
Figure 2: Visual dendrogram of sequential agglomerative clustering of a sample sketch. Thedistances between individual frames (bottom of image) only have to be computed once. Eachsketch impostor shown in the dendrogram (above the bottom sequence) represents a cluster of twochild sketches, and is chosen from the two children as the one with the most strokes (i.e., mostinformation).
3. Sketcholution
Sketcholution is an automatic technique for capturing and visualizing the his-tory of a sketch for the purpose of reflection, collaboration, and revision. Based onour literature review, we formulate the following design goals for a sketch-basedhistory mechanism:
• Stroke-level events: A truly useful sketch history requires fine-grained his-tory capture down to the level of individual strokes and formatting opera-tions. This would enable the designer to reflect on each individual changein a sketch.
5

• Chronology-preserving: The causal order of how a sketch was constructedis a vital part of providing an accurate history. The chronology may alsogive insight into the creative process behind the sketch beyond the finalresult.
• Efficient screen usage: The sketch history should be space-efficient andadaptable to any screen area; in fact, it may become integrated into thesketch editor itself.
• Efficient time usage: An efficient history mechanism for sketches shouldsupport quick references so that it can become part of the sketch flow.
Many versioning systems allow users to revert and fork the version historyfrom earlier revisions. However, such advanced version control operations arebeyond the scope of this work; here we only concern ourselves with capturing andsummarizing sketching.
3.1. Data ModelWe define a digital sketch as a canvas and an ordered list of sketch operations
that, when executed in sequence by an appropriate 2D rendering engine, yields avisual representation of the sketch on the canvas. Many types of sketch operationsare potentially relevant; in this work, we include draw strokes, erase strokes, andformatting (color, transparency, stroke thickness). Both draw and erase strokesare modeled as pairs of 2D points (lines), where the former add digital ink to thecanvas, and the latter remove it.
Using this definition of a digital sketch, it is clear that the sketch itself isalso a stroke-by-stroke history of how it was constructed, from the first drawingoperation to the last. We therefore call the list of sketch operations in the sketch asketch history. This also means that rendering a sketch consisting of N operationsfrom the beginning yields N consecutive frames—as in an animation—where thelast frame FN is the current state of the sketch: F1, F2, . . . , FN . A frame Ft can beseen as the set of sketch operations added to the sketch up to a time t. To completethis interpretation, we also include time stamps t with each individual operationin the list, allowing us to exactly animate both the order and timing of the sketch.
3.2. Sketch CaptureWhereas most versioning systems (such as SVN, git, and Subversion) as well
as cloud storage systems (Dropbox and Google Drive) operate on a file level,
6

Sketcholution must integrate with the sketch editor itself in order to collect stroke-level data. We focus on two main sketch operations—drawing and erasing—aswell as changing the color and thickness of the drawing stroke, and the size ofthe eraser (however, other operations are also possible to capture and recall). Allsketch input results in sequences of stroke segments (two points forming a line)being added to the sketch history as draw or erase strokes (depending on the cho-sen tool).
Storing a Sketcholution sketch amounts to serializing the canvas (dimensions,background, title, etc) as well as the entire sketch history. For long sketch histo-ries, it may be impractical to execute or store the entire sequence of operationsfrom beginning to end due to high rendering time and memory consumption, re-spectively. This is particularly true when many draw strokes have since beenerased. For this purpose, we use the SVG format to store a cached version of thecurrent state of a sketch’s visual representation.
Figure 3: Four-frame comic strip representation of the sketch shown in Figure 2. The four frameswere chosen by cutting the aggregation tree (dendrogram) in Figure 2 at depth 3 (N = 4), yieldingfour impostor children.
3.3. Sketch SummaryThe design space of interaction histories is large [19], but our design goals
limit the options to consider. Since our intention with this work is not to supportforking past states, there is no branching model and thus no need for a hierarchicalvisual representation. Rather, the sketch history is a linear list, and the challengeinstead becomes how to reduce the number of frames that are shown in the sum-mary, from showing all N frames to just showing one.
In light of these constraints and goals, we formulate the following main typesof sketch summary mechanisms (discussed below):
• Animation: Play back the entire sequence as a smooth animation. Thisoption corresponds to one end of the above design spectrum: including allN frames.
7

• Comic strip: Render a subset of n representative frames as a static comicstrip. The number would be selected as n ∈ (1, N), so this constitutes adesign compromise.
• Summary frame: Create a single frame that captures the entire sequenceand enumerates the order of events. This design is at the other end of thespectrum: n = 1.
3.3.1. Animated PlaybackAnimated playback is the most straightforward of all: summarize the history
of the sketch being drawn by simply replaying the operation sequence and showhow the sketch evolves as strokes and formatting changes are executed. There isno attempt to reduce the number of frames, yet several design issues must still beresolved, the primary ones being timing, animation speed, and user control.
Timing refers to how to map the timestamped sketch operations in the sketchhistory to animated playback. While it may be useful to see the relative timingof operations (i.e., that the user took more time drawing one part of the sketchthan another), most of the time the timestamps can be ignored and the operationssimply be drawn in order with uniform timing. Speed, on the other hand, refers tothe overall speed with which the animation is played back. Typically, an animatedhistory will be played back faster than real time, although this could be left inthe hands of the user. In addition, easing the speed of the animation in and outusing temporal distortion may help perception [5]. Finally, user control concernsthe interaction model that is used to control the animation; we use a media playermetaphor, including play, pause, and rewind buttons, as well as a scrubber bar fordirectly controlling frame position.
3.3.2. Sequential AggregationBefore being able to summarize a sketch using either a comic strip or a sum-
mary frame, we need to find a way to reduce the number of frames in the se-quence, ideally without losing too much of the information encoded in the history.Furthermore, our design constraints mandate that we preserve the chronologicalorder in the history, yet provide a flexible data structure that can adapt to avail-able screen space. To achieve this, we use a variant of standard agglomerative(or hierarchical) clustering [6] where we preserve the order by only aggregatingadjacent frames. This sequential aggregation algorithm preserves the chronol-ogy of frames, whereas traditional hierarchical clustering typically considers thedistances between all items at each iteration of the algorithm.
8

For the aggregation to begin, we first need to compute the distances betweeneach neighboring frame in the sketch history. The distance between two sketchframes d(Ft−1, Ft) is a measure of how much has changed between the two con-secutive points in time, with the understanding that larger differences are morelikely to be interesting than smaller ones. Several different distance metrics arepossible (for example, how far the user’s pen has traveled from one frame to thenext); we explore this in more detail later in this paper.
With the distances computed, the aggregation algorithm proceeds in the nor-mal way by iteratively combining the two adjacent frames with the shortest dis-tance into a single aggregate with the two frames as children. Distances for thenew aggregate are taken from the child items, so no new distances need to becomputed. The hierarchy created during this process is stored in memory, andthe iterative merging is repeated until only one aggregate remains (the root ofthe aggregation hierarchy). Figure 2 shows how a sketch is iteratively clusteredbottom-up into an aggregation hierarchy.
When creating a new aggregate, an impostor frame is chosen to representthe whole aggregate. Impostor selection should be stable, i.e., the impostor foran aggregate should be one of the two impostors of its children, otherwise thesketch history may change radically when expanding or collapsing an aggregateand thereby cause confusion. Of the two candidates taken from the children ofan aggregate, our algorithm chooses the one with the most visible strokes becausethis branch of the aggregation hierarchy has the most information to convey to theuser. Naturally, impostors for the original frames in the sketch history are thoseframes themselves.
3.3.3. Comic StripThe basic idea behind the comic strip history mechanism is to select a subset
of n ∈ (1, N) frames and show them in a static comic strip, i.e., in a list or gridwhere time runs from left to right, top to bottom. Figure 3 shows a four-framecomic strip of a sketch.
Of course, selecting which frames from the sketch history to include is the realchallenge. This is where the sequential aggregation algorithm presented abovecomes in useful. Given a particular distance function, the dendrogram resultingfrom this cluster analysis constitutes a level-of-detail tree that can be cut at anylevel depending on the amount of screen space available. Such a cut (temporarilydisregarding the hierarchy above the tree cut) yields a forest of n subtrees. Theimpostor frame for each subtree root becomes a representative frame to use inthe comic strip. This way, the sketch history can be represented by any number of
9

frames n ≤ N , including n = 1 as well as n = N . For example, the comic strip inFigure 3 resulted from cutting Figure 2 at depth 3, yielding 4 subtrees representedby frames 2, 7, 8, and 12 from the sketch sequence.
3.3.4. Summary FrameOur intention with the summary frame was to provide a single frame where all
events were captured. This would represent a compact, space-efficient visualiza-tion of a dynamic event sequence that is diametrically opposite from animation,which uses all frames. We achieve this by computing the union of all strokes (eventhose who were later erased) drawn at different points in time during the sketchhistory into a single frame, and then adding visual annotations to highlight andenumerate the major events during the history. Figure 4 shows an example of asummary frame for Figure 2.
Again we come back to the problem of identifying the major representativeevents during the sketch history, and the sequential aggregation algorithm againprovides the solution. Let the diameter of an aggregate be defined as the sumof the sketch distances between all of its children. Instead of the user explicitlychoosing the number of frames to display in a comic strip, we traverse the den-drogram depth first, only stopping the traversal for each branch when the currentaggregate has a diameter less than or equal to a threshold value. The resulting listof frames become the events to highlight. For example, given a threshold of 0.45,such a traversal of the dendrogram in Figure 2 would yield frames 2, 5, 8, and12. We then draw the bounding box of the strokes for each frame in the singlesummary frame and add an ordinal number. We use a green box and numeral foradded strokes and red for erased strokes.
To be able to separate drawing and erasing into different events that can beconveyed with different colors, we must also use a distance metric that differen-tiates between these two types of events. This in turn will cause the aggregationhierarchy to become a forest instead of a single tree; a tree consisting of draw-ing strokes simply cannot be merged with a tree consisting of erasing strokes. Along sequence of alternate drawing and erasing will thus yield many events in theresulting summary frame, even if each is minor.
3.4. ImplementationWhile we expect a production sketch tool to run on a mobile tablet, our pro-
totype Sketcholution implementation (Figure 1) is built in Java using the Pic-colo2D [29] library for vector graphics. The main component in the Sketcholu-tion software is the sketch history, implemented as a queue of operations using
10

Figure 4: Summary frame for Figure 2 with ordinal numbers given the temporal sequence ofevents. The green bounding box communicates objects being added; removed objects (none inthis sequence) would be drawn using a red color instead.
the Command design pattern. Because early design requires minimally-invasiveinterfaces and as close to natural interaction as possible, we chose not to exposethis functionality in our prototype.
4. Sketch Distance Metrics
Our sketch summarization approach has two major advantages compared tomore traditional summarization approaches [30]: it is bottom-up, and it can beperformed online. To achieve this, we need appropriate sketch distance metricsd(Ft−1, Ft) that accurately portray the absolute difference between two consecu-tive sketch frames at timestamps t−1 and t. Below we review some of the distancemetrics we have experimented with in our prototype:
• Temporal distance: The temporal order in how people sketch and draw
11
reflects how we think [9], which indicates that the time spent in drawingparts of a sketch may be an interesting distance metric to explore.
• Euclidean distance: Another simple metric is defined as the 2D distance(in pixels) that the user’s pen has moved between the frames. This metricwill cluster adjacent strokes tighter than distant ones, and is used in Figure 1.
• Perceptual distance: Euclidean distance alone will not distinguish betweencolor, thickness, and transparency, but such formatting changes are oftenimportant in segmenting a sketch history. A perceptual distance metric ex-tends the Euclidean metric by assigning weights based on the visual saliencyof the chosen stroke format.
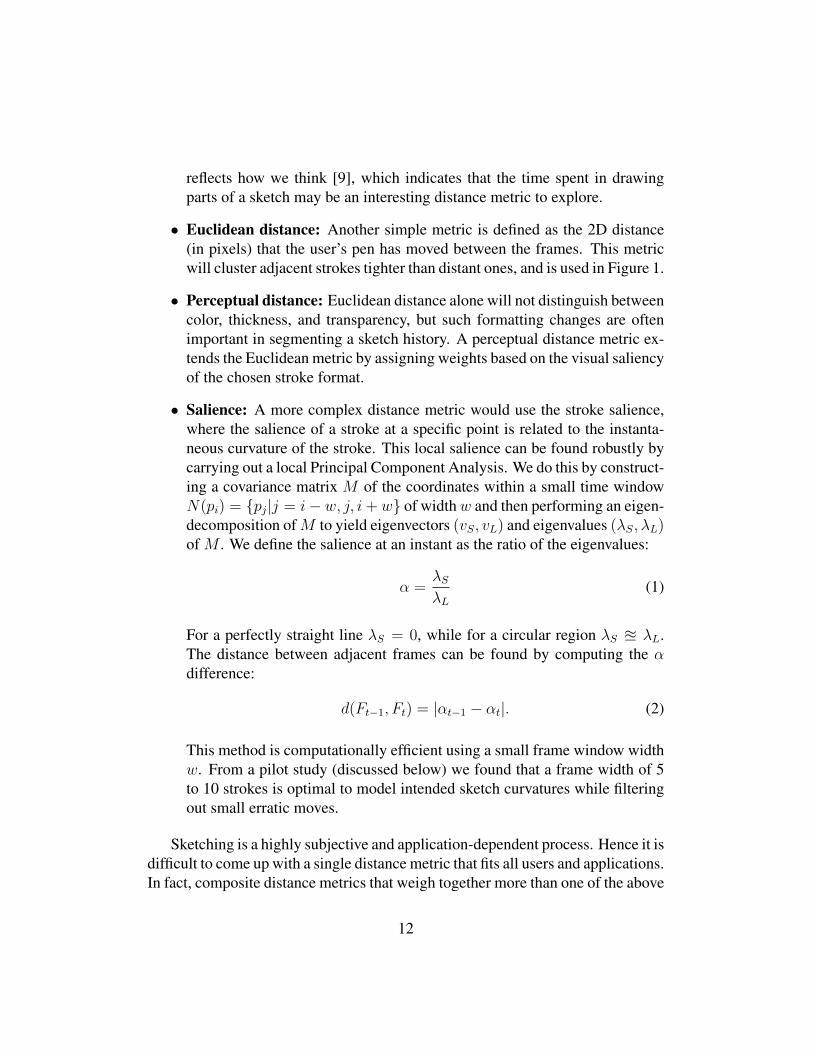
• Salience: A more complex distance metric would use the stroke salience,where the salience of a stroke at a specific point is related to the instanta-neous curvature of the stroke. This local salience can be found robustly bycarrying out a local Principal Component Analysis. We do this by construct-ing a covariance matrix M of the coordinates within a small time windowN(pi) = {pj|j = i− w, j, i+ w} of widthw and then performing an eigen-decomposition ofM to yield eigenvectors (vS, vL) and eigenvalues (λS, λL)of M . We define the salience at an instant as the ratio of the eigenvalues:
α =λSλL
(1)
For a perfectly straight line λS = 0, while for a circular region λS u λL.The distance between adjacent frames can be found by computing the αdifference:
d(Ft−1, Ft) = |αt−1 − αt|. (2)
This method is computationally efficient using a small frame window widthw. From a pilot study (discussed below) we found that a frame width of 5to 10 strokes is optimal to model intended sketch curvatures while filteringout small erratic moves.
Sketching is a highly subjective and application-dependent process. Hence it isdifficult to come up with a single distance metric that fits all users and applications.In fact, composite distance metrics that weigh together more than one of the above
12

metrics are often good compromises. A general methodology to select distancemetrics given an application is left for future work.
In many real-life design scenarios, such as that discussed by Schmidt etal. [31], continuous refinement and correction is an essential sketch activity. Thefinal outcome has all the details and color on top of the original design scaffold-ing, which makes it hard for the user to review and have a quick overview for thewhole process. In this case, a good distance metric may be based on color andthickness combined with temporal distance, as sketchers typically change theirpens for either another color or thickness, and may often pause before startinganother stage in the layered sketch.
5. User Study
At this point, we have derived three different techniques for conveying sketchhistory—animation, comic strip, and summary frame—but have no data on whichof these techniques perform best under different conditions. Our intuition is thatcomic strips and summary frames will outperform animation when the testingsample is long and complex. On the other hand, for short and simple tasks, weexpect that animation will be fastest since such tasks do not require summariza-tion [27], and animation is also more familiar to participants.
To find the answer to this question, we performed a controlled user study thatcompared the completion time of participants recovering the temporal sequenceof visual components being added and removed from a sample sketch.
5.1. Pilot StudyPrior to performing the full experiment, we first conducted an in-depth pilot
study involving 16 participants. In the pilot study, we used a simple task sketchhistory recall task (similar to the actual study below), but used the pilot to de-termine suitable factors and conditions. During the pilot study, we found that thelength of a sketch history and the context components that serve as background areinteresting factors affecting the overall difficulty of the tests. However, the initialexperimental design for the pilot study was not able to adequately distinguish be-tween different difficulty levels. After increasing these two factors, we were ableto obtain results so that groups were well separated based on completion time. Wecarefully selected the parameters to keep a balance so that participants will haveenough challenge in the hard cases while their performance will not be affectedby fatigue. This increased difficulty lead to increased session duration. In conse-quence, we were forced to take fewer participants in the formal user study due to
13

limited time and budget. We explain the details of the two experimental factorsbelow.
For the techniques of Single Frame and Comic Strip, we also observed thatobtaining the correct number of frames is essential to the their effectiveness, i.e.the time for the participants to finish certain task using such techniques. Therefore,we developed an automatic segregation approach that separates the sketch intodiscrete frames. We tested this approach in the pilot study to reach an optimalseparation rate, and used the parameters to the actual study with minor changes.
All of the parameters for factors in the below text were chosen to best separatethe efforts of participants while keeping the tasks manageable.
5.2. ParticipantsWe recruited 12 paid participants (6 male, 6 female) for this user study (each
paid $10). The participants were self-selected from the student population at ouruniversity, were aged between 20 and 31 years of age, had normal or corrected-to-normal vision, and were proficient computer users (all demographics were self-reported). A majority of participants were engineering students with a designbackground.
5.3. ApparatusWe conducted the experiment on a standard desktop computer equipped with a
24-inch LCD screen (resolution 1600× 1200), a standard keyboard, and a mouse.The Sketcholution software was maximized to fill the entire screen during theexperiment.
5.4. Task and DataBased on previous work on graphical histories [19] and causality in analyt-
ics [32], we selected a task based on recovering the casality of events in an inter-action history. In our case, each trial consisted of the participant using one of thethree sketch history mechanisms to view the evolution of a sample sketch.
The sample sketch consisted of several smaller “sketch objects”: D distractorobjects, A added objects, and R removed objects. A sketch object is defined asa relatively small (approximately 100–300 pixels in dimension) sketched compo-nent of a clearly distinguishable physical item, such as a car, face, or heart shape.All objects were recorded using one-pixel wide black strokes for simplicity. Asample sketch was constructed by assembling a sequence of A sketch objects be-ing added to the sketch, and R objects being removed. This design was chosento allow us to procedurally generate new trials from scratch. Sketch objects were
14

selected from a pool of 23 discrete objects of different complexity, and each objectwas used at most once per trial. The order of object additions and removal wasrandomly permuted, whereas distractor objects never changed during a trial.
The user study task was to use the given sketch history mechanism to recoverthe order of added and removed sketch objects in the overall sketch. Participantswere given a randomly ordered list of the sketch objects involved in the samplesketch, and were asked to specify the order. This was done by simply selectinga number representing its order of appearance or disappearance for each objectusing combo boxes (Figure 5). A trial could only be completed when the exactorder for each sketch was given (incorrect clicks were recorded). The experimen-tal platform silently recorded the completion time from the beginning of the trialto the moment the user clicked the submit button once the answer was correct.
Figure 5: Screenshot from the study setup using the summary frame technique. In this example,we chose both temporal and Euclidean distance metrics for better segmentation. Temporal distanceis added with a weight of 0.3 for better segmentation rates based on results from our pilot study.
5.5. FactorsWe included the following factors in the experiment:
5.5.1. History Mechanism (H)This factor modeled the sketch history mechanism H used:
15

• Animation: Basic animation playback where the participant can play,pause, and rewind the action, fast-forwarding, fast-rewinding, as well asmoving the seeker bar to any time in the animation. All these controls wereavailable throughout the trials. The playback window was stretched to fillthe entire available screen space, minus the playback control interface.
• Comic strip: The Sketcholution comic strip where the available screenspace is subdivided into smaller frames, each showing a representative snap-shot of the history. The participant was able to control the number of framesusing a slider; the initial number was five. Increasing the number caused theindividual frames to become smaller, but showed a larger number of historyhighlights (and vice versa).
• Summary frame: The Sketcholution summary frame where a single an-notated picture of the sketch history was stretched to fit the entire screen.The number of significant events to annotate in the summary was deter-mined from distance thresholds found using a pilot. This number could alsobe controlled by the participant using a slider similar to the slider used forthe comic strip; increasing the event number would simply highlight moreevents in the summary frame.
Even if our sketch objects were discrete, we did not artificially add delim-itations between them, but used the complete stroke-level history of the sketchobjects constituting the history.
5.5.2. Sketch Complexity (C)The length of a sketch history will clearly have an impact on the difficulty of
recovering the sequence of events; the longer the history, the more elements tosurvey and remember. To model this, we introduced a sketch complexity factor Cas the sum C = A+R, i.e., the total number of added and removed sketch objectsconstituting the history. Given C, values for A and R were selected randomly.The pilot study had a low Sketch Complexity: 3, 5, 8. We increased it to 5, 8, 11in the acual user study to increase the difficulty.
5.5.3. Distractor Level (D)Sketches often contain components that either serve as context (for example,
reference figures or background scenery), are part of earlier work, or were createdby others in a collaborative setting. These visual components still add to the visualcomplexity of the sketch. We speculate that these invariant components in a sketch
16

that do not change over the course of the sketch history may therefore impactperformance. We thus added a distractor factor D that modeled the number ofsuch distractors that are visible in the sketch. We selected the distractor factor asa set of low (2 distractors), medium (4 distractors), and high (6 distractors) in thepilot study. We found that this configuration was not enough to serve its purpose,so we increased the number of distractors to 2 (low), 4–6 (medium), and 8–10(high) distractors.
5.6. Experimental DesignWe used a full-factorial within-participants design:
12 participants× 3 History Mechanisms H (anim, strip, frame)× 3 Sketch Complexities C (5, 8, 11)× 3 Distractor Levels D (low, medium, high)
324 Total trials (27 per participant, training excluded)Trials were organized in blocks for each history mechanism. Block order was
balanced using a Latin square participants to counteract learning effects; otherfactors were randomized. Trial completion time (in seconds) was the single de-pendent variable.
5.7. ProcedureAn experimental session started with the participant arriving, reading and sign-
ing the consent form, and being assigned an identifier and history mechanismblock order. The administrator then explained the general goals and task for theexperiment. Each block started with the administrator demonstrating the use ofthe history mechanism and showing how to utilize it to solve a practice trial. Theparticipant was then given two practice trials to solve. These trials were not timedand the participant was allowed to ask questions about the history mechanism andthe task during this time. Since trials were timed individually, participants couldrest between any two trials at will.
Individual trials started with an empty intermission screen that instructed theparticipant to click on a button to start the next trial. Clicking on this button causedthe empty screen to be replaced by the history mechanism interface. A separatepanel provided a randomly ordered list of the names of the sketch objects involvedin the trial. The participant could select the ordinal number for each object’sappearance or disappearance during the sketch history using a dropdown menu.There was no need to specify whether the object had been added or removed
17

during the sequence. Participants clicked on a submit button to finish the trial, butwere allowed to proceed only if the provided order was correct.
After finishing a full block of 3 × 3 conditions per mechanism, participantswere asked to rate their perception of the efficiency, ease of use, and enjoya-bility of the history mechanism on a 1–5 Likert scale. After finishing all threeblocks, they were asked to provide any general comments or feedback on anyof the history mechanisms or the experiment. A full experimental session lastedapproximately 60 minutes, including training and questionnaires.
5.8. HypothesesWe formulate the following hypotheses about the study:
H1 Both Sketcholution interfaces will be significantly faster than animation.We believe that the visual summaries provided by the comic strip and sum-mary frame will be more efficient representations of sketch history thananimation.
H2 High sketch complexities will cause significantly longer completion timethan low complexities. The number of discrete components being added orremoved from the sketch will directly influence the time to solve a trial.
H3 Many distractors will cause significantly longer completion time than fewdistractors. Analogously, many distractors will make the task more difficult,and thus slower.
6. Results
We here report on the completion times and subjective ratings for the threedifferent history mechanisms.
6.1. Completion TimeWe analyzed completion times using a repeated-measures analysis of variance
(RM-ANOVA, all assumptions fulfilled) and found a significant main effect of his-tory mechanism H on the completion time (F (2, 22) = 106.59, p < .0001). Fig-ure 6 shows a visual summary of the completion times; averages of 61.7 secondsfor animation, 34.2 for summary frame, and 32.1 for comic strip. A posthoc TukeyHSD indicated that the difference between animation and comic strip as well asbetween animation and summary frame was significant (p < .05), with animationon average having twice as long completion time as the other two mechanisms.
18

Figure 6: Average completion time as a function of history mechanism H and complexity C.Comic strip and summary frame show significantly faster times than animation.
There was no significant difference between completion times for comic strip andsummary frame (p = .60).
Not surprisingly, the sketch complexity C had a significant main effect oncompletion time (F (2, 22) = 215.67, p < .0001). A posthoc Tukey HSDshowed that all complexity levels had significant pairwise differences (p < .05)in the order 5 < 8 < 11 in ascending completion time. Similarly, analysisof the distractor level D on completion time yielded a main significant effect(F (2, 22) = 4.89, p < .01). A pairwise Tukey HSD showed significant differ-ences for 2 < 10 number of distractors (p < .05).
Finally, we found a significant interaction between history mechanism H andcomplexity C (F (4, 44) = 8.16, p < .0001). A Tukey HSD posthoc test indicatedthat animation had comparable performance to both comic strip and summaryframe at low complexity (5 events), but was significantly (p < .05) slower for 8and 11 events.
6.2. Subjective RatingsFigure 7 depicts boxplots of the subjective ratings for each history mecha-
nism on efficiency, ease of use, and enjoyability. We analyzed the 5-point Likertscale of subjective ratings for the different history mechanisms and found that
19

EnjoyabilityEase of UseEfficiency
A C S A AC CS S
32
14
5
Figure 7: Subjective ratings (Likert 1–5). Comic strip and summary frame are higher than anima-tion for efficiency and ease.
the efficiency and ease of use rating were significantly different across the threemechanisms (Friedman test, p < .05), but the enjoyability had no significantdifference (Friedman tests, p = .12 for enjoyability). A Friedman posthoc testshowed significant differences of efficiency between comic strip and animation(p < .05), and significant differences of ease of use between comic strip andanimation (p < .001) and between comic strip and summary frame (p < .05).
7. Discussion
We can summarize our findings as follows (discussed below):
• Both comic strip and summary frame are considerably faster than animation(accepting H1);
• The complexity of trials (i.e., the number of components) had a direct im-pact on trial difficulty (accepting H2); and
• The number of distractors in the sketch history had significant impact oncompletion time (accepting H3).
7.1. Explaining the ResultsOur findings were in line with our initial hypotheses. Both summary frame
and comic strip showed better performance than animation. The most likely ex-planation for these results is that our two novel methods allow the user to overviewthe entire event sequence without relying on a dynamically changing visual repre-sentation and requiring no user interaction. Users were simply faster in recoveringcausal order using Sketcholution for these reasons.
20

We made several interesting observations on how participants used the differ-ent techniques to solve the task. For comic strip, participants seemed to movefrom frame to frame using the bounding boxes to mark changes. The comic strippartitions events into an orderly grid, and so is faster than an animation. Simi-larly, the numbered bounding boxes in the summary frame imposes structure onthe event sequence, relieving the user from having to replay the sketching historyand explicitly remember the ordering.
It is hardly surprising that the complexity of a trial is indeed governed bythe number of sketch components that are added or removed during the history,and this is a direct impact from the need to provide more information to the test-ing platform to recover the sequence. Animation of complex sketches involved anoticeably large amount of user interaction to recognize and recall events in thesketching sequence. The summarized nature of comic strip and summary framemade it significantly easier to identify the sketching sequence in the presence ofcomplexity.
Distractors have a significant impact on completion times. This is again notsurprising: a higher number of distracting items clearly makes it more difficult tomemorize the event sequence, especially for animation. On the other hand, comicstrip and summary frame have bounding boxes to indicate the changes whichmakes the distractors less effective. During the actual test, the combination ofhigh sketch complexity and distractor level significantly increased the completiontime.
7.2. Generalizing the ResultsHistory mechanisms are pervasive in HCI, so our findings are potentially im-
portant beyond the sketch interactions discussed here. For example, it is notablethat comic strips are common in several graphical history mechanisms [19]. Eventhough animation has comparable enjoyability to summary frame, it requires userinteraction to start, stop, and rewind. In contrast, both summary frame and comicstrips are static and require no user navigation.
On a more general level, both Sketcholution techniques proposed in this paperare examples of spatialization [33]: transforming temporal data into spatial rep-resentations. For Sketcholution, the stroke-level interaction sequence representsthe temporal data, and the techniques only differ in which spatial representationis used. Comic strips use small multiples, whereas the summary frame insteadorders the temporal data in the same image. Both approaches have their own prosand cons, and more research is needed to investigate the relative merits of eachtechnique in detail.
21

However, the common denominator for all spatialization methods is that theyrun the risk of introducing high visual clutter and complexity. This is certainlyalso true for the Sketcholution techniques; the comic strip scales down and mul-tiples the sketch canvas, yielding increased clutter proportional to the number offrames as well as smaller visual resolution for individual frames, and the number-ing and bounding boxes used in the summary frame will cause similar levels ofincreased clutter and visual complexity. The saving grace for sketches in compar-ison to, for example, digital video is that the overall level of visual detail tendsto be relatively low for sketches. However, it is equally true that a sketch willbecome increasingly complex as it is worked on over a longer period of time. OurSketcholution techniques will not scale well with such long sequences and morework is needed to accommodate them.
There are several strategies that we could adopt to combat scale and complex-ity in the future. Simple optimization rules could be applied to the interactionsequence that eliminates redundancy, such as discarding strokes that were imme-diately deleted or undone. Multiple operations could be chunked, similar to ourwork in the skWiki system [34], where a series of consecutive stroke or erase op-erations are grouped together into a single meta-operation. Finally, as observedearlier in this paper as a rationale for introducing distractors in our user study,there are often parts of a sketch that do not change much. Such invariant com-ponents could be ghosted so that they are less visually salient and thus less of adistraction.
Another limitation of the Sketcholution approach is that sequential agglom-erative clustering may not work well with holistic sketching where the illustratorevenly adds detail across the entire canvas (i.e., a form of breadth-first sketching)as opposed to working on different parts of the sketch separately (i.e., depth-first).We may have to relax the chronology-preserving design goal to better accommo-date such behavior. We leave this for future work.
Finally, our intended use-case for Sketcholution is to embed the methods intothe skWiki collaborative multimedia system [34]. skWiki stores persistent ver-sions of sketches, rich text, and images using the concept of a path as a sequenceof operations yielding a particular data object. We plan to use the Sketcholutionmethod to visualize the evolution of a sketch in the system. While our study showsclear advantages to the comic strip and summary frame techniques proposed inthis paper, a realistic implementation in the skWiki system may still provide allthree options. In fact, hybrid solutions may also be desirable: for example, an ani-mation could highlight recent changes using bounding boxes similar to the comicsstrip and summary frame. Another approach may be to chunk the animation into
22

individual segments, resulting in a hybrid animated comic strip.
8. Conclusions and Future Work
We have presented Sketcholution, a new approach to capturing and summa-rizing the interaction history for digital sketching. The approach is based on anorder-preserving agglomerative clustering algorithm that summarizes the stroke-level evolution of a sketch from the bottom up, yielding a visual summary that canbe adapted to any desired level of detail. Comic strip and summary frame are twoconcrete history mechanisms that use the aggregation tree resulting from this clus-ter analysis, and they present the results as a sequence of highlighted frames, or asa single annotated frame, respectively. Results from a controlled user study indi-cate that both comic strip and summary frame significantly outperform animation.Furthermore, both are static and require no user interaction.
In the future, we will keep exploring applications in the domain of artis-tic sketching where our techniques can be integrated into a tool of segmentingsketches based on their time stamps. Our techniques can also be handy in thefield of technical sketches and sketches of process schematics since such sketchestend to have multiple layers where our tools can separate the overlapped layers incertain cases. Our future work will also study how to use findings from the userstudy in a revision control framework for sketches. It should be possible to inte-grate our Sketcholution techniques directly into the editor interface. Furthermore,beyond vector drawing, automatically extracting animation summaries is appeal-ing for many domains, including storyboarding, general interaction histories, andvideo summarization.
9. Acknowledgments
This work is partly supported by the National Science Foundation grant no.1227639, the Donald W. Feddersen Chaired Professorship, and the Purdue Schoolof Mechanical Engineering. Any opinions, findings, and conclusions or recom-mendations expressed in this material are those of the authors and do not neces-sarily reflect the views of the sponsors.
References
[1] D. G. Ullman, S. Wood, D. Craig, The importance of drawing in the me-chanical design process, Computers and Graphics 14 (2) (1990) 263–274.
23
[2] R. H. McKim, Experiences in visual thinking, Brooks/Cole Pub. Co, Mon-terey, CA, 1972.
[3] L. P. Rieber, Using computer animated graphics in science instruction withchildren, Journal of Educational Psychology 82 (1) (1990) 135.
[4] B. Zhu, M. Iwata, R. Haraguchi, T. Ashihara, N. Umetani, T. Igarashi,K. Nakazawa, Sketch-based dynamic illustration of fluid systems, in: ACMTransactions on Graphics, Vol. 30, ACM, 2011, pp. 134:1–134:8.
[5] P. Dragicevic, A. Bezerianos, W. Javed, N. Elmqvist, J.-D. Fekete, Temporaldistortion for animated transitions, in: Proceedings of the ACM Conferenceon Human Factors in Computing Systems, Vancouver, BC, Canada, 2011,pp. 2009–2018.
[6] A. K. Jain, M. N. Murty, P. J. Flynn, Data clustering: A review, ACM Com-puting Surveys 31 (3) (1999) 264–323.
[7] B. Tversky, J. B. Morrison, M. Betrancourt, Animation: Can it facilitate?,International Journal of Human-Computer Studies 57 (4) (2002) 247–262.
[8] I. E. Sutherland, Sketch pad a man-machine graphical communication sys-tem, in: Proceedings of the SHARE Design Automation Workshop, ACM,1964, pp. 6.329–6.346.
[9] H. Taylor, B. Tversky, Descriptions and depictions of environments, Mem-ory and Cognition 20 (5) (1992) 483–496.
[10] B. Tversky, J. Zacks, P. U. Lee, J. Heiser, Lines, blobs, crosses and arrows:Diagrammatic communication with schematic figures, in: Proceedings of theInternational Conference on Theory and Application of Diagrams, SpringerBerlin Heidelberg, 2000, pp. 221–230.
[11] B. Tversky, What does drawing reveal about thinking?, in: J. S. Gero & B.Tversky (Eds.), Visual and Spatial Reasoning in Design, Sydney, Australia,1999, pp. 93–101.
[12] E. Taborda, S. K. Chandrasegaran, K. Ramani, ME 444: Redesigning a toydesign course, in: Proceedings of the International Symposium on Tools andMethods of Competitive Engineering, Karlsruhe, Germany, 2012, pp. 597–608.
24

[13] F. L. Mckoy, N. Vargas-Hernandez, J. D. Summers, J. J. Shah, Influence ofdesign representation on effectiveness of idea generation, in: Proceedings ofthe ASME Design Engineering Technical Conferences and Computers andInformation in Engineering Conference, Pittsburgh, PA, USA, 2001, pp. 1–10.
[14] S. Greenberg, S. Carpendale, N. Marquardt, B. Buxton, Sketching User Ex-periences: The Workbook, Morgan Kaufmann Publishers Inc., 2011.
[15] J. Dorsey, S. Xu, G. Smedresman, H. Rushmeier, L. McMillan, The mentalcanvas: A tool for conceptual architectural design and analysis, in: Proceed-ings of the IEEE Pacific Conference on Computer Graphics and Applica-tions, 2007, pp. 201–210.
[16] L. B. Kara, K. Shimada, Supporting early styling design of automobiles us-ing sketch-based 3D shape construction, Computer-Aided Design & Appli-cations 5 (6) (2008) 867—876.
[17] Q. Chen, J. Grundy, J. Hosking, An e-whiteboard application to support earlydesign-stage sketching of UML diagrams, in: Proceedings of the IEEE Sym-posium on Human Centric Computing Languages and Environments, 2003,pp. 219–226.
[18] T. Berlage, A selective undo mechanism for graphical user interfaces basedon command objects, ACM Transactions on Computer-Human Interaction1 (3) (1994) 269–294.
[19] J. Heer, J. D. Mackinlay, C. Stolte, M. Agrawala, Graphical histories forvisualization: Supporting analysis, communication, and evaluation, IEEETransactions on Visualization and Computer Graphics 14 (6) (2008) 1189–1196.
[20] D. Kurlander, S. Feiner, Editable graphical histories, in: Proceedings of theIEEE Workshop on Visual Language, New Orleans, Louisiana, USA, 1988,pp. 127–134.
[21] K.-L. Ma, Image graphs — A novel approach to visual data exploration,in: Proceedings of the IEEE Conference on Visualization, San Francisco,California, USA, 1999, pp. 81–88.
25

[22] M. Nancel, A. Cockburn, Causality: A conceptual model of interaction his-tory, in: Proceedings of the ACM Conference on Human Factors in Comput-ing Systems, Toronto, Ontario, Canada, 2014, pp. 1777–1786.
[23] G. Li, X. Cao, S. Paolantonio, F. Tian, SketchComm: A tool to support richand flexible asynchronous communication of early design, in: Proceedingsof the ACM Conference on Computer Supported Cooperative Work, Seattle,Washington, USA, 2012, pp. 359–368.
[24] G. Noris, D. Skora, A. Shamir, S. Coros, B. Whited, M. Simmons, A. Hor-nung, M. Gross, R. Sumner, Smart scribbles for sketch segmentation, Com-puter Graphics Forum 31 (2012) 2516–2527.
[25] H.-T. Chen, L.-Y. Wei, C.-F. Chang, Nonlinear revision control for images,ACM Transactions on Graphics 30 (2011) 105:1–105:10.
[26] C. Barnes, D. B. Goldman, E. Shechtman, A. Finkelstein, Video tapestrieswith continuous temporal zoom, ACM Transactions on Graphics 29 (2010)89:1–89:9.
[27] M. Ajmal, M. Ashraf, M. Shakir, Y. Abbas, F. Shah, Video summarization:Techniques and classification, in: Computer Vision and Graphics, Vol. 7594,Springer Berlin Heidelberg, 2012, pp. 1–13.
[28] R. Eccles, T. Kapler, R. Harper, W. Wright, Stories in geotime, InformationVisualization 7 (1) (2008) 3–17.
[29] B. B. Bederson, J. Grosjean, J. Meyer, Toolkit design for interactive struc-tured graphics, IEEE Transactions on Software Engineering 30 (8) (2004)535–546.
[30] R. C. Gonzales, R. E. Woods, Digital Image Processing, Pearson PrenticeHall, Upper Saddle River, NJ, 2008.
[31] R. Schmidt, T. Isenberg, P. Jepp, K. Singh, B. Wyvill, Sketching, scaffolding,and inking: A visual history for interactive 3D modeling, in: Proceedings ofthe ACM Symposium on Non-photorealistic Animation and Rendering, SanDiego, California, USA, 2007, pp. 23–32.
[32] B. chul Kwon, W. Javed, S. Ghani, N. Elmqvist, J. S. Yi, D. Ebert, Evaluat-ing the role of time in investigative analysis of document collections, IEEE
26

Transactions on Visualization and Computer Graphics 18 (11) (2012) 1992–2004.
[33] W. Javed, N. Elmqvist, ExPlates: Spatializing interactive analysis to scaffoldvisual exploration, Computer Graphics Forum 32 (2) (2013) 441–450.
[34] Z. Zhao, S. K. Badam, S. Chandrasegaran, D. G. Park, N. Elmqvist,L. Kisselburgh, K. Ramani, skWiki: A multimedia sketching system forcollaborative creativity, in: Proceedings of the ACM Conference on Hu-man Factors in Computing Systems, ACM, Toronto, ON, Canada, 2014, pp.1235–1244.
27