Skeletal Muscle Fiber-Type Specific Succinate ...
1
Skeletal Muscle Fiber-Type Specific Succinate Dehydrogenase Activity Is Not Reduced in Children with Cerebral Palsy Sudarshan Dayanidhi 1,4 , Andrew Zogby 2 , Henry G. Chambers 1,5 , Simon Schenk 1 , Richard L. Lieber 1,2,4 1 Department of Orthopaedic Surgery, 2 School of Medicine, 3 Department of Bioengineering, University of California, San Diego, CA 4 Rehabilitation Institute of Chicago, Chicago, IL 5 Deparment of Orthopedics, Rady Children’s Hospital, San Diego, CA INTRODUCTION • Children with cerebral palsy (CP) display increased energy expenditure and decreased physical activity 1,2,3 compared to children with typical development (TD). • Mitochondrial oxidative metabolism in skeletal muscle is critical during sustained movement. While recent studies report a reduced expression at the mRNA level of metabolism-related proteins, including SDH in children with CP 4,5 , no direct measurements of oxidative metabolism have been reported. • Succinate dehydrogenase (SDH) is a mitochondrial enzyme of the tricarboxylic acid (TCA) cycle and complex II of the electron transport chain. Oxidative capacity varies by fiber type (type1>type2A>type2X) and SDH activity is commonly analyzed as a marker of intrinsic oxidative capacity in skeletal muscle. • The goal of this study was to directly quantify fiber-type specific SDH activity to evaluate if there are differences between children with CP and TD. METHODS RESULTS Figure 1: Representative images of fiber- type specific oxidative metabolism. (A) Laminin labeling of basal lamina, (B) SDH staining of oxidative capacity after 10 minutes of incubation, (C) type 2A fibers (bright green), (D) type 1 fibers (bright red). ACKNOWLEDGEMENTS This work was supported by the Department of Veterans Affairs and NIH grants AR061303-01, HD048501, HD050837 and HD44822 to RLL. References 1. Johnston TE, Moore SE, Quinn LT, Smith BT (2004) Energy cost of walking in children with cerebral palsy: relation to the Gross Motor Function Classification System. Developmental Medicine and Child Neurology, 46, 34-38. 2. Koop J and Stout S (2004) Energy expenditure in cerebral palsy. In The Treatment of Gait Problems in Cerebral Palsy (Ed. Gage JR.) . Mac Keith Press. London, UK, 146-164. 3. Maher CA, Williams MT, Olds T, Lane AE. (2007) Physical and sedentary activity in adolescents with cerebral palsy. Developmental Medicine & Child Neurology, 49, 450-7. 4. Smith LR, Pontén E, Hedstrom Y, Ward SR, Chambers HG, Subramaniam S, Lieber, RL (2009). Novel transcriptional profile in wrist muscles from cerebral palsy patients. BMC Medical Genomics, 2,44. 5. Smith LR, Chambers HG, Subramaniam S, Lieber RL (2012). Transcriptional abnormalities of hamstring muscle contractures in children with cerebral palsy. PLoS ONE, 7, e40686. CONCLUSIONS • SDH activity in Type 1- and 2A skeletal muscle fibers is maintained in children with CP and Type 1 fibers have a higher activity compared to Type 2A fibers. • Type 1 and type 2A fibers in children with CP are nearly uniform in size, and the average fiber size is decreased in children with CP. • Further research that focuses on the functional capacity of mitochondria and other components of the electron transport chain in skeletal muscle of children with CP is needed. Figure 4: SDH activity in type 1 and type 2A fibers. The data are expressed as median optical density (OD)/min in both typically developing and cerebral palsy groups. Asterisks indicate significantly lower activity in type2A fibers compared to type 1 (p<0.05). • Semitendosus muscle biopsies were obtained from ten children (5/group, CP mean age=12.2±5.1, 3 male, TD mean age=15±0.7, 4 male) • Ethical approval provided by UCSD Human Research Protection Program and all subjects & parents consented. • 10µm cross-sections from flash frozen biopsies using a cryostat at -25°C • SDH activity (optical density (OD)/min) in cross-sections was measured histochemically as a marker of oxidative capacity (Figure 1). • Images were captured in real-time every 60 seconds for 10 minutes and optical density was calculated for muscle fibers at each time point (Figure 2). • Type 1 and Type 2A MHC isoforms and the basal lamina were identified by immunohistochemistry to determine fiber-type specific SDH activity (Figure 1, 2). • Myofiber area was measured based on immunolabeling of the basal lamina using Image J in all fibers in which SDH activity was measured (Figure 1). Figure 2: Representative plot demonstrating linear change in optical density over time, the slope of which reflects muscle fiber SDH activity. Calculation of SDH activity in this type 1 fiber, would be expressed by the difference in slope of “Background 1” and “type 1”. Figure 3: Myofiber areas in children with cerebral palsy (CP) and typical development (TD). (A) Pairwise change in myofiber area between type 1 and type 2A fibers. (B) Boxplots showing the distribution of the average myofiber areas across both type 1 and type 2A fibers for the TD and CP groups. RESULTS • Average myofiber areas were 45% smaller in CP vs. TD (2713±2567 μm 2 vs. 4975±1579 μm 2 ; p<0.05, Figure 3). In children with CP, type 2A and type 1 fiber sizes were not significantly different (2887±3070 um 2 vs. 2540±2308 um 2 ; p=0.37), whereas, in TD children, type 2A fibers were 32% larger than type 1 fibers (5666±1626 um 2 vs. 4284±1330 um 2 ; p<0.05, Figure 3). • SDH activity per unit area was ~35% lower in Type 2A compared to Type 1 fibers, but no differences were seen between children with CP and TD (Figure 4).
Transcript of Skeletal Muscle Fiber-Type Specific Succinate ...
Skeletal Muscle Fiber-Type Specific Succinate Dehydrogenase Activity Is Not Reduced in Children with Cerebral Palsy Sudarshan Dayanidhi1,4, Andrew Zogby2, Henry G. Chambers1,5, Simon Schenk1, Richard L. Lieber1,2,4
1Department of Orthopaedic Surgery, 2School of Medicine,3Department of Bioengineering, University of California, San Diego, CA 4Rehabilitation Institute of Chicago, Chicago, IL
5Deparment of Orthopedics, Rady Children’s Hospital, San Diego, CA
INTRODUCTION • Children with cerebral palsy (CP) display increased energy expenditure
and decreased physical activity 1,2,3 compared to children with typical development (TD).
• Mitochondrial oxidative metabolism in skeletal muscle is critical during sustained movement. While recent studies report a reduced expression at the mRNA level of metabolism-related proteins, including SDH in children with CP4,5, no direct measurements of oxidative metabolism have been reported.
• Succinate dehydrogenase (SDH) is a mitochondrial enzyme of the tricarboxylic acid (TCA) cycle and complex II of the electron transport chain. Oxidative capacity varies by fiber type (type1>type2A>type2X) and SDH activity is commonly analyzed as a marker of intrinsic oxidative capacity in skeletal muscle.
• The goal of this study was to directly quantify fiber-type specific SDH activity to evaluate if there are differences between children with CP and TD.
METHODS
RESULTS
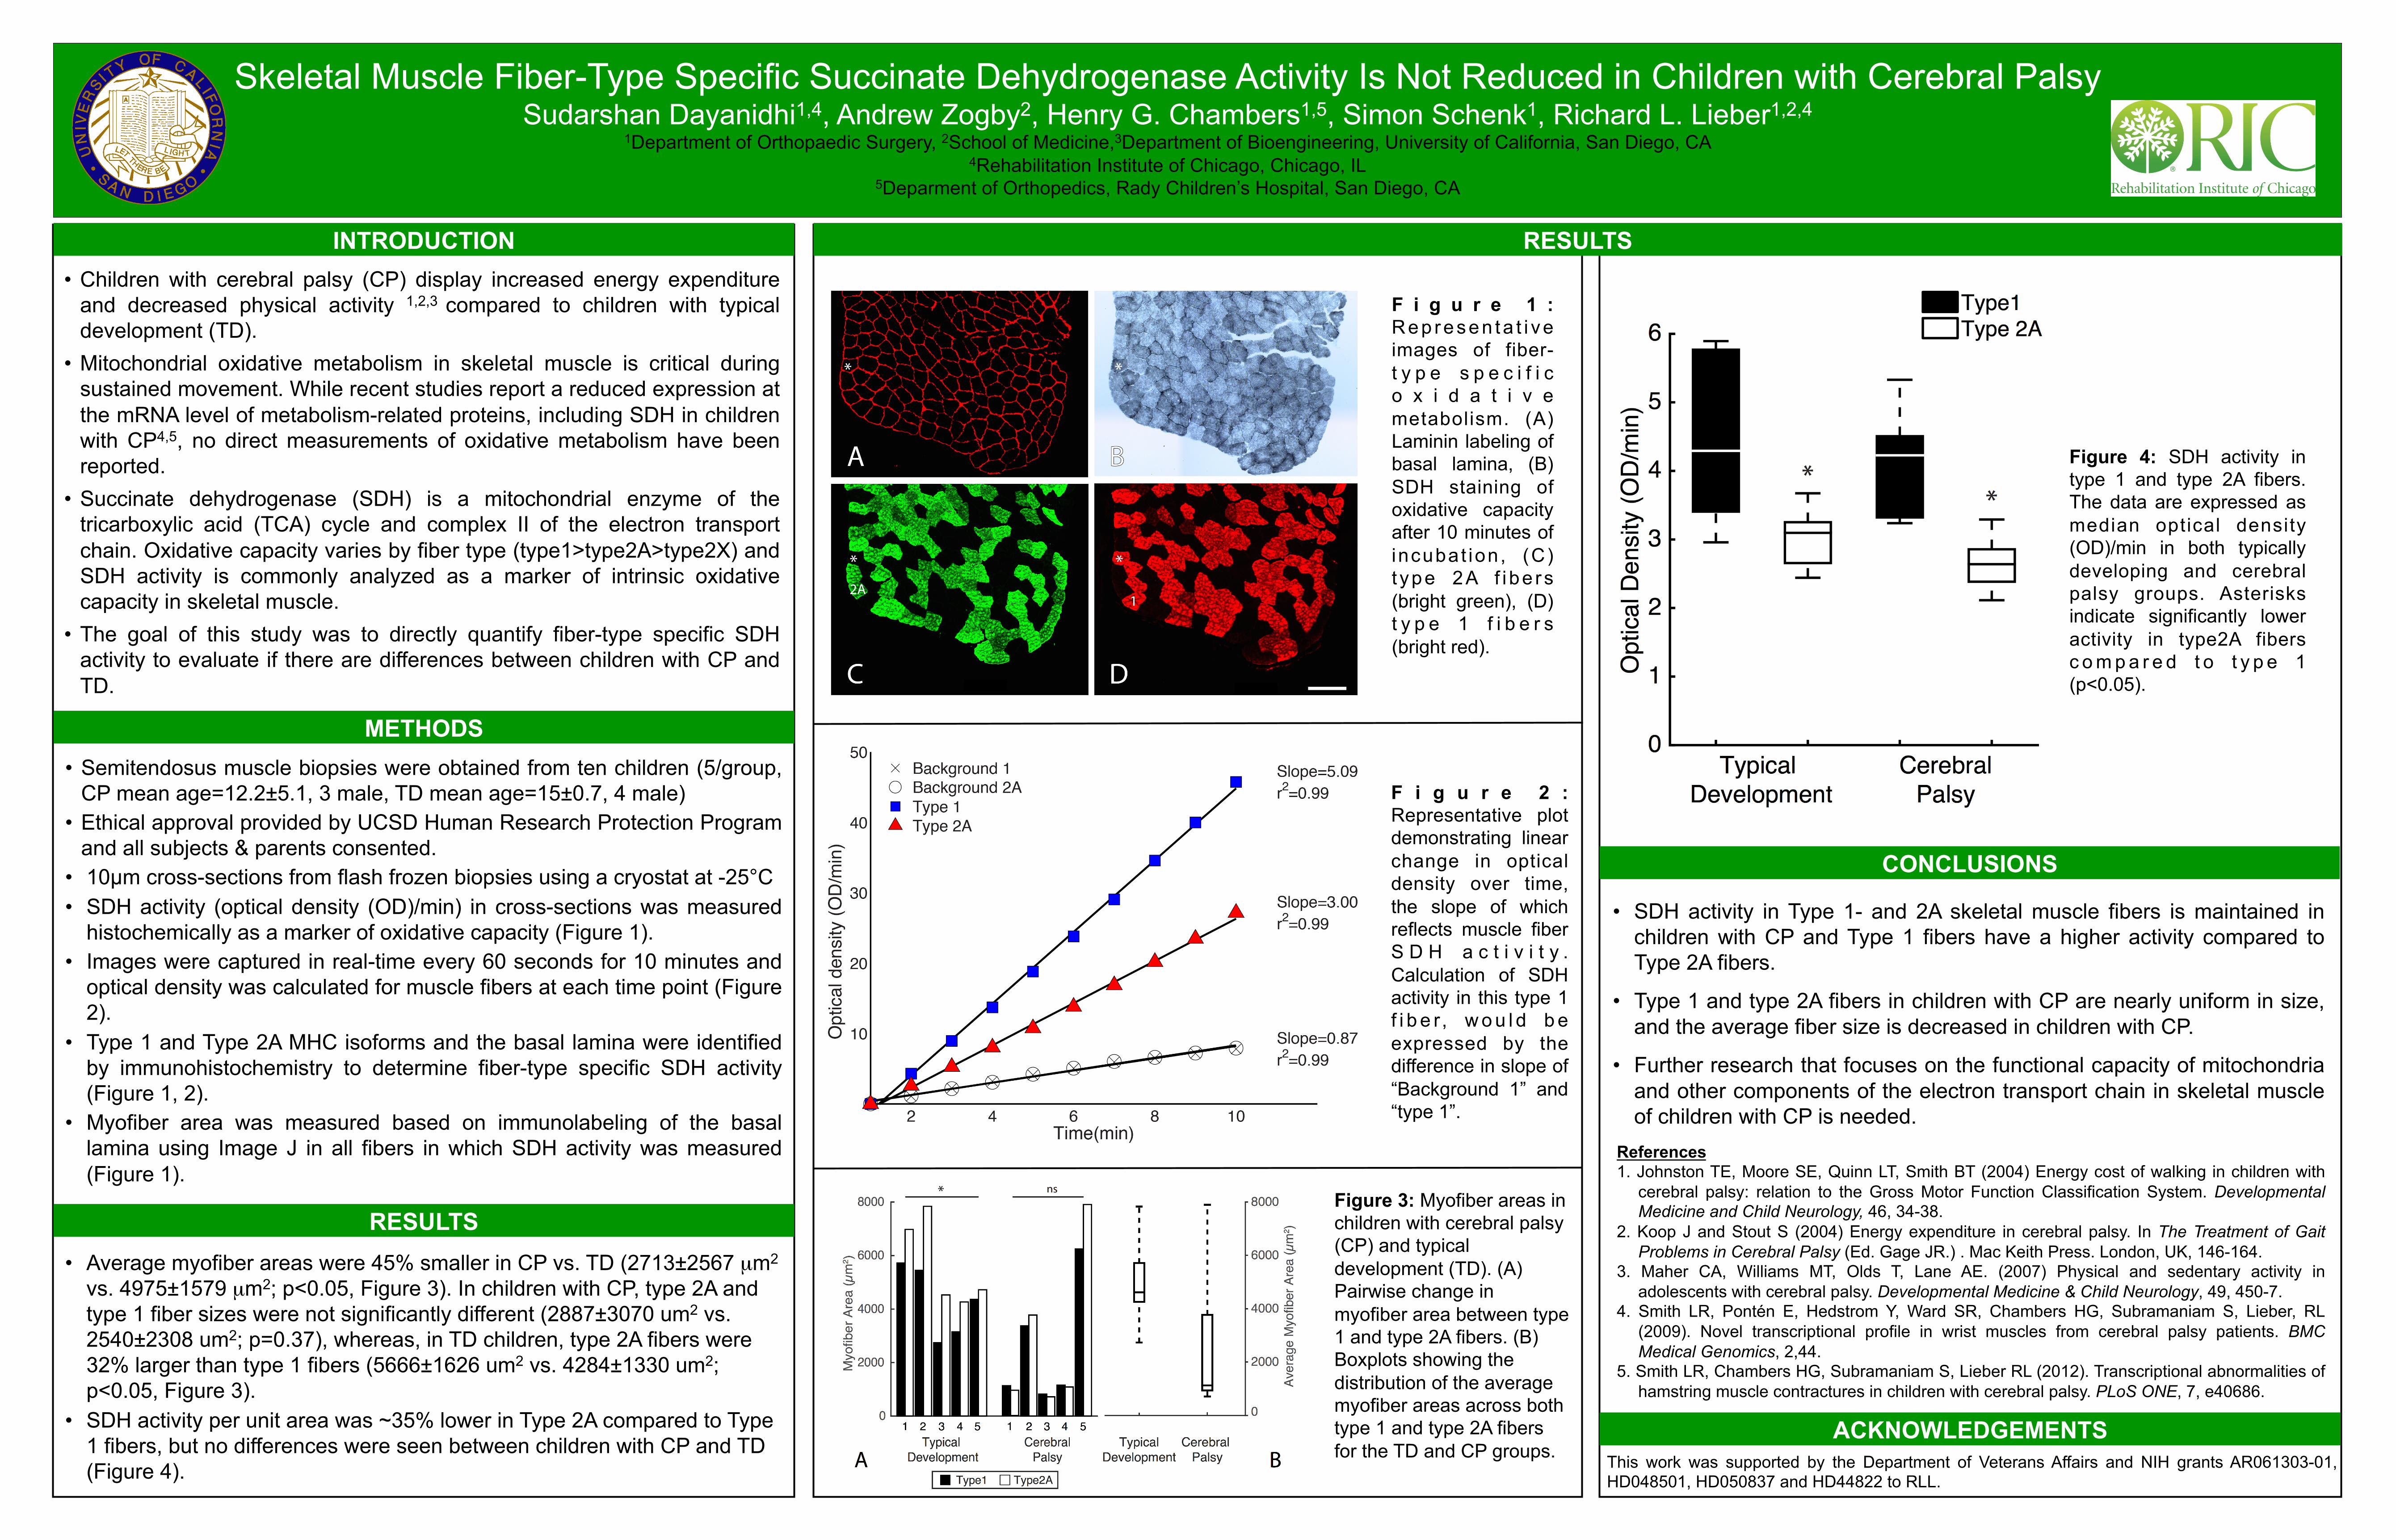
F i g u r e 1 : Rep resen ta t i ve images of fiber-t y p e s p e c i f i c o x i d a t i v e metabolism. (A) Laminin labeling of basal lamina, (B) SDH staining of oxidative capacity after 10 minutes of incubat ion, (C) t ype 2A f i be rs (bright green), (D) t y p e 1 f i b e r s (bright red).
ACKNOWLEDGEMENTS This work was supported by the Department of Veterans Affairs and NIH grants AR061303-01, HD048501, HD050837 and HD44822 to RLL.
References 1. Johnston TE, Moore SE, Quinn LT, Smith BT (2004) Energy cost of walking in children with
cerebral palsy: relation to the Gross Motor Function Classification System. Developmental Medicine and Child Neurology, 46, 34-38.
2. Koop J and Stout S (2004) Energy expenditure in cerebral palsy. In The Treatment of Gait Problems in Cerebral Palsy (Ed. Gage JR.) . Mac Keith Press. London, UK, 146-164.
3. Maher CA, Williams MT, Olds T, Lane AE. (2007) Physical and sedentary activity in adolescents with cerebral palsy. Developmental Medicine & Child Neurology, 49, 450-7.
4. Smith LR, Pontén E, Hedstrom Y, Ward SR, Chambers HG, Subramaniam S, Lieber, RL (2009). Novel transcriptional profile in wrist muscles from cerebral palsy patients. BMC Medical Genomics, 2,44.
5. Smith LR, Chambers HG, Subramaniam S, Lieber RL (2012). Transcriptional abnormalities of hamstring muscle contractures in children with cerebral palsy. PLoS ONE, 7, e40686.
CONCLUSIONS
• SDH activity in Type 1- and 2A skeletal muscle fibers is maintained in children with CP and Type 1 fibers have a higher activity compared to Type 2A fibers.
• Type 1 and type 2A fibers in children with CP are nearly uniform in size, and the average fiber size is decreased in children with CP.
• Further research that focuses on the functional capacity of mitochondria and other components of the electron transport chain in skeletal muscle of children with CP is needed.
Figure 4: SDH activity in type 1 and type 2A fibers. The data are expressed as median optical density (OD)/min in both typically developing and cerebral palsy groups. Asterisks indicate significantly lower activity in type2A fibers c o m p a r e d t o t y p e 1 (p<0.05).
• Semitendosus muscle biopsies were obtained from ten children (5/group, CP mean age=12.2±5.1, 3 male, TD mean age=15±0.7, 4 male)
• Ethical approval provided by UCSD Human Research Protection Program and all subjects & parents consented.
• 10µm cross-sections from flash frozen biopsies using a cryostat at -25°C • SDH activity (optical density (OD)/min) in cross-sections was measured
histochemically as a marker of oxidative capacity (Figure 1). • Images were captured in real-time every 60 seconds for 10 minutes and
optical density was calculated for muscle fibers at each time point (Figure 2).
• Type 1 and Type 2A MHC isoforms and the basal lamina were identified by immunohistochemistry to determine fiber-type specific SDH activity (Figure 1, 2).
• Myofiber area was measured based on immunolabeling of the basal lamina using Image J in all fibers in which SDH activity was measured (Figure 1).
F i g u r e 2 : Representative plot demonstrating linear change in optical density over time, the slope of which reflects muscle fiber S D H a c t i v i t y . Calculation of SDH activity in this type 1 f i b e r, w o u l d b e expressed by the difference in slope of “Background 1” and “type 1”.
Figure 3: Myofiber areas in children with cerebral palsy (CP) and typical development (TD). (A) Pairwise change in myofiber area between type 1 and type 2A fibers. (B) Boxplots showing the distribution of the average myofiber areas across both type 1 and type 2A fibers for the TD and CP groups.
RESULTS • Average myofiber areas were 45% smaller in CP vs. TD (2713±2567 µm2
vs. 4975±1579 µm2; p<0.05, Figure 3). In children with CP, type 2A and type 1 fiber sizes were not significantly different (2887±3070 um2 vs. 2540±2308 um2; p=0.37), whereas, in TD children, type 2A fibers were 32% larger than type 1 fibers (5666±1626 um2 vs. 4284±1330 um2; p<0.05, Figure 3).
• SDH activity per unit area was ~35% lower in Type 2A compared to Type 1 fibers, but no differences were seen between children with CP and TD (Figure 4).