SIZE EXCLUSION CHROMATOGRAPHY FOR BIOMOLECULE ANALYSIS · PDF fileSIZE EXCLUSION...
20
SIZE EXCLUSION CHROMATOGRAPHY FOR BIOMOLECULE ANALYSIS Agilent “How to” Guide for
-
Upload
phungquynh -
Category
Documents
-
view
237 -
download
3
Transcript of SIZE EXCLUSION CHROMATOGRAPHY FOR BIOMOLECULE ANALYSIS · PDF fileSIZE EXCLUSION...
SIZE EXCLUSION CHROMATOGRAPHY FOR BIOMOLECULE ANALYSIS
Agilent “How to” Guide for
2
A GUIDE TO SUCCESSFUL SECThe chromatographic separation of biomolecules based on their size in solution is known as size exclusion chromatography (SEC). Unlike other modes of chromatography, it relies on the absence of any interaction between the analyte and the stationary phase packed in the column. This provides an ideal solution for separating and analyzing intact proteins from contaminants that can include aggregates, excipients, cell debris, and other impurities arising from degradation. SEC is therefore widely used in both development and manufacture for biotherapeutic molecule characterization.
In this guide, we discuss SEC separations, the effect of solute size and molecular weight, column selection choices, important mobile phase considerations, general rules for using SEC, and more.
3
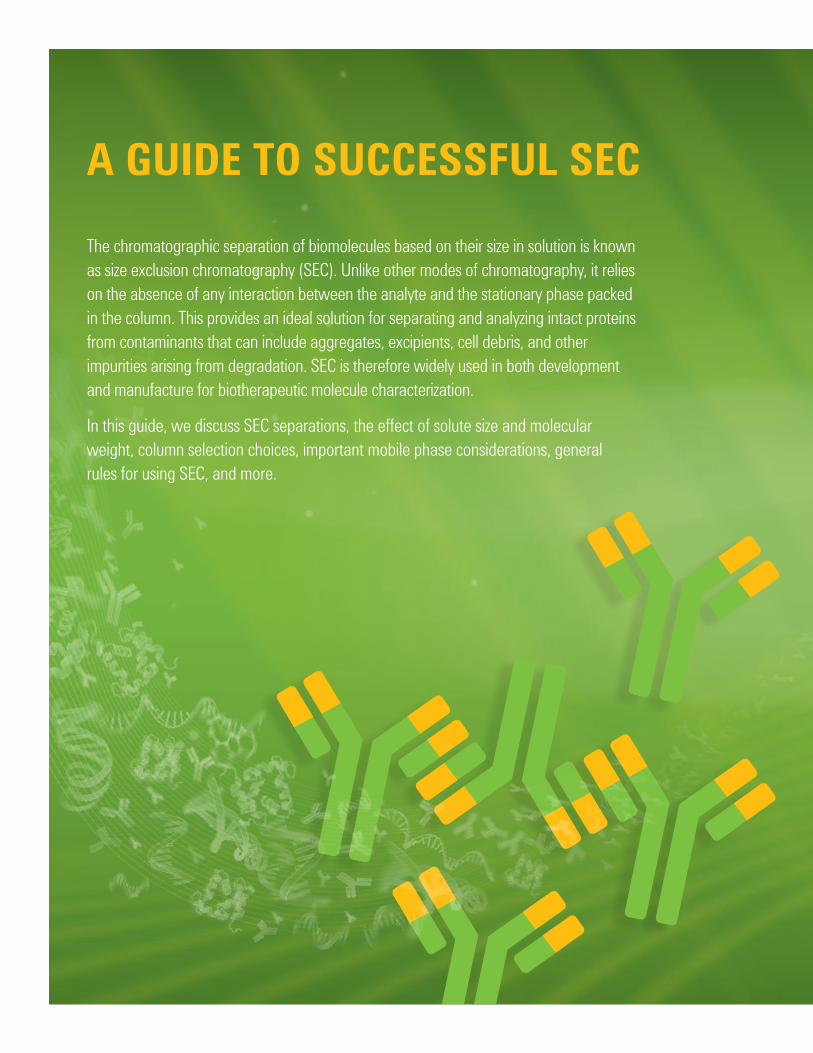
Figure 1: Molecules permeate the pores of the stationary phase to different extents depending on their size.
Smaller molecules spend longer in the pores and elute later
Larger molecules spend less time in the pores and elute sooner
With SEC, molecules are separated from largest to smallest in proportion to their molecular size in solution. Very large molecules are excluded from the packed bed and elute first, in the void volume. Smaller molecules will be able to penetrate the pores to various degrees depending on their size (Figure 1), with the smallest molecules diffusing furthest into the pore structure and eluting last.
SEPARATION IS STRAIGHTFORWARD AND UNCOMPLICATED
Learn more about Agilent biocolumns for SEC at www.agilent.com/chem/bioHPLC
4
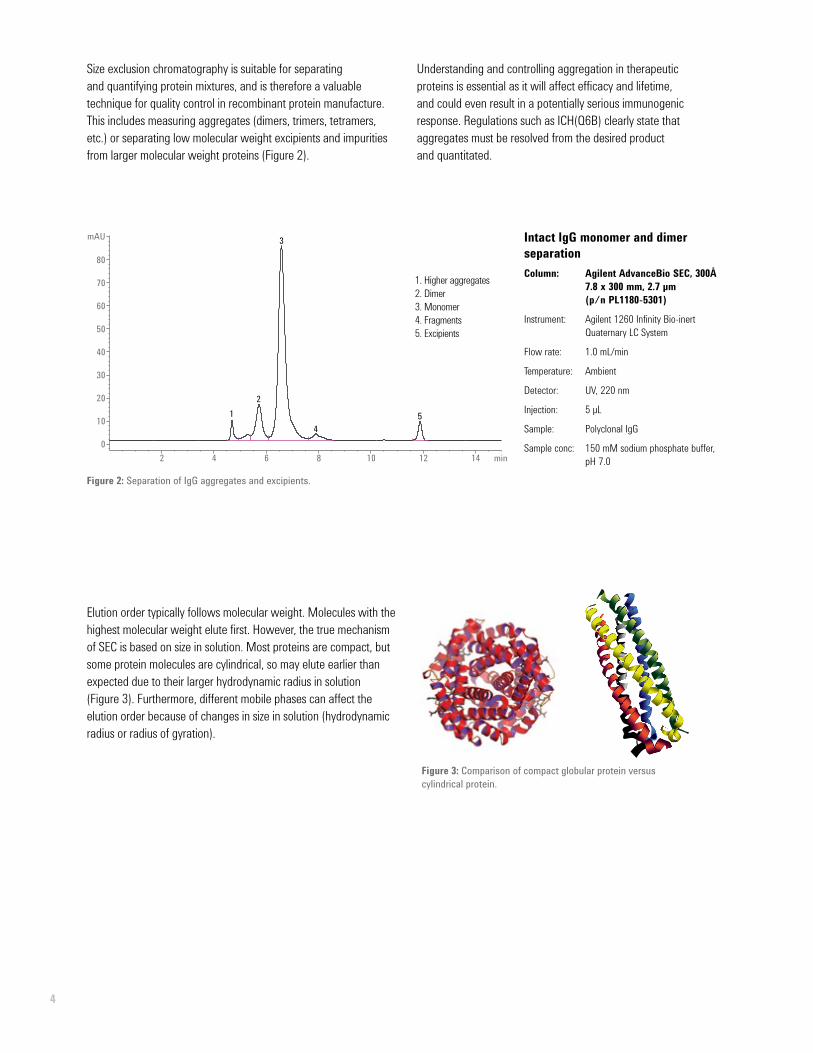
Size exclusion chromatography is suitable for separating and quantifying protein mixtures, and is therefore a valuable technique for quality control in recombinant protein manufacture. This includes measuring aggregates (dimers, trimers, tetramers, etc.) or separating low molecular weight excipients and impurities from larger molecular weight proteins (Figure 2).
Understanding and controlling aggregation in therapeutic proteins is essential as it will affect efficacy and lifetime, and could even result in a potentially serious immunogenic response. Regulations such as ICH(Q6B) clearly state that aggregates must be resolved from the desired product and quantitated.
Elution order typically follows molecular weight. Molecules with the highest molecular weight elute first. However, the true mechanism of SEC is based on size in solution. Most proteins are compact, but some protein molecules are cylindrical, so may elute earlier than expected due to their larger hydrodynamic radius in solution (Figure 3). Furthermore, different mobile phases can affect the elution order because of changes in size in solution (hydrodynamic radius or radius of gyration).
Figure 3: Comparison of compact globular protein versus cylindrical protein.
Figure 2: Separation of IgG aggregates and excipients.
Column: Agilent AdvanceBio SEC, 300Å 7.8 x 300 mm, 2.7 µm (p/n PL1180-5301)
Instrument: Agilent 1260 Infinity Bio-inert Quaternary LC System
Flow rate: 1.0 mL/min
Temperature: Ambient
Detector: UV, 220 nm
Injection: 5 µL
Sample: Polyclonal IgG
Sample conc: 150 mM sodium phosphate buffer, pH 7.0
Intact lgG monomer and dimer separation
min2 4 6 8 10 12 14
mAU
0
10
20
30
40
50
60
70
80
12
3
45
1. Higher aggregates2. Dimer3. Monomer4. Fragments5. Excipients
5
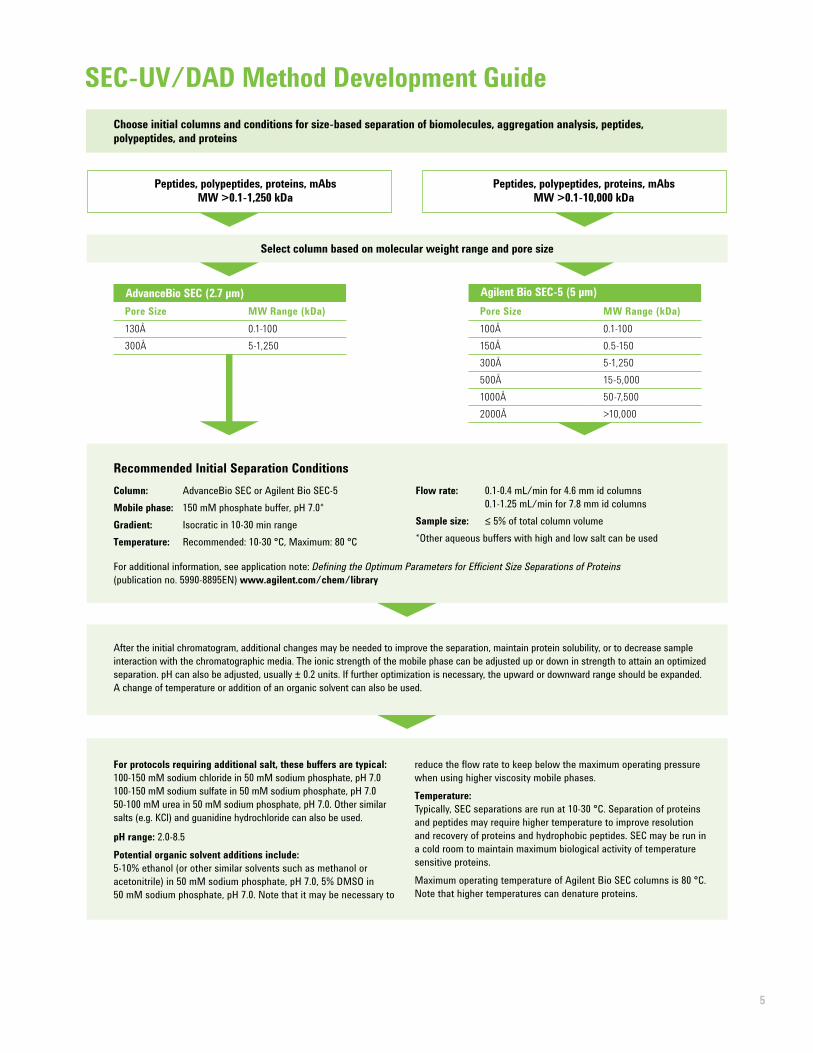
SEC-UV/DAD Method Development GuideChoose initial columns and conditions for size-based separation of biomolecules, aggregation analysis, peptides, polypeptides, and proteins
Peptides, polypeptides, proteins, mAbsMW >0.1-1,250 kDa
Select column based on molecular weight range and pore size
Peptides, polypeptides, proteins, mAbsMW >0.1-10,000 kDa
After the initial chromatogram, additional changes may be needed to improve the separation, maintain protein solubility, or to decrease sample interaction with the chromatographic media. The ionic strength of the mobile phase can be adjusted up or down in strength to attain an optimized separation. pH can also be adjusted, usually ± 0.2 units. If further optimization is necessary, the upward or downward range should be expanded. A change of temperature or addition of an organic solvent can also be used.
For protocols requiring additional salt, these buffers are typical:100-150 mM sodium chloride in 50 mM sodium phosphate, pH 7.0 100-150 mM sodium sulfate in 50 mM sodium phosphate, pH 7.050-100 mM urea in 50 mM sodium phosphate, pH 7.0. Other similar salts (e.g. KCl) and guanidine hydrochloride can also be used.
pH range: 2.0-8.5Potential organic solvent additions include:5-10% ethanol (or other similar solvents such as methanol or acetonitrile) in 50 mM sodium phosphate, pH 7.0, 5% DMSO in 50 mM sodium phosphate, pH 7.0. Note that it may be necessary to
Agilent Bio SEC-5 (5 µm)Pore Size MW Range (kDa)100Å 0.1-100150Å 0.5-150300Å 5-1,250500Å 15-5,0001000Å 50-7,5002000Å >10,000
AdvanceBio SEC (2.7 μm)Pore Size MW Range (kDa)130Å 0.1-100300Å 5-1,250
reduce the flow rate to keep below the maximum operating pressure when using higher viscosity mobile phases.Temperature:Typically, SEC separations are run at 10-30 °C. Separation of proteins and peptides may require higher temperature to improve resolution and recovery of proteins and hydrophobic peptides. SEC may be run in a cold room to maintain maximum biological activity of temperature sensitive proteins.Maximum operating temperature of Agilent Bio SEC columns is 80 °C. Note that higher temperatures can denature proteins.
Recommended Initial Separation Conditions
For additional information, see application note: Defining the Optimum Parameters for Efficient Size Separations of Proteins (publication no. 5990-8895EN) www.agilent.com/chem/library
Column: AdvanceBio SEC or Agilent Bio SEC-5Mobile phase: 150 mM phosphate buffer, pH 7.0*Gradient: Isocratic in 10-30 min rangeTemperature: Recommended: 10-30 °C, Maximum: 80 °C
Flow rate: 0.1-0.4 mL/min for 4.6 mm id columns 0.1-1.25 mL/min for 7.8 mm id columns
Sample size: ≤ 5% of total column volume*Other aqueous buffers with high and low salt can be used
6
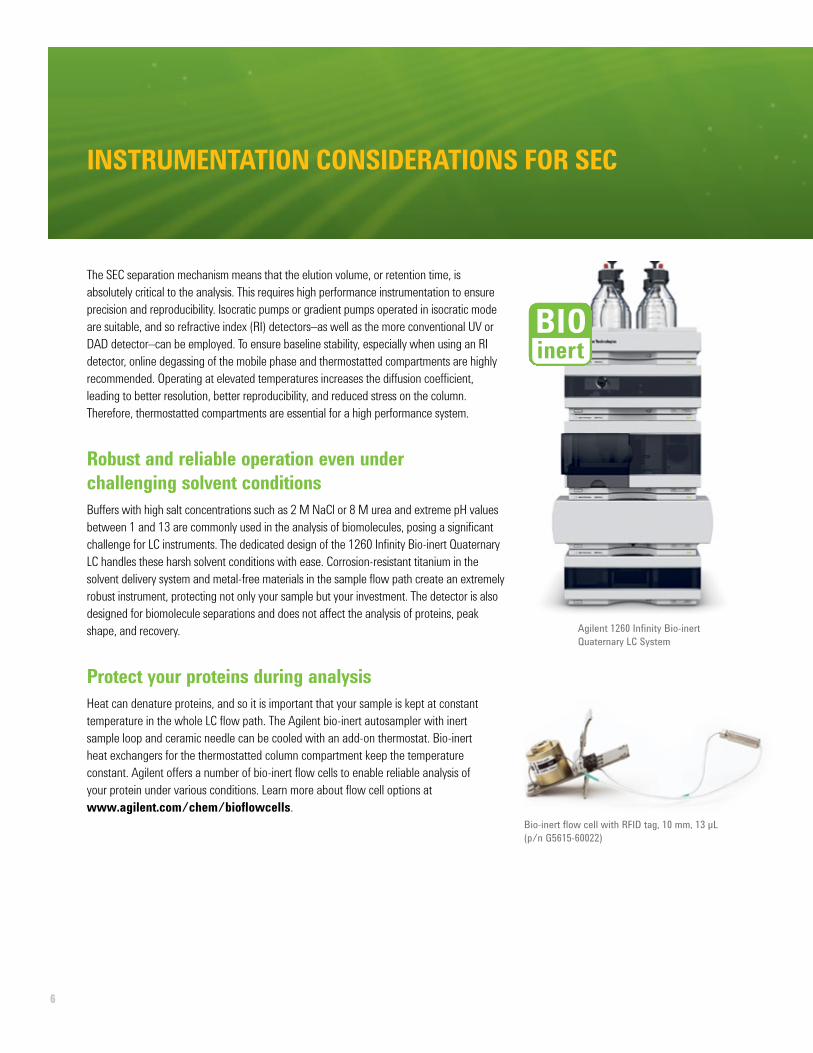
Agilent 1260 Infinity Bio-inert Quaternary LC System
The SEC separation mechanism means that the elution volume, or retention time, is absolutely critical to the analysis. This requires high performance instrumentation to ensure precision and reproducibility. Isocratic pumps or gradient pumps operated in isocratic mode are suitable, and so refractive index (RI) detectors–as well as the more conventional UV or DAD detector–can be employed. To ensure baseline stability, especially when using an RI detector, online degassing of the mobile phase and thermostatted compartments are highly recommended. Operating at elevated temperatures increases the diffusion coefficient, leading to better resolution, better reproducibility, and reduced stress on the column. Therefore, thermostatted compartments are essential for a high performance system.
Robust and reliable operation even under challenging solvent conditionsBuffers with high salt concentrations such as 2 M NaCl or 8 M urea and extreme pH values between 1 and 13 are commonly used in the analysis of biomolecules, posing a significant challenge for LC instruments. The dedicated design of the 1260 Infinity Bio-inert Quaternary LC handles these harsh solvent conditions with ease. Corrosion-resistant titanium in the solvent delivery system and metal-free materials in the sample flow path create an extremely robust instrument, protecting not only your sample but your investment. The detector is also designed for biomolecule separations and does not affect the analysis of proteins, peak shape, and recovery.
Protect your proteins during analysisHeat can denature proteins, and so it is important that your sample is kept at constant temperature in the whole LC flow path. The Agilent bio-inert autosampler with inert sample loop and ceramic needle can be cooled with an add-on thermostat. Bio-inert heat exchangers for the thermostatted column compartment keep the temperature constant. Agilent offers a number of bio-inert flow cells to enable reliable analysis of your protein under various conditions. Learn more about flow cell options at www.agilent.com/chem/bioflowcells.
INSTRUMENTATION CONSIDERATIONS FOR SEC
Bio-inert flow cell with RFID tag, 10 mm, 13 µL (p/n G5615-60022)
7
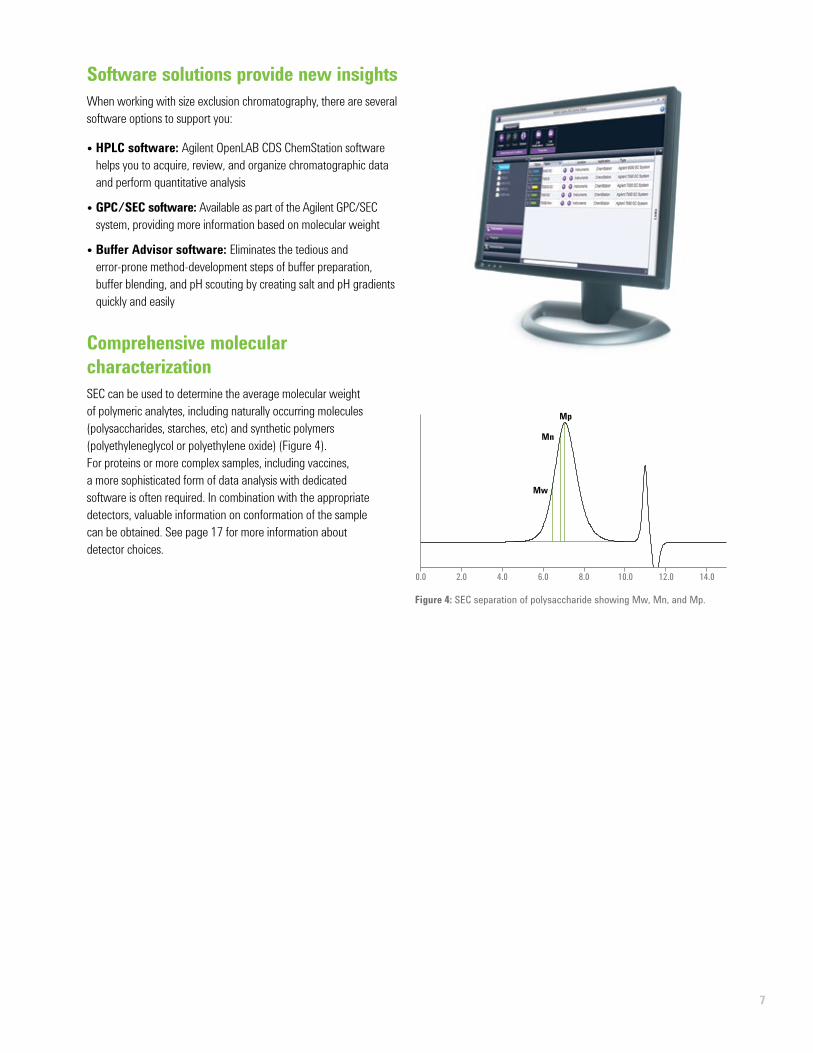
Figure 4: SEC separation of polysaccharide showing Mw, Mn, and Mp.
Software solutions provide new insightsWhen working with size exclusion chromatography, there are several software options to support you:
• HPLC software: Agilent OpenLAB CDS ChemStation software helps you to acquire, review, and organize chromatographic data and perform quantitative analysis
• GPC/SEC software: Available as part of the Agilent GPC/SEC system, providing more information based on molecular weight
• Buffer Advisor software: Eliminates the tedious and error-prone method-development steps of buffer preparation, buffer blending, and pH scouting by creating salt and pH gradients quickly and easily
Comprehensive molecular characterizationSEC can be used to determine the average molecular weight of polymeric analytes, including naturally occurring molecules (polysaccharides, starches, etc) and synthetic polymers (polyethyleneglycol or polyethylene oxide) (Figure 4). For proteins or more complex samples, including vaccines, a more sophisticated form of data analysis with dedicated software is often required. In combination with the appropriate detectors, valuable information on conformation of the sample can be obtained. See page 17 for more information about detector choices.
0.0 2.0 4.0 6.0 8.0 10.0 12.0 14.0
Mp
Mn
Mw
8
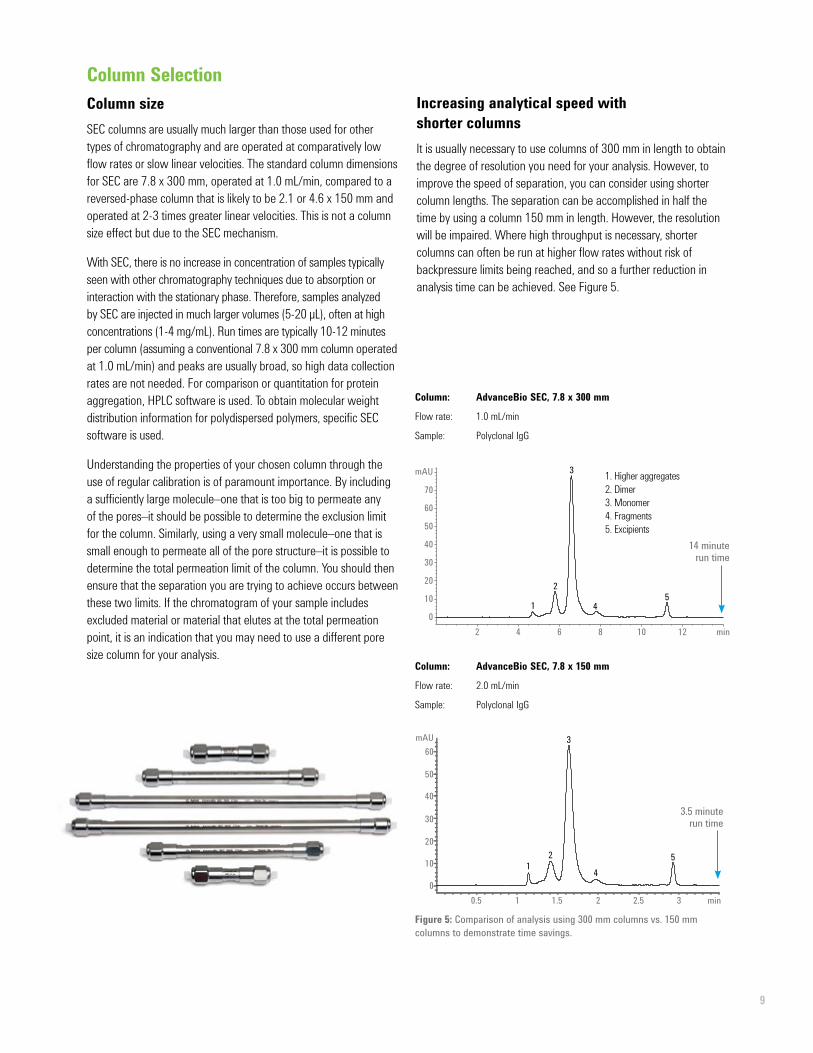
Captiva low protein binding filtersRegardless of what sample prep you are performing, it is a good idea to filter your sample with a low protein binding filter.
Agilent PES filters provide superior and consistent low protein binding for protein-related filtration. PES filter membranes are a better option than PVDF membranes for most LC analyses. Agilent PES has similar compatibility to PVDF filters for common LC solvents and is superior in terms of protein binding and cleanliness. Learn more at www.agilent.com/chem/filtration
COMPONENTS OF SIZE EXCLUSION CHARACTERIZATION
Sample PreparationSample preparation for size exclusion chromatography is similar to that for any protein analysis for HPLC methods. The most important aspect is that the sample must be soluble in the eluent and should ideally be dissolved in the mobile phase itself. Because of the larger column dimensions and low linear velocity as a result of relatively slow flow rates compared with other forms of HPLC (see “Column size”, below), sample concentrations and injection volumes may need to be larger than normal. To protect the column from possible damage, we recommend that samples be filtered or centrifuged before use to remove particulates. However, filtration should not be used to address poor sample solubility–an alternative eluent may need to be found.
For effective sample preparation, it is also important to ensure that the methods used to dissolve the sample do not change the properties of the sample itself. Some proteins may aggregate (forming dimers and higher molecular weight multimers) or dissociate (forming lower molecular weight sub-units) under stress conditions. These may include freeze-thaw cycles, extremes of temperature, sonication, or even concentration. See the method development guide on page 5 for more information.
Captiva PES Filters
Diameter (mm) Pore Size (µm) Certification Housing Part Number4 0.45 LC Polypropylene 5190-5095
4 0.2 LC/MS Polypropylene 5190-5094
15 0.2 LC/MS Polypropylene 5190-5096
15 0.45 LC Polypropylene 5190-5097
25 0.2 LC/MS Polypropylene 5190-5098
25 0.45 LC Polypropylene 5190-5099
9
Column SelectionColumn sizeSEC columns are usually much larger than those used for other types of chromatography and are operated at comparatively low flow rates or slow linear velocities. The standard column dimensions for SEC are 7.8 x 300 mm, operated at 1.0 mL/min, compared to a reversed-phase column that is likely to be 2.1 or 4.6 x 150 mm and operated at 2-3 times greater linear velocities. This is not a column size effect but due to the SEC mechanism.
With SEC, there is no increase in concentration of samples typically seen with other chromatography techniques due to absorption or interaction with the stationary phase. Therefore, samples analyzed by SEC are injected in much larger volumes (5-20 µL), often at high concentrations (1-4 mg/mL). Run times are typically 10-12 minutes per column (assuming a conventional 7.8 x 300 mm column operated at 1.0 mL/min) and peaks are usually broad, so high data collection rates are not needed. For comparison or quantitation for protein aggregation, HPLC software is used. To obtain molecular weight distribution information for polydispersed polymers, specific SEC software is used.
Understanding the properties of your chosen column through the use of regular calibration is of paramount importance. By including a sufficiently large molecule–one that is too big to permeate any of the pores–it should be possible to determine the exclusion limit for the column. Similarly, using a very small molecule–one that is small enough to permeate all of the pore structure–it is possible to determine the total permeation limit of the column. You should then ensure that the separation you are trying to achieve occurs between these two limits. If the chromatogram of your sample includes excluded material or material that elutes at the total permeation point, it is an indication that you may need to use a different pore size column for your analysis.
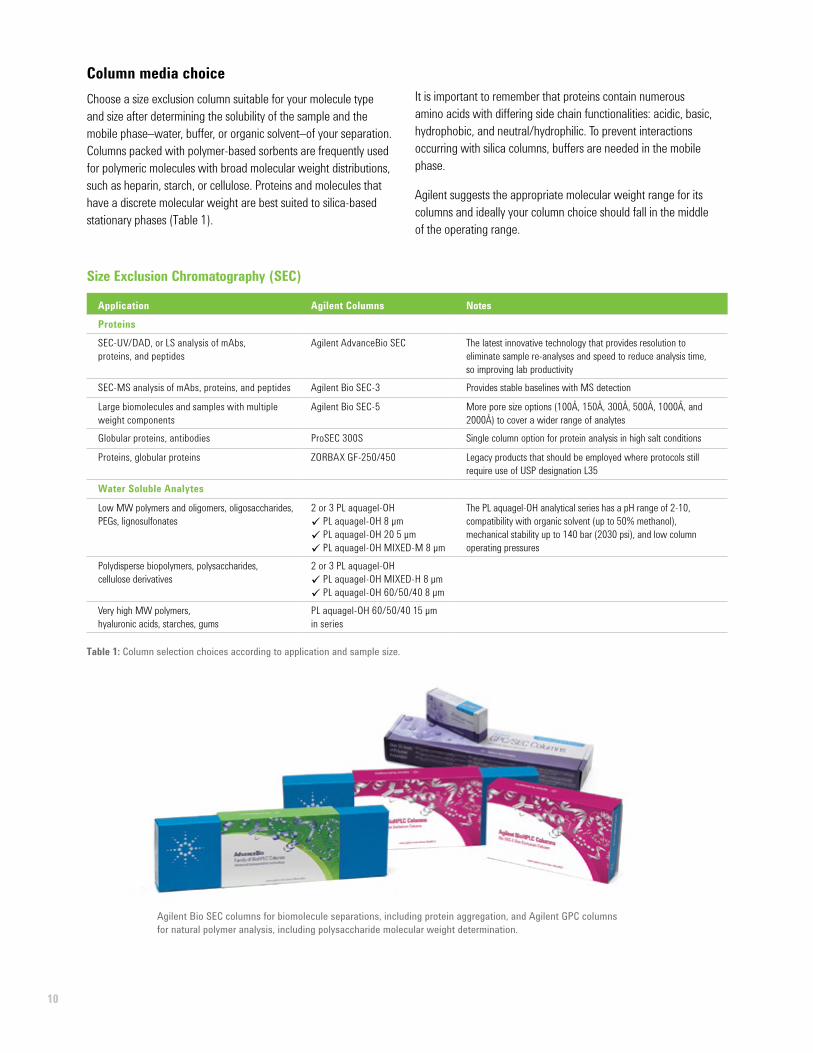
Increasing analytical speed with shorter columnsIt is usually necessary to use columns of 300 mm in length to obtain the degree of resolution you need for your analysis. However, to improve the speed of separation, you can consider using shorter column lengths. The separation can be accomplished in half the time by using a column 150 mm in length. However, the resolution will be impaired. Where high throughput is necessary, shorter columns can often be run at higher flow rates without risk of backpressure limits being reached, and so a further reduction in analysis time can be achieved. See Figure 5.
Figure 5: Comparison of analysis using 300 mm columns vs. 150 mm columns to demonstrate time savings.
min2 4 6 8 10 12
mAU
0
10
20
30
40
50
60
70
2
3
45
1
min0.5 1 1.5 2 2.5 3
mAU
0
10
20
30
40
50
60
2
3
45
1
Column: AdvanceBio SEC, 7.8 x 300 mm
Flow rate: 1.0 mL/min
Sample: Polyclonal IgG
Column: AdvanceBio SEC, 7.8 x 150 mm
Flow rate: 2.0 mL/min
Sample: Polyclonal IgG
14 minute run time
1. Higher aggregates2. Dimer3. Monomer4. Fragments5. Excipients
3.5 minute run time
10
Column media choiceChoose a size exclusion column suitable for your molecule type and size after determining the solubility of the sample and the mobile phase–water, buffer, or organic solvent–of your separation. Columns packed with polymer-based sorbents are frequently used for polymeric molecules with broad molecular weight distributions, such as heparin, starch, or cellulose. Proteins and molecules that have a discrete molecular weight are best suited to silica-based stationary phases (Table 1).
Table 1: Column selection choices according to application and sample size.
Agilent Bio SEC columns for biomolecule separations, including protein aggregation, and Agilent GPC columns for natural polymer analysis, including polysaccharide molecular weight determination.
It is important to remember that proteins contain numerous amino acids with differing side chain functionalities: acidic, basic, hydrophobic, and neutral/hydrophilic. To prevent interactions occurring with silica columns, buffers are needed in the mobile phase.
Agilent suggests the appropriate molecular weight range for its columns and ideally your column choice should fall in the middle of the operating range.
Size Exclusion Chromatography (SEC)
Application Agilent Columns NotesProteinsSEC-UV/DAD, or LS analysis of mAbs, proteins, and peptides
Agilent AdvanceBio SEC The latest innovative technology that provides resolution to eliminate sample re-analyses and speed to reduce analysis time, so improving lab productivity
SEC-MS analysis of mAbs, proteins, and peptides Agilent Bio SEC-3 Provides stable baselines with MS detection
Large biomolecules and samples with multiple weight components
Agilent Bio SEC-5 More pore size options (100Å, 150Å, 300Å, 500Å, 1000Å, and 2000Å) to cover a wider range of analytes
Globular proteins, antibodies ProSEC 300S Single column option for protein analysis in high salt conditions
Proteins, globular proteins ZORBAX GF-250/450 Legacy products that should be employed where protocols still require use of USP designation L35
Water Soluble Analytes
Low MW polymers and oligomers, oligosaccharides, PEGs, lignosulfonates
2 or 3 PL aquagel-OH ü PL aquagel-OH 8 µmü PL aquagel-OH 20 5 µmü PL aquagel-OH MIXED-M 8 µm
The PL aquagel-OH analytical series has a pH range of 2-10, compatibility with organic solvent (up to 50% methanol), mechanical stability up to 140 bar (2030 psi), and low column operating pressures
Polydisperse biopolymers, polysaccharides, cellulose derivatives
2 or 3 PL aquagel-OH ü PL aquagel-OH MIXED-H 8 µmü PL aquagel-OH 60/50/40 8 µm
Very high MW polymers, hyaluronic acids, starches, gums
PL aquagel-OH 60/50/40 15 µm in series
11
min
1
2, 3
4 5
mAU
2 4 6 8 10 12 140
20
40
60
80
100
1 2
3
4 5
2 4 6 8 10 12 14 min
mAU
0
10
20
30
40
50
60
70
min
mAU
2 4 6 8 10 12 140
100
200
300
400
500
600 1
2 3 4
5
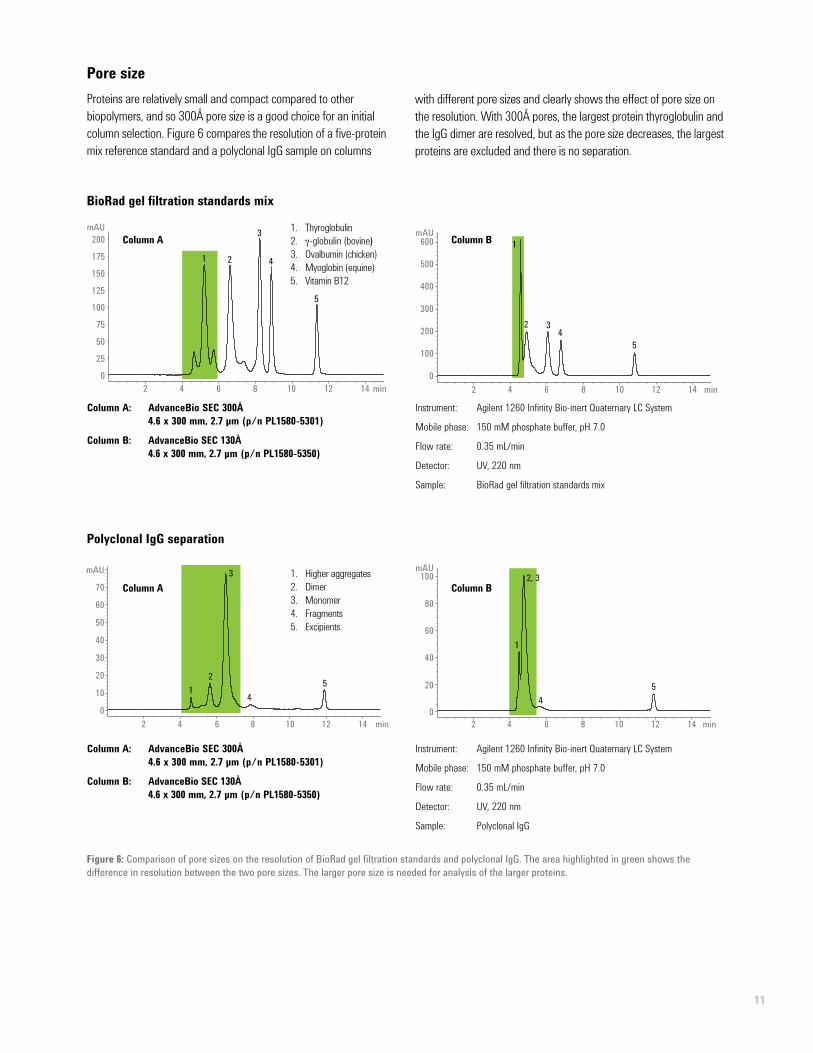
Pore sizeProteins are relatively small and compact compared to other biopolymers, and so 300Å pore size is a good choice for an initial column selection. Figure 6 compares the resolution of a five-protein mix reference standard and a polyclonal IgG sample on columns
BioRad gel filtration standards mix
Figure 6: Comparison of pore sizes on the resolution of BioRad gel filtration standards and polyclonal IgG. The area highlighted in green shows the difference in resolution between the two pore sizes. The larger pore size is needed for analysis of the larger proteins.
with different pore sizes and clearly shows the effect of pore size on the resolution. With 300Å pores, the largest protein thyroglobulin and the IgG dimer are resolved, but as the pore size decreases, the largest proteins are excluded and there is no separation.
1. Higher aggregates 2. Dimer 3. Monomer 4. Fragments 5. Excipients
min2 4 6 8 10 12 14
mAU
0
25
50
75
100
125
150
175
200
1 2 4
5
3
Column A: AdvanceBio SEC 300Å 4.6 x 300 mm, 2.7 µm (p/n PL1580-5301)
Column B: AdvanceBio SEC 130Å 4.6 x 300 mm, 2.7 µm (p/n PL1580-5350)
Column A: AdvanceBio SEC 300Å 4.6 x 300 mm, 2.7 µm (p/n PL1580-5301)
Column B: AdvanceBio SEC 130Å 4.6 x 300 mm, 2.7 µm (p/n PL1580-5350)
Instrument: Agilent 1260 Infinity Bio-inert Quaternary LC System
Mobile phase: 150 mM phosphate buffer, pH 7.0
Flow rate: 0.35 mL/min
Detector: UV, 220 nm
Sample: BioRad gel filtration standards mix
Instrument: Agilent 1260 Infinity Bio-inert Quaternary LC System
Mobile phase: 150 mM phosphate buffer, pH 7.0
Flow rate: 0.35 mL/min
Detector: UV, 220 nm
Sample: Polyclonal IgG
Polyclonal IgG separation
1. Thyroglobulin 2. g-globulin (bovine) 3. Ovalbumin (chicken) 4. Myoglobin (equine) 5. Vitamin B12
Column BColumn A
Column BColumn A
12
4,000
mAU
3,000
2,000
1,000
02 4 6 8 10 min
100
1,000
10,000
100,000
1,000,000
4 5 6 7 8 9 10 11 12 13
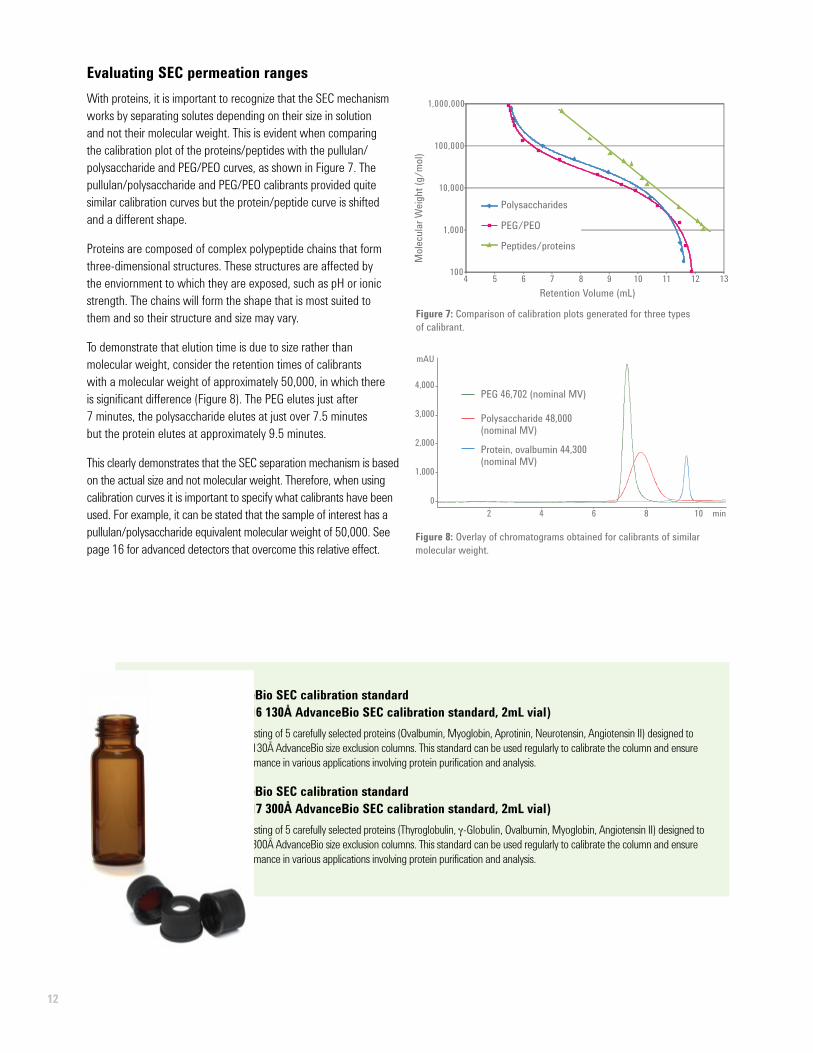
Evaluating SEC permeation rangesWith proteins, it is important to recognize that the SEC mechanism works by separating solutes depending on their size in solution and not their molecular weight. This is evident when comparing the calibration plot of the proteins/peptides with the pullulan/ polysaccharide and PEG/PEO curves, as shown in Figure 7. The pullulan/polysaccharide and PEG/PEO calibrants provided quite similar calibration curves but the protein/peptide curve is shifted and a different shape.
Proteins are composed of complex polypeptide chains that form three-dimensional structures. These structures are affected by the enviornment to which they are exposed, such as pH or ionic strength. The chains will form the shape that is most suited to them and so their structure and size may vary.
To demonstrate that elution time is due to size rather than molecular weight, consider the retention times of calibrants with a molecular weight of approximately 50,000, in which there is significant difference (Figure 8). The PEG elutes just after 7 minutes, the polysaccharide elutes at just over 7.5 minutes but the protein elutes at approximately 9.5 minutes.
This clearly demonstrates that the SEC separation mechanism is based on the actual size and not molecular weight. Therefore, when using calibration curves it is important to specify what calibrants have been used. For example, it can be stated that the sample of interest has a pullulan/polysaccharide equivalent molecular weight of 50,000. See page 16 for advanced detectors that overcome this relative effect.
Figure 7: Comparison of calibration plots generated for three types of calibrant.
Figure 8: Overlay of chromatograms obtained for calibrants of similar molecular weight.
Peptides/proteins
PEG/PEO
Polysaccharides
Mol
ecul
ar W
eight
(g/m
ol)
Retention Volume (mL)
Protein, ovalbumin 44,300 (nominal MV)
Polysaccharide 48,000 (nominal MV)
PEG 46,702 (nominal MV)
130Å AdvanceBio SEC calibration standard (p/n 5190-9416 130Å AdvanceBio SEC calibration standard, 2mL vial)A protein mix consisting of 5 carefully selected proteins (Ovalbumin, Myoglobin, Aprotinin, Neurotensin, Angiotensin II) designed to calibrate Agilent’s 130Å AdvanceBio size exclusion columns. This standard can be used regularly to calibrate the column and ensure ideal system performance in various applications involving protein purification and analysis.
300Å AdvanceBio SEC calibration standard (p/n 5190-9417 300Å AdvanceBio SEC calibration standard, 2mL vial)A protein mix consisting of 5 carefully selected proteins (Thyroglobulin, g-Globulin, Ovalbumin, Myoglobin, Angiotensin II) designed to calibrate Agilent’s 300Å AdvanceBio size exclusion columns. This standard can be used regularly to calibrate the column and ensure ideal system performance in various applications involving protein purification and analysis.
13
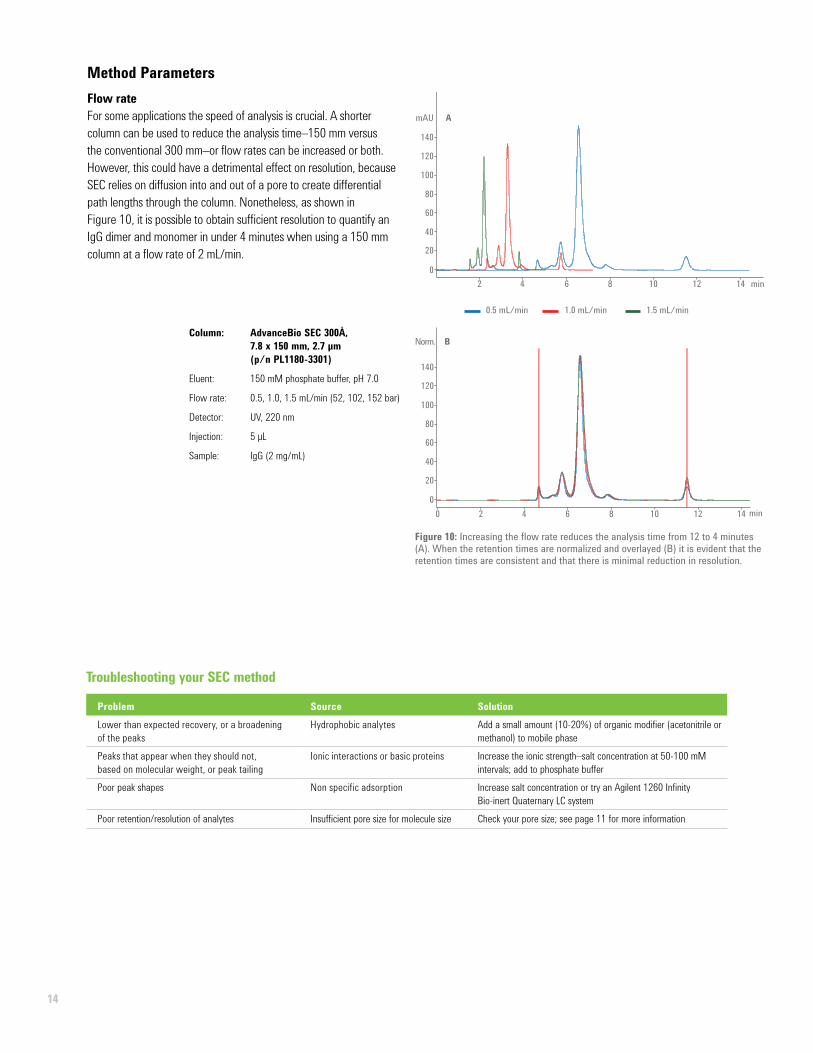
Particle sizeParticle size is also an important consideration in column selection. Smaller particle sizes provide more efficient separation, but at the risk of degrading (shearing/deforming) the protein. Figure 9 shows a comparison between Agilent 3 µm Bio SEC-3 and 5 µm Bio SEC-5 columns. There is a greater risk of higher backpressure and columns
Comparison between Agilent Bio SEC-3 and Agilent Bio SEC-5
0 2 4 6
12 3
1 2
3
8 10 12 14 min
0
20
80
100
120
mAU
16 18
40
60
1. Dimer2. Monomer3. Monomer fragment
3 µm
5 µm
Column diameterColumn diameter can also be important depending on the amount of sample. If only limited amounts of material are available, 4.6 mm id columns (operated at 0.35 mL/min) are useful. But it is important to minimize system volumes when using the smaller id columns to prevent excessive dispersion and loss of resolution.
SEC is considered to be a non denaturing technique when aqueous eluents are used, and so it is extremely useful for fractionation of complex samples or isolation of a sample component for further analysis. Larger diameter columns, such as 21.2 mm as found in the Agilent SEC-3 and SEC-5 product range, mean that lab prep separations can be performed using analytical HPLC systems.
Figure 9: Comparison of Agilent Bio SEC-3 versus Agilent Bio SEC-5 columns. The 3 µm column gives better separation.
Calculate Rs Factors
Agilent AdvanceBio SEC columns 7.8 x 300 mm and 4.6 x 300 mm
becoming blocked if samples and eluents are not prepared carefully. Filtration is recommended to remove insoluble matter and debris. The use of a guard column or in line filter can also extend column lifetime.
Analysis of monoclonal antibody
Column: Bio SEC-3, 300Å 7.8 x 300 mm, 3 µm (p/n 5190-2511)
Column: Bio SEC-5, 300Å 7.8 x 300 mm, 5 µm (p/n 5190-2526)
Instrument: Agilent 1260 Infinity Bio-inert Quaternary LC System
Mobile phase: 150 mM sodium phosphate, pH 7
Flow rate: 1 mL/min
Detector: UV, 220 nm
Sample: Humanized monoclonal antibody
14
Troubleshooting your SEC method
Problem Source SolutionLower than expected recovery, or a broadening of the peaks
Hydrophobic analytes Add a small amount (10-20%) of organic modifier (acetonitrile or methanol) to mobile phase
Peaks that appear when they should not, based on molecular weight, or peak tailing
Ionic interactions or basic proteins Increase the ionic strength–salt concentration at 50-100 mM intervals; add to phosphate buffer
Poor peak shapes Non specific adsorption Increase salt concentration or try an Agilent 1260 Infinity Bio-inert Quaternary LC system
Poor retention/resolution of analytes Insufficient pore size for molecule size Check your pore size; see page 11 for more information
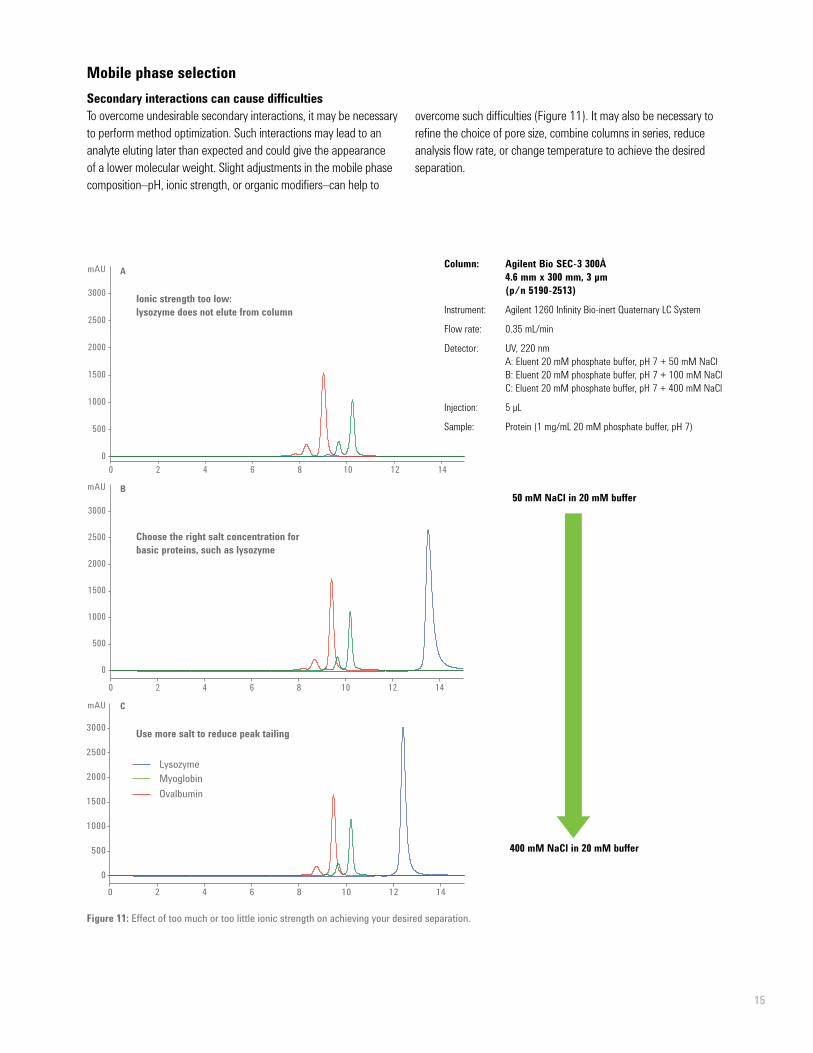
Method ParametersFlow rateFor some applications the speed of analysis is crucial. A shorter column can be used to reduce the analysis time–150 mm versus the conventional 300 mm–or flow rates can be increased or both. However, this could have a detrimental effect on resolution, because SEC relies on diffusion into and out of a pore to create differential path lengths through the column. Nonetheless, as shown in Figure 10, it is possible to obtain sufficient resolution to quantify an IgG dimer and monomer in under 4 minutes when using a 150 mm column at a flow rate of 2 mL/min.
Column: AdvanceBio SEC 300Å, 7.8 x 150 mm, 2.7 µm (p/n PL1180-3301)
Eluent: 150 mM phosphate buffer, pH 7.0
Flow rate: 0.5, 1.0, 1.5 mL/min (52, 102, 152 bar)
Detector: UV, 220 nm
Injection: 5 µL
Sample: IgG (2 mg/mL)
80
100
120
140
mAU
60
40
20
02 4 6 8 10 12 14 min
0.5 mL/min 1.0 mL/min 1.5 mL/min
A
80
100
120
140
Norm.
60
40
20
020 4 6 8 10 12 14 min
B
Figure 10: Increasing the flow rate reduces the analysis time from 12 to 4 minutes (A). When the retention times are normalized and overlayed (B) it is evident that the retention times are consistent and that there is minimal reduction in resolution.
150 2 4 6 8 10 12 14
0
500
1000
1500
2000
2500
3000
0 2 4 6 8 10 12 14
0
500
1000
1500
2000
2500
3000
0 2 4 6 8 10 12 140
500
1000
1500
2000
2500
3000
mAU A
B
C
mAU
mAU
0 2 4 6 8 10 12 14
0
500
1000
1500
2000
2500
3000
0 2 4 6 8 10 12 14
0
500
1000
1500
2000
2500
3000
0 2 4 6 8 10 12 140
500
1000
1500
2000
2500
3000
mAU A
B
C
mAU
mAU
Mobile phase selectionSecondary interactions can cause difficultiesTo overcome undesirable secondary interactions, it may be necessary to perform method optimization. Such interactions may lead to an analyte eluting later than expected and could give the appearance of a lower molecular weight. Slight adjustments in the mobile phase composition–pH, ionic strength, or organic modifiers–can help to
Ionic strength too low: lysozyme does not elute from column
Ovalbumin
LysozymeMyoglobin
50 mM NaCl in 20 mM buffer
400 mM NaCl in 20 mM buffer
Figure 11: Effect of too much or too little ionic strength on achieving your desired separation.
Choose the right salt concentration for basic proteins, such as lysozyme
Use more salt to reduce peak tailing
Column: Agilent Bio SEC-3 300Å 4.6 mm x 300 mm, 3 µm (p/n 5190-2513)
Instrument: Agilent 1260 Infinity Bio-inert Quaternary LC System
Flow rate: 0.35 mL/min
Detector: UV, 220 nm A: Eluent 20 mM phosphate buffer, pH 7 + 50 mM NaCl B: Eluent 20 mM phosphate buffer, pH 7 + 100 mM NaCl C: Eluent 20 mM phosphate buffer, pH 7 + 400 mM NaCl
Injection: 5 µL
Sample: Protein (1 mg/mL 20 mM phosphate buffer, pH 7)
overcome such difficulties (Figure 11). It may also be necessary to refine the choice of pore size, combine columns in series, reduce analysis flow rate, or change temperature to achieve the desired separation.
16
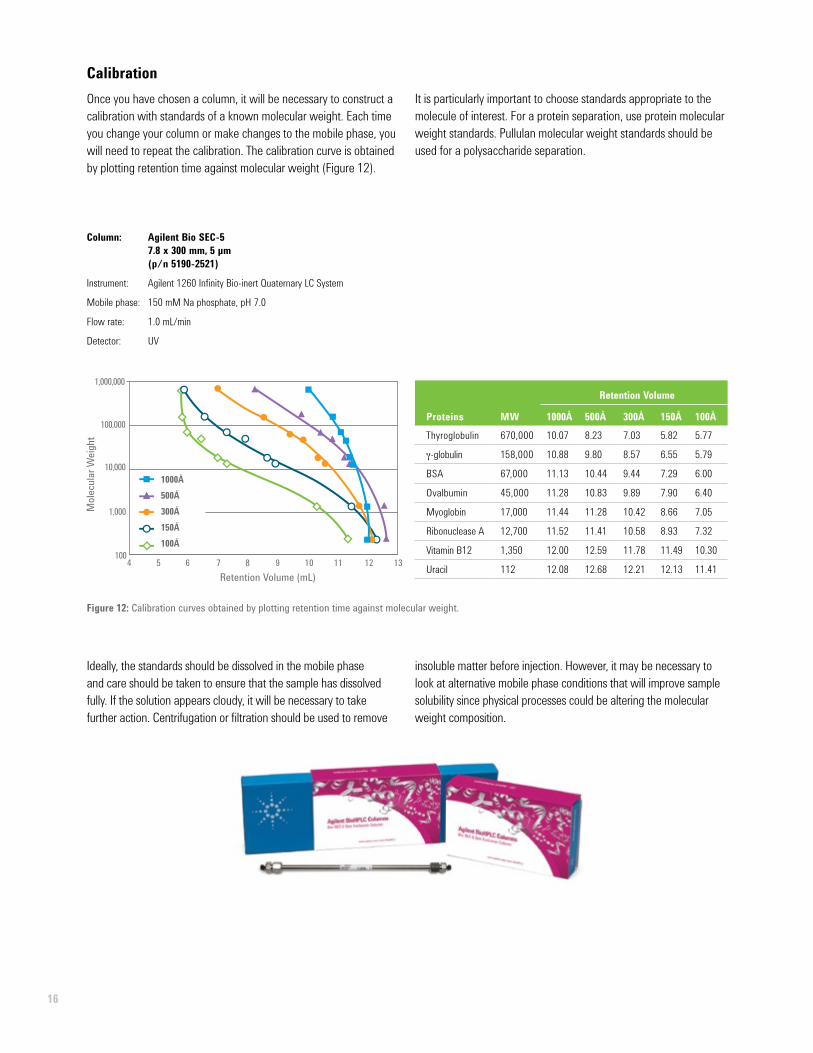
CalibrationOnce you have chosen a column, it will be necessary to construct a calibration with standards of a known molecular weight. Each time you change your column or make changes to the mobile phase, you will need to repeat the calibration. The calibration curve is obtained by plotting retention time against molecular weight (Figure 12).
4100
1,000
10,000
100,000
1,000,000
5 876 9 10 131211
Figure 12: Calibration curves obtained by plotting retention time against molecular weight.
1000Å500Å300Å150Å100Å
Mol
ecul
ar W
eight
Retention Volume (mL)
It is particularly important to choose standards appropriate to the molecule of interest. For a protein separation, use protein molecular weight standards. Pullulan molecular weight standards should be used for a polysaccharide separation.
Column: Agilent Bio SEC-5 7.8 x 300 mm, 5 µm (p/n 5190-2521)
Instrument: Agilent 1260 Infinity Bio-inert Quaternary LC System
Mobile phase: 150 mM Na phosphate, pH 7.0
Flow rate: 1.0 mL/min
Detector: UV
Ideally, the standards should be dissolved in the mobile phase and care should be taken to ensure that the sample has dissolved fully. If the solution appears cloudy, it will be necessary to take further action. Centrifugation or filtration should be used to remove
insoluble matter before injection. However, it may be necessary to look at alternative mobile phase conditions that will improve sample solubility since physical processes could be altering the molecular weight composition.
Retention Volume
Proteins MW 1000Å 500Å 300Å 150Å 100ÅThyroglobulin 670,000 10.07 8.23 7.03 5.82 5.77
g-globulin 158,000 10.88 9.80 8.57 6.55 5.79
BSA 67,000 11.13 10.44 9.44 7.29 6.00
Ovalbumin 45,000 11.28 10.83 9.89 7.90 6.40
Myoglobin 17,000 11.44 11.28 10.42 8.66 7.05
Ribonuclease A 12,700 11.52 11.41 10.58 8.93 7.32
Vitamin B12 1,350 12.00 12.59 11.78 11.49 10.30
Uracil 112 12.08 12.68 12.21 12.13 11.41
17
45
40
35
30
25
20
15
10
5
0
-5
-10
RT (min)1514131211109876543210
Resp
onse
(mv)
RI LS 90° UV, 280 nm
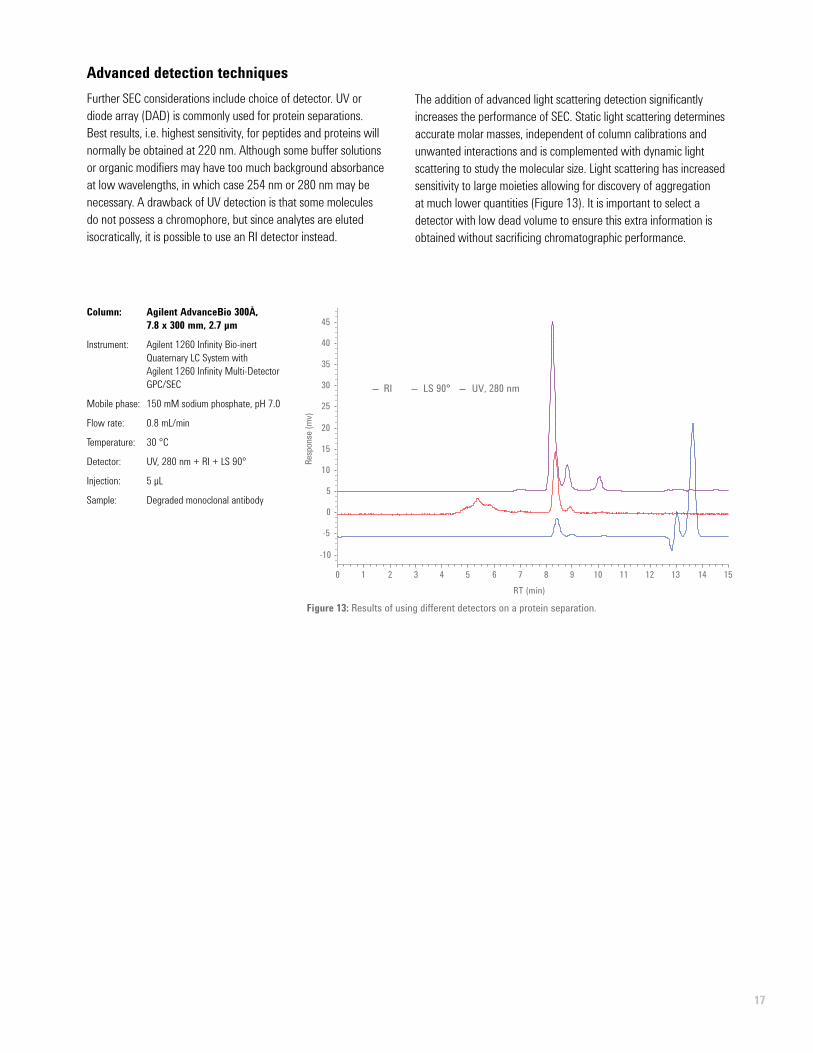
The addition of advanced light scattering detection significantly increases the performance of SEC. Static light scattering determines accurate molar masses, independent of column calibrations and unwanted interactions and is complemented with dynamic light scattering to study the molecular size. Light scattering has increased sensitivity to large moieties allowing for discovery of aggregation at much lower quantities (Figure 13). It is important to select a detector with low dead volume to ensure this extra information is obtained without sacrificing chromatographic performance.
Figure 13: Results of using different detectors on a protein separation.
Advanced detection techniquesFurther SEC considerations include choice of detector. UV or diode array (DAD) is commonly used for protein separations. Best results, i.e. highest sensitivity, for peptides and proteins will normally be obtained at 220 nm. Although some buffer solutions or organic modifiers may have too much background absorbance at low wavelengths, in which case 254 nm or 280 nm may be necessary. A drawback of UV detection is that some molecules do not possess a chromophore, but since analytes are eluted isocratically, it is possible to use an RI detector instead.
Column: Agilent AdvanceBio 300Å, 7.8 x 300 mm, 2.7 μm
Instrument: Agilent 1260 Infinity Bio-inert Quaternary LC System with Agilent 1260 Infinity Multi-Detector GPC/SEC
Mobile phase: 150 mM sodium phosphate, pH 7.0
Flow rate: 0.8 mL/min
Temperature: 30 °C
Detector: UV, 280 nm + RI + LS 90°
Injection: 5 µL
Sample: Degraded monoclonal antibody
18
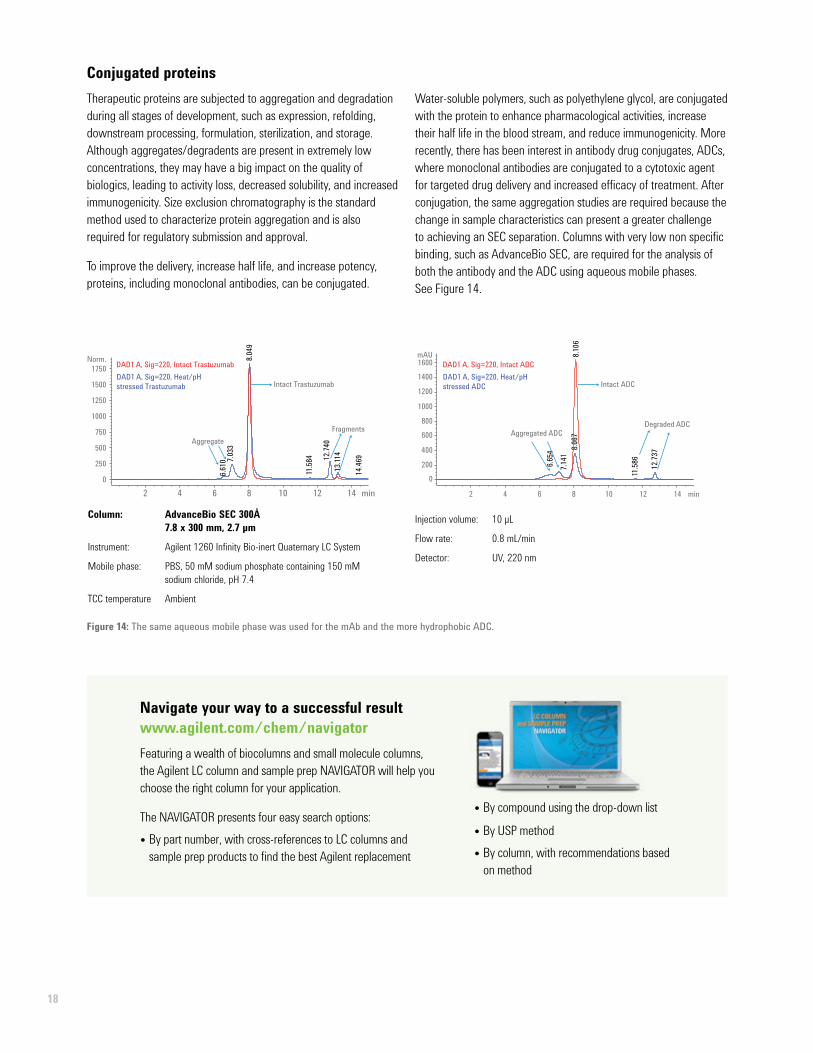
Conjugated proteinsTherapeutic proteins are subjected to aggregation and degradation during all stages of development, such as expression, refolding, downstream processing, formulation, sterilization, and storage. Although aggregates/degradents are present in extremely low concentrations, they may have a big impact on the quality of biologics, leading to activity loss, decreased solubility, and increased immunogenicity. Size exclusion chromatography is the standard method used to characterize protein aggregation and is also required for regulatory submission and approval.
To improve the delivery, increase half life, and increase potency, proteins, including monoclonal antibodies, can be conjugated.
Water-soluble polymers, such as polyethylene glycol, are conjugated with the protein to enhance pharmacological activities, increase their half life in the blood stream, and reduce immunogenicity. More recently, there has been interest in antibody drug conjugates, ADCs, where monoclonal antibodies are conjugated to a cytotoxic agent for targeted drug delivery and increased efficacy of treatment. After conjugation, the same aggregation studies are required because the change in sample characteristics can present a greater challenge to achieving an SEC separation. Columns with very low non specific binding, such as AdvanceBio SEC, are required for the analysis of both the antibody and the ADC using aqueous mobile phases. See Figure 14.
Column: AdvanceBio SEC 300Å 7.8 x 300 mm, 2.7 µm
Instrument: Agilent 1260 Infinity Bio-inert Quaternary LC System
Mobile phase: PBS, 50 mM sodium phosphate containing 150 mM sodium chloride, pH 7.4
TCC temperature Ambient
min2 4 6 8 10 12 14
Norm.
0
250
500
750
1000
1250
1500
1750
6.610 7.0
33
8.049
11.58
4 12.74
0
14.46
9
13.11
4
DAD1 A, Sig=220, Heat/pH stressed Trastuzumab
DAD1 A, Sig=220, Intact TrastuzumabDAD1 A, Sig=220, Heat/pH stressed ADC
DAD1 A, Sig=220, Intact ADC
FragmentsAggregate
Intact Trastuzumab
min 2 4 6 8 10 12 14
mAU
0
200
400
600
800
1000
1200
1400
1600
6.654
7.141
8.067
11.58
6
12.73
7
8.106
Aggregated ADCDegraded ADC
Intact ADC
Injection volume: 10 µL
Flow rate: 0.8 mL/min
Detector: UV, 220 nm
Navigate your way to a successful result www.agilent.com/chem/navigatorFeaturing a wealth of biocolumns and small molecule columns, the Agilent LC column and sample prep NAVIGATOR will help you choose the right column for your application.
The NAVIGATOR presents four easy search options:
• By part number, with cross-references to LC columns and sample prep products to find the best Agilent replacement
• By compound using the drop-down list
• By USP method
• By column, with recommendations based on method
Figure 14: The same aqueous mobile phase was used for the mAb and the more hydrophobic ADC.
19
Column selection• To ensure sample integrity, SEC is carried
out slowly on long columns
• Column lengths are typically 250 or 300 mm
• Normal flow rate is 1.0 mL/min on a 7.5 or 7.8 mm id column and 0.35 mL/min on a 4.6 mm id column
• Columns are often run in series to increase resolution in biopolymer applications
• Smaller particle sizes are used to increase resolution in protein applications
• Separations done on 150 mm columns with smaller particle sizes can reduce analytical time
Column media choice• There should be no non specific interactions
between analytes and column media
• Silica-based sorbents are used for analyzing peptides and proteins
• Polymer-based sorbents are for analyzing biopolymers
Column parameters• Pore size–depends on the molecular weight range of the sample to avoid exclusion
of sample components and maximize volume in the required separation region
• Particle size–use smaller particles for higher resolution (but higher backpressure)
• Column length–compromise between resolution and analysis time
• Column id–use smaller columns for reduced solvent consumption and smaller injection volume
Mobile phase• Mobile phase should contain buffer/salt to overcome ionic interactions, but too much may cause hydrophobic interactions
• Do not alter the analyte to avoid degradation/aggregation, etc
• Make up fresh mobile phase and use promptly, as bacterial growth is rapid in dilute buffer stored at room temperature
• Buffer shelf life is less than 7 days unless refrigerated
• Filter before use to remove particulates in water (less likely) or in buffer salts (more likely)
• High pH phosphate buffers (particularly at elevated temperature) can significantly reduce column lifetime when using silica columns
Learn more about Agilent biocolumns for SEC at www.agilent.com/chem/bioHPLC
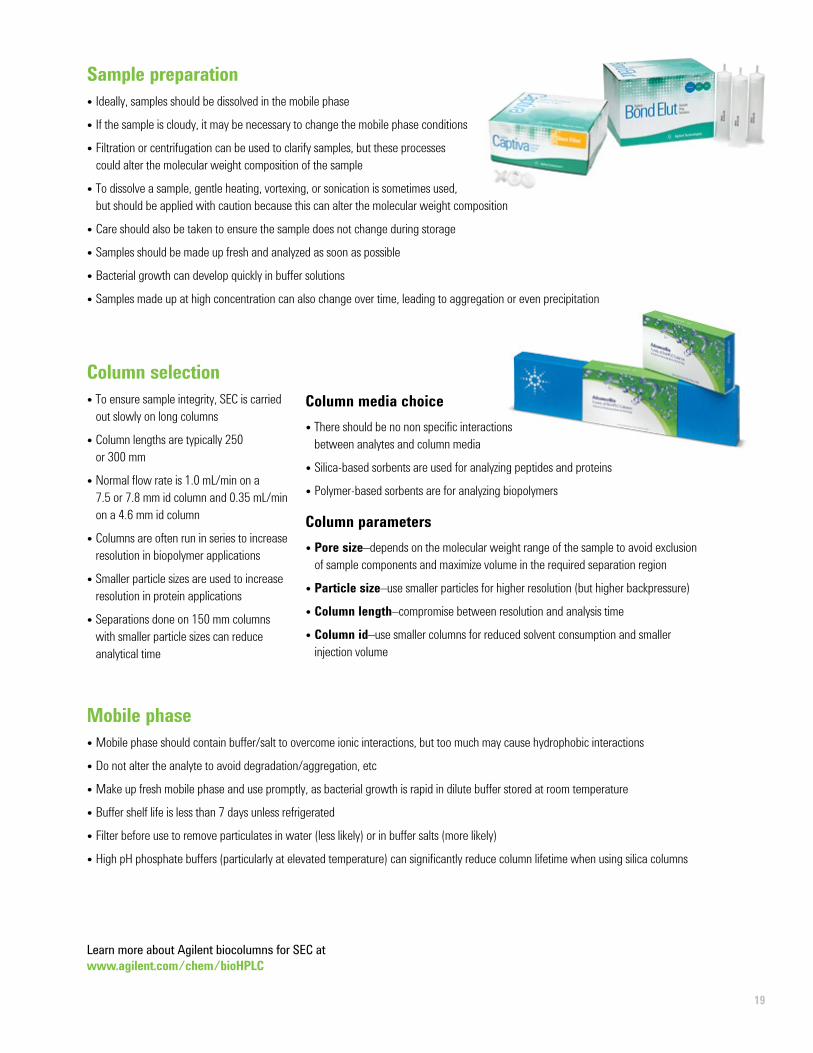
Sample preparation• Ideally, samples should be dissolved in the mobile phase
• If the sample is cloudy, it may be necessary to change the mobile phase conditions
• Filtration or centrifugation can be used to clarify samples, but these processes could alter the molecular weight composition of the sample
• To dissolve a sample, gentle heating, vortexing, or sonication is sometimes used, but should be applied with caution because this can alter the molecular weight composition
• Care should also be taken to ensure the sample does not change during storage
• Samples should be made up fresh and analyzed as soon as possible
• Bacterial growth can develop quickly in buffer solutions
• Samples made up at high concentration can also change over time, leading to aggregation or even precipitation

Partnering with you to get great resultsIncreasing challenges require better answers. Our solutions enable biopharmaceutical scientists to innovate in disease research, accelerate drug discovery, and have greater confidence throughout development and manufacturing.
Learn about Agilent solutions for biopharma www.agilent.com/chem/togetherbiopharma
Learn more www.agilent.com/chem/BioHPLC
Find a local Agilent customer center in your country www.agilent.com/chem/contactus
U.S. and Canada 1-800-227-9770 [email protected]
Europe [email protected]
Asia Pacific [email protected]
For research use only. Information, descriptions, and specifications in this publication are subject to change without notice. Agilent Technologies shall not be liable for errors contained herein or for incidental or consequential damages in connection with the furnishing, performance, or use of this material.
© Agilent Technologies, Inc. 2015 Printed in the USA, November 1, 2015 5991-3651EN