
Sixty years of project planning: history and future
12
Organization, Technology and Management in Construction 2016; 8: 1–12 Research Article Open Access M. Hajdu* and S. Isaac Sixty years of project planning: history and future DOI 10.1515/otmcj-2016-0013 Received October 16, 2016; accepted November 28, 2016 Abstract: Modern project management owes its reputa- tion to the development of modern scheduling techniques based on the theory of graphs, namely, network schedul- ing techniques. In 2017, these techniques are celebrating their 60th birthday. This anniversary provides the oppor- tunity to look back at the most important achievements such as non-linear activities and new precedence rela- tions, as well as to take a look into the future. The high- lights of this subjective retrospective are the presentation of the latest results and the compilation of those problems that will probably define the priorities for future research. This paper is the extended version of the keynote lecture/ presentation that has been presented at the PBE 2016 Con- ference (People, Buildings and Environment, Luhačovice, Czech Republic) (Hajdu 2016a). Keywords: network scheduling, Critical Path Method, PERT, Precedence Diagramming Method, continuous prec- edence relations, non-linear activities, logical switches 1 The Beginnings The first appearance of modern planning techniques dates back to the Cold War and the time the first computers started to be used for such purposes. These techniques differ from traditional ones such as the Gantt chart or Linear Schedul- ing Method in that they allow the logic underlying the plan to be directly modelled. Modern techniques also make this logic graphically understandable and visible. These plans are depicted as graphs, where the sequence of the activities is shown as chains of vertices and arrows. Due to the afore- mentioned features, modern techniques are often referred to as network techniques. Dozens of planning techniques have been developed; however, all of them are based on one of the first three techniques that were introduced: Program Evaluation and Review Technique (PERT), Crit- ical Path Method (CPM) and Precedence Diagram Method (PDM). In the following sections, the history of these tech- niques is briefly introduced. 1.1 The Program Evaluation and Review Technique (PERT) The Polaris program the purpose of which was to develop a submarine-launched nuclear-armed ballistic missile, started in 1956. In December 1956, a research team, consisting of the Special Project Office of the Navy (SPO), Booz Allen Hamilton consulting firm and experts in the Lockheed Corporation, was formed. In January 1957, Admiral Raborn, who was in charge of the Polaris program defined his most important expec- tations regarding the tracking of the project:” I must be able to reach down to any level of Special Projects Office activity and find a plan and performance report that log- ically and clearly can be related to the total job, we have to do.” (Massay 1963) The research team set the aims of the future system, and the research proceeded quickly. In October 1957, PERT was running on a computer, and according to the official statement, they began to apply it for the project. However, PERT was not “really” applied on the Polaris program (Massay 1963). No wonder – man- aging projects involving around 120 contractors and © 2016, Hajdu, licensee De Gruyter Open. This work is licensed under the Creative Commons Attribution-NonCommercial-NoDerivs 3.0 License. *Corresponding author: M. Hajdu, Budapest University of Technology and Economics, 1. Műegyetem rkp. Budapest, Hungary 1111, e-mail: [email protected] S. Isaac, Ben-Gurion University of the Negev, Be’er Sheva, Israel Unauthenticated Download Date | 2/22/17 1:40 PM
Transcript of Sixty years of project planning: history and future
Organization, Technology and Management in Construction 2016; 8: 1–12
Research Article Open Access
M. Hajdu* and S. Isaac
Sixty years of project planning: history and futureDOI 10.1515/otmcj-2016-0013 Received October 16, 2016; accepted November 28, 2016
Abstract: Modern project management owes its reputa-tion to the development of modern scheduling techniques based on the theory of graphs, namely, network schedul-ing techniques. In 2017, these techniques are celebrating their 60th birthday. This anniversary provides the oppor-tunity to look back at the most important achievements such as non-linear activities and new precedence rela-tions, as well as to take a look into the future. The high-lights of this subjective retrospective are the presentation of the latest results and the compilation of those problems that will probably define the priorities for future research. This paper is the extended version of the keynote lecture/presentation that has been presented at the PBE 2016 Con-ference (People, Buildings and Environment, Luhačovice, Czech Republic) (Hajdu 2016a).
Keywords: network scheduling, Critical Path Method, PERT, Precedence Diagramming Method, continuous prec-edence relations, non-linear activities, logical switches
1 The BeginningsThe first appearance of modern planning techniques dates back to the Cold War and the time the first computers started to be used for such purposes. These techniques differ from traditional ones such as the Gantt chart or Linear Schedul-ing Method in that they allow the logic underlying the plan to be directly modelled. Modern techniques also make this logic graphically understandable and visible. These plans are depicted as graphs, where the sequence of the activities is shown as chains of vertices and arrows. Due to the afore-mentioned features, modern techniques are often referred to as network techniques. Dozens of planning techniques have been developed; however, all of them are based on one of the first three techniques that were introduced: Program Evaluation and Review Technique (PERT), Crit-ical Path Method (CPM) and Precedence Diagram Method (PDM). In the following sections, the history of these tech-niques is briefly introduced.
1.1 The Program Evaluation and Review Technique (PERT)
The Polaris program the purpose of which was to develop a submarine-launched nuclear-armed ballistic missile, started in 1956. In December 1956, a research team, consisting of the Special Project Office of the Navy (SPO), Booz Allen Hamilton consulting firm and experts in the Lockheed Corporation, was formed. In January 1957, Admiral Raborn, who was in charge of the Polaris program defined his most important expec-tations regarding the tracking of the project:” I must be able to reach down to any level of Special Projects Office activity and find a plan and performance report that log-ically and clearly can be related to the total job, we have to do.” (Massay 1963) The research team set the aims of the future system, and the research proceeded quickly. In October 1957, PERT was running on a computer, and according to the official statement, they began to apply it for the project. However, PERT was not “really” applied on the Polaris program (Massay 1963). No wonder – man-aging projects involving around 120 contractors and
© 2016, Hajdu, licensee De Gruyter Open.This work is licensed under the Creative Commons Attribution-NonCommercial-NoDerivs 3.0 License.
*Corresponding author: M. Hajdu, Budapest University of Technology and Economics, 1. Műegyetem rkp. Budapest, Hungary 1111, e-mail: [email protected] S. Isaac, Ben-Gurion University of the Negev, Be’er Sheva, Israel
UnauthenticatedDownload Date | 2/22/17 1:40 PM

2 Hajdu and Isaac, Sixty years of project planning
about thousands of subcontractors is even nowadays a challenging task for the best planners, who are equipped with the latest information technology (IT) and com-puter applications. Lack of an adequate methodology, apart from having to program with punched cards and with less than 10 KB memory, made it really hard to apply PERT in large real-life projects. There is another argu-ment explaining why PERT was not used at that time: the theoretical flaw in the method’s rules for calculation, which are discussed in Section 2. The popularization of PERT also started in these times, with the help of SPO’s public relations machinery. The first scientific paper was published in 1959 (Malcolm et al. 1959). By 1962, the US government alone had issued 139 documents about PERT. By 1964, the number of scientific announcements, books and reports on the technique had reached 1000. The technique became so widespread that some authors use it as a synonym for network technique even today, as well as equating network diagrams with PERT diagrams, causing serious misunderstandings.
1.2 The Critical Path Method (CPM)
The development of the CPM technique started in 1956, when the management of DuPont decided to utilize their UNIVAC 1 computer (Fig. 1) to support the maintenance work of their production plants. The management of the company wanted to prove that IT is the future, and that the money they had spent on the computer was not in vain.
DuPont’s management thought that using the com-puter for planning and cost optimization was an excel-lent way to prove its utility. Morgan Walker, an engineer at DuPont, got the assignment of figuring out whether UNIVAC could be used for solving such problems. There were also other researchers within DuPont investigating the same thing; however, none of them could come up with a useful solution. Between the second half of 1956 and the beginning of 1957, Morgan Walker and James E. Kelley from the Remington Rand Research Institute, who joined the project in the meantime, were able to define an existing project, whose logical dependencies they had discovered. Kelley transformed the problem into a parametric linear programming one, which he could solve. On 24 July 1957, a problem called Fischer’s Work was successfully managed to run on computer. The network consisted of 61 activities and 16 dummy activities. The result of the analysis, i.e. the least-cost solutions for the given project durations, can be seen in Fig. 2, while Fig. 3 shows a drawing explaining the algorithm.
The first scientific paper on the CPM technique was published in 1959 (Kelley and Walker 1959), and another
Fig. 1: Mercury delay line memory of UNIVAC I (https://en.wikipedia.org/wiki/UNIVAC_I).
Fig. 2: Result of the first CPM analysis made by a computer (Kelley 1989).
UnauthenticatedDownload Date | 2/22/17 1:40 PM

Hajdu and Isaac, Sixty years of project planning 3
one was later published in 1961 (Kelley 1961). Populariza-tion of the CPM in the construction industry is due to the work of Fondahl (1961).
1.3 The Precedence Diagramming Method (PDM)
The PERT and the CPM, the two techniques most con-nected to the beginnings of project management, have lost their significance over the decades. Despite thou-sands of papers published on PERT each year, it has not been improved sufficiently to be widely used by project managers. The original CPM network planning technique has suffered a similar fate. Both the mathematical appa-ratus needed for the solution and the necessary comput-ers were unavailable for the masses. Therefore, the CPM technique was simplified over time. It was used for time analysis instead of cost optimization. However, there were other problems as well, which made the applica-tion of even this simplified technique difficult. The most important one of these was how to draw the CPM network based on the list of activities and on the list of immediate predecessors. John Fondahl (1961), a pioneer of network techniques, noticed that drawing a CPM network was a very daunting task, especially in case of bigger projects. It is now known that drawing a CPM (activity-on-arrow [AOA]) network with the minimal number of dummies is a non-deterministic polynomial-time (NP)-hard problem (Krishnamoorty et al. 1979). To avoid this problem, Fondahl recommended a new way of drawing the network, the activity-on-node notation. His suggestion is an important prelude to the PDM planning technique. According to his reminiscences (Fondahl 1987), the first three precedence relations – the Start-to-Start (SS), the Finish-to-Start (FS) and the Finish-to-Finish (FF) – had
appeared in an IBM application in 1964 (IBM 1964). The term Precedence Diagramming Method also came from the IBM team (Fondahl 1987). Research regarding network scheduling had also taken place in Europe. The most notable and significant among these was the development of the so-called Metra Potential Method (MPM), which was developed by Roy (1959, 1960). His MPM network was an activity-on-node network that utilized the Start-to-Start relations with minimal and maximal lags. In this sense, it was more advanced than the PDM. The two techniques were practically the same, and it is important to note that Fondahl and Roy were not acquainted at this time and they were not cognizant of each other’s work (Fondahl 1987). Some researchers still feel the importance to distinguish these techniques, and some of them use their names as synonyms for the same technique, which is called PDM today. Although the rise of the Precedence Diagramming Method (PDM) was not as straightforward as that of the previously mentioned techniques, there is no doubt that PDM has become the prevalent technique of our time due to the flexibility pro-vided by its different precedence relations.
2 Foundations and problems
2.1 PERT network
The original PERT (Malcolm et al. 1959) is an AOA network with one start and one finish event. These two events rep-resent the beginning and the end of a project. The logic of the project is depicted by a directed, acyclic graph in which the vertices of the graph represent the events, while the arrows represent the tasks. An event occurs when all preceding activities have been completed; after that, the succeeding tasks can start.
Activity durations are defined by stochastic variables that are assumed to be independent of each other. The distribution of the activity durations follows a so-called PERT-beta distribution (Fig. 4), which can be defined by the so-called three-point estimation. The main goal of the PERT analysis is to create a distribution of the project duration. According to the PERT theory, the project dura-tion has a normal distribution, with the mean being the result of a time analysis based on mean activity durations x( ) (refer Fig. 4 for the calculation of expected values) and
the variance being equal to the sum of the variances of the activities on the critical path. These calculations are based on the central limit theorem of mathematical sta-tistics. PERT has received a great deal of criticism since its
Fig. 3: Topology graph of the CPM network (Kelley 1989).
UnauthenticatedDownload Date | 2/22/17 1:40 PM

4 Hajdu and Isaac, Sixty years of project planning
“birth”. These critiques can be classified into four classes, as follows:• Critiques of the three-point estimation (Three point
estimation cannot be used to define activity distri-bution without ambiguity) (Clark 1962; Sasieni 1986; Keefer and Bodily 1983; Farnum and Stanton 1987).
• Critiques of the proposed activity distribution (Why is Beta assumed for the distribution of the activity dura-tion, instead of other, maybe better distributions?) (Kotiah and Wallace 1973; Mohan and Chandrashekar 2007; Hahn 2008; Johnson 1997; Trietsch et al. 2012; Premachandra and Gonzales 1996; Kamburowski 1997).
• Critiques of the optimistic result of the PERT calcula-tion. (PERT works only if not more than one path can be critical [refer Fig. 5: Original PERT result for the same distribution for a 10-path network]) (Clark 1961; Dodin 1985a, 1985b; Adlakha 1989; Elmaghraby 1989; Kamburowski 1992; Yao 2007).
• Critiques about omitting activity calendars (the distri-bution of the project duration does not follow normal distribution even in the case of the simplest one-chain network if different calendars are applied; Fig. 6) (Hajdu 2013).
The application of a Monte Carlo simulation (Van Slyke 1963) offers a solution for all the calculation problems noted herein. It can handle multiple competing paths, any kind of activity duration distributions and calendars as well. It is fast enough to run a vast number of instances within a reasonable amount of time and can be used on a network containing more complicated precedence relationships.
2.2 CPM network
CPM possesses a similar topology as PERT. The basic difference is in how it handles activity durations. In the
Fig. 5: Distribution of the project duration of one-chain and 10-chain networks.
Fig. 4: Typical density function of the PERT-beta distribution.
UnauthenticatedDownload Date | 2/22/17 1:40 PM

Hajdu and Isaac, Sixty years of project planning 5
original CPM model, it is assumed that every activity has a normal duration, which is based on an execution using normal technology, normal working weeks and working days, as well as an average resource load. The so-called normal cost is associated directly with the normal dura-tion. On the other hand, some of the activities can be accelerated by using longer shifts, faster technologies and application of more workforce and machines. The fastest activity duration is called the crash duration and the associated direct cost is called the crash cost. It is also assumed that the crash cost is greater than the normal cost, and the curve in between these costs is linear (Fig. 7).
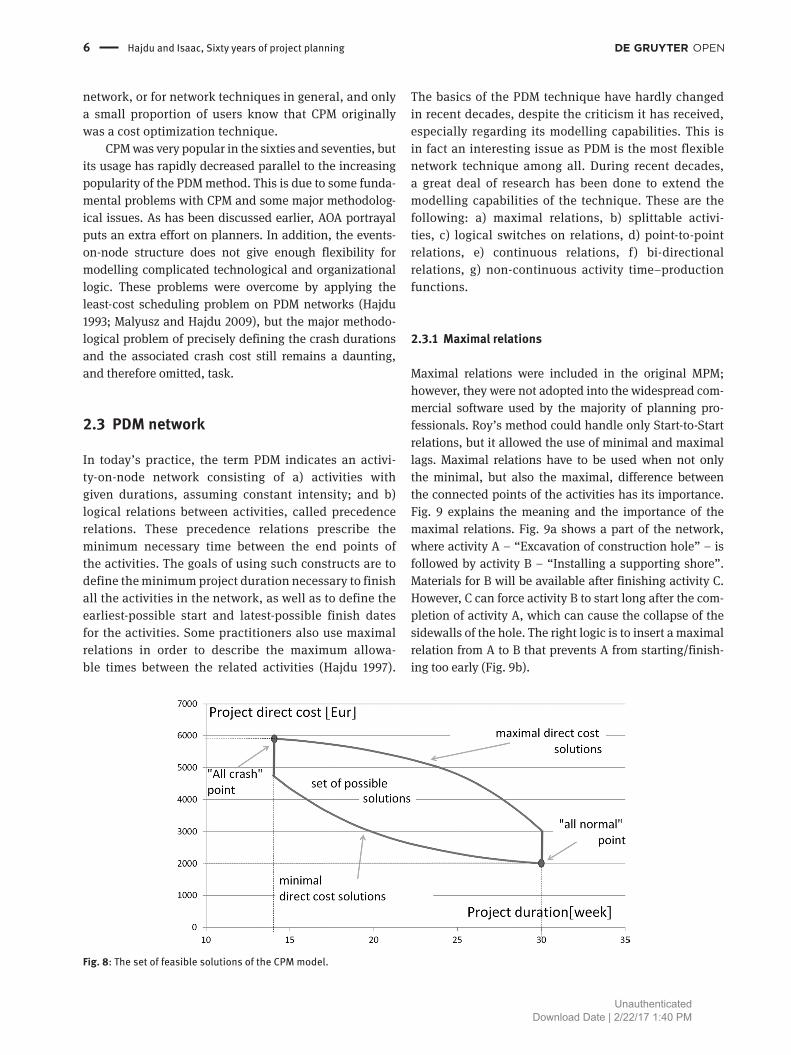
It is obvious that freely changing the activity dura-tions between these boundaries results in different project durations and a different direct project cost. The goal of the original CPM model was to find the minimal project cost for all the possible project durations, i.e. to define the lower envelope of Fig. 8.
The solution that was developed by the research team in 1957 was based on linear programming, which was developed by Dantzig (1963) during World War II. In the following years, mathematicians produced increasingly beautiful and elegant solutions for the CPM model, based on – for instance, a network flow model (Fulkerson 1961) or the dynamic programming technique (Hindealng and Muth 1979). According to the author’s opinion, the most elegant solution was developed by
Klafszky (1969). The original algorithm assumed that the cost curve is linear between the crash and the normal cost of the activities. This limitation was later relaxed in different ways by allowing discrete points or non-linear time–cost curves (Meyer and Shaffer 1963). Finding the maximal cost solution for the CPM problem, i.e. the upper envelope of the solution set of Fig. 8, is the result of the work of Crandall and Hajdu (Crandall and Hajdu 1994) and Hajdu (1997). Heuristic solutions have also been developed to solve the CPM model (Fondahl 1961; Siemens 1971), as well as to ease the cal-culations in the absence of computer tools. However, these methods have no practical importance in the area of personal computers. It is interesting to note that the majority of the planners and even teachers use the term CPM simply as a synonym for time analysis on an AOA
Fig. 6: The effect of the different activity calendars on the distribution of project duration based on the same one-chain network (Hajdu 2013).
Fig. 7: Assumption of time vs cost of the original CPM model.
UnauthenticatedDownload Date | 2/22/17 1:40 PM
6 Hajdu and Isaac, Sixty years of project planning
network, or for network techniques in general, and only a small proportion of users know that CPM originally was a cost optimization technique.
CPM was very popular in the sixties and seventies, but its usage has rapidly decreased parallel to the increasing popularity of the PDM method. This is due to some funda-mental problems with CPM and some major methodolog-ical issues. As has been discussed earlier, AOA portrayal puts an extra effort on planners. In addition, the events-on-node structure does not give enough flexibility for modelling complicated technological and organizational logic. These problems were overcome by applying the least-cost scheduling problem on PDM networks (Hajdu 1993; Malyusz and Hajdu 2009), but the major methodo-logical problem of precisely defining the crash durations and the associated crash cost still remains a daunting, and therefore omitted, task.
2.3 PDM network
In today’s practice, the term PDM indicates an activi-ty-on-node network consisting of a) activities with given durations, assuming constant intensity; and b) logical relations between activities, called precedence relations. These precedence relations prescribe the minimum necessary time between the end points of the activities. The goals of using such constructs are to define the minimum project duration necessary to finish all the activities in the network, as well as to define the earliest-possible start and latest-possible finish dates for the activities. Some practitioners also use maximal relations in order to describe the maximum allowa-ble times between the related activities (Hajdu 1997).
The basics of the PDM technique have hardly changed in recent decades, despite the criticism it has received, especially regarding its modelling capabilities. This is in fact an interesting issue as PDM is the most flexible network technique among all. During recent decades, a great deal of research has been done to extend the modelling capabilities of the technique. These are the following: a) maximal relations, b) splittable activi-ties, c) logical switches on relations, d) point-to-point relations, e) continuous relations, f) bi-directional relations, g) non-continuous activity time–production functions.
2.3.1 Maximal relations
Maximal relations were included in the original MPM; however, they were not adopted into the widespread com-mercial software used by the majority of planning pro-fessionals. Roy’s method could handle only Start-to-Start relations, but it allowed the use of minimal and maximal lags. Maximal relations have to be used when not only the minimal, but also the maximal, difference between the connected points of the activities has its importance. Fig. 9 explains the meaning and the importance of the maximal relations. Fig. 9a shows a part of the network, where activity A – “Excavation of construction hole” – is followed by activity B – “Installing a supporting shore”. Materials for B will be available after finishing activity C. However, C can force activity B to start long after the com-pletion of activity A, which can cause the collapse of the sidewalls of the hole. The right logic is to insert a maximal relation from A to B that prevents A from starting/finish-ing too early (Fig. 9b).
Fig. 8: The set of feasible solutions of the CPM model.
UnauthenticatedDownload Date | 2/22/17 1:40 PM

Hajdu and Isaac, Sixty years of project planning 7
2.3.2 Splittable activities
Activities in a PDM network are assumed to progress with a constant speed without breaks. The reason for this is that modelling, e.g. overlapping of activities using the traditional precedence relations, requires this assumption to prevent situations such as that shown in Fig. 10. It can be seen that there is sufficient space between the start of activity A – “excavation” – and the start of activity B – “pipe laying”, and that the same is true for the end of these activities due the FF and SS relations. However, unwanted situations can arise, e.g. due to changing productivity, which will not be noticed by the algorithm, because the relationships control only the end points. However, the hypothesis concern-ing the constant progress rate of activities is very strict and almost never fulfilled in construction projects. The concept of splittable activities helps in handling this problem in a limited sense: activities can be split for dif-ferent reasons such as calendars, changes of resources, etc. Splitting can be discrete, which means that splitting is allowed only in given times for given periods, and can
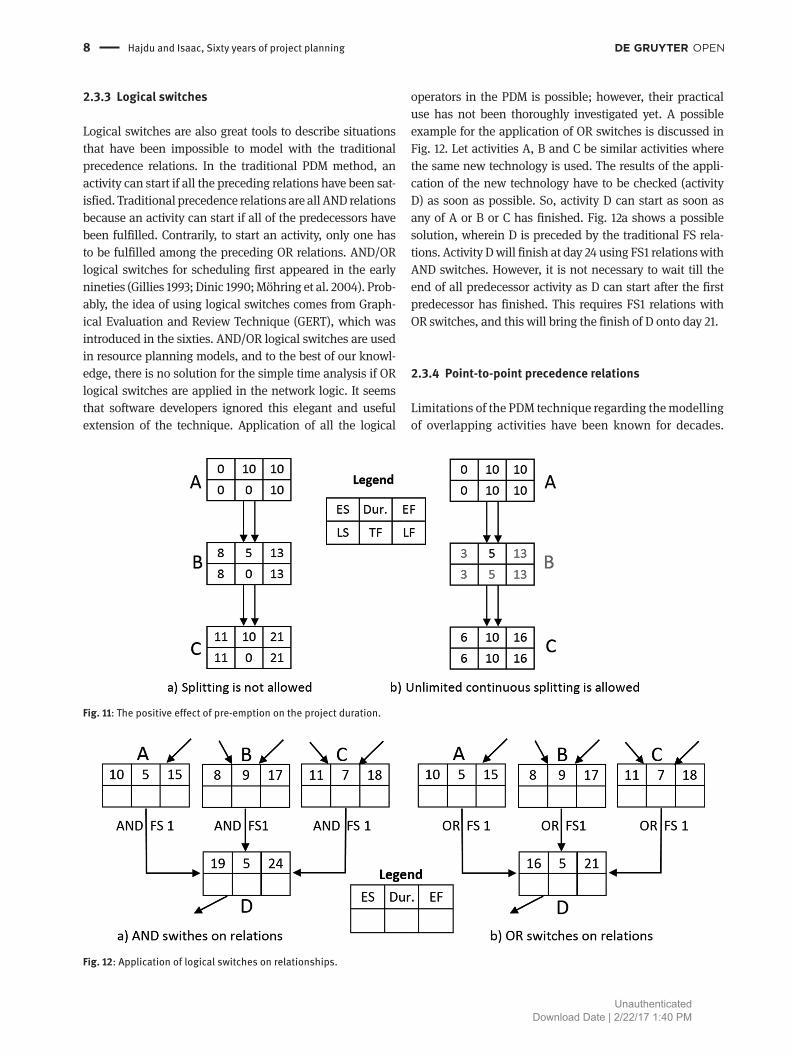
be continuous when activities can be split unlimited number of times. An example for continuous pre-emp-tion is shown in Fig. 11.
Fig. 11a shows a situation when the durations of all the activities (A – excavation, B – pipe laying and C – refill) are fixed, while Fig. 11b shows the situation when contin-uous splitting is allowed on activity B. It can be seen that allowing activity splitting has a positive effect on project duration. An additional advantage of using this concept is that the resources on activity B can be adjusted to the longer duration (in this case, it is 10 days) which gives the possibility of reducing cost. Scheduling applications usually does not allow pre-emption and follows the origi-nal hypothesis. However, allowing pre-emption can better fit real-life situations, and its effect on project duration is very often positive, as can be seen in Fig. 11. Activity pre-emption has been discussed by many authors, and pri-ority to any author is hard to judge. Detailed discussion of pre-emption can be found in the study by Schwindt and Zimmermann (2015), and one of the earliest discussions of continuous unlimited pre-emption is found in other similar studies (Hajdu 1997).
Fig. 9: Maximal relations in PDM network.
Fig. 10: Assumption of linear activities is essential in case of traditional relationships.
UnauthenticatedDownload Date | 2/22/17 1:40 PM
8 Hajdu and Isaac, Sixty years of project planning
2.3.3 Logical switches
Logical switches are also great tools to describe situations that have been impossible to model with the traditional precedence relations. In the traditional PDM method, an activity can start if all the preceding relations have been sat-isfied. Traditional precedence relations are all AND relations because an activity can start if all of the predecessors have been fulfilled. Contrarily, to start an activity, only one has to be fulfilled among the preceding OR relations. AND/OR logical switches for scheduling first appeared in the early nineties (Gillies 1993; Dinic 1990; Möhring et al. 2004). Prob-ably, the idea of using logical switches comes from Graph-ical Evaluation and Review Technique (GERT), which was introduced in the sixties. AND/OR logical switches are used in resource planning models, and to the best of our knowl-edge, there is no solution for the simple time analysis if OR logical switches are applied in the network logic. It seems that software developers ignored this elegant and useful extension of the technique. Application of all the logical
operators in the PDM is possible; however, their practical use has not been thoroughly investigated yet. A possible example for the application of OR switches is discussed in Fig. 12. Let activities A, B and C be similar activities where the same new technology is used. The results of the appli-cation of the new technology have to be checked (activity D) as soon as possible. So, activity D can start as soon as any of A or B or C has finished. Fig. 12a shows a possible solution, wherein D is preceded by the traditional FS rela-tions. Activity D will finish at day 24 using FS1 relations with AND switches. However, it is not necessary to wait till the end of all predecessor activity as D can start after the first predecessor has finished. This requires FS1 relations with OR switches, and this will bring the finish of D onto day 21.
2.3.4 Point-to-point precedence relations
Limitations of the PDM technique regarding the modelling of overlapping activities have been known for decades.
Fig. 12: Application of logical switches on relationships.
Fig. 11: The positive effect of pre-emption on the project duration.
UnauthenticatedDownload Date | 2/22/17 1:40 PM

Hajdu and Isaac, Sixty years of project planning 9
The first step on the road to better modelling of overlap-ping activities was the development of point-to-point relations. Point-to-point relations can connect not only the end points of the activities but also any of their inter-nal points. Connected inner points can be defined using time or work units (e.g. workdays or meters). This allows overlapping to be modelled at an acceptable level, using relatively short sections connected with point-to-point relations. The development of point-to-point relations was made independently in a number of parallel studies, which gave new names to PDM such as the chronographic approach (Francis and Miresco 2000, 2002), Bee-line Dia-gramming Method (Kim 2010, 2012), Relationship Dia-gramming Method (Plotnick 2004), and Graphical Dia-gramming Method (de Leon 2008). The common feature of all these developments is that they have made possible the establishment of logical relations between the inner points of the activities. The point-to-point denomination and the correct mathematical model come from the work of Hajdu (2015), who also pointed to the fact that tradi-tional precedence relations (SS, SF, FF and FS) are specific manifestations of point-to-point relations, namely, when
the defined points are the end points of the activities. Point-to-point relations can be seen in Fig. 13.
2.3.5 Continuous precedence relations
Hajdu (2015) has also shown that point-to-point relations suffer from the same drawback as end point relations, in that they control only the end points of the fragments, and if an unacceptable situation arises within segments, the model will not recognize this. Consequently, point-to-point relations give theoretically correct solutions for overlapping activities only if the number of segments is infinite and the size of the fragments approaches zero.
This revelation has led to the definition of continu-ous relations (Hajdu 2015, 2016b). Continuous relations are the theoretically perfect relations for defining activ-ity overlapping because all the points of the activities are controlled. Continuous relations can be defined by using time and work gaps, as can be seen in Fig. 14.
2.3.6 Bi-directional relations
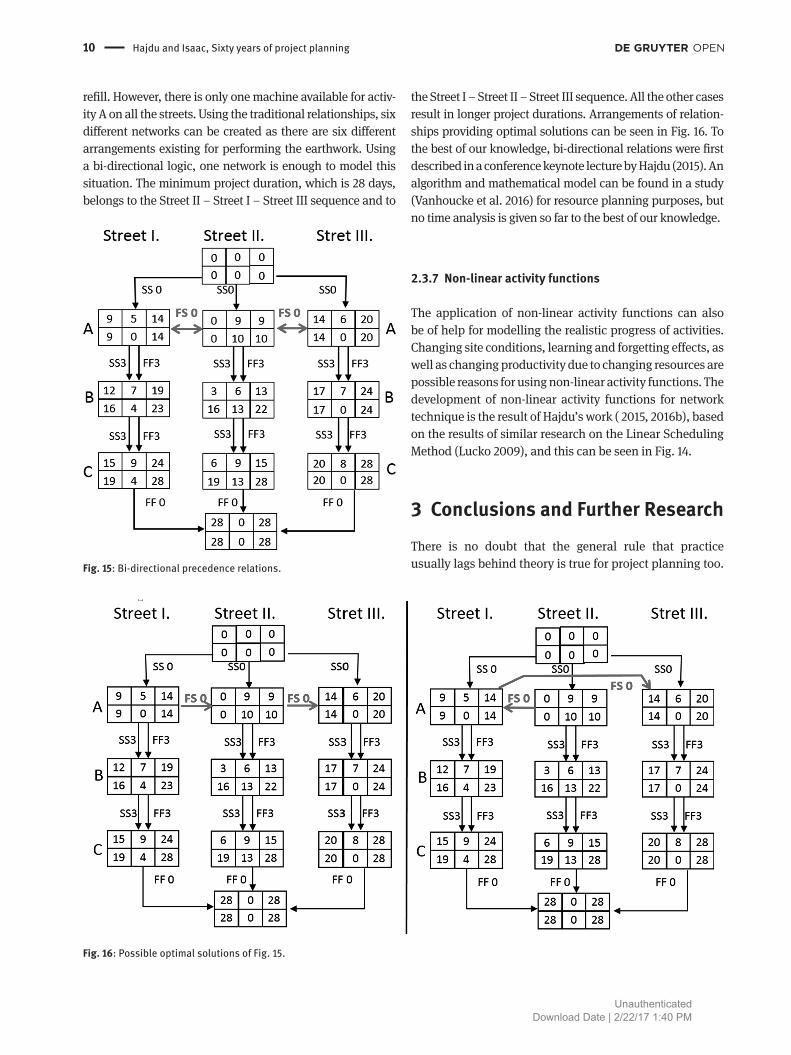
Bi-directional relations have been developed for model-ling activities that are technologically independent but are using the same resources. In this case, the sequence of the activities is neutral, but one has to follow the other due to the resource requirement. Fig. 15 shows an example of the construction of a drainage system in three parallel streets consisting of three activities in each street (A – excavation, B – pipe laying and C – refill). There are no resource limits for executing the pipe-laying activity and the same is valid for
Fig. 14: Continuous relations with time and work gaps.
Fig. 13: Point-to-point relations for better modelling of overlapping activities.
UnauthenticatedDownload Date | 2/22/17 1:40 PM
10 Hajdu and Isaac, Sixty years of project planning
refill. However, there is only one machine available for activ-ity A on all the streets. Using the traditional relationships, six different networks can be created as there are six different arrangements existing for performing the earthwork. Using a bi-directional logic, one network is enough to model this situation. The minimum project duration, which is 28 days, belongs to the Street II – Street I – Street III sequence and to
the Street I – Street II – Street III sequence. All the other cases result in longer project durations. Arrangements of relation-ships providing optimal solutions can be seen in Fig. 16. To the best of our knowledge, bi-directional relations were first described in a conference keynote lecture by Hajdu (2015). An algorithm and mathematical model can be found in a study (Vanhoucke et al. 2016) for resource planning purposes, but no time analysis is given so far to the best of our knowledge.
2.3.7 Non-linear activity functions
The application of non-linear activity functions can also be of help for modelling the realistic progress of activities. Changing site conditions, learning and forgetting effects, as well as changing productivity due to changing resources are possible reasons for using non-linear activity functions. The development of non-linear activity functions for network technique is the result of Hajdu’s work ( 2015, 2016b), based on the results of similar research on the Linear Scheduling Method (Lucko 2009), and this can be seen in Fig. 14.
3 Conclusions and Further ResearchThere is no doubt that the general rule that practice usually lags behind theory is true for project planning too. Fig. 15: Bi-directional precedence relations.
Fig. 16: Possible optimal solutions of Fig. 15.
UnauthenticatedDownload Date | 2/22/17 1:40 PM
Hajdu and Isaac, Sixty years of project planning 11
Foundations that have been set 60 years ago comprise the sole basis of scheduling application even today. A meth-odology that can ease the application of the more sophis-ticated developments is also missing. However, there are some creative applications that offer some of these missing features. In the near future, it could become possible for every kind of logic and all kinds of activity functions to be perfectly modelled. Once this has been done, the main problem of creating good plans will be the human factor. Projects tend to be so complex and difficult that no plan-ners and no planning teams will be able to overview all the aspects of the projects. The author’s opinion is that once the required modelling capabilities have been developed, research will next turn to developing knowledge-based (KB) systems that use KB techniques to support human decision-making during the course of project planning.
ReferencesAdlakha, V. G. (1989). A classified bibliography of research on
stochastic PERT networks: 1966-1987. Information Systems and Operational Research, 27(3), pp. 272-296.
Clark, C. E. (1961). The greatest of a finite set of random variables. Operations Research, 9, pp. 145-162.
Clark, C. E. (1962). The PERT model for the distribution of an activity time. Operations Research, 10, pp. 405-406.
Crandall, K., & Hajdu, M. (1994). A CPM költségtervezési feladat “legrosszabb” megoldása. Közlekedéstudományi szemle, 44(5), pp. 173-176. (In Hungrian).
Dantzig, G. B. (1963). Linear Programming and Extensions. Princeton University Press, Princeton, NJ.
de Leon, G. P. (2008). Graphical Planning method. In: PMICOS Annual Conference, Chicago, IL.
Dinic, E. A. (1990). The fastest algorithm for the PERT problem with AND- and OR-nodes (the new product-new technology problem). In: Kannan, R., & Pulleyblank, W. R. (eds.). Proceedings of the International Conference on Integer Programming and Combinatorial Optimization. University of Waterloo Press, Waterloo, ON, Canada, pp. 185-187.
Dodin, B. M. (1985a). Bounding the project completion time distribution in PERT networks. Operations Research, 33, pp. 862-881.
Dodin, B. M. (1985b). Approximating the distribution functions in stochastic networks. Computers & Operations Research, 12(3), pp. 251-264.
Elmaghraby, S. E. (1989). The estimation of some network parameters in PERT model of activity networks: Review and critique. In: Slowinski, R., & Weglarz J. (eds.). Advances in Project Scheduling. Elsevier, Amsterdam, pp. 371-432.
Farnum, N. R., & Stanton, L. W. (1987). Some results concerning the estimation of beta distribution parameters in PERT. Journal of the Operations Research Society, 38, pp. 287-290.
Fondahl, J. W. (1961). A Non-Computer Approach to the Critical Path Method for the Construction Industry, Technical
Report #9. Department of Civil Engineering, Stanford University, Stanford, CA.
Fondahl, J. W. (1987). The history of modern project management: Precedence diagramming method: Origins and early developments. Project Management Journal, 18(2), pp. 33-36.
Francis, A., & Miresco, E. T. (2000). Decision support for project management using a chronographic approach. In: Proceedings of the 2nd International Conference on Decision Making in Urban and Civil Engineering Grand Hôtel Mercure Saxe- Lafayette, 20-22 November 2000, Lyon, France, pp. 845-856. Published jointly by INSA-Lyon, ESIGEC Chambery, ENTPE-Lyon and ETS Canada. [ISBN 2868341179].
Francis, A., & Miresco, E. T. (2002). Decision support for project management using a chronographic approach. Journal of Decision Systems, 11(3-4), pp. 383-404.
Fulkerson, D. R. (1961). A network flow computation for project cost curves. Management Science, 7(2), pp. 167-178.
Gillies, D. W. (1993). Algorithms to schedule tasks with AND/OR precedence constraints. PhD thesis, Department of Computer Science, University of Illinois at Urbana-Champaign, Urbana, IL.
Hahn, E. D. (2008). Mixture densities for project management activity times: A robust approach to PERT. European Journal of Operational Research, 188, pp. 450-459.
Hajdu, M. (1993). An algorithm for solving the cost optimization problem in precedence diagramming. Periodica Politechnica Civil Engineering, 37(3), pp. 231-247.
Hajdu, M. (1997). Network Scheduling Techniques for Construction Project Management. Kluwer Academic Publishers, Dordrecht, London, New York. 352 p. [ISBN:0-7923-4309-3].
Hajdu, M. (2013). Effects of the application of activity calendars in PERT networks. Automation in Construction, 35, pp. 397-404.
Hajdu, M. (2015a). One relation to rule them all: The point-to-point precedence relation that substitutes the existing ones. In: Froese, T. M., Newton, L., Sadeghpour, F., & Vanier, D. J. (eds.). Proceedings of ICSC15: The Canadian Society for Civil Engineering 5th International/11th Construction Specialty Conference. 7-10 June. University of British Columbia, Vancouver, BC, Canada. doi: 10.14288/1.0076408.
Hajdu, M. (2015b). History and some latest development of precedence diagramming method. Organization, Technology and Management in Construction: An International Journal, 7(2), pp. 1302-1314. doi: 10.5592/otmcj.2015.2.5.
Hajdu, M. (2015c). Continuous precedence relations for better modelling overlapping activities. Procedia Engineering, 123, pp. 216-223. doi: 1016/j.proeng.2015.10.080.
Hajdu, M. (2015d). Precedence diagramming method: Some latest developments. In: Keynote Presentation on the Creative Construction Conference, 21-24 June, 2015. Krakow, Poland.
Hajdu, M. (2016a). Sixty years of project planning: History and future. In: Conference Proceedings of People, Buildings and Environment 2016, An International Scientific Conference, Luhačovice, Czech Republic, pp. 230-242. Brno University of Technology, Faculty of Civil Engineering, Brno, Czech Republic [ISSN: 1805-6784].
Hajdu, M. (2016b). PDM time analysis with continuous and point-to-point relations: Calculations using an artificial example. Procedia Engineering, 164, pp. 57-67. doi: 10.1016/j.proeng.2016.11.592.
UnauthenticatedDownload Date | 2/22/17 1:40 PM
12 Hajdu and Isaac, Sixty years of project planning
Hindealng, T. J., & Muth, J. F. (1979). A dynamic programming algorithm for decision CPM networks. Operations Research, 27(2), pp. 225-241.
IBM. (1964). Users’ Manual for IBM 1440 Project Control System (PCS).
Johnson, D. (1997). The triangular distribution as a proxy for the beta distribution in risk analysis. Journal of the Royal Statistical Society: Series D (The Statistician), 46, pp. 387-398. doi: 10.1111/1467-9884.00091.
Kamburowski, J. (1992). Bounding the distribution of project duration in PERT networks. Operations Research Letters, 12(1), pp. 17-22.
Kamburowski, J. (1997). New validations of PERT times. Omega, 25(3), pp. 323-328.
Keefer, D. L., & Bodily, S. E. (1983). Three-point approximations for continuous random variables. Management Science, 29(5), pp. 595-609.
Kelley, J. E. (1961). Critical path planning and scheduling: Mathematical basis. Operations Research, 9(3), pp. 296-320.
Kelley, J. E. (1989). The origins of CPM: A personal history. PM Network, III(2) PMI: USA.
Kelley, J. E., & Walker, M. E. (1959). Critical path planning and scheduling. In: Proceedings of the Eastern Joint Computer Conference, 1-3 December 1959 Boston, MA, pp. 160-173.
Kim, S. (2010). Advanced Networking Technique. Kimoondang, South Korea.
Kim, S. (2012). CPM schedule summarizing function of the beeline diagramming method. Journal of Asian Architecture and Building Engineering, 11(2), pp. 367-374.
Klafszky, E. (1969). Hálózati folyamok (Network Flows). Bolyai Jáns Mathematical Society Akadémiai Kiadó, Budapest.
Kotiah, T. C. T., & Wallace, N. D. (1973). Another look at the PERT asssumptions. Management Science, 20(3-4), pp. 44-49.
Krishnamoorty, M. S., & Deon, N. (1979). Complexity of minimum-dummy-activities problem in a PERT Network. Networks, 9. pp. 189-194.
Lucko, G. (2009). Productivity Scheduling Method: Linear schedule analysis with singularity functions. Journal of Construction Engineering and Management, 135(4), pp. 246-253.
Malcolm, D. G., Roseboom, J. H., Clark, C. E., & Fazar W. (1959). Application of a technique for a research and development program evaluation. Operations Research, 7, pp. 646-669.
Malyusz, L., & Hajdu, M. (2009). How would you like it? Shorter or cheaper? Organization Technology and Management in Construction, 1(2), pp. 59-63.
Massay, R. S. (1963). Program evaluation review technique: Its origins and development. Master’s thesis, The American University, Washington, DC.
Meyer, W. L., & Shaffer, L. R. (1963). Extension of the Critical Path Method Through the Application of Integer Programming, Technical Report. Department of Civil Engineering, University of Illinois, Urbana, IL.
Mohan, S., Gopalakrishnan, M., Balasubramanian, H., & Chandrashekar, A. (2007). A lognormal approximation of activity duration in PERT using two time estimates. Journal of the Operational Research Society, 58, pp. 827-831.
Möhring, R. H., Skutella, M., & Stork, F. (2004). Scheduling with and/or precedence constraints. SIAM Journal on Computing, 33(2), pp. 393-415.
Plotnick, FL. (2004). Introduction to modified sequence logic. In: Conference Proceedings, PMICOS Conference, April 25, 2004, Montreal, QC.
Premachandra, I. M., & Gonzales, L. (1996). A simulation model solved the problem of scheduling drilling rigs at Clyde dam. Interfaces, 26(2), pp. 80-91.
Roy, G. B. (1959), Théorie des Graphes: Contribution de la théorie des graphes á l1 étude de certains problémes linéaries. In: Comptes rendus des Séances de l1 Acedémie des Sciences. séence du Avril, Gauthier-Villars, 1959, pp. 2437-2449.
Roy, G. B. (1960), Contribution de la théorie des graphes à l’étude de certains problems d’ordonnancement. In: Comptes rendus de la 2ème conférence internationale sur la recherché opérationnelle, Aix-en-Provence. English Universities Press, Londres, pp. 171-185.
Sasieni, M. W. (1986). A note on PERT times. Management Science, 32, pp. 405-406.
Schwindt, C., & Zimmermann, J. (2015). Handbook on Project Management and Scheduling. Springer, Switzerland (ISBN 978-3-319-05442-1).
Siemens, N. (1971). A simple time-cost trade-off algorithm. Management Science, 17(6), pp. 354-363.
Trietsch, D., Mazmanyan, L., Gevorgyan, L., & Baker, K. R. (2012). Modeling activity times by the Parkinson distribution with a lognormal core: Theory and validation. European Journal of Operations Research, 216(2), pp. 386-396.
Van Slyke, R. M. (1963). Monte Carlo methods and the PERT problem. Operational Research, 11, pp. 839-861.
Vanhoucke, M., & Coelho, J. (2016). An approach using SAT solvers for the RCPSP with logical constraints. European Journal of Operations Research, 249(2), pp. 577-591.
Yao, M., & Chu, W. (2007). A new approximation algorithm for obtaining the probability distribution function for project completion time. Computers and Mathematics with Applications, 54, pp. 282-295.
UnauthenticatedDownload Date | 2/22/17 1:40 PM