SIXTH GRADE PLANNING GUIDE · number line diagrams Ratio relationships between two quantities Unit...
41
SIXTH GRADE PLANNING GUIDE 2017 - 2018 HENRY COUNTY SCHOOLS
Transcript of SIXTH GRADE PLANNING GUIDE · number line diagrams Ratio relationships between two quantities Unit...
SIXTH GRADE
PLANNING GUIDE
OFFICE OF
2017 - 2018
HENRY COUNTY SCHOOLS

6th Grade Spaced Instructional Review Planning Sheet Henry County Schools - Office of Mathematics
2017 - 2018
© Paul J. Riccomini 2016 [email protected]
Notes: Use assessment data from Teacher assessments (formal & informal), Progress Monitoring data sources, State Assessments, and other sources of information (teacher’s experience). Table abbreviated for space considerations. Created by Henry County teachers for Henry County teacher, June 2017 Teachers are expected to collaborate and plan in professional learning communities at their school and/or with other teachers throughout the district using this document as needed for support. 1
Block
of Time (6 weeks)
Big Ideas Covered (or specific skills)
Problematic Areas Problematic Areas Targeted for SIR
Date & Instructional Time Allotted
● 55-60 min. classes allot 10-15 minutes
● 90 min. classes allot 30 minutes
July 31 - September 1, 2017
● LCM ● GCF ● Multiplying and Dividing Fractions ● Dividing with multi digit numbers
using standard algorithm ● Add, Subtract, multiply and divide
decimals using standard algorithm
● Dividing Fractions ● Long Division ● Dividing Decimals ● Difference between GCF
and LCM
● GCF/LCM ● Dividing Fractions
September 5, 2017
September 5 - October 6, 2017
● Ratio relationships between two quantities
● Unit rates (including pricing and speed)
● Equivalent ratio tables, tape diagrams, double number line diagrams, and equations
● Plotting equivalent ratios on a coordinate grid
● Percent of a quantity as a rate
● Conversion ● Percent ● Visual representations
(tables, tape diagrams, and double number lines)
● Percent ● Visual
representation
October 30, 2017

6th Grade Spaced Instructional Review Planning Sheet Henry County Schools - Office of Mathematics
2017 - 2018
© Paul J. Riccomini 2016 [email protected]
Notes: Use assessment data from Teacher assessments (formal & informal), Progress Monitoring data sources, State Assessments, and other sources of information (teacher’s experience). Table abbreviated for space considerations. Created by Henry County teachers for Henry County teacher, June 2017 Teachers are expected to collaborate and plan in professional learning communities at their school and/or with other teachers throughout the district using this document as needed for support. 2
● Converting measurement units within one system of measurement
October 9 - November 17, 2017
● Numerical expressions with whole number exponents
● Read, write and evaluate expressions with variables
● Parts of an expression ● Order of operations ● Use properties to generate equivalent
expressions ● Use GCF and the distributive property
to create equivalent expressions
● Order of operations ● Exponents ● Properties to generate
equivalent expressions ● Writing expressions
● Writing expressions ● Order of operations
December 11, 2017
November 27 - December
22, 2017
● Identifying values that make an equation or inequality true
● Write expressions using numbers and variables to solve a real world problem
● Write and solve one-step equations (mathematical and real world problems)
● Write and solve one-step inequalities (mathematical and real world
● Inequalities on a number line
● Identifying values which make an equation or inequality true
● Writing equations and inequalities
● Writing equations and inequalities
January 29, 2018

6th Grade Spaced Instructional Review Planning Sheet Henry County Schools - Office of Mathematics
2017 - 2018
© Paul J. Riccomini 2016 [email protected]
Notes: Use assessment data from Teacher assessments (formal & informal), Progress Monitoring data sources, State Assessments, and other sources of information (teacher’s experience). Table abbreviated for space considerations. Created by Henry County teachers for Henry County teacher, June 2017 Teachers are expected to collaborate and plan in professional learning communities at their school and/or with other teachers throughout the district using this document as needed for support. 3
problems); represent solutions on on number line diagrams
● Ratio relationships between two quantities
● Unit rates (including pricing and speed)
● Equivalent ratio tables, tape diagrams, double number line diagrams, and equations
● Plotting equivalent ratios on a coordinate grid
● Percents of a quantity as a rate ● Converting measurement units within
one system of measurement January 9 – February 9, 2018
● Calculate area of triangles, quadrilaterals and other polygons by composing and decomposing the figures
● Find volume of a rectangular prism with fractional edge lengths by packing it with unit cubes of the appropriate unit lengths
● Calculating surface area of three dimensional figures using nets
● Surface area (calculating)
● Volume with fractional edge lengths
● Surface Area (Calculating)
● Calculating volume with fractional edge length
January 29, 2018
6th Grade Spaced Instructional Review Planning Sheet Henry County Schools - Office of Mathematics
2017 - 2018
© Paul J. Riccomini 2016 [email protected]
Notes: Use assessment data from Teacher assessments (formal & informal), Progress Monitoring data sources, State Assessments, and other sources of information (teacher’s experience). Table abbreviated for space considerations. Created by Henry County teachers for Henry County teacher, June 2017 Teachers are expected to collaborate and plan in professional learning communities at their school and/or with other teachers throughout the district using this document as needed for support. 4
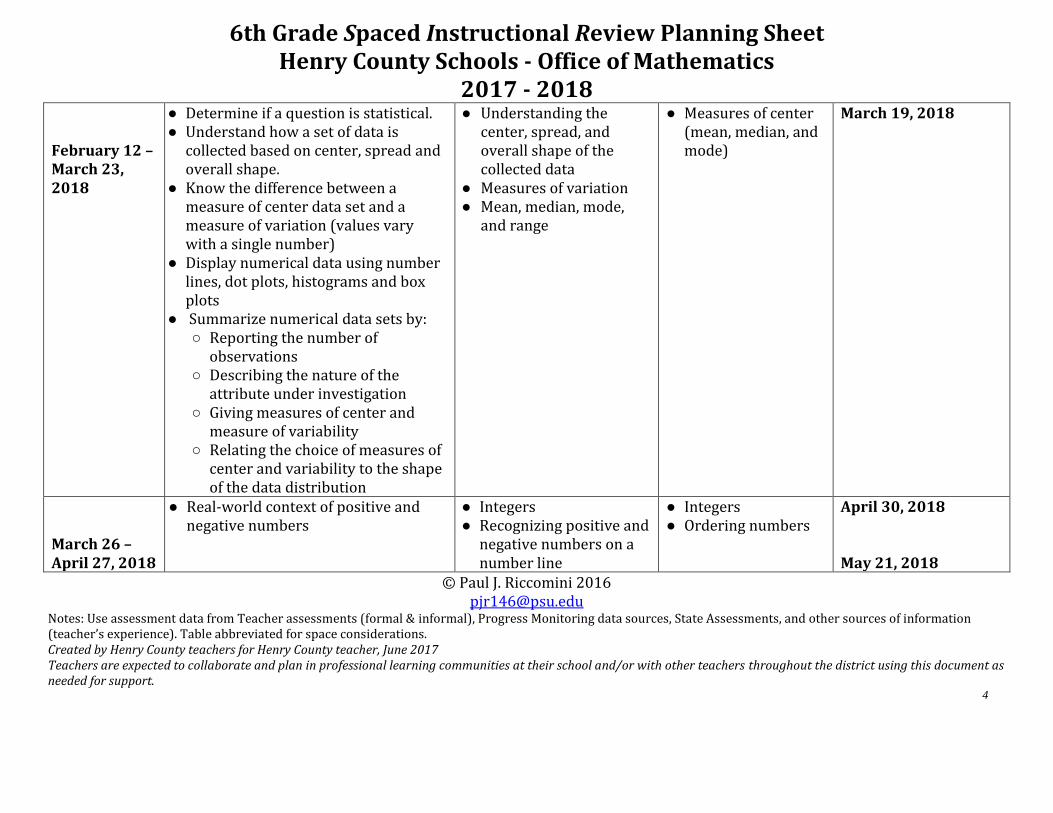
February 12 – March 23, 2018
● Determine if a question is statistical. ● Understand how a set of data is
collected based on center, spread and overall shape.
● Know the difference between a measure of center data set and a measure of variation (values vary with a single number)
● Display numerical data using number lines, dot plots, histograms and box plots
● Summarize numerical data sets by: ○ Reporting the number of
observations ○ Describing the nature of the
attribute under investigation ○ Giving measures of center and
measure of variability ○ Relating the choice of measures of
center and variability to the shape of the data distribution
● Understanding the center, spread, and overall shape of the collected data
● Measures of variation ● Mean, median, mode,
and range
● Measures of center (mean, median, and mode)
March 19, 2018
March 26 – April 27, 2018
● Real-world context of positive and negative numbers
● Integers ● Recognizing positive and
negative numbers on a number line
● Integers ● Ordering numbers
April 30, 2018 May 21, 2018

6th Grade Spaced Instructional Review Planning Sheet Henry County Schools - Office of Mathematics
2017 - 2018
© Paul J. Riccomini 2016 [email protected]
Notes: Use assessment data from Teacher assessments (formal & informal), Progress Monitoring data sources, State Assessments, and other sources of information (teacher’s experience). Table abbreviated for space considerations. Created by Henry County teachers for Henry County teacher, June 2017 Teachers are expected to collaborate and plan in professional learning communities at their school and/or with other teachers throughout the district using this document as needed for support. 5
● Positive and negative numbers (integers) on a number line and coordinate plane
● Opposite numbers and absolute values
● Ordering absolute values and rational numbers
● Polygons on a coordinate plane (finding length and missing sides with the same first or second coordinate)
● Absolute value ● Ordering numbers

1
2 3 4 5 6 7 8
9 10 11 12 13 14 15
16 17 18 19 20 21 22
23 24 25 26 27 28 29
30 31
© 2013 Vertex42 LLC. Free to print.
PRE-PLANNING
Notes:
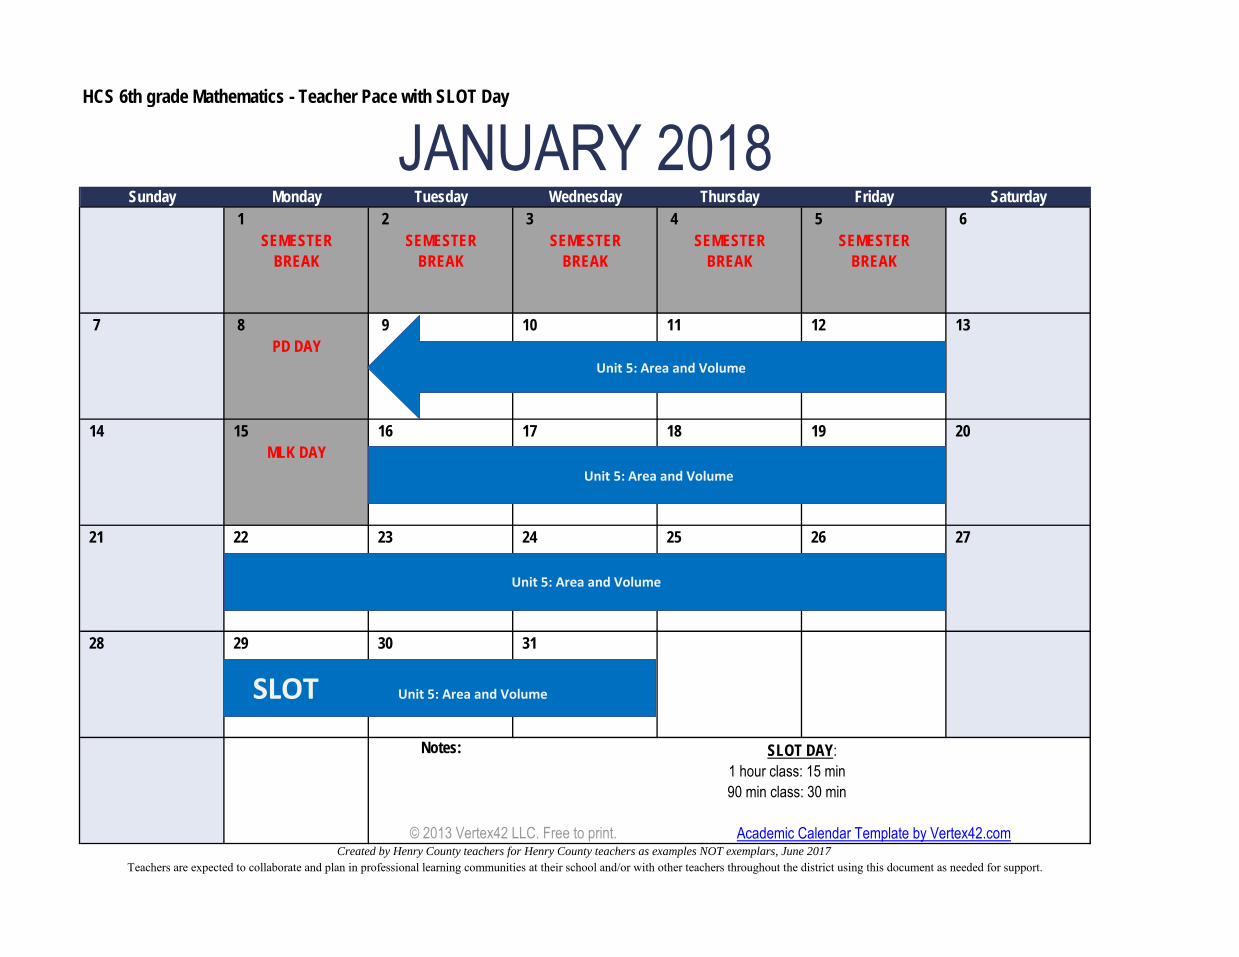
90 min class: 30 min 1 hour class: 15 min
SLOT DAY:
Academic Calendar Template by Vertex42.com
PRE-PLANNING PRE-PLANNING
TuesdayMonday
Created by Henry County teachers for Henry County teachers as examples NOT exemplars, June 2017
PRE-PLANNING PRE-PLANNING
HCS 6th grade Mathematics - Teacher Pace with SLOT Day
Thursday Friday
JULY 2017WednesdaySunday Saturday
Teachers are expected to collaborate and plan in professional learning communities at their school and/or with other teachers throughout the district using this document as needed for support.
Unit 1

1 2 3 4 5
6 7 8 9 10 11 12
13 14 15 16 17 18 19
20 21 22 23 24 25 26
27 28 29 30 31
Academic Calendar Template by Vertex42.comCreated by Henry County teachers for Henry County teachers as examples NOT exemplars, June 2017
© 2013 Vertex42 LLC. Free to print.
SLOT DAY:Notes:
90 min class: 30 min 1 hour class: 15 min
Sunday Wednesday SaturdayThursday Friday
AUGUST 2017HCS 6th grade Mathematics - Teacher Pace with SLOT Day
TuesdayMonday
Teachers are expected to collaborate and plan in professional learning communities at their school and/or with other teachers throughout the district using this document as needed for support.
Unit 1: Number System Fluency
Unit 1: Number System Fluency
Unit 1: Number System Fluency
Unit 1: Number System Fluency
Unit 1: Number System Fluency

1 2
3 4 5 6 7 8 9
10 11 12 13 14 15 16
17 18 19 20 21 22 23
24 25 26 27 28 29 30
Academic Calendar Template by Vertex42.comCreated by Henry County teachers for Henry County teachers as examples NOT exemplars, June 2017
© 2013 Vertex42 LLC. Free to print.
SLOT DAY:Notes:
90 min class: 30 min 1 hour class: 15 min
Sunday Wednesday SaturdayThursday Friday
HCS 6th grade Mathematics - Teacher Pace with SLOT Day
SEPTEMBER 2017TuesdayMonday
FALL BREAK FALL BREAKFALL BREAK FALL BREAK FALL BREAK
Teachers are expected to collaborate and plan in professional learning communities at their school and/or with other teachers throughout the district using this document as needed for support.
LABOR DAY
Unit 1
SLOT Unit 2: Rate, Ratio and Proportional Reasoning Using Equivalent Fractions
Unit 2: Rate, Ratio and Proportional Reasoning Using Equivalent Fractions
Unit 2: Rate, Ratio and Proportional Reasoning Using Equivalent Fractions

1 2 3 4 5 6 7
8 9 10 11 12 13 14
15 16 17 18 19 20 21
22 23 24 25 26 27 28
29 30 31
PD DAY
90 min class: 30 min 1 hour class: 15 min
© 2013 Vertex42 LLC. Free to print.Created by Henry County teachers for Henry County teachers as examples NOT exemplars, June 2017
Academic Calendar Template by Vertex42.com
Notes: SLOT DAY:
Teachers are expected to collaborate and plan in professional learning communities at their school and/or with other teachers throughout the district using this document as needed for support.
HCS 6th grade Mathematics - Teacher Pace with SLOT Day
OCTOBER 2017Wednesday ThursdayMondaySunday Friday SaturdayTuesday
SLOT Unit 3: Expressions
SLOT
Unit 2: Rate, Ratio and Proportional Reasoning Using Equivalent Fractions
Unit 3: Expressions
Unit 3: Expressions
Unit 3: Expressions

1 2 3 4
5 6 7 8 9 10 11
12 13 14 15 16 17 18
19 20 21 22 23 24 25
26 27 28 29 30
PD DAY
BREAKTHANKSGIVING
Sunday
PD DAY
Saturday
HCS 6th grade Mathematics - Teacher Pace with SLOT Day
NOVEMBER 2017
Created by Henry County teachers for Henry County teachers as examples NOT exemplars, June 2017
90 min class: 30 min
THANKSGIVINGTHANKSGIVING
Friday
SLOT DAY:Notes:
BREAK
Academic Calendar Template by Vertex42.com© 2013 Vertex42 LLC. Free to print.
BREAKBREAKBREAK
1 hour class: 15 min
Monday
Teachers are expected to collaborate and plan in professional learning communities at their school and/or with other teachers throughout the district using this document as needed for support.
Wednesday ThursdayTuesday
THANKSGIVING THANKSGIVING
Unit 3: Expressions
Unit 3: Expressions
Unit 4: One-Step Equations and Inequalities
Unit 3: Expressions

1 2
3 4 5 6 7 8 9
10 11 12 13 14 15 16
17 18 19 20 21 22 23
24 25 26 27 28 29 30
31
Friday Saturday
DECEMBER 2017HCS 6th grade Mathematics - Teacher Pace with SLOT Day
ThursdayWednesdaySunday TuesdayMonday
BREAK
Academic Calendar Template by Vertex42.comCreated by Henry County teachers for Henry County teachers as examples NOT exemplars, June 2017
© 2013 Vertex42 LLC. Free to print.
BREAK
SLOT DAY:Notes: 1 hour class: 15 min 90 min class: 30 min
SEMESTERSEMESTERBREAKBREAK BREAK
SEMESTER
Teachers are expected to collaborate and plan in professional learning communities at their school and/or with other teachers throughout the district using this document as needed for support.
SEMESTER SEMESTER
Unit 4: One-Steph Equations and Inequalities
Unit 4: One -Step Equations and Inequalities
Unit 4: One Step Equations and
Inequalities
Unit 4: One-Steph Equations and InequalitiesSLOT
1 2 3 4 5 6
7 8 9 10 11 12 13
14 15 16 17 18 19 20
21 22 23 24 25 26 27
28 29 30 31
Academic Calendar Template by Vertex42.comCreated by Henry County teachers for Henry County teachers as examples NOT exemplars, June 2017
© 2013 Vertex42 LLC. Free to print.
SLOT DAY:Notes:
90 min class: 30 min 1 hour class: 15 min
BREAKBREAKBREAK BREAK BREAK
Sunday Wednesday SaturdayThursday Friday
SEMESTERSEMESTER
HCS 6th grade Mathematics - Teacher Pace with SLOT Day
JANUARY 2018TuesdayMonday
SEMESTER SEMESTER SEMESTER
MLK DAY
Teachers are expected to collaborate and plan in professional learning communities at their school and/or with other teachers throughout the district using this document as needed for support.
PD DAYUnit 5: Area and Volume
Unit 5: Area and Volume
Unit 5: Area and Volume
SLOTSLOT Unit 5: Area and Volume

1 2 3
4 5 6 7 8 9 10
11 12 13 14 15 16 17
18 19 20 21 22 23 24
25 26 27 28
Sunday Monday
WINTERBREAK BREAK
WINTER WINTERBREAKWINTER
BREAK BREAKWINTER
90 min class: 30 min 1 hour class: 15 min
SLOT DAY:Notes:
Created by Henry County teachers for Henry County teachers as examples NOT exemplars, June 2017Academic Calendar Template by Vertex42.com© 2013 Vertex42 LLC. Free to print.
PD DAY
Teachers are expected to collaborate and plan in professional learning communities at their school and/or with other teachers throughout the district using this document as needed for support.
WednesdayTuesday
FEBRUARY 2018HCS 6th grade Mathematics - Teacher Pace with SLOT Day
SaturdayFridayThursday
Unit 5: Area and Volume
Unit 5: Area and Volume
Unit 6: Statistics
Unit 6: Statistics

1 2 3
4 5 6 7 8 9 10
11 12 13 14 15 16 17
18 19 20 21 22 23 24
25 26 27 28 29 30 31
SLOT DAY:
Academic Calendar Template by Vertex42.com© 2013 Vertex42 LLC. Free to print.
1 hour class: 15 minNotes:
Created by Henry County teachers for Henry County teachers as examples NOT exemplars, June 2017
90 min class: 30 min
Thursday FridayWednesday Saturday
HCS 6th grade Mathematics - Teacher Pace with SLOT Day
MARCH 2018TuesdayMondaySunday
Teachers are expected to collaborate and plan in professional learning communities at their school and/or with other teachers throughout the district using this document as needed for support.
PD DAYUnit 6: Statistics
Unit 6: Statistics
SLOT Unit 6: Statistics
Unit 7: Rational Explorations: Numbers and their Opposites
Unit 6: Statistics

1 2 3 4 5 6 7
8 9 10 11 12 13 14
15 16 17 18 19 20 21
22 23 24 25 26 27 28
29 30
1 hour class: 15 minSLOT DAY:Notes:
90 min class: 30 min
Academic Calendar Template by Vertex42.com© 2013 Vertex42 LLC. Free to print.Created by Henry County teachers for Henry County teachers as examples NOT exemplars, June 2017
APRIL 2018HCS 6th grade Mathematics - Teacher Pace with SLOT Day
Monday
SPRING SPRING SPRING SPRING
Wednesday Thursday SaturdayFridaySunday Tuesday
Teachers are expected to collaborate and plan in professional learning communities at their school and/or with other teachers throughout the district using this document as needed for support.
BREAK BREAK BREAKSPRING
BREAKBREAK
Unit 7: Rational Numbers and Their Opposites
SLOTEOG Testing
Unit 7: Rational Explorations: Numbers and Their Opposites
Unit 7: Rational Explorations: Numbers and Their Opposites
1 2 3 5
6 7 8 9 10 11 12
13 14 15 16 17 18 19
20 21 22 23 24 25 26
27 28 29 30 31
Sunday
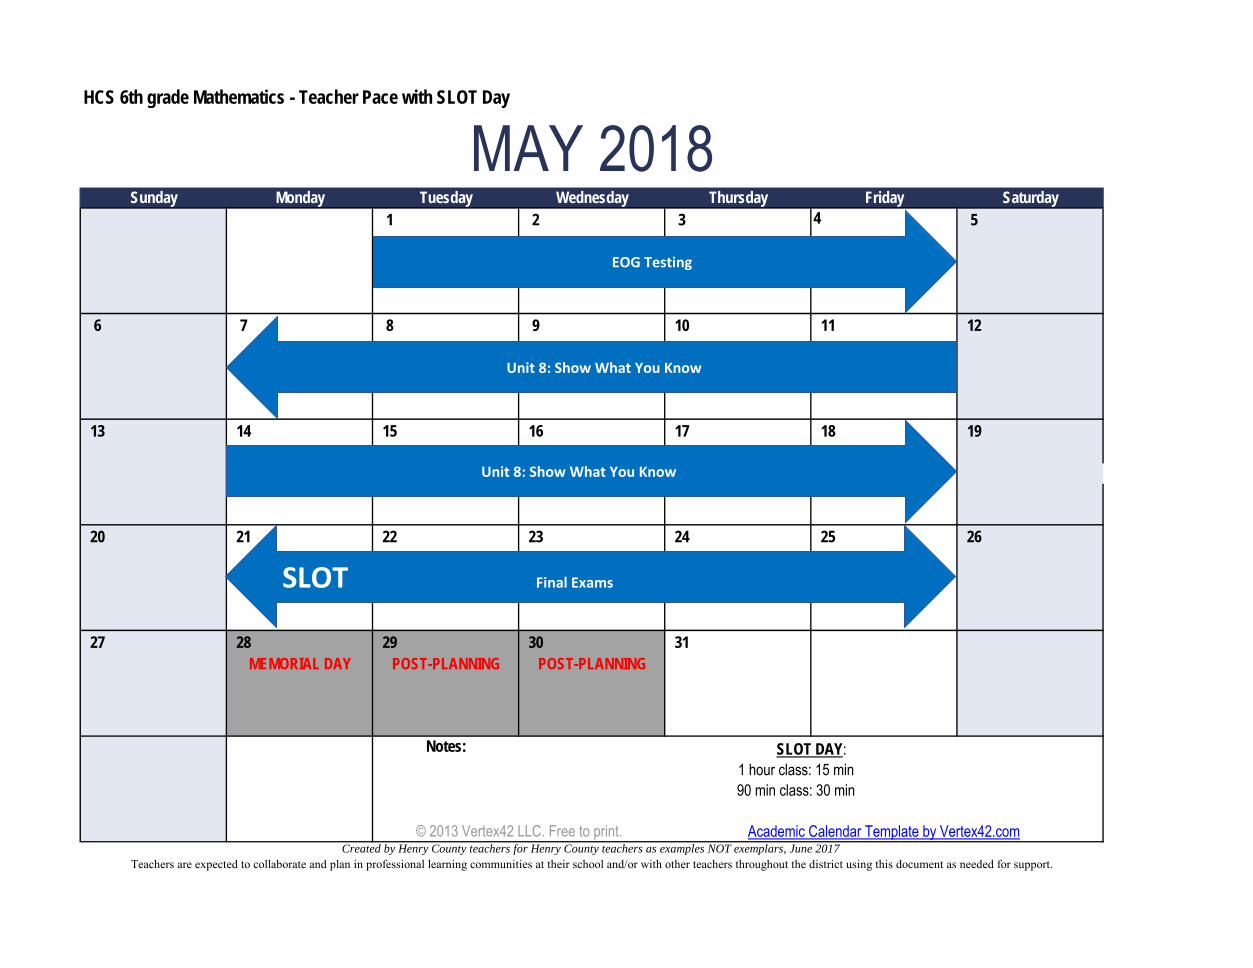
HCS 6th grade Mathematics - Teacher Pace with SLOT Day
MAY 2018TuesdayMonday Thursday Friday Saturday
© 2013 Vertex42 LLC. Free to print.
POST-PLANNING
90 min class: 30 min 1 hour class: 15 min
SLOT DAY:Notes:
Wednesday
POST-PLANNING
4
Teachers are expected to collaborate and plan in professional learning communities at their school and/or with other teachers throughout the district using this document as needed for support.Created by Henry County teachers for Henry County teachers as examples NOT exemplars, June 2017
Academic Calendar Template by Vertex42.com
MEMORIAL DAY
EOG Testing
SLOT Final Exams
Unit 8: Show What You Know
Unit 8: Show What You Know
Created by Henry County teachers for Henry County teachers as examples NOT exemplars, June 2017
Teachers are expected to collaborate and plan in professional learning communities at their school and/or with other teachers throughout the
district, using this document as needed for support.
1
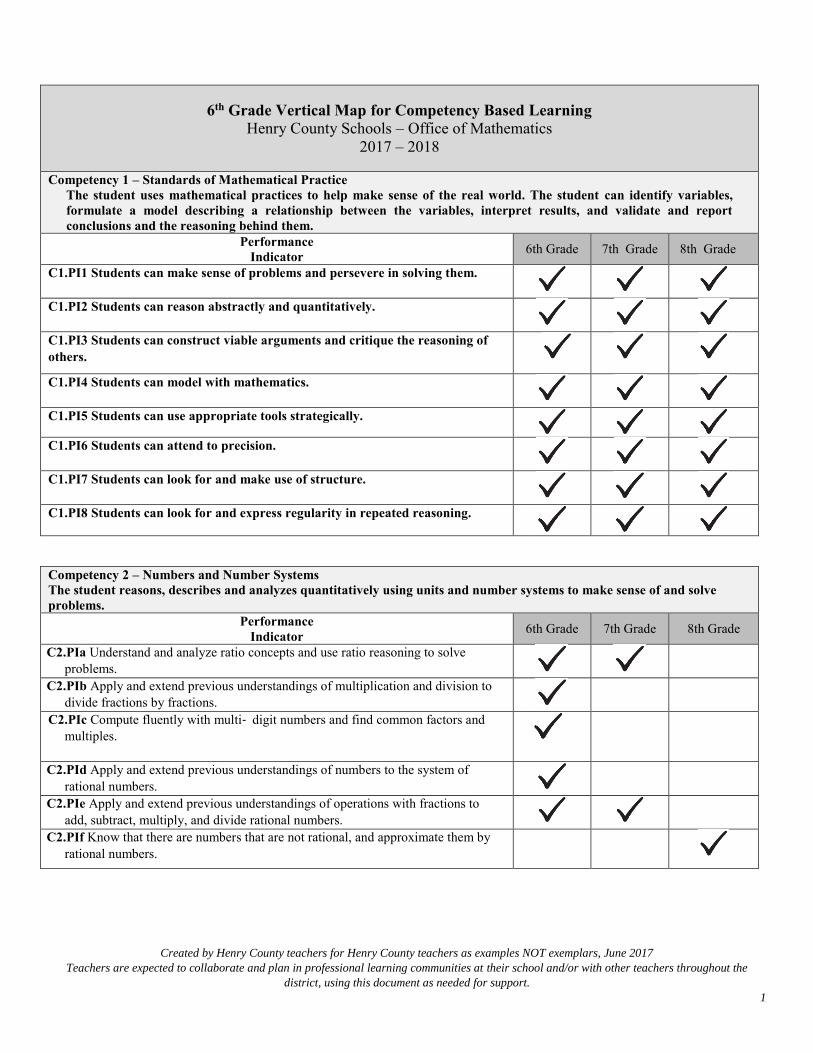
6th Grade Vertical Map for Competency Based Learning Henry County Schools – Office of Mathematics
2017 – 2018
Competency 1 – Standards of Mathematical Practice The student uses mathematical practices to help make sense of the real world. The student can identify variables, formulate a model describing a relationship between the variables, interpret results, and validate and report conclusions and the reasoning behind them.
Performance Indicator 6th Grade 7th Grade 8th Grade
C1.PI1 Students can make sense of problems and persevere in solving them. C1.PI2 Students can reason abstractly and quantitatively. C1.PI3 Students can construct viable arguments and critique the reasoning of others.
C1.PI4 Students can model with mathematics. C1.PI5 Students can use appropriate tools strategically.
C1.PI6 Students can attend to precision. C1.PI7 Students can look for and make use of structure. C1.PI8 Students can look for and express regularity in repeated reasoning.
Competency 2 – Numbers and Number Systems The student reasons, describes and analyzes quantitatively using units and number systems to make sense of and solve problems.
Performance Indicator 6th Grade 7th Grade 8th Grade
C2.PIa Understand and analyze ratio concepts and use ratio reasoning to solve problems.
C2.PIb Apply and extend previous understandings of multiplication and division to divide fractions by fractions.
C2.PIc Compute fluently with multi‐ digit numbers and find common factors and multiples.
C2.PId Apply and extend previous understandings of numbers to the system of rational numbers.
C2.PIe Apply and extend previous understandings of operations with fractions to add, subtract, multiply, and divide rational numbers.
C2.PIf Know that there are numbers that are not rational, and approximate them by rational numbers.

Created by Henry County teachers for Henry County teachers as examples NOT exemplars, June 2017
Teachers are expected to collaborate and plan in professional learning communities at their school and/or with other teachers throughout the
district, using this document as needed for support.
2
Competency 3 – Algebraic Structures The student creates, interprets, uses, and analyzes patterns of algebraic structures to make sense of problems.
Performance Indicator 6th Grade 7th Grade 8th Grade
C3.PIa Apply and extend previous understandings of arithmetic to algebraic expressions.
C3.PIb Reason about and solve one‐ variable equations and inequalities. C3.PIc Represent and analyze quantitative relationships between dependent and
independent variables C3.PId Use properties of operations to generate equivalent expressions.
C3.PIe Solve real‐ life and mathematical problems using numerical and algebraic
expressions and equations. C3.PIf Solve problems with radicals and/or integer exponents.
C3.PIg Understand the connections between proportional relationships, lines, and
linear equations.
C3.PIh Analyze and solve linear equations and pairs of simultaneous linear
equations.
C3.PIi Analyze proportional relationships and use them to solve real‐ world and
mathematical problems.
Competency 4 – Functions The student uses functions to interpret and analyze a variety of contexts. Functions describe situations where one quantity determines another.
Performance Indicator 6th Grade 7th Grade 8th Grade
C4.PIa The student can define, evaluate, and compare functions
C4.PIb The student can use functions to model relationships between quantities.
Competency 5 – Geometry The student proves, understands, and models geometric concepts using appropriate tools, theorems and constructions to solve problems and apply logical reasoning.
Performance Indicator 6th Grade 7th Grade 8th Grade
C5.PIa The student can solve real-world and mathematical problems involving angle measure, area, surface area, and volume
C5.PIb The students can draw, construct and describe geometrical figures and describe the relationships between them.
C5.PIc Understand congruence and similarity using physical models, transparencies, or geometry software.
C5.PId Understand and apply the Pythagorean Theorem.
C5.PIe Solve real-world and mathematical problems involving volume of cylinders, cones and spheres.
Created by Henry County teachers for Henry County teachers as examples NOT exemplars, June 2017
Teachers are expected to collaborate and plan in professional learning communities at their school and/or with other teachers throughout the
district, using this document as needed for support.
3
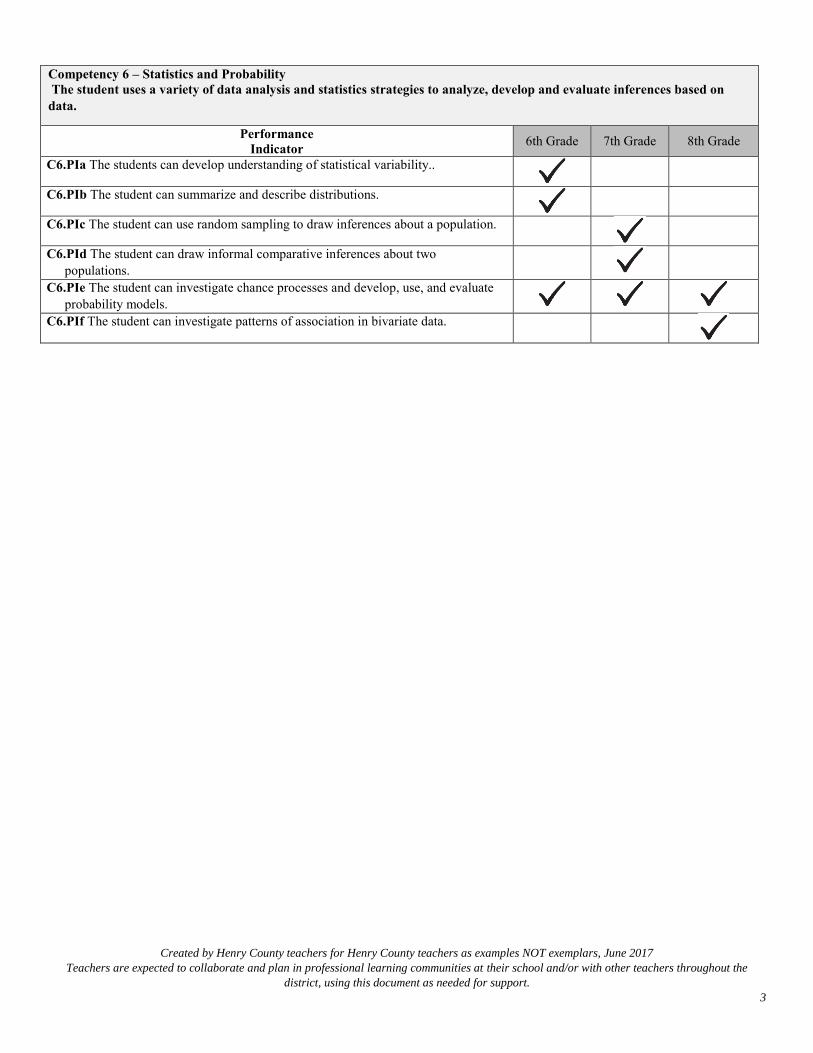
Competency 6 – Statistics and Probability The student uses a variety of data analysis and statistics strategies to analyze, develop and evaluate inferences based on data.
Performance Indicator 6th Grade 7th Grade 8th Grade
C6.PIa The students can develop understanding of statistical variability..
C6.PIb The student can summarize and describe distributions.
C6.PIc The student can use random sampling to draw inferences about a population.
C6.PId The student can draw informal comparative inferences about two populations.
C6.PIe The student can investigate chance processes and develop, use, and evaluate probability models.
C6.PIf The student can investigate patterns of association in bivariate data.

1 Created by Henry County teachers for Henry County teachers as examples NOT exemplars, June 2017
Teachers are expected to collaborate and plan in professional learning communities at their school and/or with other teachers throughout the district using this document as needed for support.
6th Grade Map for Competency Based Learning Henry County Schools – Office of Mathematics
2017 – 2018 Determine how many times each performance indicator is being addressed throughout the year and activities that students may do to show competency appropriate for the grade level or course. If the performance indicator is not fully assessed in the unit, leave the cell blank. Once this task is complete, delete the instructions.
Grade Span: 6-8 Competencies
Unit 1: Number System
Fluency Activities
Unit 2: Rate, Ratio and
Proportional Reasoning Using
Equivalent Fractions Activities
Unit 3: Expressions Activities
Unit 4: One-Step
Equations and Inequalities Activities
Unit 5: Area and Volume
Activities
Unit 6: Statistics Activities
Unit 7: Rational
Explorations: Numbers and
Their Opposites Activities
Competency 1: Standards of Mathematical Practice
District Benchmark Codes for Illuminate:
(Pre): 16981 (Post): 16979
OR
State Frameworks Culminating Task “Pick A Number,
Any Number” (pgs. 128-133)
District Benchmark Codes for Illuminate:
(Pre): 16978 (Post): 16910
OR
State Frameworks Culminating Task
“The Rocky Mountain
Vacation Trip” (pg. 69-77)
District Benchmark Codes for Illuminate:
(Pre): 16909 (Post): 16908
OR
State Frameworks Culminating Task
“Sweet Tooth Chocolate Shop”
(pg. 95-103)
District Benchmark Codes for Illuminate:
(Pre): 16907 (Post): 16906
OR
State Frameworks Culminating Task
“Want Ads” (pg. 71-77)
District Benchmark Codes for Illuminate:
(Pre): 16905 (Post): 16904
OR
State Frameworks Culminating Task
“STEM Fish Tank Foam Packaging
Design” (pg. 99-106)
District Benchmark Codes for Illuminate:
(Pre): 16903 (Post): 16896
OR
State Frameworks Culminating Task “Order Up Fast Food Frenzy”
(pg. 64-78)
District Benchmark Codes for Illuminate:
(Pre): 16902 (Post): 16901
OR
State Frameworks Culminating Task “Sounds of the
Band” (pg. 81-96)
C1.PI1 Students can make sense of problems and persevere in solving them.
Make sense of real-world fraction and decimal problem situations by representing the context in tactile and/or virtual manipulatives, visual, or algebraic models.
Understand the problem context in order to translate them into ratios/rates.
Make sense of expressions and formulas by connecting them to real world contexts when evaluating.
Choose the appropriate algebraic representations for given contexts and can create contexts given equations or inequalities.
Given a rectangular prisms, rectangular pyramids, triangular prisms, and triangular prisms, find surface area using the net. Solve problems by finding the volume of rectangular
Make sense of the data distributions by interpreting the measures of center and variability in the context of the situations they represent.
Make sense of problems involving points and polygons in the coordinate plane.
2 Created by Henry County teachers for Henry County teachers as examples NOT exemplars, June 2017
Teachers are expected to collaborate and plan in professional learning communities at their school and/or with other teachers throughout the district using this document as needed for support.
prisms with fractional edges. Decompose and compose polygons to find the area.
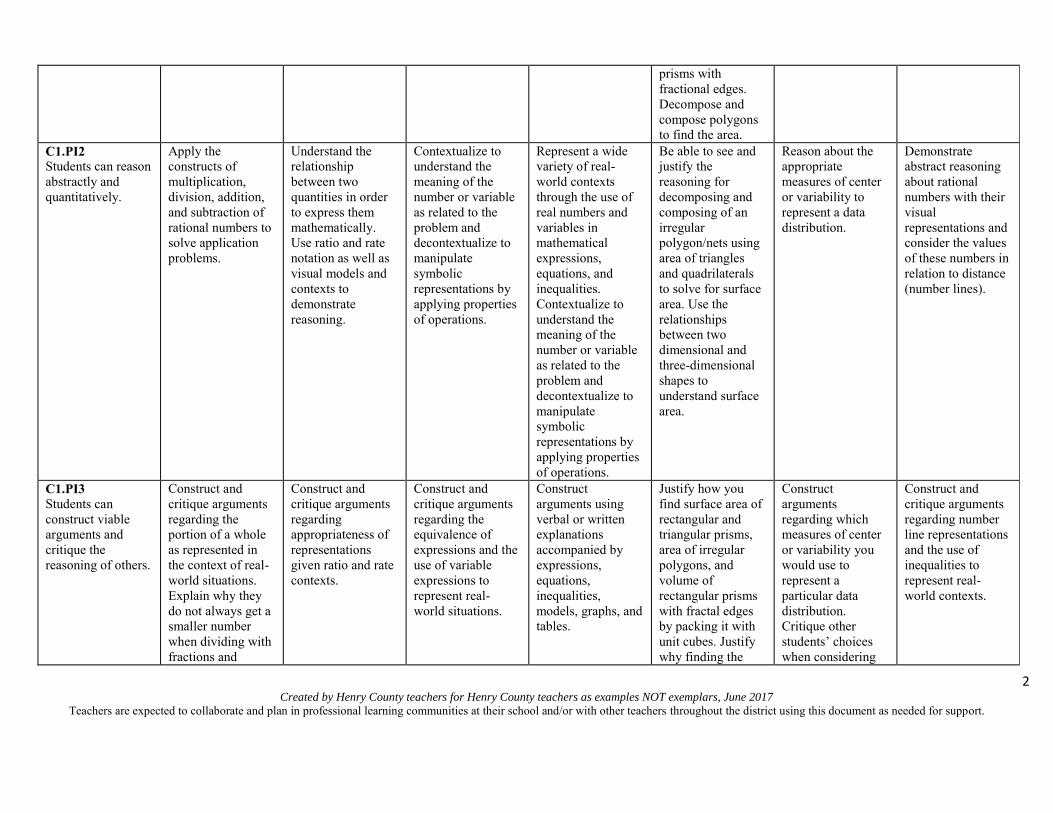
C1.PI2 Students can reason abstractly and quantitatively.
Apply the constructs of multiplication, division, addition, and subtraction of rational numbers to solve application problems.
Understand the relationship between two quantities in order to express them mathematically. Use ratio and rate notation as well as visual models and contexts to demonstrate reasoning.
Contextualize to understand the meaning of the number or variable as related to the problem and decontextualize to manipulate symbolic representations by applying properties of operations.
Represent a wide variety of real-world contexts through the use of real numbers and variables in mathematical expressions, equations, and inequalities. Contextualize to understand the meaning of the number or variable as related to the problem and decontextualize to manipulate symbolic representations by applying properties of operations.
Be able to see and justify the reasoning for decomposing and composing of an irregular polygon/nets using area of triangles and quadrilaterals to solve for surface area. Use the relationships between two dimensional and three-dimensional shapes to understand surface area.
Reason about the appropriate measures of center or variability to represent a data distribution.
Demonstrate abstract reasoning about rational numbers with their visual representations and consider the values of these numbers in relation to distance (number lines).
C1.PI3 Students can construct viable arguments and critique the reasoning of others.
Construct and critique arguments regarding the portion of a whole as represented in the context of real-world situations. Explain why they do not always get a smaller number when dividing with fractions and
Construct and critique arguments regarding appropriateness of representations given ratio and rate contexts.
Construct and critique arguments regarding the equivalence of expressions and the use of variable expressions to represent real-world situations.
Construct arguments using verbal or written explanations accompanied by expressions, equations, inequalities, models, graphs, and tables.
Justify how you find surface area of rectangular and triangular prisms, area of irregular polygons, and volume of rectangular prisms with fractal edges by packing it with unit cubes. Justify why finding the
Construct arguments regarding which measures of center or variability you would use to represent a particular data distribution. Critique other students’ choices when considering
Construct and critique arguments regarding number line representations and the use of inequalities to represent real-world contexts.

3 Created by Henry County teachers for Henry County teachers as examples NOT exemplars, June 2017
Teachers are expected to collaborate and plan in professional learning communities at their school and/or with other teachers throughout the district using this document as needed for support.
decimals. Reason the steps in modeling division of fractions.
volume of a rectangular prisms by multiplying the length by the width by the height is the same as multiply the area of the base by the height. Review solutions and justify (verbally and written) why the solutions are reasonable.
how outliers are handled in each situation.
C1.PI4 Students can model with mathematics.
Model real-world situations to show division of fractions. Use number lines and tape diagrams to find least common multiple and greatest common factor.
Model problem situations symbolically (tables, expressions or equations), visually (graphs or diagrams) and contextually to form real-world connections.
Form expressions from real world contexts. Students use algebra tiles to model algebraic expressions.
Model problem situations in symbolic, graphic, tabular, and contextual formats. Form expressions, equations, and inequalities from real-world contexts and connect symbolic and visual representations.
Use hands on/virtual manipulatives for two-dimensional and three-dimensional shapes. Students will draw irregular polygons and decompose into triangles and special quadrilaterals.
Use measures of center and variability and data displays (i.e. box plots and histograms) to draw inferences about and make comparisons between data sets. Collect data regarding real-world contexts and create models to display and interpret the data.
Use number lines to compare numbers and represent inequalities in mathematical and real-world contexts.
C1.PI5 Students can use appropriate tools strategically.
Use visual or concrete tools for division of fractions with understanding.
Choose appropriate models for a given situation, including tables, expressions or equations, tape diagrams, number line models, etc.
Determine which algebraic representations are appropriate for given contexts.
Use number lines to graph equations and inequalities. Use tables to organize information to write equations and inequalities.
Use a ruler, graph paper two-dimensional and three-dimensional shapes to solve for area, volume and surface area. Determine appropriate area
Consider available tools (including estimation and technology) when answering questions about data or representing data distributions.
Select and use tools such as two-color counters, number line models and the coordinate plane to represent situations involving positive and negative numbers.

4 Created by Henry County teachers for Henry County teachers as examples NOT exemplars, June 2017
Teachers are expected to collaborate and plan in professional learning communities at their school and/or with other teachers throughout the district using this document as needed for support.
formulas to use for given situations.
C1.PI6 Students can attend to precision.
Attend to the language of problems to determine appropriate representations and operations for solving real-world problems and the precision of correct decimal placement used in real-world problems.
Use and interpret mathematical language to make sense of ratios and rates.
Use the language of real-world situations to create appropriate expressions.
Precisely define variables.
Use appropriate measurement units (square units and cubic units) and correct terminology to justify reasonable solutions.
Use appropriate terminology when referring data displays and statistical measures.
Attend to the language of real-world situations to determine if positive or negative quantities/distances are being represented.
C1.PI7 Students can look for and make use of structure.
Examine the relationship of rational numbers to the number line and the place value structure as related to multi-digit operations.
Recognize patterns that exist in ratio tables. Use knowledge of the structures of word problems to make sense of real-world problems.
Apply properties to generate equivalent expressions and interpret the structure of an expression in terms of a context. Identify a “term” in an expression.
Seek patterns or structures to model and solve problems using tables, equations and inequalities. Apply properties to generate equivalent expressions and solve equations.
Understand the relationship between the structure of a three-dimensional shape and its volume formula and decompose two-dimensional figures to find areas.
Examine the structure of data representations by examining intervals, units, and scale in box plots, line plots, histograms and dot plots.
Relate the structure of number lines to values of rational numbers as they use the coordinate plane.
C1.PI8 Students can look for and express regularity in repeated reasoning.
Demonstrate repeated reasoning when dividing fractions by fractions and connect the inverse relationship to multiplication and use repeated reasoning when solving real-world problems using rational numbers.
Utilize repeated reasoning by applying their knowledge of ratio, rate and problem solving structures to new contexts. Generalize the relationship between representations, understanding that all formats represent the same
Work with expressions involving variables without the focus on a specific number or numbers that the variable may represent and focus on the patterns that lead to generalizations. Work with the structure of the distributive
Generalize effective processes for representing equations and inequalities based upon experiences.
Explain why formula or process is used to solve given problems and use properties of figures and properties of operations to connect formulas to surface area and volume.
Recognize typical situations in which outliers skew data and explain patterns in the way data is interpreted in the various representations.
Relate new experiences to experiences with similar contexts when studying positive and negative representations of distance and quantity and demonstrate repeated reasoning by showing that both positive and

5 Created by Henry County teachers for Henry County teachers as examples NOT exemplars, June 2017
Teachers are expected to collaborate and plan in professional learning communities at their school and/or with other teachers throughout the district using this document as needed for support.
ratio or rate. property. negative quantities represent the same distance from zero.
Competency 2: Numbers and Number Systems
C2.PIa Understand and analyze ration concepts and use ration reasoning to solve problems.
Understand the concept of ratio and rate and use reasoning to solve real-world problems using tables, tape diagrams, number lines and/or equations. Solve unit rate, percent and measurement conversion problems.
C2.PIb Apply and extend previous understandings of multiplication and division to divide fractions by fractions.
Divide fractions by fractions using models and equations.
C2.PIc Compute fluently with multi-digit numbers and find the common factors and multiples.
Divide multi-digit numbers. Find the GCF of two numbers and apply it to the distributive property. Find the LCM of two numbers and use to solve real-

6 Created by Henry County teachers for Henry County teachers as examples NOT exemplars, June 2017
Teachers are expected to collaborate and plan in professional learning communities at their school and/or with other teachers throughout the district using this document as needed for support.
world problems.
C2.PId Apply and extend previous understandings of numbers to the system or rational numbers.
Fluently perform all four operations with decimals.
Give real-life examples of positive and negative numbers. Understand opposites and absolute value. Graph in all four quadrants of the coordinate plane.
C2.PIe Apply and extend previous understandings of operations with fractions to add, subtract, multiply and divide rational numbers.
Fluently perform all four operations with decimals.
Competency 3: Algebra and Algebraic Thinking
C3.PIa Apply and extend previous understandings of arithmetic to algebraic expressions.
Read, write and evaluate expressions containing variables.
C3.PIb
Reason about and solve one‐variable equations and inequalities.
Evaluate one-step equations and inequalities

7 Created by Henry County teachers for Henry County teachers as examples NOT exemplars, June 2017
Teachers are expected to collaborate and plan in professional learning communities at their school and/or with other teachers throughout the district using this document as needed for support.
C3.PIc Represent and analyze quantitative relationships between dependent and independent variables
Write equations to express one quantity in terms of the other quantity and use graphs and table to relate them to the equation.
C3.PId Use properties of operations to generate equivalent expressions.
Apply the properties of operations to create equivalent expressions and identify when two expressions are equivalent.
C3.PIe Solve real‐life and mathematical problems using numerical and algebraic expressions and equations.
Evaluate expressions and perform Order of Operations.
C3.PIf Solve problems with radicals and/or integer exponents.
Perform Order of Operations.
C3.PIi Analyze proportional relationships and use them to solve real‐world and mathematical problems.
Use ratio and rate reasoning to solve problems using tables, tape diagrams, double number lines and/or equations.
Competency 4: Functions
C4.PIb The student can
Use ratio and rate reasoning to solve

8 Created by Henry County teachers for Henry County teachers as examples NOT exemplars, June 2017
Teachers are expected to collaborate and plan in professional learning communities at their school and/or with other teachers throughout the district using this document as needed for support.
use functions to model relationships between quantities.
problems using tables, tape diagrams, double number lines and/or equations.
Competency 5: Geometry
C5.PIa The student can solve real-world and mathematical problems involving angle measure, area, surface area, and volume
Find the area of regular and irregular polygons; find the volume of right rectangular prisms; find surface area of 3-D shapes using nets; Draw polygons in the coordinate plane using ordered pairs as vertices.
C5.PIb The students can draw, construct and describe geometrical figures and describe the relationships between them.
Find surface area of 3-D shapes using nets; Draw polygons in the coordinate plane using ordered pairs as vertices.
Competency 6: Statistics and Probability
C6.PIa. The students develop and understanding of statistical variability.
Recognize a statistical question. Difference between measures of center and measures of variability. Display data in dot plots, histograms
9 Created by Henry County teachers for Henry County teachers as examples NOT exemplars, June 2017
Teachers are expected to collaborate and plan in professional learning communities at their school and/or with other teachers throughout the district using this document as needed for support.
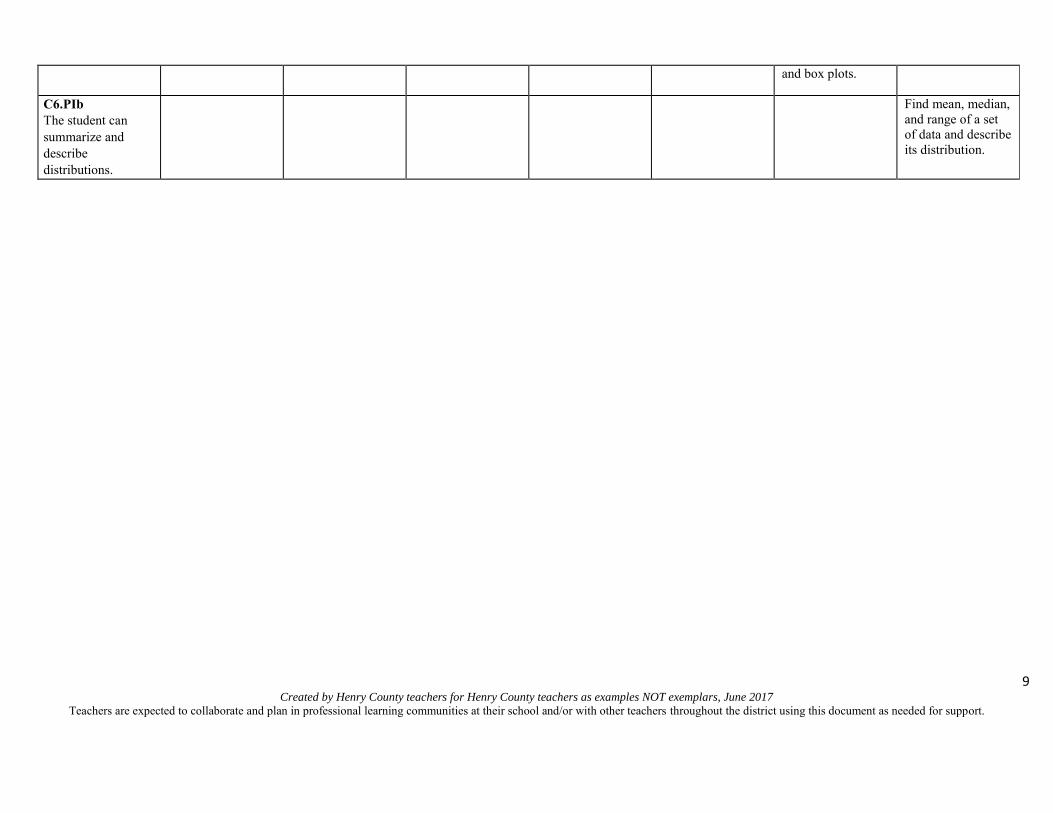
and box plots.
C6.PIb The student can summarize and describe distributions.
Find mean, median, and range of a set of data and describe its distribution.
Created by Henry County teachers for Henry County teachers as examples NOT exemplars, June 2017
Teachers are expected to collaborate and plan in professional learning communities at their school and/or with other teachers throughout the district using this document as needed for support.
. 1
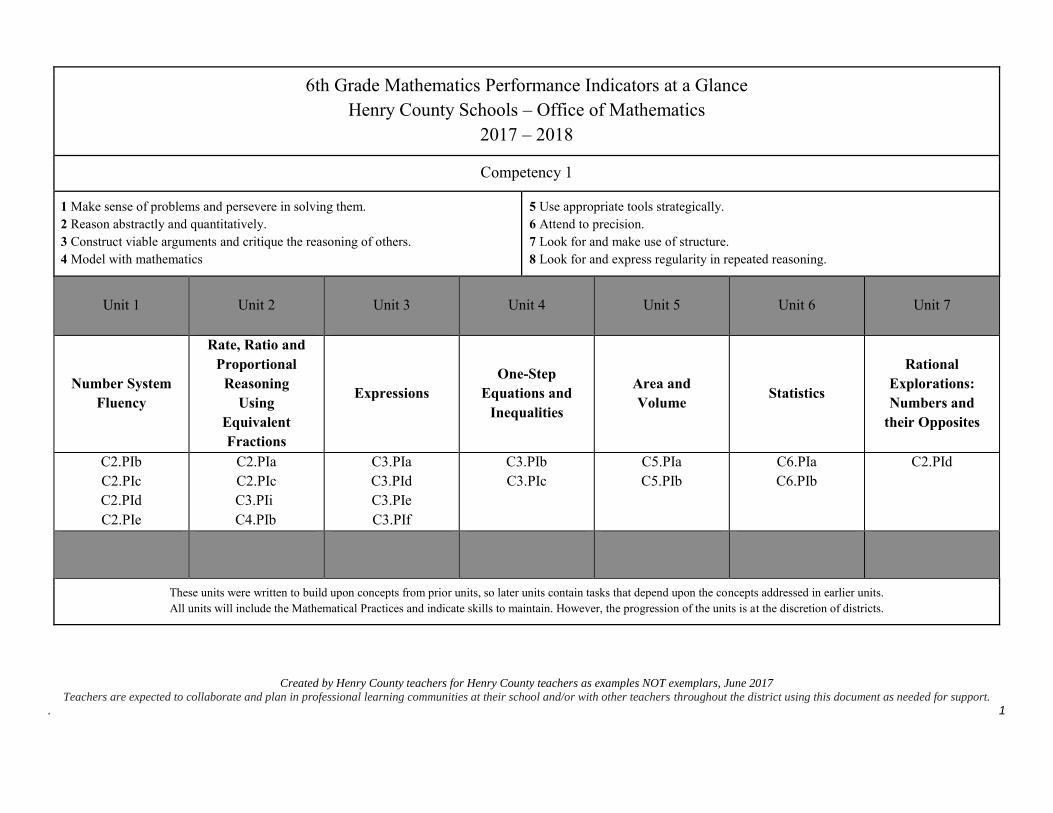
6th Grade Mathematics Performance Indicators at a Glance Henry County Schools – Office of Mathematics
2017 – 2018
Competency 1
1 Make sense of problems and persevere in solving them. 2 Reason abstractly and quantitatively. 3 Construct viable arguments and critique the reasoning of others. 4 Model with mathematics
5 Use appropriate tools strategically. 6 Attend to precision. 7 Look for and make use of structure. 8 Look for and express regularity in repeated reasoning.
Unit 1
Unit 2
Unit 3
Unit 4 Unit 5 Unit 6 Unit 7
Number System Fluency
Rate, Ratio and Proportional
Reasoning Using
Equivalent Fractions
Expressions One-Step
Equations and Inequalities
Area and Volume
Statistics
Rational Explorations: Numbers and
their Opposites
C2.PIb C2.PIc C2.PId C2.PIe
C2.PIa C2.PIc
C3.PIi C4.PIb
C3.PIa C3.PId C3.PIe C3.PIf
C3.PIb C3.PIc
C5.PIa C5.PIb
C6.PIa C6.PIb
C2.PId
These units were written to build upon concepts from prior units, so later units contain tasks that depend upon the concepts addressed in earlier units. All units will include the Mathematical Practices and indicate skills to maintain. However, the progression of the units is at the discretion of districts.
Created by Henry County teachers for Henry County teachers as examples NOT exemplars, June 2017
Teachers are expected to collaborate and plan in professional learning communities at their school and/or with other teachers throughout the district using this document as needed for support.
. 2
6th Grade Mathematics Performance Indicators at a Glance Henry County Schools – Office of Mathematics
2017 – 2018
Competency 1
1 Make sense of problems and persevere in solving them. 2 Reason abstractly and quantitatively. 3 Construct viable arguments and critique the reasoning of others. 4 Model with mathematics.
5 Use appropriate tools strategically. 6 Attend to precision. 7 Look for and make use of structure. 8 Look for and express regularity in repeated reasoning.
Performance Indicators
Unit 1 Unit 2
Number System Fluency Rate, Ratio and Proportional Reasoning Using Equivalent Fractions
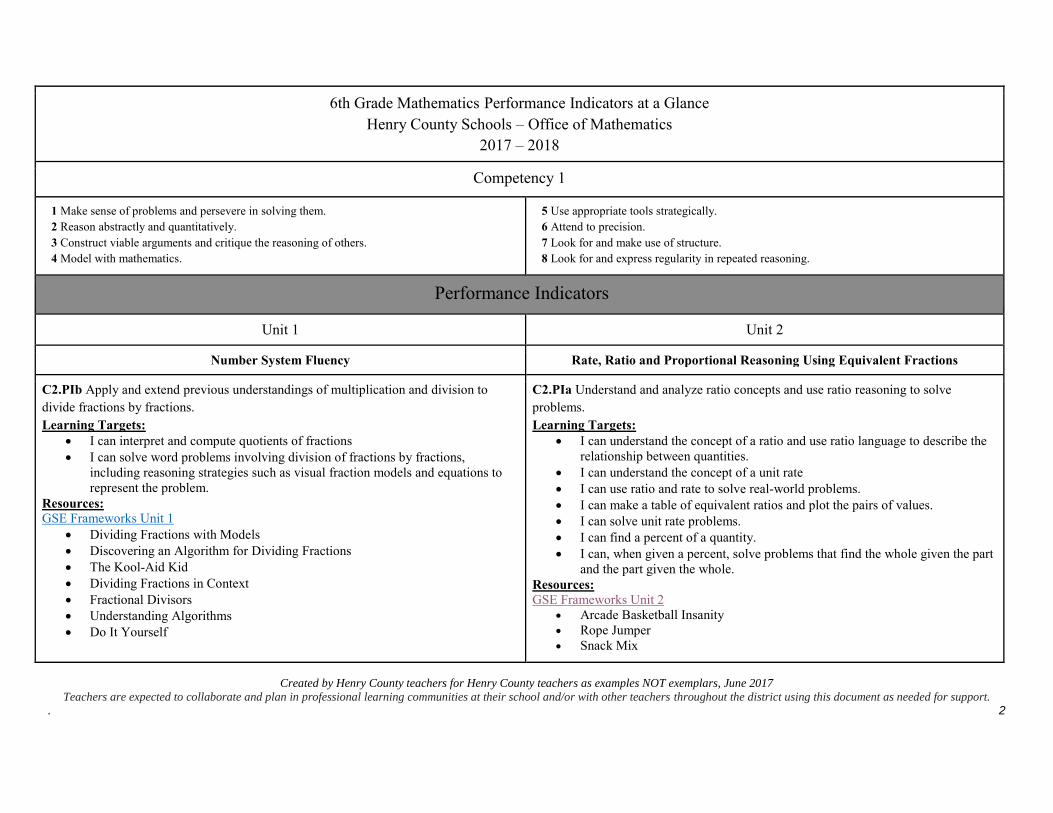
C2.PIb Apply and extend previous understandings of multiplication and division to divide fractions by fractions. Learning Targets:
I can interpret and compute quotients of fractions I can solve word problems involving division of fractions by fractions,
including reasoning strategies such as visual fraction models and equations to represent the problem.
Resources: GSE Frameworks Unit 1
Dividing Fractions with Models Discovering an Algorithm for Dividing Fractions The Kool-Aid Kid Dividing Fractions in Context Fractional Divisors Understanding Algorithms Do It Yourself
C2.PIa Understand and analyze ratio concepts and use ratio reasoning to solve problems. Learning Targets:
I can understand the concept of a ratio and use ratio language to describe the relationship between quantities.
I can understand the concept of a unit rate I can use ratio and rate to solve real-world problems. I can make a table of equivalent ratios and plot the pairs of values. I can solve unit rate problems. I can find a percent of a quantity. I can, when given a percent, solve problems that find the whole given the part
and the part given the whole. Resources: GSE Frameworks Unit 2
Arcade Basketball Insanity Rope Jumper Snack Mix

Created by Henry County teachers for Henry County teachers as examples NOT exemplars, June 2017
Teachers are expected to collaborate and plan in professional learning communities at their school and/or with other teachers throughout the district using this document as needed for support.
. 3
C2.PIc Compute fluently with multi‐digit numbers and find common factors and multiples. Learning Targets:
I can fluently divide multi-digit numbers. I can find the Least Common Multiple of two whole numbers and apply it to
real world problems. I can find the Greatest Common Factor of two whole numbers and use the
Distributive Property to rewrite the sum of two or more numbers as a product of their GCF and a sum of numbers with no common factor.
Resources: GSE Frameworks Unit 1
School Fundraiser Scaffolding Division Through Strip Model Diagramming Counting and Building Rectangles Factors and Multiples Puzzle Back to School Secret Number Let’s Distribute
C2.PId Apply and extend previous understandings of numbers to the system of rational numbers. Learning Targets:
I can fluently add, subtract, multiply and divide multi-digit decimals. Resources: GSE Frameworks Unit 1
Hanging by a Hair Estimating is the Root of Fluency (Adding and Subtracting Decimals) Where Does the Decimal Go? (Multiplying and Dividing Decimals)
C2.PIe Apply and extend previous understandings of operations with fractions to add, subtract, multiply, and divide rational numbers. Learning Targets:
I can fluently add, subtract, multiply and divide multi-digit decimals. Resources: GSE Frameworks Unit 1
Hanging by a Hair Estimating is the Root of Fluency (Adding and Subtracting Decimals) Where Does the Decimal Go? (Multiplying and Dividing Decimals)
Real??? World Ratios (Spotlight Task) Ratios and Rates Constant Dimensions How Many Noses are in Your Arms Reaching the Goal Free Comparing Rates Ice Cream or Cake?
C2.PIc Compute fluently with multi‐digit numbers and find common factors and multiples. Learning Targets:
I can fluently divide multi-digit numbers. I can find the Least Common Multiple of two whole numbers and apply it to
real world problems. I can find the Greatest Common Factor of two whole numbers and use the
Distributive Property to rewrite the sum of two or more numbers as a product of their GCF and a sum of numbers with no common factor.
Resources: C3.PIi Analyze proportional relationships and use them to solve real‐world and mathematical problems. Learning Targets:
I can use ratio and rate to solve real-world problems. Resources: GSE Frameworks Unit 4
It’s On Sale! The Catering Job
C4.PIb The student can use functions to model relationships between quantities. Learning Targets:
I can use ratio and rate to solve real-world problems. Resources:

Created by Henry County teachers for Henry County teachers as examples NOT exemplars, June 2017
Teachers are expected to collaborate and plan in professional learning communities at their school and/or with other teachers throughout the district using this document as needed for support.
. 4
6th Grade Mathematics Performance Indicators at a Glance Henry County Schools – Office of Mathematics
2017 – 2018
Competency 1
1 Make sense of problems and persevere in solving them. 2 Reason abstractly and quantitatively. 3 Construct viable arguments and critique the reasoning of others. 4 Model with mathematics.
5 Use appropriate tools strategically. 6 Attend to precision. 7 Look for and make use of structure. 8 Look for and express regularity in repeated reasoning.
Performance Indicators
Unit 3 Unit 4
Expressions One-step Equations and Inequalities
C3.PIa Apply and extend previous understandings of arithmetic to algebraic expressions. Learning Targets:
I can evaluate expressions containing variables. I can write algebraic expressions containing variables to stand for numbers. I can identify the parts of an expression.
Resources: GSE Frameworks Unit 3
Visual Patterns Perimeter and Area Expressions The Algebra of Magic, Parts 1 – 3 Writing Expressions Writing and Evaluating Expressions
C3.PId Use properties of operations to generate equivalent expressions. Learning Targets:
I can apply the properties of operations to create equivalent expressions. I can identify when two expressions are equivalent.
Resources:
C3.PIb Reason about and solve one‐variable equations and inequalities. Learning Targets:
I can substitute a given value for the variable in an equation or inequality to check if that value makes the equation or inequality true.
Resources: GSE Frameworks Unit 4
Set It Up Building with Toothpicks Fruit Punch Who Has Faulty Thinking? When Is It Not Equal?
C3.PIc Represent and analyze quantitative relationships between dependent and independent variables. Learning Targets:
I can use a variable to represent a number in an expression. I can write an equation to express one quantity in terms of another quantity. I can use graphs, tables and equations to model the same mathematical
relationship. Resources:

Created by Henry County teachers for Henry County teachers as examples NOT exemplars, June 2017
Teachers are expected to collaborate and plan in professional learning communities at their school and/or with other teachers throughout the district using this document as needed for support.
. 5
GSE Frameworks Unit 3 Conjectures About Properties Laws of Arithmetic Are We Equal?
C3.PIe Solve real‐life and mathematical problems using numerical and algebraic expressions and equations. Learning Targets:
I can evaluate expressions, including expressions that represent real-world problems.
Resources: See resources for C3.PIa
C3.PIf Solve problems with radicals and/or integer exponents. Learning Targets:
I can evaluate expressions containing variables. Resources: GSE Frameworks Unit 3
The Best Offer Exponents The Rules for Exponents
GSE Frameworks Unit 4 Graphing Stories Making Sense of Graphs Analyzing Tables

Created by Henry County teachers for Henry County teachers as examples NOT exemplars, June 2017
Teachers are expected to collaborate and plan in professional learning communities at their school and/or with other teachers throughout the district using this document as needed for support.
. 6
6th Grade Mathematics Performance Indicators at a Glance Henry County Schools – Office of Mathematics
2017 – 2018
Competency 1
1 Make sense of problems and persevere in solving them. 2 Reason abstractly and quantitatively. 3 Construct viable arguments and critique the reasoning of others. 4 Model with mathematics.
5 Use appropriate tools strategically. 6 Attend to precision. 7 Look for and make use of structure. 8 Look for and express regularity in repeated reasoning.
Performance Indicators
Unit 5
Unit 6
Area and Volume Statistics
C5.PIa The student can solve real‐world and mathematical problems involving angle measure, area, surface area, and volume. Learning Targets:
I can find the area of regular and irregular polygons. I can find the volume of right rectangular prisms. I can draw polygons on the coordinate plane by plotting their vertices and
connecting them. I can use nets to find the surface area of 3-dimensional figures.
Resources: GSE Frameworks Unit 5
Rectangle Wrap-Around Finding the Areas of Polygons What’s My Area? King Arthur’s New Table Finding Surface Area How Many Ways? Banana Bread Volume and Cubes Painting the Barn
C6.PIa The students can develop understanding of statistical variability. Learning Targets:
I can recognize a statistical question. I can find the measure of center for a numerical data set (mean, median) and a
measure of variation (range). I can display and interpret data on dot plots, histograms and box plots.
Resources: GSE Frameworks Unit 6
What is a Statistical Question? How Long is a Minute?
C6.PIb The student can summarize and describe distributions. Learning Targets:
I can display data in a graph and describe how the data are distributed. I can find the measure of center for a numerical data set (mean, median) and a
measure of variation (range). I can display and interpret data on dot plots, histograms and box plots. I can summarize data sets in relation to their context.

Created by Henry County teachers for Henry County teachers as examples NOT exemplars, June 2017
Teachers are expected to collaborate and plan in professional learning communities at their school and/or with other teachers throughout the district using this document as needed for support.
. 7
The File Cabinet
C5.PIb The students can draw, construct and describe geometrical figures and describe the relationships between them. Learning Targets:
I can draw polygons on the coordinate plane by plotting their vertices and connecting them.
I can use nets to find the surface area of 3-dimensional figures. Resources: GSE Frameworks Unit 5
Packaging Our Goods Designing Candy Cartons Candle Box Smoothie Box Boxing Bracelets
I can describe what is being measured, how it is being measured, and the units being used when a set of data is collected in a real-world context.
I can compare mean, median and mode and determine which is best to describe a data set.
Resources: GSE Frameworks Unit 6
Who Was the Greatest Yankee Home Run Hitter? Cost of Learning Where’s Waldo? Guinness Outliers
Created by Henry County teachers for Henry County teachers as examples NOT exemplars, June 2017
Teachers are expected to collaborate and plan in professional learning communities at their school and/or with other teachers throughout the district using this document as needed for support.
. 8
6th Grade Mathematics Performance Indicators at a Glance Henry County Schools – Office of Mathematics
2017 – 2018
Competency 1
1 Make sense of problems and persevere in solving them. 2 Reason abstractly and quantitatively. 3 Construct viable arguments and critique the reasoning of others. 4 Model with mathematics.
5 Use appropriate tools strategically. 6 Attend to precision. 7 Look for and make use of structure. 8 Look for and express regularity in repeated reasoning.
Performance Indicators
Unit 7
Rational Explorations: Numbers and their Opposites
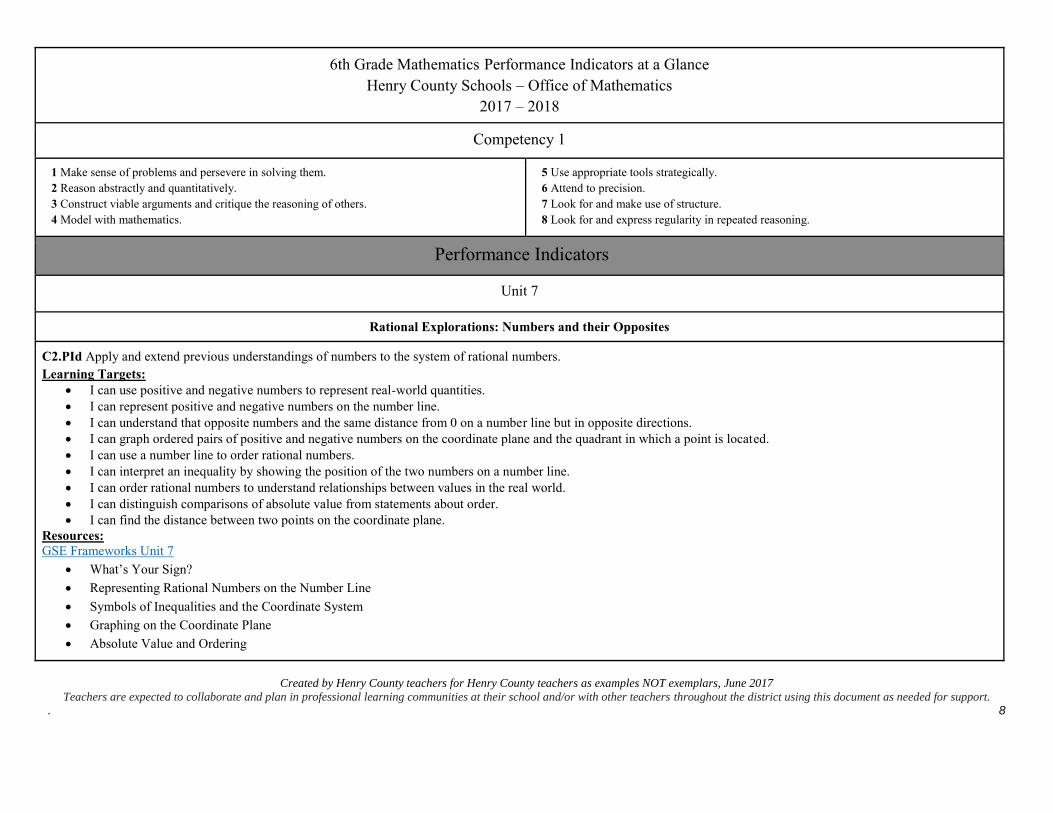
C2.PId Apply and extend previous understandings of numbers to the system of rational numbers. Learning Targets:
I can use positive and negative numbers to represent real-world quantities. I can represent positive and negative numbers on the number line. I can understand that opposite numbers and the same distance from 0 on a number line but in opposite directions. I can graph ordered pairs of positive and negative numbers on the coordinate plane and the quadrant in which a point is located. I can use a number line to order rational numbers. I can interpret an inequality by showing the position of the two numbers on a number line. I can order rational numbers to understand relationships between values in the real world. I can distinguish comparisons of absolute value from statements about order. I can find the distance between two points on the coordinate plane.
Resources: GSE Frameworks Unit 7
What’s Your Sign? Representing Rational Numbers on the Number Line Symbols of Inequalities and the Coordinate System Graphing on the Coordinate Plane Absolute Value and Ordering

Created by Henry County teachers for Henry County teachers as examples NOT exemplars, June 2017
Teachers are expected to collaborate and plan in professional learning communities at their school and/or with other teachers throughout the district using this document as needed for support.
. 9
Planning a Field Trip (Spotlight Task)

6th Grade
Unpacking Performance Indicators Henry County Schools-Office of Mathematics
Created by Henry County teachers for Henry County teachers as examples NOT exemplars, June 2016. Teachers, please work through this process in professional learning communities at your schools or with other teachers
throughout the district. 1
Time Map (to be completed by teacher along with lesson planning activities form omitted from this template) Duration of Lesson: ______________ Dates of Lesson ____________ Number of Elements in Standard: _________
Weight on Milestone Assessment: ________ Time for each element: (try to balance this for the duration of the lesson) ___________ / element Assessment Date(s): __________________________________________________
Graduation Competency 3: The student creates, interprets, uses, and analyzes patterns of algebraic structures to make sense of problems. Performance Indicator: b. Reason about and solve one-variable equations and inequalities.
Ultimate ELEMENT TYPE (place an X on one type)
___(K)nowledge __X__ (R)easoning ___ (S)Skill ___(P)roduct How will the ultimate target be assessed? (be sure the assessment type is appropriate for the type of target indicated above)
Use the chart below to identify the underpinning targets for the target (element) above. Follow the guidelines below.
K Standard
requires K
Target(s)
R Standard requires
K + R Targets
S Standard requires K + R + S Targets
P Standard requires
K + R + S* + P Targets *Not always

6th Grade
Unpacking Performance Indicators Henry County Schools-Office of Mathematics
Created by Henry County teachers for Henry County teachers as examples NOT exemplars, June 2016. Teachers, please work through this process in professional learning communities at your schools or with other teachers
throughout the district. 2
KNOWLEDGE:
1. Describe the components which transform an expression into an equation 2. Label the parts of an expression (coefficient, variable, term, constant) 3. Develop an initial conceptual understanding of different uses of variables 4. Recognize solving an equation or inequality as a process of answering “which values
from a specified set, if any, make the equation or inequality true. REASONING:
1. Evaluate which values from a specified set, if any, make an equation or inequality true. 2. Determine the value you of an unknown variable in a one variable equation.
PERFORMANCE SKILL: 1. Use substitution to determine whether a given number in a specified set makes and
equation or inequality true. PRODUCT:
1. Construct a model which proves a value makes an equation or inequality true.
*Will the targets identified above move the student toward overall mastery? Yes or No **If “YES,” write the targets in “student friendly” terms and add a stem.
***You may use: “I can…,” “I will be able to…,” “I am learning to…” etc.
STUDENT FRIENDLY LEARNING TARGETS FOR THE ELEMENT
KNOWLEDGE: (Use an ID system for the target i.e. K1 would be Knowledge target 1)
1. I can describe the components which transform an expression into an equation. 2. I can label the parts of an expression, which are term, variable, coefficient, and constant.

6th Grade
Unpacking Performance Indicators Henry County Schools-Office of Mathematics
Created by Henry County teachers for Henry County teachers as examples NOT exemplars, June 2016. Teachers, please work through this process in professional learning communities at your schools or with other teachers
throughout the district. 3
3. I can explain the usage and functionality of using variables when writing and evaluating equations.
4. I can recognize solving an equation or inequality as a process of answering “which values from a specified set, if any, make the equation or inequality true?”
REASONING:
1. I can evaluate which values from a specified set, if any make an equation or inequality true.
PERFORMANCE SKILL:
1. I can use substitution to determine whether a given number in a specified set makes an equation or inequality true.
PRODUCT:
1. I can use the solution to an equation or inequality to prove that a solution is correct.