Six Sigma and Quality Control design in the Laboratory
51
Six Sigma and Quality Control design in the Laboratory Sue Chan Chemopharm Sdn Bhd [email protected]
Transcript of Six Sigma and Quality Control design in the Laboratory

Agenda
• What is Six Sigma?
• How can we use Six Sigma in the Laboratory?
• Westgard Advisor and quality control design.
2

Six Sigma Introduction
• Six Sigma or also called Sigma Metrics was developed by Motorola in 1985.
• Created to help measure and improve the manufacturing production processes.
• In 1995 it became famous when General Electric successfully implemented this methodology.
3

Six Sigma Introduction
• Six Sigma is both a metric and a methodology.
• Six Sigma as a metric is used as a scale for quality.
• It measures DPMO (Defects Per one Million Opportunity’s)
4
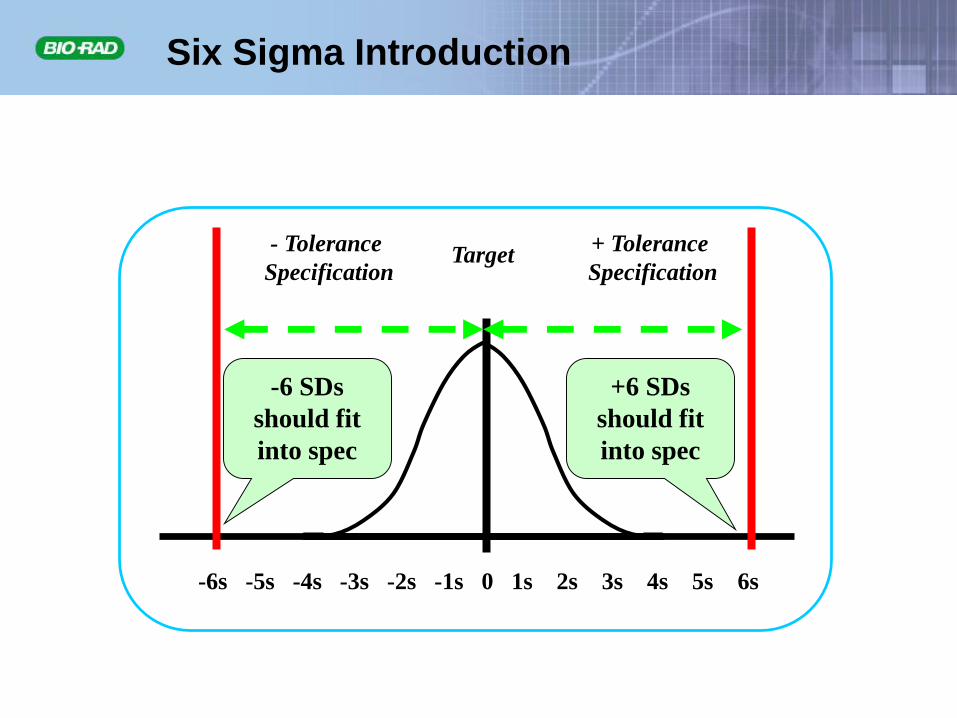
-6s -5s -4s -3s -2s -1s 0 1s 2s 3s 4s 5s 6s
- Tolerance
Specification
+ Tolerance
SpecificationTarget
+6 SDs
should fit
into spec
-6 SDs
should fit
into spec
Six Sigma Introduction

1.5s
shiftFew
defects
even with
1.5s shift
-6s -5s -4s -3s -2s -1s 0 1s 2s 3s 4s 5s 6s
Six Sigma Introduction

Six Sigma Introduction
7
World Class
Minimum for stable process
Sigma Metric DPM without shift DPM with 1.5s shift
1.0 317,400 697,700
2.0 45,400 308,637
2.5 12,419 158,686
3.0 2,700 66,807
3.5 465 22,750
4.0 63 6,210
4.5 6.8 1,350
5.0 0.57 233
5.5 0.038 32
6.0 0.002 3.4

Six Sigma Introduction
8
What’s good enough?
99% Good (3.8 Sigma) 99.99966% Good (6 Sigma)
20,000 lost articles of mail per hour (based on 2,000,000/hr)
7 articles lost per hour
5,000 incorrect surgical operations per
week
1.7 incorrect operations per week
2 short or long landings daily at an
airport with 200 flights/day
1 short or long landing every 5 years
2,000,000 wrong drug prescriptions
each year
680 wrong prescriptions per year
No electricity for almost 7 hours each
month
1 hour without electricity every 34
years

Six Sigma Introduction
9
Nevelainen et al. Evaluating laboratory performance with
the six sigma scale. Arch Pathol Lab Med 2000;124:516-9.
Q-Probe Quality Indicator % Error DPM Sigma
TDM timing errors 24.4 244,000 2.20
Cytology specimen adequacy 7.32 73,200 2.95
Surgical pathology specimen accessioning 3.4 34,000 3.30
PAP smear rescreening false negatives 2.4 24,000 3.45
Order accuracy 1.8 18,000 3.60
Surg path frozen sect diagnostic discordance 1.7 17,000 3.60
Duplicate test orders 1.52 15,200 3.65
Laboratory proficiency testing 0.9 9,000 3.85
Wristband errors (not banded) 0.65 6,500 4.00
Hematology specimen adequacy 0.38 3,800 4.15
Chemistry specimen adequacy 0.30 3,000 4.25
Reporting errors 0.0477 477 4.80

10
Quality Today
Analyte estimated
Cholesterol 2.9 - 3.0
Glucose 2.9 - 3.3
Calcium 2.8 - 3.0
Prothrombin Time 1.8
INR 2.4 - 3.5
Fibrinogen 1.8 - 3.2
Glycohemoglobin 1.9 - 2.6
PSA 1.2 - 1.8
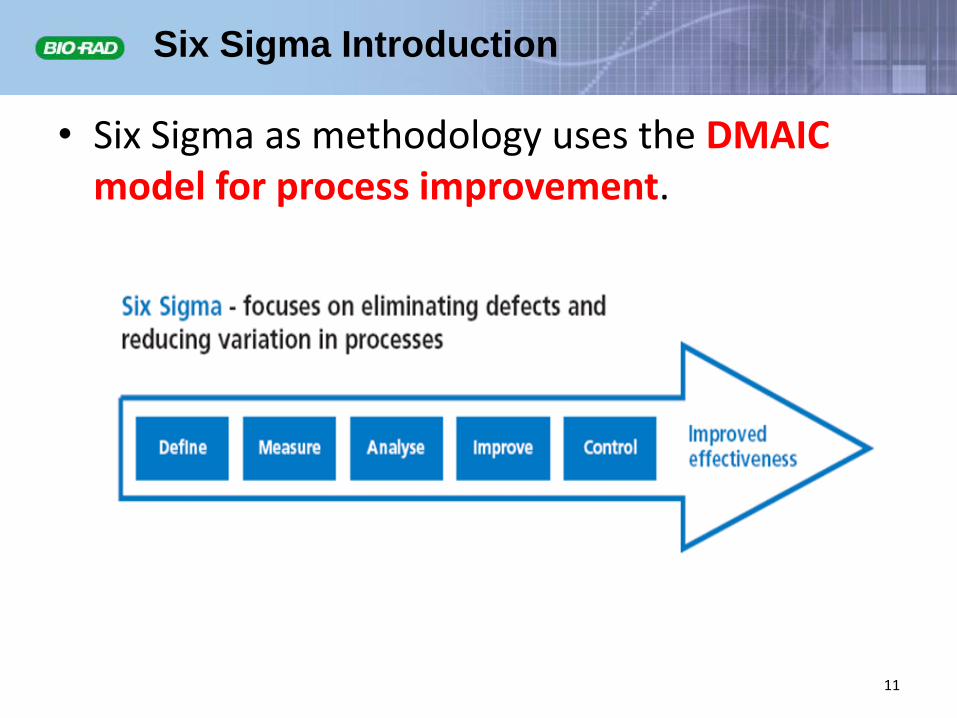
Six Sigma Introduction
• Six Sigma as methodology uses the DMAIC model for process improvement.
11

provides you with information
– it does not dictate your actions.
You must decide what to do with that
information!!!

Bad Sigma ???
False rejection often lead to a troubling cycleTrouble-shooting that chases the ghosts of
false rejectsMore calls to technical supportMore complaints to the manufacturer, longer
TAT.Increased field service visitsHigher dissatisfaction with the instrumentNeither the manufacturer nor the customer
are happy.

Six Sigma is still the goal!
Moving a Three Sigma process to Six Sigma is a
significant task
Raising the bar to Seven Sigma is not necessary.

What’s a Laboratory
Must Do?
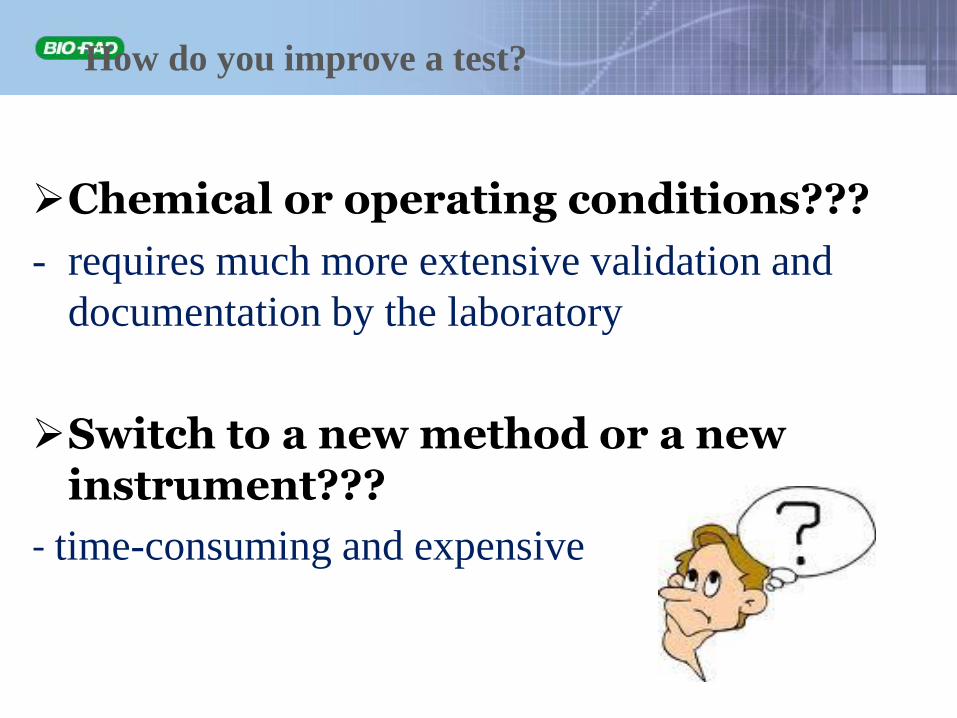
How do you improve a test?
Chemical or operating conditions???
- requires much more extensive validation and
documentation by the laboratory
Switch to a new method or a new instrument???
- time-consuming and expensive

18
Quality Planning
QualityAssessment
Quality Control
Quality Laboratory Processes
Quality Improvement
Criteria and benchmark
How to do about it
RunHow many?How often?Which one?
Making sense of data collected
Am I meeting to criteria?If not, how to improve?
Quality System
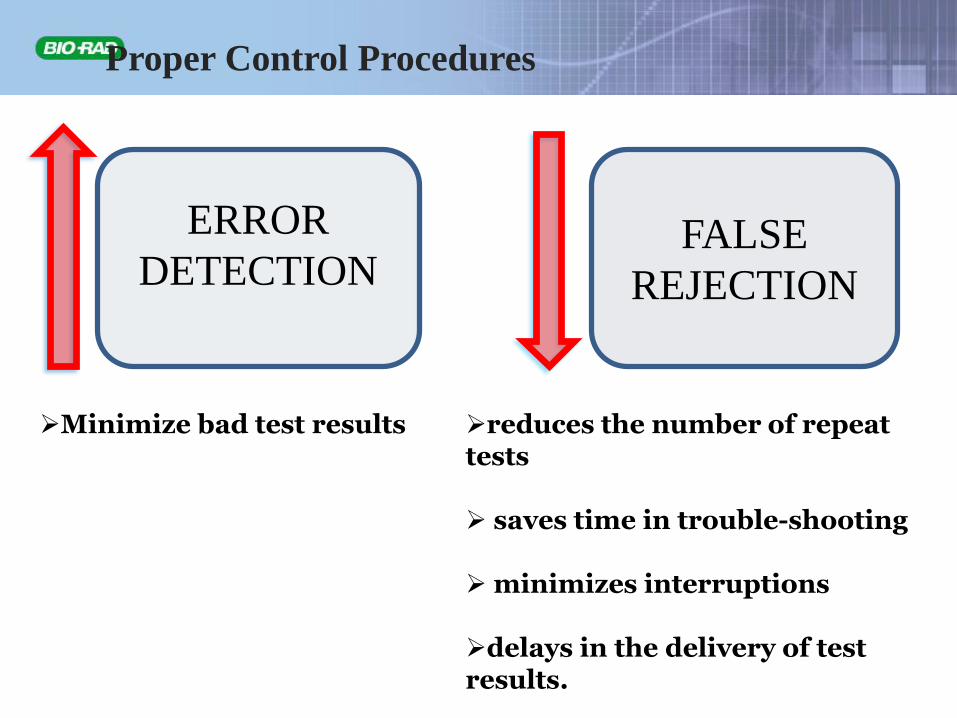
Proper Control Procedures
Minimize bad test results reduces the number of repeat tests
saves time in trouble-shooting
minimizes interruptions
delays in the delivery of test results.
ERROR
DETECTIONFALSE
REJECTION

Doctors will be happier with fast and accurate
test results.
Staff will be happier, too!
There is a huge financial impact in the
laboratory from both inadequate and
excessive quality control.
Six Sigma will help you manage your testing
processes to improve quality and productivity
and reduce costs.


Six Sigma in the Laboratory
• How can we use Six Sigma in the laboratory?
• Define the tolerance limits or quality requirements for a specific test. Specified as the Total Allowable Error (TEa).
• Measure the inaccuracy or bias and imprecision SD or CV for the specific test.
23

Source of CV

• Define your Total Allowable Error (TEa) for each analyte
Prioritization for TEa was established in 1999 at the Stockholm Conference, International Conference (IFCC, IUPAC, WHO) consensus for determining the quality specifications in the medical laboratory.
• Recommendations for choosing analytical goals:
1. Quality specifications in specific clinical situations2. Biological Variation or medical opinions3. Professional/ regulatory recommendations 4. State of the Art
Total Allowable Error (TEa)

Biological Variation table – Ricos et. al
Analyte
Biological Desirable
Variation specification
CVw CVg I(%) B(%) TE(%)
S- Albumin 3.1 4.2 1.6 1.3 3.9
U-
Albumin, concentration, first
morning 36 55 18 16.4 46.1
S- Aldosterone 29.4 40.1 14.7 12.4 36.7
U- Aldosterone, concentration 32.6 39 16.3 12.7 39.6
S- Alkaline phosphatase 6.4 24.8 3.2 6.4 11.7
S- Alkaline phosphatase, bone 6.2 35.6 3.1 9 14.1
S- Alkaline phosphatase, liver 10 27 5 7.2 15.4
U- Ammonia, output, 24h 24.7 27.3 12.4 9.2 29.6

27
Source of Bias
• Proficiency Testing program
• Interlaboratory Comparison program

Proficiency Testing Program

29
•Bias =Your mean – Peer mean
Peer mean X 100
•Example:
•Your mean = 2.15
•Peer mean = 2.80
•Bias = (2.15-2.80)/2.80 X100
= -7%
Interlaboratory Comparison Program

Interlaboratory Comparison Program

Six Sigma in the Laboratory
• Six Sigma = TEa - bias
CV
Example: TEa = 10 % CV = 2 % Bias = 0 %
Sigma = (10 – 0)/2 = 5
TEa = 10 % CV = 4 % Bias = 0 %
Sigma = (10 – 0)/4 = 2.5
TEa = 10 % CV = 2 % Bias = 2 %
Sigma = (10 – 2)/2 = 4
31

Six Sigma in the Laboratory
• What is the relationship between Six Sigma and QC?
• Critical Systematic Error (DSEcrit)
– Index used by Dr Westgard to describe size of error that needs to be detected by QC procedure
– DSEcrit = [(TEa – Bias)/CV] – 1.65
– Can relate DSEcrit to rejection characteristics of QC rules and numbers of QC measurements using known power curves
32

0.0
0.1
0.2
0.3
0.4
0.5
0.6
0.7
0.8
0.9
1.0
0.0 1.0 2.0 3.0 4.0
1.65 2.65 3.65 4.65 5.65
13s
/2of32s
/R4s
/31s
/6x
0.07 0.07 6 1
13s
/22s
/R4s
/41s
0.03 0.03 4 1
12.5s
0.04 0.04 4 1
12.5s
0.03 0.03 2 1
13s
/22s
/R4s
0.01 0.01 2 1
13s
0.00 0.00 2 1
13.5s
0.00 0.00 2 1
13s
0.00 0.00 1 1
Pfr
Ped
N R
Pro
bab
ility
fo
r R
eje
ctio
n (
P)
3 4 5 6
Desirable
Error
Detection
Desirable
False
Rejection
Systematic Error (SE, multiples of s)
Sigma Scale
Six Sigma in the Laboratory


Westgard Advisor 2.0
• Westgard Advisor meets lab need to implement and document Six Sigma and QC design.
• Westgard Advisor is integrated in Bio-Rad’sUnity Real Time 2.0 software.
• How do we get started?

Westgard Advisor 2.0 wizard
• Unity Real Time® 2 is regularly updated with these values necessary for calculating analytical goals.
• Specifications currently provided in Unity Real Time:
• User definable specification field available.
Biological Variation (Dr Ricos & Fraser) CLIA (Clinical Laboratory Improvement Amendments) RCPA (Royal College of Pathologist of Australasia) Rilibak (German Guidelines) IPH Belgium (Institute for Public Health Belgium) QMP-LS (Quality Management Program – Laboratory Services
Ontario Canada) Qualab (Committee for quality assurance – Switzerland)

Westgard Advisor 2.0 wizard
Select TEa

Westgard Advisor 2.0 wizard
• All current data and Westgard rules are displayed.

Westgard Advisor 2.0 wizard
• All Unity interlab comparaison data is available

Westgard Advisor 2.0 wizard
• Manual N selection upon practical request!!!
(always defined as multiple of levels used)

Select the date range
Select the level of the control, or select by performance
Select bias source(new user defined
setting)

Westgard Advisor 2.0 data grid

Westgard Advisor 2.0 data charts
Sigma Metrics Chart

Westgard Advisor 2.0 data charts
• OPSpecs chart
Region ofUnacceptablePerformance
Region ofmarginal
Performance
Region ofoptimal
Performance

Westgard Advisor 2.0 Advanced option
• New advanced option: will display all Westgard ruleselections and the corresponding Ped and Pfr.
• Listed by highest Detection Level and lowest Pfr, this is the used selection by the Westgard Advisor.

All selections can be displayed and/or applied in Unity Real Time.

Report example

Report example

Report example

Westgard Advisor 2.0
• Bio-Rad patented technology for automatedrule selection.
• Reduces false rejections and desensitization to false error flags.
• Selects optimal QC rules
• Integrates automatically in the Unity Real Time data managment software
• Now made even more practical for lab use.

1) Performance quantification using Six Sigma allows to tailorQC rules for every analyte
Use multirule QC when really needed
Simplify rules, after careful evaluation, when possible !
2) Sigma indexes are good indicators to monitor analyticalperformance
Quality requirements (TEa), imprecision and bias
in one equation !
Conclusion

Thank you