Copyright © 2013 Quintiles Quintiles Site Management Kim Davis, SSRM June 17, 2014.

Situational Analysis of Equityin Access to Quality Health
Care for Women and Childrenin VietnamPresentation by
Sarah Bales and Jim Knowles
Ha Long Bay, 8 April 2008

Organization of the Presentation• Purpose• Methodology• Main findings• Data gaps• Interventions to reduce inequality in
MCH• Conclusions

Purpose• Assess the extent of existing inequalities
in key MNCH outcomes• Assess changes over time in the
inequalities, where possible• Identify underlying factors most closely
associated with key MNCH outcomes• Assess the contributions of these factors
to the observed inequalities

Purpose (continued)• Focus is on inequalities, rather than national
averages• Focus is on income inequalities rather than
inequalities with respect to other factors (e.g.,gender, region, ethnicity)
• Why is it important to focus on inequalities?θ To sustain continued improvement in national
averagesθ To achieve an equitable distribution of the benefits of
economic development

Methodology
• Conceptual Framework• Measurement of inequality• Sources of inequality• Analysis of provincial-level data

Conceptual framework
Region levelProvince levelDistrict level
Commune levelVillage levelHousehold
Region levelProvince levelDistrict level
Commune levelVillage levelHousehold
Physical proximityQuality
Affordability
Physical proximityQuality
Affordability
AgeSex
EducationIncome
EthnicityReligionLocation
AgeSex
EducationIncome
EthnicityReligionLocation
Family planningAntenatal care
Obstetric delivery careNeonatal carePostnatal careImmunization
Malaria preventionNutritional supplementsInfant feeding practicesUtilization of safe water
and sanitationCurative care
Family planningAntenatal care
Obstetric delivery careNeonatal carePostnatal careImmunization
Malaria preventionNutritional supplementsInfant feeding practicesUtilization of safe water
and sanitationCurative care
MortalityMorbidity
Nutritional statusFertility
MortalityMorbidity
Nutritional statusFertility
Observed underlying factors
Unobserved factors
Health services
Intermediate outcomes
High-level outcomes

Measurement of inequality• Population-weighted quintiles• Concentration curve• Concentration index (CI)• Living standards measures (LSM)The methodology is described in great
detail in:O’Donnell, O, et al. (2008) Analyzing
Health Equity Using Household SurveyData: A Guide to Techniques and TheirImplementation, Washington, D.C.:World Bank

Population-weighted quintiles
Source: 1992/93 Vietnam Living Standards Survey; 2006 VHLSS
Proportion of children under 5 with moderately low weight for age
051015202530354045
Poorest Nearpoor
Middle Nearrich
Richest
Percent
1992/93 2006

Concentration curve
0.2
.4.6
.81
cum
ul. sh
are
of w
omen
rece
iving
ante
nata
l ser
vices
0 .2 .4 .6 .8 1cumul. share of mothers (poorest first)
weighedblood testultrasoundHIVadviceline of equality
Inequality in the components of a complete antenatal care exam, 2006
Source: 2006 MICS III
Cum
. sha
re o
f wom
e n r e
ceivi
n g a
nten
atal
ser
vices

Concentration index• Definition: Twice the area between the
concentration curve and the line of equality (the45° line).
• The larger the absolute value, the greater theinequality
• Convention is to assign negative values to areasabove the line of equality and positivepositive values toareas belowbelow
• Inequalities may favor or disfavor the poor andfavor or disfavor the rich

Living standards measuresDirect measures• Reported household income per capita• Reported household consumption per capita• Reported household wealth per capita• Average ranking of direct measuresIndirect measures• Predicted household income per capita• Predicted household consumption per capita• Predicted household wealth per capita• Wealth index

Living standards measuresProportions of obstetric deliveries in a hospital by quintile
(using alternative LSMs to define quintiles), 1992/93
Source: 1992/93 Vietnam Living Standards Survey
01 02 03 04 05 06 07 08 09 0
1 0 0
Direct
inc
ome
Direct
co
nsum
ption
Direct
wea
lth
Avera
ge
rank
ing
Indire
ct
incom
e
Indire
ct
cons
umpt
ion
Indire
ct
wealth
Wea
lth
index
Pe
rce
nt P o o r
Near poorA v e r a g eNext richestR i c hes t

Analysis of sources of inequality
• Regression analysis• Decomposition of the concentration
index (i.e., decomposition of theobserved inequality)
• Contribution to inequality depends onelasticity and the concentration indexfor explanatory variables

Decomposition of inequalities for fullantenatal care
0.497Total
-0.012Residual
0.049-12.6222.713Commune fixed effects(combined)
0.4070.3011.352Wealth index
-0.0370.137-0.267Head of household isVietnamese or Chineseethnicity
0.0160.0770.208
Highest education of adultsin household
0.0590.1320.449Mother’s schooling
0.0140.0140.999Mother’s age (years)
ContributionConcentrationindicesElasticitiesVariable

Decomposition of inequalityDecomposition of concentration index for antenatal care and
full package of antenatal care, 2006
Source: 2006 MICS III
-0.10
0.00
0.10
0.20
0.30
0.40
0.50
Age ofmother(years)
Mother'sschooling
Highestschooling
EthnicVietnameseor Chinese
Wealthindex
Communefixed effects
"Residual"
Cont
ribut
ion
Any antenatal care (0.059)Full antenatal (0.497)
Offsetting factor

Analysis of provincial data• Outcome data available from surveys and
Health Statistics Yearbook by province• Living standard measure is mean
household income per capita• Concentration curves, indices and
decompositions• Complements analysis at the household
level

Main findings

High level outcomes• Child mortality• Maternal mortality• Morbidity• Nutritional status• Fertility

Intermediate outcomes• Family planning• Antenatal care• Obstetric delivery care• Immunization• Malaria prevention• Nutritional supplements• Infant feeding practices• Curative care

Important achievements inimproving basic health indicators
2.12.25TFR (births perwoman)
23.431.9Child malnutritionrate (%)
2642U5MR (per 1000 livebirths)
1631IMR (per 1000 livebirths)
7595MMR (per 100 000live births)
20062001

Important achievements inimproving access to health care
61.739.1% of children under 5 completelyvaccinated (according to mother’sreporting)
84.454.7% of women delivering at health facility
87.773.6% of women receiving professionalassistance at delivery
91.259.5% of pregnant women receivingantenatal care
75.666.1Contraceptive prevalence amongmarried women (%)
20061992/93

Important variation in degree ofinequality
• The degree of inequality in both high-leveloutcomes and intermediate outcomesvaries greatly.
• As a reference point for this comparison,the Gini-coefficients (basically theconcentration indices for living standardsvariables) using the 2006 MICSIII are:– Wealth index (0.297)– Estimated consumption (0.394)

Variation in inequality for high-leveloutcomes
Inci
denc
e of
re
spira
tory
in
fect
ion
Fert
ility
Diar
rhea
Stun
ting
Und
erw
eigh
t
% o
f chi
ldre
n w
hose
mot
her h
as
died
-0.60
-0.50
-0.40
-0.30
-0.20
-0.10
0.00C
once
ntra
tion
inde
x

Variation in inequality for selectedintermediate outcomes (1)
Any
ante
nata
l ca
re
Wei
ghed
Bloo
d pr
essu
re
mea
sure
d
Ultra
soun
d
Urin
e te
st
Bloo
d te
st
HIV
advi
ce
Full
ante
nata
l
0.00
0.10
0.20
0.30
0.40
0.50
0.60C
once
ntra
tion
inde
x

Variation in inequality for selectedintermediate outcomes (2)
Full
dose
of a
ll va
ccin
es
BC
G Polio
DPT
Mea
sles
Full
dose
in fi
rst
year
of l
ife
0.00
0.10
0.20
0.30
0.40
0.50
0.60C
once
ntra
tion
inde
x

Changes in inequality over time• There has been significant improvement in
reducing inequalities in some intermediateoutcomes, but little improvement inreducing inequalities in several higher-level outcomes

Reduced inequality over time• Use of contraception• Any antenatal care• Professional assistance at delivery• Facility or hospital delivery

Almost complete reduction ininequality for use of contraception
% of married women using contraception
0%
20%
40%
60%
80%
100%
Poorest Nearpoor
Middle Nearrich
Richest
1992/932006

Important reduction in inequality foruse of any antenatal care
0.2
.4.6
.81
cum
ul. s
hare
of a
ny a
nten
atal
car
e
0 .2 .4 .6 .8 1cumul. share of pregnancies (poorest first)
1992/932006line of equality

Important improvements in middlequintiles for obstretic care
% of deliveries with professionally assistance
0%
20%
40%
60%
80%
100%
Poorest Nearpoor
Middle Nearrich
Richest
1992/932006

Less improvement in inequality forhigh-level outcomes
• Child malnutrition• Child mortality• Incidence of diarrhea• Fertility

Increased inequality in stunting0
.2.4
.6.8
1
cum
ul. s
hare
of s
tunt
ed c
hild
ren
0 .2 .4 .6 .8 1cumul. share of children (poorest first)
consumptionwealth indexline of equality
0.2
.4.6
.81
cum
ul. s
hare
of s
tunt
ed c
hild
ren
0 .2 .4 .6 .8 1cumul. share of children under 5
wealth indexdirect consumptionline of equality
1992/93 2006
Lowinequality
Higherinequality

No reduction in inequality in childmortality
Child mortality
0102030405060708090
Poorest Nearpoor
Middle Nearrich
RichestDea
ths
per
1000
chi
ldre
n ev
er b
orn
1992/932006
Gap in 1992/93
Gap in 2006

Slow reductions in poorer groups
Number of children ever born
0.00.51.01.52.02.53.03.5
Poorest Nearpoor
Middle Nearrich
Richest
1992/932006
Slower Faster

Factors examined for theircontribution to inequalities
• “Income”• Education of mother, of adults in
household• Ethnicity• Mother’s and father’s nutritional status• Location (communal fixed effects)• Sex• Religion

Main factors affecting inequalityThe main factors contributing to the observed
inequalities in maternal and child healthoutcomes are:
• Inequalities in household “income”• Inequalities related to location (i.e., to the
commune of residence).Other important factors for some outcomes
include:• Inequalities in education• Inequalities in ethnicity

Factors contributing to inequalitiesin child malnutrition, 2006
Ethnic Vietnamese or Chinese
Child's age
Sex
Mother's schooling
Mean adult schooling Commune
fixed effects
Wealth index-0.16-0.14-0.12-0.10-0.08-0.06-0.04-0.020.000.020.04
Cont
ribut
ion
to in
equa
lity
Height for age (-0.181) Weight for age (-0.167)

Factors contributing to inequalitiesin incidence of diarrhea, 2006
Commune fixed effects
Ethnic Vietnamese or Chinese
Wealth index
Child's sex
Mean adult
schooling
Mother's schooling
Child's age
-0.20
-0.15
-0.10
-0.05
0.00
0.05
0.10Co
ntrib
utio
n to
ineq
ualit
y
Concentration index (-0.136)

Factors contributing to inequalitiesin obstetric care, 2006
Ethnic Vietnamese or Chinese
Commune fixed
e f fec ts
Wealth index
Highest adult
schoolingWoman's schoolingWoman's
age 0 . 0 0
0 . 0 2
0 . 0 4
0 . 0 6
0 . 0 8
0 . 1 0
0 . 1 2
0 . 1 4
Con
trib
utio
n to
ine
qual
ity
Professionally assisted delivery (0.096)Facility-based delivery (0.116)Hospital delivery (0.218)

Factors contributing to inequalitiesin child immunization, 2006
Sex
Commune fixed
e f fec ts
Wealth index
Ethnic Vietnamese or Chinese
Mother's schooling
Highest adult
schooling
Days survived
- 0 . 3 0- 0 . 2 5- 0 . 2 0- 0 . 1 5- 0 . 1 0- 0 . 0 50 . 0 00 . 0 50 . 1 00 . 1 50 . 2 0
Cont
ribut
ion
to in
equa
lity
Complete vaccination in first year (0.235)No vaccinations (-0.535)

Contribution of education toinequality
• Women’s/mother’s schooling is not asclosely related to many of the outcomesanalyzed as is the schooling of other adulthousehold members

Parental nutrition• Nutritional status of father and mother are
significantly associated with child’snutritional status (only available in the1992/93 VLSS).
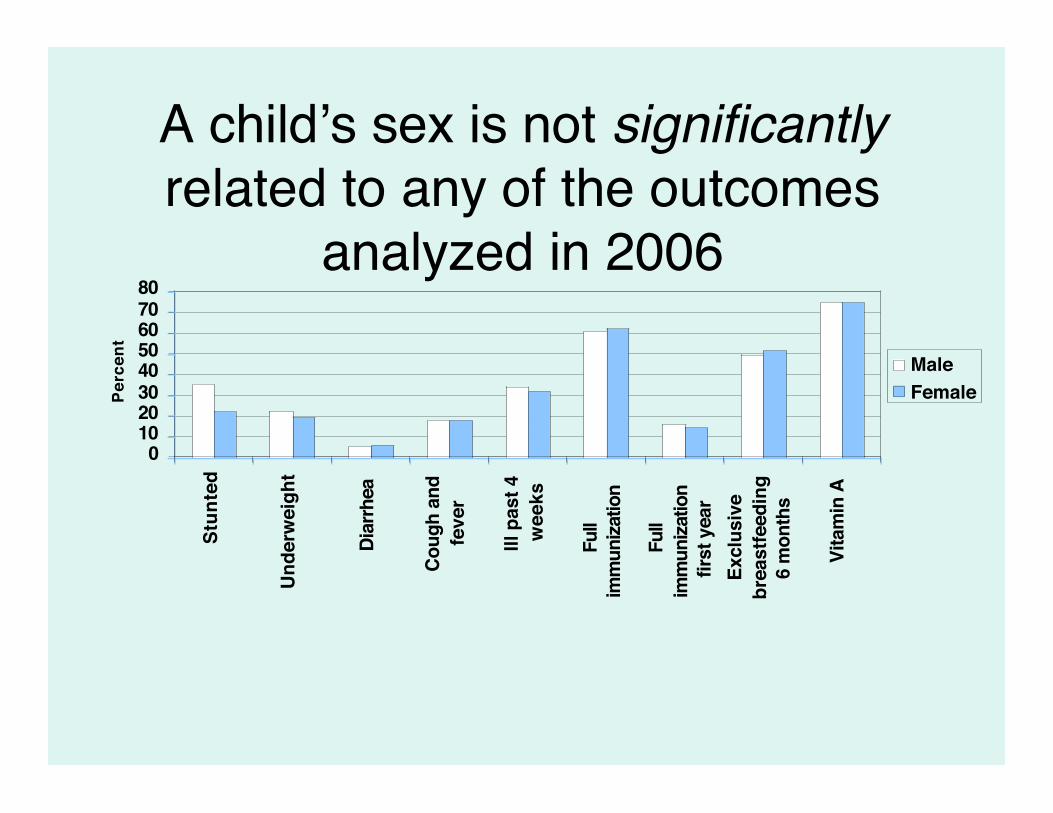
A child’s sex is not significantlyrelated to any of the outcomes
analyzed in 2006
01020304050607080
Stun
ted
Unde
rwei
ght
Diar
rhea
Coug
h an
dfe
ver
Ill p
ast 4
wee
ks
Full
imm
uniza
tion
Full
imm
uniza
tion
first
yea
rEx
clus
ive
brea
stfe
edin
g6
mon
ths
Vita
min
A
Perc
ent
MaleFemale

Analysis of commune fixed effects• In some cases, commune effects explain a large proportion of
the concentration index.• Important commune level factors include:
– Mean education of adults in households in the commune(for most outcomes)
– Regions (Southeast and Mekong Delta better thanaverage, Northwest, Central Highlands worse thanaverage)
– Proportion ethnic Vietnamese or Chinese in commune– Road goes to center of commune (family planning,
antenatal care, obstetric care)– Proportion Catholic in the commune (fertility, use of family
planning)

EthnicityAnalysis of province-level data, commune
fixed effects and household level data allindicate that ethnicity is an important factorin inequality for many outcomes (IMR,fertility, malaria morbidity, antenatal care,births attended by health worker, childimmunizations).

Fertility and IMR, 2005
Factors contributing to inequality in fertility in provincial analysis
Income
Urbanization
Infant mortality
Residual
Population density
Schooling
Ethnicity
-0.08
-0.06
-0.04
-0.02
0.00
0.02
0.04
Cont
ribu
tion

Inequalities in governmenthealth spending, 2005
0.2
.4.6
.81
cum
ul. s
hare
of g
ovt
heal
th e
xpen
ditu
re
0 .2 .4 .6 .8 1cumul. share of population (poorest first)
total health expenditurenational program expendituretreatment & prevention expenditureother expenditureline of equality
Pro-poor nationalprogramspending
Pro-rich curative carespending

Indicators of access to curative caredisfavoring the middle income provinces, 2005
0.2
.4.6
.81
cum
ul. s
hare
of p
opul
atio
n w
ith a
cces
s to
car
e
0 .2 .4 .6 .8 1cumul. share of population (poorest first)
medical doctorsinpatient bedsHI coverageline of equality
Pro-poor
Pro-rich

Data gapsThere are still several important data gaps in
the area of maternal-child health in VietNam that need to be addressed to supporteffective monitoring of inequalities inmaternal and child health

Missing data• Maternal nutritional status (to understand
the intergenerational associations withchild malnutrition)
• Complete birth history data is missing forrecent years
• Information on number of antenatal exams

Need for revising surveyinstruments
New or newly available interventions requireconstant revision of survey instruments.For example:– Zinc supplements and use of zinc to treat
diarrhea,– Vitamin K injections at birth,– Use of folic acid and/or iron during pregnancy,– Use of deworming medicines,– Post-natal exams,– Delivery by C-section.

New data collection methodologies
New developments and reductions in cost ofdata collection methods also requireconsideration:
• anemia testing,• HIV testing (with consent),• information about delivery complications,• oral autopsy about child deaths, etc.(Good example is the Cambodian DHS)

Inadequacy of current HISDifficulties in using HIS data for health
equity analysis, either because of:• Under-reporting of pregnancies/births• Only partial coverage (Doesn’t include
private services).• Missing indicators of quality aspects

Interventions to reduce inequality inMaternal and Child health (1)
• Extensive public health infrastructure in alllocalities throughout the country
• Numerous pilot projects (mainly NGO) toreduce mortality among newborns focused atthe grassroots level
• Population and family planning programfocusing efforts and budget in areas withremaining high fertility

Interventions to reduce inequality inMaternal and Child health (2)
• National health target programs focusingefforts and budget on disadvantaged areas
• Military-civilian medical cooperation forborder areas, disaster areas
• School health programs• Targeted health financing for the poor, for
children under age 6

Conclusions (1)• Most government health programs have
been very effective in Viet Nam inimproving average health status amongmothers and children
• For most intermediate outcomes, theyhave been effective in reducinginequalities
• For higher-level outcomes reduction ininequality has been less successful

Conclusions (2)• Income and commune-level factors
explain much of the inequality• Education and ethnicity also contribute
importantly to inequality for someoutcomes
• At the commune level, general educationallevel, region, ethnicity, road access andeven religion explain some of theinequalities

Conclusions (3)• Important data gaps inhibit monitoring of
inequality in some aspects of maternal and childhealth
• Government and non-governmentalinterventions need to increasingly focus effortsand budget on disadvantaged areas or groupswhere outcomes are worse.
• There is a need for interventions on bothdemand and supply side.


![Supplementary Online Content - JAMA...MDD Heritability Estimates of Whole-Genome SNP Sets Partitioned by MAF Quintiles MAF quintiles h2 se p‐value SNPs (0.00244,0.0351] 0.006473](https://static.fdocuments.in/doc/165x107/611582318c623e5e4f1b8623/supplementary-online-content-jama-mdd-heritability-estimates-of-whole-genome.jpg)