Situation Overview: Central and Eastern Equatoria, South Sudan · 2 Central Equatoria State New...
8
Situation Overview: Central and Eastern Equatoria, South Sudan July - September 2018 Introduction During the third quarter of 2018, dry climatic conditions have reportedly limited agricultural production across most of Central and Eastern Equatoria States. As a result, a large proportion of the population remained food insecure in spite of the end of the lean season. Moreover, worsening road conditions due to the onset of seasonal rains have led to a decrease in the availability of basic services such as healthcare and education in the hard-to-reach areas of Central and Eastern Equatoria. Finally, other areas remained inaccessible to humanitarian actors due to insecurity. As a result, only limited information is available on the humanitarian situation outside of large towns and displacement sites. In order to fill these information gaps and improve the humanitarian response, REACH began collecting monthly data on hard-to-reach areas in the Equatoria region from January 2017 through interviews with Key Informants (KIs). Between July and September 2018, data was collected through phone call interviews with KIs across Central and Eastern Equatoria States who had direct knowledge of the situation in hard-to-reach settlements as well as through direct in-person KI interviews in Kapoeta town, Kapoeta South County. From July to September 2018, REACH interviewed 465 KIs that had knowledge about 439 different settlements: 191 settlements in all six counties of Central Equatoria State and 248 settlements in six out of eight counties of Eastern Equatoria State (Figure 1). Primary data collection was supplemented by interviews with humanitarian partners based .3. Radio Tamazuj. Rokon residents urge leaders to implement the peace deal. 2 October 2018. 1. OCHA. South Sudan Humanitarian Snapshot. September 2018 2. OCHA. South Sudan Humanitarian Access Snapshot. September 2018 in Kapoeta town. Findings were triangulated with secondary data. As settlement coverage was higher in August, figures provided in this Situation Overview are based on August data. This Situation Overview provides a summary of displacement trends and access to food and other basic services for both internally displaced persons (IDPs) and host communities across Central and Eastern Equatoria States from July to September 2018. The following analysis will summarize trends for the two states overall and zoom into specific counties where REACH was able to assess over 5% of the total settlements for a given month (Map 2). Population Movement and Displacement Entering into the second half of 2018, displacement continued in the Yei river area (Morobo, Kajo-Keji, Lainya and Yei Counties) following renewed armed clashes. 1 Apart from triggering displacement, recent clashes have further limited humanitarian access to rural areas surrounding Yei Town, including the areas close to the border with the Democratic Republic of Congo which have been prioritized as part of the Ebola Preparedness campaign that is currently being implemented by the Ministry of Health (MoH) and humanitarian partners in the Equatorias. 2 Additionally, the security situation continued to deteriorate in Terekeka County and in the northern portion of Juba County following a spike in intercommunal fighting that caused displacement. 3 Finally, isolated cases of flooding caused small scale displacement in the Greater Kapoeta area, and a number of farms were reportedly Lopa Magwi Torit Ikotos Budi Kapoeta North Kapoeta East Kapoeta South Terekeka Juba Yei Lainya Morobo Kajo-Keji Kapoeta town Moyo Juba Data collection point (C) Figure 1: KIs interviewed in each REACH base covering Central and Eastern Equatoria States Juba Kapoeta Moyo Phone 228 KIs 63 KIs In person 215 KIs Map 2: REACH assessment coverage of Central and Eastern Equatoria States, July (A), August (B) and September 2018 (C) Map 1: Counties in Central and Eastern Equatoria States, September 2018 (B) (A)
Transcript of Situation Overview: Central and Eastern Equatoria, South Sudan · 2 Central Equatoria State New...

Situation Overview: Central and Eastern Equatoria, South SudanJuly - September 2018
IntroductionDuring the third quarter of 2018, dry climatic conditions have reportedly limited agricultural production across most of Central and Eastern Equatoria States. As a result, a large proportion of the population remained food insecure in spite of the end of the lean season. Moreover, worsening road conditions due to the onset of seasonal rains have led to a decrease in the availability of basic services such as healthcare and education in the hard-to-reach areas of Central and Eastern Equatoria. Finally, other areas remained inaccessible to humanitarian actors due to insecurity. As a result, only limited information is available on the humanitarian situation outside of large towns and displacement sites.
In order to fill these information gaps and improve the humanitarian response, REACH began collecting monthly data on hard-to-reach areas in the Equatoria region from January 2017
through interviews with Key Informants (KIs). Between July and September 2018, data was collected through phone call interviews with KIs across Central and Eastern Equatoria States who had direct knowledge of the situation in hard-to-reach settlements as well as through direct in-person KI interviews in Kapoeta town, Kapoeta South County.
From July to September 2018, REACH interviewed 465 KIs that had knowledge about 439 different settlements: 191 settlements in all six counties of Central Equatoria State and 248 settlements in six out of eight counties of Eastern Equatoria State (Figure 1). Primary data collection was supplemented by interviews with humanitarian partners based
.3. Radio Tamazuj. Rokon residents urge leaders to implement the peace deal. 2 October 2018.
1. OCHA. South Sudan Humanitarian Snapshot. September 20182. OCHA. South Sudan Humanitarian Access Snapshot. September 2018
in Kapoeta town. Findings were triangulated with secondary data. As settlement coverage was higher in August, figures provided in this Situation Overview are based on August data. This Situation Overview provides a summary of displacement trends and access to food and other basic services for both internally displaced persons (IDPs) and host communities across Central and Eastern Equatoria States from July to September 2018. The following analysis will summarize trends for the two states overall and zoom into specific counties where REACH was able to assess over 5% of the total settlements for a given month (Map 2).
Population Movement and DisplacementEntering into the second half of 2018, displacement continued in the Yei river area
(Morobo, Kajo-Keji, Lainya and Yei Counties) following renewed armed clashes.1 Apart from triggering displacement, recent clashes have further limited humanitarian access to rural areas surrounding Yei Town, including the areas close to the border with the Democratic Republic of Congo which have been prioritized as part of the Ebola Preparedness campaign that is currently being implemented by the Ministry of Health (MoH) and humanitarian partners in the Equatorias.2
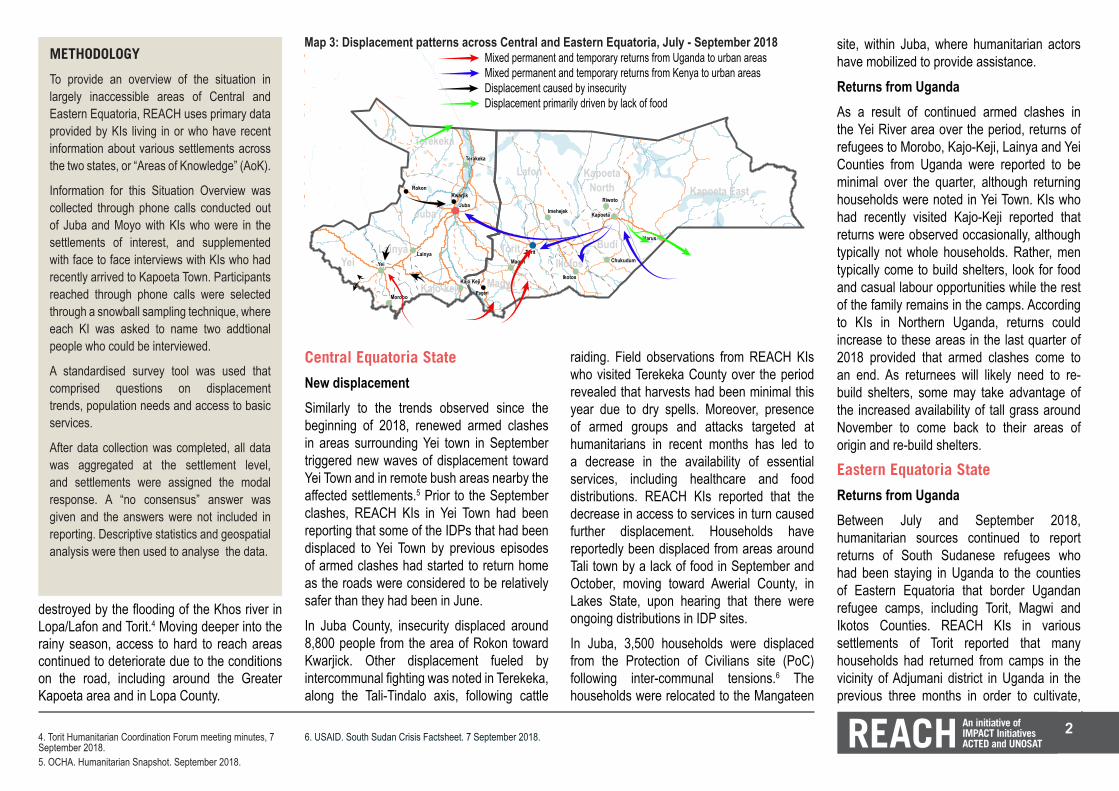
Additionally, the security situation continued to deteriorate in Terekeka County and in the northern portion of Juba County following a spike in intercommunal fighting that caused displacement.3 Finally, isolated cases of flooding caused small scale displacement in the Greater Kapoeta area, and a number of farms were reportedly
Lopa
Magwi
Torit
Ikotos
Budi
KapoetaNorth
KapoetaEast
KapoetaSouth
Terekeka
Juba
Yei Lainya
MoroboKajo-Keji
Kapoeta town
Moyo
Juba
Data collection point
REACH Area of Knowledge (AoK) settlement coverage - September 20181
Legend0 - 4.9%5 - 10%
Map based on Longitude (generated) and Latitude (generated) and Latitude (generated). For pane Latitude (generated): Color shows details about A.Indicator color (coverage). Details are shown for County, County Join and Month Month. For pane Latitude (generated) (2): Size shows Settlement Size (Parameters). Details are shown for Namecounty. The data isfiltered on Month Month and State Label. The Month Month filter keeps September 2018. The State Label filter keeps Central Equatoria and Eastern Equatoria. The view is filtered on Latitude (generated), which keeps non-Null values only.
( C )
Figure 1: KIs interviewed in each REACH base covering Central and Eastern Equatoria States
Juba Kapoeta Moyo
Phone 228 KIs 63 KIs
In person 215 KIs
Map 2: REACH assessment coverage of Central and Eastern Equatoria States, July (A), August (B) and September 2018 (C)
Map 1: Counties in Central and Eastern Equatoria States, September 2018
REACH Area of Knowledge (AoK) settlement coverage - August 2018
Legend0 - 4.9%5 - 10%11 - 20%
1
Map based on Longitude (generated) and Latitude (generated) and Latitude (generated). For pane Latitude (generated): Color shows details about A.Indicator color (coverage). Details are shown for County, County Join and Month Month. For pane Latitude (generated) (2): Size shows Settlement Size (Parameters). Details are shown for Namecounty. The data isfiltered on Month Month and State Label. The Month Month filter keeps August 2018. The State Label filter keeps Central Equatoria and Eastern Equatoria. The view is filtered on Latitude (generated), which keeps non-Null values only.
( B )REACH Area of Knowledge (AoK) settlement coverage - July 2018
Legend0 - 4.9%5 - 10%11 - 20%21 - 50%
1
Map based on Longitude (generated) and Latitude (generated) and Latitude (generated). For pane Latitude (generated): Color shows details about A.Indicator color (coverage). Details are shown for County, County Join and Month Month. For pane Latitude (generated) (2): Size shows Settlement Size (Parameters). Details are shown for Namecounty. The data isfiltered on Month Month and State Label. The Month Month filter keeps July 2018. The State Label filter keeps Central Equatoria and Eastern Equatoria. The view is filtered on Latitude (generated), which keeps non-Null values only.
( A )
2
Central Equatoria State
New displacementSimilarly to the trends observed since the beginning of 2018, renewed armed clashes in areas surrounding Yei town in September triggered new waves of displacement toward Yei Town and in remote bush areas nearby the affected settlements.5 Prior to the September clashes, REACH KIs in Yei Town had been reporting that some of the IDPs that had been displaced to Yei Town by previous episodes of armed clashes had started to return home as the roads were considered to be relatively safer than they had been in June.In Juba County, insecurity displaced around 8,800 people from the area of Rokon toward Kwarjick. Other displacement fueled by intercommunal fighting was noted in Terekeka, along the Tali-Tindalo axis, following cattle
raiding. Field observations from REACH KIs who visited Terekeka County over the period revealed that harvests had been minimal this year due to dry spells. Moreover, presence of armed groups and attacks targeted at humanitarians in recent months has led to a decrease in the availability of essential services, including healthcare and food distributions. REACH KIs reported that the decrease in access to services in turn caused further displacement. Households have reportedly been displaced from areas around Tali town by a lack of food in September and October, moving toward Awerial County, in Lakes State, upon hearing that there were ongoing distributions in IDP sites.In Juba, 3,500 households were displaced from the Protection of Civilians site (PoC) following inter-communal tensions.6 The households were relocated to the Mangateen
site, within Juba, where humanitarian actors have mobilized to provide assistance.Returns from UgandaAs a result of continued armed clashes in the Yei River area over the period, returns of refugees to Morobo, Kajo-Keji, Lainya and Yei Counties from Uganda were reported to be minimal over the quarter, although returning households were noted in Yei Town. KIs who had recently visited Kajo-Keji reported that returns were observed occasionally, although typically not whole households. Rather, men typically come to build shelters, look for food and casual labour opportunities while the rest of the family remains in the camps. According to KIs in Northern Uganda, returns could increase to these areas in the last quarter of 2018 provided that armed clashes come to an end. As returnees will likely need to re-build shelters, some may take advantage of the increased availability of tall grass around November to come back to their areas of origin and re-build shelters.Eastern Equatoria State
Returns from UgandaBetween July and September 2018, humanitarian sources continued to report returns of South Sudanese refugees who had been staying in Uganda to the counties of Eastern Equatoria that border Ugandan refugee camps, including Torit, Magwi and Ikotos Counties. REACH KIs in various settlements of Torit reported that many households had returned from camps in the vicinity of Adjumani district in Uganda in the previous three months in order to cultivate,
METHODOLOGY
To provide an overview of the situation in largely inaccessible areas of Central and Eastern Equatoria, REACH uses primary data provided by KIs living in or who have recent information about various settlements across the two states, or “Areas of Knowledge” (AoK).
Information for this Situation Overview was collected through phone calls conducted out of Juba and Moyo with KIs who were in the settlements of interest, and supplemented with face to face interviews with KIs who had recently arrived to Kapoeta Town. Participants reached through phone calls were selected through a snowball sampling technique, where each KI was asked to name two addtional people who could be interviewed.
A standardised survey tool was used that comprised questions on displacement trends, population needs and access to basic services.
After data collection was completed, all data was aggregated at the settlement level, and settlements were assigned the modal response. A “no consensus” answer was given and the answers were not included in reporting. Descriptive statistics and geospatial analysis were then used to analyse the data.
4. Torit Humanitarian Coordination Forum meeting minutes, 7 September 2018.5. OCHA. Humanitarian Snapshot. September 2018.
6. USAID. South Sudan Crisis Factsheet. 7 September 2018.
destroyed by the flooding of the Khos river in Lopa/Lafon and Torit.4 Moving deeper into the rainy season, access to hard to reach areas continued to deteriorate due to the conditions on the road, including around the Greater Kapoeta area and in Lopa County.
!
!
!
!
!
!
!!
!
!
!
!
!
!
Juba
Kajo-keji
Lainya
Terekeka
YeiBudi
Ikotos
Kapoeta EastKapoeta
NorthLafon
Magwi
Torit
Morobo
Lainya
Yei
Juba
Terakeka
Kajo Keji
Magwi
Ikotos
Kapoeta
ChukudumTorit
Riwoto
Imehejek
Narus
!Pageri
!
!
RokonKwarjik
Mixed permanent and temporary returns from Kenya to urban areasDisplacement caused by insecurityDisplacement primarily driven by lack of food
Mixed permanent and temporary returns from Uganda to urban areasMap 3: Displacement patterns across Central and Eastern Equatoria, July - September 2018

3
Ikotos County, Juba County and Torit County. Most of these households are reported to be returning permanently to areas such as Magwi, Torit and Ikotos in September. In absolute numbers, however, more households crossed from South Sudan toward Kakuma refugee camp in Kenya than the contrary in August and September (see Figure 2). Returning households typically leave some members of the household in the camps while they return to South Sudan, in order to cope with lack of opportunities in areas of return. Partners report that some households are moving back and forth between Torit County and Kakuma refugee camp in search for resources and opportunities.
Situation in Assessed SettlementsFood security and Livelihoods
In line with the trends identified in the previous quarters, food security continued to be affected by a combination of environmental shocks, conflict and competition over scarce resources between July and September. Erratic rainfall was reported to have disrupted cultivation cycles across all livelihood zones of Central and Eastern Equatoria, but with particularly
serious impact in Terekeka County and in the Greater Kapoeta area. Meanwhile, southern Central Equatoria State continued to face chronic food insecurity due to the presence of armed groups.In total, 46% of assessed settlements reported adequate access to food in Central and Eastern Equatoria States in August.9 The reason most widely cited to explain difficulties to access food across settlements of Central and Eastern Equatoria was the lack of rain (33% of assessed settlements). All counties of Central and Eastern Equatoria States were affected by drier-than-normal conditions from June to September.10 Sporadic dry spells followed by erratic rainfall ruined crops and forced farmers to re-plant many times.11 As a result, many households were not able to gather reserves, and harvests only provided a minor relief to food insecure households following the lean season.Among the 52% of assessed settlements
that reported inadequate access to food, 27% reported that it led to severe hunger in their area, and 4% reported that hunger was beyond severe, most of which were located in Terekeka County. In addition, 40% of all assessed settlements reported that most residents were eating one meal a day or less, further evidence of low food consumption in a large portion of Eastern and Central Equatoria States. Nevertheless, the end of the lean season in Central and Eastern Equatoria did provide a respite from extreme hunger in many areas, as evidenced by the low proportion of assessed settlements relying on extreme coping strategies such as spending entire days without eating (8% of all assessed settlements in August) and adults not eating so that children can eat (18% of assessed settlements).
The decrease in reliance on extreme coping strategies compared to previous quarters may be partly explained by the appreciation of the
due to contradicting answers given by KIs from the settlement.10. CLIMIS. South Sudan - Precipitation Anomaly Map. August 2018.11. FAO. South Sudan Crop Watch: Updates to 3rd Dekad. July 2018.
citing low food rations in the camps as a push factor. However, KIs also reported that low rainfalls in the areas of return prevented many returnees from having adequate access to food. KIs also reported that the return of South Sudanese refugees to their former homes has created localized tensions over land and housing ownership with the households that are currently occupying the houses.Returns from KenyaOver the reporting period, REACH Road Monitoring teams in Kapoeta Town mostly recorded households departing Kapoeta town, generally toward areas of Kapoeta East such as Narus where education services and business opportunities are available.7 Among households exiting Kapoeta town, 17% were leaving toward Kakuma Refugee Camp, in Kenya. REACH also recorded households in transit from Kakuma refugee camp moving on to different areas in South Sudan, primarily
19+22+33
7. REACH. Kapoeta Town Road Monitoring. July to September 20188. Ibid.9. In 2% of assessed settlements, answers were classified as ‘‘no consensus’’ during data aggregation at the settlement level
12. FEWS NET. South Sudan Livelihood Zones. 2013.
Figure 3: Percentage of assessed settlements reporting inadequate access to food, August 2018
52% of assessed settlements reported inadequate access to food52+48+A
Morobo
MagwiIkotos
LainyaYei
KapoetaSouth
BudiTorit
Juba
Kapoeta NorthLopa
Terekeka
Kapoeta East
Kajo-KejiEastern Semi-Arid Pastoral
Highland Forest and Sorghum
Equatorial Maize and Cassava
Ironstone Plateau agro-pastoral
Map 4: Dominant livelihood zone per county12
0
10
20
30
40
50
60
70
80
July August September
From Kakuma Toward Kakuma
Figure 2: Number of households passing through Kapoeta Town toward and from Kakuma refugee camp, July - September 2018.8
4
South Sudanese Pound (SSP) against the US Dollar (USD) over the period. As a result, prices of commodities were reported to have decreased in key markets such as Torit and Yei, and to have stabilized in Juba. Markets were also reported to be physically accessible in 49% of all assessed settlements, including all assessed settlements in Torit, Yei, Terekeka and Kapoeta South. However, the gap between high reported levels of access to markets and low reported levels of access to food in these counties suggests that communities are still unable to fulfill their basic needs from the markets alone in spite of reports of decreasing prices.13 This situation can be explained by the lack of income generating opportunities, which continued to prevent many households from relying on the market to fill food consumption gaps over the quarter.
Instead, communities continued to depend heavily on traditional sources of livelihoods in order to access food. Subsistence agriculture was the most frequently reported source
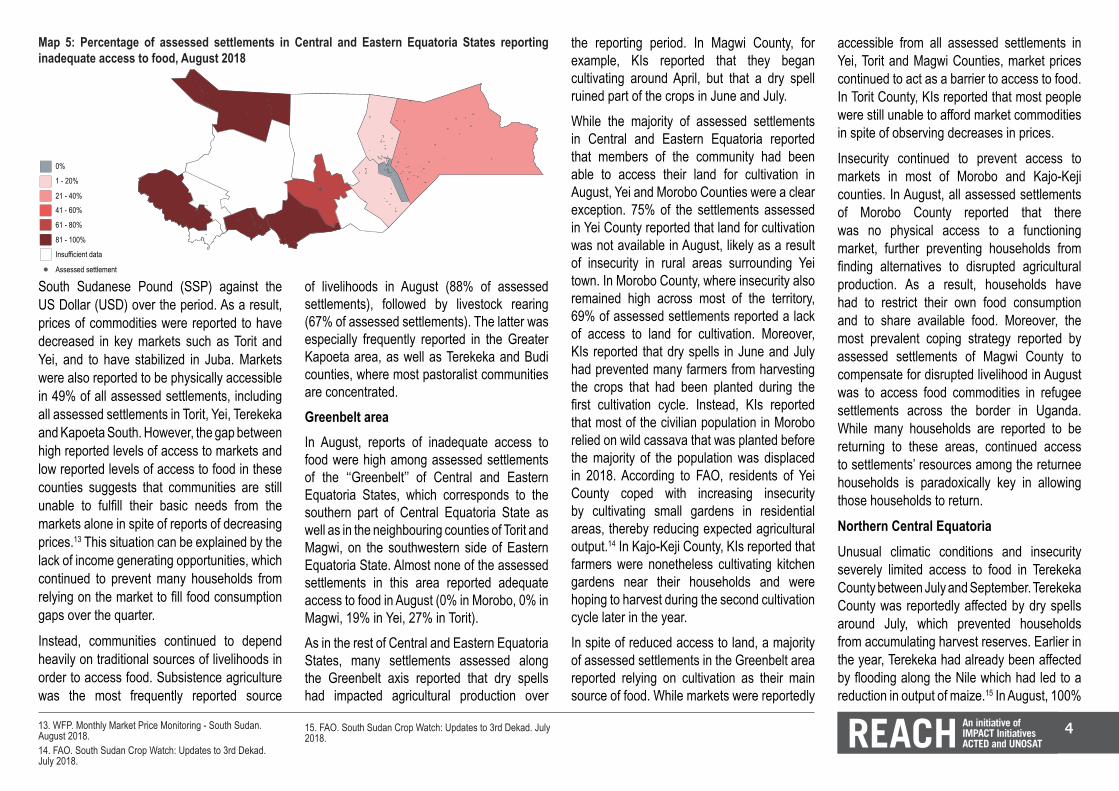
of livelihoods in August (88% of assessed settlements), followed by livestock rearing (67% of assessed settlements). The latter was especially frequently reported in the Greater Kapoeta area, as well as Terekeka and Budi counties, where most pastoralist communities are concentrated.Greenbelt areaIn August, reports of inadequate access to food were high among assessed settlements of the ‘‘Greenbelt’’ of Central and Eastern Equatoria States, which corresponds to the southern part of Central Equatoria State as well as in the neighbouring counties of Torit and Magwi, on the southwestern side of Eastern Equatoria State. Almost none of the assessed settlements in this area reported adequate access to food in August (0% in Morobo, 0% in Magwi, 19% in Yei, 27% in Torit).As in the rest of Central and Eastern Equatoria States, many settlements assessed along the Greenbelt axis reported that dry spells had impacted agricultural production over
the reporting period. In Magwi County, for example, KIs reported that they began cultivating around April, but that a dry spell ruined part of the crops in June and July. While the majority of assessed settlements in Central and Eastern Equatoria reported that members of the community had been able to access their land for cultivation in August, Yei and Morobo Counties were a clear exception. 75% of the settlements assessed in Yei County reported that land for cultivation was not available in August, likely as a result of insecurity in rural areas surrounding Yei town. In Morobo County, where insecurity also remained high across most of the territory, 69% of assessed settlements reported a lack of access to land for cultivation. Moreover, KIs reported that dry spells in June and July had prevented many farmers from harvesting the crops that had been planted during the first cultivation cycle. Instead, KIs reported that most of the civilian population in Morobo relied on wild cassava that was planted before the majority of the population was displaced in 2018. According to FAO, residents of Yei County coped with increasing insecurity by cultivating small gardens in residential areas, thereby reducing expected agricultural output.14 In Kajo-Keji County, KIs reported that farmers were nonetheless cultivating kitchen gardens near their households and were hoping to harvest during the second cultivation cycle later in the year.In spite of reduced access to land, a majority of assessed settlements in the Greenbelt area reported relying on cultivation as their main source of food. While markets were reportedly
15. FAO. South Sudan Crop Watch: Updates to 3rd Dekad. July 2018.
accessible from all assessed settlements in Yei, Torit and Magwi Counties, market prices continued to act as a barrier to access to food. In Torit County, KIs reported that most people were still unable to afford market commodities in spite of observing decreases in prices.
Insecurity continued to prevent access to markets in most of Morobo and Kajo-Keji counties. In August, all assessed settlements of Morobo County reported that there was no physical access to a functioning market, further preventing households from finding alternatives to disrupted agricultural production. As a result, households have had to restrict their own food consumption and to share available food. Moreover, the most prevalent coping strategy reported by assessed settlements of Magwi County to compensate for disrupted livelihood in August was to access food commodities in refugee settlements across the border in Uganda. While many households are reported to be returning to these areas, continued access to settlements’ resources among the returnee households is paradoxically key in allowing those households to return.
Northern Central EquatoriaUnusual climatic conditions and insecurity severely limited access to food in Terekeka County between July and September. Terekeka County was reportedly affected by dry spells around July, which prevented households from accumulating harvest reserves. Earlier in the year, Terekeka had already been affected by flooding along the Nile which had led to a reduction in output of maize.15 In August, 100%
13. WFP. Monthly Market Price Monitoring - South Sudan. August 2018.14. FAO. South Sudan Crop Watch: Updates to 3rd Dekad. July 2018.
Assessed settlements reporting on food security: inadequate access to food - August 2018
A.indicator color (yes/no bad)0%1 - 20%21 - 40%61 - 80%81 - 100%Insufficient data
1
Map based on Longitude (generated) and Latitude (generated) and Latitude (generated). For pane Latitude (generated): Color shows details about A.indicator color (yes/no bad). Details are shown for County and Month Month. For pane Latitude (generated) (2): Size shows Settlement Size (Parameters). Details are shown for Namecounty. The data is filtered onMonth Month and State Label. The Month Month filter keeps August 2018. The State Label filter keeps Central Equatoria and Eastern Equatoria. The view is filtered on Latitude (generated), which keeps non-Null values only.
1 - 20%
21 - 40%
41 - 60%
61 - 80%
Insufficient data
0%
Assessed settlement
81 - 100%
Map 5: Percentage of assessed settlements in Central and Eastern Equatoria States reporting inadequate access to food, August 2018
5
of settlements assessed in Terekeka County reported inadequate access to food, with 74% attributing the low access to food primarily to a lack of rain.
While lack of rain primarily affected households that rely heavily on subsistence agriculture, it also reportedly had an adverse impact on households and communities that rely on fishing, due to the low level of water in seasonal rivers.
A sudden influx of cattle coming from Juba County reportedly led many agricultural households of Terekeka to hold off on cultivating large plots of land out of fear that incoming cattle would eventually trample the crops. KIs reported high confusion between farmers and pastoralists following the selection of agricultural land as grazing areas. As a result, many farmers resorted to cultivating smaller plots of land around their houses, leading to a decrease in total production output from what was expected.
As a result of constraints on normal traditional livelihoods, the population of Terekeka County was reported to be highly dependent on markets throughout the reporting period. As per the seasonal calendar, communities in Terekeka County are usually able to rely on their own production from August through March. While all assessed settlements of Terekeka County reported physical access to a market in August, households reportedly lack liquidity to purchase articles, which, KIs report, led to an increase in the practice of bartering. Moreover, 87% of assessed settlements also reported that some community members had
to sell livestock in order to be able to afford commodities at the market. KIs also reported that many households had been displaced to IDP sites in Awerial County (Lakes State) in order to cope with disrupted livelihoods.
Food consumption was also restricted in Terekeka County over the assessment period, with 83% of assessed settlements in Terekeka reporting that most households were eating only one meal a day. Assessed settlements also reported a higher reliance on severe coping strategies than other assessed counties of Central and Eastern Equatoria in August, such as 70% of assessed settlements reporting that adults had stopped eating in order for children to eat, and 35% of assessed settlements reporting that entire households were forced to spend entire days without eating. Households have also coped with constrained livelihoods by relying heavily on wild foods (100% of assessed settlements in August). According to KIs, there is a strong perception that wild food consumption had caused a surge in stomach diseases in Terekeka County.
Greater Kapoeta areaBelow average rainfall also limited agricultural output across the Greater Kapoeta area. While early harvests helped sustain the population in July and August, subsequent dry spells reportedly led to a large loss of crops.16 According to KIs, the county that was most affected by the lack of rain was Kapoeta East. In July, Kapoeta East experienced 80% below than average rainfall. According to FEWSNET estimates of rainfall, the Kapoeta East – Pibor
16. CLIMIS. South Sudan - Precipitation anomaly map. July 201817. FEWSNET. East African Seasonal Monitor. 26 October 2018.18. Reuters. South Sudan’s President, Rebel Leader Sign Peace Deal. 12 September 2018.
triangle was still experiencing “significantly drier-than-normal conditions” by early October.17 The same area has seen profound changes in climatic patterns over the past five years or so, and communities are struggling to adapt livelihoods to the new patterns. This situation had led to chronic food insecurity and a gradual depletion of coping capacity.While KIs reported that harvests were ‘fair’’ in Kapoeta North and Kapoeta South, farmers from Kapoeta East had reportedly produced very little agricultural output as of the end of September. However, short term access to food was aided by an increase in availability of milk over the reported period, given the proximity of cattle to urban areas in the rainy season. Moreover, KIs in Kapoeta East and Budi reported that an upscale in food distribution had improved access to food. As such, settlements of the Greater Kapoeta area generally reported that they had enough access to food in August, with 72% of assessed settlements reporting adequate access in Kapoeta East. As such, assessed settlements reported very little reliance on extreme consumption-based coping strategies in August. Nevertheless, high proportions of assessed settlements in Kapoeta East, Kapoeta South and Kapoeta North reported that some members of the community had to sell excess livestock and others had to move to cattle camps early in order to cope with disrupted livelihoods.In the medium term, food security is far from ensured in the Greater Kapoeta area. In addition to impacting agricultural production, the lack of rain also reportedly affected the
condition of livestock. While cattle keepers had returned from their grazing areas early in the season following onset of rain in April, the exceptionally dry conditions experienced in July and August led to a high scarcity of available pasture. This reportedly affected the body condition of some of the animals that had migrated closer to urban areas, and it forced cattle keepers to start moving along atypical migration routes in search for water. With the end of the rainy season approaching, cattle keepers may begin to migrate back to remote grazing grounds earlier than usual in order to access water.The limited agricultural output caused by dry conditions and the early departure of livestock to grazing land should lead to a very early start to the lean season in the Greater Kapoeta area.Protection
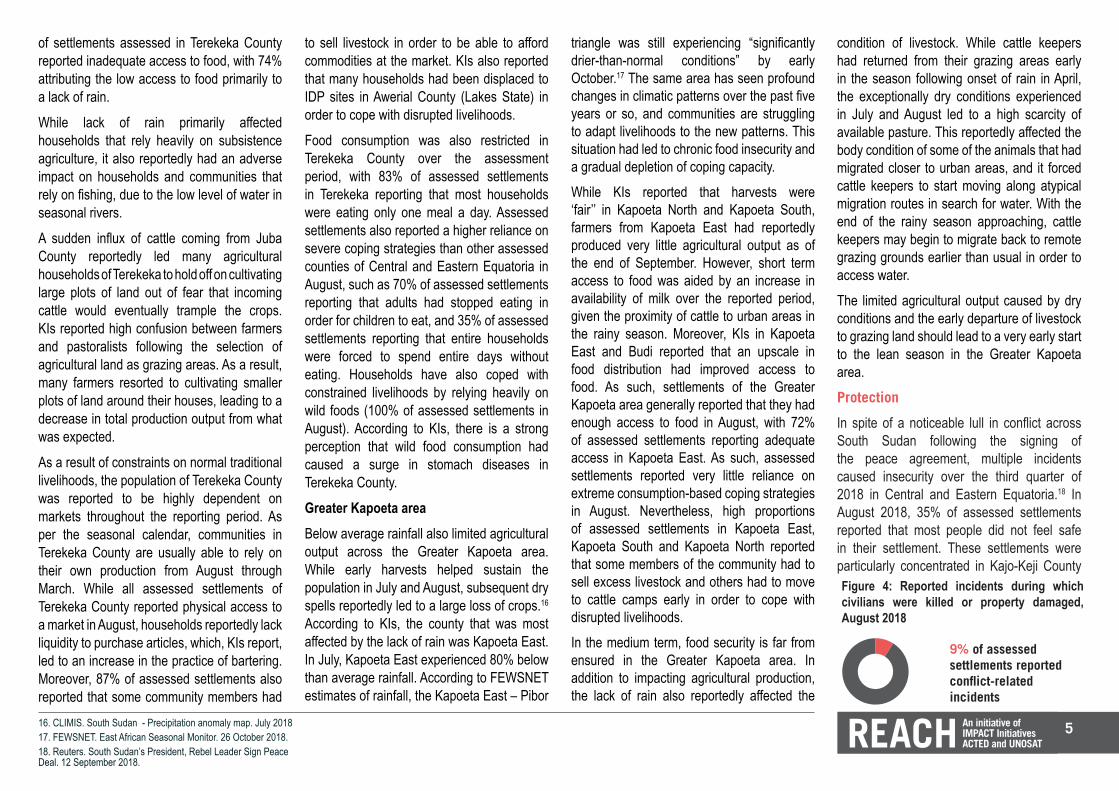
In spite of a noticeable lull in conflict across South Sudan following the signing of the peace agreement, multiple incidents caused insecurity over the third quarter of 2018 in Central and Eastern Equatoria.18 In August 2018, 35% of assessed settlements reported that most people did not feel safe in their settlement. These settlements were particularly concentrated in Kajo-Keji County
9% of assessed settlements reported conflict-related incidents
Figure 4: Reported incidents during which civilians were killed or property damaged, August 2018
9+91+A

6
and Morobo County, where tensions remained high in spite of the signing of a peace deal at the national level. Perception of insecurity was also reported by assessed settlements located in areas with high pastoralist presence. Cattle raiding was rampant over the period, and led to many loss of lives, especially in Kapoeta East and Terekeka Counties). Perceptions of insecurity appeared to be tied to a heavy and visible presence of armed actors who were moving along atypical routes as a result of decrees requesting them to go back to their areas of origin. Among settlements that reported that an incident of conflict had led to the loss of life of civilian(s) over the month prior to data collection, almost all were in pastoralist areas ; 31% of assessed settlements in Budi County in August, 19% of assessed settlements in Kapoeta East County, and 9% of assessed settlements in both Kapoeta South and Terekeka counties.In areas still believed to be affected by active conflict between armed actors such as Kajo-Keji and Morobo counties, sexual violence was most frequently cited as the main protection concern for women in the assessed settlements in August (61% and 67% of assessed settlements respectively). In all counties of the Greater Kapoeta area as well as in Terekeka County, the primary protection concern reported to be experienced by women was domestic violence. Among men, protection concerns mentioned by the assessed settlements were diverse in August, ranging from cattle raiding (15% of assessed settlements) to family separation (13%) and looting (12%). The most cited protection
concern among girls in the assessed settlements was early marriage (42% of assessed settlements). Among boys, a broad variety of concerns were cited, including the fear of harassment (10% of assessed settlements) and looting (9% of assessed settlements).Shelter
IDPs in Central and Eastern Equatoria States continued to face more restrictions in access to adequate shelter relative to host communities. While the majority (81%) of assessed settlements reported that most of the host community was living in tukuls in August, a bigger proportion of assessed settlements reported that IDPs were living in more precarious shelters such as abandoned structures (12% of assessed settlements) and rakoobas (18% of assessed settlements). In 9% of assessed settlements, it was reported that at least some IDPs were sleeping out in the open. These settlements were largely concentrated in Kajo-Keji County, where most shelters have reportedly been destroyed or looted over the past two years of conflict. The others were in Terekeka, where sudden onset displacement occured over the period following inter-communal tensions.Mosquito nets were the non-food item (NFI) most often cited to be needed by the assessed settlements. However, blankets were reported as the top NFI need among IDPs specifically. In Kajo-Keji County, 59% of assessed settlements reported that soap was the most needed NFI among IDPs in their community, while cooking pots was cited as the main
NFI need among IDPs in 69% of assessed settlements of Yei County.REACH KIs in areas like Torit and Magwi reported that disputes over ownership of shelters were starting to rise between those who were occupying the shelters prior to displacement and those who moved into the shelters following the other’s departure. With 68% of assessed settlements in Central and Eastern Equatoria reporting that people have returned from displacement and 46% among those reporting that such returns had occurred within the previous three months, Housing, Land and Property (HLP) is expected to become a central issue in areas where high proportions of the population were displaced by conflict, including most areas of Central and Eastern Equatoria States that border Uganda.Water, Sanitation and Hygiene (WASH)
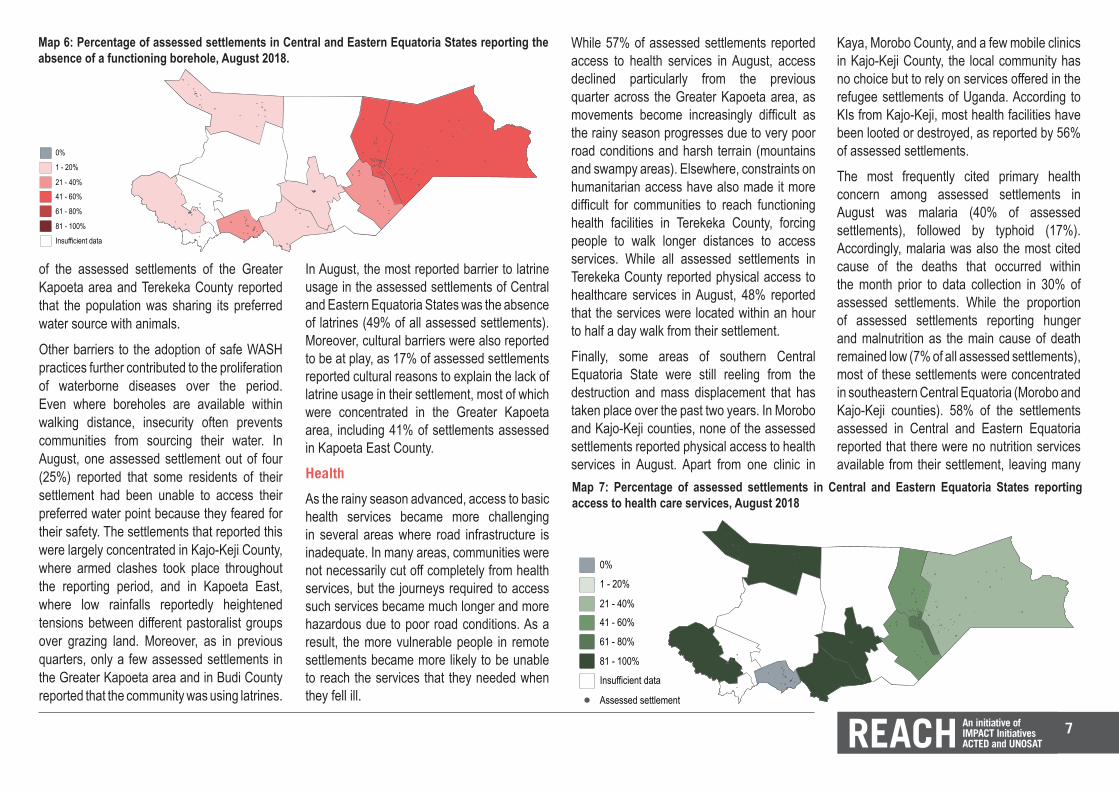
At the height of the rainy season, vulnerability to waterborne diseases continued to appear higher in the Greater Kapoeta area, where access to and use of adequate WASH infrastructure was reported to be severely limited. Assessed settlements in most of Central Equatoria State and the western portion of Eastern Equatoria State (Torit and Magwi counties), in comparison, tended to report better access to improved water sources.
In August 2018, 76% of assessed settlements across Central and Eastern Equatoria reported the presence of at least one borehole in their settlement. Among those, 90% reported that at least one of the boreholes was functioning properly. Overall, this means that 68% of all assessed settlements had access to a functioning borehole. In Kapoeta East, the county where access to an improved water source was reported to be the lowest, only 41% of assessed settlements reported access to a functionning borehole. According to KIs, local communities that have no access to boreholes tend to drink unfiltered water that they extract from dried up seasonal rivers by digging in the ground. It is not uncommon for local communities to share such water sources with their animals, further increasing the risk of transmission of a variety of zoonotic diseases. Regular access to improved water sources should continue to decline among the population over the next quarter. As the area enters in the dry season and pastoralist communities start searching for better pastures, these populations will be moving away from settlements equipped with WASH infrastructure. Even at the height of the wet season, when pastoralists are typically closer to permanently settled areas and therefore to improved water sources, a high proportion
Figure 5: Proportion of assessed settlements reporting primary health concern, August 2018.40+17+8Malaria 40%Typhoid 17%Hepatitis 8%
68% of assessed settlements reported access to a functioning borehole
Figure 6: Access to a functioning borehole, August 2018
68+32+A
7
While 57% of assessed settlements reported access to health services in August, access declined particularly from the previous quarter across the Greater Kapoeta area, as movements become increasingly difficult as the rainy season progresses due to very poor road conditions and harsh terrain (mountains and swampy areas). Elsewhere, constraints on humanitarian access have also made it more difficult for communities to reach functioning health facilities in Terekeka County, forcing people to walk longer distances to access services. While all assessed settlements in Terekeka County reported physical access to healthcare services in August, 48% reported that the services were located within an hour to half a day walk from their settlement.
Finally, some areas of southern Central Equatoria State were still reeling from the destruction and mass displacement that has taken place over the past two years. In Morobo and Kajo-Keji counties, none of the assessed settlements reported physical access to health services in August. Apart from one clinic in
In August, the most reported barrier to latrine usage in the assessed settlements of Central and Eastern Equatoria States was the absence of latrines (49% of all assessed settlements). Moreover, cultural barriers were also reported to be at play, as 17% of assessed settlements reported cultural reasons to explain the lack of latrine usage in their settlement, most of which were concentrated in the Greater Kapoeta area, including 41% of settlements assessed in Kapoeta East County. Health
As the rainy season advanced, access to basic health services became more challenging in several areas where road infrastructure is inadequate. In many areas, communities were not necessarily cut off completely from health services, but the journeys required to access such services became much longer and more hazardous due to poor road conditions. As a result, the more vulnerable people in remote settlements became more likely to be unable to reach the services that they needed when they fell ill.
of the assessed settlements of the Greater Kapoeta area and Terekeka County reported that the population was sharing its preferred water source with animals.
Other barriers to the adoption of safe WASH practices further contributed to the proliferation of waterborne diseases over the period. Even where boreholes are available within walking distance, insecurity often prevents communities from sourcing their water. In August, one assessed settlement out of four (25%) reported that some residents of their settlement had been unable to access their preferred water point because they feared for their safety. The settlements that reported this were largely concentrated in Kajo-Keji County, where armed clashes took place throughout the reporting period, and in Kapoeta East, where low rainfalls reportedly heightened tensions between different pastoralist groups over grazing land. Moreover, as in previous quarters, only a few assessed settlements in the Greater Kapoeta area and in Budi County reported that the community was using latrines.
Kaya, Morobo County, and a few mobile clinics in Kajo-Keji County, the local community has no choice but to rely on services offered in the refugee settlements of Uganda. According to KIs from Kajo-Keji, most health facilities have been looted or destroyed, as reported by 56% of assessed settlements.
The most frequently cited primary health concern among assessed settlements in August was malaria (40% of assessed settlements), followed by typhoid (17%). Accordingly, malaria was also the most cited cause of the deaths that occurred within the month prior to data collection in 30% of assessed settlements. While the proportion of assessed settlements reporting hunger and malnutrition as the main cause of death remained low (7% of all assessed settlements), most of these settlements were concentrated in southeastern Central Equatoria (Morobo and Kajo-Keji counties). 58% of the settlements assessed in Central and Eastern Equatoria reported that there were no nutrition services available from their settlement, leaving many
Assessed settlements reporting on health: physical access to facilities providing services - August 2018
A.indicator color (yes/no good)0%21 - 40%41 - 60%61 - 80%81 - 100%Insufficient data
1
Map based on Longitude (generated) and Latitude (generated) and Latitude (generated). For pane Latitude (generated): Color shows details about A.indicator color (yes/no good). Details are shown for County and Month Month. For pane Latitude (generated) (2): Size shows Settlement Size (Parameters). Details are shown for Namecounty. The data is filtered onMonth Month and State Label. The Month Month filter keeps August 2018. The State Label filter keeps Central Equatoria and Eastern Equatoria. The view is filtered on Latitude (generated), which keeps non-Null values only.
1 - 20%
21 - 40%
41 - 60%
61 - 80%
Insufficient data
0%
Assessed settlement
81 - 100%
Map 7: Percentage of assessed settlements in Central and Eastern Equatoria States reporting access to health care services, August 2018
Assessed settlements reporting on water and sanitation: absence of a functional borehole - August 2018
A.indicator color (yes/no bad)1 - 20%21 - 40%41 - 60%Insufficient data
1
Map based on Longitude (generated) and Latitude (generated) and Latitude (generated). For pane Latitude (generated): Color shows details about A.indicator color (yes/no bad). Details are shown for County and Month Month. For pane Latitude (generated) (2): Size shows Settlement Size (Parameters). Details are shown for Namecounty. The data is filtered onMonth Month and State Label. The Month Month filter keeps August 2018. The State Label filter keeps Central Equatoria and Eastern Equatoria. The view is filtered on Latitude (generated), which keeps non-Null values only.
Map 6: Percentage of assessed settlements in Central and Eastern Equatoria States reporting the absence of a functioning borehole, August 2018.
1 - 20%
21 - 40%
41 - 60%
61 - 80%
Insufficient data
0%
Assessed settlement
81 - 100%

8
About REACH REACH facilitates the development of information tools and products that enhance the capacity of aid actors to make evidence-based decisions in emergency, recovery and development contexts. All REACH activities are conducted through inter-agency aid coordination mechanisms. For more information, you can write to our in-country office: [email protected] or to our global office: [email protected]. Visit www.reach-initiative.org and follow us @REACH_info.
the rainy season due to exceptionally poor road infrastructure. Finally, education service delivery remained severely hampered by the impact of previous years of conflict in Kajo-Keji County, where 100% of assessed settlements reported that there was no physical access to education services from their settlement. Among those, 72% reported that the main reason for the lack of services was the destruction of facilities during conflict.
Reported attendance rates were much higher among boys than among girls, with 24% of assessed settlements where education services were available reporting that more than half of boys were attending school in the settlement, as opposed to 16% of girls. In those settlements where some boys and girls were reported to be out of school in spite of the availability of services within walking distance, the main reason cited as to why girls were out of school was high fees. In the midst of the harvest season in August, the main reason cited to explain why boys were out of school was that they had to work in the fields.
Conclusion
As the height of the wet season approached in Central and Eastern Equatoria States, access to services became constrained. As heavy rain flooded existing roads, more assessed settlements found themselves cut off from basic services such as healthcare, nutrition and education. Access to early harvests increased overall access to food in much of the area over the quarter, yet exceptionally dry conditions have led to a crop productivity far below expectations, including in Terekeka
households highly vulnerable.Finally, while no Ebola cases have been reported in South Sudan, the discovery of cases in areas of the Democratic Republic of Congo prompted humanitarian partners and the Ministry of Health to launch a full-fledged Ebola preparedness effort focusing on border areas of the Equatorias, and delivery of preparedness supplies and trainings has intensified throughout the period, especially among humanitarian partners in Yambio town, Maridi town, Juba town, Yei town and Nimule town.18
Education
Access to education services was found to be constrained over the quarter, with only 35% of settlements assessed in August in Central and Eastern Equatoria States reporting that education services were accessible from their settlement. Magwi County and Torit County were two clear exceptions, with respectively 89 and 87% of assessed settlements reporting physical access to services. It should however
be noted that settlements assessed in Magwi and Torit counties were largely located in urban areas within each respective state.
In areas where access to education services was reported to be lower, reasons provided varied considerably. In the Greater Kapoeta area, settlements that reported a lack of access to education services also largely reported that this was due to the long distance to the nearest facilities (43% in Kapoeta East). Walking distances that were acceptable for able-bodied residents during the dry season are no longer acceptable in the middle of
County, in the Greater Kapoeta area and along the Green Belt. Even in areas that are considered to be stable and more prone to high agricultural productivity such as Magwi, perception of food insecurity remained high among the assessed settlements. This was reportedly due to the combination of poor harvests, remaining pockets of insecurity and pressures created by a growing number of returnee households. Households continued to return from refugee settlements in Uganda toward Magwi, Torit and Ikotos Counties between July and September. Returns reportedly generated competition over resources, as well as a number of localized disputes over ownership of land and housing. Elsewhere, such as in southern Central Equatoria, the pace of returns remained slow due to continued insecurity.
Map 8: Percentage of assessed settlements in Central and Eastern Equatoria States reporting access to education services, August 2018.
Assessed settlements reporting on education: availability of services - August 20181
A.indicator color (yes/no good)0%1 - 20%61 - 80%81 - 100%Insufficient data
Map based on Longitude (generated) and Latitude (generated) and Latitude (generated). For pane Latitude (generated): Color shows details about A.indicator color (yes/no good). Details are shown for County and Month Month. For pane Latitude (generated) (2): Size shows Settlement Size (Parameters). Details are shown for Namecounty. The data is filtered onMonth Month and State Label. The Month Month filter keeps August 2018. The State Label filter keeps Central Equatoria and Eastern Equatoria. The view is filtered on Latitude (generated), which keeps non-Null values only.
1 - 20%
21 - 40%
41 - 60%
61 - 80%
Insufficient data
0%
Assessed settlement
81 - 100%
65+11+7+1625+5+6+65
65% None 65%
6% Less than half 11%
5% Half 7%
24% More than half 16%
Figure 7: Reported proportion of 6-17 year old girls and 6-17 year old boys attending school, August 2018.
18. WHO. Ebola Virus Disease Risk Map 2018.