Situation Assessment in Villa Nueva - urban-response.org · II. Household Case Studies ... The...
61
Western Washington University, 516 High Street, Bellingham WA 98225-9085 USA|+1 360.650.2707 www.wwu.edu/huxley/resilience Dr. Rebekah Green Dr. Scott Miles Walter Svekla Prepared for Oxfam-Great Britain Institute Working Paper 2009_1 July 2009 Situation Assessment in Villa Nueva Prospects for an Urban Disaster Risk Reduction Program in Guatemala City’s Precarious Settlements
Transcript of Situation Assessment in Villa Nueva - urban-response.org · II. Household Case Studies ... The...

Western Washington University, 516 High Street, Bellingham WA 98225-9085 USA|+1 360.650.2707
www.wwu.edu/huxley/resilience
Dr. Rebekah Green Dr. Scott Miles Walter Svekla Prepared for Oxfam-Great Britain Institute Working Paper 2009_1 July 2009
Situation Assessment in Villa Nueva
Prospects for an Urban Disaster Risk Reduction Program in Guatemala City’s Precarious
Settlements

2
Situation Assessment -Green et al. Working Paper 2009_1
July 2009
TABLE OF CONTENTS
Summary .......................................................................................................................................... 3
Introduction and Background .......................................................................................................... 3
I. Household Surveys ........................................................................................................................ 6
Response Summaries to Survey Questions .................................................................................. 9
Synthesis and Discussion ........................................................................................................... 32
II. Household Case Studies ............................................................................................................. 35
Young Mother at Ravine Edge ................................................................................................... 35
Large Family ............................................................................................................................... 37
Construction Worker and His Elderly Mother ........................................................................... 38
III. Focus Groups ............................................................................................................................. 40
Outline of Community Issues ..................................................................................................... 40
Major Problems...................................................................................................................... 40
Major Risks ............................................................................................................................. 41
Community Mapping of Issues .................................................................................................. 43
Las Brisas Community Mapping ............................................................................................. 43
Unidos 8 de Marzo Community Mapping .............................................................................. 46
Joint Discussion .......................................................................................................................... 49
Interest in Additional Knowledge .............................................................................................. 49
IV. Organizational Analysis ............................................................................................................. 51
Institutional Analysis Results ..................................................................................................... 51
Institutional Analysis Discussion ................................................................................................ 55
V. Emerging Themes ...................................................................................................................... 57
Flooding and Inadequate Drainage ............................................................................................ 57
Slope Instability and Residents’ Perception of Flooding and Refuse Management .................. 58
Conflicts between Formal and Informal Settlements ................................................................ 59
Competing Jurisdictions and Missions ....................................................................................... 60
VI. Prospects for an Urban Disaster Risk Reduction Program........................................................ 60
Works Cited .................................................................................................................................... 61

3
Situation Assessment -Green et al. Working Paper 2009_1
July 2009
SUMMARY
In 2009, Oxfam-Great Britain in Guatemala asked The Resilience Institute of Western Washington
University to conduct a situation assessment of two informal communities in the outskirts of Guatemala
City, Guatemala. Oxfam sought to assess the potential for developing an urban disaster risk reduction
program within the metropolitan’s precarious settlements – informal settlements along the steep
embankments of ravines. These settlements are often rapidly constructed overnight using temporary
materials, with little possibility for considering the prevalent risk of landslides and seismic activity.
Because residents build these squatter settlements without municipal approval, the settlements are
considered illegal and often remain un-serviced for years.
The situation assessment took place in two pilot communities, located 16 kilometers south of the capital
Guatemala City in the municipality Villa Nueva. More specifically they are located in the El Mezquital
area and are called Las Brisas and Unidos 8 de Marzo. There, as elsewhere in the region, precarious
squatter settlements experience seasonal landslides, heavy rains, and reoccurring damage to their
property. The situation assessment included 65 household surveys, a physical risk assessment,
community focus group discussions, and meetings with national emergency management
representatives, local universities, research institutions, and municipal planning department. The
situation assessment formed a basis on which the Resilience Institute has worked with Oxfam-Great
Britain in Guatemala to formulate an initial disaster risk reduction framework. This framework is
applicable for many communities in Guatemala and the rest of Latin America, and is elaborated on in a
separate document.
The following section gives a brief overview of informal settlements in Guatemala, and in El Mezquital in
particular. This is followed by a detailed analysis of the household survey, a summary of the focus group
discussions, three case studies of settlement households, and a brief institutional analysis. The
document concludes with a brief synthesis of the work, through a discussion of 4 emerging themes and
a brief discussion about prospects for urban DRR in Guatemala City. Strategies for implementing a DRR
program are more fully elaborated in the companion document – Urban DRR Framework for
Guatemala’s Precarious Settlements.
INTRODUCTION AND BACKGROUND
Guatemala is located in Central America and is home to almost 13,000,000 people. It has high levels of
inequality throughout the country and is ranked 121 out of 179 on the United Nation’s Development
Programme’s Human Development Index (UNDP, 2008). Due to its high inequalities and poverty poorer
residents have built many informal settlements, especially in and around Guatemala City. The
metropolitan population in Guatemala City is 823,301 with 250,000 of those living in informal precarious
settlements (Diaz et al. 2000).
4
Situation Assessment -Green et al. Working Paper 2009_1
July 2009
Guatemala’s unstable political history is an underlying factor which has contributed to an increased level
of vulnerability for informal settlements. Years of social, economic, and political corruption and
inequality has deteriorated the local community’s trust and faith in the national level government.
Guatemalan politics lack transparency and accountability and have repeatedly failed to provide support
for its citizen’s. The main source of the law is the constitution of 1985 which was amended in 1993. It is
largely ineffectual. The lack of government influence in Guatemala has established it as one of the most
violent countries in Latin America, with almost 6,000 people murdered there last year. That is 46 victims
per 100,000 people, a rate eight times higher than in the United States (Rosenberg, 2008). The people of
Guatemala have limited political rights. A high degree of corruption exists in the country, especially in
the administrative, judiciary and corporate sectors. Efforts to promote transparency have made little
progress.
The 1976 earthquake marks the beginnings of a class struggle that has heavily influenced Guatemalan
society. The earthquake was a 7.5 magnitude centered in the Motagua Fault, about 160 km northeast of
Guatemala City. Over 22,000 people lost their lives in the quake, especially those that were living in
unsafe housing in the rural highlands and in informal squatter settlements. Those living in informal
settlements, primarily Mayan Indians, suffered the highest mortality rate. Residents of middle class
homes, which were better protected and more safely sited, experienced less destruction.
Disproportionate recovery efforts further segregated the populations. “The earthquake tore open many
holes in the social fabric which had already been stretched thin. The rich and those in power came out
richer and the poor came out poorer, and the differences and inequalities became more visible” (Davis
and Hodsen 1982, 15).
After the earthquake, years of civil war and genocide against the rural Mayan majority dominated the
political context of the country, further breaking down the governmental organization established to
ensure the livelihoods of their citizens. During this time, government soldiers herded hundreds of
thousands of Mayans into new settlements; others took refuge in remote forested mountains. These
population movements often involved marginalized people forced into marginal, precarious places.
The long civil wars and political unrest has undermined the ability of the central government to prevent
or mitigate hazard events. The Guatemalan poor have been caught up in a vicious cycle where a lack of
access to a means of social and self-protection has made them perpetually vulnerable to disaster after
disaster (Wisner 2000, 9).
Currently, there is a serious lack of affordable housing in areas that are near places of steady
employment. This political environment has established a situation that favors a migratory invasion
tactic for those who live in conditions beyond their means. Populations are driven to settle in precarious
areas susceptible to hazards. Most of the poorest housing exists in ravines and gorges which are highly
susceptible to landslides.

5
Situation Assessment -Green et al. Working Paper 2009_1
July 2009
The informal settlements are established by an invasion tactic often organized by a community leader.
All on the same day, a population leaves the formalized housing areas to take over a plot of land. Many
use the invasion to escape from oppressive and unaffordable conditions they experience in formal
sector rentals. Others join the invasion opportunistically. The prospect of owning or occupying land
informally is often too powerful to prevent settlements from establishing in highly vulnerable areas.
A study in 2009 of Knowledge, Attitudes and Practices of residents of informal settlements in the
Guatemala Metropolitan Area showed that community leaders know that they choose to live in an area
of high risk. They also know that they should not build houses larger than one story, and that their
building increases the environmental degradation. However, they believe that due to their economic
conditions they cannot aspire to live in a better place (KAP, 2008, 12). In most places there is no
organization in the event of a disaster and no plan to evacuate in case of an emergency (KAP, 2008, 15,
32). Many community leaders have expressed interest in developing a local Integrated Emergency Plan
(KAP, 2008, 73).
In informal settlements, houses are usually built incrementally over a number of years, with materials of
diverse origin and quality, and not always following accepted techniques. These houses rarely comply
with official safety standards and there are no controls in place to regulate safety. Standardized building
materials for housing like concrete, bricks and steel, are scarce and expensive, which makes it very
difficult for residents to properly reinforce their homes. Residents often resort to scavenging materials
like corrugated metal sheeting and other scraps or discarded resources. This results in haphazard and
unreliable construction. There are not many inflows of money into the informal settlements, thus
residents have a serious lack of capital for making significant structural improvements. Infrastructure is
limited and poorly maintained in the settlements. Residents often illegally tap electricity from more
developed neighborhoods and water is in limited supply. Formalized garbage disposal is infrequent and
often under-utilized; instead residents throw their garbage into the streets and the ravines.
The residents of El Mezquital describe the conditions of the terrain at the time of the invasion as “filthy
and stripped of vegetation” (Diaz et al. 2000). The initial invasion by thousands of families aggravated
these conditions. The lack of water, the discarded waste, the precarious dwellings, and overcrowding
resulted in a very low quality of life as well as high levels of mortality and morbidity, particularly for
children.
Since the initial invasions of El Mezquital however, there have been significant developments. After 15
years of community work, supported by external organizations, almost all the families in the settlement
of El Mezquital have access to water. COIVEES, a government agency, supplies 2,537 water meters with
clean, good quality water 365 days per year to El Mezquital, a much better service than most residential
areas receive in the rest of the city, including middle- and upper-income areas. The cost of getting
connected to the water system is 550 Quetzales for members of the Cooperative and 650 Quetzales for
non-members. The cost of water supplied by COIVEES is relatively low compared to the other providers
(Diaz et al. 2000). Ninety-five per cent of families have electricity in their homes (Diaz et al. 2000). The

6
Situation Assessment -Green et al. Working Paper 2009_1
July 2009
entire population of El Mezquital, some 3,500 families, has sewers and rainwater drains in their areas
(Diaz et al. 2000). Unfortunately, these drains are not properly maintained and often get clogged,
worsening flooding hazard.
Those living in the settlements discussed landslides and flooding as the most significant hazards to which
their community is susceptible. Eighty eight percent of Guatemala City is located in areas that have low
to moderate risk of landslides, while 10% is at high risk and 2% at very high risk (Diaz et al. 2000). The
winter months are a time of heightened level of vulnerability to hazards. Residents experience large
amounts of rainfall, which often flood into the streets due to clogged drains and increases soil
saturation, making the area more prone to landslides. Flooding and landslides combined repeatedly to
devastate the already dilapidated housing as water flows into homes and dislodges them.
I. HOUSEHOLD SURVEYS
Western Washington University, through its Institute for Global and Community Resilience, with the
support of Oxfam, surveyed 64 households within two precarious settlements located in the
municipality of Villa Nueva during the weekend of March 22-23, 2009. Both settlements are within the El
Mezquital area of Villa Nueva, a municipality part of the Greater Metropolitan Area of Guatemala City.
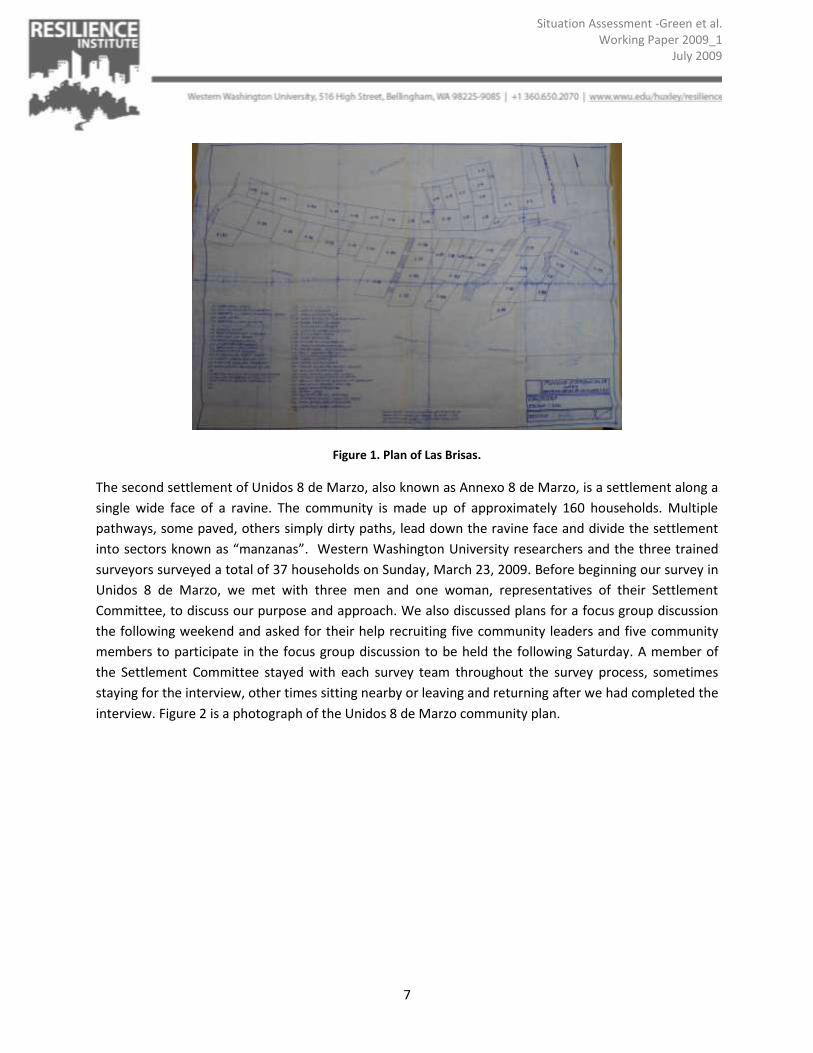
The first settlement of Las Brisas, officially known as Brisas de Villa Lobos, consists of approximately 50
households spread primarily along a single path following a ridge finger. Several side paths lead down
into the ravine with a minority of households on the more modest upper slopes of the ravine. Western
Washington University researchers and three trained surveyors associated with Oxfam surveyed a total
of 27 residents on Saturday, March 22, 2009. We were welcomed into the community by three women
who were leaders in the Settlement Committee. They led us to each home and often introduced us to
the residents before we started the survey. Figure 1 is a photograph of the Las Brisas community plan.
7
Situation Assessment -Green et al. Working Paper 2009_1
July 2009
Figure 1. Plan of Las Brisas.
The second settlement of Unidos 8 de Marzo, also known as Annexo 8 de Marzo, is a settlement along a
single wide face of a ravine. The community is made up of approximately 160 households. Multiple
pathways, some paved, others simply dirty paths, lead down the ravine face and divide the settlement
into sectors known as “manzanas”. Western Washington University researchers and the three trained
surveyors surveyed a total of 37 households on Sunday, March 23, 2009. Before beginning our survey in
Unidos 8 de Marzo, we met with three men and one woman, representatives of their Settlement
Committee, to discuss our purpose and approach. We also discussed plans for a focus group discussion
the following weekend and asked for their help recruiting five community leaders and five community
members to participate in the focus group discussion to be held the following Saturday. A member of
the Settlement Committee stayed with each survey team throughout the survey process, sometimes
staying for the interview, other times sitting nearby or leaving and returning after we had completed the
interview. Figure 2 is a photograph of the Unidos 8 de Marzo community plan.

8
Situation Assessment -Green et al. Working Paper 2009_1
July 2009
Figure 2. Plan of Unidos 8 de Marzo.
Table 1 is a brief summary of the people interviewed for the 64 household surveys:
Table 1. Number of surveys and average age of person surveyed, by sex.
Las Brisas Unidos 8 de Marzo
Count Average age Count Average
age
Men 1 68 12 29
Women 26 36 25 34
TOTAL 27 37 37 32
9
Situation Assessment -Green et al. Working Paper 2009_1
July 2009
Response Summaries to Survey Questions
Question 1. How many people live in your house?
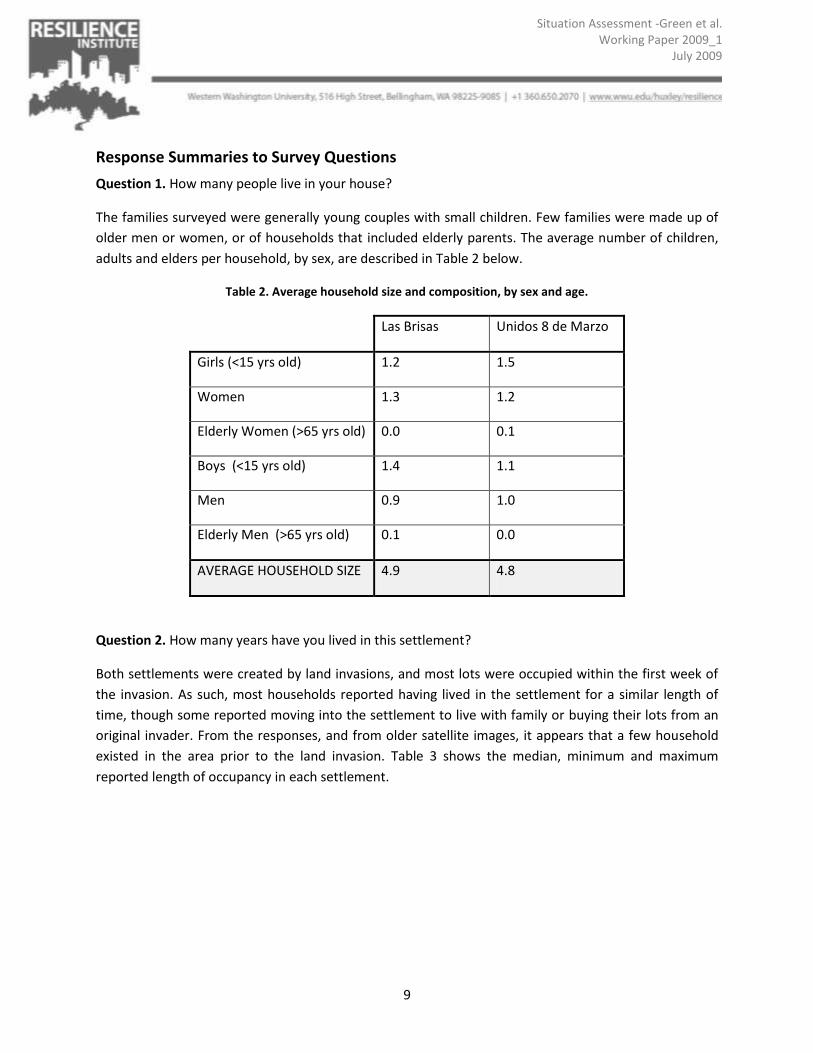
The families surveyed were generally young couples with small children. Few families were made up of
older men or women, or of households that included elderly parents. The average number of children,
adults and elders per household, by sex, are described in Table 2 below.
Table 2. Average household size and composition, by sex and age.
Las Brisas Unidos 8 de Marzo
Girls (<15 yrs old) 1.2 1.5
Women 1.3 1.2
Elderly Women (>65 yrs old) 0.0 0.1
Boys (<15 yrs old) 1.4 1.1
Men 0.9 1.0
Elderly Men (>65 yrs old) 0.1 0.0
AVERAGE HOUSEHOLD SIZE 4.9 4.8
Question 2. How many years have you lived in this settlement?
Both settlements were created by land invasions, and most lots were occupied within the first week of
the invasion. As such, most households reported having lived in the settlement for a similar length of
time, though some reported moving into the settlement to live with family or buying their lots from an
original invader. From the responses, and from older satellite images, it appears that a few household
existed in the area prior to the land invasion. Table 3 shows the median, minimum and maximum
reported length of occupancy in each settlement.

10
Situation Assessment -Green et al. Working Paper 2009_1
July 2009
Table 3. Length of occupancy in settlement in years.
Las Brisas
Unidos 8 de
Marzo
Median 6 8
Maximum 9 9
Minimum 0.5 1
Question 3. Why did you come to live in this settlement?
Table 4 illustrates the varied reasons respondents moved into the two settlements. When asked why
they had come to live in the settlement, two thirds of the survey respondents spoke about renting
elsewhere before invading the ravine. Most noted that rent was too expensive, that rent had increased,
or that they had not paid rent and were evicted or pressured to leave. Some simply noted that they had
been renting, learned of the invasion and came. Their answers implied that renting was not desirable, in
comparison to “owning” a piece of land, even if it was not legally theirs.
About 14% of the respondents noted wanting or needing their own place to live as the primary reason
for coming to the settlement. These respondents mentioned living with family, in other formal and
informal settlements, and needing a space for a family of their own. For instance, one woman
mentioned that there were no vacant lots in the informal settlement where her extended family lived.
Some respondents mentioned that they moved to the settlement to not only eliminate rental costs, but
because landlords did not want families with children to rent their apartments.
Four respondents, representing 6% of the total, had been displaced from other communities. Three of
these had been displaced from coastal towns devastated by Hurricane Stan. With the destruction of
their homes on the coast, they had come because of familial ties to someone already living in the
settlements.
About 14% did not give a direct reason for moving to the settlement. Instead they mentioned that they
learned of the invasion, saw it as an opportunity, and took it. Some came to join other family members;
others simply saw signs of invasion or heard of it through family, neighbors, or community leaders. Two
families mentioned that they came because they were having trouble raising their children in their
previous location.

11
Situation Assessment -Green et al. Working Paper 2009_1
July 2009
Table 4. Reasons for coming to the settlement.
Las Brisas Unidos 8 de Marzo Both Settlements
Rent 15 55% 27 73% 42 66%
Need own place to live 4 25% 5 14% 9 14%
Displacement 3 22% 1 3% 4 6%
Saw opportunity 5 18% 4 10% 9 14%
TOTAL 27 100% 37 100% 64 100%
Question 4. How did you come to obtain your lot?
When asked how they obtained their property, most interviewees responded that they purchased the
land or simply obtained it through occupying the land. A few mentioned that they received the plot as a
gift from a family member or from the settlement community. This latter option most likely refers to
people who lived in the settlement previously, but lost their homes due to erosion and were resettled
on a new land plot.
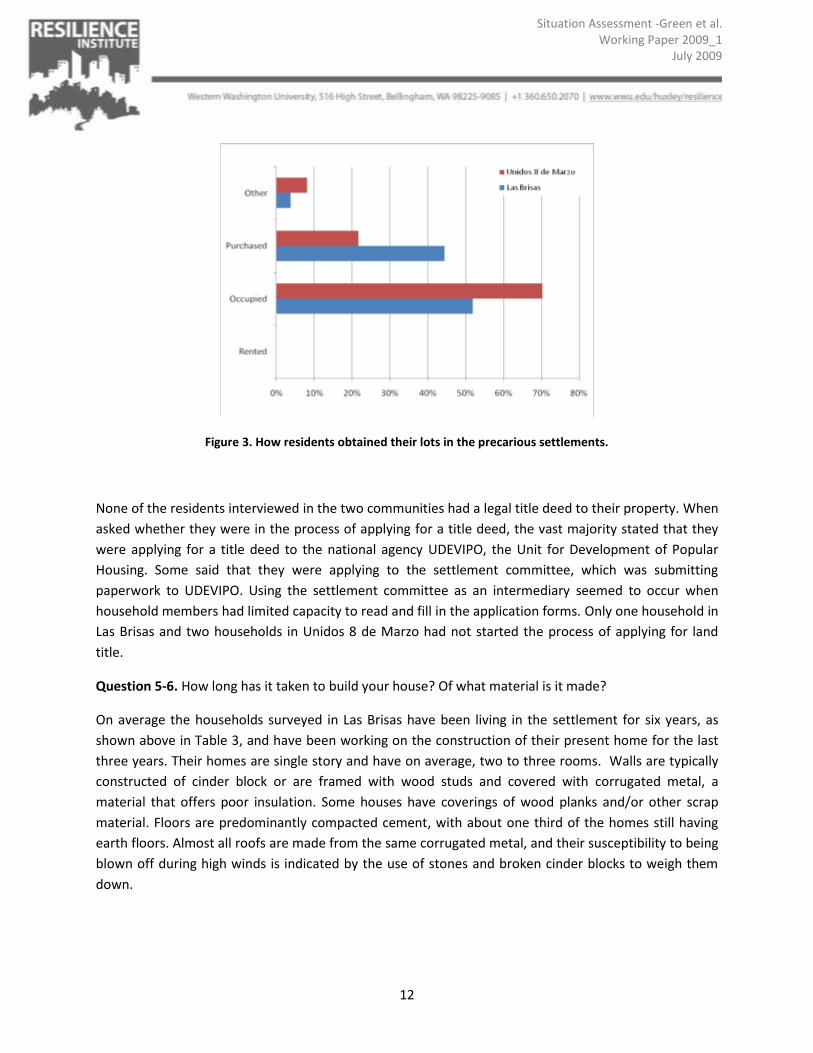
While not the focus of the survey, the results of this question suggest a different strategy for invasion
between the two settlements. In Unidos 8 de Marzo, 70% the households surveyed stated they obtained
land through direct invasion and occupancy, while less than a quarter stated that they had purchased
the land. In contrast, 44% of the households surveyed in Las Brisas stated that they had purchased the
land with 52% saying they had obtained it through direct invasion. It is possible that the purchase of
land refers to the practice of community leaders organizing a land invasion and then “selling” the land to
those who desire to invade. If so, it appears that this practice was more widespread in Las Brisas than in
Unidos 8 de Marzo. Figure 3 illustrates how land acquisition varied among respondents.
12
Situation Assessment -Green et al. Working Paper 2009_1
July 2009
Figure 3. How residents obtained their lots in the precarious settlements.
None of the residents interviewed in the two communities had a legal title deed to their property. When
asked whether they were in the process of applying for a title deed, the vast majority stated that they
were applying for a title deed to the national agency UDEVIPO, the Unit for Development of Popular
Housing. Some said that they were applying to the settlement committee, which was submitting
paperwork to UDEVIPO. Using the settlement committee as an intermediary seemed to occur when
household members had limited capacity to read and fill in the application forms. Only one household in
Las Brisas and two households in Unidos 8 de Marzo had not started the process of applying for land
title.
Question 5-6. How long has it taken to build your house? Of what material is it made?
On average the households surveyed in Las Brisas have been living in the settlement for six years, as
shown above in Table 3, and have been working on the construction of their present home for the last
three years. Their homes are single story and have on average, two to three rooms. Walls are typically
constructed of cinder block or are framed with wood studs and covered with corrugated metal, a
material that offers poor insulation. Some houses have coverings of wood planks and/or other scrap
material. Floors are predominantly compacted cement, with about one third of the homes still having
earth floors. Almost all roofs are made from the same corrugated metal, and their susceptibility to being
blown off during high winds is indicated by the use of stones and broken cinder blocks to weigh them
down.
13
Situation Assessment -Green et al. Working Paper 2009_1
July 2009
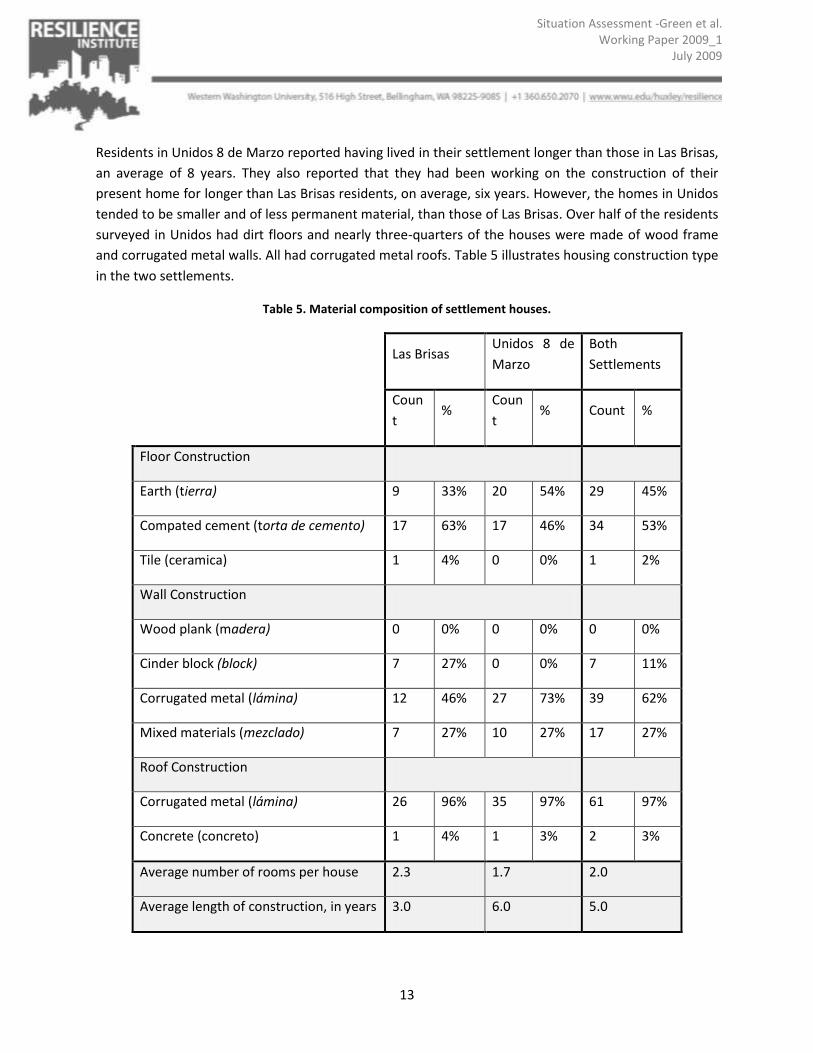
Residents in Unidos 8 de Marzo reported having lived in their settlement longer than those in Las Brisas,
an average of 8 years. They also reported that they had been working on the construction of their
present home for longer than Las Brisas residents, on average, six years. However, the homes in Unidos
tended to be smaller and of less permanent material, than those of Las Brisas. Over half of the residents
surveyed in Unidos had dirt floors and nearly three-quarters of the houses were made of wood frame
and corrugated metal walls. All had corrugated metal roofs. Table 5 illustrates housing construction type
in the two settlements.
Table 5. Material composition of settlement houses.
Las Brisas Unidos 8 de
Marzo
Both
Settlements
Coun
t %
Coun
t % Count %
Floor Construction
Earth (tierra) 9 33% 20 54% 29 45%
Compated cement (torta de cemento) 17 63% 17 46% 34 53%
Tile (ceramica) 1 4% 0 0% 1 2%
Wall Construction
Wood plank (madera) 0 0% 0 0% 0 0%
Cinder block (block) 7 27% 0 0% 7 11%
Corrugated metal (lámina) 12 46% 27 73% 39 62%
Mixed materials (mezclado) 7 27% 10 27% 17 27%
Roof Construction
Corrugated metal (lámina) 26 96% 35 97% 61 97%
Concrete (concreto) 1 4% 1 3% 2 3%
Average number of rooms per house 2.3 1.7 2.0
Average length of construction, in years 3.0 6.0 5.0

14
Situation Assessment -Green et al. Working Paper 2009_1
July 2009
Question 7, 10, 12. Do you have sanitation, electricity, phone and television?
Over 90% of residents in both settlements reported having electricity in their home. Despite being the
newer settlement, 100% of those surveyed in Las Brisas had a toilet on their lot or in their house. A
slightly smaller percentage, 94%, or residents in Unidos 8 de Marzo had a toilet. Television and cell
phone ownership was over 80% for both settlements, though slightly lower for Unidos. Table 6
illustrates the percentage of respondents with electricity, phone and television.
Table 6. Percent households with electricity, phone and television.
Las Brisas Unidos 8 de
Marzo
Toilet 100% 94%
Electricity 93% 92%
Phone or cell phone 93% 80%
Television 89% 81%
Question 7a. Who do you pay for electricity?
While over 90% of the residents surveyed had electricity, payment for that electricity varied. Table 7
shows respondents means of electricity acquisition. The majority paid the electric company or
municipality. Because electricity was not metered at each individual lot, residents chipped in to cover
the cost of the electricity for the entire community or for section of the settlement. Some residents
reported taking electricity from a neighbor and paying them accordingly. A small percentage of
respondents reported not paying at all, though community leaders suggested that the percentage of
people in the community who did not regularly contribute to the electricity bill was actually quite high.

15
Situation Assessment -Green et al. Working Paper 2009_1
July 2009
Table 7. Electricity acquisition.
Las Brisas Unidos 8 de
Marzo Both Settlements
Count % Count % Count %
Electric company or municipality
(Empresa de
electricidad/municipio)
22 88% 19 56% 41 70%
Neighbor
(un vecino) 2 8% 14 41% 16 27%
We do not pay
(no pagamos) 1 4% 1 3% 2 3%
TOTAL 25 100% 34 100% 59 100%
Question 8. How do you get water?
All of the Las Brisas residents had piped water into their home or outdoor kitchen area. Only 60% of the
residents surveyed in Unidos 8 de Marzo had piped water. Twenty-three percent bought water from a
neighbor who did have piped water, and another 17% bought water through other means such as
purchasing from a water truck in the legal neighborhood above or from a store, and rainwater
catchment. Table 8 shows how respondents in the two communities access water.

16
Situation Assessment -Green et al. Working Paper 2009_1
July 2009
Table 8. Water acquisition.
Las Brisas Unidos 8 de
Marzo Both Settlements
Count % Count % Coun
t %
Piped water system
(Red/tuberia) 27
100
% 11 30% 38 60%
Buy from neighbor
(se la vende el vecino) 0 0% 15 40% 15 23%
Other
(Otro) 0 0% 11 30% 11 17%
TOTAL 27 100
% 37 100% 64 100%
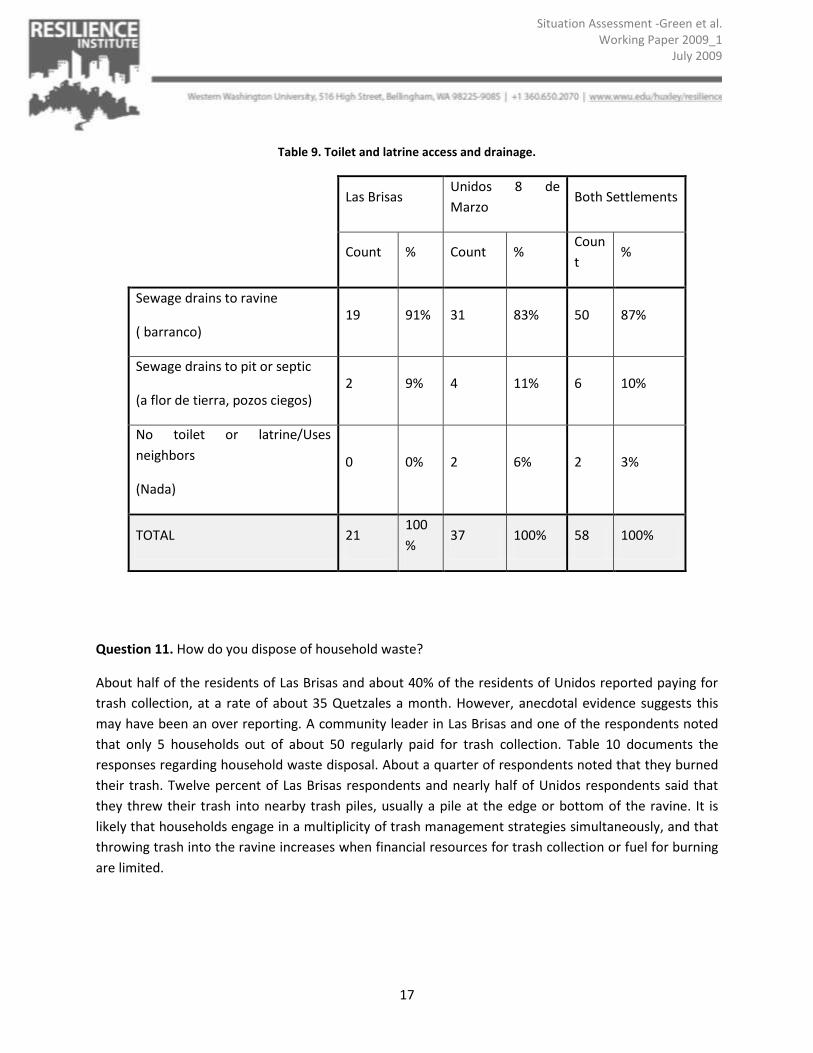
Question 9. To where does your toilet drain?
All residents interviewed in Las Brisas had toilets or latrines on their property, while 94% of Unidos
residents had toilets or latrines. None of the sewage from these toilets entered the municipal sewage
treatment system. Rather, the overwhelming majority of sewage and waste water connected to an
informal settlement drainage system that emptied into the ravine just below the lower edge of the
settlement. A small fraction had sewage pits. Table 9 shows toilet and latrine access and drainage in the
two settlements.
17
Situation Assessment -Green et al. Working Paper 2009_1
July 2009
Table 9. Toilet and latrine access and drainage.
Las Brisas Unidos 8 de
Marzo Both Settlements
Count % Count % Coun
t %
Sewage drains to ravine
( barranco) 19 91% 31 83% 50 87%
Sewage drains to pit or septic
(a flor de tierra, pozos ciegos) 2 9% 4 11% 6 10%
No toilet or latrine/Uses
neighbors
(Nada)
0 0% 2 6% 2 3%
TOTAL 21 100
% 37 100% 58 100%
Question 11. How do you dispose of household waste?
About half of the residents of Las Brisas and about 40% of the residents of Unidos reported paying for
trash collection, at a rate of about 35 Quetzales a month. However, anecdotal evidence suggests this
may have been an over reporting. A community leader in Las Brisas and one of the respondents noted
that only 5 households out of about 50 regularly paid for trash collection. Table 10 documents the
responses regarding household waste disposal. About a quarter of respondents noted that they burned
their trash. Twelve percent of Las Brisas respondents and nearly half of Unidos respondents said that
they threw their trash into nearby trash piles, usually a pile at the edge or bottom of the ravine. It is
likely that households engage in a multiplicity of trash management strategies simultaneously, and that
throwing trash into the ravine increases when financial resources for trash collection or fuel for burning
are limited.

18
Situation Assessment -Green et al. Working Paper 2009_1
July 2009
Table 10. Disposal of household waste.
Las Brisas Unidos 8 de
Marzo Both Settlements
Count % Count % Coun
t %
Pay for trash collection
(cuentan servicio de
recoleccion)
13 50% 12 32% 25 39%
Burn it
(la quemamos) 10 38% 8 22% 18 29%
Throw it in a trash pile nearby
(la tiramos en algun lugar cerca) 3 12% 17 46% 20 32%
TOTAL 26 100
% 37 100% 63 100%
Question 13. In your opinion, what is the biggest problem in your settlement?
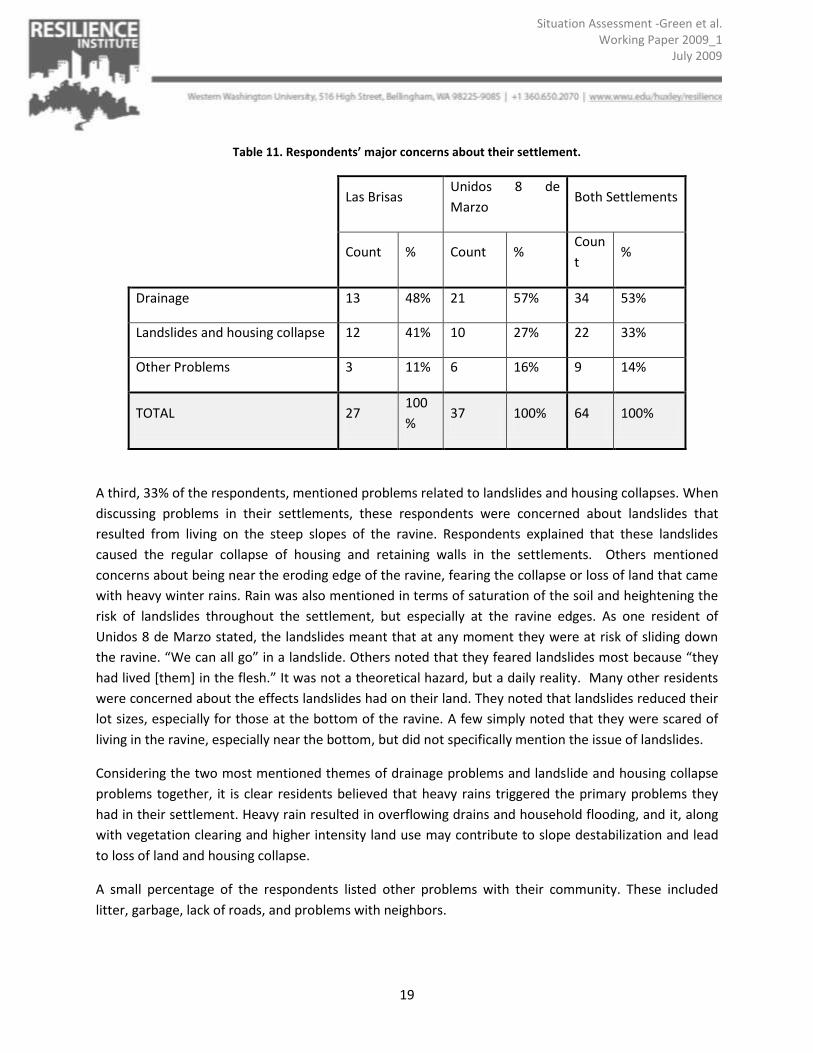
Table 11 illustrates respondents’ perceptions of problems in their community. Half of the respondents
mentioned rain and water related problems as the biggest problem in their settlement. Most
respondents saw rain as a serious problem because of ineffective and inadequate drainage. Rainwater
and overflowing sewage water regularly ran down the pathways and through homes in the winter. As
one Las Brisas women stated, “When it rains the water can clog the drains. All the water comes and
floods houses.” Others noted that rain water from the roofs and eaves of one house often poured water
onto downhill neighbors, flooding their insides, collapsing the downhill house or destroying precarious
retaining walls between lots. Many mentioned that litter clogged drains, exacerbating the drainage
problem during heavy downpours.
19
Situation Assessment -Green et al. Working Paper 2009_1
July 2009
Table 11. Respondents’ major concerns about their settlement.
Las Brisas Unidos 8 de
Marzo Both Settlements
Count % Count % Coun
t %
Drainage 13 48% 21 57% 34 53%
Landslides and housing collapse 12 41% 10 27% 22 33%
Other Problems 3 11% 6 16% 9 14%
TOTAL 27 100
% 37 100% 64 100%
A third, 33% of the respondents, mentioned problems related to landslides and housing collapses. When
discussing problems in their settlements, these respondents were concerned about landslides that
resulted from living on the steep slopes of the ravine. Respondents explained that these landslides
caused the regular collapse of housing and retaining walls in the settlements. Others mentioned
concerns about being near the eroding edge of the ravine, fearing the collapse or loss of land that came
with heavy winter rains. Rain was also mentioned in terms of saturation of the soil and heightening the
risk of landslides throughout the settlement, but especially at the ravine edges. As one resident of
Unidos 8 de Marzo stated, the landslides meant that at any moment they were at risk of sliding down
the ravine. “We can all go” in a landslide. Others noted that they feared landslides most because “they
had lived [them] in the flesh.” It was not a theoretical hazard, but a daily reality. Many other residents
were concerned about the effects landslides had on their land. They noted that landslides reduced their
lot sizes, especially for those at the bottom of the ravine. A few simply noted that they were scared of
living in the ravine, especially near the bottom, but did not specifically mention the issue of landslides.
Considering the two most mentioned themes of drainage problems and landslide and housing collapse
problems together, it is clear residents believed that heavy rains triggered the primary problems they
had in their settlement. Heavy rain resulted in overflowing drains and household flooding, and it, along
with vegetation clearing and higher intensity land use may contribute to slope destabilization and lead
to loss of land and housing collapse.
A small percentage of the respondents listed other problems with their community. These included
litter, garbage, lack of roads, and problems with neighbors.

20
Situation Assessment -Green et al. Working Paper 2009_1
July 2009
Question 14. In your neighborhood, there are many risks from landslides, fires, earthquakes, floods, and
hurricanes. What hazard concerns you most and why?
When asked which natural hazard affecting their community was the most serious, respondents
overwhelmingly chose landslides over fire, earthquake, flood, hurricane and none. As noted in Figure 4,
over three-quarters of the residents were most concerned about landslides. Of these, a third spoke
about landslides in connection with the weather patterns of the region. Respondents reported that
heavy rains in the winter, combined with sandy soil, resulted in unstable ground. They stated that they
felt the constant threat of landslides when it rained.
Three residents of Unidos and one Las Brisas resident did not see the threat of landslides as only a result
of heavy rains. Rather, they mentioned issues of poor drainage and trash clogging the drains. One
resident of Unidos explained that “There is a lot of trash up there [in the formal settlement] and the
drains overflow and the water falls into our homes.” Another woman noted that “when it rained, water
went everywhere.” The heavy rains overflowed the drains, ran through their homes, and soaked into the
soil. Thus, landslide risk was understood by settlement residents as linked to issues of urban planning
associated with drainage and the inadequate handling of rubbish.
Figure 4. Natural hazard about which respondents were most concerned.
A minority of respondents, 12% of all surveyed, said they were most concerned about flood events. They
reported that rain water got everywhere, causing mud, clogging drains and pooling in ways that
respondents believed resulted in health hazards. One resident also mentioned that excess water
engorged the river below the settlement. Those that mentioned hurricanes, about 6% of respondents,
noted that the heavy winds and rains pulled off corrugated tin roofs and forced the evacuation of their
families or neighbors. Others mentioned that hurricanes resulted in the flooding and landslides which
concerned other residents. Only one resident mentioned earthquakes as a major concern. He was most
concerned about this hazard because he viewed it as an act of God that no human could control.
21
Situation Assessment -Green et al. Working Paper 2009_1
July 2009
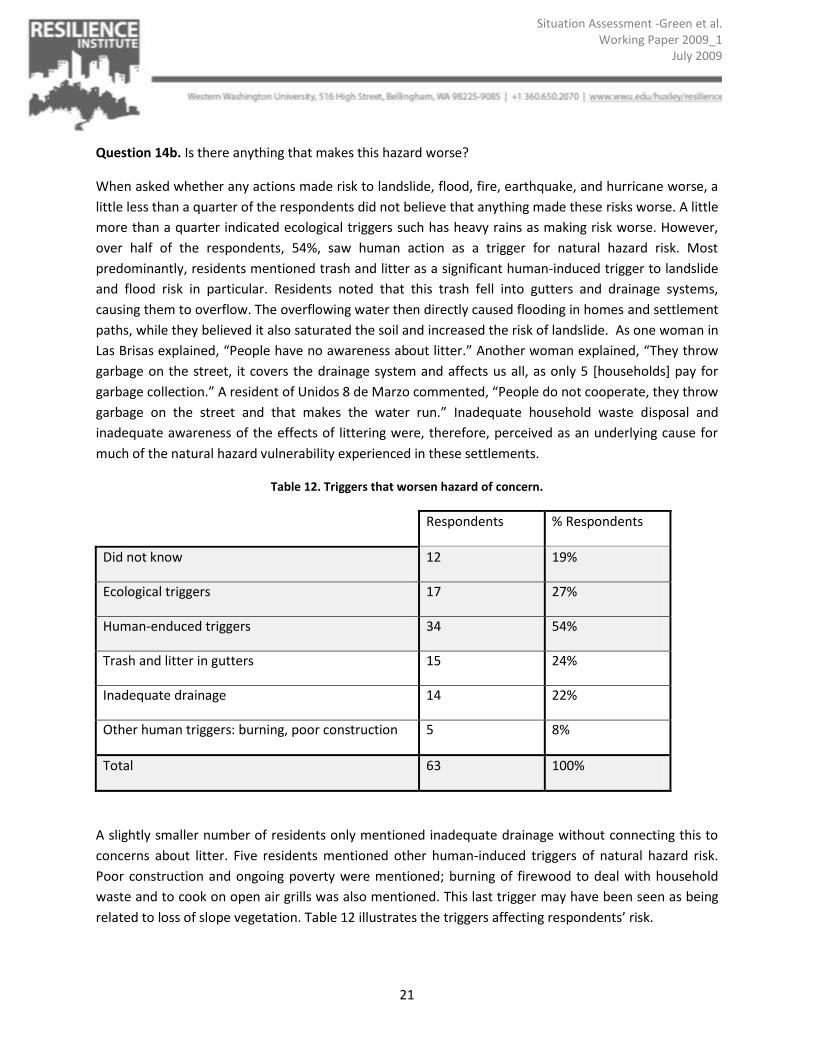
Question 14b. Is there anything that makes this hazard worse?
When asked whether any actions made risk to landslide, flood, fire, earthquake, and hurricane worse, a
little less than a quarter of the respondents did not believe that anything made these risks worse. A little
more than a quarter indicated ecological triggers such has heavy rains as making risk worse. However,
over half of the respondents, 54%, saw human action as a trigger for natural hazard risk. Most
predominantly, residents mentioned trash and litter as a significant human-induced trigger to landslide
and flood risk in particular. Residents noted that this trash fell into gutters and drainage systems,
causing them to overflow. The overflowing water then directly caused flooding in homes and settlement
paths, while they believed it also saturated the soil and increased the risk of landslide. As one woman in
Las Brisas explained, “People have no awareness about litter.” Another woman explained, “They throw
garbage on the street, it covers the drainage system and affects us all, as only 5 [households] pay for
garbage collection.” A resident of Unidos 8 de Marzo commented, “People do not cooperate, they throw
garbage on the street and that makes the water run.” Inadequate household waste disposal and
inadequate awareness of the effects of littering were, therefore, perceived as an underlying cause for
much of the natural hazard vulnerability experienced in these settlements.
Table 12. Triggers that worsen hazard of concern.
Respondents % Respondents
Did not know 12 19%
Ecological triggers 17 27%
Human-enduced triggers 34 54%
Trash and litter in gutters 15 24%
Inadequate drainage 14 22%
Other human triggers: burning, poor construction 5 8%
Total 63 100%
A slightly smaller number of residents only mentioned inadequate drainage without connecting this to
concerns about litter. Five residents mentioned other human-induced triggers of natural hazard risk.
Poor construction and ongoing poverty were mentioned; burning of firewood to deal with household
waste and to cook on open air grills was also mentioned. This last trigger may have been seen as being
related to loss of slope vegetation. Table 12 illustrates the triggers affecting respondents’ risk.

22
Situation Assessment -Green et al. Working Paper 2009_1
July 2009
Question 15. What measures have you taken to reduce risk to your house and family from the risk that
concerns you most? Have these measures been effective?
When residents were asked if they had tried any mitigation measures to reduce the risk of natural
hazards to their household, 52 responded that they had, while 12 responded that they had not. Table 13
shows the mitigation measures that respondents reported to have done. Of those who had tried
mitigation measures, the most frequently mentioned mitigation measure was some form of ground
alteration. This consisted of creating drainage troughs, clearing drains of litter and paving exposed soil
with cement caps or cement pathways to reduce erosion. Respondents also frequently mentioned
constructing retaining walls, called muros. Construction of retaining walls accounted for 29% of
mitigation measures mentioned as a strategy for reducing risk to natural hazards. Residents mentioned
constructing muros from sandbags about half the time, corrugated sheet metal in a little more than a
quarter of the instances, and an unspecified material a little less than a quarter of the time. Other
mitigation actions mentioned included planting vegetation and properly disposing of trash.
Table 13. Mitigation measures respondents took to address hazard of most concern.
Response
Count
% of
Subcategory
% All
Responses
Ground Alterations 26 100% 36%
Creating drainage troughs 11 42% 15%
Clearing drains 9 35% 13%
Cement and paths 6 23% 8%
Building Retaining Walls 21 100% 29%
Sand bags 10 48% 14%
Sheet Metal 6 29% 8%
Other or unspecified materials 5 21% 7%
Other Mitigation Actions 13 100% 17%
Planting and vegetating 6 46% 8%
Proper waste disposal 5 39% 7%
Fasten roof 1 7% 1%

23
Situation Assessment -Green et al. Working Paper 2009_1
July 2009
Awareness of conditions 1 7% 1%
Engaged in No Mitigation Actions 12 100% 17%
TOTAL MITIGATION MEASURES
DESCRIBED BY RESPONDENTS * 72 100% 100%
*Total is higher than survey count of 64 because some residents mentioned trying more than one type
of mitigation measure.
When asked if their mitigation measures had been effective, 78% of respondents who stated they had
done mitigation said that it was effective. The remaining 22% said that their efforts had not been
effective. Some of the reasons respondents thought their mitigation efforts were not effective were:
walls and drainage paths created were not strong enough and thus were washed away by the rain or
that their neighbors were not able to do the same mitigation, thereby undermining their own efforts.
Question 16. What more [mitigation] would you like to do?
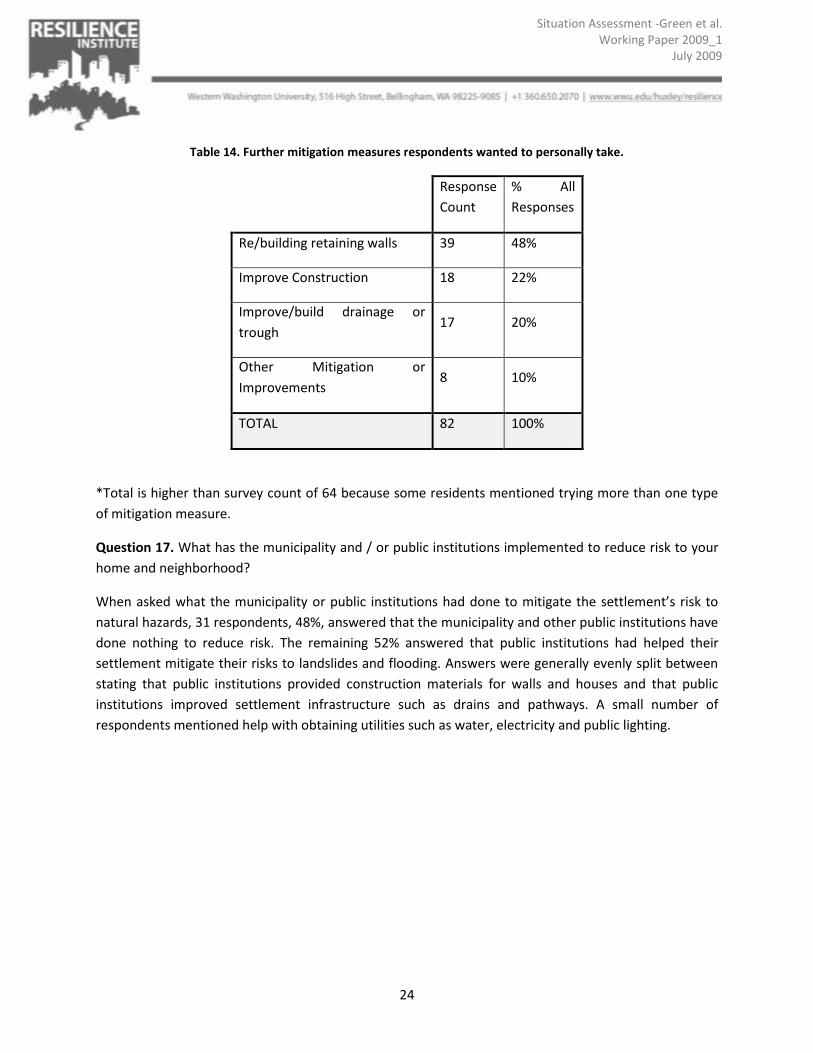
Table 14 lists mitigation measures that respondents indicated they would like to perform in the future.
When asked what more they would like to do to reduce their risk, about half of the residents mentioned
wanting to build or improve their retaining walls. About a quarter wanted to improve housing
construction, including improve foundations, walls and roofing. A smaller percentage was interested in
improving drainage and troughs while only a few mentioned other mitigation measures, including trash
disposal and dealing with community communication and conflict. Two respondents claimed they could
not engage in more mitigation because they lacked time, one stated their household did not have
authorization; the remainder, 83%, said that the reason they had not engaged in these activities was
because they lacked the financial resources to do so.
24
Situation Assessment -Green et al. Working Paper 2009_1
July 2009
Table 14. Further mitigation measures respondents wanted to personally take.
Response
Count
% All
Responses
Re/building retaining walls 39 48%
Improve Construction 18 22%
Improve/build drainage or
trough 17 20%
Other Mitigation or
Improvements 8 10%
TOTAL 82 100%
*Total is higher than survey count of 64 because some residents mentioned trying more than one type
of mitigation measure.
Question 17. What has the municipality and / or public institutions implemented to reduce risk to your
home and neighborhood?
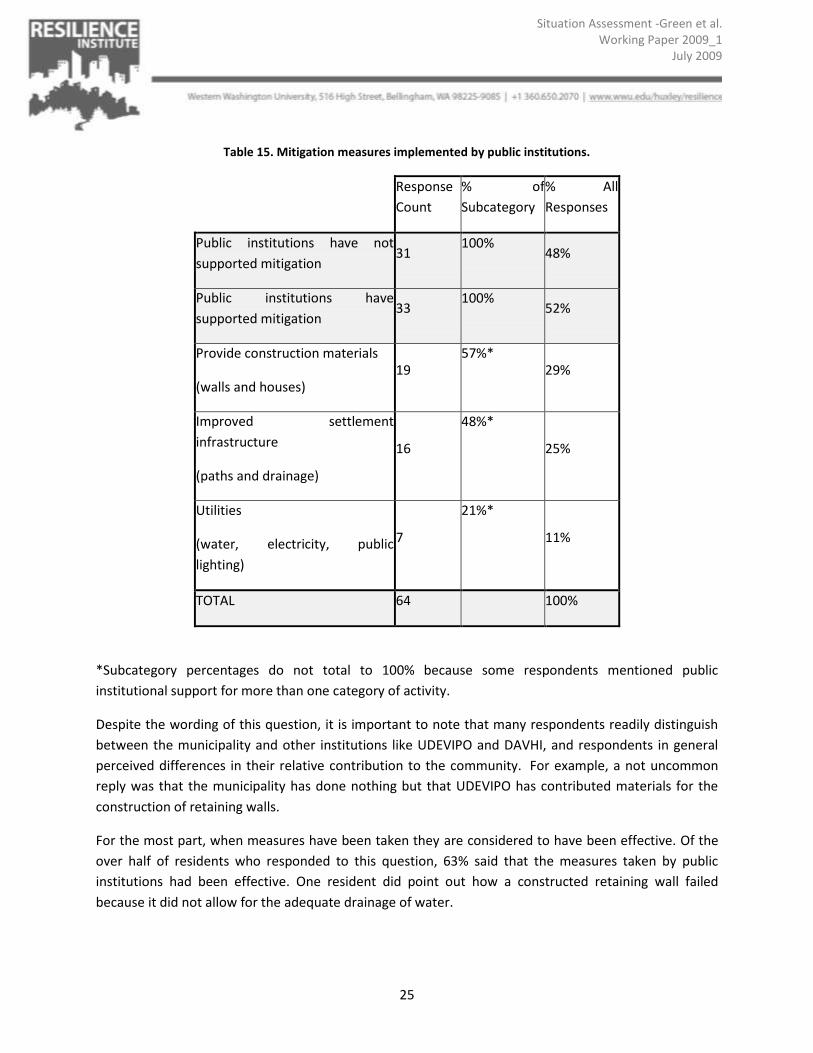
When asked what the municipality or public institutions had done to mitigate the settlement’s risk to
natural hazards, 31 respondents, 48%, answered that the municipality and other public institutions have
done nothing to reduce risk. The remaining 52% answered that public institutions had helped their
settlement mitigate their risks to landslides and flooding. Answers were generally evenly split between
stating that public institutions provided construction materials for walls and houses and that public
institutions improved settlement infrastructure such as drains and pathways. A small number of
respondents mentioned help with obtaining utilities such as water, electricity and public lighting.
25
Situation Assessment -Green et al. Working Paper 2009_1
July 2009
Table 15. Mitigation measures implemented by public institutions.
Response
Count
% of
Subcategory
% All
Responses
Public institutions have not
supported mitigation 31
100% 48%
Public institutions have
supported mitigation 33
100% 52%
Provide construction materials
(walls and houses) 19
57%* 29%
Improved settlement
infrastructure
(paths and drainage)
16
48%*
25%
Utilities
(water, electricity, public
lighting)
7
21%*
11%
TOTAL 64 100%
*Subcategory percentages do not total to 100% because some respondents mentioned public
institutional support for more than one category of activity.
Despite the wording of this question, it is important to note that many respondents readily distinguish
between the municipality and other institutions like UDEVIPO and DAVHI, and respondents in general
perceived differences in their relative contribution to the community. For example, a not uncommon
reply was that the municipality has done nothing but that UDEVIPO has contributed materials for the
construction of retaining walls.
For the most part, when measures have been taken they are considered to have been effective. Of the
over half of residents who responded to this question, 63% said that the measures taken by public
institutions had been effective. One resident did point out how a constructed retaining wall failed
because it did not allow for the adequate drainage of water.

26
Situation Assessment -Green et al. Working Paper 2009_1
July 2009
Question 18. What more could the municipality or other institutions be doing?
Over 50% of the responses indicated the respondents’ desire to see the municipality and other public
institutions improve settlement infrastructure like paths and alleys, drainage, and retaining
walls. Outside of these specific infrastructural improvements, over 10% of the responses articulated a
desire for assistance in obtaining construction materials; however, respondents were not specific in
saying whether these materials would be utilized for house, wall, path or drainage construction. Along
the same lines, respondents noted they would like to just receive more attention and help in general as
someone commented that "others need to come and see the danger under which we live." In stark
contrast to the majority of respondents that express a desire for direct aid for improving local living
conditions and to mitigate risks, two respondents mentioned resettlement somewhere else as a
potential mitigation measure the municipality or other public institutions could take.
Table 16. Further mitigation measures respondents wanted public institutions to take.
Response
Count*
% All
Responses
Improve settlement infrastructure (paths, drainage,
walls) 45 52%
Assistance in obtaining construction materials 10 11%
Attention and help 9 10%
Utilities and services (water, lights, garbage) 9 10%
Don't know 5 6%
Other 7 8%
Resettle somewhere else 2 2%
TOTAL 87 100%
*Total is higher than survey count of 64 because some residents mentioned trying more than one type
of mitigation measure.

27
Situation Assessment -Green et al. Working Paper 2009_1
July 2009
Question 19. What have community organizations done to reduce risk in your home and neighborhood?
The diversity and quantity of measures instituted by community organizations gives a strong indication
that community organizations are relatively active in the settlements and that their work does not go
unnoticed. A good deal of the responses, over 60%, indicate the dedication of efforts toward
formalizing these land occupations in terms of providing lifeline services like water and electricity (28%),
improving settlement infrastructure like walls and paths (21%), and initiating processes to secure legal
ownership of lots by their residents (15%). In these very direct ways community organizations have
worked to raise standards of living and to ease some of the discomforts of constructing homes on at the
edges and within ravines. Community organizations, according to responses and not surprisingly, also
seem to provide some managerial and technical expertise outside of construction practices. They are
seen to provide expertise for the management of supplies and materials and for negotiating politics and
policy and making solicitations on behalf of the settlements to the municipality and other entities of
interest. Community organizations mentioned include UDEVIPO, FOGUAVI, COIVIEES, and the
settlement Committees.
Table 17. Mitigation measures implemented by community organizations.
Response
Count*
% All
Responses
Utilities (water and electricity) 28 28%
Improve settlement infrastructure (walls and paths) 21 21%
Assist with securing land title 15 15%
Help, support, management, supplies, materials 12 12%
Make official requests on behalf of settlement 10 10%
Other
(programming for kids, community center, bolsa
solidaria)
9 9%
Don't know 5 5%
Nothing 1 1%
TOTAL 101 100%

28
Situation Assessment -Green et al. Working Paper 2009_1
July 2009
Almost all of the respondents feel that measures implemented by community organizations have been
effective.
Question 20. What else could community organizations do?
When asked what more could be done by community organizations, responses were similar to earlier
questions: respondents in the settlement wanted community organizations to support further
improvement of settlement infrastructure, solicit more aid or assistance, or assist with securing land
title. However, it is interesting to note that almost one-fifth of the responses, 19%, express a desire for
these organizations to work toward and encourage more unity and solidarity among settlement
residents. In this way, respondents do not view themselves as individuals or individual households
struggling in isolation from one another. They are aware of a settlement unity created by shared
geography and the associated exposure to hazards, as well as their legal status. This idea also
manifested itself in question 18 above when a respondent commented that the municipality and other
institutions should be assisting all residents and not just some of them.
Table 18. Further mitigation measures respondents wanted.
Response
Count
% All
Responses
Solicit more aid/assistance 26 36%
Assistance soliciting land title and utilities 18 25%
Foment more community
organization/solidarity/consensus 14 19%
Improve settlement infrastructure (paths, drainage,
walls) 11 15%
Don't know 4 5%
TOTAL 73 100
*Total is higher than survey count of 64 because some residents mentioned trying more than one type
of mitigation measure.

29
Situation Assessment -Green et al. Working Paper 2009_1
July 2009
Question 21. What other institutions could or should add support to prevent damage from risks to your
property?
Respondents were asked what other institutions could or should be lending support in regard to the
hazards that they and their communities face. National government and institutions topped the list at
32%. These responses included "the government" as well as more specific answers like the congress and
the first lady. National institutions with which the residents were already familiar due to past assistant –
institutions like UDEVIPO, FOGUAVI, FONAPAZ and EMPAGUA - were also mentioned. The municipality
and foreign assistance tied for second place at 18% each. The idea of the municipality is relatively
straightforward; however, some confusion arose when trying to pin down whether a particular
settlement is located within the municipality of Villa Nueva or Guatemala City. Foreign assistance
includes other countries, international organizations, and foreigners also were mentioned in 18% of the
responses. CONRED as the National Coordinator for the Reduction of Disaster was mentioned in 13% of
the responses. It should also be noted that three responses alluded to and recognized the ability of
residents to help themselves.
Table 19. Institutions respondents believe should support mitigation in settlements.
Response
Count
% All
Responses
National government/institutions 30 32%
Municipality 17 18%
Foreign assistance 17 18%
Don't know 13 14%
CONRED 12 13%
Help ourselves/settlement committee 3 3%
Other 3 3%
TOTAL 95 100
*Total is higher than survey count of 64 because some residents mentioned trying more than one type
of mitigation measure.

30
Situation Assessment -Green et al. Working Paper 2009_1
July 2009
Question 22. Who works in your household, in what sector, and what is their level of educational
obtainment?
About half of the working residents interviewed in Las Brisas had incomplete primary schooling or no
formal education. About half, 49% had a primary education or higher, as shown in Figure 5. The
education pattern was similar in Unidos 8 de Marzo, as shown in Figure 6. In Unidos 8 de Marzo, 35% of
the working residents surveyed reported no school or incomplete primary school. Just over half, 52%,
reported having completed primary school or higher.
In Unidos 8 de Marzo, there was sufficient gender parity in survey numbers to assess education levels by
gender. This is shown in Figure 6. While slightly more men had incomplete primary education or no
schooling, overall, men had more and higher levels of educational attainment. Very few women had
basic, diversified, or technical education.
Figure 5. Education level of working residents in Las Brisas.

31
Situation Assessment -Green et al. Working Paper 2009_1
July 2009
Figure 6. Education level of working eesidents in Unidos 8 de Marzo.
Question 26. Do you receive remittance?
When asked if the household received remittance for relatives or friends abroad, only one family in Las
Brisas replied that they did receive remittance. Two other households in Las Brisas and two households
in Unidos 8 de Marzo chose not to answer this question. While remittance is an important part of the
Guatemalan economy for many households, it appears that the vast majority of households surveyed in
these two precarious settlements do not have access to remittance as a supplement to their own
income. Since remittance is often used for large, one-time expenses such as housing construction and
infrastructure upgrading, these informal settlement residents appear to have few personal resources for
capital intensive community improvements.
Question 27. How much per month do you spend on rent or payment for the land, light and water,
transportation, school fees, and food/sustenance?
Table 15 shows the average household and per person monthly spending for respondents in both
communities. Las Brisas residents reported spending about a 15% more on rent, light, transportation,
school fees, food and water than those of Unidos 8 de Marzo. On average, residents said they spent
approximately 400 Quetzals a month per person. This is roughly equivalent to 50 USD or about $1.60 a
day on basic needs. Large, one time purchases were not considered in this calculation.

32
Situation Assessment -Green et al. Working Paper 2009_1
July 2009
Table 20. Average monthly expenses by settlement.
Average Household Monthly
Expenses
Average Household Monthly Expenses
per Person
Las Brisas 1,870 Quetzales 419 Quetzales (Min:132, Max:840)
Unidos 8 de Marzo 1,593 Quetzales 363 Quetzales (Min: 100, Max:733)
AVERAGE 1,707 Quetzales 386 Quetzales (Min: 100, Max:840)
Synthesis and Discussion
After compiling, organizing and analyzing the data collected from the surveys, several key themes
became apparent. These themes include how and why people came to live in these settlements,
connections between demographics and the physical site, the relationship between hazards and
mitigation efforts, and a comparison of mitigation measures taken, effectiveness and what further
measures should be taken by each social organizational level.
The majority of people living in both communities chose to live there because they did not want to or
could not afford to pay rent where they were previously living. Owning their own land and not having to
pay rent was so desirable that 44% of the households in Las Brisas informally purchased their land; 52%
simply occupied the land. . Even though a significant percentage of people bought their land in Las
Brisas, not a single household responded yes to having a land title. In Unidos 8 de Marzo, 70% obtained
their lot by occupying it and only 22% informally purchased land in the settlement. When asked what
more could be done by the community organizations to assist the community, 25% suggested that the
organization with the legislative process to obtain land titles.
On average, each household is made up of approximately five people. In Las Brisas, these five people
live in two to three bedroom homes than took on average three years to build. In Unidos 8 de Marzo,
the same average of five people live in a one room dwelling unit that took six years to build.
Landslides were selected as the as the greatest risk to the settlement by 77% of respondents from both
neighborhoods. Sixty nine percent stated that landslides are caused by ecological triggers such as steep
terrain, poor soil, and notably, rain. An even larger percentage, 54%, believed that human triggers like
trash and inadequate drainage exacerbated landslide hazards. A large percentage, 36%, had
implemented informally drainage management as a strategy for reducing household risk. Only 20%
wanted to implement future drainage management to further reduce risk. Half of the residents simply
wanted to build more retaining walls, however, the overwhelming majority of households (86%) lack the
funds to implement mitigation measures. The survey results suggest that the current insufficiency of

33
Situation Assessment -Green et al. Working Paper 2009_1
July 2009
disaster prevention measures is not an oversight by the community, but a result of limited access to
resources. Only a few respondents claimed that they did not have enough time for mitigation or lacked
authorization. As such, most of the residents would have time to assist in the building of drainages and
other mitigation measures, if the resources were. and 24% saw the excess litter resulting from the high
percentage of households without trash collection as a contributor to landslides. Only a few residents
list proper waste disposal as a potential future risk reduction tool. In order to implement garbage clean
up and disposal management practices as risk reduction tool, public education and awareness will be
vital. If people do not understand the importance of waste management, then they will be less likely to
want to participate in pilot programs that promote garbage clean-up.
Households, public institutions and community organizations all pursued different methods of hazard
mitigation; however, there are a few commonalities between these various organizations. Both
households and public institutions also worked to create drainage systems as risk reduction measures.
When asked what they were doing to reduce risk, about 36% of individual households worked to create
drainages, while 25% of respondents mentioned public institutions construct drainages. Since many of
the respondents list rain as the cause of landslides, it makes sense that building drainages was
mentioned often as a common tool used to mitigate natural hazard risk. Walls and other forms of
retaining systems were mentioned about as often as drainage as a common mitigation measure.
Twenty-nine percent stated they had constructed retaining walls as a household mitigation strategy,
29% said public institutions had, and 21% said community organizations had. It is clear that a major
community concern is for the creation of retaining walls to mitigate landslides. A third tool used to
reduce risk is re-planting the slopes. This method is only implemented by individual households and is
not assisted by public institutions or community organizations. Re-planting is a valuable tool for slope
stabilization that only 8% of residents use. This type of mitigation method has room of a lot of growth in
these settlements.
Interestingly only 17% of households reported that they had taken no mitigation measures and only 6%
of respondents thought that the community organizations had done nothing or did not know of any
acitvities. These numbers are extremely minimal compared to the 48% of respondents who thought that
the city and other public institutions had done nothing. It appears that in these settlements that the
lower levels of organizations, households and community organizations, are more effective at
implementing mitigation measures than the higher levels, the city government and public institutions.
Of the measures actually taken by each group, the majority of respondents thought that the mitigation
efforts were. People thought that the efforts of the community organizations were the most effective,
96% compared to 78% of households and 63% of public institutions. This may relate to the fact that 28%
of the community organizations’ activities were providing utilities such as plumbing and water. Such
activities do not directly mitigate hazards such as landslides and flooding, but are present in daily life.
Since residents use their plumbing and electricity in day to day activities, it makes sense that these
actions are thought of as the most effective.

34
Situation Assessment -Green et al. Working Paper 2009_1
July 2009
Even though retaining walls were among the most common type of mitigation technique actually taken,
it was also the most commonly suggested as a future mitigation tool. Building projects such as walls,
drainage, and better constructer were suggested for households 80% of the time The remaining
suggestions can be classified as legislative assistance with obtaining land titles, requesting more
assistance or general improvements such as managing garbage, creating parks, maintaining roads, and
fixing the edge of the cliff. This survey points to a heightened level of concern in relation to landslides
and slope stabilization and the residents’ desire to make their settlement a safer living environment,
primarily through improved construction practices.

35
Situation Assessment -Green et al. Working Paper 2009_1
July 2009
II. HOUSEHOLD CASE STUDIES
Three case studies of households in the settlement are included in this section to better illustrate the
compounding effects of poverty and vulnerability in precarious settlements.
Young Mother at Ravine Edge
Marieta1 looks young for her 27 years of age. She and her husband and their two young children have
been living in the settlement for six years. Marieta was able to go to primary school for three years, but
then her mother died and she could no longer go. At nineteen she got married, using it as a way to get
away from a step-mother she never got a long with. For a few years, they lived in Zone Six of Guatemala
City with people her husband worked with, but the cost was exhorbinent and they were unable to keep
up with the rent. When they heard of a land invasion in Villa Nueva from a friend, they came too. By the
time they arrived, there was no land left at the hill crest and they laid out their plot on the hillside down
in the ravine.
Figure 7. Children looking over the edge of the ravine in Las Brisas.
That first night in the settlement Marieta cried. There was no light, no water, and their home was pieced
together with scrapes of lumber and plastic. For years, she cried herself to sleep, wishing she did not
have to live in the settlement and fearing the steep ravine below their makeshift home.
1 All names in case studies are pseudonyms.
36
Situation Assessment -Green et al. Working Paper 2009_1
July 2009
They began building their home four years ago, bit by bit. Today it is a cement-packed floor, three rooms
and corrugated metal walls and roofs. While the metal is hot in the summer, it offers more protection
than their previous makeshift home. They have electricity from the communal meter, and piped in
water to a concrete kitchen sink in the back yard, and a toilet with a pipe running down to the edge of
the ravine.
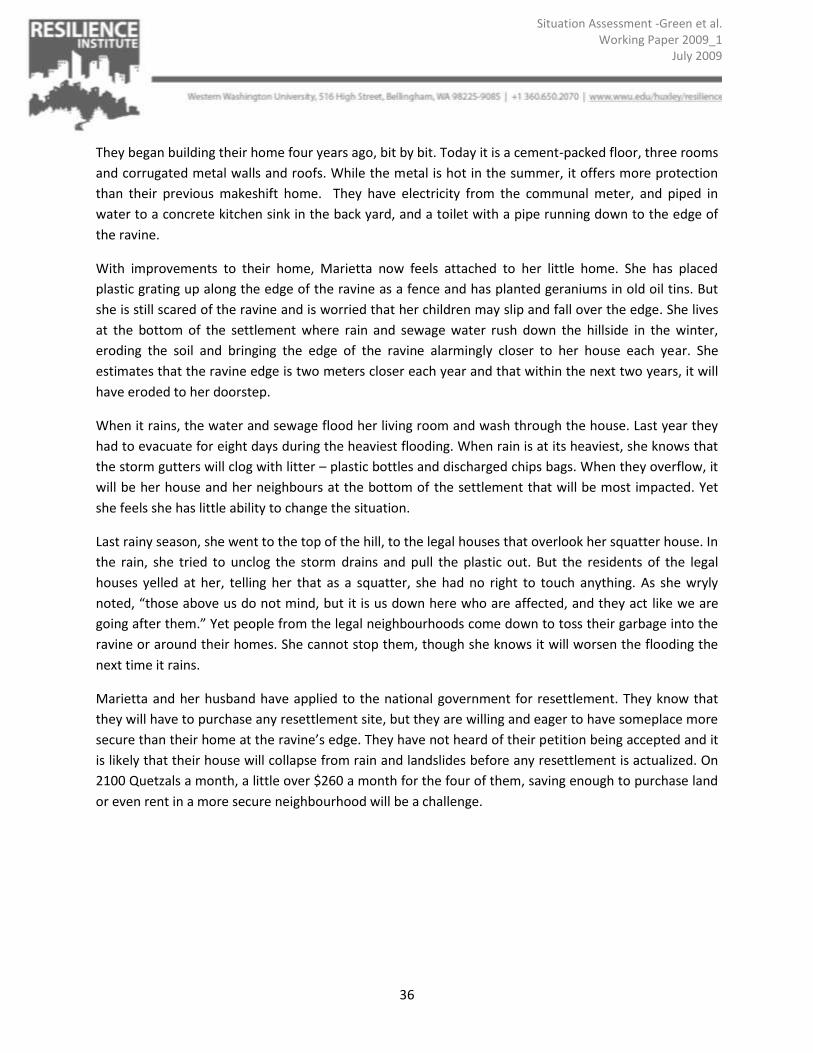
With improvements to their home, Marietta now feels attached to her little home. She has placed
plastic grating up along the edge of the ravine as a fence and has planted geraniums in old oil tins. But
she is still scared of the ravine and is worried that her children may slip and fall over the edge. She lives
at the bottom of the settlement where rain and sewage water rush down the hillside in the winter,
eroding the soil and bringing the edge of the ravine alarmingly closer to her house each year. She
estimates that the ravine edge is two meters closer each year and that within the next two years, it will
have eroded to her doorstep.
When it rains, the water and sewage flood her living room and wash through the house. Last year they
had to evacuate for eight days during the heaviest flooding. When rain is at its heaviest, she knows that
the storm gutters will clog with litter – plastic bottles and discharged chips bags. When they overflow, it
will be her house and her neighbours at the bottom of the settlement that will be most impacted. Yet
she feels she has little ability to change the situation.
Last rainy season, she went to the top of the hill, to the legal houses that overlook her squatter house. In
the rain, she tried to unclog the storm drains and pull the plastic out. But the residents of the legal
houses yelled at her, telling her that as a squatter, she had no right to touch anything. As she wryly
noted, “those above us do not mind, but it is us down here who are affected, and they act like we are
going after them.” Yet people from the legal neighbourhoods come down to toss their garbage into the
ravine or around their homes. She cannot stop them, though she knows it will worsen the flooding the
next time it rains.
Marietta and her husband have applied to the national government for resettlement. They know that
they will have to purchase any resettlement site, but they are willing and eager to have someplace more
secure than their home at the ravine’s edge. They have not heard of their petition being accepted and it
is likely that their house will collapse from rain and landslides before any resettlement is actualized. On
2100 Quetzals a month, a little over $260 a month for the four of them, saving enough to purchase land
or even rent in a more secure neighbourhood will be a challenge.
37
Situation Assessment -Green et al. Working Paper 2009_1
July 2009
Large Family
Carlos, age 17 lives with his mother, two grown sisters, baby niece and 5 younger siblings. Only having
lived in the settlement for five years, they are newcomers. They bought their lot from the previous
squatter and hold an informal “title” to their land from that sale. When they arrived, there was no
house, as the previous squatter took him home with him. The family set about building their home and
it now has two large rooms with three sides having corrugated metal walls. In the corner of one room,
they have a cement sink and toilet, with a piece of plastic draped around it for privacy.
They have run an electrical wire from their neighbor’s lot and pay the neighbor for that electricity. They
pay for water, but it is intermittent and had not been on for five days when we visited. Often it is on only
for a few hours and then is cut off again, forcing everyone to fill their sinks and use and carefully reuse it
until piped water is available again. They don’t have any trash collection, but simply throw their garbage
over the edge of the ravine, just below their house.
They struggle simply keeping their house standing. During the rainy season, water poured into their two
rooms from the un-guttered roof top of their uphill neighbor. It caused some of their walls to collapse
and created large mud puddles in their home. They fear that they will be the next lot to erode away in
the winter. Carlos’ family wants to build a high wall between their home and their neighbor’s to stop the
hillside from eroding in the rain. Thus far, they have not found money enough to build a wall. They also
wish there was a way to fix the storm water ditches throughout the settlement so that there was less
water reaching their lot at the bottom of the ravine.
Carlos had to stop schooling after the third grade. He now works as a mechanic’s assistant while his
mother and sister, who have no schooling, wash clothes. Together they are able to make enough to
cover monthly expenses of about 2000 Quetzals, or 240 dollars a month for the ten-person household,
or only 80 cents a day a person.

38
Situation Assessment -Green et al. Working Paper 2009_1
July 2009
Construction Worker and His Elderly Mother
Juan Lopez, a resident of Unidos 8 de Marzo, lives with his elderly mother. Mr. Lopez is 36, his mother
65. They have lived together in Unidos for about 8 years, in a house constructed of wood planks and
corrugated metal. He works for a private auto mechanic and his mother stays at home. He had four
years of education before he had to quit, though he wants to continue his schooling some day. His
mother has no schooling and cannot read or write. Their home is located near the bottom of the
settlement, in close proximity to the edge of the ravine. The older woman has an obvious limp to her
step, which makes climbing the stairs to the upper portions of the settlement difficult.
Figure 8. Home of a construction worker and his mother.
Prior to living in Unidos, Juan Lopez rented a place in Santa Fe (Zone 13), approximately three kilometers
from the airport. There he paid rent, but when Juan Lopez was told about the land invasion, he decided
to join. Initially, the living conditions were very poor, even compared to the current quality of life.
Housing materials are expensive, making it difficult to add significant structural contributions to the
house.

39
Situation Assessment -Green et al. Working Paper 2009_1
July 2009
Their primary concerns are landslides, as they live very near the edge, as well as the water that floods
houses every winter. Though landslides are first on his mind, Juan is also concerned with the numerous
dogs present, as many of them carry fleas and possibly diseases. Living at the bottom of the ravine, near
where residents toss their garbage, they deal with the smell of the garbage, the flies, and the occasional
dead cat or dog thrown into the heap. The large rats that scavenge in the dump also come up to their
yard. Juan believes that poor trash management is a compounding factor to all of these problems,
especially to the inundations of water-run off from clogged drainages plaguing his community. Juan also
recognizes the community efforts to plant trees and dig drainage ditches, but the problems persist.
Mr. Lopez’s home lacks any formal concrete structure, and the floor is hard-packed dirt. The home does
not have electricity or a direct phone line, though Mr. Lopez does own a cell phone. There is sanitary
plumbing, but it is not connected to municipal waste manage. Instead, sewage is emptied directly into
the ravine. Garbage accumulated by Mr. Lopez and his mother is burned, rather than being collected by
a service. Monthly expenses accrue to almost 1500 Quetzal, 1200 of which is spent on food. This
translates to about 40 Quetzal a day for food, or approximately five U.S. Dollars. The remainder goes to
the cost of utilities and transportation. Mr. Lopez does not hold title to his property, nor is the title being
processed.

40
Situation Assessment -Green et al. Working Paper 2009_1
July 2009
III. FOCUS GROUPS
During the final weekend of the situation assessment, on March 29, 2009, we conducted a focus group
discussion with the two settlements surveyed. Five community leaders and five representative residents
from each of the communities participated in the 2.5 hour discussion. The focus group participants
along with Western Washington University representatives Rebekah Green, Scott Miles, and affiliate
Walter Svekla discussed problems facing the settlements and identified primary areas of risk.
Discussions and prepared questions were centered on survey results collected earlier in the week, as
well as risk mapping exercises for each settlement. Proceedings began with introductions by IGCR
members and a short explanation of purpose. Participating community members stood up individually
and introduced themselves, and discussion began.
Outline of Community Issues
The first focus group discussion began with two questions to help outline community issues. Each
question began with a voting exercise, followed by discussion facilitated by Rebekah Green.
Major Problems
The first question was based on responses to the household survey question regarding respondents’
perception of the greatest problem in their settlement. Prior to the focus group, the survey responses to
this question were tallied and 6 major themes identified.
Table 21. Tally of dot voting for major problems.
From these main themes, focus group participants were asked to vote on which problems were of
greatest importance. Everyone was given three dots. An individual could choose to place all three dots
on one category, indicating extreme importance, or split up their votes to indicate that multiple
Problem Votes
A- Living near the edge of the ravine 20
B- Garbage clogging the drains 10
C- Water flowing into people’s houses 4
D- Landslides/Cracking or crumbling walls 14
E- Roads/Pathways 11
F- Houses collapsing and affecting other houses 11

41
Situation Assessment -Green et al. Working Paper 2009_1
July 2009
problems needed strong consideration. Tabulated results showed that living near the edge of the ravine
(20 votes), and landslides/cracking or crumbling walls (14 votes) were the main issues. Although the top
two issues were clear, the next three received almost equal consideration. Roads and housing collapse
received 11 votes each, and garbage clogging the drains receiving 10 votes. The issue of water was
marked only four times, clearly being of least importance relative to other issues.
When asked about these problems, focus group participants focused
on slope stability and the structural integrity of walls. One person in
particular expressed frustration with the poor quality of construction
for walls, specifically that masons would not build the foundations
deep enough- despite the fact that residents said the walls being
constructed would not hold. This person stated that 20,000 Quetzales
would be charged for construction, but only half of that would go to
labor and materials. 10,000 would be pocketed directly by the mason.
Many others noted problems of slope stability. Residents of Las Brisas
noted the sandy and unstable composition of their soil. Garbage was
said to be a complicating factor in this- too much garbage buried under
the already sandy slope material aggravates the problem of stability.
After this comment was made, more people began discussing the problem of garbage and drainages.
One resident recognized that dealing with garbage is a community effort, and cannot be left up to a
minority. In their opinion, if everyone took care of their garbage properly, the drainages would not be
clogged.
Various people also stated that people living lower down on the slope are strongly affected by people
living above them. Insufficient drainage higher up was said to be one of the sources of flooding in lower
portions of the settlement.
Major Risks
The participants were then asked to identify the major risks to their communities, based upon five
environmental hazards. The same voting system from question one was used.
Figure 9. Dot voting for major
problems in neighborhood.
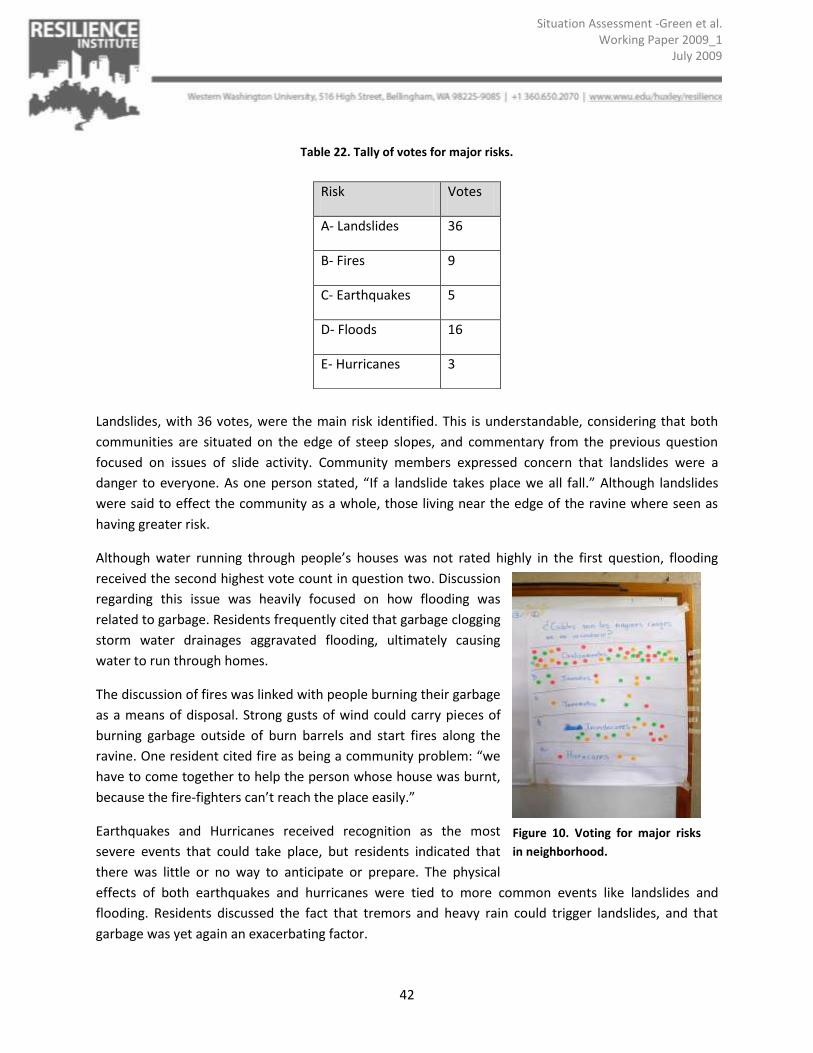
42
Situation Assessment -Green et al. Working Paper 2009_1
July 2009
Table 22. Tally of votes for major risks.
Landslides, with 36 votes, were the main risk identified. This is understandable, considering that both
communities are situated on the edge of steep slopes, and commentary from the previous question
focused on issues of slide activity. Community members expressed concern that landslides were a
danger to everyone. As one person stated, “If a landslide takes place we all fall.” Although landslides
were said to effect the community as a whole, those living near the edge of the ravine where seen as
having greater risk.
Although water running through people’s houses was not rated highly in the first question, flooding
received the second highest vote count in question two. Discussion
regarding this issue was heavily focused on how flooding was
related to garbage. Residents frequently cited that garbage clogging
storm water drainages aggravated flooding, ultimately causing
water to run through homes.
The discussion of fires was linked with people burning their garbage
as a means of disposal. Strong gusts of wind could carry pieces of
burning garbage outside of burn barrels and start fires along the
ravine. One resident cited fire as being a community problem: “we
have to come together to help the person whose house was burnt,
because the fire-fighters can’t reach the place easily.”
Earthquakes and Hurricanes received recognition as the most
severe events that could take place, but residents indicated that
there was little or no way to anticipate or prepare. The physical
effects of both earthquakes and hurricanes were tied to more common events like landslides and
flooding. Residents discussed the fact that tremors and heavy rain could trigger landslides, and that
garbage was yet again an exacerbating factor.
Risk Votes
A- Landslides 36
B- Fires 9
C- Earthquakes 5
D- Floods 16
E- Hurricanes 3
Figure 10. Voting for major risks
in neighborhood.
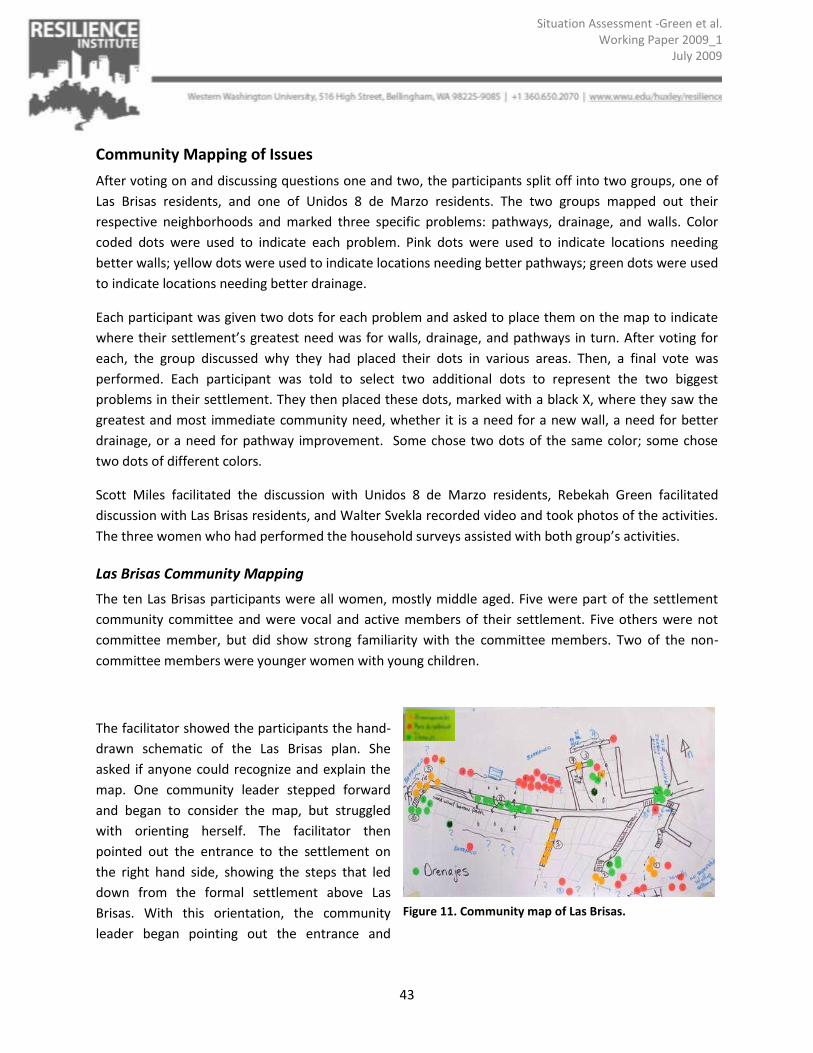
43
Situation Assessment -Green et al. Working Paper 2009_1
July 2009
Community Mapping of Issues
After voting on and discussing questions one and two, the participants split off into two groups, one of
Las Brisas residents, and one of Unidos 8 de Marzo residents. The two groups mapped out their
respective neighborhoods and marked three specific problems: pathways, drainage, and walls. Color
coded dots were used to indicate each problem. Pink dots were used to indicate locations needing
better walls; yellow dots were used to indicate locations needing better pathways; green dots were used
to indicate locations needing better drainage.
Each participant was given two dots for each problem and asked to place them on the map to indicate
where their settlement’s greatest need was for walls, drainage, and pathways in turn. After voting for
each, the group discussed why they had placed their dots in various areas. Then, a final vote was
performed. Each participant was told to select two additional dots to represent the two biggest
problems in their settlement. They then placed these dots, marked with a black X, where they saw the
greatest and most immediate community need, whether it is a need for a new wall, a need for better
drainage, or a need for pathway improvement. Some chose two dots of the same color; some chose
two dots of different colors.
Scott Miles facilitated the discussion with Unidos 8 de Marzo residents, Rebekah Green facilitated
discussion with Las Brisas residents, and Walter Svekla recorded video and took photos of the activities.
The three women who had performed the household surveys assisted with both group’s activities.
Las Brisas Community Mapping
The ten Las Brisas participants were all women, mostly middle aged. Five were part of the settlement
community committee and were vocal and active members of their settlement. Five others were not
committee member, but did show strong familiarity with the committee members. Two of the non-
committee members were younger women with young children.
The facilitator showed the participants the hand-
drawn schematic of the Las Brisas plan. She
asked if anyone could recognize and explain the
map. One community leader stepped forward
and began to consider the map, but struggled
with orienting herself. The facilitator then
pointed out the entrance to the settlement on
the right hand side, showing the steps that led
down from the formal settlement above Las
Brisas. With this orientation, the community
leader began pointing out the entrance and
Figure 11. Community map of Las Brisas.

44
Situation Assessment -Green et al. Working Paper 2009_1
July 2009
tracing down the main pathway. Again she became confused and the facilitator then pointed out the
edge of the ravine, a leader’s house, a corn field at the end of the settlement and the location of the
drainage pipe and garbage pit. She also pointed out two path termination points, and pointing out
where two of the focus group participants lived. With this guidance, a lively discussion ensued.
Participants discussed and pointed out the each other’s lots and became familiar with the schematic.
One leader then began pointing to the map and explaining locations of the ravine. Another pointed out
a location of a municipal wall in the formal settlement, a wall that had collapsed and spilled sewage on
several houses the previous winter. As the participants explained their region of the settlement
schematic, the facilitator jotted down pictures or words to indicate what was being described and to
document the landmarks the participants wanted represented. It was clear that viewing their
community through schematic was initially difficult, but with facilitator support all were able to
eventually understand the schematic and take ownership of it.
After participants had oriented themselves, the facilitator explained that they would be using three
colors of dots to describe problems in their settlement: green for drainage, yellow for pathways, and
pink for retaining walls. At this explanation, one participant noted that “These three options [walls,
drainage, and pathways] are very important for us in Las Brisas. If we address all three, then we address
some very important things in Las Brisas.”
Participants were first given two green dots representing drainage. The facilitator explained that they
should place their two green dots where the issue of drainage was most severe in their settlement. The
facilitator demonstrated placing dots in two hypothetical locations of “terrible drainage” and then told
participants they could discuss where to place dots, but that each person got to make a decision for
themselves. After placing the green dots, the facilitator pointed to a few locations where many people
had placed green drainage dots. She asked the participants to explain what the drainage problem was in
each of these locations.
When discussing where to place drainage dots, the women debated placing dots at the top where water
entered the community or at the bottom where much of the water ended up. They also began
discussing the need for paths at this bottom location and the facilitator had to reassure participants that
pathways and walls would be discussed next. (This discussion may suggest that problems were often
viewed in terms of integrated problems based upon location, rather than in terms of settlement
drainage, pathway and wall systems.) The participants noted that without drainage, the water eroded
the soil and that if they did not deal with sewage, they would “all be dragged down” the ravine. They
placed many drainage dots near the entrance of the settlement, noting that at the entrance much water
flowed into the settlement. This water came from the formal settlements, Colonia, above them and in
the winter it flowed through several houses. They noted that there was only one sewage (storm water)
drain and that it was often clogged with litter (point one), causing the overflow into their houses. At the
western end of the settlement (point two), participants also placed dots and noted that water flowed
down the steps and then into their lots. They thought that two ditches could be used to divert the water

45
Situation Assessment -Green et al. Working Paper 2009_1
July 2009
and direct it down to the sewage pipe at the southern end of the community. At the southern end of the
community a participant noted that water from the pathways, overflowed drains and lack of roof
gutters also eroded their soil and threatened collapse of housing and leaving houses “just hanging in the
air”. Another noted that they were connected to the sewage system, but it gets clogged and needed to
be bigger to effectively deal with storm water.
The facilitator then passed out two yellow dots each to represent pathways. A participant asked if
pathways included ditches, and the facilitator noted that she wanted them to only think about paths
and stairs because ditches were similar to drainage. (In retrospect, it seems that participants consider
drainage to refer most strongly to sewage system pipes, while ditches alongside pathways were seen as
a separate issue.) Several participants noted that they didn’t think there were any pathway problems.
The facilitator drew a box at the bottom of the map and told participants that they could stick their
yellow dots down in the box if they did not feel there was a location where pathway improvement was
needed. Participants again discussed pathway issues among themselves and then placed their two dots
where do they felt there were serious pathway insufficiencies.
When the facilitator asked why yellow pathway dots had been placed in various locations, slight division
emerged. Those who lived down the ravine slope often had incomplete steep stairs or dirt paths. They
wanted pathways to reduce mud and to make climbing in and out the ravine easier. They stated that
they placed their dots in places where the existing concrete paths ended but needed to be extended to
reach residents on the lower slopes. However, some residents who lived at the western terminus votes
for new paths along the ridge top where a completely paved and continuous path already existed. When
asked why this area needed a new path, these residents noted that they wanted ramps added in the few
places where stairs existed so they could wheel construction material along the path without having to
navigate stairways.
Participants were then given two pink dots to represent areas where there were significant problems
with retaining walls. Walls, shown with pink dots, were considered an acute issue. Placement of pink
wall dots resulted in the most discussion and some contention. Areas along the edge of the ravine
received concentrated groupings of votes for wall improvements. Residents vocalized the need for
better built concrete walls. One community member elaborated on how her neighbor’s plot was being
divided by slope movement and erosion, and that a joint wall would help her and everyone else in the
immediate area. Some people were using tin sheets braced with wooden beams as an improvised
barrier, but they were insufficient and collapsed during the winter season. Participants also debated
whether to place their dots near their homes where the soil was collapsing, or to place it up near the
entrance where water was infiltrating the soil and contributing to the landslide risk.
Several community members discussed a recent municipal wall constructed to reduce erosion at the
edge of the formal settlement to the east of the Las Brisas entrance. During a heavy rainfall, water
pooled behind the wall, and the wall collapsed. Sewage, mud and rainwater rushed down the hillside
(towards point one on the map), causing at least one house to collapse.

46
Situation Assessment -Green et al. Working Paper 2009_1
July 2009
Struggling to balance loyalties to friends, neighbors and community leaders with personal need was
evident in voting about location of greatest need for walls. When asked to place two pink dots near the
area where new walls were most needed in their settlement, the women participating in the focus
group began a group discussion about walls, erosion, and community need. They discussed whether the
greatest need was on the north side of the ridge lots (above and slightly to the right of point four) or
whether other areas were in greater need. When the voting was completed, one of the leaders looked
at the dots placed further from her house and jokingly asked whether the other women “really loved”
her. A similar process occurred regarding drainage near point four. Such internal tensions and loyalties
would be important to address openly and discuss with community members in any future development
activities.
Table 23. Vote tally for greatest problem, Las Brisas.
When participants were asked to place two dots of any color as their final vote for the settlement’s two
greatest problems, walls received nine votes and drainage received eight. Pathways were viewed as a
must less important issue, with only two people out of 10 selecting them as the “highest need”.
Unidos 8 de Marzo Community Mapping
The makeup of the eight participants from Unidos 8 de Marzo was in contrast to those from Las Brisas.
Except for two, participants were young (under about 20 years old) and included three males. Another
significant aspect of the group makeup was residence location; about half of the group lived in the “J”
section of the Unidos 8 de Marzo. Thus, the prominent group dynamic was that of the male participants
and the women from the “J” section.
The exercise began with an overview of what participants would be asked to do. Participants were
shown the hand-traced schematic of their community and asked if they recognized it. Spatial
understanding of the schematic by the participants was proven by their request to be able to label the
schematic with the community sections labels (“B” through “K” were drawn on the schematic by
participants). We had intended to label the schematic with the sections prior to the workshop. However,
having participants do the labeling served the dual purpose of evaluating their spatial understanding and
Issue Initial Dots Greatest Problem
Dots
Pathways 16 2
Walls 19 9
Drainages 15 8
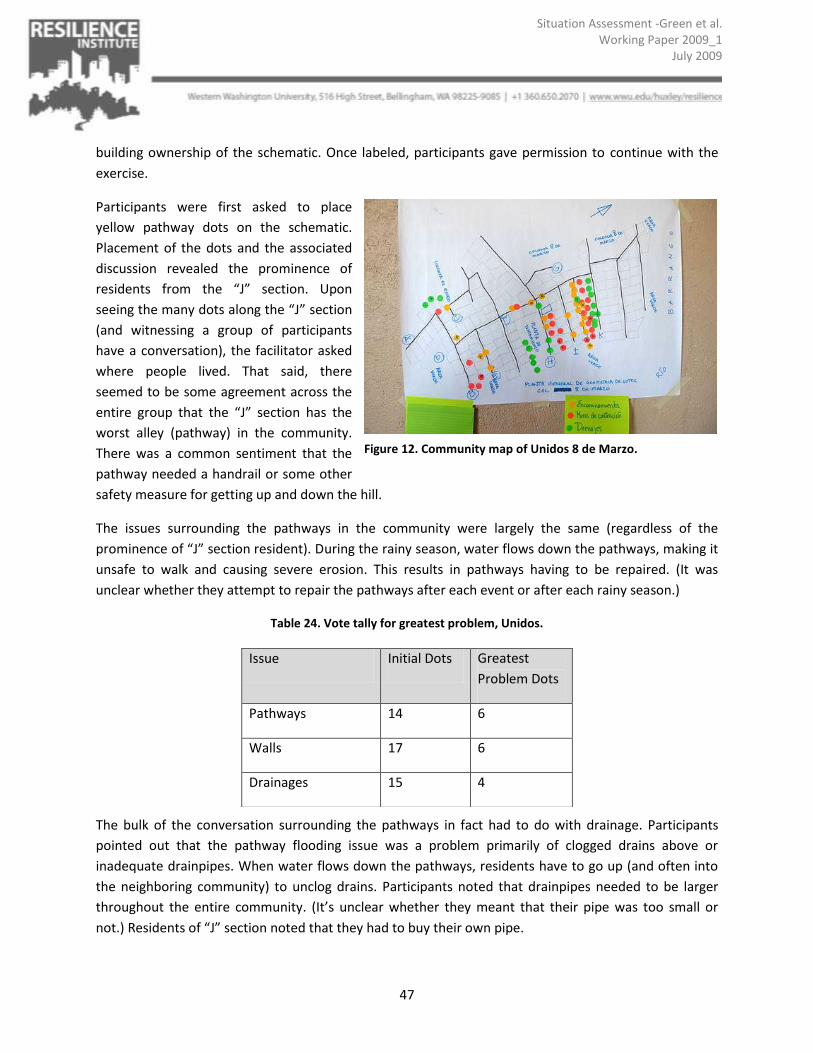
47
Situation Assessment -Green et al. Working Paper 2009_1
July 2009
building ownership of the schematic. Once labeled, participants gave permission to continue with the
exercise.
Participants were first asked to place
yellow pathway dots on the schematic.
Placement of the dots and the associated
discussion revealed the prominence of
residents from the “J” section. Upon
seeing the many dots along the “J” section
(and witnessing a group of participants
have a conversation), the facilitator asked
where people lived. That said, there
seemed to be some agreement across the
entire group that the “J” section has the
worst alley (pathway) in the community.
There was a common sentiment that the
pathway needed a handrail or some other
safety measure for getting up and down the hill.
The issues surrounding the pathways in the community were largely the same (regardless of the
prominence of “J” section resident). During the rainy season, water flows down the pathways, making it
unsafe to walk and causing severe erosion. This results in pathways having to be repaired. (It was
unclear whether they attempt to repair the pathways after each event or after each rainy season.)
Table 24. Vote tally for greatest problem, Unidos.
The bulk of the conversation surrounding the pathways in fact had to do with drainage. Participants
pointed out that the pathway flooding issue was a problem primarily of clogged drains above or
inadequate drainpipes. When water flows down the pathways, residents have to go up (and often into
the neighboring community) to unclog drains. Participants noted that drainpipes needed to be larger
throughout the entire community. (It’s unclear whether they meant that their pipe was too small or
not.) Residents of “J” section noted that they had to buy their own pipe.
Issue Initial Dots Greatest
Problem Dots
Pathways 14 6
Walls 17 6
Drainages 15 4
Figure 12. Community map of Unidos 8 de Marzo.

48
Situation Assessment -Green et al. Working Paper 2009_1
July 2009
The placement of the green drain dots was done last in this exercise but will be discussed second
because of the strong association participants made to the pathway issue. The most significant reason
behind placement of pathway dots was drainage of the pathway. Except for one reason, participants did
not have much to add from their pathway discussion regarding drainage problems after placing the
green drain dots. In other words, participants, showing the strong association of the two issues, largely
conflated the issue of pathway and drainage. The non-conflated reasons given were safety for the
pathways, and the sewage treatment plant for the drainages.
A long discussion ensued after placing the green drainage dots about the unfinished sewage treatment
plant in the central area of the community. Participants said “all water flows” through the sewage
treatment plant. They noted that the sewage creates a bad smell, attracts mosquitoes, and has gotten
children in the community sick. Participants were particularly frustrated by this issue because the
sewage doesn’t come from their community it comes from the five or so neighborhoods above them in
the Mezquital. They note that the sewage treatment plant was never finished and doesn’t have the
capacity to deal with the actual flow, resulting in sewage flowing overland. Participants also observed
that uphill neighbors (outside their community) often plug the sewage drains and pipes with trash,
which also lead to overland flow of sewage.
On the issue of retaining walls there were two themes: retaining walls are needed to protect paths and
the “J” section is the most lacking for both path and residential retaining walls. Participants noted that
UDEVIPO constructed retaining walls for the community, but those walls were built to provide better
protection for houses. UDEVIPO did not construct retaining walls to help protect pathways. According to
participants, the community has also been unable to adequately protect pathways. Thus, a strong
community desire was to have more retaining walls designed to increase pathway safety and integrity.
Resident of “J” section claimed that their area has the biggest problem with retaining walls in the entire
community. There seemed to be some agreement on this point by residents of other sections. The “J”
section has had no permanent walls in the nine years the community has existed. The walls are all built
by residents out of sand bags and wood. These temporary walls get damaged or fail every rainy season,
requiring repairs each dry season.
After participants had placed dots associated with pathways, drainages, and retaining walls, as well as
participated in discussion of each, they were asked to choose two dots of any of the three colors in
order to vote for the issue (and location) they thought was most important in their community. Six dots
were placed for pathways, six for retaining walls, and six for drainages. At first glance this would suggest
that participants felt that pathway and retaining wall issues were of equal importance. However, one
could interpret the results as prioritizing drainage issues, based on the conflation of reasons for placing
pathway and drainage dots. (This might also provide insight into answers to the Question 1: Major
Problems, discussed in the previous section. One could argue that there is overlap in at least some
participant’s interpretation of Answers B, C, and E, meaning they feel drainage issues are more

49
Situation Assessment -Green et al. Working Paper 2009_1
July 2009
important the retaining walls. This overlap is likely more pronounced for Unidos 8 de Marzo residents
than for Las Brisas residents, where most pathways were more permanent.)
Joint Discussion
After each of the two groups finished their individual mapping, everyone combined to discuss the
similarities and differences between the two communities. Representatives from each group briefly
described the challenges facing their community. Representatives from both Las Brisas and Unidos
stressed the importance of drainage, and how badly everyone is affected during the rainy season.
Representatives from Las Brisas noted more issues with underground drainage problems - for instance
drainage pipes ending short of the ravine’s edge, which increases soil saturation and decreases slope
stability. Representatives from Unidos focused more on over-ground drainage problems, such as their
water treatment facility overflowing onto pathways because drainages are either clogged or insufficient.
When asked how their problems were similar or different, four individuals discussed how both
communities face comparable issues, but no one vocalized any differences.
Interest in Additional Knowledge
In conclusion, WWU representatives noted that many of the problems discussed required three
resources to be addressed: time, materials/financial resources, and knowledge. They then asked a final
question regarding knowledge resources. Each participant was asked to vote on what they would like to
know more about. Choices ranged from how to construct better houses to how to build better drainage
systems. One community leader from Las Brisas asked that an additional item be added to the list:
conflict resolution. This was added as to the list as ‘Improved Community Organization’ and each
participant was given three dots with which to vote. Again, participants were reminded that they could
place all dots on a single item to indicate extreme interest, or one to two dots on multiple items to
indicate moderate interest in more than one item.
Table 25. Tally of dot votes for additional knowledge.
Additional Knowledge Votes
Constructing better houses 10
Constructing better drainages 15
Constructing better pathways 7
Constructing better walls 25
Improved community organization 3

50
Situation Assessment -Green et al. Working Paper 2009_1
July 2009
Participants voted for learning how to construct better walls as their top choice, at 25 votes. Building
better drainage and better houses followed with 15 and 10 votes respectively. Pathways received fewer
votes at seven, and improved community organization received three votes.
The focus group discussion was concluded by thanking the participants, photographs, and a meal
prepared by Las Brisas residents.
51
Situation Assessment -Green et al. Working Paper 2009_1
July 2009
IV. ORGANIZATIONAL ANALYSIS
We conducted an analysis of significant institutions and organizations with respect to disaster risk
reduction of the Villa Nueva case study settlements. This serves to put the household survey described
above into context, with respect to horizontal and vertical relationships of residents with other
important actors. The analysis is from the perspective of the residents of the settlements (particularly
the case study settlements) on the issue of disaster risk reduction of their community. That is,
institutions and relationships not deemed significant from these perspectives were left out.
Data collection for the analysis primarily consisted of interviews and focus groups meetings with several
representatives from Oxfam GB (Guatemala City office), CONRED, Villa Nueva Municipality, and San
Carlos University. This dataset should eventually be augmented with interviews with additional
organizations, as well as compilation of government documents. Analysis focused on identifying
important actors and relationships.
Following, are two sections; the former enumerating the results of the analysis and the latter discussing
the significance of the results in the context of the household survey. The results section first provides
an overview and then analyses three specific types of actors identified in this context.
Institutional Analysis Results
Data analysis resulted in identifying three important types of actors within the context of settlement
disaster risk reduction in Villa Nueva (and by extension the Guatemala Metropolitan Region):
government, non-government and residents. Important government actors are the central government
of Guatemala and the municipal government (in this case) of Villa Nueva. The regional and district
governments do not for the most part play a significant role in the development of precarious
settlements. And while the Guatemala Metropolitan region is constitutionally required to have a
governance structure coordinating municipalities, such an institution remains unrealized. Residents can
be usefully categorized with respect to the legal status of their home. There is a vast array of social
relationships between residents, as well as neighborhoods/settlements in various states along the way
to legalization. However, for the purpose of this analysis a binary of precarious settlements versus legal
neighborhoods is most useful. Lastly, important non-government actors include NGOs (international
non-profits and community-based organizations), the private sector, and the informal sector. For this
analysis, we focus primarily, but not exclusively, on Oxfam GB, as representative of NGO actors. A deep
analysis of the informal and private sector are beyond the scope of this work, but are included because
of the important relationships they provide with respect to precarious settlement disaster risk
reduction.
In addition to identifying three types of actors, the analysis resulted in identification of three significant
types of horizontal and vertical relationships between actors: financial, oversight, and service. That is,
the majority of relationships described by the collected data can be classified as one of these types of
52
Situation Assessment -Green et al. Working Paper 2009_1
July 2009
relationships. How a particular relationship is manifested can vary significantly, depending on the actors
involved. Financial relationships include federal appropriations, taxes, grants, donations, wages, and
remittance, among others. Oversight relationships include laws, regulations, formal rules, contracts, and
cultural or social norms. Services are the most wide ranging type of relationship and can include
everything from labor, consulting, utilities, provision of materials, training, and so on.
An overview of the institutional analysis results is depicted in Figure X1. This figure lists the three major
types of actors and the relationships currently in place between actors of each type. The figure
highlights what relationships are or are not available to each actor for promoting disaster risk reduction
in precarious settlements. What is immediately apparent is that there is little in the way of direct
financial relationships and no oversight relationships between precarious settlement residents and all
other actors. Instead, the direct relationships between actors and precarious settlement residents are
services.
Of the minimal financial relationships with outside actors, the majority is associated with the purchase
of electricity and water services from the public or private sector. (There are also similar internal
financial relationships with neighbors.) Money is also spent on building materials from the private or
informal sectors. Financial relationships resulting in money flowing into the settlements consist
primarily of wage labor in the private and informal sector. Technically, there are oversight relationships
between government and precarious settlements, such as taxes and land use restrictions, as with legal
neighborhoods, but they are rarely enforced. There are oversight relationships within the settlements
between leaders/landlords and settlers/tenants, as well as typical structures of domination (gender,
age, tenure, etc.).
As mentioned previously, residents provide external services in the form of wage labor; this labor likely
is primarily service work, but also includes construction and industrial occupations. The other significant
external service provided by residents is voting, both for federal and municipal elected officials.
Informally, this service can be exchanged for inflowing services, such as infrastructure construction.
Another service by the precarious settlement residents is lobbying the central government for
legalization. This is an unusual service because it can be performed for settlement leaders, but
interfaces government actors. The same service can often be provide by proxy of NGOs; that is, an NGO
serves as an intermediary—someone who does not distort an actor’s interests. It is unclear whether
there are other intermediaries for the precarious settlement residents. Certainly, both the federal and
municipal governments provide services for precarious settlement residents, but the interests behind
these services are difficult to determine. The most common services provided to the precarious
settlement residents are infrastructure construction, construction materials, and utility services. It
appears that any type of actor can provide each of these types of services. This results in a wide variety
of alternatives of varying quality and efficacy, in addition to frequent instances of cross-purposes. In
contrast, the precarious settlement residents have a very unique set of service relationships with
53
Situation Assessment -Green et al. Working Paper 2009_1
July 2009
abutting legal neighborhoods. These include limited access to the precarious settlement and
downstream issues such as disposed garbage and sewage overflow (a disservice).
Relationships between actors not including precarious settlement residents (and the informal sector)
are primarily financial. Quite literally, money flows around the precarious settlements, but not directly
into them. The most significant financial relationship is most likely that between the central
government and municipal government. Twelve percent of the national budget is appropriated to
municipalities; this is the primary funding source for municipal operating and capital budgets. Special
project funding, for example for settlement improvement projects, can be requested and is evaluated
on a case-by-case basis by the national planning institute SEGEPLAN. The central government, via CIV
(Ministry of Communications, Infrastructure, and Housing), procures services and infrastructures for
precarious settlements from NGOs and the private sector. CIV contains the agencies UDEVIPO,
FOUGAVI, and DAHVI, which provide various services to precarious settlements, such as utilities and
infrastructure. Similarly NGOs might procure services and infrastructure for precarious settlements
through the private sector. CONRED often procures risk assessment services from private sector
consultants, which are used as the basis for legalization decisions and special project funding. Money is
brought into the institutional networks via international donors (to local NGOs), international
development banks, international aid, and federal taxes.
There is very little oversight or coordination between the central government and other actors, most
importantly municipalities. Municipalities have relative autonomy with respect to the central
government. There are land use regulations handed down to the municipalities, but these are often
difficult for any actor to enforce.

Figure 13. Overview diagram summarizing institutional analysis.

Situation Assessment -Green et al. Working Paper 2009_1
July 2009
Institutional Analysis Discussion
The results of the institutional analysis highlight several themes with respect to disaster risk reduction of
precarious settlements in Villa Nueva, and arguably by extension the Guatemala Metropolitan Region.
The first and most promising theme is that many actors have identified the need for disaster risk
reduction in the precarious settlements; a loose institutional network is beginning to form around the
issue. As part of this formation, actors are starting to identify the interests of precarious settlement
residents with respect to disaster risk reduction. It is possible however that some actors are co-opting
the interests of the precarious settlements for their own gain (e.g., using disaster risk reduction efforts
as a means to gain votes).
There is not a lot of evidence that actors understand their role well, nor the role of other organizations
and institutions. Some of this can be attributed to a high degree of turnover in both federal and
municipal governments. As a result, there is a not a lot of communication, coordination, cooperation, or
collaboration on disaster risk reduction for precarious settlements.
A troublesome theme related to the lack roles and, in turn, lack of communication, coordination,
cooperation, and collaboration are a range of efforts and initiatives that tend to have cross-purposes.
The highly decentralized network that precarious settlement residents can leverage for obtaining
services and infrastructure exacerbates this. For example, the federal government may have land use
regulation preventing development, a municipality or private sector business may provide infrastructure
that encourages inhabitation.
Combine the nascent network with lack of coordination and network instability results. While many
actors have identified the problem of disaster risk reduction in precarious settlements, it is likely that a
relatively small change in context (e.g., political turnover, economic shift, public sentiment, etc.) could
result in the network collapsing. This creates a negative feedback loop where it is difficult to attract
investment and build momentum in disaster risk reduction because of the uncertainty associated with
future support or involvement of all actors currently involved.
The observation that there are not many inflows of money into the precarious settlements is not
entirely related to disaster risk reduction. It is a general observation that these residents do not have
significant access to income. However, increased income would result in a greater capacity for residents
to reduce their own risk. It is also an observation related to the themes of co-optation and network
instability. That is, there are minimal opportunities provided by external actors to precarious settlement
residents to influence the allocation of funds used in improving the settlements. Similar to having
greater income, residents could use this influence to more directly reduce their disaster risk, while
avoiding cooptation.
The last important theme relates to obligatory points of passage – particular actors in a network that
another actor is required to interact with to meet the latter actor’s interests. The two obviously

56
Situation Assessment -Green et al.l. Working Paper 2009_11
July 20099
obligatory points of passage for precarious settlement residents are CIV and adjacent legal
neighborhoods. These points of passage are considerably different. CIV is the ministry in the central
government that control legalization of settlements. Settlement leaders, some residents, municipalities,
and NGOs may all interact with CIV for the same purpose. As a result, CIV has the potential to shape
development and practices in precarious settlement to promote disaster risk reduction via incentives
and legalization criteria. This might also be the reason the residents feel that central government, more
than other actors, needs to do more to help them with disaster risk reduction. Conversely, adjacent legal
neighborhoods have little potential to influence development and practices within the precarious
settlements. However, their physical role as both entrance and being uphill sets up a power dynamic
between legal neighborhood residents and precarious settlement residents. Thus, for example a
mediator (e.g., government) likely has to step in to incentivize (e.g., subsidized garbage collection) or
restrict activities such as clogging drains with garbage.

57
Situation Assessment -Green et al.l. Working Paper 2009_11
July 20099
V. EMERGING THEMES
A third of Guatemala Metropolitan Region residents or more live in informal squatter settlements, many
in steep ravines with heightened landslide risk. Settlement residents receive little help from the
government, which generally believes that the market should be the primary economic actor in
development. Residents attempt to manage landslide, flood, and hurricane risk with limited resources
and awareness of innovative socio-technical solutions. Residents express a strong desire for help in
community development that reduced vulnerability to natural
hazards. The following are five interrelated themes that
emerged from this situation assessment.
Flooding and Inadequate Drainage
When residents were questioned about the biggest
problems in their settlement (not restricted to natural
hazards), water management and flooding, and a desire
for solutions to these issues, was a dominant issue. Over
50% of the household survey respondents said that
drainage was the biggest problem. In contrast, landslide
and housing collapse was a major concern in only 33% of
the responses to the question about overall problems in
the setltement. During the community mapping exercises,
focus group participants also placed high priority on
improving drainage. Eight out of 19 and 10 out of 16
“greatest priority dots” for Las Brisas and Unidos 8 de
Marzo respectively, were chosen to represent the need for
improved drainage and improved pathways.
Survey respondents and focus group participants strongly believed that the current drainage ditch
infrastructure and black water pipe systems (both those servicing their community and the formal
settlements above them) were highly inadequate. Residents believed that the pipes and ditches
were too small and that this was one of the main factors in frequent overflows. When waste and
storm water overflowed the ditches and pipes, it washed through the informal settlement homes.
Residents explained that this caused their retaining walls to collapse, their house walls to lean,
and created rivers of mud through their homes. Several residents showed black water pipe
connections that leaked during heavy precipitation and caused sewage to flow into their homes.
Figure 14. Trash accumulation in
drainage ditches.

58
Situation Assessment -Green et al.l. Working Paper 2009_11
July 20099
Informal settlement residents also were very concerned about inadequate roof gutters. Some
homes had improvised gutter systems to collect rainwater off the edges of roofs and funnel it into
underground storm water and sewage collection systems that emptied out into the ravine at the
bottom of the settlement. Other homes had no gutter system. Residents pointed out that lack of
gutters or inadequate gutters resulted in streams of water falling off roof edges onto the retaining
walls, yards or roofs of their neighbors.This had caused retaining wall collapse, housing collapse
and general misery for those nearby.
Slope Instability and Residents’ Perception of Flooding and Refuse Management
When asked directly about natural hazard risk, the overwhelming majority of informal
settlement residents were most concerned about landslide risk, in contrast to flooding,
earthquakes, fires, and hurricanes. Seventy percent of those surveyed in Las Brisas and 81% of
those surveyed in Unidos 8 de Marzo. Landslides also received the second highest number of
dots in a snap poll during focus group discussions. Many people showed us areas of considerable
erosion on the edges of the ravine, and spoke about being afraid of their homes sliding down the
ravine. Slope stability was also a strong concern when residents were asked to discuss and map
areas in need of improvement in their settlements. The placement of new retaining walls was the
most hotly debated improvement, as it was seen as a matter of life and death, in a way that
drainage was not.
What emerged from the situation assessment in the two informal settlements was a widespread
belief that landslides were rooted in problems of water and refuse management. When asked
what made landslide risk greater, most focus group respondents stated that human actions
triggered or increased landslide risk. Trash and litter in the gutters was seen as a primary cause,
along with inadequate drainage. Respondents also drew links between landslides and drainage
when they stated that ground alterations (drainage ditches, clearing drains, and building cement
paths) were mitigation actions they had taken. During the focus group discussion, respondents
also drew links between slope stability, trash buried in the ground, and the fact that litter clogged
drains and caused them to overflow.
Many residents stated that litter on the ground and in the drainage ditches caused water to
overflow sewage and storm water systems during heavy precipitation. This overflow was seen as
causing retaining wall collapse, soil to quickly wash away, loss of land, the undermining of
housing walls, in addition to the general misery of having water run through their houses.
Residents also discussed the noticeable loss of land during the rainy season from precipitation
directly on soil and from overflowing storm water runoff.

59
Situation Assessment -Green et al.l. Working Paper 2009_11
July 20099
Of course, these are perceptions of residents about what increases the slope failure potential in an
already hazardous situation. The terrain on which the settlements have been built is extremely
steep (great er than 45 degrees in most locations). Soil in the area is relatively cohesionless and
thus very susceptible to reduction in shear strength from increase ground water saturation and
flow during the rainy season.
The residents showed a strong desire to find better solutions for constructing walls to stop
landslides in their community and ways to better manage rainwater. In ranking exercises with the
focus group participants, overwhelming ranked “receiving training on better wall construction”
as a top priority, followed by “receiving training on better drainage construction.”
Conflicts between Formal and Informal Settlements
Another significant theme we see emerging from the situation assessment is the considerable
tension between the informal settlements and their immediate formal settlement neighbors.
Multiple times during household interviews and during the focus group discussions, these
tensions were acknowledged and discussed. It was clear that informal residents did not feel that
formal settlement residents trusted them and that informal residents felt that they were impacted
by decision and practices in the formal settlements. While the situation assessment did not allow
us to hear the perspectives of formal settlement residents, it appeared that both the formal and
informal residents begrudged having to live side-by-side. As Elias notes in his figurative model
of established and marginalized people “[M]ere residential permanence in that place, with all it
implies, may generate a degree of group cohesion, collective identification and common rules,
adequate to generate in some people the gratifying euphoria linked to the sense of belonging to a
superior group and the concomitant contempt for other groups. Thus, marginalized exclusion and
stigmatization become powerful weapons if used by established people to maintain their identity
and reaffirm their superiority so as to firmly keep others in their place” (Scheinsohn, 2009).
Both informal settlements were impacted by inadequate or faulty infrastructure projects
completed in the formal settlement. Las Brisas residents pointed out a retaining wall built in the
edge of the formal settlement, right above their homes, as a major source of problems. The
municipality had built the wall inadequately; during the rainy season, water pressure built up
behind the wall and it failed, sending a shower of black water, trash, and mud flooding down
onto several homes. In Unidos 8 de Marzo, residents claimed land around a sewage treatment
plant on the ravine slope built for the formal settlement. The small treatment plant is not
currently not monitored or managed by the municipality and being inadequate in size, it often
overflows. The open storage tanks attracted flies and mosquitoes. In both cases, the informal

60
Situation Assessment -Green et al.l. Working Paper 2009_11
July 20099
settlement residents were not eligible for municipal services themselves, but contended with the
affects of having settled near infrastructure designed for formal settlements.
Competing Jurisdictions and Missions
An institutional analysis of relationships between settlements, government agencies, and NGOs shows
that that there is little in the way of direct financial relationships and no oversight relationships between
precarious settlement residents and all other agencies or entities. While technically, there should be an
oversight relationship between the settlements and the municipal relationship, this is rarely
enforced. Instead, land tenure for informal settlements is provided at the national level, while local
municipalities set zoning limits, authorize building permits, and provide public services such as water,
sewage, and electricity either through direct distribution or through private businesses with municipal
contracts. This had led to an untenable situation in municipalities like Villa Nueva whereby they may
designate zones for agricultural or non-residential use, only to have the land invaded and developed
informally. Settlers apply and receive land tenure, often only after years of legal review. The muncipality
is then in a difficult position of providing services to areas believed to be of too high risk for residential
use, often with added costs associated with ex-post service provision. While the situations is less than
ideal, those we spoke to in governmental positions realized that precarious settlements would indeed
by legalized and that there was a crucial need for managing, and if possible, reducing natural hazard
risks within these settlements.
VI. PROSPECTS FOR AN URBAN DISASTER RISK REDUCTION PROGRAM
The Multisectoral meeting, the focus groups, and the participatory voting and mapping exercises were
all attempts to directly involve stakeholders, especially informal settlement residents, in our work of
information gathering and in envisioning future programming and a DRR framework. The Multisectoral
meeting provided us with an opportunity to more fully introduce ourselves and discuss the intentions
behind our work and to promote an open and two-way exchange between ourselves and concerned
community members. The participatory mapping and voting exercises, besides serving a purpose of
providing us with critical information, also functioned as a mechanism for residents to learn from each
other. Despite the relative small size of these settlement communities, rough geography and other
aspects often contribute to neighbors not knowing each other well on a personal level, let alone their
thoughts about risks and mitigations. The mapping and voting exercises were designed to give
participants an individual voice as well as to visually present a "collective" or aggregate perspective on
the critical issues. Idea presentation, discussion, and analysis are critical elements of consensus building
needed for individual and household level buy-in for community-led collective action. This situation
assessment was a first step in developing a consensus on and strategy for an urban disaster risk
reduction in Guatemala’s urban areas.

61
Situation Assessment -Green et al.l. Working Paper 2009_11
July 20099
The assessment shows that community leaders and residents in the squatter settlement strongly agreed
that outside supporters like Oxfam should help them develop their communities in ways that reduced
vulnerability to future hazards. They were also keen on applying collaborative decision making strategies
to a range of economic, social, physical, and political issues.
The interest in urban DRR in the precarious settlements extends beyond settlement residents. Within
the municipal and national government, planners and emergency management officers were initiating
activities that focused on community early warning systems, understanding social vulnerability, and an
integrated disaster risk reduction and urban land use planning strategy. It is indeed promising that a
loose institutional network is beginning to form around risk reduction. Clearly, urban disaster risk
reduction is not only needed in the precarious settlements, but strongly desired by residents,
community organizations, and municipal actors alike.
WORKS CITED
Diaz, Andres Cabanas, Emma Grant, Paula Irene Del Cid Vargas, and Veronica Sajbin Velasquez. 2000. "El
Mezquital: a community's struggle for development." Environment and Urbanization 12: 87-217.
Davis, Shelton H. & Hodson, Julie. 1982. Witness to Political Violence in Guatemala: The Suppression of
a Rural Development Movement, Washington, D.C.: Oxfam America.
OxFam. Study of Knowledge, Attitudes and Practice Guatemala. 1 Oct. 2008.
Wisner, Ben. At Risk Natural Hazards, People's Vulnerability and Disasters. 2nd ed. New York: Routledge,
2003.
United Nations Development Programme (UNDP). Human Development Reports. 18 Dec. 2008. United
Nations. Retrieved 30 May 2009 from
<http://hdrstats.undp.org/2008/countries/country_fact_sheets/cty_fs_GTM.html>.