Farming development in response to urban expansion in Greece

ARTICLE IN PRESS
Soil Dynamics and Earthquake Engineering ] (]]]]) ]]]–]]]
Contents lists available at ScienceDirect
Soil Dynamics and Earthquake Engineering
0267-72
doi:10.1
� Corr
E-m
Pleasanaly
journal homepage: www.elsevier.com/locate/soildyn
Site response analysis of Vartholomio W-Greece from singular spectrumanalysis of microtremor and weak motion data
G-Akis Tselentis, Paraskevas Paraskevopoulos �
Patras Seismological Laboratory, University of Patras, Greece
a r t i c l e i n f o
Article history:
Received 28 August 2009
Received in revised form
11 December 2009
Accepted 15 December 2009
Keywords:
Site effects
Microtremors
Weak motion
Singular spectrum analysis
Amplification
Vartholomio
61/$ - see front matter & 2010 Published by
016/j.soildyn.2009.12.011
esponding author.
ail address: [email protected] (P. Paraskevopo
e cite this article as: Tselentis G-A, Psis of microtremor and weak motio
a b s t r a c t
Twenty six sites were instrumented in the city of Vartholomio following the December 2, 2002 Ms 6.0
earthquake. Thirty weak events from the aftershock sequence as well as microtremors were used to
identify amplifications due to geological site effects. Horizontal-to-vertical spectral ratios (HVSR—
Nakamura estimates) and weak events ratios were calculated and the singular spectrum analysis (SSA)
method was used. The results showed that the effects of SSA on the stability of the frequency peak and
amplitude distribution of HVSR for both weak motion and microtremors. The data analysis confirms the
role of near surface geology in causing locally significant variations of the predominant frequencies and
amplitudes of ground shaking as already inferred from the distribution of damages. The site response
spectra exhibited significant peaks within the range of 1.5–2.6 Hz and the amplification factor did not
exceed 6.5. Finally the parts of the HVSR ratios from �0.2 up to 10 Hz were used, in order to create an
automatic optimal zonation of the study area using a genetic algorithm. This procedure resulted in the
division of the city into 2 main zones.
& 2010 Published by Elsevier Ltd.
1. Introduction
Local site conditions are one of the most important factorswhich characterize the distribution of earthquake damage. Wellknown examples from San Francisco (1989), Guerrero Michoacan(1985), Northridge (1994), Kobe (1995), Armenia (1999) andTurkey (1999) earthquakes have been extensively cited toillustrate the role of surface geology on seismic waves. Reliablesite response models are essential to estimate the amplificationpotential and the probabilistic and deterministic distributions ofthe peak and spectral amplitudes of ground shaking at the surface.
Many experimental methods have been used to quantify thesite effects and define the site response functions (e.g. Field andJacob [14]). Although the best determination of site responsefunctions is obtained from strong ground motions [30], spectralanalysis of microtremors (low amplitude ground motioncontinuously recorded when earthquakes are not recorded) andweak motions from earthquakes can be an alternative tool toquantify site effects [2].
The horizontal-to-vertical spectral ratio (HVSR) (the ratiobetween the Fourier amplitude spectra of the horizontal andvertical components of the microtremors) was first introduced byNogoshi and Igarashi [27] and was widely spread by Nakamura
Elsevier Ltd.
ulos).
araskevopoulos P. Site respn data. Soil Dyn Earthquak
[24–26]. Since then, many investigators have reported thesuccessful application of the method for estimating the funda-mental frequency f0, which has been applied also inside urbanenvironments e.g. [3,4,11,13,15,20,29,31]. Furthermore, severalstudies e.g. [8,33] found that the HVSR results are correlated withthe distribution of damages, after taking vulnerability intoconsideration.
Several theoretical 1D investigations that have computedmicrotremor synthetics using randomly distributed near-surfacesources e.g [14,18], have shown that H/V ratios sharply peakedaround the fundamental resonance frequency of SH waveswhenever the surface layer exhibits a sharp impedance contrastwith the underlying stiffer formations.
A simple straightforward modification of the above techniqueconsists in taking the spectral ratio between the horizontal andthe vertical components of weak earthquake recordings. Thistechnique is in fact a combination of Langston’s [19] receiverfunction method for determining the velocity structure of thecrust from the horizontal to vertical spectral ratio of teleseismicP waves, and Nakamura’s method. In the literature several studiescan be found where weak motion data where applied to assesssite effects in urban areas, even though originally they were notproposed for cities e.g. [10,23,31,32,34,36,38,39] exhibiting arather good correlation with surface geology, and in many casesare able to predict site resonance frequencies, whereas there is alower reliability on the amplification factors [2]. Most of theearthquake data examined in the HVSR investigations are relevant
onse analysis of Vartholomio W-Greece from singular spectrume Eng (2010), doi:10.1016/j.soildyn.2009.12.011

ARTICLE IN PRESS
G.-A. Tselentis, P. Paraskevopoulos / Soil Dynamics and Earthquake Engineering ] (]]]]) ]]]–]]]2
to weak motion recorded at short term temporary networksdeployed for microzonation purposes. To obtain a statisticallysignificant database of weak events we need long recordingperiods, with the exception if we install the network to record anaftershock sequence, as it is in our case. Theodulidis et al. [34]using a dataset of 22 earthquakes at the Garner Valley array,concluded that the HVSR applied to weak motion data showedgood stability and it was not influenced by source location ofmechanisms. In another investigation Mucciarelli et al. [23], afteranalyzing two years worth of data, concluded that HVSR is aremarkably stable site dependant feature.
Recently Carniel et al. [9], showed that the application of thesingular spectrum analysis (SSA) methodology on Nakamura’sapproach can improve the results. The SSA allows the time seriesto be decomposed into different components, e.g., the signal itself,as well as various noise components, which can be subsequentlyremoved from the time series. Since microtremors and weakmotions are measured along two horizontal directions and onevertical direction, we get two Nakamura spectral ratios that inmany cases show considerable difference. The cause of thisdifference may be the presence of artificial noise (e.g. ghosttransients) and the application of the SSA methodology canreduce this effect.
Finally in order to identify parts of the study area that havesimilar ground-motion behavior, an automatic method usinggenetic algorithms as in [5,6] is employed. This method uses theclassification of the HVSRs as objective criteria for an initialmicrozonation of the area.
2. Geological setting and data
The city of Vartholomio is located in the most seismicallyactive part of Greece, and is undergoing urban development.During its history, strong earthquakes have severely affected thesite. On 16 October 1988 an Ms=5.9 earthquake reached a seismicintensity of 7 on the MSK scale, causing serious damages in thecity. The seismic intensity was higher than would normally beexpected from the magnitude and epicentral distance of the
Fig. 1. Epicenters of the Ms=5.9 1988 (black star) and Ms=6.0 2002 (grey star) earthquak
city. Circles are the epicenters of the weak motion data used in the present investigati
Please cite this article as: Tselentis G-A, Paraskevopoulos P. Site respanalysis of microtremor and weak motion data. Soil Dyn Earthquak
earthquake (Fig. 1). More recently, the Ms=6, December 2, 2002earthquake, severely damaged many parts of the town, reaching aseismic intensity of 5–6 on the MSK scale. It is likely that thestructural damages all over the area of Vartholomio, after takinginto account the vulnerability of the structures, are caused bylocal site effects of the sedimentary layer that may have amplifiedthe earthquake ground motion.
Following the December 2, 2002 Ms 6.0 earthquake and duringthe period from December 7, 2002 to January 7, 2003, theUniversity of Patras seismological lab installed and operated a 26stations seismological network in and around the city ofVartholomio (Fig. 1). The stations were instrumented with aLandTech LT-S01, three component velocity sensor with flatresponse between 0.2 and 100 Hz and a sensitivity of 1000 V/m s.The seismological data have been recorded using an EarthData24bit digitizer with a sampling rate of 100 samples /second.
The study area is situated on the external part of the HellenicArc and therefore subjected to intense neotectonic deformationand high seismicity. More specifically, this area is part of theneotectonic depression (graben) of Pirgos, which is delimited bytwo faults of NW–SE and NNE–SSW direction and it is character-ized by co-sedimentation tectonism [21].
To the west of the city of Vartholomio, there are outcropingalpine formations (Ionian zone). These are considered as thebedrock of Vartholomio. In geochronological order, three geolo-gical formations can be located [22]:
The Vounargo formation, having a total thickness that canexceed 500 m, comprises of various sandstones and shales. Thisformation outcrops to the west of Vartholomio.
Developing unconformably over the previous Vounargo for-mation, are the Calcitic Sandstones. They contain locally fine orcoarser material, from various rocks. This unit has a thickness ofup to 20 m.
Alluvial formations, composed of clayey sands and sandy clays,overlying unconformably the previous formation. These occupythe major plain of Vartholomio and their thickness is increasingtowards the east.
The topmost layer, inside the city, has a thickness increasingfrom 6 m in the Western part to 15 m in the Eastern part, and
es. Triangles depict the installed microearthquake network within the Vartholomio
on.
onse analysis of Vartholomio W-Greece from singular spectrume Eng (2010), doi:10.1016/j.soildyn.2009.12.011
ARTICLE IN PRESS
G.-A. Tselentis, P. Paraskevopoulos / Soil Dynamics and Earthquake Engineering ] (]]]]) ]]]–]]] 3
according to research-drillings and geophysical investigations[35], consists of recent deposits of soft to medium density clayeysands, sandy clay of medium cohesiveness, sandy clays of mediumplasticity locally with gravel, thin layers of silt and soft layers ofplastic clay.
3. Theory
3.1. Singular spectral analysis (SSA) method
The SSA method [12], sometimes called caterpillar method[16] or Karhunen–Lo�eve decomposition [28], has its roots in chaostheory [7] and only recently has been applied to in time seriesanalysis of microtremor data by [9].
SSA is designed to decompose time series and thus providesinsight into the unknown or only partially known dynamics of theunderlying system that generates the series [37]. It allows one tounravel the information embedded in the delay-coordinate phasespace by decomposing the sequence of augmented vectors thusobtained into elementary patterns of behavior. It does so byproviding data-adaptive filters that help separate the time seriesinto components that are statistically independent, at zero lag, inthe augmented vector space of interest. These components can beclassified essentially into trends of oscillatory patterns and noise.
The method provides an orthogonal basis onto which the datacan be transformed, thus making individual data components(modes) linearly independent. Each of the orthogonal modes,which are projections of the original data onto new orthogonalbasis vectors, is characterized by its variance, which is given bythe related eigenvalue of the covariance matrix. In traditional SSA,the distinction of signal from noise is based on finding a thresholdto a noise floor in a sequence of eigenvalues given in a descendingorder.
The first step of SSA is the embedding, where the one-dimensional seismic data time series is recast as a multidimen-sional trajectory matrix X. Considering a time series x={x1, x2,x3,y, xN} with N samples and an embedding dimension (cater-pillar length) M, we obtain the trajectory matrix X
X ¼
x1 x2 : : : xM
x2 x3 : : : xMþ1
: : : : : :
: : : : : :
xk xkþ1 : : : xN
26666664
37777775
ð1Þ
where k=N�M+1.The number of columns of the trajectory matrix should be
sufficiently large to capture the global behavior of the time series.Starting the process we compute the singular value decom-
position of X. We start by computing the lagged covariance matrixC
C ¼XT XX
N�Mð2Þ
and its spectral decomposition C=FLFT, where F is an ortho-normal matrix having as columns the eigenvectors of C (providingthe orthonormal Karhunen–Lo�eve basis in the space of vectors xi),and L¼ diagðs2
1;s22; . . . ;s2
MÞ with s2i non-negative eigenvalues of
C giving the variance of orthogonal modes.The singular value decomposition technique allows obtaining
the decomposition of the trajectory matrix as
X ¼USVT ð3Þ
where U is a (N�M+1)� (N�M+1) orthogonal matrix, V is am�m orthogonal matrix and S is a (N�M+1�M diagonal matrixwho’s elements are the trajectory’s matrix singular values which
Please cite this article as: Tselentis G-A, Paraskevopoulos P. Site respanalysis of microtremor and weak motion data. Soil Dyn Earthquak
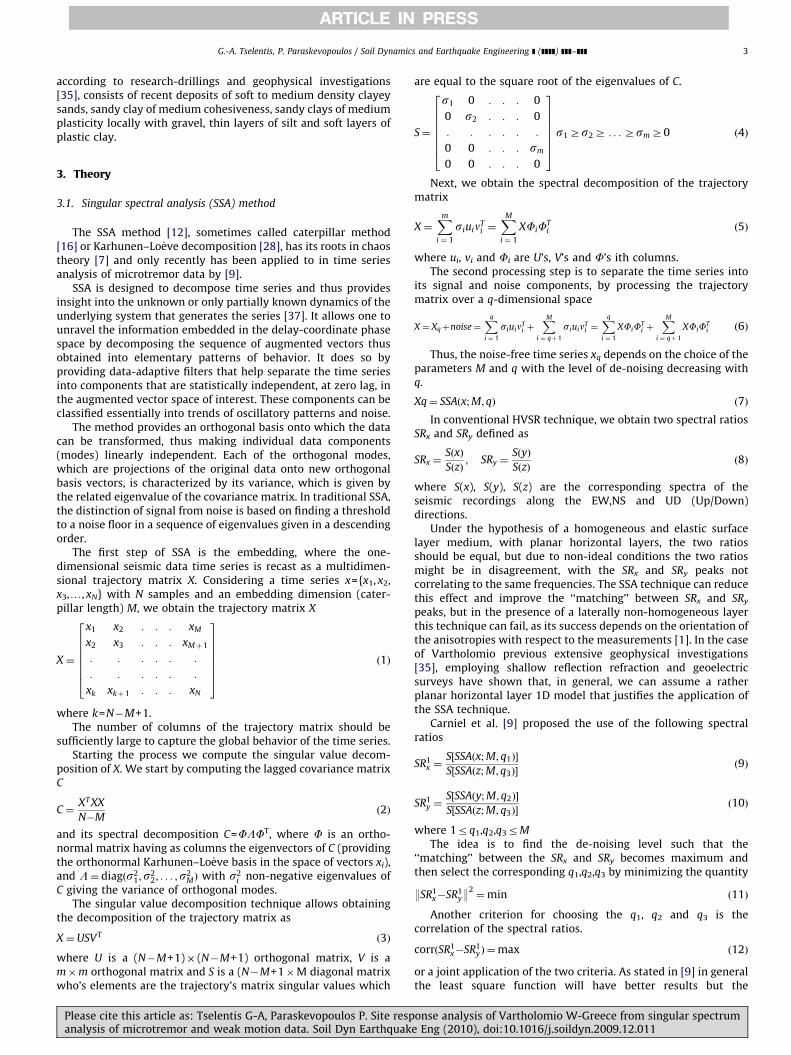
are equal to the square root of the eigenvalues of C.
S¼
s1 0 : : : 0
0 s2 : : : 0
: : : : : :
0 0 : : : sm
0 0 : : : 0
26666664
37777775s1Zs2Z . . .ZsmZ0 ð4Þ
Next, we obtain the spectral decomposition of the trajectorymatrix
X ¼Xm
i ¼ 1
siuinTi ¼
XMi ¼ 1
XFiFTi ð5Þ
where ui, vi and Fi are U’s, V’s and F’s ith columns.The second processing step is to separate the time series into
its signal and noise components, by processing the trajectorymatrix over a q-dimensional space
X ¼ Xqþnoise¼Xq
i ¼ 1
siuinTi þ
XMi ¼ qþ1
siuinTi ¼
Xq
i ¼ 1
XFiFTi þ
XMi ¼ qþ1
XFiFTi ð6Þ
Thus, the noise-free time series xq depends on the choice of theparameters M and q with the level of de-noising decreasing withq.
Xq¼ SSAðx;M;qÞ ð7Þ
In conventional HVSR technique, we obtain two spectral ratiosSRx and SRy defined as
SRx ¼SðxÞ
SðzÞ; SRy ¼
SðyÞ
SðzÞð8Þ
where S(x), S(y), S(z) are the corresponding spectra of theseismic recordings along the EW,NS and UD (Up/Down)directions.
Under the hypothesis of a homogeneous and elastic surfacelayer medium, with planar horizontal layers, the two ratiosshould be equal, but due to non-ideal conditions the two ratiosmight be in disagreement, with the SRx and SRy peaks notcorrelating to the same frequencies. The SSA technique can reducethis effect and improve the ‘‘matching’’ between SRx and SRy
peaks, but in the presence of a laterally non-homogeneous layerthis technique can fail, as its success depends on the orientation ofthe anisotropies with respect to the measurements [1]. In the caseof Vartholomio previous extensive geophysical investigations[35], employing shallow reflection refraction and geoelectricsurveys have shown that, in general, we can assume a ratherplanar horizontal layer 1D model that justifies the application ofthe SSA technique.
Carniel et al. [9] proposed the use of the following spectralratios
SR1x ¼
S½SSAðx;M; q1Þ�
S½SSAðz;M;q3Þ�ð9Þ
SR1y ¼
S½SSAðy;M; q2Þ�
S½SSAðz;M; q3Þ�ð10Þ
where 1rq1,q2,q3rM
The idea is to find the de-noising level such that the‘‘matching’’ between the SRx and SRy becomes maximum andthen select the corresponding q1,q2,q3 by minimizing the quantity
:SR1x�SR1
y:2¼min ð11Þ
Another criterion for choosing the q1, q2 and q3 is thecorrelation of the spectral ratios.
corrðSR1x�SR1
y Þ ¼max ð12Þ
or a joint application of the two criteria. As stated in [9] in generalthe least square function will have better results but the
onse analysis of Vartholomio W-Greece from singular spectrume Eng (2010), doi:10.1016/j.soildyn.2009.12.011
ARTICLE IN PRESS
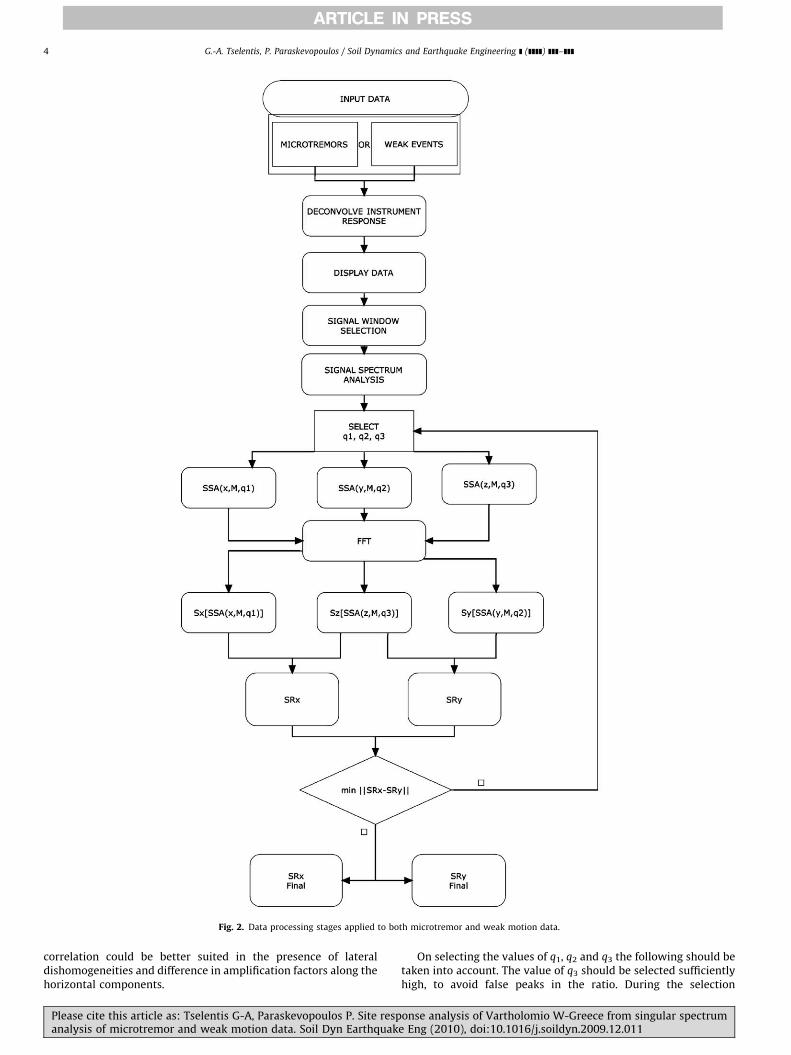
Fig. 2. Data processing stages applied to both microtremor and weak motion data.
G.-A. Tselentis, P. Paraskevopoulos / Soil Dynamics and Earthquake Engineering ] (]]]]) ]]]–]]]4
correlation could be better suited in the presence of lateraldishomogeneities and difference in amplification factors along thehorizontal components.
Please cite this article as: Tselentis G-A, Paraskevopoulos P. Site respanalysis of microtremor and weak motion data. Soil Dyn Earthquak
On selecting the values of q1, q2 and q3 the following should betaken into account. The value of q3 should be selected sufficientlyhigh, to avoid false peaks in the ratio. During the selection
onse analysis of Vartholomio W-Greece from singular spectrume Eng (2010), doi:10.1016/j.soildyn.2009.12.011
ARTICLE IN PRESS
G.-A. Tselentis, P. Paraskevopoulos / Soil Dynamics and Earthquake Engineering ] (]]]]) ]]]–]]] 5
process, the results should be monitored for abnormally highpeaks that may be present in the resulting ratio and in some casescompared with the non SSA HVSR results. If false peaks areobserved a higher value for q3 should be selected. This wasreported in [9] and was also observed during the application ofthis technique to the data. This is because SSA, as applied, can beconsidered as a filter keeping only the higher peaks whilesuppressing the lower ones. This effect becomes less importantas the values of q increase. In the case of very small q3, thedenominator of the ratio is affected and could take very smallvalues causing vertical asymptotes that can in turn produce falsepeaks in the ratio [9].
A graphical representation of the previous processing stagesdescribing the application of the SSA method is depicted in Fig. 2.
3.2. Zonation using a genetic algorithm
After the SSA processing selected parts of the spectra will beused by a genetic algorithm (GA) in order to produce an automaticzonation of the area. The theory of the method followed isdescribed in greater detail in Braggato et al. [6].
Considering all the Np stations connected in a Delauneytriangulation, on every station there is a vector SRi=(SRi,1,y, SRi,F)whose elements are the values of the spectral ratio computed inthe selected frequency range with F the number of frequencies inthat range. By removing the edges, the Delaunay triangulation canbe partitioned into Nc connected subgraphs each one consisting ofNpk measurement points (k=1 ,y, Nc). The edges of the triangula-tions are weighted using the Euclidean distance of the corre-sponding HVRS and an Euclidean minimum spanning tree (EMST)is obtained. Then for every connected cluster the within groupsum of squares (WGSS) is calculated as described in [6]. This is ameasure of the dissimilarity within every cluster. The sum of theWGSSs of all the clusters is called the residual sum of squares(RSS). For a fixed value of Nc, the optimal partioning, is the oneminimizing the value of the RSS.
The optimal zonation depends on finding the optimal value forNc. A number of statistics can be used as indicators of its value.Following [6] the Bayesian information criterion (BIC) was used.
BIC ¼NplnRSS
Np
� �þðNc�1ÞlnðNpÞ ð13Þ
The Nc selected should minimize the BIC. In this way an Nc isselected that has a small number of clusters, has a low RSS andalso achieves a significant reduction in RSS.
As discussed by Bragato and Bressan [5] one disadvantage ofusing EMSTs is that most partitions of the Delaunay triangulationwill not be generated and evaluated. Instead their variablespanning tree (VST) method is used. According to this, for apartition of the triangulation in k connected subsets, k�1 edgesare selected from the entire triangulation and assigned negativeweights. Then employing Kruskal’s algorithm the minimumspanning tree that includes them is found. Finally a connectedpartition of the triangulation is obtained by removing the selectededges from the spanning tree.
For a number of increasing Nc values the genetic algorithm isused to find the optimal partition for a Delaunay triangulationincluding Np nodes and ND edges. During each run, we programthe GA using Nc�1 parameters
ðn1;n2; . . . ;nNc�1Þ; 0rnirND�1 ð14Þ
Each ni represents an edge used to generate the VST. Thesenumbers are encoded as the ‘‘chromosomes’’ of the geneticalgorithm, consisting of b bits binary strings each, where b is suchthat 2b–1oND�1o2b. The total length of the ‘‘chromosomes’’ isb(Nc�1) and the search space includes 2b(Nc�1) individuals.
Please cite this article as: Tselentis G-A, Paraskevopoulos P. Site respanalysis of microtremor and weak motion data. Soil Dyn Earthquak
After each run the corresponding BIC is calculated. Forthe value of Nc that BIC becomes minimum, this value is selected.The procedure stops after the minimum is sufficiently individ-uated.
4. Application of the SSA technique
4.1. Application of the SSA technique on microtremor data
Microtremor recordings have been selected from the installedmicroearthquake network stations in order to estimate the siteeffects using the HVSR technique. From the records obtainedduring the continuous 1 month operation of the microearthquakenetwork, we selected 30 stationary portions of the signal thatappear unaffected by strong unwanted signals, such as shorttransients, small earthquakes or caused by human activities, usingwindows of 20.48 s length. The spectral analysis includeddetrending and 5% cosine-tapering before transformation.
Next, the SSA methodology, previously described, was applied(Fig. 2). As the ‘‘matching’’ measure, we choose the least squaressum. For all data sections we first compute the spectrogram for50% overlapping windows. In this way we can investigate thespectral stability and, if necessary, remove the portions of signalsthat are clearly contaminated by unwanted signal components,such as those described above. Next, we perform a band-passfilter between 0.2 and 15 Hz. The lowcut frequency is selected inorder to remove very high spectral energy in the very lowfrequency range. Then, for every signal window and everycomponent the SSA decomposition is performed, and thecorresponding Sx, Sy and Sz spectral estimates S[SSA(x;M,q1)],S[SSA(y;M,q2)] and S[SSA(z;M,q3)] are obtained (Eqs. (9) and (10)).Finally the ratios of the two horizontal components to the verticalare calculated for every choice of the triplet (q1, q2, q3) and thebest HVSRs are selected.
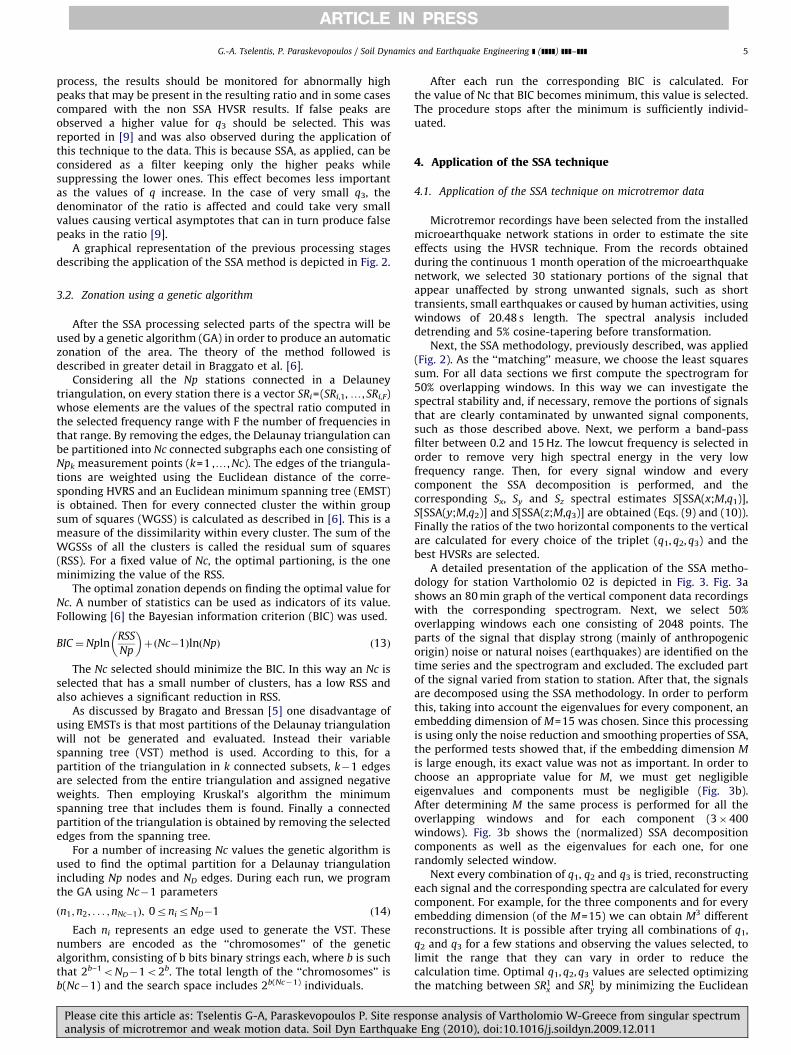
A detailed presentation of the application of the SSA metho-dology for station Vartholomio 02 is depicted in Fig. 3. Fig. 3ashows an 80 min graph of the vertical component data recordingswith the corresponding spectrogram. Next, we select 50%overlapping windows each one consisting of 2048 points. Theparts of the signal that display strong (mainly of anthropogenicorigin) noise or natural noises (earthquakes) are identified on thetime series and the spectrogram and excluded. The excluded partof the signal varied from station to station. After that, the signalsare decomposed using the SSA methodology. In order to performthis, taking into account the eigenvalues for every component, anembedding dimension of M=15 was chosen. Since this processingis using only the noise reduction and smoothing properties of SSA,the performed tests showed that, if the embedding dimension M
is large enough, its exact value was not as important. In order tochoose an appropriate value for M, we must get negligibleeigenvalues and components must be negligible (Fig. 3b).After determining M the same process is performed for all theoverlapping windows and for each component (3�400windows). Fig. 3b shows the (normalized) SSA decompositioncomponents as well as the eigenvalues for each one, for onerandomly selected window.
Next every combination of q1, q2 and q3 is tried, reconstructingeach signal and the corresponding spectra are calculated for everycomponent. For example, for the three components and for everyembedding dimension (of the M=15) we can obtain M3 differentreconstructions. It is possible after trying all combinations of q1,q2 and q3 for a few stations and observing the values selected, tolimit the range that they can vary in order to reduce thecalculation time. Optimal q1, q2, q3 values are selected optimizingthe matching between SR1
x and SR1y by minimizing the Euclidean
onse analysis of Vartholomio W-Greece from singular spectrume Eng (2010), doi:10.1016/j.soildyn.2009.12.011

ARTICLE IN PRESS
Fig. 3. (a) Example of vertical component recordings with corresponding spectrogram for station 02. (b) SSA normalized decomposition and corresponding eigenvalues.
G.-A. Tselentis, P. Paraskevopoulos / Soil Dynamics and Earthquake Engineering ] (]]]]) ]]]–]]]6
distance between them (Eq. (11)). In addition SR1x and SR1
y arecontrolled for the presence of false peaks and abnormally highratio values, as discussed in the theory section. When such peaksare detected, only higher q3 values are considered for reconstruct-ing the vertical component.
Please cite this article as: Tselentis G-A, Paraskevopoulos P. Site respanalysis of microtremor and weak motion data. Soil Dyn Earthquak
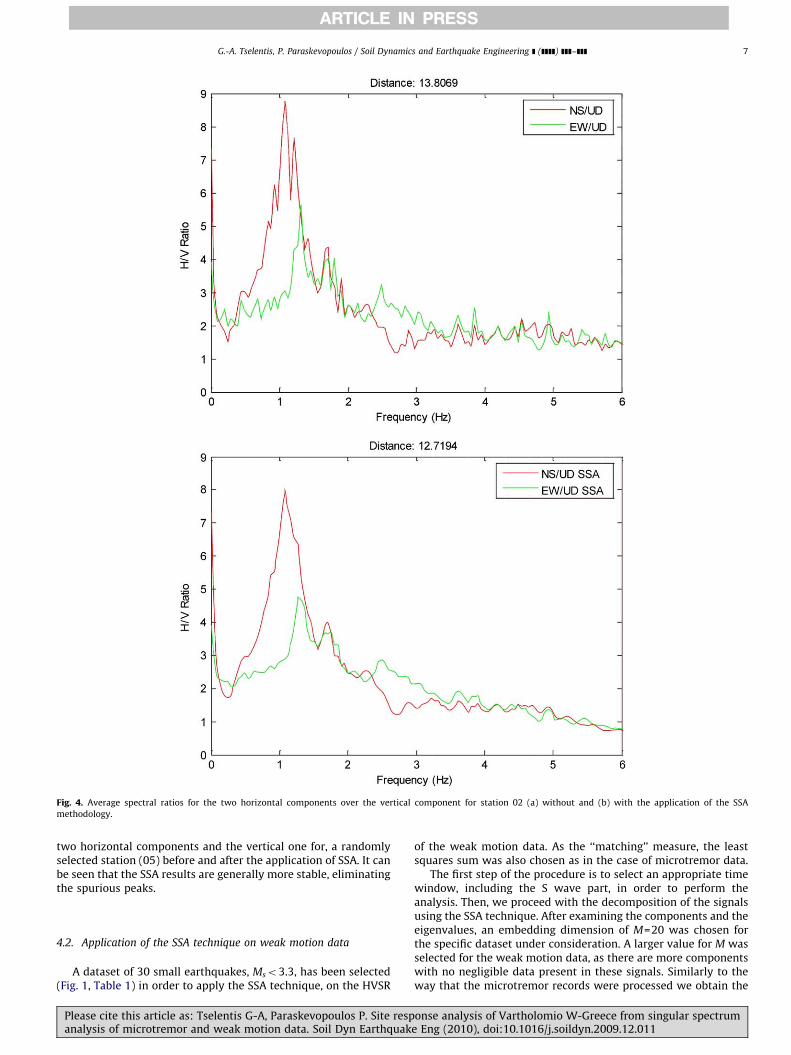
The average spectral ratios without and with the application ofthe SSA methodology for station 02, are shown in Fig. 4a and 4b,respectively.
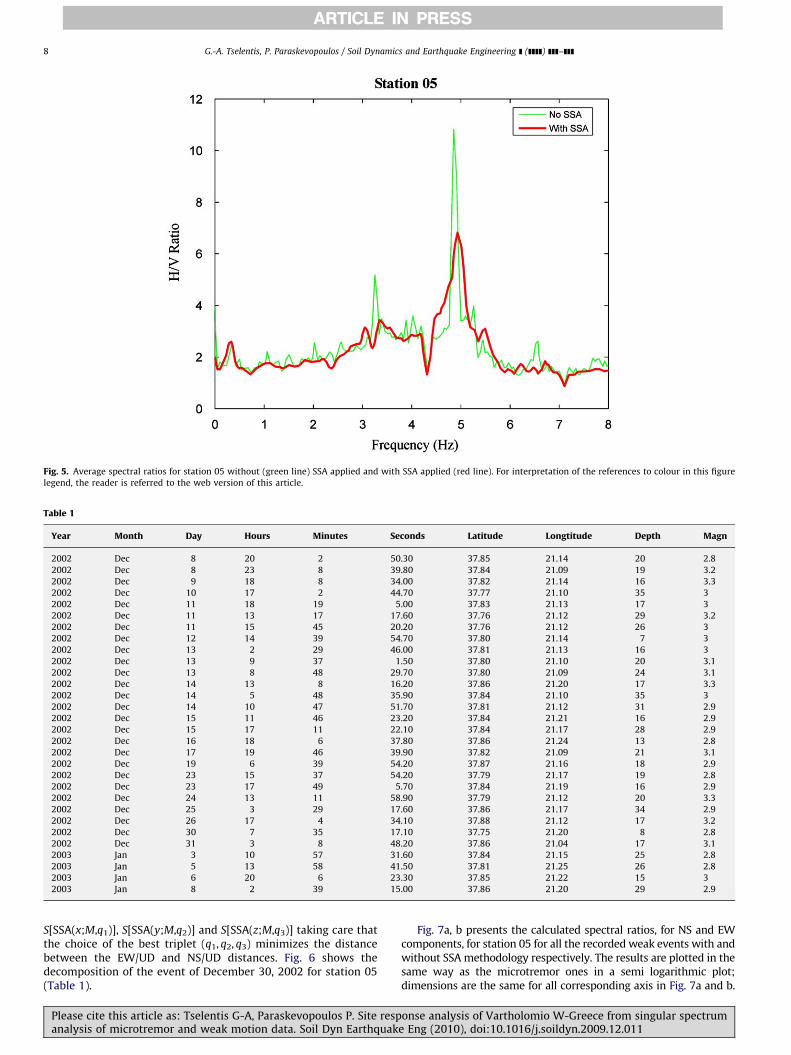
To further illustrate the effect of the SSA methodology, Fig. 5shows the comparison between the average HVSR results of the
onse analysis of Vartholomio W-Greece from singular spectrume Eng (2010), doi:10.1016/j.soildyn.2009.12.011
ARTICLE IN PRESS
Fig. 4. Average spectral ratios for the two horizontal components over the vertical component for station 02 (a) without and (b) with the application of the SSA
methodology.
G.-A. Tselentis, P. Paraskevopoulos / Soil Dynamics and Earthquake Engineering ] (]]]]) ]]]–]]] 7
two horizontal components and the vertical one for, a randomlyselected station (05) before and after the application of SSA. It canbe seen that the SSA results are generally more stable, eliminatingthe spurious peaks.
4.2. Application of the SSA technique on weak motion data
A dataset of 30 small earthquakes, Mso3.3, has been selected(Fig. 1, Table 1) in order to apply the SSA technique, on the HVSR
Please cite this article as: Tselentis G-A, Paraskevopoulos P. Site respanalysis of microtremor and weak motion data. Soil Dyn Earthquak
of the weak motion data. As the ‘‘matching’’ measure, the leastsquares sum was also chosen as in the case of microtremor data.
The first step of the procedure is to select an appropriate timewindow, including the S wave part, in order to perform theanalysis. Then, we proceed with the decomposition of the signalsusing the SSA technique. After examining the components and theeigenvalues, an embedding dimension of M=20 was chosen forthe specific dataset under consideration. A larger value for M wasselected for the weak motion data, as there are more componentswith no negligible data present in these signals. Similarly to theway that the microtremor records were processed we obtain the
onse analysis of Vartholomio W-Greece from singular spectrume Eng (2010), doi:10.1016/j.soildyn.2009.12.011
ARTICLE IN PRESS
Fig. 5. Average spectral ratios for station 05 without (green line) SSA applied and with SSA applied (red line). For interpretation of the references to colour in this figure
legend, the reader is referred to the web version of this article.
Table 1
Year Month Day Hours Minutes Seconds Latitude Longtitude Depth Magn
2002 Dec 8 20 2 50.30 37.85 21.14 20 2.8
2002 Dec 8 23 8 39.80 37.84 21.09 19 3.2
2002 Dec 9 18 8 34.00 37.82 21.14 16 3.3
2002 Dec 10 17 2 44.70 37.77 21.10 35 3
2002 Dec 11 18 19 5.00 37.83 21.13 17 3
2002 Dec 11 13 17 17.60 37.76 21.12 29 3.2
2002 Dec 11 15 45 20.20 37.76 21.12 26 3
2002 Dec 12 14 39 54.70 37.80 21.14 7 3
2002 Dec 13 2 29 46.00 37.81 21.13 16 3
2002 Dec 13 9 37 1.50 37.80 21.10 20 3.1
2002 Dec 13 8 48 29.70 37.80 21.09 24 3.1
2002 Dec 14 13 8 16.20 37.86 21.20 17 3.3
2002 Dec 14 5 48 35.90 37.84 21.10 35 3
2002 Dec 14 10 47 51.70 37.81 21.12 31 2.9
2002 Dec 15 11 46 23.20 37.84 21.21 16 2.9
2002 Dec 15 17 11 22.10 37.84 21.17 28 2.9
2002 Dec 16 18 6 37.80 37.86 21.24 13 2.8
2002 Dec 17 19 46 39.90 37.82 21.09 21 3.1
2002 Dec 19 6 39 54.20 37.87 21.16 18 2.9
2002 Dec 23 15 37 54.20 37.79 21.17 19 2.8
2002 Dec 23 17 49 5.70 37.84 21.19 16 2.9
2002 Dec 24 13 11 58.90 37.79 21.12 20 3.3
2002 Dec 25 3 29 17.60 37.86 21.17 34 2.9
2002 Dec 26 17 4 34.10 37.88 21.12 17 3.2
2002 Dec 30 7 35 17.10 37.75 21.20 8 2.8
2002 Dec 31 3 8 48.20 37.86 21.04 17 3.1
2003 Jan 3 10 57 31.60 37.84 21.15 25 2.8
2003 Jan 5 13 58 41.50 37.81 21.25 26 2.8
2003 Jan 6 20 6 23.30 37.85 21.22 15 3
2003 Jan 8 2 39 15.00 37.86 21.20 29 2.9
G.-A. Tselentis, P. Paraskevopoulos / Soil Dynamics and Earthquake Engineering ] (]]]]) ]]]–]]]8
S[SSA(x;M,q1)], S[SSA(y;M,q2)] and S[SSA(z;M,q3)] taking care thatthe choice of the best triplet (q1, q2, q3) minimizes the distancebetween the EW/UD and NS/UD distances. Fig. 6 shows thedecomposition of the event of December 30, 2002 for station 05(Table 1).
Please cite this article as: Tselentis G-A, Paraskevopoulos P. Site respanalysis of microtremor and weak motion data. Soil Dyn Earthquak
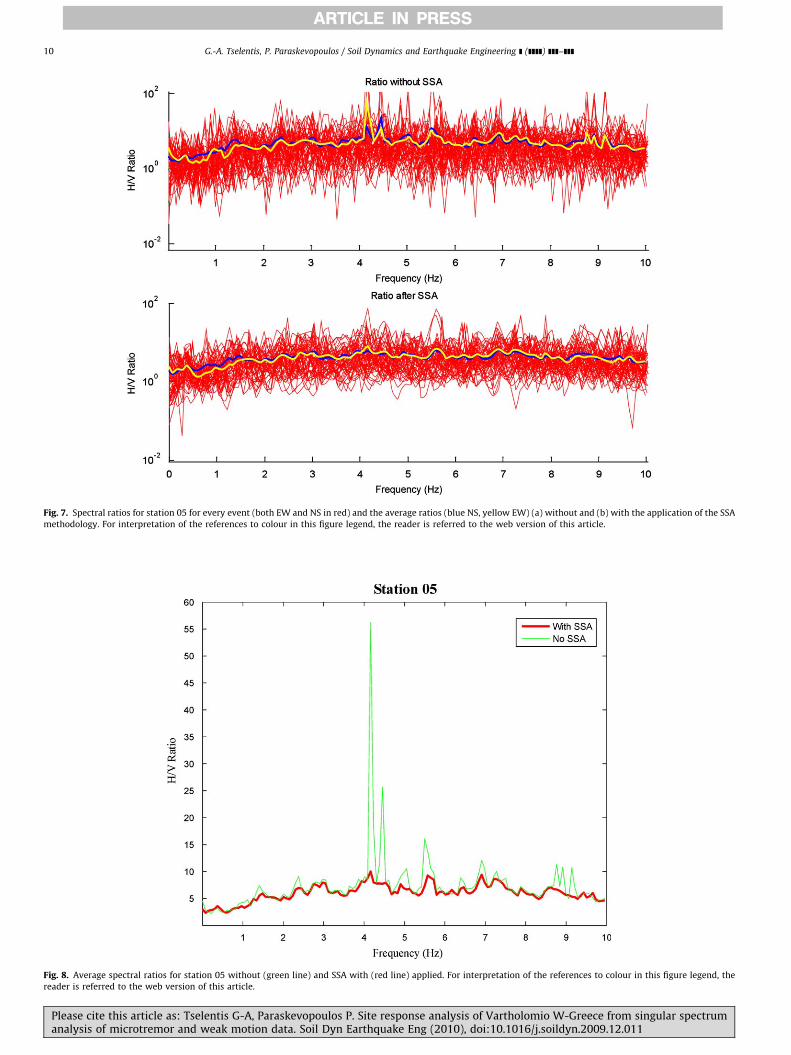
Fig. 7a, b presents the calculated spectral ratios, for NS and EWcomponents, for station 05 for all the recorded weak events with andwithout SSA methodology respectively. The results are plotted in thesame way as the microtremor ones in a semi logarithmic plot;dimensions are the same for all corresponding axis in Fig. 7a and b.
onse analysis of Vartholomio W-Greece from singular spectrume Eng (2010), doi:10.1016/j.soildyn.2009.12.011

ARTICLE IN PRESS
Fig. 6. SSA decomposition of the 3 components of the December 30, 2002 event as it was recorded in station 05 and its corresponding eigenvalues.
G.-A. Tselentis, P. Paraskevopoulos / Soil Dynamics and Earthquake Engineering ] (]]]]) ]]]–]]] 9
Although the SSA methodology does not eliminate some of theirregularly high peak values of the ratios it can reduce themsignificantly. This can be observed in Fig. 8 where the averageratios are compared, from both EW and NS components, for all theweak earthquakes selected without and with the application ofthe SSA methodology, for the previously selected station 05.
5. Results and discussion
The obtained results from all the stations (dominant frequen-cies and HVSRs) are combined in order to map the assessed localsite effects properties. The maps presented include only the partinside the city of Vartholomio because only in this part themajority of the recording stations are located at sufficiently closedistances.
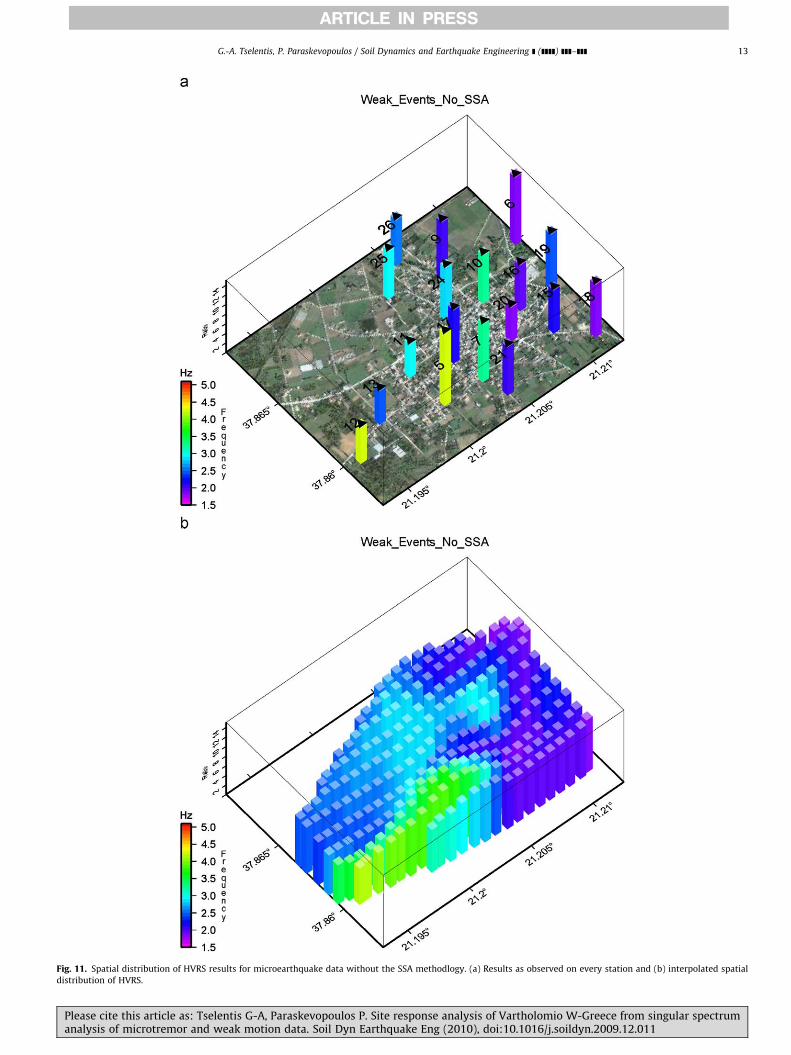
In Figs. 9–12, the microtremor and weak motion results areinterpolated in space and presented both without and with theapplication of the SSA methodology. Dominant frequency andcorresponding HVSRs are plotted on the same diagram for eachmethod. In these figures the dominant frequencies are colourcoded while the spectral ratios are represented by thecorresponding heights of the blocks. Figs. 9 and 10 present theresults using the microtremor data without and with SSA applied,respectively. In the same way Figs. 11 and 12 show the results
Please cite this article as: Tselentis G-A, Paraskevopoulos P. Site respanalysis of microtremor and weak motion data. Soil Dyn Earthquak
from the weak motion data. Comparing these data we canconclude that the results without and with application of SSA;look very similar. But when comparing the results of the twodatasets used (microtremors and weak events) the SSA resultspresent a decreased discrepancy between the two.
There are small differences between the two results but themain features seem to be the same. The highest frequencies arefound towards the southwestern part of the mapped area. Alsoboth datasets agree that the values of the dominant frequenciesbecome generally lower towards the eastern part. Fig. 13 a, bpresents the difference in the results from the weak events minusthe ones from microtremors, without (Fig. 13a) and after applyingthe SSA methodology (Fig. 13b). An improved convergence for theresults of the two datasets can be seen. Without the SSA applied,the difference of the results between the two dataset ranges from�1.6 up to 0.88 Hz for the dominant frequencies andapproximately 2.6 to 10.4 for the ratio. The differences in theSSA processed results remain unchanged for the frequencies butthe differences between the ratio values are approximatelybetween �1 and 4.
Most authors favor an explanation of the difference betweenweak motion and microtremor HVSRs based on the polarization ofRayleigh waves, which should be more abundant in microtremorsthan in earthquakes [14]. If the microtremors consist primarily ofsurface waves generated at the sediment—bedrock interface, then
onse analysis of Vartholomio W-Greece from singular spectrume Eng (2010), doi:10.1016/j.soildyn.2009.12.011
ARTICLE IN PRESS
Fig. 7. Spectral ratios for station 05 for every event (both EW and NS in red) and the average ratios (blue NS, yellow EW) (a) without and (b) with the application of the SSA
methodology. For interpretation of the references to colour in this figure legend, the reader is referred to the web version of this article.
Fig. 8. Average spectral ratios for station 05 without (green line) and SSA with (red line) applied. For interpretation of the references to colour in this figure legend, the
reader is referred to the web version of this article.
G.-A. Tselentis, P. Paraskevopoulos / Soil Dynamics and Earthquake Engineering ] (]]]]) ]]]–]]]10
Please cite this article as: Tselentis G-A, Paraskevopoulos P. Site response analysis of Vartholomio W-Greece from singular spectrumanalysis of microtremor and weak motion data. Soil Dyn Earthquake Eng (2010), doi:10.1016/j.soildyn.2009.12.011

ARTICLE IN PRESS
Fig. 9. Results for microtremor data. Without SSA method applied. (a) Results as observed on each station and (b) interpolated spatial distribution of HVRS. Colour code and
block heights correspond to predominant frequencies and spectral amplitude ratios, respectively. For interpretation of the references to colour in this figure legend, the
reader is referred to the web version of this article.
G.-A. Tselentis, P. Paraskevopoulos / Soil Dynamics and Earthquake Engineering ] (]]]]) ]]]–]]] 11
Please cite this article as: Tselentis G-A, Paraskevopoulos P. Site response analysis of Vartholomio W-Greece from singular spectrumanalysis of microtremor and weak motion data. Soil Dyn Earthquake Eng (2010), doi:10.1016/j.soildyn.2009.12.011

ARTICLE IN PRESS
Fig. 10. Spatial distribution of HVRS results for microtremor data, by employing the SSA methodology. (a) Results as observed on every station and (b) interpolated spatial
distribution of HVRS.
G.-A. Tselentis, P. Paraskevopoulos / Soil Dynamics and Earthquake Engineering ] (]]]]) ]]]–]]]12
Please cite this article as: Tselentis G-A, Paraskevopoulos P. Site response analysis of Vartholomio W-Greece from singular spectrumanalysis of microtremor and weak motion data. Soil Dyn Earthquake Eng (2010), doi:10.1016/j.soildyn.2009.12.011
ARTICLE IN PRESS
Fig. 11. Spatial distribution of HVRS results for microearthquake data without the SSA methodlogy. (a) Results as observed on every station and (b) interpolated spatial
distribution of HVRS.
G.-A. Tselentis, P. Paraskevopoulos / Soil Dynamics and Earthquake Engineering ] (]]]]) ]]]–]]] 13
Please cite this article as: Tselentis G-A, Paraskevopoulos P. Site response analysis of Vartholomio W-Greece from singular spectrumanalysis of microtremor and weak motion data. Soil Dyn Earthquake Eng (2010), doi:10.1016/j.soildyn.2009.12.011

ARTICLE IN PRESS
Fig. 12. Spatial distribution of HVRS results for microearthquake data with the SSA methodology. (a) Results as observed on every station and (b) interpolated spatial
distribution of HVRS.
G.-A. Tselentis, P. Paraskevopoulos / Soil Dynamics and Earthquake Engineering ] (]]]]) ]]]–]]]14
Please cite this article as: Tselentis G-A, Paraskevopoulos P. Site response analysis of Vartholomio W-Greece from singular spectrumanalysis of microtremor and weak motion data. Soil Dyn Earthquake Eng (2010), doi:10.1016/j.soildyn.2009.12.011

ARTICLE IN PRESS
Fig. 13. Spatial distribution of the difference weak events—microtremors (a) without SSA and (b) with SSA applied.
G.-A. Tselentis, P. Paraskevopoulos / Soil Dynamics and Earthquake Engineering ] (]]]]) ]]]–]]] 15
the dominant period of these waves may not, in general, beexpected to match precisely the fundamental period of theSH-wave resonance [19]. If the impedance contrast is strongenough to allow the surface waves to be trapped entirely withinthe sediment layer, then their dominant velocity and period willbe close to that of an SH resonance in that layer. If the impedancecontrast is weaker (as it was found from a seismic reflectionsurvey), then the velocity of surface waves may partially reflectthe higher shear wave velocity of the basement. In this case thedominant frequency of the microtremors is higher than that of thefundamental frequency of the shear wave resonance, somethingwhich can be seen in most parts of Fig. 13b.
The next step is to separate stations that present similarcharacteristics in their spectral ratios, performing a zonation ofthe study area. The method chosen was the automatic zonation
Please cite this article as: Tselentis G-A, Paraskevopoulos P. Site respanalysis of microtremor and weak motion data. Soil Dyn Earthquak
based on the similarity of spectral ratios proposed by [5,6]. Theaim of this method is to optimally partition the dataset ofmeasurements stations in a number of subsets whose points havemaximal similarity.
The part of the spectral ratios used in all the cases was thesame and ranged from 0 to 10 Hz. Assuming that the number ofconnected clusters (Nc) ranged from 2 up to 8 the geneticalgorithm was run for each one of these values using 200individuals per population; probability of crossover between 0.6and 0.8 and probability of mutation between 0.001 and 0.02. Eachrun was completed after 1000 generations. The Bayesianinformation criterion (BIC) parameter was computed for everypartition of measurement points.
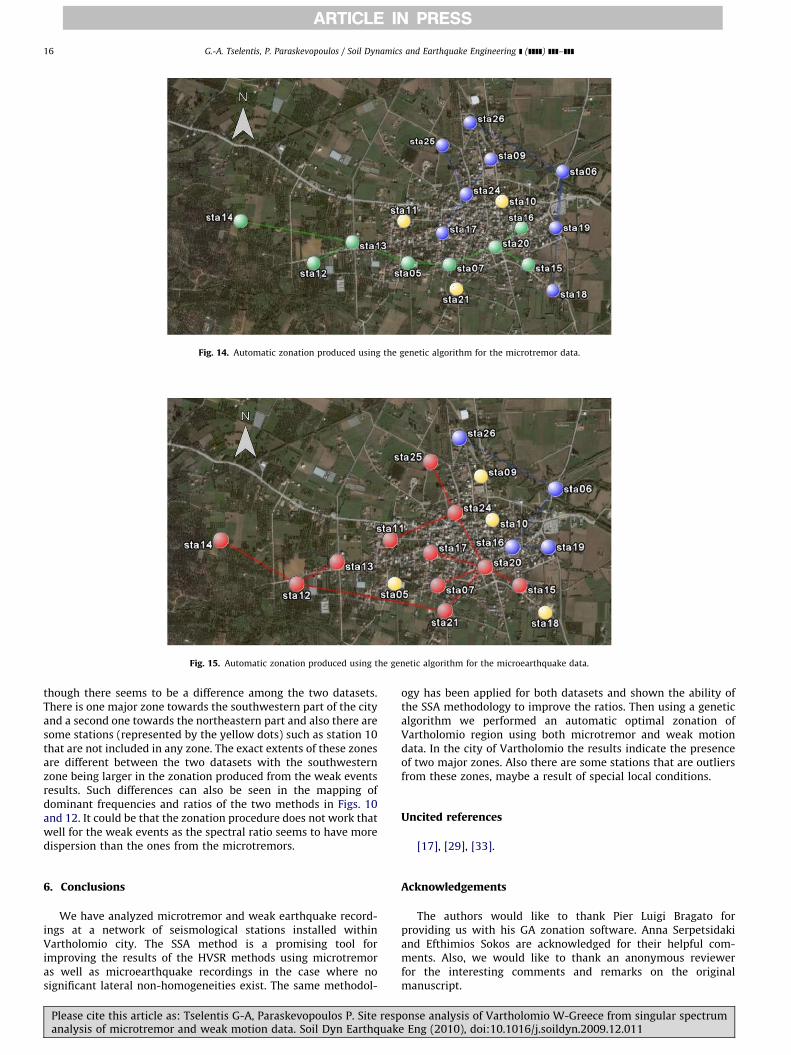
The results when plotted in Figs. 14 (microtremors) and 15(weak events) indicate the existence of 2 major zones even
onse analysis of Vartholomio W-Greece from singular spectrume Eng (2010), doi:10.1016/j.soildyn.2009.12.011
ARTICLE IN PRESS
Fig. 14. Automatic zonation produced using the genetic algorithm for the microtremor data.
Fig. 15. Automatic zonation produced using the genetic algorithm for the microearthquake data.
G.-A. Tselentis, P. Paraskevopoulos / Soil Dynamics and Earthquake Engineering ] (]]]]) ]]]–]]]16
though there seems to be a difference among the two datasets.There is one major zone towards the southwestern part of the cityand a second one towards the northeastern part and also there aresome stations (represented by the yellow dots) such as station 10that are not included in any zone. The exact extents of these zonesare different between the two datasets with the southwesternzone being larger in the zonation produced from the weak eventsresults. Such differences can also be seen in the mapping ofdominant frequencies and ratios of the two methods in Figs. 10and 12. It could be that the zonation procedure does not work thatwell for the weak events as the spectral ratio seems to have moredispersion than the ones from the microtremors.
6. Conclusions
We have analyzed microtremor and weak earthquake record-ings at a network of seismological stations installed withinVartholomio city. The SSA method is a promising tool forimproving the results of the HVSR methods using microtremoras well as microearthquake recordings in the case where nosignificant lateral non-homogeneities exist. The same methodol-
Please cite this article as: Tselentis G-A, Paraskevopoulos P. Site respanalysis of microtremor and weak motion data. Soil Dyn Earthquak
ogy has been applied for both datasets and shown the ability ofthe SSA methodology to improve the ratios. Then using a geneticalgorithm we performed an automatic optimal zonation ofVartholomio region using both microtremor and weak motiondata. In the city of Vartholomio the results indicate the presenceof two major zones. Also there are some stations that are outliersfrom these zones, maybe a result of special local conditions.
Uncited references
[17], [29], [33].
Acknowledgements
The authors would like to thank Pier Luigi Bragato forproviding us with his GA zonation software. Anna Serpetsidakiand Efthimios Sokos are acknowledged for their helpful com-ments. Also, we would like to thank an anonymous reviewerfor the interesting comments and remarks on the originalmanuscript.
onse analysis of Vartholomio W-Greece from singular spectrume Eng (2010), doi:10.1016/j.soildyn.2009.12.011

ARTICLE IN PRESS
G.-A. Tselentis, P. Paraskevopoulos / Soil Dynamics and Earthquake Engineering ] (]]]]) ]]]–]]] 17
References
[1] Barazza F, Malisan P, Carniel R. Improvement of H/V technique by rotation ofthe coordinate system. Commun Nonlinear Sci Numer Simul 2009;14(1):182–93.
[2] Bard P-Y. Microtremor measurements: a tool for site effect estimation? In :Proceedings of the second international symposium on the effects of surfacegeology on seismic motion, Yokohama, Japan, vol. 3; 1998. p. 1251–79.
[3] Bard P-Y. The SESAME-Team. Report D23.12, Guidelines for the implementa-tion of the H/V spectral ratio technique on ambient vibrations measure-ments, processing and interpretation in European Commission: ResearchGeneral Directorate, Project No. EVG1-CT-2000-00026, SESAME, (2005), 62pp. Available online at /http://sesame-fp5.obs.ujf-grenoble.frS (last accessedApril 2009).
[4] Bettig B, Bard PY, Scherbaum F, Riepl J, Cotton F, Cornou C, Hatzfeld D.Analysis of dense array noise measurements using the modified spatial auto-correlation method (SPAC): application to the Grenoble area,. Boll Geofis TeorAppl 2001;42(3–4):281–304.
[5] Bragato PL, Bressan G. Automatic seismic zonation based on stress-fielduniformity assessed from focal mechanisms. Bull Seismol Soc Am 2006;96:2050–2058.
[6] Bragato PL, Laurenzano G, Barnaba C. Automatic zonation of urban areasbased on the similarity of H/V spectral ratios. Bull Seismol Soc Am 2007;97:1404–12.
[7] Broomhead DS, King GP. Extracting qualitative dynamics from experimentaldata. Physica D 1986;20:217–36.
[8] Cara F, Cultera G, Azzara RM, De Rubeis V, Di Giulio G, Giammarinaro MS,et al. Microtremor measurements in the city of Palermo, Italy: analysis of thecorrelation with local geology and damage. Bull Seismol Soc Am2008;98(3):1354–72.
[9] Carniel R, Barazza F, Pascolo P. Improvement of Nakamura technique bysingular spectrum analysis. Soil Dyn Earthquake Eng 2006;26:55–63.
[10] Di Giulio G, Azzara RM, Cultrera G, Giammarinaro MS, Vallone P, Rovelli A.Effect of local geology on ground motion in the city of Palermo, Italy, asinferred from aftershocks of the September 9, 2002, Mw, 5.9. Bull Seismol SocAm 2005;95(6):2328–41.
[11] Duval AM, Vidal S, Meneroud J-P, Singer A, De Santis F, Ramos C, et al. Cracas,Venezuela, site effects determination with microtremors. Pure Appl Geophys2001;158:2513–23.
[12] Elsner AA, Tsonis AA. Singular spectrum analysis: a new tool in time seriesanalysis. New York: Plenum Press; 1996.
[13] Fah D. Microzonation of the city of Basel. J Seismol 1997;1(1):87–102.[14] Field EH, Jacob KH. A comparison and test of various site-response estimation
techniques, including three that are not reference-site dependent. BullSeismol Soc Am 1995;85:1127–43.
[15] Gitterman Y, Zaslavsky Y, Shapira A, Shtivelman V. Empirical siteresponseevaluations: case studies in Israel. Soil Dyn Earthq Eng 1996;15:447–63.
[16] Golyandina N, Osipov E. The ‘‘Caterpillar’’-SSA method for analysis of timeseries with missing values. J Stat Plann Infer 2007;137(8):2642–53.
[17] Hough SE, Seeber L, Rovelli A, Malagnini L, DeCesare A, Selvaggi G, Lerner-Lam A. Ambient noise and weak motion excitation of sediment resonances:results from the Tiber Valley, Italy. Bull Seismol Soc Am 1992;82:1186–205.
[18] Lachet C, Hatzfeld D, Bard P-Y, Theodulidis N, Papaioannou C, Savvaidis A. Siteeffects and microzonation in the city of Thessaloniki (Greece): comparison ofdifferent approaches. Bull Seismol Soc Am 1996;86:1692–703.
Please cite this article as: Tselentis G-A, Paraskevopoulos P. Site respanalysis of microtremor and weak motion data. Soil Dyn Earthquak
[19] Langston CA. Structure under Mount Rainier, Washington, inferred fromteleseismic body waves. J Geophys Res 1979;84:4749–62.
[20] Lebrun B, Hatzfeld D, Bard P-Y. A site effect study in urban area: experimentalresults in Grenoble (France). Pure Appl Geophys 2001;158:2543–57.
[21] Le Pichon X, Chamot-Rooke N, Lallemant S, Noomen R, Veis G. Geodeticdetermination of the Kinematics of Central Greece with respect to Europe.J Geophys Res 1995;100(B7):12675–90.
[22] Lekkas E, Papanikolaou D, Fountoulis I. Neotectonic map of Greece. SheetsPyrgos and Tropea. University of Atherns; 1992 Comment: 120 pp.
[23] Mucciarelli M, Gallipoli MR, Arcieri M. The stability of the horizontal-to-vertical spectral ratio of triggered noise and earthquake recordings. BullSeismol Soc Am 2003;93(3):1407–12.
[24] Nakamura Y. A method for dynamic characteristics estimations of subsurfaceusing microtremors on the ground surface. Q Rep RTRI Jpn 1989;30:25–33.
[25] Nakamura Y. Real-time information systems for hazards mitigation. In:Proceedings of the 11th world conference on earthquake engineering,Acapulco, Mexico; 1996.
[26] Nakamura Y. Clear identification of fundamental idea of Nakamura’stechnique and its applications. In: Proceedings of the 12th world conferenceon earthquake engineering, Auckland, New Zealand; 2000.
[27] Nogoshi M, Igarashi T. On the amplitude characteristics of microtremor (part2). J Seismol Soc Jpn 1971;24:26–40. (in Japanese with English abstract).
[28] Palus M, Novotna D. Detecting modes with nontrivial dynamics embedded incolored noise: enhanced Monte Carlo SSA and the case of climate oscillations.Phys Lett A 1998;248(2-4):191–202.
[29] Panou A, Theodulidis N, Hadzidimitriou P, Savvaidis A, Papazachos C.Reliability of ambient noise horizontal to vertical spectral ratio in urbanenvironments: The case of Thessaloniki city (Northern Greece). Pure ApplGeophys 2005;162(5):891–912.
[30] Reinoso E, Ordaz M. Spectral ratios for Mexico City from free-field recordings.Earthquake Spectra 1999;15:273.
[31] Riepl J, Bard P-Y, Hatzfeld D, Papaioannou C, Nechtschein S. Detailedevaluation of site response estimation methods across and along the sedi-mentary valley of Volvi (EURO-SEISTEST). Bull Seismol Soc Am 1998;88(2):488–502.
[32] Seekins L, Wenneberg L, Margheriti L, Liu H-P. Site amplification at fivelocations in San Fransisco, California: a comparison of S waves, codas, andmicrotremors. Bull Seismol Soc Am 1996;86(3):627–35.
[33] Teves-Costa P, Almeida IM, Silva PL. Microzonation of Lisbon: 1D theoreticalapproach. Pure Appl Geophys 2001;158:2579–96.
[34] Theodulidis N, Bard P-Y, Archuleta RJ, Bouchon M. Horizontal to verticalspectral ratio and geological conditions: the case of Garner Valley downholearray in Southern California. Bull Seismol Soc Am 1996;86:306–19.
[35] Tselentis GA, Vasiliou I, Lekkas E, Roubos D, Sokos E. Site specific designstrong motions at the city of Vartholomio—Greece. In: Proceedings of thethird conference of geotechnical engineering, Patras, vol I, 1998. p. 567–74.
[36] Udwadia FE, Trifunac MD. Comparison of earthquake and microtremorground motions in El Centro, California. Bull Seismol Soc Am 1973;63:1227–53.
[37] Vautard P, Yiou P, Ghil M. Singular spectrum analysis: a toolkit for short,noisy chaotic signals. Physica D 1992;58:95–126.
[38] Yamazaki F, Ansary MA. Horizontal-to-vertical spectrum ratio of earthquakeground motion for site characterization. Earthquake Eng Struct Dyn 1997;26:671–689.
[39] Zare M, Bard P-Y, Ghafory-Ashtiany M. Site categorization for the Iranianstrong motion network. Soil Dyn Earthquake Eng 1999;18:101–23.
onse analysis of Vartholomio W-Greece from singular spectrume Eng (2010), doi:10.1016/j.soildyn.2009.12.011