SIRVs: Spike-In RNA Variants as External Isoform Controls in RNA ...
33
Spike-In RNA variant controls for RNA-Sequencing bioRxiv upload 2016-10-13 1 SIRVs: Spike-In RNA Variants as External Isoform Controls in RNA-Sequencing Lukas Paul, Petra Kubala, Gudrun Horner, Michael Ante, Igor Holländer, Alexander Seitz and Torsten Reda Lexogen GmbH, Campus Vienna Biocenter 5, 1030 Vienna, Austria Correspondence should be addressed to T.R. (email: [email protected]). Running title: Spike-In RNA Variants Key words: synthetic RNA, in-vitro transcripts, IVT, RNA standards, external RNA controls, RNA spike-in mix, RNA sequencing, RNA-Seq, gene expression, sequencing quality control, isoform, transcript variant, poly(A) site not peer-reviewed) is the author/funder. All rights reserved. No reuse allowed without permission. The copyright holder for this preprint (which was . http://dx.doi.org/10.1101/080747 doi: bioRxiv preprint first posted online Oct. 13, 2016;
Transcript of SIRVs: Spike-In RNA Variants as External Isoform Controls in RNA ...
Spike-In RNA variant controls for RNA-Sequencing bioRxiv upload 2016-10-13
1
SIRVs Spike-In RNA Variants as External Isoform Controls in RNA-Sequencing
Lukas Paul Petra Kubala Gudrun Horner Michael Ante Igor Hollaumlnder Alexander Seitz and Torsten
Reda
Lexogen GmbH Campus Vienna Biocenter 5 1030 Vienna Austria
Correspondence should be addressed to TR (email torstenredalexogencom)
Running title Spike-In RNA Variants
Key words synthetic RNA in-vitro transcripts IVT RNA standards external RNA controls RNA
spike-in mix RNA sequencing RNA-Seq gene expression sequencing quality control
isoform transcript variant poly(A) site
not peer-reviewed) is the authorfunder All rights reserved No reuse allowed without permission The copyright holder for this preprint (which was httpdxdoiorg101101080747doi bioRxiv preprint first posted online Oct 13 2016
Spike-In RNA variant controls for RNA-Sequencing bioRxiv upload 2016-10-13
2
ABSTRACT
Spike-In RNA variants (SIRVs) enable for the first time the validation of RNA sequencing workflows
using external isoform transcript controls 69 transcripts derived from seven human model genes
cover the eukaryotic transcriptome complexity of start- and end-site variations alternative
splicing overlapping genes and antisense transcription in a condensed format Reference RNA
samples were spiked with SIRV mixes sequenced and exemplarily four data evaluation pipelines
were challenged to account for biases introduced by the RNA-Seq workflow The deviations of the
respective isoform quantifications from the known inputs allow to determine the comparability of
sequencing experiments and to extrapolate to which degree alterations in an RNA-Seq workflow
affect gene expression measurements The SIRVs as external isoform controls are an important
gauge for inter-experimental comparability and a modular spike-in contribution to clear the way
for diagnostic RNA-Seq applications
[Supplemental material is available for this article]
INTRODUCTION
RNA sequencing workflows comprise of RNA purification library generation the sequencing itself
and the evaluation of the sequenced fragments (Wang et al 2009) The first steps impose numerous
whether or not intended biases towards RNA classes and sequence characteristics which data
processing algorithms try to compensate for afterwards (Li et al 2010 van Dijk et al 2014 Zheng et
al 2011) Here key tasks are the concordant assignment of fragments to the transcript variants and
the subsequent deduction of the corresponding abundance values As long as the quality of all
individual processing steps cannot be unequivocally determined subsequent comparisons of
experimental data in particular but not exclusively between different data sets remain ambiguous
The proliferation of different RNA-Seq platforms and protocols has created the need for multi-
not peer-reviewed) is the authorfunder All rights reserved No reuse allowed without permission The copyright holder for this preprint (which was httpdxdoiorg101101080747doi bioRxiv preprint first posted online Oct 13 2016
Spike-In RNA variant controls for RNA-Sequencing bioRxiv upload 2016-10-13
3
functional spiked-in controls which are processed alongside real samples to enable the monitoring
and comparing of key performance parameters like the ability to correctly distinguish and quantify
transcript variants (Fed Reg Doc 2015-19742)
At present comparisons are carried out only in exemplary inter-laboratory studies on
reference RNA samples which investigate different RNA treatments NGS platforms and data
evaluation algorithms (SEQCMAQC-III Consortium 2014 Li et al 2014) For these studies reference
RNA samples were created from Universal Human Reference RNA (UHRR from Agilent) and Human
Brain Reference RNA (HBRR from Ambion Thermo Fisher) which contain a stable but largely
unknown transcript variant diversity In addition the reference samples contained also a set of 92 in-
vitro transcripts IVTs as spike-in controls which were developed by the External RNA Controls
Consortium (Baker et al 2005) These control transcripts ERCCs (Ambion Thermo Fisher) allow to
asses dynamic range dose response lower limit of detection and fold-change response of RNA
sequencing pipelines within the limitation of the mono-exonic single-isoform RNA sequences (Jiang
et al 2011) Because the ERCCs contain no transcript variants one of the main challenges of
sequencing complex transcriptomes - to identify and distinguish splice variants - could not be
evaluated until now
Here we describe the sequence design and preparation of a comprehensive and novel set of
Spike-In Transcript Variants SIRVs and show in first examples how mixes thereof can be used to
validate isoform-specific RNA sequencing workflows Further we demonstrate how to utilize SIRVs
for comparing experiments by extrapolating the results from the well-defined ground truth of a small
fraction of control reads to the sample reads Although the focus of the first SIRV module is clearly on
the resolution of transcript variants the aim is to build a modular system of IVT controls which retain
in the most condensed manner all relevant aspects of the transcriptome complexity to establish a
continuous referencing method for RNA sequencing experiments Then those controls will provide
the base for lasting comparisons of the wealth of RNA-Seq data especially in the face of the rapid
development of sequencing technologies
not peer-reviewed) is the authorfunder All rights reserved No reuse allowed without permission The copyright holder for this preprint (which was httpdxdoiorg101101080747doi bioRxiv preprint first posted online Oct 13 2016
Spike-In RNA variant controls for RNA-Sequencing bioRxiv upload 2016-10-13
4
RESULTS
SIRVS DESIGN The SIRVs were modelled on 7 human genes whose annotated transcripts
were extended by exemplary isoforms to yield between 6 and 18 transcript variants for each gene
and 69 transcripts in total (general design overview in Suppl Fig S1) They comprehensively address
start- and end-site variations alternative splicing overlapping genes and antisense transcription Fig
1A illustrates how the human gene KLK5 served as a blue print for the design of the gene SIRV1 with
its 8 transcript variants (gene structures of SIRV2 to SIRV7 are shown in the odd-numbered suppl
Figures from S5 to S15) The SIRV genes model in a condensed and redundant manner all currently
known transcription and alternative splicing variations (summary in Fig 1B) The transcripts range in
length from 191 to 2528 nt (119909 1134 nt 813 nt) and contain an additional 30 nt long poly(A)-tail
The GC-content varies between 295 and 512 ( 430 436 ) The exon sequences were
created from a pool of database-derived genomes and modified by inverting the sequence to lose
identity while maintaining a naturally occurring order in the sequences The splice junctions conform
to 969 to the canonical GT-AG exon-intron junction rule with few exceptions harboring the less
frequently occurring variations GC-AG (17 ) and AT-AC (06 ) Two non-canonical splice sites CT-
AG and CT-AC account for 04 each The exon sequences were blasted against the entire NCBI
database on the nucleotide and on the protein level and mapped using in silico generated reads
Because no significant matches were found off-target mapping is de facto absent Therefore the
artificial SIRV sequences are suitable for non-interfering qualitative and quantitative assessments in
known genomic systems and they are complementary to the ERCC sequences
not peer-reviewed) is the authorfunder All rights reserved No reuse allowed without permission The copyright holder for this preprint (which was httpdxdoiorg101101080747doi bioRxiv preprint first posted online Oct 13 2016
Spike-In RNA variant controls for RNA-Sequencing bioRxiv upload 2016-10-13
5
Figure 1 ǀ Deriving SIRV1 from model gene KLK5 and classification of implemented transcript
isoform features
A) Schematic view of the human Kallikrein-related peptidase 5 gene (KLK5) Ensembl annotation
(GRCh38p2) which served as model for SIRV1 The condensed exon-intron structure and the
annotated transcript isoforms are shown in the upper grey section SIRV1 comprises 8 transcript
variants shown in blue The transcript orientations are indicated by arrows just upstream of the
not peer-reviewed) is the authorfunder All rights reserved No reuse allowed without permission The copyright holder for this preprint (which was httpdxdoiorg101101080747doi bioRxiv preprint first posted online Oct 13 2016
Spike-In RNA variant controls for RNA-Sequencing bioRxiv upload 2016-10-13
6
poly(A)-tails highlighted in red B) The occurrences of the different transcription and splicing events
are counted for each transcript in reference to a hypothetical master transcript which contains all
exon sequences from all transcript variants of a given gene (outlined next to ldquoSIRV 1rdquo in A)) Therefore
no intron retention can occur and exon splitting has been defined to be understood as introduction of
an intron sequence
PRODUCTION OF SIRV MIXES The SIRVs were produced by in vitro transcription (IVT) from
linearized plasmids yielding SIRV RNAs of high purity but varying integrity Since the SIRV transcripts
represent isoforms with overlapping sequences break-down products of SIRV RNAs can potentially
affect the detection and quantification of other isoforms Therefore a set of tailored purification
procedures was applied to obtain full-length RNAs with a minimal amount of side products despite
the broad sequence and length variation of the SIRVs (Fig 2A) By capillary electrophoresis
(Bioanalyzer Agilent) the purified SIRV RNAs were assessed to be at least to 9031plusmn372 of correct
length Each SIRV transcript entered the final mixes via one of eight PreMixes allowing for the unique
identification of each SIRV by capillary electrophoresis (Fig 2B) The PreMixes were merged pairwise
in equal amounts to yield four SubMixes which were then combined in defined volumetric ratios to
create the final mixes The experimentally determined cumulative pipetting error for individual SIRVs
is smaller than plusmn8 while the applied SubMix scheme limits the maximum error for differential gene
expression experiments to only plusmn4 Bioanalyzer traces were used to monitor the relative
propagation of the SIRVs in Pre- and SubMixes during the staged mixing (Fig 2B) The mix E0
maintains equimolar SIRV concentration ratios E1 contains a maximum concentration difference of
8-fold (close to one order of magnitude) and E2 comprises a concentration difference of up to 128-
fold The inter-mix concentration ratios range from 164- to 16-fold (Fig 2C)
not peer-reviewed) is the authorfunder All rights reserved No reuse allowed without permission The copyright holder for this preprint (which was httpdxdoiorg101101080747doi bioRxiv preprint first posted online Oct 13 2016
Spike-In RNA variant controls for RNA-Sequencing bioRxiv upload 2016-10-13
7
Figure 2 ǀ SIRV RNA integrity and mixing scheme
A) Examples of high SIRV integrity T7 transcription of SIRV612 yielded RNA of almost uniform correct
length with 4924 in the pre- main- and post-peak fractions as analyzed by Bioanalyzer RNA
6000 Pico Chip (Agilent) capillary electrophoresis The lower integrity of SIRV101 and SIRV203 after T7
transcription (blue traces) was increased using tailored purification protocols PP1 and PP2 (red
traces) Finally the integrity of all SIRVs was ge85 wt with on average 903plusmn37 wt in the main peak
fraction B) 8 PreMixes received in equimolar entities between 6 and 11 SIRVs which varied in length
to be unambiguously traced in Bioanalyzer runs PreMixes were combined pairwise in equal ratios to
yield SubMixes The resulting 4 SubMixes were combined in defined ratios to obtain the final Mixes
not peer-reviewed) is the authorfunder All rights reserved No reuse allowed without permission The copyright holder for this preprint (which was httpdxdoiorg101101080747doi bioRxiv preprint first posted online Oct 13 2016
Spike-In RNA variant controls for RNA-Sequencing bioRxiv upload 2016-10-13
8
E0 E1 and E2 Measured traces are shown in red and traces computed from the PreMix traces to
validate the composition of the SubMixes and final Mixes are shown in blue A color code for the
SubMixes is introduced to follow groupings of SIRVs throughout the subsequent data analysis C)
Graphical representation of the relative SIRV concentrations and concentration ratios according their
SubMix belonging The total molarity and weight of the final mixes are evenly balanced at 697
fmolmicrol and 253 ngmicrol
Three different samples with SIRVs RC-0 RC-1 and RC-2 (for details see methods section) were
prepared NGS libraries generated and sequenced in paired-end 125 bp mode
NGS DATA EVALUATION All demultiplexed NGS reads were mapped to the human
genome (GRCh38p2) the ERCC sequences and the SIRVome by using the common splice-aware
aligners STAR (Dobin et al 2012) TopHat2 (Kim et al 2013) while Bowtie2 (Langmead and Salzberg
2012) was used to map reads to a set of accordingly generated transcript sequences Bowtie2 aligned
reads were further processed by RSEM (Li and Dewey 2011) a combination referred to below as data
evaluation pipeline P1 Salmon is an autarkic program algorithm (Patro et al 2015) referred to as P2
STAR as well as TopHat2 aligned reads were further processed by Cufflinks2 (Trapnell et al 2012)
and resemble the evaluation pipelines P3 and P4
ESTIMATION OF THE MRNA CONTENTS On the basis of the assumption that the RNAs in the
samples and the spike-in controls are equally targeted by the library preparation due to similar
length distributions (SIRV 1129plusmn15 nt ERCC 880plusmn26 nt and based on the P4 results UHRR 1538 nt
and HBRR 1641 nt) the relative mass partition between controls and endogenous RNA can be
determined The propagation of the input amounts to the output read ratio depends on the mRNA
content and the relative recovery efficiencies of controls and mRNA after the library preparation
Therefore one reference value needs to be defined or externally determined which we chose to be
not peer-reviewed) is the authorfunder All rights reserved No reuse allowed without permission The copyright holder for this preprint (which was httpdxdoiorg101101080747doi bioRxiv preprint first posted online Oct 13 2016
Spike-In RNA variant controls for RNA-Sequencing bioRxiv upload 2016-10-13
9
an mRNA content of 3 in UHRR (Shippy et al 2006) We further set the efficiency of the
endogenous mRNA proceeding through this particular library preparation to 100 The SIRVs can
then be calculated to progress with a relative efficiency of 870plusmn6 allowing to determine the
mRNA content in the second sample HBRR to be 172 The mRNA content in the mixed samples
RC-2 is then assessed to be 234 which corresponds to a minor -91 offset relative to the
theoretical outcome based on the RC-0 and RC-1 measurements In the TruSeq library preparation
the 30 nt long poly(A)-tail of the SIRVs ensures an enrichment similar to the endogenous mRNAs The
ERCC controls show a lower recovery efficiency of 416plusmn47 most likely due to their shorter poly(A)-
tails which vary between 19 and 25 adenines ( 23 nt) The results are summarized in suppl Tab S1
COMPARISON BETWEEN EXPECTED AND MEASURED COVERAGE AND CONCENTRATION MEASURES For the first
time the ground truth of complex input sequences is available allowing detailed target-performance
comparisons for read alignment relative abundance calculation and differential expression
determination Fig 3 shows for one example gene SIRV 3 in E0 the expected coverages and counts
of the telling junctions together with the coverages obtained by STAR and TopHat2 mapping NGS
workflow-specific read start-site distributions lead to coverage patterns with inherent terminal
deficiencies for which the expected coverage has been adjusted accordingly However in the
measured coverages these systematic start- and end-site biases are accompanied by a variety of
biases which introduce severe local deviations from the expected coverage
not peer-reviewed) is the authorfunder All rights reserved No reuse allowed without permission The copyright holder for this preprint (which was httpdxdoiorg101101080747doi bioRxiv preprint first posted online Oct 13 2016
Spike-In RNA variant controls for RNA-Sequencing bioRxiv upload 2016-10-13
10
Figure 3 ǀ Comparison of the expected and the measured coverages for the SIRV3 locus in mix E0
A) Individual transcripts of SIRV3 with transcripts on the plus strand in blue and in red for the ones on
the minus strand Color code indicates the SubMix allocation B) The expected SIRV3 coverage is
shown as superposition of individual transcript coverages in which the terminal sites have been
modelled by a transient error function The measured coverages after read mapping by TopHat2 are
shown in grey The measured coverages and number of splice junction reads were normalized to
obtained identical areas under the curves and identical sums of all junctions for the expected and
measured data The measured splice junction reads are shown by the numbers before the brackets
not peer-reviewed) is the authorfunder All rights reserved No reuse allowed without permission The copyright holder for this preprint (which was httpdxdoiorg101101080747doi bioRxiv preprint first posted online Oct 13 2016
Spike-In RNA variant controls for RNA-Sequencing bioRxiv upload 2016-10-13
11
while the expected values are shown inside the brackets The CoD values are given for the plus and
minus strand in the respective colors C) Differences between mapping by STAR aligner and TopHat2
The black arrows indicate the direction of positive differences Percentages refer to the relative
changes of the measured splice junction reads
To obtain a comparative measure gene-specific coefficients of deviation CoD were calculated CoDs
describe the often hidden biases in the sequence data predominantly caused by an inhomogeneous
library preparation but also by the subsequent sequencing and mapping In the presented example
the stranded TruSeq library preparation with the Illumina HiSeq2500 sequencing and mapping by
TopHat2 results in a mean CoD of 0190plusmn0193 across all SIRVs For the sense oriented SIRVs the
mean CoD is 0275plusmn0223 and for the antisense SIRVs which cover a region of fewer overlapping
transcript annotations the mean CoD is 0090plusmn0076 The coverage target-performance comparison
highlights the inherent difficulties in deconvoluting read distributions to correctly identify transcript
variants and determine concentrations The distribution of telling reads splice junctions and reads
towards the termini are references for the assignment of the remaining reads before calculating
relative transcript variant abundances Not surprisingly although the majority of junction counts
correlates well with the expected values the high CoD values indicate that numerous telling reads
deviate significantly within the context of the individual mixes They also differ between mixes which
affects differential expression measurements (see Fig 3B and for the coverage of all seven SIRV
genes the even suppl Fig from S4 to S16)
The CoD does not allow to distinguish between periodicity and randomness in the biases nor
does it forecast how well a data evaluation strategy can cope with the bias contributions
Nevertheless smaller CoD values are expected to correlate with a simpler and less error-prone data
evaluation The CoD values can be taken as a first indicative measure to characterize the mapped
data and to compare data sets for similarity up to this point in the workflow Target-performance
comparisons of all SIRV genes in all three mixes can be found in the supplemental information
not peer-reviewed) is the authorfunder All rights reserved No reuse allowed without permission The copyright holder for this preprint (which was httpdxdoiorg101101080747doi bioRxiv preprint first posted online Oct 13 2016
Spike-In RNA variant controls for RNA-Sequencing bioRxiv upload 2016-10-13
12
The above described four data analysis pipelines P1 to P4 were used to calculate transcript
abundances for 69 SIRV and 196˙165 annotated endogenous transcripts All obtained results are
relative concentration measures yielding either Fragments Per Kilobase of exon per Million
fragments mapped (FPKM) (Mortazavi 2008) or Transcripts Per Million (TPM) (Li and Dewey 2011)
The concentrations were scaled by linear transformation in such way that all SIRVs together reach 69
in E0 685 in E1 and 708 in E2 which is the dimensionless value identical to the fmolmicrol in the
respective SIRV stock solutions In consequence the relative quantities of the SIRVs are compatible
to the normalized scale which was introduced in Fig 2C Boxplots in Fig 4 show exemplarily the SIRV
concentrations and two discrete differentials as measured by P3 (results from P1 P2 and P4 are
shown in suppl Fig S17 and standard correlation plots of the four pipelines are shown in suppl Fig
S18) The majority of all SubMix mean concentration values are in concordance with the expected
values The concentration ratios simulating differential expression measurements are less prone to
systematic offsets and show by trend narrower distributions However these correlations highlight
already the issue of obvious and frequent outliers ie transcript variants that are not well resolved
not peer-reviewed) is the authorfunder All rights reserved No reuse allowed without permission The copyright holder for this preprint (which was httpdxdoiorg101101080747doi bioRxiv preprint first posted online Oct 13 2016
Spike-In RNA variant controls for RNA-Sequencing bioRxiv upload 2016-10-13
13
Figure 4 ǀ Box plot overview of calculated concentration values for SIRV mixes and mix ratios
Reads from SIRV mixes E0 E1 and E2 were processed by four different data evaluation algorithms for
transcript quantification Results derived by pipeline P3 are exemplarily shown in reference to the
known inputs (bars in colors corresponding to the SIRV SubMixes of Fig 2) The black circles mark the
mean and the bold dashes the medians of the data points which are shown in grey the boxes span
the 25 to 75 region of the data points and the black whiskers with connecting lines reach up to the
min and max values and indicate also outliers outside the scale of the graph The comparison E1 vs
E0 from sample RC-1 and RC-0 (2nd row) was used for building the histogram of Fig 5B The shaded
area resembles the 1st bin (0leǀLFCǀle1) while the inner section (b1) comprises the fraction 0leǀLFCǀlt05
where the majority of data points originates from SubMix4 (ratio 11) and some ldquooutliersrdquo from
SubMix2 which were actually spiked in at the ratio 21
Heat maps allow to inspect each SIRV in the context of competing transcripts Tab 1B shows
the abundancies as log2-fold changes LFC relative to the expected values for the example of SIRV 6
LFC values consider relative increases and decreases across all concentration ranges likewise An LFC
window of plusmn011 presents the confidence interval as a result from the currently achievable accuracy
not peer-reviewed) is the authorfunder All rights reserved No reuse allowed without permission The copyright holder for this preprint (which was httpdxdoiorg101101080747doi bioRxiv preprint first posted online Oct 13 2016
Spike-In RNA variant controls for RNA-Sequencing bioRxiv upload 2016-10-13
14
in producing the SIRV mixtures We examine the LFC values uncoupled from the adjusted p-values
which provide a statistical measure of the significance level for apparent differential expression By
these means we prevent pipelines to appear more coherent only due to higher noise levels The
accuracy has been calculated for each SIRV as the mean of the LFCs in all three mixes The precision is
a measure of how consistent SIRVs are quantified and has been calculated as the LFC standard
deviation for each SIRV and further for entire pipelines by using all SIRVs Within the presented
example SIRVs can obtain in all four pipelines high precisions of up to 018plusmn007 and high accuracies
of up to -001plusmn010 (SIRV604) In contrast SIRV612 of similar length has an average precision of
569plusmn368 and an accuracy of -386plusmn270 although it was detected by P2 with a high precision of 012
at an accuracy of 018 This quantification of differences between pipelines now directly permits to
assess the effect of changes in workflows and individual experiments
COMPARISON BETWEEN DIFFERENT WORKFLOWS When ranking the four pipelines by said precision P3
gives the lowest value with 129 followed by P4 with 164 P1 with 198 and P2 with 214 However
a sample-specific global target-performance comparison is not the strongest criteria for evaluating
performance differences at transcript resolution For this purpose the apparent differential
expression shows if similar errors are caused by the same or different transcripts The highest
concordance was found between P3 and P1 (labelled P3P1) calculated as standard deviation of all
SIRV LFCs with 101 followed by P4P3 (104) P4P1 (255) P2P1 (288) and P3P2 (309) The
lowest concordance has P4P2 with a value of 412 One section of the resulting heat map for both
extremes is shown in Tab 1C
not peer-reviewed) is the authorfunder All rights reserved No reuse allowed without permission The copyright holder for this preprint (which was httpdxdoiorg101101080747doi bioRxiv preprint first posted online Oct 13 2016
Spike-In RNA variant controls for RNA-Sequencing bioRxiv upload 2016-10-13
15
Table 1 ǀ Variance heat map of SIRV concentration measures detailing SIRV6 by the 4 different
pipelines P1 to P4 A) Given are SIRV transcript identifier SubMix (SM) color code and transcript
lengths (in nucleotides) B) Heat maps showing the log-fold changes (LFC) for the comparison of the
normalized expected and measured SIRV concentrations as a result from the four data evaluation
pipelines P1 to P4 evaluating E0 E1 and E2 Fields with -1 le LFC le 1 are filled with gradient green all
fields with LFC lt -1 with straight blue and all fields with LFC gt 1 with straight red C) From all 6
possible pairwise comparisons P2P1 P3P1 to P4P3 of the normalized measured SIRV
concentrations the one with the smallest (P3P1) and largest (P4P2) median of all LFC are shown
The complete heat map is shown in the suppl Tab S2
not peer-reviewed) is the authorfunder All rights reserved No reuse allowed without permission The copyright holder for this preprint (which was httpdxdoiorg101101080747doi bioRxiv preprint first posted online Oct 13 2016
Spike-In RNA variant controls for RNA-Sequencing bioRxiv upload 2016-10-13
16
The same pipeline comparisons were made with either all endogenous transcripts or the ones in the
higher SIRV expression range and compared to the pipeline concordances calculated with the SIRV
controls (Fig 5) We define the first bin with ǀLFCǀ lt 1 as the bin of no apparently differentially
expressed transcripts independent of the corresponding p-values The other bins contain transcripts
for which the calculated concentrations differ by more than 2-fold hence convene apparently
differentially expressed transcripts (DE) We find that SIRV controls and endogenous transcripts are
evaluated coherently While theoretically no differences are expected pipelines P3 and P1 differ in
their quantification of the same data by 44 for the SIRVs and by 69 for endogenous RNAs in the
SIRV concentration range (Fig 5A) Pipelines P2 and P4 differ to a larger extent when evaluating the
same samples (Fig 5B C) The same correlation is seen in comparisons between different samples
(shown here for RC-0 vs RC-1) The expected DE between reference RNAs UHRR and HBRR of
approximately 50 is evaluated differently by P3 vs P1 (DE of 24 ) and this is mirrored in the
evaluation of the SIRV mixes spiked into these reference RNAs (DE of 49 ) P4 vs P2 performed
worse with a pipeline difference of 39 and 103 for endogenous and SIRV transcripts The
controls show a highly similar increase when comparing P3P1 with P4P2 (21-fold from 49 to
103 ) to the endogenous RNAs (16-fold from 24 to 39 ) Here the average measurement
using the same pipeline provide a pseudo-ground truth which is compared to the measurement
using different pipelines It allows to quantify the additional error caused solely by changes in the
pipeline A change from pipeline P3 to P1 would increase the number of DE-detected transcripts to a
smaller extent than a change from P2 to P4 and this is true for both the SIRV controls and the
endogenous transcripts
not peer-reviewed) is the authorfunder All rights reserved No reuse allowed without permission The copyright holder for this preprint (which was httpdxdoiorg101101080747doi bioRxiv preprint first posted online Oct 13 2016
Spike-In RNA variant controls for RNA-Sequencing bioRxiv upload 2016-10-13
17
Figure 5 ǀ SIRV and endogenous mRNA expression analyses are affected similarly when changing
data evaluation pipelines Binned apparent LFC-moduli are shown in histograms when comparing
results obtained by different pipelines evaluating identical NGS data sets from A C) the same
samples or B D) different samples Exemplarily the comparison with the best P3 vs P1 (black
symbols) and the worst agreement P4 vs P2 (red symbols) are shown The charts compare side-by-
side the results from the SIRV controls (green) all endogenous transcripts (black outline) and
endogenous transcripts within the medium-to-high concentration range of 10 to 2250 TPM or FPKM
(blue) The average of all intra-pipeline results are shown in grey The differences Δ between
not peer-reviewed) is the authorfunder All rights reserved No reuse allowed without permission The copyright holder for this preprint (which was httpdxdoiorg101101080747doi bioRxiv preprint first posted online Oct 13 2016
Spike-In RNA variant controls for RNA-Sequencing bioRxiv upload 2016-10-13
18
analyses with the same and with different pipelines show the losses in the bins 0 lt ǀLFCǀ lt 1 and the
corresponding gain in the other bins ǀLFCǀ gt 1 The increase of the FP-rate purely caused by the
pipeline changes vs the TP range is given in the summary graphs E and F) The 1st bins 0 lt ǀLFCǀ lt 1
are divided into two 0 lt ǀLFCǀ lt 05 and 05 lt ǀLFCǀ lt 1 which facilitates the easier tracking of the
results from the SubMixes4 as shown in Fig 4 were in both figures the 1st fraction is signed with 1b
DISCUSSION
We report a significant contribution to the external RNA controls toolbox in the form of Spike-In RNA
Variants (SIRVs) that address transcription variation and alternative splicing The highly defined mixes
of 69 transcripts aligning to 7 genes enable accurate target-performance evaluations of gene
expression analysis methods which is not possible eg by analyzing larger but only loosely defined
pools of in vitro transcripts (Lahens et al 2014) or limited sets addressing special problems like
fusion genes (Tembe et al 2014) The results presented here demonstrate that the condensed
complexity of the SIRV controls mimic very closely main properties of endogenous mRNAs when
analyzing high-throughput RNA sequencing workflows for their capabilities to determine transcript
variants and their relative quantities The responses of the SIRV controls to changes in the workflows
allow to extrapolate measures for the accuracy precision and foremost inter-experiment
comparability (concordance) to the large pool of endogenous RNAs With the help of the external
controls we could confirm that biases in sequence coverage could mostly be balanced by the
exemplary chosen data evaluation algorithms and for the majority of transcripts consistent relative
abundances were obtained However in our most concordant same sample pipeline comparison
P3P1 already 44 of the controls and 69 of the endogenous RNAs in the medium to high
concentration range appeared to be differentially expressed although none of those were true
positives (TP) because the reductio ad absurdum same sample comparison was using the very same
sets of NGS reads In consequence more than 700 potential endogenous mRNA leads would be non-
validatable false positives (FP) only because of a change in data evaluation pipelines With a
not peer-reviewed) is the authorfunder All rights reserved No reuse allowed without permission The copyright holder for this preprint (which was httpdxdoiorg101101080747doi bioRxiv preprint first posted online Oct 13 2016
Spike-In RNA variant controls for RNA-Sequencing bioRxiv upload 2016-10-13
19
difference between P4 and P2 of 12 at the level of endogenous RNAs an extra 1200 FPs would
obscure the evaluation
The inter-sample comparison between UHRR and HBRR presents a rather extreme case
where around half of all transcripts were calculated to differ by more than 2-fold However the
relative FPTP weight of both comparisons remains similar as P4P2 shows again clearly higher FP-
rates in both controls and endogenous RNAs The linear interpolation (Fig 5E) allows to estimate the
effect of the experimental changes to relative small number of differences as they would be seen in
typical RNA-Seq experiments Exemplarily highlighted are the intersections at 002 and 01 in Fig 5F
TP call rates and FPTP ratios are the important figures to estimate the likelihood and inversely
related effort to validate differentially expressed transcripts For the P3P1 comparison at 2 TP we
approximate an FPTP ratio of 289 The likelihood to actually validate DE transcripts under such
circumstances would reach 035 For the P4P2 comparison the TPFP ratio estimates to mere 014
The related risks and often substantial costs for deducing potential biomarkers would be 25 times
higher Although we demonstrated in the presented example the influence of changes in data
evaluation pipeline within an integrated RNA-Seq workflow the same principles apply to the front
end - the RNA treatment NGS library preparation and sequencing Here unintended variations in
particular sample preparations can only be detected by these external spike-in controls which
operate as markers and reference spots By these means SIRV controls increase the comparability
within and between sequencing experiments at the transcript isoform level SIRVs are designed for
the co-development improvement and monitoring of library preparations sequencing and data
processing
Outlook The presented module and the 92 ERCCs which probe the wide dynamic range using
monocistronic transcripts can be stepwise extended in the future by a) ca 15 poly(A)-tail variations
of monocistronic sequences with defined lengths of 20 and 30 adenosines as well as polyadenylated
and purified RNAs with poly(A)-tail lengths close to 50 100 and above 200 nucleotides b) around 12
above-average long RNAs with 3 5 7 and 10 kb c) approx 3 RNAs each with a low medium and
not peer-reviewed) is the authorfunder All rights reserved No reuse allowed without permission The copyright holder for this preprint (which was httpdxdoiorg101101080747doi bioRxiv preprint first posted online Oct 13 2016
Spike-In RNA variant controls for RNA-Sequencing bioRxiv upload 2016-10-13
20
high GC-content d) a set of 13 mRNA relevant chemical modifications most prominent the cap-
structure (Bokar and Rottman 1998) e) variants which cover aspects of SNPs alleles inversions and
fusion genes which needs to be accounted for in the corresponding sequence annotation files and f)
a random set of small and micro RNAs that comprise all sequence variations at their termini to
account for ligation biases The external control modules need to be fine-tuned with respect to the
dynamic concentration and concentration ratio range and the reference annotations must provide a
mixture of correctly over- and under-annotated genes to better emulate the challenging conditions
for bioinformatical data evaluation Both optimizations will also further increase the congruence of
the presented SIRV module with the endogenous RNAs Eventually all modules together would
develop into a comprehensive set of approximately 250 long RNA controls plus a microRNA module
which will become sufficient for calibration and normalization purposes This new estimate reduces
the scope of designing better spike-in controls compared to the maybe thousands of IVTs which have
been previously anticipated (Kratz and Carninci 2014)
METHODS
SIRV DESIGN AND IN SILICO ANALYSIS The gene structures of seven human model genes
(KLK5 LDHD LGALS17A DAPK3 HAUS5 USF2 and TESK2) were used as scaffold for the design of
SIRV1 to SIRV7 The ENCODE-annotated transcripts as well as added variants were edited to
represent in a redundant and comprehensive manner known transcription and alternative splicing
variations (complete gene structures are shown in the odd-numbered suppl Fig from S3 to S15) All
exon sequences descend from a pool of database-derived genomes (gene fragments from viruses
and bacteriophage capsid proteins and glycoproteins selected based on a GC-content in a range of
30-50) which were modified by inverting the sequence to lose identity while maintaining a kind of
naturally occurring order in the sequences Intron sequences that do not align with exons of another
isoform were drawn from random sequences whereby the GC content was balanced to comply with
not peer-reviewed) is the authorfunder All rights reserved No reuse allowed without permission The copyright holder for this preprint (which was httpdxdoiorg101101080747doi bioRxiv preprint first posted online Oct 13 2016
Spike-In RNA variant controls for RNA-Sequencing bioRxiv upload 2016-10-13
21
the adjacent exonic sequences (Random DNA Sequence Generator
httpwwwfacultyucredu~mmadurorandomhtm)
To verify the sequence exclusivity first the exon sequences were blasted against the entire NCBI
database including ERCCs on the nucleotide and protein level (program BLASTN 2229
httpsblastncbinlmnihgov) The default BLAST parameters used were word size 28 expected
threshold 10 Max matches in query rang 20 MatchMismatch Score 1 -2 Gap Costs Linear Filter
Low complexity regions Mask for lookup table only Search of the nucleotide collection resulted for
all SIRVs in ldquono significant similarity foundrdquo Second in silico generated reads (Griebel t al 2012)
(FLUX-Generator httpsammethnetconfluencedisplaySIMHome command line flux-simulator
-p ~hellipFluxsirv1par -t simulator -x -l -s) were mapped to nine individually selected genomes using
TopHat2 (Kim et al 2013) and Bowtie2 (Langmead and Salzberg2012) Because Bowtie2-aligned
reads can be as short as 20 nt the resulting limited number of mapping reads would be deemed to
be not significant in standard NGS work-flows In contrast when mapping reads with the standard
setting of the splicing-aware TopHat2 program not a single read aligned to any of the tested
genomes Given that both searches found no significant matches off-target mapping of the SIRVs can
essentially be ruled out Therefore the artificial SIRV sequences are suitable for noninterfering
qualitative and quantitative assessments in the context of known genomic systems and
complementary to the ERCC sequences (National Institute of Standards and Technology (NIST)
certified DNA plasmids Standard Reference Materialreg 2374) The SIRV sequences can be found at
httpswwwlexogencomsirvssirvsdownloads in the Source Data files and they are also
deposited at the NCBI Nucleotide Database (PRJNA312485)
SIRV CONSTRUCTS AND THE PRODUCTION OF IN-VITRO TRANSCRIPTS Synthetic gene constructs
were produced (Bio Basic Inc Markham ON Canada) that comprised 5rsquo to 3rsquo a unique restriction
site a T7 RNA polymerase promoter whose 3rsquo G is the first nucleotide of the actual SIRV sequence
which is seamlessly followed by a (A30)-tail that is fused with an exclusive 2nd restriction site These
not peer-reviewed) is the authorfunder All rights reserved No reuse allowed without permission The copyright holder for this preprint (which was httpdxdoiorg101101080747doi bioRxiv preprint first posted online Oct 13 2016
Spike-In RNA variant controls for RNA-Sequencing bioRxiv upload 2016-10-13
22
gene cassettes were cloned into a vector colony-amplified and singularized All SIRV sequence in the
purified plasmids were verified by Sanger-sequencing to identify the correct clones The E coli
cultures were grown in batches to obtain plasmids in the lower microg-scale Double digestion of isolated
plasmids with XhoI and NsiI showed correct insert size and complete restriction Linearized silica-
purified plasmids served as templates in in vitro transcription reactions using T7 transcription kits
(AmpliScribe T7 High Yield Transcription Kit and AmpliScribe T7 Flash Transcription Kit Epicentre
Madison WI) The DNase-treated phenol-extracted and silica-purified in vitro transcription products
were assessed for concentration and purity by spectrophotometry (NanoDrop Thermo Fisher
Scientific Waltham MA) and for integrity by capillary electrophoresis (2100 Bioanalyzer RNA 6000
Pico Kit Agilent Technologies Santa Clara CA)
In the context of variant verification RNA integrity is a very important measure Fragments
arising from incomplete transcription might impose errors on the correct determination of variants
which share those sequences and thereby also affect the overall gene coverage The integrity of the
transcription products was very heterogeneous as expected given the broad sequence variation and
the length of the SIRV transcripts (average 11 kb with 14 RNAs between 20 and 25 kb) A majority
of transcripts therefore had to be purified by at least one of two purification methods Purification
method PP1 is selective for poly(A)-tails and neglects prematurely terminated transcription products
Purification method PP2 is based on size-selective quantitative electrophoresis separating the
correctly sized main products from shorter fragments (transcription break off and degraded
products) and longer fragments (run-through transcription products) After purification the 69 SIRV
RNAs were assessed to be on average 736plusmn343 in the pre-peak fraction 9031plusmn372 in the
main-peak fraction (corresponding to RNAs of correct length) and 236plusmn304 in the post-peak
fraction (mass percentages wt) Noteworthy the risks of a beginning degradation during the initial
denaturation (2 min at 70degC) and the not fully denaturing conditions during RNA microcapillary
electrophoresis tiny noise levels in the baseline and slightly different shapes of the main peak result
in a rather over- than underestimation of pre- and post-peak fractions
not peer-reviewed) is the authorfunder All rights reserved No reuse allowed without permission The copyright holder for this preprint (which was httpdxdoiorg101101080747doi bioRxiv preprint first posted online Oct 13 2016
Spike-In RNA variant controls for RNA-Sequencing bioRxiv upload 2016-10-13
23
rRNasin (Promega Madison WI) was added to 08 Umicrol to minimize the risks of RNase
contamination induced RNA degradation The SIRVs were quantified by absorbance spectroscopy to
adjust all stock solutions to a base concentration of close to but above 50 ngmicrol RNA purity was very
high with A 260280 214plusmn012 and A 260230 217plusmn020
SIRV MIXING SIRV mixes were designed that contain pools of SIRVs (SubMixes) in defined
amounts and ratios by combining accurate volumes of the stock solutions in sufficiently large batch
sizes Pipetting errors vary depending on transfer volumes and range from plusmn4 for 2 microl to plusmn08 for
gt100 microl transfers The precision was experimentally determined with blank solutions Starting with
the stock concentration measurement (NanoDrop accuracy plusmn2 ngmicrol for 50 ngmicrol or plusmn4 ) and
accounting for the entire mixing pathway the accumulative concentration error is expected to range
between plusmn8 and plusmn47 Therefore in the data evaluation one has to account for the experimental
fuzziness by allowing for lower accuracy thresholds of plusmn8 on the linear scale or plusmn011 on the log2-
fold scale respectively The SIRV concentration ratios between two mixes are more precise because
only one final pipetting step defines the concentration differences and synchronizes all SIRVs which
belong to the same SubMix Here a maximal error of plusmn4 (or plusmn0057 on the log2-fold scale) can be
expected between SubMixes while all SIRVs of the same SubMix must propagate coherently into the
final mixes Bioanalyzer traces were used to monitor the relative propagation of the SIRVs PreMixes
and SubMixes during the mixing (Fig 2B) In addition the accurate pipetting of the 8 PreMixes was
controlled by checksums of Nanodrop concentration measurements which deviated by only
0002plusmn34 from the calculated target concentrations and by weighing on an analytical balance
which showed a deviation of 18plusmn065 The final concentration of the SIRV mixes are set to be 253
ngmicrol
not peer-reviewed) is the authorfunder All rights reserved No reuse allowed without permission The copyright holder for this preprint (which was httpdxdoiorg101101080747doi bioRxiv preprint first posted online Oct 13 2016
Spike-In RNA variant controls for RNA-Sequencing bioRxiv upload 2016-10-13
24
SPIKING OF REFERENCE RNA WITH SIRV MIXES In general SIRV mixes can be used with crude
cell extracts purified total RNA rRNA-depleted RNA or poly(A)-enriched RNA Important the spike-in
ratios have to be chosen in concordance with the desired final SIRV content the RNA preparation
method and if known the expected mRNA content One widely applicable spike-in ratio can be
obtained by adding 006 ng of controls to approximately 100 ng of total RNA In the presented
examples the total RNA mass of one single aliquot RNA was 100 ng of UHRR in RC-0 and 1128 ng of
HBRR in RC-1 The reference RNA in RC-2 was calculated to be 10427 ng (Fig S2) The high-
concentrated and thereby stable SIRV mix stocks with 253 ngmicrol and ERCC mix stocks with 30 ngmicrol
(ERCC Spike-In Mixes 1 and 2 by Ambion Thermo Fisher Waltham MA) were diluted just prior to the
spiking to facilitate the mixing of manageable volumes For example the final 11000 dilution
reduced the SIRV mix concentration to 253 pgmicrol from which 237 microl were required to spike a 100 ng
total RNA sample with 006 ng SIRVs The RC-samples were produced in large batches to yield
hundreds of samples allowing for a protocol with fewer dilutions and larger volumes reducing
thereby sources of experimental errors
NGS LIBRARY PREPARATION AND SEQUENCING The experiments were carried out in technical
triplicates From 1 microg RC-0 RC-1 or RC-2 RNA in total nine NGS libraries were prepared by Fasteris SA
(Plan-les-Ouates CH) using the TruSeq stranded mRNA library preparation kit with polyA selection
(Illumina Inc San Diego CA) All primary library templates were amplified with 14 PCR cycles to
reach reproducible concentrations 155plusmn45 nM and insert sizes 165plusmn10 bp An equimolar lane-mix
was sequenced at the CSF Campus Science Support Facilities GmbH (CSF Vienna AUT) in PE125
mode in one lane of a HiSeq 2500 flowcell in 125 bp paired-end mode using V4 chemistry The run
yielded 305 M raw reads 293 M after demultiplexing and trimming which corresponds to a read
depth of 326plusmn22 M reads per library
not peer-reviewed) is the authorfunder All rights reserved No reuse allowed without permission The copyright holder for this preprint (which was httpdxdoiorg101101080747doi bioRxiv preprint first posted online Oct 13 2016
Spike-In RNA variant controls for RNA-Sequencing bioRxiv upload 2016-10-13
25
READ PROCESSING AND MAPPING Standard data processing routines (bbduk part of BBMap by
B Bushnell to be found at sourceforgenetprojectsbbmap) were applied removing low quality
reads and trimming adapter sequences Due to variable stringencies the mappers produced different
read statistics STAR mapped against the genome 897plusmn59 of the reads (864plusmn56 uniquely) and
TopHat2 852plusmn57 (794plusmn52 uniquely) Bowtie2 mapped against the transcriptome 693plusmn18
reads (151plusmn15 uniquely)
ESTIMATION OF THE MRNA CONTENTS Based on the obtained read distributions the relative
mass partition between external controls and endogenous RNA fraction can be estimated Because
the library preparation uses a poly(A)-enrichment step the targeted endogenous RNA corresponds
almost exclusively to the mRNA content of the samples The propagation of the input mass ratio to
the output read ratio depends on both the mRNA content and the efficiencies of how controls and
mRNA proceed through the library preparation The relationship is described by Eqn 1
reRNA times prod(1 rconifrasl )
j
i=1
= (EeRNA times meRNA) times prod(1 (Econi times mconi)frasl )
j
i=1
Equation 1
with r number of reads from eRNA the endogenous RNA fraction here mRNA and con the
controls here SIRVs and ERCC E the relative efficiency of how the fraction proceeds through the
workflow and m the input mass
Ratios are measured as relative read counts and the results as a product of efficiencies and
apparent amounts are also relative measures Therefore at least one de facto arbitrary reference
point needs to be defined to deduce comparable absolute results Several reference points or
default values can be defined which lead to different dependent variables and imply slightly variable
interpretation of the results The following three calculation examples are simple deductions from
not peer-reviewed) is the authorfunder All rights reserved No reuse allowed without permission The copyright holder for this preprint (which was httpdxdoiorg101101080747doi bioRxiv preprint first posted online Oct 13 2016
Spike-In RNA variant controls for RNA-Sequencing bioRxiv upload 2016-10-13
26
the ratio shown in Eqn 1 with the ERCC (con1) and the SIRVs (con2) respectively Variation 1 is
explained in greater detail while in the other variants only the differing aspects are highlighted
Variation 1 i) Here the first assumption is that the mRNA content in UHRR (Agilent Santa
Clara CA) is 3 (factor 003) and 2 (factor 002) in HBRR (Ambion Thermo Fisher Waltham MA)
which stays in close agreement to previous estimates concluded from experiments by Shippy et al in
2006 The amounts of total RNA were measured by Nanodrop absorbance spectroscopy The UHRR
samples contained 100 ng and the HBRR samples 1128 ng The mixing ratio of (2times RC-0) (1times RC-1)
determines the concentration of the 3rd sample RC-2 and further the amount of total RNA (10427
ng) as well as its related mRNA content (2times100 ng times 3 + 1times1128 ng times 2 ) (2times100 ng + 1times1128
ng) = 264 (factor 0026) The mRNA masses of the samples are calculated by the measured total
RNA input amounts and default mRNA contents are 3 ng 2256 ng and 2752 ng The second
assumption is that the endogenous mRNAs proceed with the maximal efficiency of 100 (factor 1)
through library preparation and sequencing The input of the spike-in controls is the product of the
concentration values which were either measured as in the case of the SIRV stocks or stated by the
vendor as in the case of the ERCC stocks and the pipetted volumes Both are treated as de facto
measured values
ii) The relative amounts of reads which have been assigned to either endogenous mRNA
ERCCs or SIRVs are obtained from the mapping statistics (read classification)
iii) The ratio of mass input to reads output allows to calculate the propagation efficiency of
the controls relative to the default efficiency of the endogenous mRNA In the present experiment
the SIRVs progress with a relative efficiency of 867plusmn57 and the ERCCs with 416plusmn47 The
significant difference between the relative efficiency of both controls is very likely caused by the
different lengths of the poly(A)-tails which might influence a different binding efficiency during
poly(A)-enrichment step The SIRVs with a 30 nt long poly(A)-tail perform much more in concordance
with the endogenous mRNA as the ERCCs which contain shorter and variable poly(A)-tails ( 23 nt)
The observed small differences in the experiments using RC-0 RC-1 or RC-2 could be caused by a
not peer-reviewed) is the authorfunder All rights reserved No reuse allowed without permission The copyright holder for this preprint (which was httpdxdoiorg101101080747doi bioRxiv preprint first posted online Oct 13 2016
Spike-In RNA variant controls for RNA-Sequencing bioRxiv upload 2016-10-13
27
two-way interference of samples and controls However the deviations are small and can rather be a
result of minor inaccuracies in determining the relative input amounts Both hypotheses would need
to be verified by a series of repeats with the aim to resolve potential influences of pipetting during
the sample preparation variations in the library preparation and other contributions
Variation 2 Here no varying interferences between samples and controls are permitted
which means that relative efficiencies of the controls are considered to be constant The causes of
the experimental variations are exclusively assigned to the input amounts (alike hypothesis two in
the above example in discussing the deviation of the results in RC-2) This would translate into input
standard deviations of 118 (SIRVs) and 76 (ERCCs) The variations meld all accumulating errors
made in determining the concentration of the control stock solutions preparing the subsequent
dilutions pipetting the samples and controls during the spike-in step itself as well as determining the
amount of sample RNA in the first place Against the background of potential errors the calculated
results can be considered as highly consistent
Variation 3 In addition to the assumptions made for the measurement of sample RC-0
the spike-in of 006 ng SIRVs to all samples is also set as default Alike variation 2 the experiments in
RC-1 and RC-2 adopt the same default setting for the relative efficiencies calculated in RC-0
According to the ratio of Eqn 1 one can obtain mRNA contents as well as ERCC input amounts in this
case for samples RC-1 and RC-2 The mRNA content of the HBRR sample (RC-1) relative to the default
mRNA content in the UHRR sample (set to 3 ) would be 172 lower than the previously assumed
2 According to the present mixing scheme it would also imply that sample RC-2 has an mRNA
content of 254 up from the calculated 234 The offsets of -79 is again small and very likely
refers to the level of accuracy in the experimental results as discussed above Using this method the
spiking of samples with controls such as the SIRVs allows to closely estimate the relative mRNA
content of any unknown sample and to draw conclusions eg on the transcriptional state of tissues
cell suspension or individual cells
not peer-reviewed) is the authorfunder All rights reserved No reuse allowed without permission The copyright holder for this preprint (which was httpdxdoiorg101101080747doi bioRxiv preprint first posted online Oct 13 2016
Spike-In RNA variant controls for RNA-Sequencing bioRxiv upload 2016-10-13
28
COEFFICIENT OF DEVIATION We implemented a strand specific Coefficient of Deviation
(CoD) which aims to reflect the quality of NGS pipelines targeted at specific effects in particular
lsquospikenessrsquo of the coverage while systematic effects like drop of the coverage at Transcription Start
Sites (TSS) and Transcription End Sites (TES) are being suppressed The CoD is implemented by Eqn
2
CoD = CoD(LTSSLTES) = sum (cidealp- crealp)2
TESe
p=TSS1
divide sum cidealp
TESe
p=TSS1
Equation 2
which is calculated in strand orientation for contigs along all exonic nucleotide position (p) from the
first annotated TSS (TSS1) up to the last annotated TES (TESe) whereby cideal are the ideal coverages
with the optimized transient regions (LrsquoTSS LrsquoTES) and creal are the real coverages scaled as such that
the total integrals along all positions of ideal and real coverages are equal
The transient function at TSS and TES is the error function erf(x) which corresponds to
Cufflinks assumption about normally distributed fragment lengths (Trapnell et al 2012) Since erf(x)
is a non-algebraic function we used the algebraic approximation by Abramowitz and Stegun
(httpsenwikipediaorgwikiError_function eq 7125) Once the optima (LrsquoTSS LrsquoTES ) are found
we declare CoD(LrsquoTSS LrsquoTES) to be the ultimate CoD value which mostly eliminated the transient region
effects We implemented an optimization algorithm (Nelder-Mead downhill simplex method) and
used as starting values (L0TSS L0
TES ) lengths of 150 In some cases the optimum found can be beyond
a reasonable range of values Therefore we censor the output Lopt of the mathematical optimization
as follows Lcensored = 50 if Lrsquo lt 50 Lcensored = 350 if Lrsquo gt 350 This corresponds to the maximal range of
not peer-reviewed) is the authorfunder All rights reserved No reuse allowed without permission The copyright holder for this preprint (which was httpdxdoiorg101101080747doi bioRxiv preprint first posted online Oct 13 2016
Spike-In RNA variant controls for RNA-Sequencing bioRxiv upload 2016-10-13
29
200plusmn150 This censoring needed to be applied in 8 cases out of 84 SIRVmixstrandend
combinations ie less than in 10
TRANSCRIPT CONCENTRATION MEASUREMENTS In order to estimate expression values on
transcript levels we applied RSEM (Li and Dewey 2011) which uses a Bayesian Network to compute
the likelihood of each fragment belonging to a given transcript Salmon (Patro et al 2015) estimates
the transcript expression values by a k-mer based mapping Similar to RSEM it uses an expectation-
maximization (EM) algorithm to compute the maximum likelihood of relative abundances Cufflinks2
(Trapnell et al 2013) estimates the transcript abundances with a coverage-based maximum
likelihood approach It determines the probability of read assignments to isoforms
DIFFERENTIAL EXPRESSION ANALYSIS We used the DESeq2 package (Love et al 2014) for
calculation of fold-differences between the results from different pipelines and different input samples
mixtures As explained in the main text all outputs from the evaluated pipelines (in form of relative
concentration measures) have been scaled Scaling by linear transformation is needed as a
consequence of the different mRNA contents in the samples but also to eventually compensate any
potential pipetting errors when small aliquots typically in the range of very few microliter are added
to individual samples The RC-samples in this experiment were produced in a large batch to ensure
high accuracy in volumetric ratios The main sample pool is practically invariant to the small relative
contribution of the controls but was technically treated in the same way by scaling the main sample
pools to identical sizes First SIRV concentrations were scaled to reach together 69 in E0 685 in E1
and 708 in E2 which is the dimensionless value identical to the fmolmicrol in the respective SIRV stock
solutions Then the lower threshold was set to 10-6 which corresponds to original FPKM values of
around 5∙10-3 ⅟7th of one read for a 1 kb long transcript at a read depth of 30 Mio reads or 1 gene
specific read to be divided between 7 equally possible transcript variants at said 1 kb length section
The threshold is to be understood as less than or equal to 10-6 which defines an averaged read
not peer-reviewed) is the authorfunder All rights reserved No reuse allowed without permission The copyright holder for this preprint (which was httpdxdoiorg101101080747doi bioRxiv preprint first posted online Oct 13 2016
Spike-In RNA variant controls for RNA-Sequencing bioRxiv upload 2016-10-13
30
resolution of the particular workflow at the given read depth By these means all ratios remain defined
Second for the DESeq2 calculations we multiplied all values with 106 after which fractions were
rounded to the closest integer We understand that for no-change hypothesis testing which is the
main purpose of the DESeq2 package transforming the relative concentrations (FPKM or TPM) to
lsquoquasi-read-countsrsquo is not recommended since DESeq2 internally corrects for library size by using size
factors However in our application we do not use the probability of the hypothesis rejection (P
values) but the raw fold changes detected (irrespectively of the dispersion values for that given
transcript) We also took into account the potential danger of censoring the input (by unintentionally
eliminating transcripts represented by extremely low FPKM or TPM values) by setting a suitable
threshold as described above The figures show only two differential expression analyses because the
3rd concentration ratio E2E0 is the product of E1E0 and E2E1
ERROR RATE ANALYSIS The four red data points two from the SIRV controls (circles) and two
from the endogenous mRNAs (squares) from the best agreement (P3 vs P1) and the four
corresponding black data points from the worst agreement (P4 vs P2) as shown in fig 5E were fitted
by linear approximation using the relationship as derived for Eqn 3
TP + FP = 1
FP = N times ER = (1-TP) times ER
(TP+FP) = TP + ER - TP times ER
(TP+FP) = (1-ER) times TP + ER Equation 3
where TP is the relative portion of true positives (differentially expressed as in our definition
possessing a LFC gt 1) N the relative portion of negatives ER the error rate at which negatives are
falsely detected as positives to result in false positives FP The least squares fitting method was
applied to derive values for the slope (1-ER) and the intercept ER
not peer-reviewed) is the authorfunder All rights reserved No reuse allowed without permission The copyright holder for this preprint (which was httpdxdoiorg101101080747doi bioRxiv preprint first posted online Oct 13 2016
Spike-In RNA variant controls for RNA-Sequencing bioRxiv upload 2016-10-13
31
The transformation of Eqn 3 leads to the relationship of Eqn 4
TP FPfrasl = (TP+FP) TPfrasl -1 Equation 4
which has been used for the graph in fig 5F In the present context the concept of ROC-curves is not
applicable because the true or false negatives are indistinguishable as long the ground truth of the
endogenous RNA are unknown
DATA ACCESS Sequencces and source data files data are in the process to be deposited at
NCBI under BioProject ID PRJNA312485
ACKNOWLEDGMENTS We thank SA Munro and M Salit (Material Measurement
Laboratory National Institute of Standards and Technology) for their efforts in further developing the
concepts of the External RNA Control Consortium (ERCC) in an updated suite of RNA controls and
analysis methods called ERCC 20 We thank A Tuerk for his contributions in finding suitable human
model genes G Wiktorin for carrying out the RSEM calculations M Mihaylova in helping with the
graphics design and I Gabler for critically reading the manuscript
AUTHOR CONTRIBUTIONS LP PK and TR designed the sequences and mixtures PK and GH
prepared the in vitro transcripts and spike-in mixtures TR AS and LP designed the research and
the experiments MA IH and TR evaluated the data TR and LP wrote the manuscript
DISCLOSURE DECLARATION The authors are employees of Lexogen GmbH from which the SIRVs
can be bought and AS has equity stakes in Lexogen GmbH LP PK and TR are named as
not peer-reviewed) is the authorfunder All rights reserved No reuse allowed without permission The copyright holder for this preprint (which was httpdxdoiorg101101080747doi bioRxiv preprint first posted online Oct 13 2016
Spike-In RNA variant controls for RNA-Sequencing bioRxiv upload 2016-10-13
32
inventors on a patent application regarding the production and use of RNA transcript variants and
Lexogen GmbH is the owner of this patent application
REFERENCES
Baker SC Bauer SR Beyer RP Brenton JD Bromley B Burrill J Causton H Conley MP Elespuru R Fero M et al 2005 The External RNA Controls Consortium a progress report Nat Methods 2(10) 731-4 Bokar JA Rottman FM 1998 Biosynthesis and Functions of Modified Nucleosides in Eukaryotic mRNA In Modification and Editing of RNA (eds Grosjean H Benne R) pp 183-200 ASM Press Washington DC Dobin A Davis CA Schlesinger F Drenkow J Zaleski C Jha S Batut P Chaisson M Gingeras TR 2013 STAR ultrafast universal RNA-seq aligner Bioinformatics 29(1) 15-21 Fed Reg Doc 2015-19742 2015 External RNA Controls Consortium - Call for Participation and Contributions to a Sequence Library Federal Register Citation 80 FR 48296 Griebel T Zacher B Ribeca P Raineri E Lacroix V Guigoacute R Sammeth M 2012 Modelling and simulating generic RNA-Seq experiments with the flux simulator Nucleic Acids Res 40(20) 10073-83 Jiang L Schlesinger F Davis CA Zhang Y Li R Salit M Gingeras TR Oliver B 2011 Synthetic spike-in standards for RNA-seq experiments Genome Res 21(9) 1543-51 Kim D Pertea G Trapnell C Pimentel H Kelley R Salzberg SL 2013 TopHat2 accurate alignment of transcriptomes in the presence of insertions deletions and gene fusions Genome Biol 14(4) R36 Kratz A Carninci P 2014 The devil in the details of RNA-seq Nat Biotechnol 32(9) 882-4 Lahens NF Kavakli IH Zhang R Hayer K Black MB Dueck H Pizarro A Kim J Irizarry R Thomas RS et al 2014 IVT-seq reveals extreme bias in RNA sequencing Genome Biol 15(6) R86 Langmead B Salzberg SL 2012 Fast gapped-read alignment with Bowtie 2 Nat Methods 9(4) 357-9 Li B Dewey CN 2011 RSEM accurate transcript quantification from RNA-Seq data with or without a reference genome BMC Bioinformatics 12 323 Li J Jiang H Wong WH 2010 Modeling non-uniformity in short-read rates in RNA-Seq data Genome Biol 11 R50 Li S Tighe SW Nicolet CM Grove D Levy S Farmerie W Viale A Wright C Schweitzer PA Gao Y et al 2014 Multi-platform assessment of transcriptome profiling using RNA-seq in the ABRF next-generation sequencing study Nat Biotechnology 32 915-25 Love MI Huber W Anders S 2014 Moderated estimation of fold change and dispersion for RNA-seq data with DESeq2 Genome Biol 15(12) 550
not peer-reviewed) is the authorfunder All rights reserved No reuse allowed without permission The copyright holder for this preprint (which was httpdxdoiorg101101080747doi bioRxiv preprint first posted online Oct 13 2016
Spike-In RNA variant controls for RNA-Sequencing bioRxiv upload 2016-10-13
33
Mortazavi A Williams BA McCue K Schaeffer L Wold B 2008 Mapping and quantifying mammalian transcriptomes by RNA-Seq Nat Methods 5(7) 621-8 Patro R Duggal G Kingsford C 2015 Accurate fast and model-aware transcript expression quantification with Salmon bioRxiv preprint doi httpdxdoiorg101101021592 Shippy R Fulmer-Smentek S Jensen RV Jones WD Wolber PK Johnson CD Pine PS Boysen C Guo X Chudin E et al 2006 Using RNA sample titrations to assess microarray platform performance and normalization techniques Nat Biotechnol 24(9) 1123-31 SEQCMAQC-III Consortium 2014 A comprehensive assessment of RNA-seq accuracy reproducibility and information content by the Sequencing Quality Control Consortium Nat Biotechnology 32 903-14 Tembe WD Pond SJ Legendre C Chuang HY Liang WS Kim NE Montel V Wong S McDaniel TK Craig DW Carpten JD 2014 Open-access synthetic spike-in mRNA-seq data for cancer gene fusions BMC Genomics 15 824 Trapnell C Roberts A Goff L Pertea G Kim D Kelley DR Pimentel H Salzberg SL Rinn JL Pachter L 2012 Differential gene and transcript expression analysis of RNA-seq experiments with TopHat and Cufflinks Nat Protoc 7(3) 562-78 Trapnell C Hendrickson DG Sauvageau M Goff L Rinn JL Pachter L 2013 Differential analysis of gene regulation at transcript resolution with RNA-seq Nat Biotechnol 31(1) 46-53 van Dijk EL Jaszczyszyn Y Thermes C 2014 Library preparation methods for next-generation sequencing tone down the bias Exp Cell Res 322(1) 12-20 Wang Z Gerstein M Snyder M 2009 RNA-Seq a revolutionary tool for transcriptomics Nat Rev Genet 1 57-63 Zheng W Chung LM Zhao H 2011 Bias detection and correction in RNA-Sequencing data BMC Bioinformatics 12290
not peer-reviewed) is the authorfunder All rights reserved No reuse allowed without permission The copyright holder for this preprint (which was httpdxdoiorg101101080747doi bioRxiv preprint first posted online Oct 13 2016
Spike-In RNA variant controls for RNA-Sequencing bioRxiv upload 2016-10-13
2
ABSTRACT
Spike-In RNA variants (SIRVs) enable for the first time the validation of RNA sequencing workflows
using external isoform transcript controls 69 transcripts derived from seven human model genes
cover the eukaryotic transcriptome complexity of start- and end-site variations alternative
splicing overlapping genes and antisense transcription in a condensed format Reference RNA
samples were spiked with SIRV mixes sequenced and exemplarily four data evaluation pipelines
were challenged to account for biases introduced by the RNA-Seq workflow The deviations of the
respective isoform quantifications from the known inputs allow to determine the comparability of
sequencing experiments and to extrapolate to which degree alterations in an RNA-Seq workflow
affect gene expression measurements The SIRVs as external isoform controls are an important
gauge for inter-experimental comparability and a modular spike-in contribution to clear the way
for diagnostic RNA-Seq applications
[Supplemental material is available for this article]
INTRODUCTION
RNA sequencing workflows comprise of RNA purification library generation the sequencing itself
and the evaluation of the sequenced fragments (Wang et al 2009) The first steps impose numerous
whether or not intended biases towards RNA classes and sequence characteristics which data
processing algorithms try to compensate for afterwards (Li et al 2010 van Dijk et al 2014 Zheng et
al 2011) Here key tasks are the concordant assignment of fragments to the transcript variants and
the subsequent deduction of the corresponding abundance values As long as the quality of all
individual processing steps cannot be unequivocally determined subsequent comparisons of
experimental data in particular but not exclusively between different data sets remain ambiguous
The proliferation of different RNA-Seq platforms and protocols has created the need for multi-
not peer-reviewed) is the authorfunder All rights reserved No reuse allowed without permission The copyright holder for this preprint (which was httpdxdoiorg101101080747doi bioRxiv preprint first posted online Oct 13 2016
Spike-In RNA variant controls for RNA-Sequencing bioRxiv upload 2016-10-13
3
functional spiked-in controls which are processed alongside real samples to enable the monitoring
and comparing of key performance parameters like the ability to correctly distinguish and quantify
transcript variants (Fed Reg Doc 2015-19742)
At present comparisons are carried out only in exemplary inter-laboratory studies on
reference RNA samples which investigate different RNA treatments NGS platforms and data
evaluation algorithms (SEQCMAQC-III Consortium 2014 Li et al 2014) For these studies reference
RNA samples were created from Universal Human Reference RNA (UHRR from Agilent) and Human
Brain Reference RNA (HBRR from Ambion Thermo Fisher) which contain a stable but largely
unknown transcript variant diversity In addition the reference samples contained also a set of 92 in-
vitro transcripts IVTs as spike-in controls which were developed by the External RNA Controls
Consortium (Baker et al 2005) These control transcripts ERCCs (Ambion Thermo Fisher) allow to
asses dynamic range dose response lower limit of detection and fold-change response of RNA
sequencing pipelines within the limitation of the mono-exonic single-isoform RNA sequences (Jiang
et al 2011) Because the ERCCs contain no transcript variants one of the main challenges of
sequencing complex transcriptomes - to identify and distinguish splice variants - could not be
evaluated until now
Here we describe the sequence design and preparation of a comprehensive and novel set of
Spike-In Transcript Variants SIRVs and show in first examples how mixes thereof can be used to
validate isoform-specific RNA sequencing workflows Further we demonstrate how to utilize SIRVs
for comparing experiments by extrapolating the results from the well-defined ground truth of a small
fraction of control reads to the sample reads Although the focus of the first SIRV module is clearly on
the resolution of transcript variants the aim is to build a modular system of IVT controls which retain
in the most condensed manner all relevant aspects of the transcriptome complexity to establish a
continuous referencing method for RNA sequencing experiments Then those controls will provide
the base for lasting comparisons of the wealth of RNA-Seq data especially in the face of the rapid
development of sequencing technologies
not peer-reviewed) is the authorfunder All rights reserved No reuse allowed without permission The copyright holder for this preprint (which was httpdxdoiorg101101080747doi bioRxiv preprint first posted online Oct 13 2016
Spike-In RNA variant controls for RNA-Sequencing bioRxiv upload 2016-10-13
4
RESULTS
SIRVS DESIGN The SIRVs were modelled on 7 human genes whose annotated transcripts
were extended by exemplary isoforms to yield between 6 and 18 transcript variants for each gene
and 69 transcripts in total (general design overview in Suppl Fig S1) They comprehensively address
start- and end-site variations alternative splicing overlapping genes and antisense transcription Fig
1A illustrates how the human gene KLK5 served as a blue print for the design of the gene SIRV1 with
its 8 transcript variants (gene structures of SIRV2 to SIRV7 are shown in the odd-numbered suppl
Figures from S5 to S15) The SIRV genes model in a condensed and redundant manner all currently
known transcription and alternative splicing variations (summary in Fig 1B) The transcripts range in
length from 191 to 2528 nt (119909 1134 nt 813 nt) and contain an additional 30 nt long poly(A)-tail
The GC-content varies between 295 and 512 ( 430 436 ) The exon sequences were
created from a pool of database-derived genomes and modified by inverting the sequence to lose
identity while maintaining a naturally occurring order in the sequences The splice junctions conform
to 969 to the canonical GT-AG exon-intron junction rule with few exceptions harboring the less
frequently occurring variations GC-AG (17 ) and AT-AC (06 ) Two non-canonical splice sites CT-
AG and CT-AC account for 04 each The exon sequences were blasted against the entire NCBI
database on the nucleotide and on the protein level and mapped using in silico generated reads
Because no significant matches were found off-target mapping is de facto absent Therefore the
artificial SIRV sequences are suitable for non-interfering qualitative and quantitative assessments in
known genomic systems and they are complementary to the ERCC sequences
not peer-reviewed) is the authorfunder All rights reserved No reuse allowed without permission The copyright holder for this preprint (which was httpdxdoiorg101101080747doi bioRxiv preprint first posted online Oct 13 2016
Spike-In RNA variant controls for RNA-Sequencing bioRxiv upload 2016-10-13
5
Figure 1 ǀ Deriving SIRV1 from model gene KLK5 and classification of implemented transcript
isoform features
A) Schematic view of the human Kallikrein-related peptidase 5 gene (KLK5) Ensembl annotation
(GRCh38p2) which served as model for SIRV1 The condensed exon-intron structure and the
annotated transcript isoforms are shown in the upper grey section SIRV1 comprises 8 transcript
variants shown in blue The transcript orientations are indicated by arrows just upstream of the
not peer-reviewed) is the authorfunder All rights reserved No reuse allowed without permission The copyright holder for this preprint (which was httpdxdoiorg101101080747doi bioRxiv preprint first posted online Oct 13 2016
Spike-In RNA variant controls for RNA-Sequencing bioRxiv upload 2016-10-13
6
poly(A)-tails highlighted in red B) The occurrences of the different transcription and splicing events
are counted for each transcript in reference to a hypothetical master transcript which contains all
exon sequences from all transcript variants of a given gene (outlined next to ldquoSIRV 1rdquo in A)) Therefore
no intron retention can occur and exon splitting has been defined to be understood as introduction of
an intron sequence
PRODUCTION OF SIRV MIXES The SIRVs were produced by in vitro transcription (IVT) from
linearized plasmids yielding SIRV RNAs of high purity but varying integrity Since the SIRV transcripts
represent isoforms with overlapping sequences break-down products of SIRV RNAs can potentially
affect the detection and quantification of other isoforms Therefore a set of tailored purification
procedures was applied to obtain full-length RNAs with a minimal amount of side products despite
the broad sequence and length variation of the SIRVs (Fig 2A) By capillary electrophoresis
(Bioanalyzer Agilent) the purified SIRV RNAs were assessed to be at least to 9031plusmn372 of correct
length Each SIRV transcript entered the final mixes via one of eight PreMixes allowing for the unique
identification of each SIRV by capillary electrophoresis (Fig 2B) The PreMixes were merged pairwise
in equal amounts to yield four SubMixes which were then combined in defined volumetric ratios to
create the final mixes The experimentally determined cumulative pipetting error for individual SIRVs
is smaller than plusmn8 while the applied SubMix scheme limits the maximum error for differential gene
expression experiments to only plusmn4 Bioanalyzer traces were used to monitor the relative
propagation of the SIRVs in Pre- and SubMixes during the staged mixing (Fig 2B) The mix E0
maintains equimolar SIRV concentration ratios E1 contains a maximum concentration difference of
8-fold (close to one order of magnitude) and E2 comprises a concentration difference of up to 128-
fold The inter-mix concentration ratios range from 164- to 16-fold (Fig 2C)
not peer-reviewed) is the authorfunder All rights reserved No reuse allowed without permission The copyright holder for this preprint (which was httpdxdoiorg101101080747doi bioRxiv preprint first posted online Oct 13 2016
Spike-In RNA variant controls for RNA-Sequencing bioRxiv upload 2016-10-13
7
Figure 2 ǀ SIRV RNA integrity and mixing scheme
A) Examples of high SIRV integrity T7 transcription of SIRV612 yielded RNA of almost uniform correct
length with 4924 in the pre- main- and post-peak fractions as analyzed by Bioanalyzer RNA
6000 Pico Chip (Agilent) capillary electrophoresis The lower integrity of SIRV101 and SIRV203 after T7
transcription (blue traces) was increased using tailored purification protocols PP1 and PP2 (red
traces) Finally the integrity of all SIRVs was ge85 wt with on average 903plusmn37 wt in the main peak
fraction B) 8 PreMixes received in equimolar entities between 6 and 11 SIRVs which varied in length
to be unambiguously traced in Bioanalyzer runs PreMixes were combined pairwise in equal ratios to
yield SubMixes The resulting 4 SubMixes were combined in defined ratios to obtain the final Mixes
not peer-reviewed) is the authorfunder All rights reserved No reuse allowed without permission The copyright holder for this preprint (which was httpdxdoiorg101101080747doi bioRxiv preprint first posted online Oct 13 2016
Spike-In RNA variant controls for RNA-Sequencing bioRxiv upload 2016-10-13
8
E0 E1 and E2 Measured traces are shown in red and traces computed from the PreMix traces to
validate the composition of the SubMixes and final Mixes are shown in blue A color code for the
SubMixes is introduced to follow groupings of SIRVs throughout the subsequent data analysis C)
Graphical representation of the relative SIRV concentrations and concentration ratios according their
SubMix belonging The total molarity and weight of the final mixes are evenly balanced at 697
fmolmicrol and 253 ngmicrol
Three different samples with SIRVs RC-0 RC-1 and RC-2 (for details see methods section) were
prepared NGS libraries generated and sequenced in paired-end 125 bp mode
NGS DATA EVALUATION All demultiplexed NGS reads were mapped to the human
genome (GRCh38p2) the ERCC sequences and the SIRVome by using the common splice-aware
aligners STAR (Dobin et al 2012) TopHat2 (Kim et al 2013) while Bowtie2 (Langmead and Salzberg
2012) was used to map reads to a set of accordingly generated transcript sequences Bowtie2 aligned
reads were further processed by RSEM (Li and Dewey 2011) a combination referred to below as data
evaluation pipeline P1 Salmon is an autarkic program algorithm (Patro et al 2015) referred to as P2
STAR as well as TopHat2 aligned reads were further processed by Cufflinks2 (Trapnell et al 2012)
and resemble the evaluation pipelines P3 and P4
ESTIMATION OF THE MRNA CONTENTS On the basis of the assumption that the RNAs in the
samples and the spike-in controls are equally targeted by the library preparation due to similar
length distributions (SIRV 1129plusmn15 nt ERCC 880plusmn26 nt and based on the P4 results UHRR 1538 nt
and HBRR 1641 nt) the relative mass partition between controls and endogenous RNA can be
determined The propagation of the input amounts to the output read ratio depends on the mRNA
content and the relative recovery efficiencies of controls and mRNA after the library preparation
Therefore one reference value needs to be defined or externally determined which we chose to be
not peer-reviewed) is the authorfunder All rights reserved No reuse allowed without permission The copyright holder for this preprint (which was httpdxdoiorg101101080747doi bioRxiv preprint first posted online Oct 13 2016
Spike-In RNA variant controls for RNA-Sequencing bioRxiv upload 2016-10-13
9
an mRNA content of 3 in UHRR (Shippy et al 2006) We further set the efficiency of the
endogenous mRNA proceeding through this particular library preparation to 100 The SIRVs can
then be calculated to progress with a relative efficiency of 870plusmn6 allowing to determine the
mRNA content in the second sample HBRR to be 172 The mRNA content in the mixed samples
RC-2 is then assessed to be 234 which corresponds to a minor -91 offset relative to the
theoretical outcome based on the RC-0 and RC-1 measurements In the TruSeq library preparation
the 30 nt long poly(A)-tail of the SIRVs ensures an enrichment similar to the endogenous mRNAs The
ERCC controls show a lower recovery efficiency of 416plusmn47 most likely due to their shorter poly(A)-
tails which vary between 19 and 25 adenines ( 23 nt) The results are summarized in suppl Tab S1
COMPARISON BETWEEN EXPECTED AND MEASURED COVERAGE AND CONCENTRATION MEASURES For the first
time the ground truth of complex input sequences is available allowing detailed target-performance
comparisons for read alignment relative abundance calculation and differential expression
determination Fig 3 shows for one example gene SIRV 3 in E0 the expected coverages and counts
of the telling junctions together with the coverages obtained by STAR and TopHat2 mapping NGS
workflow-specific read start-site distributions lead to coverage patterns with inherent terminal
deficiencies for which the expected coverage has been adjusted accordingly However in the
measured coverages these systematic start- and end-site biases are accompanied by a variety of
biases which introduce severe local deviations from the expected coverage
not peer-reviewed) is the authorfunder All rights reserved No reuse allowed without permission The copyright holder for this preprint (which was httpdxdoiorg101101080747doi bioRxiv preprint first posted online Oct 13 2016
Spike-In RNA variant controls for RNA-Sequencing bioRxiv upload 2016-10-13
10
Figure 3 ǀ Comparison of the expected and the measured coverages for the SIRV3 locus in mix E0
A) Individual transcripts of SIRV3 with transcripts on the plus strand in blue and in red for the ones on
the minus strand Color code indicates the SubMix allocation B) The expected SIRV3 coverage is
shown as superposition of individual transcript coverages in which the terminal sites have been
modelled by a transient error function The measured coverages after read mapping by TopHat2 are
shown in grey The measured coverages and number of splice junction reads were normalized to
obtained identical areas under the curves and identical sums of all junctions for the expected and
measured data The measured splice junction reads are shown by the numbers before the brackets
not peer-reviewed) is the authorfunder All rights reserved No reuse allowed without permission The copyright holder for this preprint (which was httpdxdoiorg101101080747doi bioRxiv preprint first posted online Oct 13 2016
Spike-In RNA variant controls for RNA-Sequencing bioRxiv upload 2016-10-13
11
while the expected values are shown inside the brackets The CoD values are given for the plus and
minus strand in the respective colors C) Differences between mapping by STAR aligner and TopHat2
The black arrows indicate the direction of positive differences Percentages refer to the relative
changes of the measured splice junction reads
To obtain a comparative measure gene-specific coefficients of deviation CoD were calculated CoDs
describe the often hidden biases in the sequence data predominantly caused by an inhomogeneous
library preparation but also by the subsequent sequencing and mapping In the presented example
the stranded TruSeq library preparation with the Illumina HiSeq2500 sequencing and mapping by
TopHat2 results in a mean CoD of 0190plusmn0193 across all SIRVs For the sense oriented SIRVs the
mean CoD is 0275plusmn0223 and for the antisense SIRVs which cover a region of fewer overlapping
transcript annotations the mean CoD is 0090plusmn0076 The coverage target-performance comparison
highlights the inherent difficulties in deconvoluting read distributions to correctly identify transcript
variants and determine concentrations The distribution of telling reads splice junctions and reads
towards the termini are references for the assignment of the remaining reads before calculating
relative transcript variant abundances Not surprisingly although the majority of junction counts
correlates well with the expected values the high CoD values indicate that numerous telling reads
deviate significantly within the context of the individual mixes They also differ between mixes which
affects differential expression measurements (see Fig 3B and for the coverage of all seven SIRV
genes the even suppl Fig from S4 to S16)
The CoD does not allow to distinguish between periodicity and randomness in the biases nor
does it forecast how well a data evaluation strategy can cope with the bias contributions
Nevertheless smaller CoD values are expected to correlate with a simpler and less error-prone data
evaluation The CoD values can be taken as a first indicative measure to characterize the mapped
data and to compare data sets for similarity up to this point in the workflow Target-performance
comparisons of all SIRV genes in all three mixes can be found in the supplemental information
not peer-reviewed) is the authorfunder All rights reserved No reuse allowed without permission The copyright holder for this preprint (which was httpdxdoiorg101101080747doi bioRxiv preprint first posted online Oct 13 2016
Spike-In RNA variant controls for RNA-Sequencing bioRxiv upload 2016-10-13
12
The above described four data analysis pipelines P1 to P4 were used to calculate transcript
abundances for 69 SIRV and 196˙165 annotated endogenous transcripts All obtained results are
relative concentration measures yielding either Fragments Per Kilobase of exon per Million
fragments mapped (FPKM) (Mortazavi 2008) or Transcripts Per Million (TPM) (Li and Dewey 2011)
The concentrations were scaled by linear transformation in such way that all SIRVs together reach 69
in E0 685 in E1 and 708 in E2 which is the dimensionless value identical to the fmolmicrol in the
respective SIRV stock solutions In consequence the relative quantities of the SIRVs are compatible
to the normalized scale which was introduced in Fig 2C Boxplots in Fig 4 show exemplarily the SIRV
concentrations and two discrete differentials as measured by P3 (results from P1 P2 and P4 are
shown in suppl Fig S17 and standard correlation plots of the four pipelines are shown in suppl Fig
S18) The majority of all SubMix mean concentration values are in concordance with the expected
values The concentration ratios simulating differential expression measurements are less prone to
systematic offsets and show by trend narrower distributions However these correlations highlight
already the issue of obvious and frequent outliers ie transcript variants that are not well resolved
not peer-reviewed) is the authorfunder All rights reserved No reuse allowed without permission The copyright holder for this preprint (which was httpdxdoiorg101101080747doi bioRxiv preprint first posted online Oct 13 2016
Spike-In RNA variant controls for RNA-Sequencing bioRxiv upload 2016-10-13
13
Figure 4 ǀ Box plot overview of calculated concentration values for SIRV mixes and mix ratios
Reads from SIRV mixes E0 E1 and E2 were processed by four different data evaluation algorithms for
transcript quantification Results derived by pipeline P3 are exemplarily shown in reference to the
known inputs (bars in colors corresponding to the SIRV SubMixes of Fig 2) The black circles mark the
mean and the bold dashes the medians of the data points which are shown in grey the boxes span
the 25 to 75 region of the data points and the black whiskers with connecting lines reach up to the
min and max values and indicate also outliers outside the scale of the graph The comparison E1 vs
E0 from sample RC-1 and RC-0 (2nd row) was used for building the histogram of Fig 5B The shaded
area resembles the 1st bin (0leǀLFCǀle1) while the inner section (b1) comprises the fraction 0leǀLFCǀlt05
where the majority of data points originates from SubMix4 (ratio 11) and some ldquooutliersrdquo from
SubMix2 which were actually spiked in at the ratio 21
Heat maps allow to inspect each SIRV in the context of competing transcripts Tab 1B shows
the abundancies as log2-fold changes LFC relative to the expected values for the example of SIRV 6
LFC values consider relative increases and decreases across all concentration ranges likewise An LFC
window of plusmn011 presents the confidence interval as a result from the currently achievable accuracy
not peer-reviewed) is the authorfunder All rights reserved No reuse allowed without permission The copyright holder for this preprint (which was httpdxdoiorg101101080747doi bioRxiv preprint first posted online Oct 13 2016
Spike-In RNA variant controls for RNA-Sequencing bioRxiv upload 2016-10-13
14
in producing the SIRV mixtures We examine the LFC values uncoupled from the adjusted p-values
which provide a statistical measure of the significance level for apparent differential expression By
these means we prevent pipelines to appear more coherent only due to higher noise levels The
accuracy has been calculated for each SIRV as the mean of the LFCs in all three mixes The precision is
a measure of how consistent SIRVs are quantified and has been calculated as the LFC standard
deviation for each SIRV and further for entire pipelines by using all SIRVs Within the presented
example SIRVs can obtain in all four pipelines high precisions of up to 018plusmn007 and high accuracies
of up to -001plusmn010 (SIRV604) In contrast SIRV612 of similar length has an average precision of
569plusmn368 and an accuracy of -386plusmn270 although it was detected by P2 with a high precision of 012
at an accuracy of 018 This quantification of differences between pipelines now directly permits to
assess the effect of changes in workflows and individual experiments
COMPARISON BETWEEN DIFFERENT WORKFLOWS When ranking the four pipelines by said precision P3
gives the lowest value with 129 followed by P4 with 164 P1 with 198 and P2 with 214 However
a sample-specific global target-performance comparison is not the strongest criteria for evaluating
performance differences at transcript resolution For this purpose the apparent differential
expression shows if similar errors are caused by the same or different transcripts The highest
concordance was found between P3 and P1 (labelled P3P1) calculated as standard deviation of all
SIRV LFCs with 101 followed by P4P3 (104) P4P1 (255) P2P1 (288) and P3P2 (309) The
lowest concordance has P4P2 with a value of 412 One section of the resulting heat map for both
extremes is shown in Tab 1C
not peer-reviewed) is the authorfunder All rights reserved No reuse allowed without permission The copyright holder for this preprint (which was httpdxdoiorg101101080747doi bioRxiv preprint first posted online Oct 13 2016
Spike-In RNA variant controls for RNA-Sequencing bioRxiv upload 2016-10-13
15
Table 1 ǀ Variance heat map of SIRV concentration measures detailing SIRV6 by the 4 different
pipelines P1 to P4 A) Given are SIRV transcript identifier SubMix (SM) color code and transcript
lengths (in nucleotides) B) Heat maps showing the log-fold changes (LFC) for the comparison of the
normalized expected and measured SIRV concentrations as a result from the four data evaluation
pipelines P1 to P4 evaluating E0 E1 and E2 Fields with -1 le LFC le 1 are filled with gradient green all
fields with LFC lt -1 with straight blue and all fields with LFC gt 1 with straight red C) From all 6
possible pairwise comparisons P2P1 P3P1 to P4P3 of the normalized measured SIRV
concentrations the one with the smallest (P3P1) and largest (P4P2) median of all LFC are shown
The complete heat map is shown in the suppl Tab S2
not peer-reviewed) is the authorfunder All rights reserved No reuse allowed without permission The copyright holder for this preprint (which was httpdxdoiorg101101080747doi bioRxiv preprint first posted online Oct 13 2016
Spike-In RNA variant controls for RNA-Sequencing bioRxiv upload 2016-10-13
16
The same pipeline comparisons were made with either all endogenous transcripts or the ones in the
higher SIRV expression range and compared to the pipeline concordances calculated with the SIRV
controls (Fig 5) We define the first bin with ǀLFCǀ lt 1 as the bin of no apparently differentially
expressed transcripts independent of the corresponding p-values The other bins contain transcripts
for which the calculated concentrations differ by more than 2-fold hence convene apparently
differentially expressed transcripts (DE) We find that SIRV controls and endogenous transcripts are
evaluated coherently While theoretically no differences are expected pipelines P3 and P1 differ in
their quantification of the same data by 44 for the SIRVs and by 69 for endogenous RNAs in the
SIRV concentration range (Fig 5A) Pipelines P2 and P4 differ to a larger extent when evaluating the
same samples (Fig 5B C) The same correlation is seen in comparisons between different samples
(shown here for RC-0 vs RC-1) The expected DE between reference RNAs UHRR and HBRR of
approximately 50 is evaluated differently by P3 vs P1 (DE of 24 ) and this is mirrored in the
evaluation of the SIRV mixes spiked into these reference RNAs (DE of 49 ) P4 vs P2 performed
worse with a pipeline difference of 39 and 103 for endogenous and SIRV transcripts The
controls show a highly similar increase when comparing P3P1 with P4P2 (21-fold from 49 to
103 ) to the endogenous RNAs (16-fold from 24 to 39 ) Here the average measurement
using the same pipeline provide a pseudo-ground truth which is compared to the measurement
using different pipelines It allows to quantify the additional error caused solely by changes in the
pipeline A change from pipeline P3 to P1 would increase the number of DE-detected transcripts to a
smaller extent than a change from P2 to P4 and this is true for both the SIRV controls and the
endogenous transcripts
not peer-reviewed) is the authorfunder All rights reserved No reuse allowed without permission The copyright holder for this preprint (which was httpdxdoiorg101101080747doi bioRxiv preprint first posted online Oct 13 2016
Spike-In RNA variant controls for RNA-Sequencing bioRxiv upload 2016-10-13
17
Figure 5 ǀ SIRV and endogenous mRNA expression analyses are affected similarly when changing
data evaluation pipelines Binned apparent LFC-moduli are shown in histograms when comparing
results obtained by different pipelines evaluating identical NGS data sets from A C) the same
samples or B D) different samples Exemplarily the comparison with the best P3 vs P1 (black
symbols) and the worst agreement P4 vs P2 (red symbols) are shown The charts compare side-by-
side the results from the SIRV controls (green) all endogenous transcripts (black outline) and
endogenous transcripts within the medium-to-high concentration range of 10 to 2250 TPM or FPKM
(blue) The average of all intra-pipeline results are shown in grey The differences Δ between
not peer-reviewed) is the authorfunder All rights reserved No reuse allowed without permission The copyright holder for this preprint (which was httpdxdoiorg101101080747doi bioRxiv preprint first posted online Oct 13 2016
Spike-In RNA variant controls for RNA-Sequencing bioRxiv upload 2016-10-13
18
analyses with the same and with different pipelines show the losses in the bins 0 lt ǀLFCǀ lt 1 and the
corresponding gain in the other bins ǀLFCǀ gt 1 The increase of the FP-rate purely caused by the
pipeline changes vs the TP range is given in the summary graphs E and F) The 1st bins 0 lt ǀLFCǀ lt 1
are divided into two 0 lt ǀLFCǀ lt 05 and 05 lt ǀLFCǀ lt 1 which facilitates the easier tracking of the
results from the SubMixes4 as shown in Fig 4 were in both figures the 1st fraction is signed with 1b
DISCUSSION
We report a significant contribution to the external RNA controls toolbox in the form of Spike-In RNA
Variants (SIRVs) that address transcription variation and alternative splicing The highly defined mixes
of 69 transcripts aligning to 7 genes enable accurate target-performance evaluations of gene
expression analysis methods which is not possible eg by analyzing larger but only loosely defined
pools of in vitro transcripts (Lahens et al 2014) or limited sets addressing special problems like
fusion genes (Tembe et al 2014) The results presented here demonstrate that the condensed
complexity of the SIRV controls mimic very closely main properties of endogenous mRNAs when
analyzing high-throughput RNA sequencing workflows for their capabilities to determine transcript
variants and their relative quantities The responses of the SIRV controls to changes in the workflows
allow to extrapolate measures for the accuracy precision and foremost inter-experiment
comparability (concordance) to the large pool of endogenous RNAs With the help of the external
controls we could confirm that biases in sequence coverage could mostly be balanced by the
exemplary chosen data evaluation algorithms and for the majority of transcripts consistent relative
abundances were obtained However in our most concordant same sample pipeline comparison
P3P1 already 44 of the controls and 69 of the endogenous RNAs in the medium to high
concentration range appeared to be differentially expressed although none of those were true
positives (TP) because the reductio ad absurdum same sample comparison was using the very same
sets of NGS reads In consequence more than 700 potential endogenous mRNA leads would be non-
validatable false positives (FP) only because of a change in data evaluation pipelines With a
not peer-reviewed) is the authorfunder All rights reserved No reuse allowed without permission The copyright holder for this preprint (which was httpdxdoiorg101101080747doi bioRxiv preprint first posted online Oct 13 2016
Spike-In RNA variant controls for RNA-Sequencing bioRxiv upload 2016-10-13
19
difference between P4 and P2 of 12 at the level of endogenous RNAs an extra 1200 FPs would
obscure the evaluation
The inter-sample comparison between UHRR and HBRR presents a rather extreme case
where around half of all transcripts were calculated to differ by more than 2-fold However the
relative FPTP weight of both comparisons remains similar as P4P2 shows again clearly higher FP-
rates in both controls and endogenous RNAs The linear interpolation (Fig 5E) allows to estimate the
effect of the experimental changes to relative small number of differences as they would be seen in
typical RNA-Seq experiments Exemplarily highlighted are the intersections at 002 and 01 in Fig 5F
TP call rates and FPTP ratios are the important figures to estimate the likelihood and inversely
related effort to validate differentially expressed transcripts For the P3P1 comparison at 2 TP we
approximate an FPTP ratio of 289 The likelihood to actually validate DE transcripts under such
circumstances would reach 035 For the P4P2 comparison the TPFP ratio estimates to mere 014
The related risks and often substantial costs for deducing potential biomarkers would be 25 times
higher Although we demonstrated in the presented example the influence of changes in data
evaluation pipeline within an integrated RNA-Seq workflow the same principles apply to the front
end - the RNA treatment NGS library preparation and sequencing Here unintended variations in
particular sample preparations can only be detected by these external spike-in controls which
operate as markers and reference spots By these means SIRV controls increase the comparability
within and between sequencing experiments at the transcript isoform level SIRVs are designed for
the co-development improvement and monitoring of library preparations sequencing and data
processing
Outlook The presented module and the 92 ERCCs which probe the wide dynamic range using
monocistronic transcripts can be stepwise extended in the future by a) ca 15 poly(A)-tail variations
of monocistronic sequences with defined lengths of 20 and 30 adenosines as well as polyadenylated
and purified RNAs with poly(A)-tail lengths close to 50 100 and above 200 nucleotides b) around 12
above-average long RNAs with 3 5 7 and 10 kb c) approx 3 RNAs each with a low medium and
not peer-reviewed) is the authorfunder All rights reserved No reuse allowed without permission The copyright holder for this preprint (which was httpdxdoiorg101101080747doi bioRxiv preprint first posted online Oct 13 2016
Spike-In RNA variant controls for RNA-Sequencing bioRxiv upload 2016-10-13
20
high GC-content d) a set of 13 mRNA relevant chemical modifications most prominent the cap-
structure (Bokar and Rottman 1998) e) variants which cover aspects of SNPs alleles inversions and
fusion genes which needs to be accounted for in the corresponding sequence annotation files and f)
a random set of small and micro RNAs that comprise all sequence variations at their termini to
account for ligation biases The external control modules need to be fine-tuned with respect to the
dynamic concentration and concentration ratio range and the reference annotations must provide a
mixture of correctly over- and under-annotated genes to better emulate the challenging conditions
for bioinformatical data evaluation Both optimizations will also further increase the congruence of
the presented SIRV module with the endogenous RNAs Eventually all modules together would
develop into a comprehensive set of approximately 250 long RNA controls plus a microRNA module
which will become sufficient for calibration and normalization purposes This new estimate reduces
the scope of designing better spike-in controls compared to the maybe thousands of IVTs which have
been previously anticipated (Kratz and Carninci 2014)
METHODS
SIRV DESIGN AND IN SILICO ANALYSIS The gene structures of seven human model genes
(KLK5 LDHD LGALS17A DAPK3 HAUS5 USF2 and TESK2) were used as scaffold for the design of
SIRV1 to SIRV7 The ENCODE-annotated transcripts as well as added variants were edited to
represent in a redundant and comprehensive manner known transcription and alternative splicing
variations (complete gene structures are shown in the odd-numbered suppl Fig from S3 to S15) All
exon sequences descend from a pool of database-derived genomes (gene fragments from viruses
and bacteriophage capsid proteins and glycoproteins selected based on a GC-content in a range of
30-50) which were modified by inverting the sequence to lose identity while maintaining a kind of
naturally occurring order in the sequences Intron sequences that do not align with exons of another
isoform were drawn from random sequences whereby the GC content was balanced to comply with
not peer-reviewed) is the authorfunder All rights reserved No reuse allowed without permission The copyright holder for this preprint (which was httpdxdoiorg101101080747doi bioRxiv preprint first posted online Oct 13 2016
Spike-In RNA variant controls for RNA-Sequencing bioRxiv upload 2016-10-13
21
the adjacent exonic sequences (Random DNA Sequence Generator
httpwwwfacultyucredu~mmadurorandomhtm)
To verify the sequence exclusivity first the exon sequences were blasted against the entire NCBI
database including ERCCs on the nucleotide and protein level (program BLASTN 2229
httpsblastncbinlmnihgov) The default BLAST parameters used were word size 28 expected
threshold 10 Max matches in query rang 20 MatchMismatch Score 1 -2 Gap Costs Linear Filter
Low complexity regions Mask for lookup table only Search of the nucleotide collection resulted for
all SIRVs in ldquono significant similarity foundrdquo Second in silico generated reads (Griebel t al 2012)
(FLUX-Generator httpsammethnetconfluencedisplaySIMHome command line flux-simulator
-p ~hellipFluxsirv1par -t simulator -x -l -s) were mapped to nine individually selected genomes using
TopHat2 (Kim et al 2013) and Bowtie2 (Langmead and Salzberg2012) Because Bowtie2-aligned
reads can be as short as 20 nt the resulting limited number of mapping reads would be deemed to
be not significant in standard NGS work-flows In contrast when mapping reads with the standard
setting of the splicing-aware TopHat2 program not a single read aligned to any of the tested
genomes Given that both searches found no significant matches off-target mapping of the SIRVs can
essentially be ruled out Therefore the artificial SIRV sequences are suitable for noninterfering
qualitative and quantitative assessments in the context of known genomic systems and
complementary to the ERCC sequences (National Institute of Standards and Technology (NIST)
certified DNA plasmids Standard Reference Materialreg 2374) The SIRV sequences can be found at
httpswwwlexogencomsirvssirvsdownloads in the Source Data files and they are also
deposited at the NCBI Nucleotide Database (PRJNA312485)
SIRV CONSTRUCTS AND THE PRODUCTION OF IN-VITRO TRANSCRIPTS Synthetic gene constructs
were produced (Bio Basic Inc Markham ON Canada) that comprised 5rsquo to 3rsquo a unique restriction
site a T7 RNA polymerase promoter whose 3rsquo G is the first nucleotide of the actual SIRV sequence
which is seamlessly followed by a (A30)-tail that is fused with an exclusive 2nd restriction site These
not peer-reviewed) is the authorfunder All rights reserved No reuse allowed without permission The copyright holder for this preprint (which was httpdxdoiorg101101080747doi bioRxiv preprint first posted online Oct 13 2016
Spike-In RNA variant controls for RNA-Sequencing bioRxiv upload 2016-10-13
22
gene cassettes were cloned into a vector colony-amplified and singularized All SIRV sequence in the
purified plasmids were verified by Sanger-sequencing to identify the correct clones The E coli
cultures were grown in batches to obtain plasmids in the lower microg-scale Double digestion of isolated
plasmids with XhoI and NsiI showed correct insert size and complete restriction Linearized silica-
purified plasmids served as templates in in vitro transcription reactions using T7 transcription kits
(AmpliScribe T7 High Yield Transcription Kit and AmpliScribe T7 Flash Transcription Kit Epicentre
Madison WI) The DNase-treated phenol-extracted and silica-purified in vitro transcription products
were assessed for concentration and purity by spectrophotometry (NanoDrop Thermo Fisher
Scientific Waltham MA) and for integrity by capillary electrophoresis (2100 Bioanalyzer RNA 6000
Pico Kit Agilent Technologies Santa Clara CA)
In the context of variant verification RNA integrity is a very important measure Fragments
arising from incomplete transcription might impose errors on the correct determination of variants
which share those sequences and thereby also affect the overall gene coverage The integrity of the
transcription products was very heterogeneous as expected given the broad sequence variation and
the length of the SIRV transcripts (average 11 kb with 14 RNAs between 20 and 25 kb) A majority
of transcripts therefore had to be purified by at least one of two purification methods Purification
method PP1 is selective for poly(A)-tails and neglects prematurely terminated transcription products
Purification method PP2 is based on size-selective quantitative electrophoresis separating the
correctly sized main products from shorter fragments (transcription break off and degraded
products) and longer fragments (run-through transcription products) After purification the 69 SIRV
RNAs were assessed to be on average 736plusmn343 in the pre-peak fraction 9031plusmn372 in the
main-peak fraction (corresponding to RNAs of correct length) and 236plusmn304 in the post-peak
fraction (mass percentages wt) Noteworthy the risks of a beginning degradation during the initial
denaturation (2 min at 70degC) and the not fully denaturing conditions during RNA microcapillary
electrophoresis tiny noise levels in the baseline and slightly different shapes of the main peak result
in a rather over- than underestimation of pre- and post-peak fractions
not peer-reviewed) is the authorfunder All rights reserved No reuse allowed without permission The copyright holder for this preprint (which was httpdxdoiorg101101080747doi bioRxiv preprint first posted online Oct 13 2016
Spike-In RNA variant controls for RNA-Sequencing bioRxiv upload 2016-10-13
23
rRNasin (Promega Madison WI) was added to 08 Umicrol to minimize the risks of RNase
contamination induced RNA degradation The SIRVs were quantified by absorbance spectroscopy to
adjust all stock solutions to a base concentration of close to but above 50 ngmicrol RNA purity was very
high with A 260280 214plusmn012 and A 260230 217plusmn020
SIRV MIXING SIRV mixes were designed that contain pools of SIRVs (SubMixes) in defined
amounts and ratios by combining accurate volumes of the stock solutions in sufficiently large batch
sizes Pipetting errors vary depending on transfer volumes and range from plusmn4 for 2 microl to plusmn08 for
gt100 microl transfers The precision was experimentally determined with blank solutions Starting with
the stock concentration measurement (NanoDrop accuracy plusmn2 ngmicrol for 50 ngmicrol or plusmn4 ) and
accounting for the entire mixing pathway the accumulative concentration error is expected to range
between plusmn8 and plusmn47 Therefore in the data evaluation one has to account for the experimental
fuzziness by allowing for lower accuracy thresholds of plusmn8 on the linear scale or plusmn011 on the log2-
fold scale respectively The SIRV concentration ratios between two mixes are more precise because
only one final pipetting step defines the concentration differences and synchronizes all SIRVs which
belong to the same SubMix Here a maximal error of plusmn4 (or plusmn0057 on the log2-fold scale) can be
expected between SubMixes while all SIRVs of the same SubMix must propagate coherently into the
final mixes Bioanalyzer traces were used to monitor the relative propagation of the SIRVs PreMixes
and SubMixes during the mixing (Fig 2B) In addition the accurate pipetting of the 8 PreMixes was
controlled by checksums of Nanodrop concentration measurements which deviated by only
0002plusmn34 from the calculated target concentrations and by weighing on an analytical balance
which showed a deviation of 18plusmn065 The final concentration of the SIRV mixes are set to be 253
ngmicrol
not peer-reviewed) is the authorfunder All rights reserved No reuse allowed without permission The copyright holder for this preprint (which was httpdxdoiorg101101080747doi bioRxiv preprint first posted online Oct 13 2016
Spike-In RNA variant controls for RNA-Sequencing bioRxiv upload 2016-10-13
24
SPIKING OF REFERENCE RNA WITH SIRV MIXES In general SIRV mixes can be used with crude
cell extracts purified total RNA rRNA-depleted RNA or poly(A)-enriched RNA Important the spike-in
ratios have to be chosen in concordance with the desired final SIRV content the RNA preparation
method and if known the expected mRNA content One widely applicable spike-in ratio can be
obtained by adding 006 ng of controls to approximately 100 ng of total RNA In the presented
examples the total RNA mass of one single aliquot RNA was 100 ng of UHRR in RC-0 and 1128 ng of
HBRR in RC-1 The reference RNA in RC-2 was calculated to be 10427 ng (Fig S2) The high-
concentrated and thereby stable SIRV mix stocks with 253 ngmicrol and ERCC mix stocks with 30 ngmicrol
(ERCC Spike-In Mixes 1 and 2 by Ambion Thermo Fisher Waltham MA) were diluted just prior to the
spiking to facilitate the mixing of manageable volumes For example the final 11000 dilution
reduced the SIRV mix concentration to 253 pgmicrol from which 237 microl were required to spike a 100 ng
total RNA sample with 006 ng SIRVs The RC-samples were produced in large batches to yield
hundreds of samples allowing for a protocol with fewer dilutions and larger volumes reducing
thereby sources of experimental errors
NGS LIBRARY PREPARATION AND SEQUENCING The experiments were carried out in technical
triplicates From 1 microg RC-0 RC-1 or RC-2 RNA in total nine NGS libraries were prepared by Fasteris SA
(Plan-les-Ouates CH) using the TruSeq stranded mRNA library preparation kit with polyA selection
(Illumina Inc San Diego CA) All primary library templates were amplified with 14 PCR cycles to
reach reproducible concentrations 155plusmn45 nM and insert sizes 165plusmn10 bp An equimolar lane-mix
was sequenced at the CSF Campus Science Support Facilities GmbH (CSF Vienna AUT) in PE125
mode in one lane of a HiSeq 2500 flowcell in 125 bp paired-end mode using V4 chemistry The run
yielded 305 M raw reads 293 M after demultiplexing and trimming which corresponds to a read
depth of 326plusmn22 M reads per library
not peer-reviewed) is the authorfunder All rights reserved No reuse allowed without permission The copyright holder for this preprint (which was httpdxdoiorg101101080747doi bioRxiv preprint first posted online Oct 13 2016
Spike-In RNA variant controls for RNA-Sequencing bioRxiv upload 2016-10-13
25
READ PROCESSING AND MAPPING Standard data processing routines (bbduk part of BBMap by
B Bushnell to be found at sourceforgenetprojectsbbmap) were applied removing low quality
reads and trimming adapter sequences Due to variable stringencies the mappers produced different
read statistics STAR mapped against the genome 897plusmn59 of the reads (864plusmn56 uniquely) and
TopHat2 852plusmn57 (794plusmn52 uniquely) Bowtie2 mapped against the transcriptome 693plusmn18
reads (151plusmn15 uniquely)
ESTIMATION OF THE MRNA CONTENTS Based on the obtained read distributions the relative
mass partition between external controls and endogenous RNA fraction can be estimated Because
the library preparation uses a poly(A)-enrichment step the targeted endogenous RNA corresponds
almost exclusively to the mRNA content of the samples The propagation of the input mass ratio to
the output read ratio depends on both the mRNA content and the efficiencies of how controls and
mRNA proceed through the library preparation The relationship is described by Eqn 1
reRNA times prod(1 rconifrasl )
j
i=1
= (EeRNA times meRNA) times prod(1 (Econi times mconi)frasl )
j
i=1
Equation 1
with r number of reads from eRNA the endogenous RNA fraction here mRNA and con the
controls here SIRVs and ERCC E the relative efficiency of how the fraction proceeds through the
workflow and m the input mass
Ratios are measured as relative read counts and the results as a product of efficiencies and
apparent amounts are also relative measures Therefore at least one de facto arbitrary reference
point needs to be defined to deduce comparable absolute results Several reference points or
default values can be defined which lead to different dependent variables and imply slightly variable
interpretation of the results The following three calculation examples are simple deductions from
not peer-reviewed) is the authorfunder All rights reserved No reuse allowed without permission The copyright holder for this preprint (which was httpdxdoiorg101101080747doi bioRxiv preprint first posted online Oct 13 2016
Spike-In RNA variant controls for RNA-Sequencing bioRxiv upload 2016-10-13
26
the ratio shown in Eqn 1 with the ERCC (con1) and the SIRVs (con2) respectively Variation 1 is
explained in greater detail while in the other variants only the differing aspects are highlighted
Variation 1 i) Here the first assumption is that the mRNA content in UHRR (Agilent Santa
Clara CA) is 3 (factor 003) and 2 (factor 002) in HBRR (Ambion Thermo Fisher Waltham MA)
which stays in close agreement to previous estimates concluded from experiments by Shippy et al in
2006 The amounts of total RNA were measured by Nanodrop absorbance spectroscopy The UHRR
samples contained 100 ng and the HBRR samples 1128 ng The mixing ratio of (2times RC-0) (1times RC-1)
determines the concentration of the 3rd sample RC-2 and further the amount of total RNA (10427
ng) as well as its related mRNA content (2times100 ng times 3 + 1times1128 ng times 2 ) (2times100 ng + 1times1128
ng) = 264 (factor 0026) The mRNA masses of the samples are calculated by the measured total
RNA input amounts and default mRNA contents are 3 ng 2256 ng and 2752 ng The second
assumption is that the endogenous mRNAs proceed with the maximal efficiency of 100 (factor 1)
through library preparation and sequencing The input of the spike-in controls is the product of the
concentration values which were either measured as in the case of the SIRV stocks or stated by the
vendor as in the case of the ERCC stocks and the pipetted volumes Both are treated as de facto
measured values
ii) The relative amounts of reads which have been assigned to either endogenous mRNA
ERCCs or SIRVs are obtained from the mapping statistics (read classification)
iii) The ratio of mass input to reads output allows to calculate the propagation efficiency of
the controls relative to the default efficiency of the endogenous mRNA In the present experiment
the SIRVs progress with a relative efficiency of 867plusmn57 and the ERCCs with 416plusmn47 The
significant difference between the relative efficiency of both controls is very likely caused by the
different lengths of the poly(A)-tails which might influence a different binding efficiency during
poly(A)-enrichment step The SIRVs with a 30 nt long poly(A)-tail perform much more in concordance
with the endogenous mRNA as the ERCCs which contain shorter and variable poly(A)-tails ( 23 nt)
The observed small differences in the experiments using RC-0 RC-1 or RC-2 could be caused by a
not peer-reviewed) is the authorfunder All rights reserved No reuse allowed without permission The copyright holder for this preprint (which was httpdxdoiorg101101080747doi bioRxiv preprint first posted online Oct 13 2016
Spike-In RNA variant controls for RNA-Sequencing bioRxiv upload 2016-10-13
27
two-way interference of samples and controls However the deviations are small and can rather be a
result of minor inaccuracies in determining the relative input amounts Both hypotheses would need
to be verified by a series of repeats with the aim to resolve potential influences of pipetting during
the sample preparation variations in the library preparation and other contributions
Variation 2 Here no varying interferences between samples and controls are permitted
which means that relative efficiencies of the controls are considered to be constant The causes of
the experimental variations are exclusively assigned to the input amounts (alike hypothesis two in
the above example in discussing the deviation of the results in RC-2) This would translate into input
standard deviations of 118 (SIRVs) and 76 (ERCCs) The variations meld all accumulating errors
made in determining the concentration of the control stock solutions preparing the subsequent
dilutions pipetting the samples and controls during the spike-in step itself as well as determining the
amount of sample RNA in the first place Against the background of potential errors the calculated
results can be considered as highly consistent
Variation 3 In addition to the assumptions made for the measurement of sample RC-0
the spike-in of 006 ng SIRVs to all samples is also set as default Alike variation 2 the experiments in
RC-1 and RC-2 adopt the same default setting for the relative efficiencies calculated in RC-0
According to the ratio of Eqn 1 one can obtain mRNA contents as well as ERCC input amounts in this
case for samples RC-1 and RC-2 The mRNA content of the HBRR sample (RC-1) relative to the default
mRNA content in the UHRR sample (set to 3 ) would be 172 lower than the previously assumed
2 According to the present mixing scheme it would also imply that sample RC-2 has an mRNA
content of 254 up from the calculated 234 The offsets of -79 is again small and very likely
refers to the level of accuracy in the experimental results as discussed above Using this method the
spiking of samples with controls such as the SIRVs allows to closely estimate the relative mRNA
content of any unknown sample and to draw conclusions eg on the transcriptional state of tissues
cell suspension or individual cells
not peer-reviewed) is the authorfunder All rights reserved No reuse allowed without permission The copyright holder for this preprint (which was httpdxdoiorg101101080747doi bioRxiv preprint first posted online Oct 13 2016
Spike-In RNA variant controls for RNA-Sequencing bioRxiv upload 2016-10-13
28
COEFFICIENT OF DEVIATION We implemented a strand specific Coefficient of Deviation
(CoD) which aims to reflect the quality of NGS pipelines targeted at specific effects in particular
lsquospikenessrsquo of the coverage while systematic effects like drop of the coverage at Transcription Start
Sites (TSS) and Transcription End Sites (TES) are being suppressed The CoD is implemented by Eqn
2
CoD = CoD(LTSSLTES) = sum (cidealp- crealp)2
TESe
p=TSS1
divide sum cidealp
TESe
p=TSS1
Equation 2
which is calculated in strand orientation for contigs along all exonic nucleotide position (p) from the
first annotated TSS (TSS1) up to the last annotated TES (TESe) whereby cideal are the ideal coverages
with the optimized transient regions (LrsquoTSS LrsquoTES) and creal are the real coverages scaled as such that
the total integrals along all positions of ideal and real coverages are equal
The transient function at TSS and TES is the error function erf(x) which corresponds to
Cufflinks assumption about normally distributed fragment lengths (Trapnell et al 2012) Since erf(x)
is a non-algebraic function we used the algebraic approximation by Abramowitz and Stegun
(httpsenwikipediaorgwikiError_function eq 7125) Once the optima (LrsquoTSS LrsquoTES ) are found
we declare CoD(LrsquoTSS LrsquoTES) to be the ultimate CoD value which mostly eliminated the transient region
effects We implemented an optimization algorithm (Nelder-Mead downhill simplex method) and
used as starting values (L0TSS L0
TES ) lengths of 150 In some cases the optimum found can be beyond
a reasonable range of values Therefore we censor the output Lopt of the mathematical optimization
as follows Lcensored = 50 if Lrsquo lt 50 Lcensored = 350 if Lrsquo gt 350 This corresponds to the maximal range of
not peer-reviewed) is the authorfunder All rights reserved No reuse allowed without permission The copyright holder for this preprint (which was httpdxdoiorg101101080747doi bioRxiv preprint first posted online Oct 13 2016
Spike-In RNA variant controls for RNA-Sequencing bioRxiv upload 2016-10-13
29
200plusmn150 This censoring needed to be applied in 8 cases out of 84 SIRVmixstrandend
combinations ie less than in 10
TRANSCRIPT CONCENTRATION MEASUREMENTS In order to estimate expression values on
transcript levels we applied RSEM (Li and Dewey 2011) which uses a Bayesian Network to compute
the likelihood of each fragment belonging to a given transcript Salmon (Patro et al 2015) estimates
the transcript expression values by a k-mer based mapping Similar to RSEM it uses an expectation-
maximization (EM) algorithm to compute the maximum likelihood of relative abundances Cufflinks2
(Trapnell et al 2013) estimates the transcript abundances with a coverage-based maximum
likelihood approach It determines the probability of read assignments to isoforms
DIFFERENTIAL EXPRESSION ANALYSIS We used the DESeq2 package (Love et al 2014) for
calculation of fold-differences between the results from different pipelines and different input samples
mixtures As explained in the main text all outputs from the evaluated pipelines (in form of relative
concentration measures) have been scaled Scaling by linear transformation is needed as a
consequence of the different mRNA contents in the samples but also to eventually compensate any
potential pipetting errors when small aliquots typically in the range of very few microliter are added
to individual samples The RC-samples in this experiment were produced in a large batch to ensure
high accuracy in volumetric ratios The main sample pool is practically invariant to the small relative
contribution of the controls but was technically treated in the same way by scaling the main sample
pools to identical sizes First SIRV concentrations were scaled to reach together 69 in E0 685 in E1
and 708 in E2 which is the dimensionless value identical to the fmolmicrol in the respective SIRV stock
solutions Then the lower threshold was set to 10-6 which corresponds to original FPKM values of
around 5∙10-3 ⅟7th of one read for a 1 kb long transcript at a read depth of 30 Mio reads or 1 gene
specific read to be divided between 7 equally possible transcript variants at said 1 kb length section
The threshold is to be understood as less than or equal to 10-6 which defines an averaged read
not peer-reviewed) is the authorfunder All rights reserved No reuse allowed without permission The copyright holder for this preprint (which was httpdxdoiorg101101080747doi bioRxiv preprint first posted online Oct 13 2016
Spike-In RNA variant controls for RNA-Sequencing bioRxiv upload 2016-10-13
30
resolution of the particular workflow at the given read depth By these means all ratios remain defined
Second for the DESeq2 calculations we multiplied all values with 106 after which fractions were
rounded to the closest integer We understand that for no-change hypothesis testing which is the
main purpose of the DESeq2 package transforming the relative concentrations (FPKM or TPM) to
lsquoquasi-read-countsrsquo is not recommended since DESeq2 internally corrects for library size by using size
factors However in our application we do not use the probability of the hypothesis rejection (P
values) but the raw fold changes detected (irrespectively of the dispersion values for that given
transcript) We also took into account the potential danger of censoring the input (by unintentionally
eliminating transcripts represented by extremely low FPKM or TPM values) by setting a suitable
threshold as described above The figures show only two differential expression analyses because the
3rd concentration ratio E2E0 is the product of E1E0 and E2E1
ERROR RATE ANALYSIS The four red data points two from the SIRV controls (circles) and two
from the endogenous mRNAs (squares) from the best agreement (P3 vs P1) and the four
corresponding black data points from the worst agreement (P4 vs P2) as shown in fig 5E were fitted
by linear approximation using the relationship as derived for Eqn 3
TP + FP = 1
FP = N times ER = (1-TP) times ER
(TP+FP) = TP + ER - TP times ER
(TP+FP) = (1-ER) times TP + ER Equation 3
where TP is the relative portion of true positives (differentially expressed as in our definition
possessing a LFC gt 1) N the relative portion of negatives ER the error rate at which negatives are
falsely detected as positives to result in false positives FP The least squares fitting method was
applied to derive values for the slope (1-ER) and the intercept ER
not peer-reviewed) is the authorfunder All rights reserved No reuse allowed without permission The copyright holder for this preprint (which was httpdxdoiorg101101080747doi bioRxiv preprint first posted online Oct 13 2016
Spike-In RNA variant controls for RNA-Sequencing bioRxiv upload 2016-10-13
31
The transformation of Eqn 3 leads to the relationship of Eqn 4
TP FPfrasl = (TP+FP) TPfrasl -1 Equation 4
which has been used for the graph in fig 5F In the present context the concept of ROC-curves is not
applicable because the true or false negatives are indistinguishable as long the ground truth of the
endogenous RNA are unknown
DATA ACCESS Sequencces and source data files data are in the process to be deposited at
NCBI under BioProject ID PRJNA312485
ACKNOWLEDGMENTS We thank SA Munro and M Salit (Material Measurement
Laboratory National Institute of Standards and Technology) for their efforts in further developing the
concepts of the External RNA Control Consortium (ERCC) in an updated suite of RNA controls and
analysis methods called ERCC 20 We thank A Tuerk for his contributions in finding suitable human
model genes G Wiktorin for carrying out the RSEM calculations M Mihaylova in helping with the
graphics design and I Gabler for critically reading the manuscript
AUTHOR CONTRIBUTIONS LP PK and TR designed the sequences and mixtures PK and GH
prepared the in vitro transcripts and spike-in mixtures TR AS and LP designed the research and
the experiments MA IH and TR evaluated the data TR and LP wrote the manuscript
DISCLOSURE DECLARATION The authors are employees of Lexogen GmbH from which the SIRVs
can be bought and AS has equity stakes in Lexogen GmbH LP PK and TR are named as
not peer-reviewed) is the authorfunder All rights reserved No reuse allowed without permission The copyright holder for this preprint (which was httpdxdoiorg101101080747doi bioRxiv preprint first posted online Oct 13 2016
Spike-In RNA variant controls for RNA-Sequencing bioRxiv upload 2016-10-13
32
inventors on a patent application regarding the production and use of RNA transcript variants and
Lexogen GmbH is the owner of this patent application
REFERENCES
Baker SC Bauer SR Beyer RP Brenton JD Bromley B Burrill J Causton H Conley MP Elespuru R Fero M et al 2005 The External RNA Controls Consortium a progress report Nat Methods 2(10) 731-4 Bokar JA Rottman FM 1998 Biosynthesis and Functions of Modified Nucleosides in Eukaryotic mRNA In Modification and Editing of RNA (eds Grosjean H Benne R) pp 183-200 ASM Press Washington DC Dobin A Davis CA Schlesinger F Drenkow J Zaleski C Jha S Batut P Chaisson M Gingeras TR 2013 STAR ultrafast universal RNA-seq aligner Bioinformatics 29(1) 15-21 Fed Reg Doc 2015-19742 2015 External RNA Controls Consortium - Call for Participation and Contributions to a Sequence Library Federal Register Citation 80 FR 48296 Griebel T Zacher B Ribeca P Raineri E Lacroix V Guigoacute R Sammeth M 2012 Modelling and simulating generic RNA-Seq experiments with the flux simulator Nucleic Acids Res 40(20) 10073-83 Jiang L Schlesinger F Davis CA Zhang Y Li R Salit M Gingeras TR Oliver B 2011 Synthetic spike-in standards for RNA-seq experiments Genome Res 21(9) 1543-51 Kim D Pertea G Trapnell C Pimentel H Kelley R Salzberg SL 2013 TopHat2 accurate alignment of transcriptomes in the presence of insertions deletions and gene fusions Genome Biol 14(4) R36 Kratz A Carninci P 2014 The devil in the details of RNA-seq Nat Biotechnol 32(9) 882-4 Lahens NF Kavakli IH Zhang R Hayer K Black MB Dueck H Pizarro A Kim J Irizarry R Thomas RS et al 2014 IVT-seq reveals extreme bias in RNA sequencing Genome Biol 15(6) R86 Langmead B Salzberg SL 2012 Fast gapped-read alignment with Bowtie 2 Nat Methods 9(4) 357-9 Li B Dewey CN 2011 RSEM accurate transcript quantification from RNA-Seq data with or without a reference genome BMC Bioinformatics 12 323 Li J Jiang H Wong WH 2010 Modeling non-uniformity in short-read rates in RNA-Seq data Genome Biol 11 R50 Li S Tighe SW Nicolet CM Grove D Levy S Farmerie W Viale A Wright C Schweitzer PA Gao Y et al 2014 Multi-platform assessment of transcriptome profiling using RNA-seq in the ABRF next-generation sequencing study Nat Biotechnology 32 915-25 Love MI Huber W Anders S 2014 Moderated estimation of fold change and dispersion for RNA-seq data with DESeq2 Genome Biol 15(12) 550
not peer-reviewed) is the authorfunder All rights reserved No reuse allowed without permission The copyright holder for this preprint (which was httpdxdoiorg101101080747doi bioRxiv preprint first posted online Oct 13 2016
Spike-In RNA variant controls for RNA-Sequencing bioRxiv upload 2016-10-13
33
Mortazavi A Williams BA McCue K Schaeffer L Wold B 2008 Mapping and quantifying mammalian transcriptomes by RNA-Seq Nat Methods 5(7) 621-8 Patro R Duggal G Kingsford C 2015 Accurate fast and model-aware transcript expression quantification with Salmon bioRxiv preprint doi httpdxdoiorg101101021592 Shippy R Fulmer-Smentek S Jensen RV Jones WD Wolber PK Johnson CD Pine PS Boysen C Guo X Chudin E et al 2006 Using RNA sample titrations to assess microarray platform performance and normalization techniques Nat Biotechnol 24(9) 1123-31 SEQCMAQC-III Consortium 2014 A comprehensive assessment of RNA-seq accuracy reproducibility and information content by the Sequencing Quality Control Consortium Nat Biotechnology 32 903-14 Tembe WD Pond SJ Legendre C Chuang HY Liang WS Kim NE Montel V Wong S McDaniel TK Craig DW Carpten JD 2014 Open-access synthetic spike-in mRNA-seq data for cancer gene fusions BMC Genomics 15 824 Trapnell C Roberts A Goff L Pertea G Kim D Kelley DR Pimentel H Salzberg SL Rinn JL Pachter L 2012 Differential gene and transcript expression analysis of RNA-seq experiments with TopHat and Cufflinks Nat Protoc 7(3) 562-78 Trapnell C Hendrickson DG Sauvageau M Goff L Rinn JL Pachter L 2013 Differential analysis of gene regulation at transcript resolution with RNA-seq Nat Biotechnol 31(1) 46-53 van Dijk EL Jaszczyszyn Y Thermes C 2014 Library preparation methods for next-generation sequencing tone down the bias Exp Cell Res 322(1) 12-20 Wang Z Gerstein M Snyder M 2009 RNA-Seq a revolutionary tool for transcriptomics Nat Rev Genet 1 57-63 Zheng W Chung LM Zhao H 2011 Bias detection and correction in RNA-Sequencing data BMC Bioinformatics 12290
not peer-reviewed) is the authorfunder All rights reserved No reuse allowed without permission The copyright holder for this preprint (which was httpdxdoiorg101101080747doi bioRxiv preprint first posted online Oct 13 2016
Spike-In RNA variant controls for RNA-Sequencing bioRxiv upload 2016-10-13
4
RESULTS
SIRVS DESIGN The SIRVs were modelled on 7 human genes whose annotated transcripts
were extended by exemplary isoforms to yield between 6 and 18 transcript variants for each gene
and 69 transcripts in total (general design overview in Suppl Fig S1) They comprehensively address
start- and end-site variations alternative splicing overlapping genes and antisense transcription Fig
1A illustrates how the human gene KLK5 served as a blue print for the design of the gene SIRV1 with
its 8 transcript variants (gene structures of SIRV2 to SIRV7 are shown in the odd-numbered suppl
Figures from S5 to S15) The SIRV genes model in a condensed and redundant manner all currently
known transcription and alternative splicing variations (summary in Fig 1B) The transcripts range in
length from 191 to 2528 nt (119909 1134 nt 813 nt) and contain an additional 30 nt long poly(A)-tail
The GC-content varies between 295 and 512 ( 430 436 ) The exon sequences were
created from a pool of database-derived genomes and modified by inverting the sequence to lose
identity while maintaining a naturally occurring order in the sequences The splice junctions conform
to 969 to the canonical GT-AG exon-intron junction rule with few exceptions harboring the less
frequently occurring variations GC-AG (17 ) and AT-AC (06 ) Two non-canonical splice sites CT-
AG and CT-AC account for 04 each The exon sequences were blasted against the entire NCBI
database on the nucleotide and on the protein level and mapped using in silico generated reads
Because no significant matches were found off-target mapping is de facto absent Therefore the
artificial SIRV sequences are suitable for non-interfering qualitative and quantitative assessments in
known genomic systems and they are complementary to the ERCC sequences
not peer-reviewed) is the authorfunder All rights reserved No reuse allowed without permission The copyright holder for this preprint (which was httpdxdoiorg101101080747doi bioRxiv preprint first posted online Oct 13 2016
Spike-In RNA variant controls for RNA-Sequencing bioRxiv upload 2016-10-13
5
Figure 1 ǀ Deriving SIRV1 from model gene KLK5 and classification of implemented transcript
isoform features
A) Schematic view of the human Kallikrein-related peptidase 5 gene (KLK5) Ensembl annotation
(GRCh38p2) which served as model for SIRV1 The condensed exon-intron structure and the
annotated transcript isoforms are shown in the upper grey section SIRV1 comprises 8 transcript
variants shown in blue The transcript orientations are indicated by arrows just upstream of the
not peer-reviewed) is the authorfunder All rights reserved No reuse allowed without permission The copyright holder for this preprint (which was httpdxdoiorg101101080747doi bioRxiv preprint first posted online Oct 13 2016
Spike-In RNA variant controls for RNA-Sequencing bioRxiv upload 2016-10-13
6
poly(A)-tails highlighted in red B) The occurrences of the different transcription and splicing events
are counted for each transcript in reference to a hypothetical master transcript which contains all
exon sequences from all transcript variants of a given gene (outlined next to ldquoSIRV 1rdquo in A)) Therefore
no intron retention can occur and exon splitting has been defined to be understood as introduction of
an intron sequence
PRODUCTION OF SIRV MIXES The SIRVs were produced by in vitro transcription (IVT) from
linearized plasmids yielding SIRV RNAs of high purity but varying integrity Since the SIRV transcripts
represent isoforms with overlapping sequences break-down products of SIRV RNAs can potentially
affect the detection and quantification of other isoforms Therefore a set of tailored purification
procedures was applied to obtain full-length RNAs with a minimal amount of side products despite
the broad sequence and length variation of the SIRVs (Fig 2A) By capillary electrophoresis
(Bioanalyzer Agilent) the purified SIRV RNAs were assessed to be at least to 9031plusmn372 of correct
length Each SIRV transcript entered the final mixes via one of eight PreMixes allowing for the unique
identification of each SIRV by capillary electrophoresis (Fig 2B) The PreMixes were merged pairwise
in equal amounts to yield four SubMixes which were then combined in defined volumetric ratios to
create the final mixes The experimentally determined cumulative pipetting error for individual SIRVs
is smaller than plusmn8 while the applied SubMix scheme limits the maximum error for differential gene
expression experiments to only plusmn4 Bioanalyzer traces were used to monitor the relative
propagation of the SIRVs in Pre- and SubMixes during the staged mixing (Fig 2B) The mix E0
maintains equimolar SIRV concentration ratios E1 contains a maximum concentration difference of
8-fold (close to one order of magnitude) and E2 comprises a concentration difference of up to 128-
fold The inter-mix concentration ratios range from 164- to 16-fold (Fig 2C)
not peer-reviewed) is the authorfunder All rights reserved No reuse allowed without permission The copyright holder for this preprint (which was httpdxdoiorg101101080747doi bioRxiv preprint first posted online Oct 13 2016
Spike-In RNA variant controls for RNA-Sequencing bioRxiv upload 2016-10-13
7
Figure 2 ǀ SIRV RNA integrity and mixing scheme
A) Examples of high SIRV integrity T7 transcription of SIRV612 yielded RNA of almost uniform correct
length with 4924 in the pre- main- and post-peak fractions as analyzed by Bioanalyzer RNA
6000 Pico Chip (Agilent) capillary electrophoresis The lower integrity of SIRV101 and SIRV203 after T7
transcription (blue traces) was increased using tailored purification protocols PP1 and PP2 (red
traces) Finally the integrity of all SIRVs was ge85 wt with on average 903plusmn37 wt in the main peak
fraction B) 8 PreMixes received in equimolar entities between 6 and 11 SIRVs which varied in length
to be unambiguously traced in Bioanalyzer runs PreMixes were combined pairwise in equal ratios to
yield SubMixes The resulting 4 SubMixes were combined in defined ratios to obtain the final Mixes
not peer-reviewed) is the authorfunder All rights reserved No reuse allowed without permission The copyright holder for this preprint (which was httpdxdoiorg101101080747doi bioRxiv preprint first posted online Oct 13 2016
Spike-In RNA variant controls for RNA-Sequencing bioRxiv upload 2016-10-13
8
E0 E1 and E2 Measured traces are shown in red and traces computed from the PreMix traces to
validate the composition of the SubMixes and final Mixes are shown in blue A color code for the
SubMixes is introduced to follow groupings of SIRVs throughout the subsequent data analysis C)
Graphical representation of the relative SIRV concentrations and concentration ratios according their
SubMix belonging The total molarity and weight of the final mixes are evenly balanced at 697
fmolmicrol and 253 ngmicrol
Three different samples with SIRVs RC-0 RC-1 and RC-2 (for details see methods section) were
prepared NGS libraries generated and sequenced in paired-end 125 bp mode
NGS DATA EVALUATION All demultiplexed NGS reads were mapped to the human
genome (GRCh38p2) the ERCC sequences and the SIRVome by using the common splice-aware
aligners STAR (Dobin et al 2012) TopHat2 (Kim et al 2013) while Bowtie2 (Langmead and Salzberg
2012) was used to map reads to a set of accordingly generated transcript sequences Bowtie2 aligned
reads were further processed by RSEM (Li and Dewey 2011) a combination referred to below as data
evaluation pipeline P1 Salmon is an autarkic program algorithm (Patro et al 2015) referred to as P2
STAR as well as TopHat2 aligned reads were further processed by Cufflinks2 (Trapnell et al 2012)
and resemble the evaluation pipelines P3 and P4
ESTIMATION OF THE MRNA CONTENTS On the basis of the assumption that the RNAs in the
samples and the spike-in controls are equally targeted by the library preparation due to similar
length distributions (SIRV 1129plusmn15 nt ERCC 880plusmn26 nt and based on the P4 results UHRR 1538 nt
and HBRR 1641 nt) the relative mass partition between controls and endogenous RNA can be
determined The propagation of the input amounts to the output read ratio depends on the mRNA
content and the relative recovery efficiencies of controls and mRNA after the library preparation
Therefore one reference value needs to be defined or externally determined which we chose to be
not peer-reviewed) is the authorfunder All rights reserved No reuse allowed without permission The copyright holder for this preprint (which was httpdxdoiorg101101080747doi bioRxiv preprint first posted online Oct 13 2016
Spike-In RNA variant controls for RNA-Sequencing bioRxiv upload 2016-10-13
9
an mRNA content of 3 in UHRR (Shippy et al 2006) We further set the efficiency of the
endogenous mRNA proceeding through this particular library preparation to 100 The SIRVs can
then be calculated to progress with a relative efficiency of 870plusmn6 allowing to determine the
mRNA content in the second sample HBRR to be 172 The mRNA content in the mixed samples
RC-2 is then assessed to be 234 which corresponds to a minor -91 offset relative to the
theoretical outcome based on the RC-0 and RC-1 measurements In the TruSeq library preparation
the 30 nt long poly(A)-tail of the SIRVs ensures an enrichment similar to the endogenous mRNAs The
ERCC controls show a lower recovery efficiency of 416plusmn47 most likely due to their shorter poly(A)-
tails which vary between 19 and 25 adenines ( 23 nt) The results are summarized in suppl Tab S1
COMPARISON BETWEEN EXPECTED AND MEASURED COVERAGE AND CONCENTRATION MEASURES For the first
time the ground truth of complex input sequences is available allowing detailed target-performance
comparisons for read alignment relative abundance calculation and differential expression
determination Fig 3 shows for one example gene SIRV 3 in E0 the expected coverages and counts
of the telling junctions together with the coverages obtained by STAR and TopHat2 mapping NGS
workflow-specific read start-site distributions lead to coverage patterns with inherent terminal
deficiencies for which the expected coverage has been adjusted accordingly However in the
measured coverages these systematic start- and end-site biases are accompanied by a variety of
biases which introduce severe local deviations from the expected coverage
not peer-reviewed) is the authorfunder All rights reserved No reuse allowed without permission The copyright holder for this preprint (which was httpdxdoiorg101101080747doi bioRxiv preprint first posted online Oct 13 2016
Spike-In RNA variant controls for RNA-Sequencing bioRxiv upload 2016-10-13
10
Figure 3 ǀ Comparison of the expected and the measured coverages for the SIRV3 locus in mix E0
A) Individual transcripts of SIRV3 with transcripts on the plus strand in blue and in red for the ones on
the minus strand Color code indicates the SubMix allocation B) The expected SIRV3 coverage is
shown as superposition of individual transcript coverages in which the terminal sites have been
modelled by a transient error function The measured coverages after read mapping by TopHat2 are
shown in grey The measured coverages and number of splice junction reads were normalized to
obtained identical areas under the curves and identical sums of all junctions for the expected and
measured data The measured splice junction reads are shown by the numbers before the brackets
not peer-reviewed) is the authorfunder All rights reserved No reuse allowed without permission The copyright holder for this preprint (which was httpdxdoiorg101101080747doi bioRxiv preprint first posted online Oct 13 2016
Spike-In RNA variant controls for RNA-Sequencing bioRxiv upload 2016-10-13
11
while the expected values are shown inside the brackets The CoD values are given for the plus and
minus strand in the respective colors C) Differences between mapping by STAR aligner and TopHat2
The black arrows indicate the direction of positive differences Percentages refer to the relative
changes of the measured splice junction reads
To obtain a comparative measure gene-specific coefficients of deviation CoD were calculated CoDs
describe the often hidden biases in the sequence data predominantly caused by an inhomogeneous
library preparation but also by the subsequent sequencing and mapping In the presented example
the stranded TruSeq library preparation with the Illumina HiSeq2500 sequencing and mapping by
TopHat2 results in a mean CoD of 0190plusmn0193 across all SIRVs For the sense oriented SIRVs the
mean CoD is 0275plusmn0223 and for the antisense SIRVs which cover a region of fewer overlapping
transcript annotations the mean CoD is 0090plusmn0076 The coverage target-performance comparison
highlights the inherent difficulties in deconvoluting read distributions to correctly identify transcript
variants and determine concentrations The distribution of telling reads splice junctions and reads
towards the termini are references for the assignment of the remaining reads before calculating
relative transcript variant abundances Not surprisingly although the majority of junction counts
correlates well with the expected values the high CoD values indicate that numerous telling reads
deviate significantly within the context of the individual mixes They also differ between mixes which
affects differential expression measurements (see Fig 3B and for the coverage of all seven SIRV
genes the even suppl Fig from S4 to S16)
The CoD does not allow to distinguish between periodicity and randomness in the biases nor
does it forecast how well a data evaluation strategy can cope with the bias contributions
Nevertheless smaller CoD values are expected to correlate with a simpler and less error-prone data
evaluation The CoD values can be taken as a first indicative measure to characterize the mapped
data and to compare data sets for similarity up to this point in the workflow Target-performance
comparisons of all SIRV genes in all three mixes can be found in the supplemental information
not peer-reviewed) is the authorfunder All rights reserved No reuse allowed without permission The copyright holder for this preprint (which was httpdxdoiorg101101080747doi bioRxiv preprint first posted online Oct 13 2016
Spike-In RNA variant controls for RNA-Sequencing bioRxiv upload 2016-10-13
12
The above described four data analysis pipelines P1 to P4 were used to calculate transcript
abundances for 69 SIRV and 196˙165 annotated endogenous transcripts All obtained results are
relative concentration measures yielding either Fragments Per Kilobase of exon per Million
fragments mapped (FPKM) (Mortazavi 2008) or Transcripts Per Million (TPM) (Li and Dewey 2011)
The concentrations were scaled by linear transformation in such way that all SIRVs together reach 69
in E0 685 in E1 and 708 in E2 which is the dimensionless value identical to the fmolmicrol in the
respective SIRV stock solutions In consequence the relative quantities of the SIRVs are compatible
to the normalized scale which was introduced in Fig 2C Boxplots in Fig 4 show exemplarily the SIRV
concentrations and two discrete differentials as measured by P3 (results from P1 P2 and P4 are
shown in suppl Fig S17 and standard correlation plots of the four pipelines are shown in suppl Fig
S18) The majority of all SubMix mean concentration values are in concordance with the expected
values The concentration ratios simulating differential expression measurements are less prone to
systematic offsets and show by trend narrower distributions However these correlations highlight
already the issue of obvious and frequent outliers ie transcript variants that are not well resolved
not peer-reviewed) is the authorfunder All rights reserved No reuse allowed without permission The copyright holder for this preprint (which was httpdxdoiorg101101080747doi bioRxiv preprint first posted online Oct 13 2016
Spike-In RNA variant controls for RNA-Sequencing bioRxiv upload 2016-10-13
13
Figure 4 ǀ Box plot overview of calculated concentration values for SIRV mixes and mix ratios
Reads from SIRV mixes E0 E1 and E2 were processed by four different data evaluation algorithms for
transcript quantification Results derived by pipeline P3 are exemplarily shown in reference to the
known inputs (bars in colors corresponding to the SIRV SubMixes of Fig 2) The black circles mark the
mean and the bold dashes the medians of the data points which are shown in grey the boxes span
the 25 to 75 region of the data points and the black whiskers with connecting lines reach up to the
min and max values and indicate also outliers outside the scale of the graph The comparison E1 vs
E0 from sample RC-1 and RC-0 (2nd row) was used for building the histogram of Fig 5B The shaded
area resembles the 1st bin (0leǀLFCǀle1) while the inner section (b1) comprises the fraction 0leǀLFCǀlt05
where the majority of data points originates from SubMix4 (ratio 11) and some ldquooutliersrdquo from
SubMix2 which were actually spiked in at the ratio 21
Heat maps allow to inspect each SIRV in the context of competing transcripts Tab 1B shows
the abundancies as log2-fold changes LFC relative to the expected values for the example of SIRV 6
LFC values consider relative increases and decreases across all concentration ranges likewise An LFC
window of plusmn011 presents the confidence interval as a result from the currently achievable accuracy
not peer-reviewed) is the authorfunder All rights reserved No reuse allowed without permission The copyright holder for this preprint (which was httpdxdoiorg101101080747doi bioRxiv preprint first posted online Oct 13 2016
Spike-In RNA variant controls for RNA-Sequencing bioRxiv upload 2016-10-13
14
in producing the SIRV mixtures We examine the LFC values uncoupled from the adjusted p-values
which provide a statistical measure of the significance level for apparent differential expression By
these means we prevent pipelines to appear more coherent only due to higher noise levels The
accuracy has been calculated for each SIRV as the mean of the LFCs in all three mixes The precision is
a measure of how consistent SIRVs are quantified and has been calculated as the LFC standard
deviation for each SIRV and further for entire pipelines by using all SIRVs Within the presented
example SIRVs can obtain in all four pipelines high precisions of up to 018plusmn007 and high accuracies
of up to -001plusmn010 (SIRV604) In contrast SIRV612 of similar length has an average precision of
569plusmn368 and an accuracy of -386plusmn270 although it was detected by P2 with a high precision of 012
at an accuracy of 018 This quantification of differences between pipelines now directly permits to
assess the effect of changes in workflows and individual experiments
COMPARISON BETWEEN DIFFERENT WORKFLOWS When ranking the four pipelines by said precision P3
gives the lowest value with 129 followed by P4 with 164 P1 with 198 and P2 with 214 However
a sample-specific global target-performance comparison is not the strongest criteria for evaluating
performance differences at transcript resolution For this purpose the apparent differential
expression shows if similar errors are caused by the same or different transcripts The highest
concordance was found between P3 and P1 (labelled P3P1) calculated as standard deviation of all
SIRV LFCs with 101 followed by P4P3 (104) P4P1 (255) P2P1 (288) and P3P2 (309) The
lowest concordance has P4P2 with a value of 412 One section of the resulting heat map for both
extremes is shown in Tab 1C
not peer-reviewed) is the authorfunder All rights reserved No reuse allowed without permission The copyright holder for this preprint (which was httpdxdoiorg101101080747doi bioRxiv preprint first posted online Oct 13 2016
Spike-In RNA variant controls for RNA-Sequencing bioRxiv upload 2016-10-13
15
Table 1 ǀ Variance heat map of SIRV concentration measures detailing SIRV6 by the 4 different
pipelines P1 to P4 A) Given are SIRV transcript identifier SubMix (SM) color code and transcript
lengths (in nucleotides) B) Heat maps showing the log-fold changes (LFC) for the comparison of the
normalized expected and measured SIRV concentrations as a result from the four data evaluation
pipelines P1 to P4 evaluating E0 E1 and E2 Fields with -1 le LFC le 1 are filled with gradient green all
fields with LFC lt -1 with straight blue and all fields with LFC gt 1 with straight red C) From all 6
possible pairwise comparisons P2P1 P3P1 to P4P3 of the normalized measured SIRV
concentrations the one with the smallest (P3P1) and largest (P4P2) median of all LFC are shown
The complete heat map is shown in the suppl Tab S2
not peer-reviewed) is the authorfunder All rights reserved No reuse allowed without permission The copyright holder for this preprint (which was httpdxdoiorg101101080747doi bioRxiv preprint first posted online Oct 13 2016
Spike-In RNA variant controls for RNA-Sequencing bioRxiv upload 2016-10-13
16
The same pipeline comparisons were made with either all endogenous transcripts or the ones in the
higher SIRV expression range and compared to the pipeline concordances calculated with the SIRV
controls (Fig 5) We define the first bin with ǀLFCǀ lt 1 as the bin of no apparently differentially
expressed transcripts independent of the corresponding p-values The other bins contain transcripts
for which the calculated concentrations differ by more than 2-fold hence convene apparently
differentially expressed transcripts (DE) We find that SIRV controls and endogenous transcripts are
evaluated coherently While theoretically no differences are expected pipelines P3 and P1 differ in
their quantification of the same data by 44 for the SIRVs and by 69 for endogenous RNAs in the
SIRV concentration range (Fig 5A) Pipelines P2 and P4 differ to a larger extent when evaluating the
same samples (Fig 5B C) The same correlation is seen in comparisons between different samples
(shown here for RC-0 vs RC-1) The expected DE between reference RNAs UHRR and HBRR of
approximately 50 is evaluated differently by P3 vs P1 (DE of 24 ) and this is mirrored in the
evaluation of the SIRV mixes spiked into these reference RNAs (DE of 49 ) P4 vs P2 performed
worse with a pipeline difference of 39 and 103 for endogenous and SIRV transcripts The
controls show a highly similar increase when comparing P3P1 with P4P2 (21-fold from 49 to
103 ) to the endogenous RNAs (16-fold from 24 to 39 ) Here the average measurement
using the same pipeline provide a pseudo-ground truth which is compared to the measurement
using different pipelines It allows to quantify the additional error caused solely by changes in the
pipeline A change from pipeline P3 to P1 would increase the number of DE-detected transcripts to a
smaller extent than a change from P2 to P4 and this is true for both the SIRV controls and the
endogenous transcripts
not peer-reviewed) is the authorfunder All rights reserved No reuse allowed without permission The copyright holder for this preprint (which was httpdxdoiorg101101080747doi bioRxiv preprint first posted online Oct 13 2016
Spike-In RNA variant controls for RNA-Sequencing bioRxiv upload 2016-10-13
17
Figure 5 ǀ SIRV and endogenous mRNA expression analyses are affected similarly when changing
data evaluation pipelines Binned apparent LFC-moduli are shown in histograms when comparing
results obtained by different pipelines evaluating identical NGS data sets from A C) the same
samples or B D) different samples Exemplarily the comparison with the best P3 vs P1 (black
symbols) and the worst agreement P4 vs P2 (red symbols) are shown The charts compare side-by-
side the results from the SIRV controls (green) all endogenous transcripts (black outline) and
endogenous transcripts within the medium-to-high concentration range of 10 to 2250 TPM or FPKM
(blue) The average of all intra-pipeline results are shown in grey The differences Δ between
not peer-reviewed) is the authorfunder All rights reserved No reuse allowed without permission The copyright holder for this preprint (which was httpdxdoiorg101101080747doi bioRxiv preprint first posted online Oct 13 2016
Spike-In RNA variant controls for RNA-Sequencing bioRxiv upload 2016-10-13
18
analyses with the same and with different pipelines show the losses in the bins 0 lt ǀLFCǀ lt 1 and the
corresponding gain in the other bins ǀLFCǀ gt 1 The increase of the FP-rate purely caused by the
pipeline changes vs the TP range is given in the summary graphs E and F) The 1st bins 0 lt ǀLFCǀ lt 1
are divided into two 0 lt ǀLFCǀ lt 05 and 05 lt ǀLFCǀ lt 1 which facilitates the easier tracking of the
results from the SubMixes4 as shown in Fig 4 were in both figures the 1st fraction is signed with 1b
DISCUSSION
We report a significant contribution to the external RNA controls toolbox in the form of Spike-In RNA
Variants (SIRVs) that address transcription variation and alternative splicing The highly defined mixes
of 69 transcripts aligning to 7 genes enable accurate target-performance evaluations of gene
expression analysis methods which is not possible eg by analyzing larger but only loosely defined
pools of in vitro transcripts (Lahens et al 2014) or limited sets addressing special problems like
fusion genes (Tembe et al 2014) The results presented here demonstrate that the condensed
complexity of the SIRV controls mimic very closely main properties of endogenous mRNAs when
analyzing high-throughput RNA sequencing workflows for their capabilities to determine transcript
variants and their relative quantities The responses of the SIRV controls to changes in the workflows
allow to extrapolate measures for the accuracy precision and foremost inter-experiment
comparability (concordance) to the large pool of endogenous RNAs With the help of the external
controls we could confirm that biases in sequence coverage could mostly be balanced by the
exemplary chosen data evaluation algorithms and for the majority of transcripts consistent relative
abundances were obtained However in our most concordant same sample pipeline comparison
P3P1 already 44 of the controls and 69 of the endogenous RNAs in the medium to high
concentration range appeared to be differentially expressed although none of those were true
positives (TP) because the reductio ad absurdum same sample comparison was using the very same
sets of NGS reads In consequence more than 700 potential endogenous mRNA leads would be non-
validatable false positives (FP) only because of a change in data evaluation pipelines With a
not peer-reviewed) is the authorfunder All rights reserved No reuse allowed without permission The copyright holder for this preprint (which was httpdxdoiorg101101080747doi bioRxiv preprint first posted online Oct 13 2016
Spike-In RNA variant controls for RNA-Sequencing bioRxiv upload 2016-10-13
19
difference between P4 and P2 of 12 at the level of endogenous RNAs an extra 1200 FPs would
obscure the evaluation
The inter-sample comparison between UHRR and HBRR presents a rather extreme case
where around half of all transcripts were calculated to differ by more than 2-fold However the
relative FPTP weight of both comparisons remains similar as P4P2 shows again clearly higher FP-
rates in both controls and endogenous RNAs The linear interpolation (Fig 5E) allows to estimate the
effect of the experimental changes to relative small number of differences as they would be seen in
typical RNA-Seq experiments Exemplarily highlighted are the intersections at 002 and 01 in Fig 5F
TP call rates and FPTP ratios are the important figures to estimate the likelihood and inversely
related effort to validate differentially expressed transcripts For the P3P1 comparison at 2 TP we
approximate an FPTP ratio of 289 The likelihood to actually validate DE transcripts under such
circumstances would reach 035 For the P4P2 comparison the TPFP ratio estimates to mere 014
The related risks and often substantial costs for deducing potential biomarkers would be 25 times
higher Although we demonstrated in the presented example the influence of changes in data
evaluation pipeline within an integrated RNA-Seq workflow the same principles apply to the front
end - the RNA treatment NGS library preparation and sequencing Here unintended variations in
particular sample preparations can only be detected by these external spike-in controls which
operate as markers and reference spots By these means SIRV controls increase the comparability
within and between sequencing experiments at the transcript isoform level SIRVs are designed for
the co-development improvement and monitoring of library preparations sequencing and data
processing
Outlook The presented module and the 92 ERCCs which probe the wide dynamic range using
monocistronic transcripts can be stepwise extended in the future by a) ca 15 poly(A)-tail variations
of monocistronic sequences with defined lengths of 20 and 30 adenosines as well as polyadenylated
and purified RNAs with poly(A)-tail lengths close to 50 100 and above 200 nucleotides b) around 12
above-average long RNAs with 3 5 7 and 10 kb c) approx 3 RNAs each with a low medium and
not peer-reviewed) is the authorfunder All rights reserved No reuse allowed without permission The copyright holder for this preprint (which was httpdxdoiorg101101080747doi bioRxiv preprint first posted online Oct 13 2016
Spike-In RNA variant controls for RNA-Sequencing bioRxiv upload 2016-10-13
20
high GC-content d) a set of 13 mRNA relevant chemical modifications most prominent the cap-
structure (Bokar and Rottman 1998) e) variants which cover aspects of SNPs alleles inversions and
fusion genes which needs to be accounted for in the corresponding sequence annotation files and f)
a random set of small and micro RNAs that comprise all sequence variations at their termini to
account for ligation biases The external control modules need to be fine-tuned with respect to the
dynamic concentration and concentration ratio range and the reference annotations must provide a
mixture of correctly over- and under-annotated genes to better emulate the challenging conditions
for bioinformatical data evaluation Both optimizations will also further increase the congruence of
the presented SIRV module with the endogenous RNAs Eventually all modules together would
develop into a comprehensive set of approximately 250 long RNA controls plus a microRNA module
which will become sufficient for calibration and normalization purposes This new estimate reduces
the scope of designing better spike-in controls compared to the maybe thousands of IVTs which have
been previously anticipated (Kratz and Carninci 2014)
METHODS
SIRV DESIGN AND IN SILICO ANALYSIS The gene structures of seven human model genes
(KLK5 LDHD LGALS17A DAPK3 HAUS5 USF2 and TESK2) were used as scaffold for the design of
SIRV1 to SIRV7 The ENCODE-annotated transcripts as well as added variants were edited to
represent in a redundant and comprehensive manner known transcription and alternative splicing
variations (complete gene structures are shown in the odd-numbered suppl Fig from S3 to S15) All
exon sequences descend from a pool of database-derived genomes (gene fragments from viruses
and bacteriophage capsid proteins and glycoproteins selected based on a GC-content in a range of
30-50) which were modified by inverting the sequence to lose identity while maintaining a kind of
naturally occurring order in the sequences Intron sequences that do not align with exons of another
isoform were drawn from random sequences whereby the GC content was balanced to comply with
not peer-reviewed) is the authorfunder All rights reserved No reuse allowed without permission The copyright holder for this preprint (which was httpdxdoiorg101101080747doi bioRxiv preprint first posted online Oct 13 2016
Spike-In RNA variant controls for RNA-Sequencing bioRxiv upload 2016-10-13
21
the adjacent exonic sequences (Random DNA Sequence Generator
httpwwwfacultyucredu~mmadurorandomhtm)
To verify the sequence exclusivity first the exon sequences were blasted against the entire NCBI
database including ERCCs on the nucleotide and protein level (program BLASTN 2229
httpsblastncbinlmnihgov) The default BLAST parameters used were word size 28 expected
threshold 10 Max matches in query rang 20 MatchMismatch Score 1 -2 Gap Costs Linear Filter
Low complexity regions Mask for lookup table only Search of the nucleotide collection resulted for
all SIRVs in ldquono significant similarity foundrdquo Second in silico generated reads (Griebel t al 2012)
(FLUX-Generator httpsammethnetconfluencedisplaySIMHome command line flux-simulator
-p ~hellipFluxsirv1par -t simulator -x -l -s) were mapped to nine individually selected genomes using
TopHat2 (Kim et al 2013) and Bowtie2 (Langmead and Salzberg2012) Because Bowtie2-aligned
reads can be as short as 20 nt the resulting limited number of mapping reads would be deemed to
be not significant in standard NGS work-flows In contrast when mapping reads with the standard
setting of the splicing-aware TopHat2 program not a single read aligned to any of the tested
genomes Given that both searches found no significant matches off-target mapping of the SIRVs can
essentially be ruled out Therefore the artificial SIRV sequences are suitable for noninterfering
qualitative and quantitative assessments in the context of known genomic systems and
complementary to the ERCC sequences (National Institute of Standards and Technology (NIST)
certified DNA plasmids Standard Reference Materialreg 2374) The SIRV sequences can be found at
httpswwwlexogencomsirvssirvsdownloads in the Source Data files and they are also
deposited at the NCBI Nucleotide Database (PRJNA312485)
SIRV CONSTRUCTS AND THE PRODUCTION OF IN-VITRO TRANSCRIPTS Synthetic gene constructs
were produced (Bio Basic Inc Markham ON Canada) that comprised 5rsquo to 3rsquo a unique restriction
site a T7 RNA polymerase promoter whose 3rsquo G is the first nucleotide of the actual SIRV sequence
which is seamlessly followed by a (A30)-tail that is fused with an exclusive 2nd restriction site These
not peer-reviewed) is the authorfunder All rights reserved No reuse allowed without permission The copyright holder for this preprint (which was httpdxdoiorg101101080747doi bioRxiv preprint first posted online Oct 13 2016
Spike-In RNA variant controls for RNA-Sequencing bioRxiv upload 2016-10-13
22
gene cassettes were cloned into a vector colony-amplified and singularized All SIRV sequence in the
purified plasmids were verified by Sanger-sequencing to identify the correct clones The E coli
cultures were grown in batches to obtain plasmids in the lower microg-scale Double digestion of isolated
plasmids with XhoI and NsiI showed correct insert size and complete restriction Linearized silica-
purified plasmids served as templates in in vitro transcription reactions using T7 transcription kits
(AmpliScribe T7 High Yield Transcription Kit and AmpliScribe T7 Flash Transcription Kit Epicentre
Madison WI) The DNase-treated phenol-extracted and silica-purified in vitro transcription products
were assessed for concentration and purity by spectrophotometry (NanoDrop Thermo Fisher
Scientific Waltham MA) and for integrity by capillary electrophoresis (2100 Bioanalyzer RNA 6000
Pico Kit Agilent Technologies Santa Clara CA)
In the context of variant verification RNA integrity is a very important measure Fragments
arising from incomplete transcription might impose errors on the correct determination of variants
which share those sequences and thereby also affect the overall gene coverage The integrity of the
transcription products was very heterogeneous as expected given the broad sequence variation and
the length of the SIRV transcripts (average 11 kb with 14 RNAs between 20 and 25 kb) A majority
of transcripts therefore had to be purified by at least one of two purification methods Purification
method PP1 is selective for poly(A)-tails and neglects prematurely terminated transcription products
Purification method PP2 is based on size-selective quantitative electrophoresis separating the
correctly sized main products from shorter fragments (transcription break off and degraded
products) and longer fragments (run-through transcription products) After purification the 69 SIRV
RNAs were assessed to be on average 736plusmn343 in the pre-peak fraction 9031plusmn372 in the
main-peak fraction (corresponding to RNAs of correct length) and 236plusmn304 in the post-peak
fraction (mass percentages wt) Noteworthy the risks of a beginning degradation during the initial
denaturation (2 min at 70degC) and the not fully denaturing conditions during RNA microcapillary
electrophoresis tiny noise levels in the baseline and slightly different shapes of the main peak result
in a rather over- than underestimation of pre- and post-peak fractions
not peer-reviewed) is the authorfunder All rights reserved No reuse allowed without permission The copyright holder for this preprint (which was httpdxdoiorg101101080747doi bioRxiv preprint first posted online Oct 13 2016
Spike-In RNA variant controls for RNA-Sequencing bioRxiv upload 2016-10-13
23
rRNasin (Promega Madison WI) was added to 08 Umicrol to minimize the risks of RNase
contamination induced RNA degradation The SIRVs were quantified by absorbance spectroscopy to
adjust all stock solutions to a base concentration of close to but above 50 ngmicrol RNA purity was very
high with A 260280 214plusmn012 and A 260230 217plusmn020
SIRV MIXING SIRV mixes were designed that contain pools of SIRVs (SubMixes) in defined
amounts and ratios by combining accurate volumes of the stock solutions in sufficiently large batch
sizes Pipetting errors vary depending on transfer volumes and range from plusmn4 for 2 microl to plusmn08 for
gt100 microl transfers The precision was experimentally determined with blank solutions Starting with
the stock concentration measurement (NanoDrop accuracy plusmn2 ngmicrol for 50 ngmicrol or plusmn4 ) and
accounting for the entire mixing pathway the accumulative concentration error is expected to range
between plusmn8 and plusmn47 Therefore in the data evaluation one has to account for the experimental
fuzziness by allowing for lower accuracy thresholds of plusmn8 on the linear scale or plusmn011 on the log2-
fold scale respectively The SIRV concentration ratios between two mixes are more precise because
only one final pipetting step defines the concentration differences and synchronizes all SIRVs which
belong to the same SubMix Here a maximal error of plusmn4 (or plusmn0057 on the log2-fold scale) can be
expected between SubMixes while all SIRVs of the same SubMix must propagate coherently into the
final mixes Bioanalyzer traces were used to monitor the relative propagation of the SIRVs PreMixes
and SubMixes during the mixing (Fig 2B) In addition the accurate pipetting of the 8 PreMixes was
controlled by checksums of Nanodrop concentration measurements which deviated by only
0002plusmn34 from the calculated target concentrations and by weighing on an analytical balance
which showed a deviation of 18plusmn065 The final concentration of the SIRV mixes are set to be 253
ngmicrol
not peer-reviewed) is the authorfunder All rights reserved No reuse allowed without permission The copyright holder for this preprint (which was httpdxdoiorg101101080747doi bioRxiv preprint first posted online Oct 13 2016
Spike-In RNA variant controls for RNA-Sequencing bioRxiv upload 2016-10-13
24
SPIKING OF REFERENCE RNA WITH SIRV MIXES In general SIRV mixes can be used with crude
cell extracts purified total RNA rRNA-depleted RNA or poly(A)-enriched RNA Important the spike-in
ratios have to be chosen in concordance with the desired final SIRV content the RNA preparation
method and if known the expected mRNA content One widely applicable spike-in ratio can be
obtained by adding 006 ng of controls to approximately 100 ng of total RNA In the presented
examples the total RNA mass of one single aliquot RNA was 100 ng of UHRR in RC-0 and 1128 ng of
HBRR in RC-1 The reference RNA in RC-2 was calculated to be 10427 ng (Fig S2) The high-
concentrated and thereby stable SIRV mix stocks with 253 ngmicrol and ERCC mix stocks with 30 ngmicrol
(ERCC Spike-In Mixes 1 and 2 by Ambion Thermo Fisher Waltham MA) were diluted just prior to the
spiking to facilitate the mixing of manageable volumes For example the final 11000 dilution
reduced the SIRV mix concentration to 253 pgmicrol from which 237 microl were required to spike a 100 ng
total RNA sample with 006 ng SIRVs The RC-samples were produced in large batches to yield
hundreds of samples allowing for a protocol with fewer dilutions and larger volumes reducing
thereby sources of experimental errors
NGS LIBRARY PREPARATION AND SEQUENCING The experiments were carried out in technical
triplicates From 1 microg RC-0 RC-1 or RC-2 RNA in total nine NGS libraries were prepared by Fasteris SA
(Plan-les-Ouates CH) using the TruSeq stranded mRNA library preparation kit with polyA selection
(Illumina Inc San Diego CA) All primary library templates were amplified with 14 PCR cycles to
reach reproducible concentrations 155plusmn45 nM and insert sizes 165plusmn10 bp An equimolar lane-mix
was sequenced at the CSF Campus Science Support Facilities GmbH (CSF Vienna AUT) in PE125
mode in one lane of a HiSeq 2500 flowcell in 125 bp paired-end mode using V4 chemistry The run
yielded 305 M raw reads 293 M after demultiplexing and trimming which corresponds to a read
depth of 326plusmn22 M reads per library
not peer-reviewed) is the authorfunder All rights reserved No reuse allowed without permission The copyright holder for this preprint (which was httpdxdoiorg101101080747doi bioRxiv preprint first posted online Oct 13 2016
Spike-In RNA variant controls for RNA-Sequencing bioRxiv upload 2016-10-13
25
READ PROCESSING AND MAPPING Standard data processing routines (bbduk part of BBMap by
B Bushnell to be found at sourceforgenetprojectsbbmap) were applied removing low quality
reads and trimming adapter sequences Due to variable stringencies the mappers produced different
read statistics STAR mapped against the genome 897plusmn59 of the reads (864plusmn56 uniquely) and
TopHat2 852plusmn57 (794plusmn52 uniquely) Bowtie2 mapped against the transcriptome 693plusmn18
reads (151plusmn15 uniquely)
ESTIMATION OF THE MRNA CONTENTS Based on the obtained read distributions the relative
mass partition between external controls and endogenous RNA fraction can be estimated Because
the library preparation uses a poly(A)-enrichment step the targeted endogenous RNA corresponds
almost exclusively to the mRNA content of the samples The propagation of the input mass ratio to
the output read ratio depends on both the mRNA content and the efficiencies of how controls and
mRNA proceed through the library preparation The relationship is described by Eqn 1
reRNA times prod(1 rconifrasl )
j
i=1
= (EeRNA times meRNA) times prod(1 (Econi times mconi)frasl )
j
i=1
Equation 1
with r number of reads from eRNA the endogenous RNA fraction here mRNA and con the
controls here SIRVs and ERCC E the relative efficiency of how the fraction proceeds through the
workflow and m the input mass
Ratios are measured as relative read counts and the results as a product of efficiencies and
apparent amounts are also relative measures Therefore at least one de facto arbitrary reference
point needs to be defined to deduce comparable absolute results Several reference points or
default values can be defined which lead to different dependent variables and imply slightly variable
interpretation of the results The following three calculation examples are simple deductions from
not peer-reviewed) is the authorfunder All rights reserved No reuse allowed without permission The copyright holder for this preprint (which was httpdxdoiorg101101080747doi bioRxiv preprint first posted online Oct 13 2016
Spike-In RNA variant controls for RNA-Sequencing bioRxiv upload 2016-10-13
26
the ratio shown in Eqn 1 with the ERCC (con1) and the SIRVs (con2) respectively Variation 1 is
explained in greater detail while in the other variants only the differing aspects are highlighted
Variation 1 i) Here the first assumption is that the mRNA content in UHRR (Agilent Santa
Clara CA) is 3 (factor 003) and 2 (factor 002) in HBRR (Ambion Thermo Fisher Waltham MA)
which stays in close agreement to previous estimates concluded from experiments by Shippy et al in
2006 The amounts of total RNA were measured by Nanodrop absorbance spectroscopy The UHRR
samples contained 100 ng and the HBRR samples 1128 ng The mixing ratio of (2times RC-0) (1times RC-1)
determines the concentration of the 3rd sample RC-2 and further the amount of total RNA (10427
ng) as well as its related mRNA content (2times100 ng times 3 + 1times1128 ng times 2 ) (2times100 ng + 1times1128
ng) = 264 (factor 0026) The mRNA masses of the samples are calculated by the measured total
RNA input amounts and default mRNA contents are 3 ng 2256 ng and 2752 ng The second
assumption is that the endogenous mRNAs proceed with the maximal efficiency of 100 (factor 1)
through library preparation and sequencing The input of the spike-in controls is the product of the
concentration values which were either measured as in the case of the SIRV stocks or stated by the
vendor as in the case of the ERCC stocks and the pipetted volumes Both are treated as de facto
measured values
ii) The relative amounts of reads which have been assigned to either endogenous mRNA
ERCCs or SIRVs are obtained from the mapping statistics (read classification)
iii) The ratio of mass input to reads output allows to calculate the propagation efficiency of
the controls relative to the default efficiency of the endogenous mRNA In the present experiment
the SIRVs progress with a relative efficiency of 867plusmn57 and the ERCCs with 416plusmn47 The
significant difference between the relative efficiency of both controls is very likely caused by the
different lengths of the poly(A)-tails which might influence a different binding efficiency during
poly(A)-enrichment step The SIRVs with a 30 nt long poly(A)-tail perform much more in concordance
with the endogenous mRNA as the ERCCs which contain shorter and variable poly(A)-tails ( 23 nt)
The observed small differences in the experiments using RC-0 RC-1 or RC-2 could be caused by a
not peer-reviewed) is the authorfunder All rights reserved No reuse allowed without permission The copyright holder for this preprint (which was httpdxdoiorg101101080747doi bioRxiv preprint first posted online Oct 13 2016
Spike-In RNA variant controls for RNA-Sequencing bioRxiv upload 2016-10-13
27
two-way interference of samples and controls However the deviations are small and can rather be a
result of minor inaccuracies in determining the relative input amounts Both hypotheses would need
to be verified by a series of repeats with the aim to resolve potential influences of pipetting during
the sample preparation variations in the library preparation and other contributions
Variation 2 Here no varying interferences between samples and controls are permitted
which means that relative efficiencies of the controls are considered to be constant The causes of
the experimental variations are exclusively assigned to the input amounts (alike hypothesis two in
the above example in discussing the deviation of the results in RC-2) This would translate into input
standard deviations of 118 (SIRVs) and 76 (ERCCs) The variations meld all accumulating errors
made in determining the concentration of the control stock solutions preparing the subsequent
dilutions pipetting the samples and controls during the spike-in step itself as well as determining the
amount of sample RNA in the first place Against the background of potential errors the calculated
results can be considered as highly consistent
Variation 3 In addition to the assumptions made for the measurement of sample RC-0
the spike-in of 006 ng SIRVs to all samples is also set as default Alike variation 2 the experiments in
RC-1 and RC-2 adopt the same default setting for the relative efficiencies calculated in RC-0
According to the ratio of Eqn 1 one can obtain mRNA contents as well as ERCC input amounts in this
case for samples RC-1 and RC-2 The mRNA content of the HBRR sample (RC-1) relative to the default
mRNA content in the UHRR sample (set to 3 ) would be 172 lower than the previously assumed
2 According to the present mixing scheme it would also imply that sample RC-2 has an mRNA
content of 254 up from the calculated 234 The offsets of -79 is again small and very likely
refers to the level of accuracy in the experimental results as discussed above Using this method the
spiking of samples with controls such as the SIRVs allows to closely estimate the relative mRNA
content of any unknown sample and to draw conclusions eg on the transcriptional state of tissues
cell suspension or individual cells
not peer-reviewed) is the authorfunder All rights reserved No reuse allowed without permission The copyright holder for this preprint (which was httpdxdoiorg101101080747doi bioRxiv preprint first posted online Oct 13 2016
Spike-In RNA variant controls for RNA-Sequencing bioRxiv upload 2016-10-13
28
COEFFICIENT OF DEVIATION We implemented a strand specific Coefficient of Deviation
(CoD) which aims to reflect the quality of NGS pipelines targeted at specific effects in particular
lsquospikenessrsquo of the coverage while systematic effects like drop of the coverage at Transcription Start
Sites (TSS) and Transcription End Sites (TES) are being suppressed The CoD is implemented by Eqn
2
CoD = CoD(LTSSLTES) = sum (cidealp- crealp)2
TESe
p=TSS1
divide sum cidealp
TESe
p=TSS1
Equation 2
which is calculated in strand orientation for contigs along all exonic nucleotide position (p) from the
first annotated TSS (TSS1) up to the last annotated TES (TESe) whereby cideal are the ideal coverages
with the optimized transient regions (LrsquoTSS LrsquoTES) and creal are the real coverages scaled as such that
the total integrals along all positions of ideal and real coverages are equal
The transient function at TSS and TES is the error function erf(x) which corresponds to
Cufflinks assumption about normally distributed fragment lengths (Trapnell et al 2012) Since erf(x)
is a non-algebraic function we used the algebraic approximation by Abramowitz and Stegun
(httpsenwikipediaorgwikiError_function eq 7125) Once the optima (LrsquoTSS LrsquoTES ) are found
we declare CoD(LrsquoTSS LrsquoTES) to be the ultimate CoD value which mostly eliminated the transient region
effects We implemented an optimization algorithm (Nelder-Mead downhill simplex method) and
used as starting values (L0TSS L0
TES ) lengths of 150 In some cases the optimum found can be beyond
a reasonable range of values Therefore we censor the output Lopt of the mathematical optimization
as follows Lcensored = 50 if Lrsquo lt 50 Lcensored = 350 if Lrsquo gt 350 This corresponds to the maximal range of
not peer-reviewed) is the authorfunder All rights reserved No reuse allowed without permission The copyright holder for this preprint (which was httpdxdoiorg101101080747doi bioRxiv preprint first posted online Oct 13 2016
Spike-In RNA variant controls for RNA-Sequencing bioRxiv upload 2016-10-13
29
200plusmn150 This censoring needed to be applied in 8 cases out of 84 SIRVmixstrandend
combinations ie less than in 10
TRANSCRIPT CONCENTRATION MEASUREMENTS In order to estimate expression values on
transcript levels we applied RSEM (Li and Dewey 2011) which uses a Bayesian Network to compute
the likelihood of each fragment belonging to a given transcript Salmon (Patro et al 2015) estimates
the transcript expression values by a k-mer based mapping Similar to RSEM it uses an expectation-
maximization (EM) algorithm to compute the maximum likelihood of relative abundances Cufflinks2
(Trapnell et al 2013) estimates the transcript abundances with a coverage-based maximum
likelihood approach It determines the probability of read assignments to isoforms
DIFFERENTIAL EXPRESSION ANALYSIS We used the DESeq2 package (Love et al 2014) for
calculation of fold-differences between the results from different pipelines and different input samples
mixtures As explained in the main text all outputs from the evaluated pipelines (in form of relative
concentration measures) have been scaled Scaling by linear transformation is needed as a
consequence of the different mRNA contents in the samples but also to eventually compensate any
potential pipetting errors when small aliquots typically in the range of very few microliter are added
to individual samples The RC-samples in this experiment were produced in a large batch to ensure
high accuracy in volumetric ratios The main sample pool is practically invariant to the small relative
contribution of the controls but was technically treated in the same way by scaling the main sample
pools to identical sizes First SIRV concentrations were scaled to reach together 69 in E0 685 in E1
and 708 in E2 which is the dimensionless value identical to the fmolmicrol in the respective SIRV stock
solutions Then the lower threshold was set to 10-6 which corresponds to original FPKM values of
around 5∙10-3 ⅟7th of one read for a 1 kb long transcript at a read depth of 30 Mio reads or 1 gene
specific read to be divided between 7 equally possible transcript variants at said 1 kb length section
The threshold is to be understood as less than or equal to 10-6 which defines an averaged read
not peer-reviewed) is the authorfunder All rights reserved No reuse allowed without permission The copyright holder for this preprint (which was httpdxdoiorg101101080747doi bioRxiv preprint first posted online Oct 13 2016
Spike-In RNA variant controls for RNA-Sequencing bioRxiv upload 2016-10-13
30
resolution of the particular workflow at the given read depth By these means all ratios remain defined
Second for the DESeq2 calculations we multiplied all values with 106 after which fractions were
rounded to the closest integer We understand that for no-change hypothesis testing which is the
main purpose of the DESeq2 package transforming the relative concentrations (FPKM or TPM) to
lsquoquasi-read-countsrsquo is not recommended since DESeq2 internally corrects for library size by using size
factors However in our application we do not use the probability of the hypothesis rejection (P
values) but the raw fold changes detected (irrespectively of the dispersion values for that given
transcript) We also took into account the potential danger of censoring the input (by unintentionally
eliminating transcripts represented by extremely low FPKM or TPM values) by setting a suitable
threshold as described above The figures show only two differential expression analyses because the
3rd concentration ratio E2E0 is the product of E1E0 and E2E1
ERROR RATE ANALYSIS The four red data points two from the SIRV controls (circles) and two
from the endogenous mRNAs (squares) from the best agreement (P3 vs P1) and the four
corresponding black data points from the worst agreement (P4 vs P2) as shown in fig 5E were fitted
by linear approximation using the relationship as derived for Eqn 3
TP + FP = 1
FP = N times ER = (1-TP) times ER
(TP+FP) = TP + ER - TP times ER
(TP+FP) = (1-ER) times TP + ER Equation 3
where TP is the relative portion of true positives (differentially expressed as in our definition
possessing a LFC gt 1) N the relative portion of negatives ER the error rate at which negatives are
falsely detected as positives to result in false positives FP The least squares fitting method was
applied to derive values for the slope (1-ER) and the intercept ER
not peer-reviewed) is the authorfunder All rights reserved No reuse allowed without permission The copyright holder for this preprint (which was httpdxdoiorg101101080747doi bioRxiv preprint first posted online Oct 13 2016
Spike-In RNA variant controls for RNA-Sequencing bioRxiv upload 2016-10-13
31
The transformation of Eqn 3 leads to the relationship of Eqn 4
TP FPfrasl = (TP+FP) TPfrasl -1 Equation 4
which has been used for the graph in fig 5F In the present context the concept of ROC-curves is not
applicable because the true or false negatives are indistinguishable as long the ground truth of the
endogenous RNA are unknown
DATA ACCESS Sequencces and source data files data are in the process to be deposited at
NCBI under BioProject ID PRJNA312485
ACKNOWLEDGMENTS We thank SA Munro and M Salit (Material Measurement
Laboratory National Institute of Standards and Technology) for their efforts in further developing the
concepts of the External RNA Control Consortium (ERCC) in an updated suite of RNA controls and
analysis methods called ERCC 20 We thank A Tuerk for his contributions in finding suitable human
model genes G Wiktorin for carrying out the RSEM calculations M Mihaylova in helping with the
graphics design and I Gabler for critically reading the manuscript
AUTHOR CONTRIBUTIONS LP PK and TR designed the sequences and mixtures PK and GH
prepared the in vitro transcripts and spike-in mixtures TR AS and LP designed the research and
the experiments MA IH and TR evaluated the data TR and LP wrote the manuscript
DISCLOSURE DECLARATION The authors are employees of Lexogen GmbH from which the SIRVs
can be bought and AS has equity stakes in Lexogen GmbH LP PK and TR are named as
not peer-reviewed) is the authorfunder All rights reserved No reuse allowed without permission The copyright holder for this preprint (which was httpdxdoiorg101101080747doi bioRxiv preprint first posted online Oct 13 2016
Spike-In RNA variant controls for RNA-Sequencing bioRxiv upload 2016-10-13
32
inventors on a patent application regarding the production and use of RNA transcript variants and
Lexogen GmbH is the owner of this patent application
REFERENCES
Baker SC Bauer SR Beyer RP Brenton JD Bromley B Burrill J Causton H Conley MP Elespuru R Fero M et al 2005 The External RNA Controls Consortium a progress report Nat Methods 2(10) 731-4 Bokar JA Rottman FM 1998 Biosynthesis and Functions of Modified Nucleosides in Eukaryotic mRNA In Modification and Editing of RNA (eds Grosjean H Benne R) pp 183-200 ASM Press Washington DC Dobin A Davis CA Schlesinger F Drenkow J Zaleski C Jha S Batut P Chaisson M Gingeras TR 2013 STAR ultrafast universal RNA-seq aligner Bioinformatics 29(1) 15-21 Fed Reg Doc 2015-19742 2015 External RNA Controls Consortium - Call for Participation and Contributions to a Sequence Library Federal Register Citation 80 FR 48296 Griebel T Zacher B Ribeca P Raineri E Lacroix V Guigoacute R Sammeth M 2012 Modelling and simulating generic RNA-Seq experiments with the flux simulator Nucleic Acids Res 40(20) 10073-83 Jiang L Schlesinger F Davis CA Zhang Y Li R Salit M Gingeras TR Oliver B 2011 Synthetic spike-in standards for RNA-seq experiments Genome Res 21(9) 1543-51 Kim D Pertea G Trapnell C Pimentel H Kelley R Salzberg SL 2013 TopHat2 accurate alignment of transcriptomes in the presence of insertions deletions and gene fusions Genome Biol 14(4) R36 Kratz A Carninci P 2014 The devil in the details of RNA-seq Nat Biotechnol 32(9) 882-4 Lahens NF Kavakli IH Zhang R Hayer K Black MB Dueck H Pizarro A Kim J Irizarry R Thomas RS et al 2014 IVT-seq reveals extreme bias in RNA sequencing Genome Biol 15(6) R86 Langmead B Salzberg SL 2012 Fast gapped-read alignment with Bowtie 2 Nat Methods 9(4) 357-9 Li B Dewey CN 2011 RSEM accurate transcript quantification from RNA-Seq data with or without a reference genome BMC Bioinformatics 12 323 Li J Jiang H Wong WH 2010 Modeling non-uniformity in short-read rates in RNA-Seq data Genome Biol 11 R50 Li S Tighe SW Nicolet CM Grove D Levy S Farmerie W Viale A Wright C Schweitzer PA Gao Y et al 2014 Multi-platform assessment of transcriptome profiling using RNA-seq in the ABRF next-generation sequencing study Nat Biotechnology 32 915-25 Love MI Huber W Anders S 2014 Moderated estimation of fold change and dispersion for RNA-seq data with DESeq2 Genome Biol 15(12) 550
not peer-reviewed) is the authorfunder All rights reserved No reuse allowed without permission The copyright holder for this preprint (which was httpdxdoiorg101101080747doi bioRxiv preprint first posted online Oct 13 2016
Spike-In RNA variant controls for RNA-Sequencing bioRxiv upload 2016-10-13
33
Mortazavi A Williams BA McCue K Schaeffer L Wold B 2008 Mapping and quantifying mammalian transcriptomes by RNA-Seq Nat Methods 5(7) 621-8 Patro R Duggal G Kingsford C 2015 Accurate fast and model-aware transcript expression quantification with Salmon bioRxiv preprint doi httpdxdoiorg101101021592 Shippy R Fulmer-Smentek S Jensen RV Jones WD Wolber PK Johnson CD Pine PS Boysen C Guo X Chudin E et al 2006 Using RNA sample titrations to assess microarray platform performance and normalization techniques Nat Biotechnol 24(9) 1123-31 SEQCMAQC-III Consortium 2014 A comprehensive assessment of RNA-seq accuracy reproducibility and information content by the Sequencing Quality Control Consortium Nat Biotechnology 32 903-14 Tembe WD Pond SJ Legendre C Chuang HY Liang WS Kim NE Montel V Wong S McDaniel TK Craig DW Carpten JD 2014 Open-access synthetic spike-in mRNA-seq data for cancer gene fusions BMC Genomics 15 824 Trapnell C Roberts A Goff L Pertea G Kim D Kelley DR Pimentel H Salzberg SL Rinn JL Pachter L 2012 Differential gene and transcript expression analysis of RNA-seq experiments with TopHat and Cufflinks Nat Protoc 7(3) 562-78 Trapnell C Hendrickson DG Sauvageau M Goff L Rinn JL Pachter L 2013 Differential analysis of gene regulation at transcript resolution with RNA-seq Nat Biotechnol 31(1) 46-53 van Dijk EL Jaszczyszyn Y Thermes C 2014 Library preparation methods for next-generation sequencing tone down the bias Exp Cell Res 322(1) 12-20 Wang Z Gerstein M Snyder M 2009 RNA-Seq a revolutionary tool for transcriptomics Nat Rev Genet 1 57-63 Zheng W Chung LM Zhao H 2011 Bias detection and correction in RNA-Sequencing data BMC Bioinformatics 12290
not peer-reviewed) is the authorfunder All rights reserved No reuse allowed without permission The copyright holder for this preprint (which was httpdxdoiorg101101080747doi bioRxiv preprint first posted online Oct 13 2016
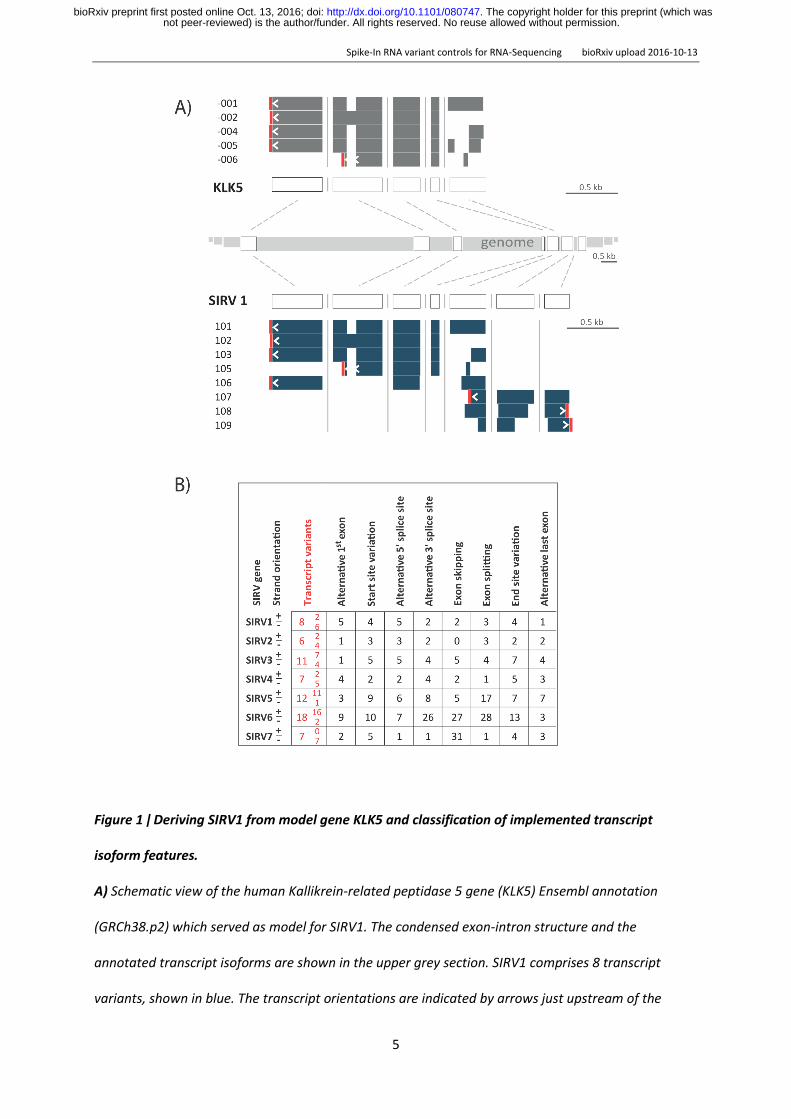
Spike-In RNA variant controls for RNA-Sequencing bioRxiv upload 2016-10-13
5
Figure 1 ǀ Deriving SIRV1 from model gene KLK5 and classification of implemented transcript
isoform features
A) Schematic view of the human Kallikrein-related peptidase 5 gene (KLK5) Ensembl annotation
(GRCh38p2) which served as model for SIRV1 The condensed exon-intron structure and the
annotated transcript isoforms are shown in the upper grey section SIRV1 comprises 8 transcript
variants shown in blue The transcript orientations are indicated by arrows just upstream of the
not peer-reviewed) is the authorfunder All rights reserved No reuse allowed without permission The copyright holder for this preprint (which was httpdxdoiorg101101080747doi bioRxiv preprint first posted online Oct 13 2016
Spike-In RNA variant controls for RNA-Sequencing bioRxiv upload 2016-10-13
6
poly(A)-tails highlighted in red B) The occurrences of the different transcription and splicing events
are counted for each transcript in reference to a hypothetical master transcript which contains all
exon sequences from all transcript variants of a given gene (outlined next to ldquoSIRV 1rdquo in A)) Therefore
no intron retention can occur and exon splitting has been defined to be understood as introduction of
an intron sequence
PRODUCTION OF SIRV MIXES The SIRVs were produced by in vitro transcription (IVT) from
linearized plasmids yielding SIRV RNAs of high purity but varying integrity Since the SIRV transcripts
represent isoforms with overlapping sequences break-down products of SIRV RNAs can potentially
affect the detection and quantification of other isoforms Therefore a set of tailored purification
procedures was applied to obtain full-length RNAs with a minimal amount of side products despite
the broad sequence and length variation of the SIRVs (Fig 2A) By capillary electrophoresis
(Bioanalyzer Agilent) the purified SIRV RNAs were assessed to be at least to 9031plusmn372 of correct
length Each SIRV transcript entered the final mixes via one of eight PreMixes allowing for the unique
identification of each SIRV by capillary electrophoresis (Fig 2B) The PreMixes were merged pairwise
in equal amounts to yield four SubMixes which were then combined in defined volumetric ratios to
create the final mixes The experimentally determined cumulative pipetting error for individual SIRVs
is smaller than plusmn8 while the applied SubMix scheme limits the maximum error for differential gene
expression experiments to only plusmn4 Bioanalyzer traces were used to monitor the relative
propagation of the SIRVs in Pre- and SubMixes during the staged mixing (Fig 2B) The mix E0
maintains equimolar SIRV concentration ratios E1 contains a maximum concentration difference of
8-fold (close to one order of magnitude) and E2 comprises a concentration difference of up to 128-
fold The inter-mix concentration ratios range from 164- to 16-fold (Fig 2C)
not peer-reviewed) is the authorfunder All rights reserved No reuse allowed without permission The copyright holder for this preprint (which was httpdxdoiorg101101080747doi bioRxiv preprint first posted online Oct 13 2016
Spike-In RNA variant controls for RNA-Sequencing bioRxiv upload 2016-10-13
7
Figure 2 ǀ SIRV RNA integrity and mixing scheme
A) Examples of high SIRV integrity T7 transcription of SIRV612 yielded RNA of almost uniform correct
length with 4924 in the pre- main- and post-peak fractions as analyzed by Bioanalyzer RNA
6000 Pico Chip (Agilent) capillary electrophoresis The lower integrity of SIRV101 and SIRV203 after T7
transcription (blue traces) was increased using tailored purification protocols PP1 and PP2 (red
traces) Finally the integrity of all SIRVs was ge85 wt with on average 903plusmn37 wt in the main peak
fraction B) 8 PreMixes received in equimolar entities between 6 and 11 SIRVs which varied in length
to be unambiguously traced in Bioanalyzer runs PreMixes were combined pairwise in equal ratios to
yield SubMixes The resulting 4 SubMixes were combined in defined ratios to obtain the final Mixes
not peer-reviewed) is the authorfunder All rights reserved No reuse allowed without permission The copyright holder for this preprint (which was httpdxdoiorg101101080747doi bioRxiv preprint first posted online Oct 13 2016
Spike-In RNA variant controls for RNA-Sequencing bioRxiv upload 2016-10-13
8
E0 E1 and E2 Measured traces are shown in red and traces computed from the PreMix traces to
validate the composition of the SubMixes and final Mixes are shown in blue A color code for the
SubMixes is introduced to follow groupings of SIRVs throughout the subsequent data analysis C)
Graphical representation of the relative SIRV concentrations and concentration ratios according their
SubMix belonging The total molarity and weight of the final mixes are evenly balanced at 697
fmolmicrol and 253 ngmicrol
Three different samples with SIRVs RC-0 RC-1 and RC-2 (for details see methods section) were
prepared NGS libraries generated and sequenced in paired-end 125 bp mode
NGS DATA EVALUATION All demultiplexed NGS reads were mapped to the human
genome (GRCh38p2) the ERCC sequences and the SIRVome by using the common splice-aware
aligners STAR (Dobin et al 2012) TopHat2 (Kim et al 2013) while Bowtie2 (Langmead and Salzberg
2012) was used to map reads to a set of accordingly generated transcript sequences Bowtie2 aligned
reads were further processed by RSEM (Li and Dewey 2011) a combination referred to below as data
evaluation pipeline P1 Salmon is an autarkic program algorithm (Patro et al 2015) referred to as P2
STAR as well as TopHat2 aligned reads were further processed by Cufflinks2 (Trapnell et al 2012)
and resemble the evaluation pipelines P3 and P4
ESTIMATION OF THE MRNA CONTENTS On the basis of the assumption that the RNAs in the
samples and the spike-in controls are equally targeted by the library preparation due to similar
length distributions (SIRV 1129plusmn15 nt ERCC 880plusmn26 nt and based on the P4 results UHRR 1538 nt
and HBRR 1641 nt) the relative mass partition between controls and endogenous RNA can be
determined The propagation of the input amounts to the output read ratio depends on the mRNA
content and the relative recovery efficiencies of controls and mRNA after the library preparation
Therefore one reference value needs to be defined or externally determined which we chose to be
not peer-reviewed) is the authorfunder All rights reserved No reuse allowed without permission The copyright holder for this preprint (which was httpdxdoiorg101101080747doi bioRxiv preprint first posted online Oct 13 2016
Spike-In RNA variant controls for RNA-Sequencing bioRxiv upload 2016-10-13
9
an mRNA content of 3 in UHRR (Shippy et al 2006) We further set the efficiency of the
endogenous mRNA proceeding through this particular library preparation to 100 The SIRVs can
then be calculated to progress with a relative efficiency of 870plusmn6 allowing to determine the
mRNA content in the second sample HBRR to be 172 The mRNA content in the mixed samples
RC-2 is then assessed to be 234 which corresponds to a minor -91 offset relative to the
theoretical outcome based on the RC-0 and RC-1 measurements In the TruSeq library preparation
the 30 nt long poly(A)-tail of the SIRVs ensures an enrichment similar to the endogenous mRNAs The
ERCC controls show a lower recovery efficiency of 416plusmn47 most likely due to their shorter poly(A)-
tails which vary between 19 and 25 adenines ( 23 nt) The results are summarized in suppl Tab S1
COMPARISON BETWEEN EXPECTED AND MEASURED COVERAGE AND CONCENTRATION MEASURES For the first
time the ground truth of complex input sequences is available allowing detailed target-performance
comparisons for read alignment relative abundance calculation and differential expression
determination Fig 3 shows for one example gene SIRV 3 in E0 the expected coverages and counts
of the telling junctions together with the coverages obtained by STAR and TopHat2 mapping NGS
workflow-specific read start-site distributions lead to coverage patterns with inherent terminal
deficiencies for which the expected coverage has been adjusted accordingly However in the
measured coverages these systematic start- and end-site biases are accompanied by a variety of
biases which introduce severe local deviations from the expected coverage
not peer-reviewed) is the authorfunder All rights reserved No reuse allowed without permission The copyright holder for this preprint (which was httpdxdoiorg101101080747doi bioRxiv preprint first posted online Oct 13 2016
Spike-In RNA variant controls for RNA-Sequencing bioRxiv upload 2016-10-13
10
Figure 3 ǀ Comparison of the expected and the measured coverages for the SIRV3 locus in mix E0
A) Individual transcripts of SIRV3 with transcripts on the plus strand in blue and in red for the ones on
the minus strand Color code indicates the SubMix allocation B) The expected SIRV3 coverage is
shown as superposition of individual transcript coverages in which the terminal sites have been
modelled by a transient error function The measured coverages after read mapping by TopHat2 are
shown in grey The measured coverages and number of splice junction reads were normalized to
obtained identical areas under the curves and identical sums of all junctions for the expected and
measured data The measured splice junction reads are shown by the numbers before the brackets
not peer-reviewed) is the authorfunder All rights reserved No reuse allowed without permission The copyright holder for this preprint (which was httpdxdoiorg101101080747doi bioRxiv preprint first posted online Oct 13 2016
Spike-In RNA variant controls for RNA-Sequencing bioRxiv upload 2016-10-13
11
while the expected values are shown inside the brackets The CoD values are given for the plus and
minus strand in the respective colors C) Differences between mapping by STAR aligner and TopHat2
The black arrows indicate the direction of positive differences Percentages refer to the relative
changes of the measured splice junction reads
To obtain a comparative measure gene-specific coefficients of deviation CoD were calculated CoDs
describe the often hidden biases in the sequence data predominantly caused by an inhomogeneous
library preparation but also by the subsequent sequencing and mapping In the presented example
the stranded TruSeq library preparation with the Illumina HiSeq2500 sequencing and mapping by
TopHat2 results in a mean CoD of 0190plusmn0193 across all SIRVs For the sense oriented SIRVs the
mean CoD is 0275plusmn0223 and for the antisense SIRVs which cover a region of fewer overlapping
transcript annotations the mean CoD is 0090plusmn0076 The coverage target-performance comparison
highlights the inherent difficulties in deconvoluting read distributions to correctly identify transcript
variants and determine concentrations The distribution of telling reads splice junctions and reads
towards the termini are references for the assignment of the remaining reads before calculating
relative transcript variant abundances Not surprisingly although the majority of junction counts
correlates well with the expected values the high CoD values indicate that numerous telling reads
deviate significantly within the context of the individual mixes They also differ between mixes which
affects differential expression measurements (see Fig 3B and for the coverage of all seven SIRV
genes the even suppl Fig from S4 to S16)
The CoD does not allow to distinguish between periodicity and randomness in the biases nor
does it forecast how well a data evaluation strategy can cope with the bias contributions
Nevertheless smaller CoD values are expected to correlate with a simpler and less error-prone data
evaluation The CoD values can be taken as a first indicative measure to characterize the mapped
data and to compare data sets for similarity up to this point in the workflow Target-performance
comparisons of all SIRV genes in all three mixes can be found in the supplemental information
not peer-reviewed) is the authorfunder All rights reserved No reuse allowed without permission The copyright holder for this preprint (which was httpdxdoiorg101101080747doi bioRxiv preprint first posted online Oct 13 2016
Spike-In RNA variant controls for RNA-Sequencing bioRxiv upload 2016-10-13
12
The above described four data analysis pipelines P1 to P4 were used to calculate transcript
abundances for 69 SIRV and 196˙165 annotated endogenous transcripts All obtained results are
relative concentration measures yielding either Fragments Per Kilobase of exon per Million
fragments mapped (FPKM) (Mortazavi 2008) or Transcripts Per Million (TPM) (Li and Dewey 2011)
The concentrations were scaled by linear transformation in such way that all SIRVs together reach 69
in E0 685 in E1 and 708 in E2 which is the dimensionless value identical to the fmolmicrol in the
respective SIRV stock solutions In consequence the relative quantities of the SIRVs are compatible
to the normalized scale which was introduced in Fig 2C Boxplots in Fig 4 show exemplarily the SIRV
concentrations and two discrete differentials as measured by P3 (results from P1 P2 and P4 are
shown in suppl Fig S17 and standard correlation plots of the four pipelines are shown in suppl Fig
S18) The majority of all SubMix mean concentration values are in concordance with the expected
values The concentration ratios simulating differential expression measurements are less prone to
systematic offsets and show by trend narrower distributions However these correlations highlight
already the issue of obvious and frequent outliers ie transcript variants that are not well resolved
not peer-reviewed) is the authorfunder All rights reserved No reuse allowed without permission The copyright holder for this preprint (which was httpdxdoiorg101101080747doi bioRxiv preprint first posted online Oct 13 2016
Spike-In RNA variant controls for RNA-Sequencing bioRxiv upload 2016-10-13
13
Figure 4 ǀ Box plot overview of calculated concentration values for SIRV mixes and mix ratios
Reads from SIRV mixes E0 E1 and E2 were processed by four different data evaluation algorithms for
transcript quantification Results derived by pipeline P3 are exemplarily shown in reference to the
known inputs (bars in colors corresponding to the SIRV SubMixes of Fig 2) The black circles mark the
mean and the bold dashes the medians of the data points which are shown in grey the boxes span
the 25 to 75 region of the data points and the black whiskers with connecting lines reach up to the
min and max values and indicate also outliers outside the scale of the graph The comparison E1 vs
E0 from sample RC-1 and RC-0 (2nd row) was used for building the histogram of Fig 5B The shaded
area resembles the 1st bin (0leǀLFCǀle1) while the inner section (b1) comprises the fraction 0leǀLFCǀlt05
where the majority of data points originates from SubMix4 (ratio 11) and some ldquooutliersrdquo from
SubMix2 which were actually spiked in at the ratio 21
Heat maps allow to inspect each SIRV in the context of competing transcripts Tab 1B shows
the abundancies as log2-fold changes LFC relative to the expected values for the example of SIRV 6
LFC values consider relative increases and decreases across all concentration ranges likewise An LFC
window of plusmn011 presents the confidence interval as a result from the currently achievable accuracy
not peer-reviewed) is the authorfunder All rights reserved No reuse allowed without permission The copyright holder for this preprint (which was httpdxdoiorg101101080747doi bioRxiv preprint first posted online Oct 13 2016
Spike-In RNA variant controls for RNA-Sequencing bioRxiv upload 2016-10-13
14
in producing the SIRV mixtures We examine the LFC values uncoupled from the adjusted p-values
which provide a statistical measure of the significance level for apparent differential expression By
these means we prevent pipelines to appear more coherent only due to higher noise levels The
accuracy has been calculated for each SIRV as the mean of the LFCs in all three mixes The precision is
a measure of how consistent SIRVs are quantified and has been calculated as the LFC standard
deviation for each SIRV and further for entire pipelines by using all SIRVs Within the presented
example SIRVs can obtain in all four pipelines high precisions of up to 018plusmn007 and high accuracies
of up to -001plusmn010 (SIRV604) In contrast SIRV612 of similar length has an average precision of
569plusmn368 and an accuracy of -386plusmn270 although it was detected by P2 with a high precision of 012
at an accuracy of 018 This quantification of differences between pipelines now directly permits to
assess the effect of changes in workflows and individual experiments
COMPARISON BETWEEN DIFFERENT WORKFLOWS When ranking the four pipelines by said precision P3
gives the lowest value with 129 followed by P4 with 164 P1 with 198 and P2 with 214 However
a sample-specific global target-performance comparison is not the strongest criteria for evaluating
performance differences at transcript resolution For this purpose the apparent differential
expression shows if similar errors are caused by the same or different transcripts The highest
concordance was found between P3 and P1 (labelled P3P1) calculated as standard deviation of all
SIRV LFCs with 101 followed by P4P3 (104) P4P1 (255) P2P1 (288) and P3P2 (309) The
lowest concordance has P4P2 with a value of 412 One section of the resulting heat map for both
extremes is shown in Tab 1C
not peer-reviewed) is the authorfunder All rights reserved No reuse allowed without permission The copyright holder for this preprint (which was httpdxdoiorg101101080747doi bioRxiv preprint first posted online Oct 13 2016
Spike-In RNA variant controls for RNA-Sequencing bioRxiv upload 2016-10-13
15
Table 1 ǀ Variance heat map of SIRV concentration measures detailing SIRV6 by the 4 different
pipelines P1 to P4 A) Given are SIRV transcript identifier SubMix (SM) color code and transcript
lengths (in nucleotides) B) Heat maps showing the log-fold changes (LFC) for the comparison of the
normalized expected and measured SIRV concentrations as a result from the four data evaluation
pipelines P1 to P4 evaluating E0 E1 and E2 Fields with -1 le LFC le 1 are filled with gradient green all
fields with LFC lt -1 with straight blue and all fields with LFC gt 1 with straight red C) From all 6
possible pairwise comparisons P2P1 P3P1 to P4P3 of the normalized measured SIRV
concentrations the one with the smallest (P3P1) and largest (P4P2) median of all LFC are shown
The complete heat map is shown in the suppl Tab S2
not peer-reviewed) is the authorfunder All rights reserved No reuse allowed without permission The copyright holder for this preprint (which was httpdxdoiorg101101080747doi bioRxiv preprint first posted online Oct 13 2016
Spike-In RNA variant controls for RNA-Sequencing bioRxiv upload 2016-10-13
16
The same pipeline comparisons were made with either all endogenous transcripts or the ones in the
higher SIRV expression range and compared to the pipeline concordances calculated with the SIRV
controls (Fig 5) We define the first bin with ǀLFCǀ lt 1 as the bin of no apparently differentially
expressed transcripts independent of the corresponding p-values The other bins contain transcripts
for which the calculated concentrations differ by more than 2-fold hence convene apparently
differentially expressed transcripts (DE) We find that SIRV controls and endogenous transcripts are
evaluated coherently While theoretically no differences are expected pipelines P3 and P1 differ in
their quantification of the same data by 44 for the SIRVs and by 69 for endogenous RNAs in the
SIRV concentration range (Fig 5A) Pipelines P2 and P4 differ to a larger extent when evaluating the
same samples (Fig 5B C) The same correlation is seen in comparisons between different samples
(shown here for RC-0 vs RC-1) The expected DE between reference RNAs UHRR and HBRR of
approximately 50 is evaluated differently by P3 vs P1 (DE of 24 ) and this is mirrored in the
evaluation of the SIRV mixes spiked into these reference RNAs (DE of 49 ) P4 vs P2 performed
worse with a pipeline difference of 39 and 103 for endogenous and SIRV transcripts The
controls show a highly similar increase when comparing P3P1 with P4P2 (21-fold from 49 to
103 ) to the endogenous RNAs (16-fold from 24 to 39 ) Here the average measurement
using the same pipeline provide a pseudo-ground truth which is compared to the measurement
using different pipelines It allows to quantify the additional error caused solely by changes in the
pipeline A change from pipeline P3 to P1 would increase the number of DE-detected transcripts to a
smaller extent than a change from P2 to P4 and this is true for both the SIRV controls and the
endogenous transcripts
not peer-reviewed) is the authorfunder All rights reserved No reuse allowed without permission The copyright holder for this preprint (which was httpdxdoiorg101101080747doi bioRxiv preprint first posted online Oct 13 2016
Spike-In RNA variant controls for RNA-Sequencing bioRxiv upload 2016-10-13
17
Figure 5 ǀ SIRV and endogenous mRNA expression analyses are affected similarly when changing
data evaluation pipelines Binned apparent LFC-moduli are shown in histograms when comparing
results obtained by different pipelines evaluating identical NGS data sets from A C) the same
samples or B D) different samples Exemplarily the comparison with the best P3 vs P1 (black
symbols) and the worst agreement P4 vs P2 (red symbols) are shown The charts compare side-by-
side the results from the SIRV controls (green) all endogenous transcripts (black outline) and
endogenous transcripts within the medium-to-high concentration range of 10 to 2250 TPM or FPKM
(blue) The average of all intra-pipeline results are shown in grey The differences Δ between
not peer-reviewed) is the authorfunder All rights reserved No reuse allowed without permission The copyright holder for this preprint (which was httpdxdoiorg101101080747doi bioRxiv preprint first posted online Oct 13 2016
Spike-In RNA variant controls for RNA-Sequencing bioRxiv upload 2016-10-13
18
analyses with the same and with different pipelines show the losses in the bins 0 lt ǀLFCǀ lt 1 and the
corresponding gain in the other bins ǀLFCǀ gt 1 The increase of the FP-rate purely caused by the
pipeline changes vs the TP range is given in the summary graphs E and F) The 1st bins 0 lt ǀLFCǀ lt 1
are divided into two 0 lt ǀLFCǀ lt 05 and 05 lt ǀLFCǀ lt 1 which facilitates the easier tracking of the
results from the SubMixes4 as shown in Fig 4 were in both figures the 1st fraction is signed with 1b
DISCUSSION
We report a significant contribution to the external RNA controls toolbox in the form of Spike-In RNA
Variants (SIRVs) that address transcription variation and alternative splicing The highly defined mixes
of 69 transcripts aligning to 7 genes enable accurate target-performance evaluations of gene
expression analysis methods which is not possible eg by analyzing larger but only loosely defined
pools of in vitro transcripts (Lahens et al 2014) or limited sets addressing special problems like
fusion genes (Tembe et al 2014) The results presented here demonstrate that the condensed
complexity of the SIRV controls mimic very closely main properties of endogenous mRNAs when
analyzing high-throughput RNA sequencing workflows for their capabilities to determine transcript
variants and their relative quantities The responses of the SIRV controls to changes in the workflows
allow to extrapolate measures for the accuracy precision and foremost inter-experiment
comparability (concordance) to the large pool of endogenous RNAs With the help of the external
controls we could confirm that biases in sequence coverage could mostly be balanced by the
exemplary chosen data evaluation algorithms and for the majority of transcripts consistent relative
abundances were obtained However in our most concordant same sample pipeline comparison
P3P1 already 44 of the controls and 69 of the endogenous RNAs in the medium to high
concentration range appeared to be differentially expressed although none of those were true
positives (TP) because the reductio ad absurdum same sample comparison was using the very same
sets of NGS reads In consequence more than 700 potential endogenous mRNA leads would be non-
validatable false positives (FP) only because of a change in data evaluation pipelines With a
not peer-reviewed) is the authorfunder All rights reserved No reuse allowed without permission The copyright holder for this preprint (which was httpdxdoiorg101101080747doi bioRxiv preprint first posted online Oct 13 2016
Spike-In RNA variant controls for RNA-Sequencing bioRxiv upload 2016-10-13
19
difference between P4 and P2 of 12 at the level of endogenous RNAs an extra 1200 FPs would
obscure the evaluation
The inter-sample comparison between UHRR and HBRR presents a rather extreme case
where around half of all transcripts were calculated to differ by more than 2-fold However the
relative FPTP weight of both comparisons remains similar as P4P2 shows again clearly higher FP-
rates in both controls and endogenous RNAs The linear interpolation (Fig 5E) allows to estimate the
effect of the experimental changes to relative small number of differences as they would be seen in
typical RNA-Seq experiments Exemplarily highlighted are the intersections at 002 and 01 in Fig 5F
TP call rates and FPTP ratios are the important figures to estimate the likelihood and inversely
related effort to validate differentially expressed transcripts For the P3P1 comparison at 2 TP we
approximate an FPTP ratio of 289 The likelihood to actually validate DE transcripts under such
circumstances would reach 035 For the P4P2 comparison the TPFP ratio estimates to mere 014
The related risks and often substantial costs for deducing potential biomarkers would be 25 times
higher Although we demonstrated in the presented example the influence of changes in data
evaluation pipeline within an integrated RNA-Seq workflow the same principles apply to the front
end - the RNA treatment NGS library preparation and sequencing Here unintended variations in
particular sample preparations can only be detected by these external spike-in controls which
operate as markers and reference spots By these means SIRV controls increase the comparability
within and between sequencing experiments at the transcript isoform level SIRVs are designed for
the co-development improvement and monitoring of library preparations sequencing and data
processing
Outlook The presented module and the 92 ERCCs which probe the wide dynamic range using
monocistronic transcripts can be stepwise extended in the future by a) ca 15 poly(A)-tail variations
of monocistronic sequences with defined lengths of 20 and 30 adenosines as well as polyadenylated
and purified RNAs with poly(A)-tail lengths close to 50 100 and above 200 nucleotides b) around 12
above-average long RNAs with 3 5 7 and 10 kb c) approx 3 RNAs each with a low medium and
not peer-reviewed) is the authorfunder All rights reserved No reuse allowed without permission The copyright holder for this preprint (which was httpdxdoiorg101101080747doi bioRxiv preprint first posted online Oct 13 2016
Spike-In RNA variant controls for RNA-Sequencing bioRxiv upload 2016-10-13
20
high GC-content d) a set of 13 mRNA relevant chemical modifications most prominent the cap-
structure (Bokar and Rottman 1998) e) variants which cover aspects of SNPs alleles inversions and
fusion genes which needs to be accounted for in the corresponding sequence annotation files and f)
a random set of small and micro RNAs that comprise all sequence variations at their termini to
account for ligation biases The external control modules need to be fine-tuned with respect to the
dynamic concentration and concentration ratio range and the reference annotations must provide a
mixture of correctly over- and under-annotated genes to better emulate the challenging conditions
for bioinformatical data evaluation Both optimizations will also further increase the congruence of
the presented SIRV module with the endogenous RNAs Eventually all modules together would
develop into a comprehensive set of approximately 250 long RNA controls plus a microRNA module
which will become sufficient for calibration and normalization purposes This new estimate reduces
the scope of designing better spike-in controls compared to the maybe thousands of IVTs which have
been previously anticipated (Kratz and Carninci 2014)
METHODS
SIRV DESIGN AND IN SILICO ANALYSIS The gene structures of seven human model genes
(KLK5 LDHD LGALS17A DAPK3 HAUS5 USF2 and TESK2) were used as scaffold for the design of
SIRV1 to SIRV7 The ENCODE-annotated transcripts as well as added variants were edited to
represent in a redundant and comprehensive manner known transcription and alternative splicing
variations (complete gene structures are shown in the odd-numbered suppl Fig from S3 to S15) All
exon sequences descend from a pool of database-derived genomes (gene fragments from viruses
and bacteriophage capsid proteins and glycoproteins selected based on a GC-content in a range of
30-50) which were modified by inverting the sequence to lose identity while maintaining a kind of
naturally occurring order in the sequences Intron sequences that do not align with exons of another
isoform were drawn from random sequences whereby the GC content was balanced to comply with
not peer-reviewed) is the authorfunder All rights reserved No reuse allowed without permission The copyright holder for this preprint (which was httpdxdoiorg101101080747doi bioRxiv preprint first posted online Oct 13 2016
Spike-In RNA variant controls for RNA-Sequencing bioRxiv upload 2016-10-13
21
the adjacent exonic sequences (Random DNA Sequence Generator
httpwwwfacultyucredu~mmadurorandomhtm)
To verify the sequence exclusivity first the exon sequences were blasted against the entire NCBI
database including ERCCs on the nucleotide and protein level (program BLASTN 2229
httpsblastncbinlmnihgov) The default BLAST parameters used were word size 28 expected
threshold 10 Max matches in query rang 20 MatchMismatch Score 1 -2 Gap Costs Linear Filter
Low complexity regions Mask for lookup table only Search of the nucleotide collection resulted for
all SIRVs in ldquono significant similarity foundrdquo Second in silico generated reads (Griebel t al 2012)
(FLUX-Generator httpsammethnetconfluencedisplaySIMHome command line flux-simulator
-p ~hellipFluxsirv1par -t simulator -x -l -s) were mapped to nine individually selected genomes using
TopHat2 (Kim et al 2013) and Bowtie2 (Langmead and Salzberg2012) Because Bowtie2-aligned
reads can be as short as 20 nt the resulting limited number of mapping reads would be deemed to
be not significant in standard NGS work-flows In contrast when mapping reads with the standard
setting of the splicing-aware TopHat2 program not a single read aligned to any of the tested
genomes Given that both searches found no significant matches off-target mapping of the SIRVs can
essentially be ruled out Therefore the artificial SIRV sequences are suitable for noninterfering
qualitative and quantitative assessments in the context of known genomic systems and
complementary to the ERCC sequences (National Institute of Standards and Technology (NIST)
certified DNA plasmids Standard Reference Materialreg 2374) The SIRV sequences can be found at
httpswwwlexogencomsirvssirvsdownloads in the Source Data files and they are also
deposited at the NCBI Nucleotide Database (PRJNA312485)
SIRV CONSTRUCTS AND THE PRODUCTION OF IN-VITRO TRANSCRIPTS Synthetic gene constructs
were produced (Bio Basic Inc Markham ON Canada) that comprised 5rsquo to 3rsquo a unique restriction
site a T7 RNA polymerase promoter whose 3rsquo G is the first nucleotide of the actual SIRV sequence
which is seamlessly followed by a (A30)-tail that is fused with an exclusive 2nd restriction site These
not peer-reviewed) is the authorfunder All rights reserved No reuse allowed without permission The copyright holder for this preprint (which was httpdxdoiorg101101080747doi bioRxiv preprint first posted online Oct 13 2016
Spike-In RNA variant controls for RNA-Sequencing bioRxiv upload 2016-10-13
22
gene cassettes were cloned into a vector colony-amplified and singularized All SIRV sequence in the
purified plasmids were verified by Sanger-sequencing to identify the correct clones The E coli
cultures were grown in batches to obtain plasmids in the lower microg-scale Double digestion of isolated
plasmids with XhoI and NsiI showed correct insert size and complete restriction Linearized silica-
purified plasmids served as templates in in vitro transcription reactions using T7 transcription kits
(AmpliScribe T7 High Yield Transcription Kit and AmpliScribe T7 Flash Transcription Kit Epicentre
Madison WI) The DNase-treated phenol-extracted and silica-purified in vitro transcription products
were assessed for concentration and purity by spectrophotometry (NanoDrop Thermo Fisher
Scientific Waltham MA) and for integrity by capillary electrophoresis (2100 Bioanalyzer RNA 6000
Pico Kit Agilent Technologies Santa Clara CA)
In the context of variant verification RNA integrity is a very important measure Fragments
arising from incomplete transcription might impose errors on the correct determination of variants
which share those sequences and thereby also affect the overall gene coverage The integrity of the
transcription products was very heterogeneous as expected given the broad sequence variation and
the length of the SIRV transcripts (average 11 kb with 14 RNAs between 20 and 25 kb) A majority
of transcripts therefore had to be purified by at least one of two purification methods Purification
method PP1 is selective for poly(A)-tails and neglects prematurely terminated transcription products
Purification method PP2 is based on size-selective quantitative electrophoresis separating the
correctly sized main products from shorter fragments (transcription break off and degraded
products) and longer fragments (run-through transcription products) After purification the 69 SIRV
RNAs were assessed to be on average 736plusmn343 in the pre-peak fraction 9031plusmn372 in the
main-peak fraction (corresponding to RNAs of correct length) and 236plusmn304 in the post-peak
fraction (mass percentages wt) Noteworthy the risks of a beginning degradation during the initial
denaturation (2 min at 70degC) and the not fully denaturing conditions during RNA microcapillary
electrophoresis tiny noise levels in the baseline and slightly different shapes of the main peak result
in a rather over- than underestimation of pre- and post-peak fractions
not peer-reviewed) is the authorfunder All rights reserved No reuse allowed without permission The copyright holder for this preprint (which was httpdxdoiorg101101080747doi bioRxiv preprint first posted online Oct 13 2016
Spike-In RNA variant controls for RNA-Sequencing bioRxiv upload 2016-10-13
23
rRNasin (Promega Madison WI) was added to 08 Umicrol to minimize the risks of RNase
contamination induced RNA degradation The SIRVs were quantified by absorbance spectroscopy to
adjust all stock solutions to a base concentration of close to but above 50 ngmicrol RNA purity was very
high with A 260280 214plusmn012 and A 260230 217plusmn020
SIRV MIXING SIRV mixes were designed that contain pools of SIRVs (SubMixes) in defined
amounts and ratios by combining accurate volumes of the stock solutions in sufficiently large batch
sizes Pipetting errors vary depending on transfer volumes and range from plusmn4 for 2 microl to plusmn08 for
gt100 microl transfers The precision was experimentally determined with blank solutions Starting with
the stock concentration measurement (NanoDrop accuracy plusmn2 ngmicrol for 50 ngmicrol or plusmn4 ) and
accounting for the entire mixing pathway the accumulative concentration error is expected to range
between plusmn8 and plusmn47 Therefore in the data evaluation one has to account for the experimental
fuzziness by allowing for lower accuracy thresholds of plusmn8 on the linear scale or plusmn011 on the log2-
fold scale respectively The SIRV concentration ratios between two mixes are more precise because
only one final pipetting step defines the concentration differences and synchronizes all SIRVs which
belong to the same SubMix Here a maximal error of plusmn4 (or plusmn0057 on the log2-fold scale) can be
expected between SubMixes while all SIRVs of the same SubMix must propagate coherently into the
final mixes Bioanalyzer traces were used to monitor the relative propagation of the SIRVs PreMixes
and SubMixes during the mixing (Fig 2B) In addition the accurate pipetting of the 8 PreMixes was
controlled by checksums of Nanodrop concentration measurements which deviated by only
0002plusmn34 from the calculated target concentrations and by weighing on an analytical balance
which showed a deviation of 18plusmn065 The final concentration of the SIRV mixes are set to be 253
ngmicrol
not peer-reviewed) is the authorfunder All rights reserved No reuse allowed without permission The copyright holder for this preprint (which was httpdxdoiorg101101080747doi bioRxiv preprint first posted online Oct 13 2016
Spike-In RNA variant controls for RNA-Sequencing bioRxiv upload 2016-10-13
24
SPIKING OF REFERENCE RNA WITH SIRV MIXES In general SIRV mixes can be used with crude
cell extracts purified total RNA rRNA-depleted RNA or poly(A)-enriched RNA Important the spike-in
ratios have to be chosen in concordance with the desired final SIRV content the RNA preparation
method and if known the expected mRNA content One widely applicable spike-in ratio can be
obtained by adding 006 ng of controls to approximately 100 ng of total RNA In the presented
examples the total RNA mass of one single aliquot RNA was 100 ng of UHRR in RC-0 and 1128 ng of
HBRR in RC-1 The reference RNA in RC-2 was calculated to be 10427 ng (Fig S2) The high-
concentrated and thereby stable SIRV mix stocks with 253 ngmicrol and ERCC mix stocks with 30 ngmicrol
(ERCC Spike-In Mixes 1 and 2 by Ambion Thermo Fisher Waltham MA) were diluted just prior to the
spiking to facilitate the mixing of manageable volumes For example the final 11000 dilution
reduced the SIRV mix concentration to 253 pgmicrol from which 237 microl were required to spike a 100 ng
total RNA sample with 006 ng SIRVs The RC-samples were produced in large batches to yield
hundreds of samples allowing for a protocol with fewer dilutions and larger volumes reducing
thereby sources of experimental errors
NGS LIBRARY PREPARATION AND SEQUENCING The experiments were carried out in technical
triplicates From 1 microg RC-0 RC-1 or RC-2 RNA in total nine NGS libraries were prepared by Fasteris SA
(Plan-les-Ouates CH) using the TruSeq stranded mRNA library preparation kit with polyA selection
(Illumina Inc San Diego CA) All primary library templates were amplified with 14 PCR cycles to
reach reproducible concentrations 155plusmn45 nM and insert sizes 165plusmn10 bp An equimolar lane-mix
was sequenced at the CSF Campus Science Support Facilities GmbH (CSF Vienna AUT) in PE125
mode in one lane of a HiSeq 2500 flowcell in 125 bp paired-end mode using V4 chemistry The run
yielded 305 M raw reads 293 M after demultiplexing and trimming which corresponds to a read
depth of 326plusmn22 M reads per library
not peer-reviewed) is the authorfunder All rights reserved No reuse allowed without permission The copyright holder for this preprint (which was httpdxdoiorg101101080747doi bioRxiv preprint first posted online Oct 13 2016
Spike-In RNA variant controls for RNA-Sequencing bioRxiv upload 2016-10-13
25
READ PROCESSING AND MAPPING Standard data processing routines (bbduk part of BBMap by
B Bushnell to be found at sourceforgenetprojectsbbmap) were applied removing low quality
reads and trimming adapter sequences Due to variable stringencies the mappers produced different
read statistics STAR mapped against the genome 897plusmn59 of the reads (864plusmn56 uniquely) and
TopHat2 852plusmn57 (794plusmn52 uniquely) Bowtie2 mapped against the transcriptome 693plusmn18
reads (151plusmn15 uniquely)
ESTIMATION OF THE MRNA CONTENTS Based on the obtained read distributions the relative
mass partition between external controls and endogenous RNA fraction can be estimated Because
the library preparation uses a poly(A)-enrichment step the targeted endogenous RNA corresponds
almost exclusively to the mRNA content of the samples The propagation of the input mass ratio to
the output read ratio depends on both the mRNA content and the efficiencies of how controls and
mRNA proceed through the library preparation The relationship is described by Eqn 1
reRNA times prod(1 rconifrasl )
j
i=1
= (EeRNA times meRNA) times prod(1 (Econi times mconi)frasl )
j
i=1
Equation 1
with r number of reads from eRNA the endogenous RNA fraction here mRNA and con the
controls here SIRVs and ERCC E the relative efficiency of how the fraction proceeds through the
workflow and m the input mass
Ratios are measured as relative read counts and the results as a product of efficiencies and
apparent amounts are also relative measures Therefore at least one de facto arbitrary reference
point needs to be defined to deduce comparable absolute results Several reference points or
default values can be defined which lead to different dependent variables and imply slightly variable
interpretation of the results The following three calculation examples are simple deductions from
not peer-reviewed) is the authorfunder All rights reserved No reuse allowed without permission The copyright holder for this preprint (which was httpdxdoiorg101101080747doi bioRxiv preprint first posted online Oct 13 2016
Spike-In RNA variant controls for RNA-Sequencing bioRxiv upload 2016-10-13
26
the ratio shown in Eqn 1 with the ERCC (con1) and the SIRVs (con2) respectively Variation 1 is
explained in greater detail while in the other variants only the differing aspects are highlighted
Variation 1 i) Here the first assumption is that the mRNA content in UHRR (Agilent Santa
Clara CA) is 3 (factor 003) and 2 (factor 002) in HBRR (Ambion Thermo Fisher Waltham MA)
which stays in close agreement to previous estimates concluded from experiments by Shippy et al in
2006 The amounts of total RNA were measured by Nanodrop absorbance spectroscopy The UHRR
samples contained 100 ng and the HBRR samples 1128 ng The mixing ratio of (2times RC-0) (1times RC-1)
determines the concentration of the 3rd sample RC-2 and further the amount of total RNA (10427
ng) as well as its related mRNA content (2times100 ng times 3 + 1times1128 ng times 2 ) (2times100 ng + 1times1128
ng) = 264 (factor 0026) The mRNA masses of the samples are calculated by the measured total
RNA input amounts and default mRNA contents are 3 ng 2256 ng and 2752 ng The second
assumption is that the endogenous mRNAs proceed with the maximal efficiency of 100 (factor 1)
through library preparation and sequencing The input of the spike-in controls is the product of the
concentration values which were either measured as in the case of the SIRV stocks or stated by the
vendor as in the case of the ERCC stocks and the pipetted volumes Both are treated as de facto
measured values
ii) The relative amounts of reads which have been assigned to either endogenous mRNA
ERCCs or SIRVs are obtained from the mapping statistics (read classification)
iii) The ratio of mass input to reads output allows to calculate the propagation efficiency of
the controls relative to the default efficiency of the endogenous mRNA In the present experiment
the SIRVs progress with a relative efficiency of 867plusmn57 and the ERCCs with 416plusmn47 The
significant difference between the relative efficiency of both controls is very likely caused by the
different lengths of the poly(A)-tails which might influence a different binding efficiency during
poly(A)-enrichment step The SIRVs with a 30 nt long poly(A)-tail perform much more in concordance
with the endogenous mRNA as the ERCCs which contain shorter and variable poly(A)-tails ( 23 nt)
The observed small differences in the experiments using RC-0 RC-1 or RC-2 could be caused by a
not peer-reviewed) is the authorfunder All rights reserved No reuse allowed without permission The copyright holder for this preprint (which was httpdxdoiorg101101080747doi bioRxiv preprint first posted online Oct 13 2016
Spike-In RNA variant controls for RNA-Sequencing bioRxiv upload 2016-10-13
27
two-way interference of samples and controls However the deviations are small and can rather be a
result of minor inaccuracies in determining the relative input amounts Both hypotheses would need
to be verified by a series of repeats with the aim to resolve potential influences of pipetting during
the sample preparation variations in the library preparation and other contributions
Variation 2 Here no varying interferences between samples and controls are permitted
which means that relative efficiencies of the controls are considered to be constant The causes of
the experimental variations are exclusively assigned to the input amounts (alike hypothesis two in
the above example in discussing the deviation of the results in RC-2) This would translate into input
standard deviations of 118 (SIRVs) and 76 (ERCCs) The variations meld all accumulating errors
made in determining the concentration of the control stock solutions preparing the subsequent
dilutions pipetting the samples and controls during the spike-in step itself as well as determining the
amount of sample RNA in the first place Against the background of potential errors the calculated
results can be considered as highly consistent
Variation 3 In addition to the assumptions made for the measurement of sample RC-0
the spike-in of 006 ng SIRVs to all samples is also set as default Alike variation 2 the experiments in
RC-1 and RC-2 adopt the same default setting for the relative efficiencies calculated in RC-0
According to the ratio of Eqn 1 one can obtain mRNA contents as well as ERCC input amounts in this
case for samples RC-1 and RC-2 The mRNA content of the HBRR sample (RC-1) relative to the default
mRNA content in the UHRR sample (set to 3 ) would be 172 lower than the previously assumed
2 According to the present mixing scheme it would also imply that sample RC-2 has an mRNA
content of 254 up from the calculated 234 The offsets of -79 is again small and very likely
refers to the level of accuracy in the experimental results as discussed above Using this method the
spiking of samples with controls such as the SIRVs allows to closely estimate the relative mRNA
content of any unknown sample and to draw conclusions eg on the transcriptional state of tissues
cell suspension or individual cells
not peer-reviewed) is the authorfunder All rights reserved No reuse allowed without permission The copyright holder for this preprint (which was httpdxdoiorg101101080747doi bioRxiv preprint first posted online Oct 13 2016
Spike-In RNA variant controls for RNA-Sequencing bioRxiv upload 2016-10-13
28
COEFFICIENT OF DEVIATION We implemented a strand specific Coefficient of Deviation
(CoD) which aims to reflect the quality of NGS pipelines targeted at specific effects in particular
lsquospikenessrsquo of the coverage while systematic effects like drop of the coverage at Transcription Start
Sites (TSS) and Transcription End Sites (TES) are being suppressed The CoD is implemented by Eqn
2
CoD = CoD(LTSSLTES) = sum (cidealp- crealp)2
TESe
p=TSS1
divide sum cidealp
TESe
p=TSS1
Equation 2
which is calculated in strand orientation for contigs along all exonic nucleotide position (p) from the
first annotated TSS (TSS1) up to the last annotated TES (TESe) whereby cideal are the ideal coverages
with the optimized transient regions (LrsquoTSS LrsquoTES) and creal are the real coverages scaled as such that
the total integrals along all positions of ideal and real coverages are equal
The transient function at TSS and TES is the error function erf(x) which corresponds to
Cufflinks assumption about normally distributed fragment lengths (Trapnell et al 2012) Since erf(x)
is a non-algebraic function we used the algebraic approximation by Abramowitz and Stegun
(httpsenwikipediaorgwikiError_function eq 7125) Once the optima (LrsquoTSS LrsquoTES ) are found
we declare CoD(LrsquoTSS LrsquoTES) to be the ultimate CoD value which mostly eliminated the transient region
effects We implemented an optimization algorithm (Nelder-Mead downhill simplex method) and
used as starting values (L0TSS L0
TES ) lengths of 150 In some cases the optimum found can be beyond
a reasonable range of values Therefore we censor the output Lopt of the mathematical optimization
as follows Lcensored = 50 if Lrsquo lt 50 Lcensored = 350 if Lrsquo gt 350 This corresponds to the maximal range of
not peer-reviewed) is the authorfunder All rights reserved No reuse allowed without permission The copyright holder for this preprint (which was httpdxdoiorg101101080747doi bioRxiv preprint first posted online Oct 13 2016
Spike-In RNA variant controls for RNA-Sequencing bioRxiv upload 2016-10-13
29
200plusmn150 This censoring needed to be applied in 8 cases out of 84 SIRVmixstrandend
combinations ie less than in 10
TRANSCRIPT CONCENTRATION MEASUREMENTS In order to estimate expression values on
transcript levels we applied RSEM (Li and Dewey 2011) which uses a Bayesian Network to compute
the likelihood of each fragment belonging to a given transcript Salmon (Patro et al 2015) estimates
the transcript expression values by a k-mer based mapping Similar to RSEM it uses an expectation-
maximization (EM) algorithm to compute the maximum likelihood of relative abundances Cufflinks2
(Trapnell et al 2013) estimates the transcript abundances with a coverage-based maximum
likelihood approach It determines the probability of read assignments to isoforms
DIFFERENTIAL EXPRESSION ANALYSIS We used the DESeq2 package (Love et al 2014) for
calculation of fold-differences between the results from different pipelines and different input samples
mixtures As explained in the main text all outputs from the evaluated pipelines (in form of relative
concentration measures) have been scaled Scaling by linear transformation is needed as a
consequence of the different mRNA contents in the samples but also to eventually compensate any
potential pipetting errors when small aliquots typically in the range of very few microliter are added
to individual samples The RC-samples in this experiment were produced in a large batch to ensure
high accuracy in volumetric ratios The main sample pool is practically invariant to the small relative
contribution of the controls but was technically treated in the same way by scaling the main sample
pools to identical sizes First SIRV concentrations were scaled to reach together 69 in E0 685 in E1
and 708 in E2 which is the dimensionless value identical to the fmolmicrol in the respective SIRV stock
solutions Then the lower threshold was set to 10-6 which corresponds to original FPKM values of
around 5∙10-3 ⅟7th of one read for a 1 kb long transcript at a read depth of 30 Mio reads or 1 gene
specific read to be divided between 7 equally possible transcript variants at said 1 kb length section
The threshold is to be understood as less than or equal to 10-6 which defines an averaged read
not peer-reviewed) is the authorfunder All rights reserved No reuse allowed without permission The copyright holder for this preprint (which was httpdxdoiorg101101080747doi bioRxiv preprint first posted online Oct 13 2016
Spike-In RNA variant controls for RNA-Sequencing bioRxiv upload 2016-10-13
30
resolution of the particular workflow at the given read depth By these means all ratios remain defined
Second for the DESeq2 calculations we multiplied all values with 106 after which fractions were
rounded to the closest integer We understand that for no-change hypothesis testing which is the
main purpose of the DESeq2 package transforming the relative concentrations (FPKM or TPM) to
lsquoquasi-read-countsrsquo is not recommended since DESeq2 internally corrects for library size by using size
factors However in our application we do not use the probability of the hypothesis rejection (P
values) but the raw fold changes detected (irrespectively of the dispersion values for that given
transcript) We also took into account the potential danger of censoring the input (by unintentionally
eliminating transcripts represented by extremely low FPKM or TPM values) by setting a suitable
threshold as described above The figures show only two differential expression analyses because the
3rd concentration ratio E2E0 is the product of E1E0 and E2E1
ERROR RATE ANALYSIS The four red data points two from the SIRV controls (circles) and two
from the endogenous mRNAs (squares) from the best agreement (P3 vs P1) and the four
corresponding black data points from the worst agreement (P4 vs P2) as shown in fig 5E were fitted
by linear approximation using the relationship as derived for Eqn 3
TP + FP = 1
FP = N times ER = (1-TP) times ER
(TP+FP) = TP + ER - TP times ER
(TP+FP) = (1-ER) times TP + ER Equation 3
where TP is the relative portion of true positives (differentially expressed as in our definition
possessing a LFC gt 1) N the relative portion of negatives ER the error rate at which negatives are
falsely detected as positives to result in false positives FP The least squares fitting method was
applied to derive values for the slope (1-ER) and the intercept ER
not peer-reviewed) is the authorfunder All rights reserved No reuse allowed without permission The copyright holder for this preprint (which was httpdxdoiorg101101080747doi bioRxiv preprint first posted online Oct 13 2016
Spike-In RNA variant controls for RNA-Sequencing bioRxiv upload 2016-10-13
31
The transformation of Eqn 3 leads to the relationship of Eqn 4
TP FPfrasl = (TP+FP) TPfrasl -1 Equation 4
which has been used for the graph in fig 5F In the present context the concept of ROC-curves is not
applicable because the true or false negatives are indistinguishable as long the ground truth of the
endogenous RNA are unknown
DATA ACCESS Sequencces and source data files data are in the process to be deposited at
NCBI under BioProject ID PRJNA312485
ACKNOWLEDGMENTS We thank SA Munro and M Salit (Material Measurement
Laboratory National Institute of Standards and Technology) for their efforts in further developing the
concepts of the External RNA Control Consortium (ERCC) in an updated suite of RNA controls and
analysis methods called ERCC 20 We thank A Tuerk for his contributions in finding suitable human
model genes G Wiktorin for carrying out the RSEM calculations M Mihaylova in helping with the
graphics design and I Gabler for critically reading the manuscript
AUTHOR CONTRIBUTIONS LP PK and TR designed the sequences and mixtures PK and GH
prepared the in vitro transcripts and spike-in mixtures TR AS and LP designed the research and
the experiments MA IH and TR evaluated the data TR and LP wrote the manuscript
DISCLOSURE DECLARATION The authors are employees of Lexogen GmbH from which the SIRVs
can be bought and AS has equity stakes in Lexogen GmbH LP PK and TR are named as
not peer-reviewed) is the authorfunder All rights reserved No reuse allowed without permission The copyright holder for this preprint (which was httpdxdoiorg101101080747doi bioRxiv preprint first posted online Oct 13 2016
Spike-In RNA variant controls for RNA-Sequencing bioRxiv upload 2016-10-13
32
inventors on a patent application regarding the production and use of RNA transcript variants and
Lexogen GmbH is the owner of this patent application
REFERENCES
Baker SC Bauer SR Beyer RP Brenton JD Bromley B Burrill J Causton H Conley MP Elespuru R Fero M et al 2005 The External RNA Controls Consortium a progress report Nat Methods 2(10) 731-4 Bokar JA Rottman FM 1998 Biosynthesis and Functions of Modified Nucleosides in Eukaryotic mRNA In Modification and Editing of RNA (eds Grosjean H Benne R) pp 183-200 ASM Press Washington DC Dobin A Davis CA Schlesinger F Drenkow J Zaleski C Jha S Batut P Chaisson M Gingeras TR 2013 STAR ultrafast universal RNA-seq aligner Bioinformatics 29(1) 15-21 Fed Reg Doc 2015-19742 2015 External RNA Controls Consortium - Call for Participation and Contributions to a Sequence Library Federal Register Citation 80 FR 48296 Griebel T Zacher B Ribeca P Raineri E Lacroix V Guigoacute R Sammeth M 2012 Modelling and simulating generic RNA-Seq experiments with the flux simulator Nucleic Acids Res 40(20) 10073-83 Jiang L Schlesinger F Davis CA Zhang Y Li R Salit M Gingeras TR Oliver B 2011 Synthetic spike-in standards for RNA-seq experiments Genome Res 21(9) 1543-51 Kim D Pertea G Trapnell C Pimentel H Kelley R Salzberg SL 2013 TopHat2 accurate alignment of transcriptomes in the presence of insertions deletions and gene fusions Genome Biol 14(4) R36 Kratz A Carninci P 2014 The devil in the details of RNA-seq Nat Biotechnol 32(9) 882-4 Lahens NF Kavakli IH Zhang R Hayer K Black MB Dueck H Pizarro A Kim J Irizarry R Thomas RS et al 2014 IVT-seq reveals extreme bias in RNA sequencing Genome Biol 15(6) R86 Langmead B Salzberg SL 2012 Fast gapped-read alignment with Bowtie 2 Nat Methods 9(4) 357-9 Li B Dewey CN 2011 RSEM accurate transcript quantification from RNA-Seq data with or without a reference genome BMC Bioinformatics 12 323 Li J Jiang H Wong WH 2010 Modeling non-uniformity in short-read rates in RNA-Seq data Genome Biol 11 R50 Li S Tighe SW Nicolet CM Grove D Levy S Farmerie W Viale A Wright C Schweitzer PA Gao Y et al 2014 Multi-platform assessment of transcriptome profiling using RNA-seq in the ABRF next-generation sequencing study Nat Biotechnology 32 915-25 Love MI Huber W Anders S 2014 Moderated estimation of fold change and dispersion for RNA-seq data with DESeq2 Genome Biol 15(12) 550
not peer-reviewed) is the authorfunder All rights reserved No reuse allowed without permission The copyright holder for this preprint (which was httpdxdoiorg101101080747doi bioRxiv preprint first posted online Oct 13 2016
Spike-In RNA variant controls for RNA-Sequencing bioRxiv upload 2016-10-13
33
Mortazavi A Williams BA McCue K Schaeffer L Wold B 2008 Mapping and quantifying mammalian transcriptomes by RNA-Seq Nat Methods 5(7) 621-8 Patro R Duggal G Kingsford C 2015 Accurate fast and model-aware transcript expression quantification with Salmon bioRxiv preprint doi httpdxdoiorg101101021592 Shippy R Fulmer-Smentek S Jensen RV Jones WD Wolber PK Johnson CD Pine PS Boysen C Guo X Chudin E et al 2006 Using RNA sample titrations to assess microarray platform performance and normalization techniques Nat Biotechnol 24(9) 1123-31 SEQCMAQC-III Consortium 2014 A comprehensive assessment of RNA-seq accuracy reproducibility and information content by the Sequencing Quality Control Consortium Nat Biotechnology 32 903-14 Tembe WD Pond SJ Legendre C Chuang HY Liang WS Kim NE Montel V Wong S McDaniel TK Craig DW Carpten JD 2014 Open-access synthetic spike-in mRNA-seq data for cancer gene fusions BMC Genomics 15 824 Trapnell C Roberts A Goff L Pertea G Kim D Kelley DR Pimentel H Salzberg SL Rinn JL Pachter L 2012 Differential gene and transcript expression analysis of RNA-seq experiments with TopHat and Cufflinks Nat Protoc 7(3) 562-78 Trapnell C Hendrickson DG Sauvageau M Goff L Rinn JL Pachter L 2013 Differential analysis of gene regulation at transcript resolution with RNA-seq Nat Biotechnol 31(1) 46-53 van Dijk EL Jaszczyszyn Y Thermes C 2014 Library preparation methods for next-generation sequencing tone down the bias Exp Cell Res 322(1) 12-20 Wang Z Gerstein M Snyder M 2009 RNA-Seq a revolutionary tool for transcriptomics Nat Rev Genet 1 57-63 Zheng W Chung LM Zhao H 2011 Bias detection and correction in RNA-Sequencing data BMC Bioinformatics 12290
not peer-reviewed) is the authorfunder All rights reserved No reuse allowed without permission The copyright holder for this preprint (which was httpdxdoiorg101101080747doi bioRxiv preprint first posted online Oct 13 2016
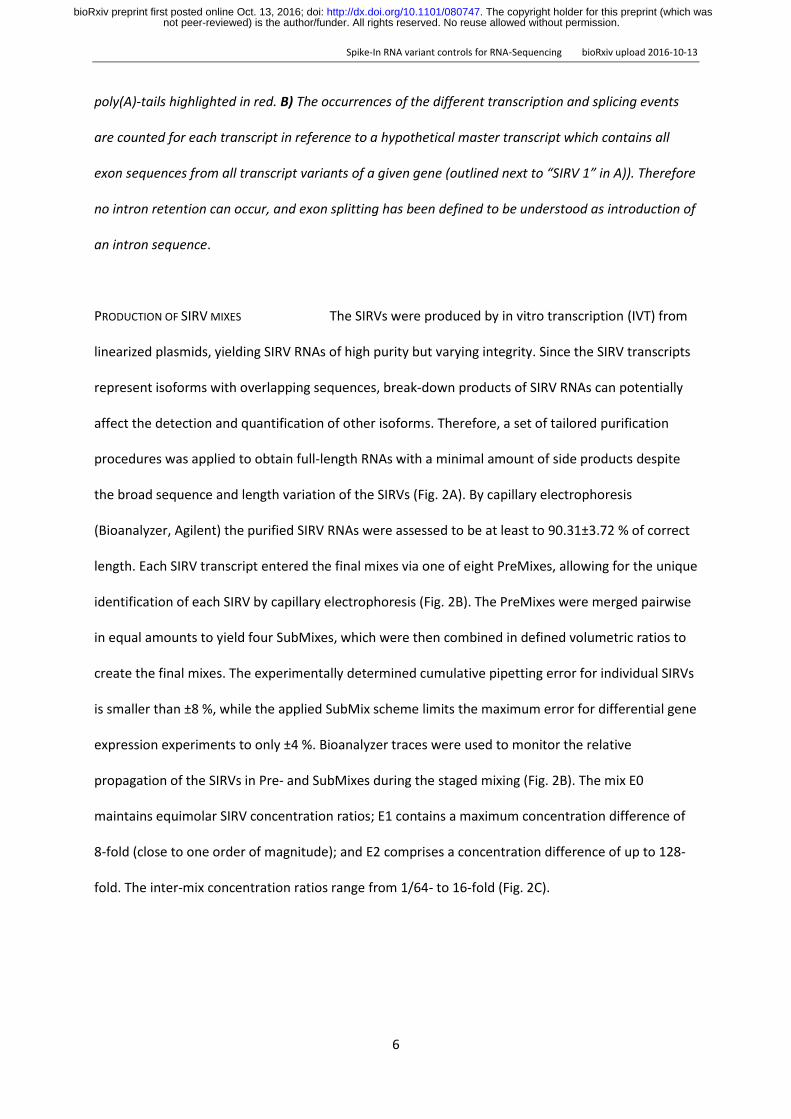
Spike-In RNA variant controls for RNA-Sequencing bioRxiv upload 2016-10-13
6
poly(A)-tails highlighted in red B) The occurrences of the different transcription and splicing events
are counted for each transcript in reference to a hypothetical master transcript which contains all
exon sequences from all transcript variants of a given gene (outlined next to ldquoSIRV 1rdquo in A)) Therefore
no intron retention can occur and exon splitting has been defined to be understood as introduction of
an intron sequence
PRODUCTION OF SIRV MIXES The SIRVs were produced by in vitro transcription (IVT) from
linearized plasmids yielding SIRV RNAs of high purity but varying integrity Since the SIRV transcripts
represent isoforms with overlapping sequences break-down products of SIRV RNAs can potentially
affect the detection and quantification of other isoforms Therefore a set of tailored purification
procedures was applied to obtain full-length RNAs with a minimal amount of side products despite
the broad sequence and length variation of the SIRVs (Fig 2A) By capillary electrophoresis
(Bioanalyzer Agilent) the purified SIRV RNAs were assessed to be at least to 9031plusmn372 of correct
length Each SIRV transcript entered the final mixes via one of eight PreMixes allowing for the unique
identification of each SIRV by capillary electrophoresis (Fig 2B) The PreMixes were merged pairwise
in equal amounts to yield four SubMixes which were then combined in defined volumetric ratios to
create the final mixes The experimentally determined cumulative pipetting error for individual SIRVs
is smaller than plusmn8 while the applied SubMix scheme limits the maximum error for differential gene
expression experiments to only plusmn4 Bioanalyzer traces were used to monitor the relative
propagation of the SIRVs in Pre- and SubMixes during the staged mixing (Fig 2B) The mix E0
maintains equimolar SIRV concentration ratios E1 contains a maximum concentration difference of
8-fold (close to one order of magnitude) and E2 comprises a concentration difference of up to 128-
fold The inter-mix concentration ratios range from 164- to 16-fold (Fig 2C)
not peer-reviewed) is the authorfunder All rights reserved No reuse allowed without permission The copyright holder for this preprint (which was httpdxdoiorg101101080747doi bioRxiv preprint first posted online Oct 13 2016
Spike-In RNA variant controls for RNA-Sequencing bioRxiv upload 2016-10-13
7
Figure 2 ǀ SIRV RNA integrity and mixing scheme
A) Examples of high SIRV integrity T7 transcription of SIRV612 yielded RNA of almost uniform correct
length with 4924 in the pre- main- and post-peak fractions as analyzed by Bioanalyzer RNA
6000 Pico Chip (Agilent) capillary electrophoresis The lower integrity of SIRV101 and SIRV203 after T7
transcription (blue traces) was increased using tailored purification protocols PP1 and PP2 (red
traces) Finally the integrity of all SIRVs was ge85 wt with on average 903plusmn37 wt in the main peak
fraction B) 8 PreMixes received in equimolar entities between 6 and 11 SIRVs which varied in length
to be unambiguously traced in Bioanalyzer runs PreMixes were combined pairwise in equal ratios to
yield SubMixes The resulting 4 SubMixes were combined in defined ratios to obtain the final Mixes
not peer-reviewed) is the authorfunder All rights reserved No reuse allowed without permission The copyright holder for this preprint (which was httpdxdoiorg101101080747doi bioRxiv preprint first posted online Oct 13 2016
Spike-In RNA variant controls for RNA-Sequencing bioRxiv upload 2016-10-13
8
E0 E1 and E2 Measured traces are shown in red and traces computed from the PreMix traces to
validate the composition of the SubMixes and final Mixes are shown in blue A color code for the
SubMixes is introduced to follow groupings of SIRVs throughout the subsequent data analysis C)
Graphical representation of the relative SIRV concentrations and concentration ratios according their
SubMix belonging The total molarity and weight of the final mixes are evenly balanced at 697
fmolmicrol and 253 ngmicrol
Three different samples with SIRVs RC-0 RC-1 and RC-2 (for details see methods section) were
prepared NGS libraries generated and sequenced in paired-end 125 bp mode
NGS DATA EVALUATION All demultiplexed NGS reads were mapped to the human
genome (GRCh38p2) the ERCC sequences and the SIRVome by using the common splice-aware
aligners STAR (Dobin et al 2012) TopHat2 (Kim et al 2013) while Bowtie2 (Langmead and Salzberg
2012) was used to map reads to a set of accordingly generated transcript sequences Bowtie2 aligned
reads were further processed by RSEM (Li and Dewey 2011) a combination referred to below as data
evaluation pipeline P1 Salmon is an autarkic program algorithm (Patro et al 2015) referred to as P2
STAR as well as TopHat2 aligned reads were further processed by Cufflinks2 (Trapnell et al 2012)
and resemble the evaluation pipelines P3 and P4
ESTIMATION OF THE MRNA CONTENTS On the basis of the assumption that the RNAs in the
samples and the spike-in controls are equally targeted by the library preparation due to similar
length distributions (SIRV 1129plusmn15 nt ERCC 880plusmn26 nt and based on the P4 results UHRR 1538 nt
and HBRR 1641 nt) the relative mass partition between controls and endogenous RNA can be
determined The propagation of the input amounts to the output read ratio depends on the mRNA
content and the relative recovery efficiencies of controls and mRNA after the library preparation
Therefore one reference value needs to be defined or externally determined which we chose to be
not peer-reviewed) is the authorfunder All rights reserved No reuse allowed without permission The copyright holder for this preprint (which was httpdxdoiorg101101080747doi bioRxiv preprint first posted online Oct 13 2016
Spike-In RNA variant controls for RNA-Sequencing bioRxiv upload 2016-10-13
9
an mRNA content of 3 in UHRR (Shippy et al 2006) We further set the efficiency of the
endogenous mRNA proceeding through this particular library preparation to 100 The SIRVs can
then be calculated to progress with a relative efficiency of 870plusmn6 allowing to determine the
mRNA content in the second sample HBRR to be 172 The mRNA content in the mixed samples
RC-2 is then assessed to be 234 which corresponds to a minor -91 offset relative to the
theoretical outcome based on the RC-0 and RC-1 measurements In the TruSeq library preparation
the 30 nt long poly(A)-tail of the SIRVs ensures an enrichment similar to the endogenous mRNAs The
ERCC controls show a lower recovery efficiency of 416plusmn47 most likely due to their shorter poly(A)-
tails which vary between 19 and 25 adenines ( 23 nt) The results are summarized in suppl Tab S1
COMPARISON BETWEEN EXPECTED AND MEASURED COVERAGE AND CONCENTRATION MEASURES For the first
time the ground truth of complex input sequences is available allowing detailed target-performance
comparisons for read alignment relative abundance calculation and differential expression
determination Fig 3 shows for one example gene SIRV 3 in E0 the expected coverages and counts
of the telling junctions together with the coverages obtained by STAR and TopHat2 mapping NGS
workflow-specific read start-site distributions lead to coverage patterns with inherent terminal
deficiencies for which the expected coverage has been adjusted accordingly However in the
measured coverages these systematic start- and end-site biases are accompanied by a variety of
biases which introduce severe local deviations from the expected coverage
not peer-reviewed) is the authorfunder All rights reserved No reuse allowed without permission The copyright holder for this preprint (which was httpdxdoiorg101101080747doi bioRxiv preprint first posted online Oct 13 2016
Spike-In RNA variant controls for RNA-Sequencing bioRxiv upload 2016-10-13
10
Figure 3 ǀ Comparison of the expected and the measured coverages for the SIRV3 locus in mix E0
A) Individual transcripts of SIRV3 with transcripts on the plus strand in blue and in red for the ones on
the minus strand Color code indicates the SubMix allocation B) The expected SIRV3 coverage is
shown as superposition of individual transcript coverages in which the terminal sites have been
modelled by a transient error function The measured coverages after read mapping by TopHat2 are
shown in grey The measured coverages and number of splice junction reads were normalized to
obtained identical areas under the curves and identical sums of all junctions for the expected and
measured data The measured splice junction reads are shown by the numbers before the brackets
not peer-reviewed) is the authorfunder All rights reserved No reuse allowed without permission The copyright holder for this preprint (which was httpdxdoiorg101101080747doi bioRxiv preprint first posted online Oct 13 2016
Spike-In RNA variant controls for RNA-Sequencing bioRxiv upload 2016-10-13
11
while the expected values are shown inside the brackets The CoD values are given for the plus and
minus strand in the respective colors C) Differences between mapping by STAR aligner and TopHat2
The black arrows indicate the direction of positive differences Percentages refer to the relative
changes of the measured splice junction reads
To obtain a comparative measure gene-specific coefficients of deviation CoD were calculated CoDs
describe the often hidden biases in the sequence data predominantly caused by an inhomogeneous
library preparation but also by the subsequent sequencing and mapping In the presented example
the stranded TruSeq library preparation with the Illumina HiSeq2500 sequencing and mapping by
TopHat2 results in a mean CoD of 0190plusmn0193 across all SIRVs For the sense oriented SIRVs the
mean CoD is 0275plusmn0223 and for the antisense SIRVs which cover a region of fewer overlapping
transcript annotations the mean CoD is 0090plusmn0076 The coverage target-performance comparison
highlights the inherent difficulties in deconvoluting read distributions to correctly identify transcript
variants and determine concentrations The distribution of telling reads splice junctions and reads
towards the termini are references for the assignment of the remaining reads before calculating
relative transcript variant abundances Not surprisingly although the majority of junction counts
correlates well with the expected values the high CoD values indicate that numerous telling reads
deviate significantly within the context of the individual mixes They also differ between mixes which
affects differential expression measurements (see Fig 3B and for the coverage of all seven SIRV
genes the even suppl Fig from S4 to S16)
The CoD does not allow to distinguish between periodicity and randomness in the biases nor
does it forecast how well a data evaluation strategy can cope with the bias contributions
Nevertheless smaller CoD values are expected to correlate with a simpler and less error-prone data
evaluation The CoD values can be taken as a first indicative measure to characterize the mapped
data and to compare data sets for similarity up to this point in the workflow Target-performance
comparisons of all SIRV genes in all three mixes can be found in the supplemental information
not peer-reviewed) is the authorfunder All rights reserved No reuse allowed without permission The copyright holder for this preprint (which was httpdxdoiorg101101080747doi bioRxiv preprint first posted online Oct 13 2016
Spike-In RNA variant controls for RNA-Sequencing bioRxiv upload 2016-10-13
12
The above described four data analysis pipelines P1 to P4 were used to calculate transcript
abundances for 69 SIRV and 196˙165 annotated endogenous transcripts All obtained results are
relative concentration measures yielding either Fragments Per Kilobase of exon per Million
fragments mapped (FPKM) (Mortazavi 2008) or Transcripts Per Million (TPM) (Li and Dewey 2011)
The concentrations were scaled by linear transformation in such way that all SIRVs together reach 69
in E0 685 in E1 and 708 in E2 which is the dimensionless value identical to the fmolmicrol in the
respective SIRV stock solutions In consequence the relative quantities of the SIRVs are compatible
to the normalized scale which was introduced in Fig 2C Boxplots in Fig 4 show exemplarily the SIRV
concentrations and two discrete differentials as measured by P3 (results from P1 P2 and P4 are
shown in suppl Fig S17 and standard correlation plots of the four pipelines are shown in suppl Fig
S18) The majority of all SubMix mean concentration values are in concordance with the expected
values The concentration ratios simulating differential expression measurements are less prone to
systematic offsets and show by trend narrower distributions However these correlations highlight
already the issue of obvious and frequent outliers ie transcript variants that are not well resolved
not peer-reviewed) is the authorfunder All rights reserved No reuse allowed without permission The copyright holder for this preprint (which was httpdxdoiorg101101080747doi bioRxiv preprint first posted online Oct 13 2016
Spike-In RNA variant controls for RNA-Sequencing bioRxiv upload 2016-10-13
13
Figure 4 ǀ Box plot overview of calculated concentration values for SIRV mixes and mix ratios
Reads from SIRV mixes E0 E1 and E2 were processed by four different data evaluation algorithms for
transcript quantification Results derived by pipeline P3 are exemplarily shown in reference to the
known inputs (bars in colors corresponding to the SIRV SubMixes of Fig 2) The black circles mark the
mean and the bold dashes the medians of the data points which are shown in grey the boxes span
the 25 to 75 region of the data points and the black whiskers with connecting lines reach up to the
min and max values and indicate also outliers outside the scale of the graph The comparison E1 vs
E0 from sample RC-1 and RC-0 (2nd row) was used for building the histogram of Fig 5B The shaded
area resembles the 1st bin (0leǀLFCǀle1) while the inner section (b1) comprises the fraction 0leǀLFCǀlt05
where the majority of data points originates from SubMix4 (ratio 11) and some ldquooutliersrdquo from
SubMix2 which were actually spiked in at the ratio 21
Heat maps allow to inspect each SIRV in the context of competing transcripts Tab 1B shows
the abundancies as log2-fold changes LFC relative to the expected values for the example of SIRV 6
LFC values consider relative increases and decreases across all concentration ranges likewise An LFC
window of plusmn011 presents the confidence interval as a result from the currently achievable accuracy
not peer-reviewed) is the authorfunder All rights reserved No reuse allowed without permission The copyright holder for this preprint (which was httpdxdoiorg101101080747doi bioRxiv preprint first posted online Oct 13 2016
Spike-In RNA variant controls for RNA-Sequencing bioRxiv upload 2016-10-13
14
in producing the SIRV mixtures We examine the LFC values uncoupled from the adjusted p-values
which provide a statistical measure of the significance level for apparent differential expression By
these means we prevent pipelines to appear more coherent only due to higher noise levels The
accuracy has been calculated for each SIRV as the mean of the LFCs in all three mixes The precision is
a measure of how consistent SIRVs are quantified and has been calculated as the LFC standard
deviation for each SIRV and further for entire pipelines by using all SIRVs Within the presented
example SIRVs can obtain in all four pipelines high precisions of up to 018plusmn007 and high accuracies
of up to -001plusmn010 (SIRV604) In contrast SIRV612 of similar length has an average precision of
569plusmn368 and an accuracy of -386plusmn270 although it was detected by P2 with a high precision of 012
at an accuracy of 018 This quantification of differences between pipelines now directly permits to
assess the effect of changes in workflows and individual experiments
COMPARISON BETWEEN DIFFERENT WORKFLOWS When ranking the four pipelines by said precision P3
gives the lowest value with 129 followed by P4 with 164 P1 with 198 and P2 with 214 However
a sample-specific global target-performance comparison is not the strongest criteria for evaluating
performance differences at transcript resolution For this purpose the apparent differential
expression shows if similar errors are caused by the same or different transcripts The highest
concordance was found between P3 and P1 (labelled P3P1) calculated as standard deviation of all
SIRV LFCs with 101 followed by P4P3 (104) P4P1 (255) P2P1 (288) and P3P2 (309) The
lowest concordance has P4P2 with a value of 412 One section of the resulting heat map for both
extremes is shown in Tab 1C
not peer-reviewed) is the authorfunder All rights reserved No reuse allowed without permission The copyright holder for this preprint (which was httpdxdoiorg101101080747doi bioRxiv preprint first posted online Oct 13 2016
Spike-In RNA variant controls for RNA-Sequencing bioRxiv upload 2016-10-13
15
Table 1 ǀ Variance heat map of SIRV concentration measures detailing SIRV6 by the 4 different
pipelines P1 to P4 A) Given are SIRV transcript identifier SubMix (SM) color code and transcript
lengths (in nucleotides) B) Heat maps showing the log-fold changes (LFC) for the comparison of the
normalized expected and measured SIRV concentrations as a result from the four data evaluation
pipelines P1 to P4 evaluating E0 E1 and E2 Fields with -1 le LFC le 1 are filled with gradient green all
fields with LFC lt -1 with straight blue and all fields with LFC gt 1 with straight red C) From all 6
possible pairwise comparisons P2P1 P3P1 to P4P3 of the normalized measured SIRV
concentrations the one with the smallest (P3P1) and largest (P4P2) median of all LFC are shown
The complete heat map is shown in the suppl Tab S2
not peer-reviewed) is the authorfunder All rights reserved No reuse allowed without permission The copyright holder for this preprint (which was httpdxdoiorg101101080747doi bioRxiv preprint first posted online Oct 13 2016
Spike-In RNA variant controls for RNA-Sequencing bioRxiv upload 2016-10-13
16
The same pipeline comparisons were made with either all endogenous transcripts or the ones in the
higher SIRV expression range and compared to the pipeline concordances calculated with the SIRV
controls (Fig 5) We define the first bin with ǀLFCǀ lt 1 as the bin of no apparently differentially
expressed transcripts independent of the corresponding p-values The other bins contain transcripts
for which the calculated concentrations differ by more than 2-fold hence convene apparently
differentially expressed transcripts (DE) We find that SIRV controls and endogenous transcripts are
evaluated coherently While theoretically no differences are expected pipelines P3 and P1 differ in
their quantification of the same data by 44 for the SIRVs and by 69 for endogenous RNAs in the
SIRV concentration range (Fig 5A) Pipelines P2 and P4 differ to a larger extent when evaluating the
same samples (Fig 5B C) The same correlation is seen in comparisons between different samples
(shown here for RC-0 vs RC-1) The expected DE between reference RNAs UHRR and HBRR of
approximately 50 is evaluated differently by P3 vs P1 (DE of 24 ) and this is mirrored in the
evaluation of the SIRV mixes spiked into these reference RNAs (DE of 49 ) P4 vs P2 performed
worse with a pipeline difference of 39 and 103 for endogenous and SIRV transcripts The
controls show a highly similar increase when comparing P3P1 with P4P2 (21-fold from 49 to
103 ) to the endogenous RNAs (16-fold from 24 to 39 ) Here the average measurement
using the same pipeline provide a pseudo-ground truth which is compared to the measurement
using different pipelines It allows to quantify the additional error caused solely by changes in the
pipeline A change from pipeline P3 to P1 would increase the number of DE-detected transcripts to a
smaller extent than a change from P2 to P4 and this is true for both the SIRV controls and the
endogenous transcripts
not peer-reviewed) is the authorfunder All rights reserved No reuse allowed without permission The copyright holder for this preprint (which was httpdxdoiorg101101080747doi bioRxiv preprint first posted online Oct 13 2016
Spike-In RNA variant controls for RNA-Sequencing bioRxiv upload 2016-10-13
17
Figure 5 ǀ SIRV and endogenous mRNA expression analyses are affected similarly when changing
data evaluation pipelines Binned apparent LFC-moduli are shown in histograms when comparing
results obtained by different pipelines evaluating identical NGS data sets from A C) the same
samples or B D) different samples Exemplarily the comparison with the best P3 vs P1 (black
symbols) and the worst agreement P4 vs P2 (red symbols) are shown The charts compare side-by-
side the results from the SIRV controls (green) all endogenous transcripts (black outline) and
endogenous transcripts within the medium-to-high concentration range of 10 to 2250 TPM or FPKM
(blue) The average of all intra-pipeline results are shown in grey The differences Δ between
not peer-reviewed) is the authorfunder All rights reserved No reuse allowed without permission The copyright holder for this preprint (which was httpdxdoiorg101101080747doi bioRxiv preprint first posted online Oct 13 2016
Spike-In RNA variant controls for RNA-Sequencing bioRxiv upload 2016-10-13
18
analyses with the same and with different pipelines show the losses in the bins 0 lt ǀLFCǀ lt 1 and the
corresponding gain in the other bins ǀLFCǀ gt 1 The increase of the FP-rate purely caused by the
pipeline changes vs the TP range is given in the summary graphs E and F) The 1st bins 0 lt ǀLFCǀ lt 1
are divided into two 0 lt ǀLFCǀ lt 05 and 05 lt ǀLFCǀ lt 1 which facilitates the easier tracking of the
results from the SubMixes4 as shown in Fig 4 were in both figures the 1st fraction is signed with 1b
DISCUSSION
We report a significant contribution to the external RNA controls toolbox in the form of Spike-In RNA
Variants (SIRVs) that address transcription variation and alternative splicing The highly defined mixes
of 69 transcripts aligning to 7 genes enable accurate target-performance evaluations of gene
expression analysis methods which is not possible eg by analyzing larger but only loosely defined
pools of in vitro transcripts (Lahens et al 2014) or limited sets addressing special problems like
fusion genes (Tembe et al 2014) The results presented here demonstrate that the condensed
complexity of the SIRV controls mimic very closely main properties of endogenous mRNAs when
analyzing high-throughput RNA sequencing workflows for their capabilities to determine transcript
variants and their relative quantities The responses of the SIRV controls to changes in the workflows
allow to extrapolate measures for the accuracy precision and foremost inter-experiment
comparability (concordance) to the large pool of endogenous RNAs With the help of the external
controls we could confirm that biases in sequence coverage could mostly be balanced by the
exemplary chosen data evaluation algorithms and for the majority of transcripts consistent relative
abundances were obtained However in our most concordant same sample pipeline comparison
P3P1 already 44 of the controls and 69 of the endogenous RNAs in the medium to high
concentration range appeared to be differentially expressed although none of those were true
positives (TP) because the reductio ad absurdum same sample comparison was using the very same
sets of NGS reads In consequence more than 700 potential endogenous mRNA leads would be non-
validatable false positives (FP) only because of a change in data evaluation pipelines With a
not peer-reviewed) is the authorfunder All rights reserved No reuse allowed without permission The copyright holder for this preprint (which was httpdxdoiorg101101080747doi bioRxiv preprint first posted online Oct 13 2016
Spike-In RNA variant controls for RNA-Sequencing bioRxiv upload 2016-10-13
19
difference between P4 and P2 of 12 at the level of endogenous RNAs an extra 1200 FPs would
obscure the evaluation
The inter-sample comparison between UHRR and HBRR presents a rather extreme case
where around half of all transcripts were calculated to differ by more than 2-fold However the
relative FPTP weight of both comparisons remains similar as P4P2 shows again clearly higher FP-
rates in both controls and endogenous RNAs The linear interpolation (Fig 5E) allows to estimate the
effect of the experimental changes to relative small number of differences as they would be seen in
typical RNA-Seq experiments Exemplarily highlighted are the intersections at 002 and 01 in Fig 5F
TP call rates and FPTP ratios are the important figures to estimate the likelihood and inversely
related effort to validate differentially expressed transcripts For the P3P1 comparison at 2 TP we
approximate an FPTP ratio of 289 The likelihood to actually validate DE transcripts under such
circumstances would reach 035 For the P4P2 comparison the TPFP ratio estimates to mere 014
The related risks and often substantial costs for deducing potential biomarkers would be 25 times
higher Although we demonstrated in the presented example the influence of changes in data
evaluation pipeline within an integrated RNA-Seq workflow the same principles apply to the front
end - the RNA treatment NGS library preparation and sequencing Here unintended variations in
particular sample preparations can only be detected by these external spike-in controls which
operate as markers and reference spots By these means SIRV controls increase the comparability
within and between sequencing experiments at the transcript isoform level SIRVs are designed for
the co-development improvement and monitoring of library preparations sequencing and data
processing
Outlook The presented module and the 92 ERCCs which probe the wide dynamic range using
monocistronic transcripts can be stepwise extended in the future by a) ca 15 poly(A)-tail variations
of monocistronic sequences with defined lengths of 20 and 30 adenosines as well as polyadenylated
and purified RNAs with poly(A)-tail lengths close to 50 100 and above 200 nucleotides b) around 12
above-average long RNAs with 3 5 7 and 10 kb c) approx 3 RNAs each with a low medium and
not peer-reviewed) is the authorfunder All rights reserved No reuse allowed without permission The copyright holder for this preprint (which was httpdxdoiorg101101080747doi bioRxiv preprint first posted online Oct 13 2016
Spike-In RNA variant controls for RNA-Sequencing bioRxiv upload 2016-10-13
20
high GC-content d) a set of 13 mRNA relevant chemical modifications most prominent the cap-
structure (Bokar and Rottman 1998) e) variants which cover aspects of SNPs alleles inversions and
fusion genes which needs to be accounted for in the corresponding sequence annotation files and f)
a random set of small and micro RNAs that comprise all sequence variations at their termini to
account for ligation biases The external control modules need to be fine-tuned with respect to the
dynamic concentration and concentration ratio range and the reference annotations must provide a
mixture of correctly over- and under-annotated genes to better emulate the challenging conditions
for bioinformatical data evaluation Both optimizations will also further increase the congruence of
the presented SIRV module with the endogenous RNAs Eventually all modules together would
develop into a comprehensive set of approximately 250 long RNA controls plus a microRNA module
which will become sufficient for calibration and normalization purposes This new estimate reduces
the scope of designing better spike-in controls compared to the maybe thousands of IVTs which have
been previously anticipated (Kratz and Carninci 2014)
METHODS
SIRV DESIGN AND IN SILICO ANALYSIS The gene structures of seven human model genes
(KLK5 LDHD LGALS17A DAPK3 HAUS5 USF2 and TESK2) were used as scaffold for the design of
SIRV1 to SIRV7 The ENCODE-annotated transcripts as well as added variants were edited to
represent in a redundant and comprehensive manner known transcription and alternative splicing
variations (complete gene structures are shown in the odd-numbered suppl Fig from S3 to S15) All
exon sequences descend from a pool of database-derived genomes (gene fragments from viruses
and bacteriophage capsid proteins and glycoproteins selected based on a GC-content in a range of
30-50) which were modified by inverting the sequence to lose identity while maintaining a kind of
naturally occurring order in the sequences Intron sequences that do not align with exons of another
isoform were drawn from random sequences whereby the GC content was balanced to comply with
not peer-reviewed) is the authorfunder All rights reserved No reuse allowed without permission The copyright holder for this preprint (which was httpdxdoiorg101101080747doi bioRxiv preprint first posted online Oct 13 2016
Spike-In RNA variant controls for RNA-Sequencing bioRxiv upload 2016-10-13
21
the adjacent exonic sequences (Random DNA Sequence Generator
httpwwwfacultyucredu~mmadurorandomhtm)
To verify the sequence exclusivity first the exon sequences were blasted against the entire NCBI
database including ERCCs on the nucleotide and protein level (program BLASTN 2229
httpsblastncbinlmnihgov) The default BLAST parameters used were word size 28 expected
threshold 10 Max matches in query rang 20 MatchMismatch Score 1 -2 Gap Costs Linear Filter
Low complexity regions Mask for lookup table only Search of the nucleotide collection resulted for
all SIRVs in ldquono significant similarity foundrdquo Second in silico generated reads (Griebel t al 2012)
(FLUX-Generator httpsammethnetconfluencedisplaySIMHome command line flux-simulator
-p ~hellipFluxsirv1par -t simulator -x -l -s) were mapped to nine individually selected genomes using
TopHat2 (Kim et al 2013) and Bowtie2 (Langmead and Salzberg2012) Because Bowtie2-aligned
reads can be as short as 20 nt the resulting limited number of mapping reads would be deemed to
be not significant in standard NGS work-flows In contrast when mapping reads with the standard
setting of the splicing-aware TopHat2 program not a single read aligned to any of the tested
genomes Given that both searches found no significant matches off-target mapping of the SIRVs can
essentially be ruled out Therefore the artificial SIRV sequences are suitable for noninterfering
qualitative and quantitative assessments in the context of known genomic systems and
complementary to the ERCC sequences (National Institute of Standards and Technology (NIST)
certified DNA plasmids Standard Reference Materialreg 2374) The SIRV sequences can be found at
httpswwwlexogencomsirvssirvsdownloads in the Source Data files and they are also
deposited at the NCBI Nucleotide Database (PRJNA312485)
SIRV CONSTRUCTS AND THE PRODUCTION OF IN-VITRO TRANSCRIPTS Synthetic gene constructs
were produced (Bio Basic Inc Markham ON Canada) that comprised 5rsquo to 3rsquo a unique restriction
site a T7 RNA polymerase promoter whose 3rsquo G is the first nucleotide of the actual SIRV sequence
which is seamlessly followed by a (A30)-tail that is fused with an exclusive 2nd restriction site These
not peer-reviewed) is the authorfunder All rights reserved No reuse allowed without permission The copyright holder for this preprint (which was httpdxdoiorg101101080747doi bioRxiv preprint first posted online Oct 13 2016
Spike-In RNA variant controls for RNA-Sequencing bioRxiv upload 2016-10-13
22
gene cassettes were cloned into a vector colony-amplified and singularized All SIRV sequence in the
purified plasmids were verified by Sanger-sequencing to identify the correct clones The E coli
cultures were grown in batches to obtain plasmids in the lower microg-scale Double digestion of isolated
plasmids with XhoI and NsiI showed correct insert size and complete restriction Linearized silica-
purified plasmids served as templates in in vitro transcription reactions using T7 transcription kits
(AmpliScribe T7 High Yield Transcription Kit and AmpliScribe T7 Flash Transcription Kit Epicentre
Madison WI) The DNase-treated phenol-extracted and silica-purified in vitro transcription products
were assessed for concentration and purity by spectrophotometry (NanoDrop Thermo Fisher
Scientific Waltham MA) and for integrity by capillary electrophoresis (2100 Bioanalyzer RNA 6000
Pico Kit Agilent Technologies Santa Clara CA)
In the context of variant verification RNA integrity is a very important measure Fragments
arising from incomplete transcription might impose errors on the correct determination of variants
which share those sequences and thereby also affect the overall gene coverage The integrity of the
transcription products was very heterogeneous as expected given the broad sequence variation and
the length of the SIRV transcripts (average 11 kb with 14 RNAs between 20 and 25 kb) A majority
of transcripts therefore had to be purified by at least one of two purification methods Purification
method PP1 is selective for poly(A)-tails and neglects prematurely terminated transcription products
Purification method PP2 is based on size-selective quantitative electrophoresis separating the
correctly sized main products from shorter fragments (transcription break off and degraded
products) and longer fragments (run-through transcription products) After purification the 69 SIRV
RNAs were assessed to be on average 736plusmn343 in the pre-peak fraction 9031plusmn372 in the
main-peak fraction (corresponding to RNAs of correct length) and 236plusmn304 in the post-peak
fraction (mass percentages wt) Noteworthy the risks of a beginning degradation during the initial
denaturation (2 min at 70degC) and the not fully denaturing conditions during RNA microcapillary
electrophoresis tiny noise levels in the baseline and slightly different shapes of the main peak result
in a rather over- than underestimation of pre- and post-peak fractions
not peer-reviewed) is the authorfunder All rights reserved No reuse allowed without permission The copyright holder for this preprint (which was httpdxdoiorg101101080747doi bioRxiv preprint first posted online Oct 13 2016
Spike-In RNA variant controls for RNA-Sequencing bioRxiv upload 2016-10-13
23
rRNasin (Promega Madison WI) was added to 08 Umicrol to minimize the risks of RNase
contamination induced RNA degradation The SIRVs were quantified by absorbance spectroscopy to
adjust all stock solutions to a base concentration of close to but above 50 ngmicrol RNA purity was very
high with A 260280 214plusmn012 and A 260230 217plusmn020
SIRV MIXING SIRV mixes were designed that contain pools of SIRVs (SubMixes) in defined
amounts and ratios by combining accurate volumes of the stock solutions in sufficiently large batch
sizes Pipetting errors vary depending on transfer volumes and range from plusmn4 for 2 microl to plusmn08 for
gt100 microl transfers The precision was experimentally determined with blank solutions Starting with
the stock concentration measurement (NanoDrop accuracy plusmn2 ngmicrol for 50 ngmicrol or plusmn4 ) and
accounting for the entire mixing pathway the accumulative concentration error is expected to range
between plusmn8 and plusmn47 Therefore in the data evaluation one has to account for the experimental
fuzziness by allowing for lower accuracy thresholds of plusmn8 on the linear scale or plusmn011 on the log2-
fold scale respectively The SIRV concentration ratios between two mixes are more precise because
only one final pipetting step defines the concentration differences and synchronizes all SIRVs which
belong to the same SubMix Here a maximal error of plusmn4 (or plusmn0057 on the log2-fold scale) can be
expected between SubMixes while all SIRVs of the same SubMix must propagate coherently into the
final mixes Bioanalyzer traces were used to monitor the relative propagation of the SIRVs PreMixes
and SubMixes during the mixing (Fig 2B) In addition the accurate pipetting of the 8 PreMixes was
controlled by checksums of Nanodrop concentration measurements which deviated by only
0002plusmn34 from the calculated target concentrations and by weighing on an analytical balance
which showed a deviation of 18plusmn065 The final concentration of the SIRV mixes are set to be 253
ngmicrol
not peer-reviewed) is the authorfunder All rights reserved No reuse allowed without permission The copyright holder for this preprint (which was httpdxdoiorg101101080747doi bioRxiv preprint first posted online Oct 13 2016
Spike-In RNA variant controls for RNA-Sequencing bioRxiv upload 2016-10-13
24
SPIKING OF REFERENCE RNA WITH SIRV MIXES In general SIRV mixes can be used with crude
cell extracts purified total RNA rRNA-depleted RNA or poly(A)-enriched RNA Important the spike-in
ratios have to be chosen in concordance with the desired final SIRV content the RNA preparation
method and if known the expected mRNA content One widely applicable spike-in ratio can be
obtained by adding 006 ng of controls to approximately 100 ng of total RNA In the presented
examples the total RNA mass of one single aliquot RNA was 100 ng of UHRR in RC-0 and 1128 ng of
HBRR in RC-1 The reference RNA in RC-2 was calculated to be 10427 ng (Fig S2) The high-
concentrated and thereby stable SIRV mix stocks with 253 ngmicrol and ERCC mix stocks with 30 ngmicrol
(ERCC Spike-In Mixes 1 and 2 by Ambion Thermo Fisher Waltham MA) were diluted just prior to the
spiking to facilitate the mixing of manageable volumes For example the final 11000 dilution
reduced the SIRV mix concentration to 253 pgmicrol from which 237 microl were required to spike a 100 ng
total RNA sample with 006 ng SIRVs The RC-samples were produced in large batches to yield
hundreds of samples allowing for a protocol with fewer dilutions and larger volumes reducing
thereby sources of experimental errors
NGS LIBRARY PREPARATION AND SEQUENCING The experiments were carried out in technical
triplicates From 1 microg RC-0 RC-1 or RC-2 RNA in total nine NGS libraries were prepared by Fasteris SA
(Plan-les-Ouates CH) using the TruSeq stranded mRNA library preparation kit with polyA selection
(Illumina Inc San Diego CA) All primary library templates were amplified with 14 PCR cycles to
reach reproducible concentrations 155plusmn45 nM and insert sizes 165plusmn10 bp An equimolar lane-mix
was sequenced at the CSF Campus Science Support Facilities GmbH (CSF Vienna AUT) in PE125
mode in one lane of a HiSeq 2500 flowcell in 125 bp paired-end mode using V4 chemistry The run
yielded 305 M raw reads 293 M after demultiplexing and trimming which corresponds to a read
depth of 326plusmn22 M reads per library
not peer-reviewed) is the authorfunder All rights reserved No reuse allowed without permission The copyright holder for this preprint (which was httpdxdoiorg101101080747doi bioRxiv preprint first posted online Oct 13 2016
Spike-In RNA variant controls for RNA-Sequencing bioRxiv upload 2016-10-13
25
READ PROCESSING AND MAPPING Standard data processing routines (bbduk part of BBMap by
B Bushnell to be found at sourceforgenetprojectsbbmap) were applied removing low quality
reads and trimming adapter sequences Due to variable stringencies the mappers produced different
read statistics STAR mapped against the genome 897plusmn59 of the reads (864plusmn56 uniquely) and
TopHat2 852plusmn57 (794plusmn52 uniquely) Bowtie2 mapped against the transcriptome 693plusmn18
reads (151plusmn15 uniquely)
ESTIMATION OF THE MRNA CONTENTS Based on the obtained read distributions the relative
mass partition between external controls and endogenous RNA fraction can be estimated Because
the library preparation uses a poly(A)-enrichment step the targeted endogenous RNA corresponds
almost exclusively to the mRNA content of the samples The propagation of the input mass ratio to
the output read ratio depends on both the mRNA content and the efficiencies of how controls and
mRNA proceed through the library preparation The relationship is described by Eqn 1
reRNA times prod(1 rconifrasl )
j
i=1
= (EeRNA times meRNA) times prod(1 (Econi times mconi)frasl )
j
i=1
Equation 1
with r number of reads from eRNA the endogenous RNA fraction here mRNA and con the
controls here SIRVs and ERCC E the relative efficiency of how the fraction proceeds through the
workflow and m the input mass
Ratios are measured as relative read counts and the results as a product of efficiencies and
apparent amounts are also relative measures Therefore at least one de facto arbitrary reference
point needs to be defined to deduce comparable absolute results Several reference points or
default values can be defined which lead to different dependent variables and imply slightly variable
interpretation of the results The following three calculation examples are simple deductions from
not peer-reviewed) is the authorfunder All rights reserved No reuse allowed without permission The copyright holder for this preprint (which was httpdxdoiorg101101080747doi bioRxiv preprint first posted online Oct 13 2016
Spike-In RNA variant controls for RNA-Sequencing bioRxiv upload 2016-10-13
26
the ratio shown in Eqn 1 with the ERCC (con1) and the SIRVs (con2) respectively Variation 1 is
explained in greater detail while in the other variants only the differing aspects are highlighted
Variation 1 i) Here the first assumption is that the mRNA content in UHRR (Agilent Santa
Clara CA) is 3 (factor 003) and 2 (factor 002) in HBRR (Ambion Thermo Fisher Waltham MA)
which stays in close agreement to previous estimates concluded from experiments by Shippy et al in
2006 The amounts of total RNA were measured by Nanodrop absorbance spectroscopy The UHRR
samples contained 100 ng and the HBRR samples 1128 ng The mixing ratio of (2times RC-0) (1times RC-1)
determines the concentration of the 3rd sample RC-2 and further the amount of total RNA (10427
ng) as well as its related mRNA content (2times100 ng times 3 + 1times1128 ng times 2 ) (2times100 ng + 1times1128
ng) = 264 (factor 0026) The mRNA masses of the samples are calculated by the measured total
RNA input amounts and default mRNA contents are 3 ng 2256 ng and 2752 ng The second
assumption is that the endogenous mRNAs proceed with the maximal efficiency of 100 (factor 1)
through library preparation and sequencing The input of the spike-in controls is the product of the
concentration values which were either measured as in the case of the SIRV stocks or stated by the
vendor as in the case of the ERCC stocks and the pipetted volumes Both are treated as de facto
measured values
ii) The relative amounts of reads which have been assigned to either endogenous mRNA
ERCCs or SIRVs are obtained from the mapping statistics (read classification)
iii) The ratio of mass input to reads output allows to calculate the propagation efficiency of
the controls relative to the default efficiency of the endogenous mRNA In the present experiment
the SIRVs progress with a relative efficiency of 867plusmn57 and the ERCCs with 416plusmn47 The
significant difference between the relative efficiency of both controls is very likely caused by the
different lengths of the poly(A)-tails which might influence a different binding efficiency during
poly(A)-enrichment step The SIRVs with a 30 nt long poly(A)-tail perform much more in concordance
with the endogenous mRNA as the ERCCs which contain shorter and variable poly(A)-tails ( 23 nt)
The observed small differences in the experiments using RC-0 RC-1 or RC-2 could be caused by a
not peer-reviewed) is the authorfunder All rights reserved No reuse allowed without permission The copyright holder for this preprint (which was httpdxdoiorg101101080747doi bioRxiv preprint first posted online Oct 13 2016
Spike-In RNA variant controls for RNA-Sequencing bioRxiv upload 2016-10-13
27
two-way interference of samples and controls However the deviations are small and can rather be a
result of minor inaccuracies in determining the relative input amounts Both hypotheses would need
to be verified by a series of repeats with the aim to resolve potential influences of pipetting during
the sample preparation variations in the library preparation and other contributions
Variation 2 Here no varying interferences between samples and controls are permitted
which means that relative efficiencies of the controls are considered to be constant The causes of
the experimental variations are exclusively assigned to the input amounts (alike hypothesis two in
the above example in discussing the deviation of the results in RC-2) This would translate into input
standard deviations of 118 (SIRVs) and 76 (ERCCs) The variations meld all accumulating errors
made in determining the concentration of the control stock solutions preparing the subsequent
dilutions pipetting the samples and controls during the spike-in step itself as well as determining the
amount of sample RNA in the first place Against the background of potential errors the calculated
results can be considered as highly consistent
Variation 3 In addition to the assumptions made for the measurement of sample RC-0
the spike-in of 006 ng SIRVs to all samples is also set as default Alike variation 2 the experiments in
RC-1 and RC-2 adopt the same default setting for the relative efficiencies calculated in RC-0
According to the ratio of Eqn 1 one can obtain mRNA contents as well as ERCC input amounts in this
case for samples RC-1 and RC-2 The mRNA content of the HBRR sample (RC-1) relative to the default
mRNA content in the UHRR sample (set to 3 ) would be 172 lower than the previously assumed
2 According to the present mixing scheme it would also imply that sample RC-2 has an mRNA
content of 254 up from the calculated 234 The offsets of -79 is again small and very likely
refers to the level of accuracy in the experimental results as discussed above Using this method the
spiking of samples with controls such as the SIRVs allows to closely estimate the relative mRNA
content of any unknown sample and to draw conclusions eg on the transcriptional state of tissues
cell suspension or individual cells
not peer-reviewed) is the authorfunder All rights reserved No reuse allowed without permission The copyright holder for this preprint (which was httpdxdoiorg101101080747doi bioRxiv preprint first posted online Oct 13 2016
Spike-In RNA variant controls for RNA-Sequencing bioRxiv upload 2016-10-13
28
COEFFICIENT OF DEVIATION We implemented a strand specific Coefficient of Deviation
(CoD) which aims to reflect the quality of NGS pipelines targeted at specific effects in particular
lsquospikenessrsquo of the coverage while systematic effects like drop of the coverage at Transcription Start
Sites (TSS) and Transcription End Sites (TES) are being suppressed The CoD is implemented by Eqn
2
CoD = CoD(LTSSLTES) = sum (cidealp- crealp)2
TESe
p=TSS1
divide sum cidealp
TESe
p=TSS1
Equation 2
which is calculated in strand orientation for contigs along all exonic nucleotide position (p) from the
first annotated TSS (TSS1) up to the last annotated TES (TESe) whereby cideal are the ideal coverages
with the optimized transient regions (LrsquoTSS LrsquoTES) and creal are the real coverages scaled as such that
the total integrals along all positions of ideal and real coverages are equal
The transient function at TSS and TES is the error function erf(x) which corresponds to
Cufflinks assumption about normally distributed fragment lengths (Trapnell et al 2012) Since erf(x)
is a non-algebraic function we used the algebraic approximation by Abramowitz and Stegun
(httpsenwikipediaorgwikiError_function eq 7125) Once the optima (LrsquoTSS LrsquoTES ) are found
we declare CoD(LrsquoTSS LrsquoTES) to be the ultimate CoD value which mostly eliminated the transient region
effects We implemented an optimization algorithm (Nelder-Mead downhill simplex method) and
used as starting values (L0TSS L0
TES ) lengths of 150 In some cases the optimum found can be beyond
a reasonable range of values Therefore we censor the output Lopt of the mathematical optimization
as follows Lcensored = 50 if Lrsquo lt 50 Lcensored = 350 if Lrsquo gt 350 This corresponds to the maximal range of
not peer-reviewed) is the authorfunder All rights reserved No reuse allowed without permission The copyright holder for this preprint (which was httpdxdoiorg101101080747doi bioRxiv preprint first posted online Oct 13 2016
Spike-In RNA variant controls for RNA-Sequencing bioRxiv upload 2016-10-13
29
200plusmn150 This censoring needed to be applied in 8 cases out of 84 SIRVmixstrandend
combinations ie less than in 10
TRANSCRIPT CONCENTRATION MEASUREMENTS In order to estimate expression values on
transcript levels we applied RSEM (Li and Dewey 2011) which uses a Bayesian Network to compute
the likelihood of each fragment belonging to a given transcript Salmon (Patro et al 2015) estimates
the transcript expression values by a k-mer based mapping Similar to RSEM it uses an expectation-
maximization (EM) algorithm to compute the maximum likelihood of relative abundances Cufflinks2
(Trapnell et al 2013) estimates the transcript abundances with a coverage-based maximum
likelihood approach It determines the probability of read assignments to isoforms
DIFFERENTIAL EXPRESSION ANALYSIS We used the DESeq2 package (Love et al 2014) for
calculation of fold-differences between the results from different pipelines and different input samples
mixtures As explained in the main text all outputs from the evaluated pipelines (in form of relative
concentration measures) have been scaled Scaling by linear transformation is needed as a
consequence of the different mRNA contents in the samples but also to eventually compensate any
potential pipetting errors when small aliquots typically in the range of very few microliter are added
to individual samples The RC-samples in this experiment were produced in a large batch to ensure
high accuracy in volumetric ratios The main sample pool is practically invariant to the small relative
contribution of the controls but was technically treated in the same way by scaling the main sample
pools to identical sizes First SIRV concentrations were scaled to reach together 69 in E0 685 in E1
and 708 in E2 which is the dimensionless value identical to the fmolmicrol in the respective SIRV stock
solutions Then the lower threshold was set to 10-6 which corresponds to original FPKM values of
around 5∙10-3 ⅟7th of one read for a 1 kb long transcript at a read depth of 30 Mio reads or 1 gene
specific read to be divided between 7 equally possible transcript variants at said 1 kb length section
The threshold is to be understood as less than or equal to 10-6 which defines an averaged read
not peer-reviewed) is the authorfunder All rights reserved No reuse allowed without permission The copyright holder for this preprint (which was httpdxdoiorg101101080747doi bioRxiv preprint first posted online Oct 13 2016
Spike-In RNA variant controls for RNA-Sequencing bioRxiv upload 2016-10-13
30
resolution of the particular workflow at the given read depth By these means all ratios remain defined
Second for the DESeq2 calculations we multiplied all values with 106 after which fractions were
rounded to the closest integer We understand that for no-change hypothesis testing which is the
main purpose of the DESeq2 package transforming the relative concentrations (FPKM or TPM) to
lsquoquasi-read-countsrsquo is not recommended since DESeq2 internally corrects for library size by using size
factors However in our application we do not use the probability of the hypothesis rejection (P
values) but the raw fold changes detected (irrespectively of the dispersion values for that given
transcript) We also took into account the potential danger of censoring the input (by unintentionally
eliminating transcripts represented by extremely low FPKM or TPM values) by setting a suitable
threshold as described above The figures show only two differential expression analyses because the
3rd concentration ratio E2E0 is the product of E1E0 and E2E1
ERROR RATE ANALYSIS The four red data points two from the SIRV controls (circles) and two
from the endogenous mRNAs (squares) from the best agreement (P3 vs P1) and the four
corresponding black data points from the worst agreement (P4 vs P2) as shown in fig 5E were fitted
by linear approximation using the relationship as derived for Eqn 3
TP + FP = 1
FP = N times ER = (1-TP) times ER
(TP+FP) = TP + ER - TP times ER
(TP+FP) = (1-ER) times TP + ER Equation 3
where TP is the relative portion of true positives (differentially expressed as in our definition
possessing a LFC gt 1) N the relative portion of negatives ER the error rate at which negatives are
falsely detected as positives to result in false positives FP The least squares fitting method was
applied to derive values for the slope (1-ER) and the intercept ER
not peer-reviewed) is the authorfunder All rights reserved No reuse allowed without permission The copyright holder for this preprint (which was httpdxdoiorg101101080747doi bioRxiv preprint first posted online Oct 13 2016
Spike-In RNA variant controls for RNA-Sequencing bioRxiv upload 2016-10-13
31
The transformation of Eqn 3 leads to the relationship of Eqn 4
TP FPfrasl = (TP+FP) TPfrasl -1 Equation 4
which has been used for the graph in fig 5F In the present context the concept of ROC-curves is not
applicable because the true or false negatives are indistinguishable as long the ground truth of the
endogenous RNA are unknown
DATA ACCESS Sequencces and source data files data are in the process to be deposited at
NCBI under BioProject ID PRJNA312485
ACKNOWLEDGMENTS We thank SA Munro and M Salit (Material Measurement
Laboratory National Institute of Standards and Technology) for their efforts in further developing the
concepts of the External RNA Control Consortium (ERCC) in an updated suite of RNA controls and
analysis methods called ERCC 20 We thank A Tuerk for his contributions in finding suitable human
model genes G Wiktorin for carrying out the RSEM calculations M Mihaylova in helping with the
graphics design and I Gabler for critically reading the manuscript
AUTHOR CONTRIBUTIONS LP PK and TR designed the sequences and mixtures PK and GH
prepared the in vitro transcripts and spike-in mixtures TR AS and LP designed the research and
the experiments MA IH and TR evaluated the data TR and LP wrote the manuscript
DISCLOSURE DECLARATION The authors are employees of Lexogen GmbH from which the SIRVs
can be bought and AS has equity stakes in Lexogen GmbH LP PK and TR are named as
not peer-reviewed) is the authorfunder All rights reserved No reuse allowed without permission The copyright holder for this preprint (which was httpdxdoiorg101101080747doi bioRxiv preprint first posted online Oct 13 2016
Spike-In RNA variant controls for RNA-Sequencing bioRxiv upload 2016-10-13
32
inventors on a patent application regarding the production and use of RNA transcript variants and
Lexogen GmbH is the owner of this patent application
REFERENCES
Baker SC Bauer SR Beyer RP Brenton JD Bromley B Burrill J Causton H Conley MP Elespuru R Fero M et al 2005 The External RNA Controls Consortium a progress report Nat Methods 2(10) 731-4 Bokar JA Rottman FM 1998 Biosynthesis and Functions of Modified Nucleosides in Eukaryotic mRNA In Modification and Editing of RNA (eds Grosjean H Benne R) pp 183-200 ASM Press Washington DC Dobin A Davis CA Schlesinger F Drenkow J Zaleski C Jha S Batut P Chaisson M Gingeras TR 2013 STAR ultrafast universal RNA-seq aligner Bioinformatics 29(1) 15-21 Fed Reg Doc 2015-19742 2015 External RNA Controls Consortium - Call for Participation and Contributions to a Sequence Library Federal Register Citation 80 FR 48296 Griebel T Zacher B Ribeca P Raineri E Lacroix V Guigoacute R Sammeth M 2012 Modelling and simulating generic RNA-Seq experiments with the flux simulator Nucleic Acids Res 40(20) 10073-83 Jiang L Schlesinger F Davis CA Zhang Y Li R Salit M Gingeras TR Oliver B 2011 Synthetic spike-in standards for RNA-seq experiments Genome Res 21(9) 1543-51 Kim D Pertea G Trapnell C Pimentel H Kelley R Salzberg SL 2013 TopHat2 accurate alignment of transcriptomes in the presence of insertions deletions and gene fusions Genome Biol 14(4) R36 Kratz A Carninci P 2014 The devil in the details of RNA-seq Nat Biotechnol 32(9) 882-4 Lahens NF Kavakli IH Zhang R Hayer K Black MB Dueck H Pizarro A Kim J Irizarry R Thomas RS et al 2014 IVT-seq reveals extreme bias in RNA sequencing Genome Biol 15(6) R86 Langmead B Salzberg SL 2012 Fast gapped-read alignment with Bowtie 2 Nat Methods 9(4) 357-9 Li B Dewey CN 2011 RSEM accurate transcript quantification from RNA-Seq data with or without a reference genome BMC Bioinformatics 12 323 Li J Jiang H Wong WH 2010 Modeling non-uniformity in short-read rates in RNA-Seq data Genome Biol 11 R50 Li S Tighe SW Nicolet CM Grove D Levy S Farmerie W Viale A Wright C Schweitzer PA Gao Y et al 2014 Multi-platform assessment of transcriptome profiling using RNA-seq in the ABRF next-generation sequencing study Nat Biotechnology 32 915-25 Love MI Huber W Anders S 2014 Moderated estimation of fold change and dispersion for RNA-seq data with DESeq2 Genome Biol 15(12) 550
not peer-reviewed) is the authorfunder All rights reserved No reuse allowed without permission The copyright holder for this preprint (which was httpdxdoiorg101101080747doi bioRxiv preprint first posted online Oct 13 2016
Spike-In RNA variant controls for RNA-Sequencing bioRxiv upload 2016-10-13
33
Mortazavi A Williams BA McCue K Schaeffer L Wold B 2008 Mapping and quantifying mammalian transcriptomes by RNA-Seq Nat Methods 5(7) 621-8 Patro R Duggal G Kingsford C 2015 Accurate fast and model-aware transcript expression quantification with Salmon bioRxiv preprint doi httpdxdoiorg101101021592 Shippy R Fulmer-Smentek S Jensen RV Jones WD Wolber PK Johnson CD Pine PS Boysen C Guo X Chudin E et al 2006 Using RNA sample titrations to assess microarray platform performance and normalization techniques Nat Biotechnol 24(9) 1123-31 SEQCMAQC-III Consortium 2014 A comprehensive assessment of RNA-seq accuracy reproducibility and information content by the Sequencing Quality Control Consortium Nat Biotechnology 32 903-14 Tembe WD Pond SJ Legendre C Chuang HY Liang WS Kim NE Montel V Wong S McDaniel TK Craig DW Carpten JD 2014 Open-access synthetic spike-in mRNA-seq data for cancer gene fusions BMC Genomics 15 824 Trapnell C Roberts A Goff L Pertea G Kim D Kelley DR Pimentel H Salzberg SL Rinn JL Pachter L 2012 Differential gene and transcript expression analysis of RNA-seq experiments with TopHat and Cufflinks Nat Protoc 7(3) 562-78 Trapnell C Hendrickson DG Sauvageau M Goff L Rinn JL Pachter L 2013 Differential analysis of gene regulation at transcript resolution with RNA-seq Nat Biotechnol 31(1) 46-53 van Dijk EL Jaszczyszyn Y Thermes C 2014 Library preparation methods for next-generation sequencing tone down the bias Exp Cell Res 322(1) 12-20 Wang Z Gerstein M Snyder M 2009 RNA-Seq a revolutionary tool for transcriptomics Nat Rev Genet 1 57-63 Zheng W Chung LM Zhao H 2011 Bias detection and correction in RNA-Sequencing data BMC Bioinformatics 12290
not peer-reviewed) is the authorfunder All rights reserved No reuse allowed without permission The copyright holder for this preprint (which was httpdxdoiorg101101080747doi bioRxiv preprint first posted online Oct 13 2016
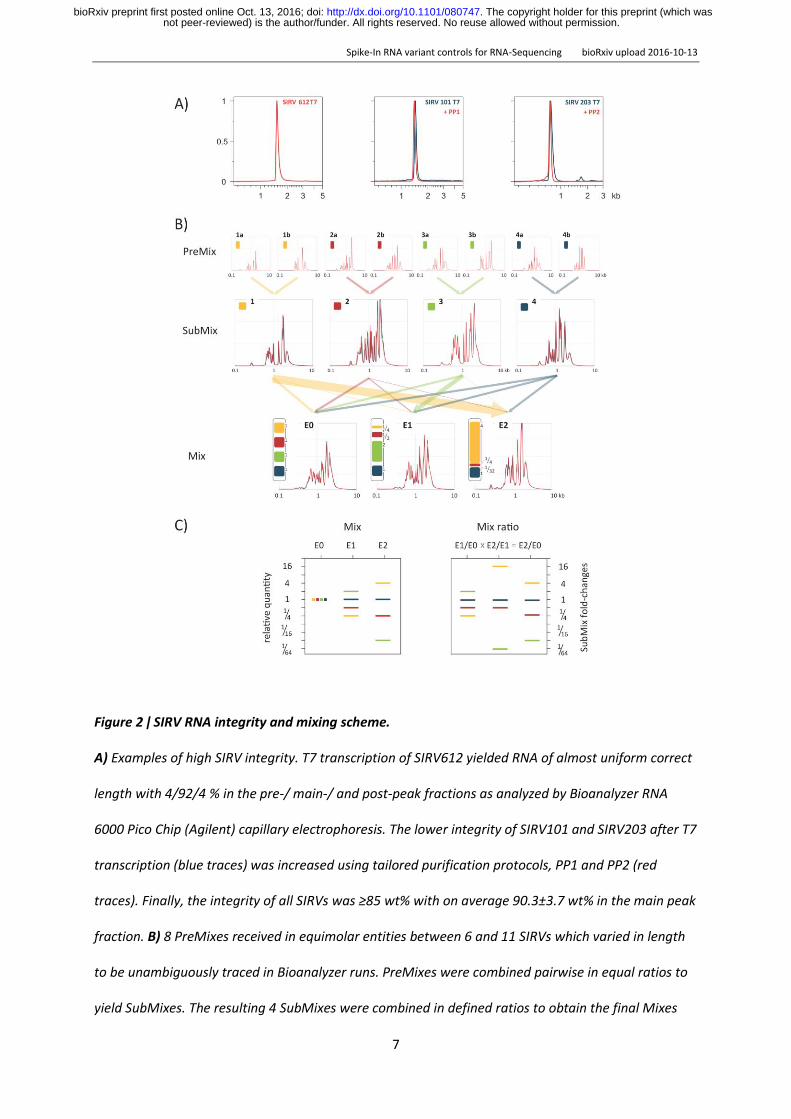
Spike-In RNA variant controls for RNA-Sequencing bioRxiv upload 2016-10-13
7
Figure 2 ǀ SIRV RNA integrity and mixing scheme
A) Examples of high SIRV integrity T7 transcription of SIRV612 yielded RNA of almost uniform correct
length with 4924 in the pre- main- and post-peak fractions as analyzed by Bioanalyzer RNA
6000 Pico Chip (Agilent) capillary electrophoresis The lower integrity of SIRV101 and SIRV203 after T7
transcription (blue traces) was increased using tailored purification protocols PP1 and PP2 (red
traces) Finally the integrity of all SIRVs was ge85 wt with on average 903plusmn37 wt in the main peak
fraction B) 8 PreMixes received in equimolar entities between 6 and 11 SIRVs which varied in length
to be unambiguously traced in Bioanalyzer runs PreMixes were combined pairwise in equal ratios to
yield SubMixes The resulting 4 SubMixes were combined in defined ratios to obtain the final Mixes
not peer-reviewed) is the authorfunder All rights reserved No reuse allowed without permission The copyright holder for this preprint (which was httpdxdoiorg101101080747doi bioRxiv preprint first posted online Oct 13 2016
Spike-In RNA variant controls for RNA-Sequencing bioRxiv upload 2016-10-13
8
E0 E1 and E2 Measured traces are shown in red and traces computed from the PreMix traces to
validate the composition of the SubMixes and final Mixes are shown in blue A color code for the
SubMixes is introduced to follow groupings of SIRVs throughout the subsequent data analysis C)
Graphical representation of the relative SIRV concentrations and concentration ratios according their
SubMix belonging The total molarity and weight of the final mixes are evenly balanced at 697
fmolmicrol and 253 ngmicrol
Three different samples with SIRVs RC-0 RC-1 and RC-2 (for details see methods section) were
prepared NGS libraries generated and sequenced in paired-end 125 bp mode
NGS DATA EVALUATION All demultiplexed NGS reads were mapped to the human
genome (GRCh38p2) the ERCC sequences and the SIRVome by using the common splice-aware
aligners STAR (Dobin et al 2012) TopHat2 (Kim et al 2013) while Bowtie2 (Langmead and Salzberg
2012) was used to map reads to a set of accordingly generated transcript sequences Bowtie2 aligned
reads were further processed by RSEM (Li and Dewey 2011) a combination referred to below as data
evaluation pipeline P1 Salmon is an autarkic program algorithm (Patro et al 2015) referred to as P2
STAR as well as TopHat2 aligned reads were further processed by Cufflinks2 (Trapnell et al 2012)
and resemble the evaluation pipelines P3 and P4
ESTIMATION OF THE MRNA CONTENTS On the basis of the assumption that the RNAs in the
samples and the spike-in controls are equally targeted by the library preparation due to similar
length distributions (SIRV 1129plusmn15 nt ERCC 880plusmn26 nt and based on the P4 results UHRR 1538 nt
and HBRR 1641 nt) the relative mass partition between controls and endogenous RNA can be
determined The propagation of the input amounts to the output read ratio depends on the mRNA
content and the relative recovery efficiencies of controls and mRNA after the library preparation
Therefore one reference value needs to be defined or externally determined which we chose to be
not peer-reviewed) is the authorfunder All rights reserved No reuse allowed without permission The copyright holder for this preprint (which was httpdxdoiorg101101080747doi bioRxiv preprint first posted online Oct 13 2016
Spike-In RNA variant controls for RNA-Sequencing bioRxiv upload 2016-10-13
9
an mRNA content of 3 in UHRR (Shippy et al 2006) We further set the efficiency of the
endogenous mRNA proceeding through this particular library preparation to 100 The SIRVs can
then be calculated to progress with a relative efficiency of 870plusmn6 allowing to determine the
mRNA content in the second sample HBRR to be 172 The mRNA content in the mixed samples
RC-2 is then assessed to be 234 which corresponds to a minor -91 offset relative to the
theoretical outcome based on the RC-0 and RC-1 measurements In the TruSeq library preparation
the 30 nt long poly(A)-tail of the SIRVs ensures an enrichment similar to the endogenous mRNAs The
ERCC controls show a lower recovery efficiency of 416plusmn47 most likely due to their shorter poly(A)-
tails which vary between 19 and 25 adenines ( 23 nt) The results are summarized in suppl Tab S1
COMPARISON BETWEEN EXPECTED AND MEASURED COVERAGE AND CONCENTRATION MEASURES For the first
time the ground truth of complex input sequences is available allowing detailed target-performance
comparisons for read alignment relative abundance calculation and differential expression
determination Fig 3 shows for one example gene SIRV 3 in E0 the expected coverages and counts
of the telling junctions together with the coverages obtained by STAR and TopHat2 mapping NGS
workflow-specific read start-site distributions lead to coverage patterns with inherent terminal
deficiencies for which the expected coverage has been adjusted accordingly However in the
measured coverages these systematic start- and end-site biases are accompanied by a variety of
biases which introduce severe local deviations from the expected coverage
not peer-reviewed) is the authorfunder All rights reserved No reuse allowed without permission The copyright holder for this preprint (which was httpdxdoiorg101101080747doi bioRxiv preprint first posted online Oct 13 2016
Spike-In RNA variant controls for RNA-Sequencing bioRxiv upload 2016-10-13
10
Figure 3 ǀ Comparison of the expected and the measured coverages for the SIRV3 locus in mix E0
A) Individual transcripts of SIRV3 with transcripts on the plus strand in blue and in red for the ones on
the minus strand Color code indicates the SubMix allocation B) The expected SIRV3 coverage is
shown as superposition of individual transcript coverages in which the terminal sites have been
modelled by a transient error function The measured coverages after read mapping by TopHat2 are
shown in grey The measured coverages and number of splice junction reads were normalized to
obtained identical areas under the curves and identical sums of all junctions for the expected and
measured data The measured splice junction reads are shown by the numbers before the brackets
not peer-reviewed) is the authorfunder All rights reserved No reuse allowed without permission The copyright holder for this preprint (which was httpdxdoiorg101101080747doi bioRxiv preprint first posted online Oct 13 2016
Spike-In RNA variant controls for RNA-Sequencing bioRxiv upload 2016-10-13
11
while the expected values are shown inside the brackets The CoD values are given for the plus and
minus strand in the respective colors C) Differences between mapping by STAR aligner and TopHat2
The black arrows indicate the direction of positive differences Percentages refer to the relative
changes of the measured splice junction reads
To obtain a comparative measure gene-specific coefficients of deviation CoD were calculated CoDs
describe the often hidden biases in the sequence data predominantly caused by an inhomogeneous
library preparation but also by the subsequent sequencing and mapping In the presented example
the stranded TruSeq library preparation with the Illumina HiSeq2500 sequencing and mapping by
TopHat2 results in a mean CoD of 0190plusmn0193 across all SIRVs For the sense oriented SIRVs the
mean CoD is 0275plusmn0223 and for the antisense SIRVs which cover a region of fewer overlapping
transcript annotations the mean CoD is 0090plusmn0076 The coverage target-performance comparison
highlights the inherent difficulties in deconvoluting read distributions to correctly identify transcript
variants and determine concentrations The distribution of telling reads splice junctions and reads
towards the termini are references for the assignment of the remaining reads before calculating
relative transcript variant abundances Not surprisingly although the majority of junction counts
correlates well with the expected values the high CoD values indicate that numerous telling reads
deviate significantly within the context of the individual mixes They also differ between mixes which
affects differential expression measurements (see Fig 3B and for the coverage of all seven SIRV
genes the even suppl Fig from S4 to S16)
The CoD does not allow to distinguish between periodicity and randomness in the biases nor
does it forecast how well a data evaluation strategy can cope with the bias contributions
Nevertheless smaller CoD values are expected to correlate with a simpler and less error-prone data
evaluation The CoD values can be taken as a first indicative measure to characterize the mapped
data and to compare data sets for similarity up to this point in the workflow Target-performance
comparisons of all SIRV genes in all three mixes can be found in the supplemental information
not peer-reviewed) is the authorfunder All rights reserved No reuse allowed without permission The copyright holder for this preprint (which was httpdxdoiorg101101080747doi bioRxiv preprint first posted online Oct 13 2016
Spike-In RNA variant controls for RNA-Sequencing bioRxiv upload 2016-10-13
12
The above described four data analysis pipelines P1 to P4 were used to calculate transcript
abundances for 69 SIRV and 196˙165 annotated endogenous transcripts All obtained results are
relative concentration measures yielding either Fragments Per Kilobase of exon per Million
fragments mapped (FPKM) (Mortazavi 2008) or Transcripts Per Million (TPM) (Li and Dewey 2011)
The concentrations were scaled by linear transformation in such way that all SIRVs together reach 69
in E0 685 in E1 and 708 in E2 which is the dimensionless value identical to the fmolmicrol in the
respective SIRV stock solutions In consequence the relative quantities of the SIRVs are compatible
to the normalized scale which was introduced in Fig 2C Boxplots in Fig 4 show exemplarily the SIRV
concentrations and two discrete differentials as measured by P3 (results from P1 P2 and P4 are
shown in suppl Fig S17 and standard correlation plots of the four pipelines are shown in suppl Fig
S18) The majority of all SubMix mean concentration values are in concordance with the expected
values The concentration ratios simulating differential expression measurements are less prone to
systematic offsets and show by trend narrower distributions However these correlations highlight
already the issue of obvious and frequent outliers ie transcript variants that are not well resolved
not peer-reviewed) is the authorfunder All rights reserved No reuse allowed without permission The copyright holder for this preprint (which was httpdxdoiorg101101080747doi bioRxiv preprint first posted online Oct 13 2016
Spike-In RNA variant controls for RNA-Sequencing bioRxiv upload 2016-10-13
13
Figure 4 ǀ Box plot overview of calculated concentration values for SIRV mixes and mix ratios
Reads from SIRV mixes E0 E1 and E2 were processed by four different data evaluation algorithms for
transcript quantification Results derived by pipeline P3 are exemplarily shown in reference to the
known inputs (bars in colors corresponding to the SIRV SubMixes of Fig 2) The black circles mark the
mean and the bold dashes the medians of the data points which are shown in grey the boxes span
the 25 to 75 region of the data points and the black whiskers with connecting lines reach up to the
min and max values and indicate also outliers outside the scale of the graph The comparison E1 vs
E0 from sample RC-1 and RC-0 (2nd row) was used for building the histogram of Fig 5B The shaded
area resembles the 1st bin (0leǀLFCǀle1) while the inner section (b1) comprises the fraction 0leǀLFCǀlt05
where the majority of data points originates from SubMix4 (ratio 11) and some ldquooutliersrdquo from
SubMix2 which were actually spiked in at the ratio 21
Heat maps allow to inspect each SIRV in the context of competing transcripts Tab 1B shows
the abundancies as log2-fold changes LFC relative to the expected values for the example of SIRV 6
LFC values consider relative increases and decreases across all concentration ranges likewise An LFC
window of plusmn011 presents the confidence interval as a result from the currently achievable accuracy
not peer-reviewed) is the authorfunder All rights reserved No reuse allowed without permission The copyright holder for this preprint (which was httpdxdoiorg101101080747doi bioRxiv preprint first posted online Oct 13 2016
Spike-In RNA variant controls for RNA-Sequencing bioRxiv upload 2016-10-13
14
in producing the SIRV mixtures We examine the LFC values uncoupled from the adjusted p-values
which provide a statistical measure of the significance level for apparent differential expression By
these means we prevent pipelines to appear more coherent only due to higher noise levels The
accuracy has been calculated for each SIRV as the mean of the LFCs in all three mixes The precision is
a measure of how consistent SIRVs are quantified and has been calculated as the LFC standard
deviation for each SIRV and further for entire pipelines by using all SIRVs Within the presented
example SIRVs can obtain in all four pipelines high precisions of up to 018plusmn007 and high accuracies
of up to -001plusmn010 (SIRV604) In contrast SIRV612 of similar length has an average precision of
569plusmn368 and an accuracy of -386plusmn270 although it was detected by P2 with a high precision of 012
at an accuracy of 018 This quantification of differences between pipelines now directly permits to
assess the effect of changes in workflows and individual experiments
COMPARISON BETWEEN DIFFERENT WORKFLOWS When ranking the four pipelines by said precision P3
gives the lowest value with 129 followed by P4 with 164 P1 with 198 and P2 with 214 However
a sample-specific global target-performance comparison is not the strongest criteria for evaluating
performance differences at transcript resolution For this purpose the apparent differential
expression shows if similar errors are caused by the same or different transcripts The highest
concordance was found between P3 and P1 (labelled P3P1) calculated as standard deviation of all
SIRV LFCs with 101 followed by P4P3 (104) P4P1 (255) P2P1 (288) and P3P2 (309) The
lowest concordance has P4P2 with a value of 412 One section of the resulting heat map for both
extremes is shown in Tab 1C
not peer-reviewed) is the authorfunder All rights reserved No reuse allowed without permission The copyright holder for this preprint (which was httpdxdoiorg101101080747doi bioRxiv preprint first posted online Oct 13 2016
Spike-In RNA variant controls for RNA-Sequencing bioRxiv upload 2016-10-13
15
Table 1 ǀ Variance heat map of SIRV concentration measures detailing SIRV6 by the 4 different
pipelines P1 to P4 A) Given are SIRV transcript identifier SubMix (SM) color code and transcript
lengths (in nucleotides) B) Heat maps showing the log-fold changes (LFC) for the comparison of the
normalized expected and measured SIRV concentrations as a result from the four data evaluation
pipelines P1 to P4 evaluating E0 E1 and E2 Fields with -1 le LFC le 1 are filled with gradient green all
fields with LFC lt -1 with straight blue and all fields with LFC gt 1 with straight red C) From all 6
possible pairwise comparisons P2P1 P3P1 to P4P3 of the normalized measured SIRV
concentrations the one with the smallest (P3P1) and largest (P4P2) median of all LFC are shown
The complete heat map is shown in the suppl Tab S2
not peer-reviewed) is the authorfunder All rights reserved No reuse allowed without permission The copyright holder for this preprint (which was httpdxdoiorg101101080747doi bioRxiv preprint first posted online Oct 13 2016
Spike-In RNA variant controls for RNA-Sequencing bioRxiv upload 2016-10-13
16
The same pipeline comparisons were made with either all endogenous transcripts or the ones in the
higher SIRV expression range and compared to the pipeline concordances calculated with the SIRV
controls (Fig 5) We define the first bin with ǀLFCǀ lt 1 as the bin of no apparently differentially
expressed transcripts independent of the corresponding p-values The other bins contain transcripts
for which the calculated concentrations differ by more than 2-fold hence convene apparently
differentially expressed transcripts (DE) We find that SIRV controls and endogenous transcripts are
evaluated coherently While theoretically no differences are expected pipelines P3 and P1 differ in
their quantification of the same data by 44 for the SIRVs and by 69 for endogenous RNAs in the
SIRV concentration range (Fig 5A) Pipelines P2 and P4 differ to a larger extent when evaluating the
same samples (Fig 5B C) The same correlation is seen in comparisons between different samples
(shown here for RC-0 vs RC-1) The expected DE between reference RNAs UHRR and HBRR of
approximately 50 is evaluated differently by P3 vs P1 (DE of 24 ) and this is mirrored in the
evaluation of the SIRV mixes spiked into these reference RNAs (DE of 49 ) P4 vs P2 performed
worse with a pipeline difference of 39 and 103 for endogenous and SIRV transcripts The
controls show a highly similar increase when comparing P3P1 with P4P2 (21-fold from 49 to
103 ) to the endogenous RNAs (16-fold from 24 to 39 ) Here the average measurement
using the same pipeline provide a pseudo-ground truth which is compared to the measurement
using different pipelines It allows to quantify the additional error caused solely by changes in the
pipeline A change from pipeline P3 to P1 would increase the number of DE-detected transcripts to a
smaller extent than a change from P2 to P4 and this is true for both the SIRV controls and the
endogenous transcripts
not peer-reviewed) is the authorfunder All rights reserved No reuse allowed without permission The copyright holder for this preprint (which was httpdxdoiorg101101080747doi bioRxiv preprint first posted online Oct 13 2016
Spike-In RNA variant controls for RNA-Sequencing bioRxiv upload 2016-10-13
17
Figure 5 ǀ SIRV and endogenous mRNA expression analyses are affected similarly when changing
data evaluation pipelines Binned apparent LFC-moduli are shown in histograms when comparing
results obtained by different pipelines evaluating identical NGS data sets from A C) the same
samples or B D) different samples Exemplarily the comparison with the best P3 vs P1 (black
symbols) and the worst agreement P4 vs P2 (red symbols) are shown The charts compare side-by-
side the results from the SIRV controls (green) all endogenous transcripts (black outline) and
endogenous transcripts within the medium-to-high concentration range of 10 to 2250 TPM or FPKM
(blue) The average of all intra-pipeline results are shown in grey The differences Δ between
not peer-reviewed) is the authorfunder All rights reserved No reuse allowed without permission The copyright holder for this preprint (which was httpdxdoiorg101101080747doi bioRxiv preprint first posted online Oct 13 2016
Spike-In RNA variant controls for RNA-Sequencing bioRxiv upload 2016-10-13
18
analyses with the same and with different pipelines show the losses in the bins 0 lt ǀLFCǀ lt 1 and the
corresponding gain in the other bins ǀLFCǀ gt 1 The increase of the FP-rate purely caused by the
pipeline changes vs the TP range is given in the summary graphs E and F) The 1st bins 0 lt ǀLFCǀ lt 1
are divided into two 0 lt ǀLFCǀ lt 05 and 05 lt ǀLFCǀ lt 1 which facilitates the easier tracking of the
results from the SubMixes4 as shown in Fig 4 were in both figures the 1st fraction is signed with 1b
DISCUSSION
We report a significant contribution to the external RNA controls toolbox in the form of Spike-In RNA
Variants (SIRVs) that address transcription variation and alternative splicing The highly defined mixes
of 69 transcripts aligning to 7 genes enable accurate target-performance evaluations of gene
expression analysis methods which is not possible eg by analyzing larger but only loosely defined
pools of in vitro transcripts (Lahens et al 2014) or limited sets addressing special problems like
fusion genes (Tembe et al 2014) The results presented here demonstrate that the condensed
complexity of the SIRV controls mimic very closely main properties of endogenous mRNAs when
analyzing high-throughput RNA sequencing workflows for their capabilities to determine transcript
variants and their relative quantities The responses of the SIRV controls to changes in the workflows
allow to extrapolate measures for the accuracy precision and foremost inter-experiment
comparability (concordance) to the large pool of endogenous RNAs With the help of the external
controls we could confirm that biases in sequence coverage could mostly be balanced by the
exemplary chosen data evaluation algorithms and for the majority of transcripts consistent relative
abundances were obtained However in our most concordant same sample pipeline comparison
P3P1 already 44 of the controls and 69 of the endogenous RNAs in the medium to high
concentration range appeared to be differentially expressed although none of those were true
positives (TP) because the reductio ad absurdum same sample comparison was using the very same
sets of NGS reads In consequence more than 700 potential endogenous mRNA leads would be non-
validatable false positives (FP) only because of a change in data evaluation pipelines With a
not peer-reviewed) is the authorfunder All rights reserved No reuse allowed without permission The copyright holder for this preprint (which was httpdxdoiorg101101080747doi bioRxiv preprint first posted online Oct 13 2016
Spike-In RNA variant controls for RNA-Sequencing bioRxiv upload 2016-10-13
19
difference between P4 and P2 of 12 at the level of endogenous RNAs an extra 1200 FPs would
obscure the evaluation
The inter-sample comparison between UHRR and HBRR presents a rather extreme case
where around half of all transcripts were calculated to differ by more than 2-fold However the
relative FPTP weight of both comparisons remains similar as P4P2 shows again clearly higher FP-
rates in both controls and endogenous RNAs The linear interpolation (Fig 5E) allows to estimate the
effect of the experimental changes to relative small number of differences as they would be seen in
typical RNA-Seq experiments Exemplarily highlighted are the intersections at 002 and 01 in Fig 5F
TP call rates and FPTP ratios are the important figures to estimate the likelihood and inversely
related effort to validate differentially expressed transcripts For the P3P1 comparison at 2 TP we
approximate an FPTP ratio of 289 The likelihood to actually validate DE transcripts under such
circumstances would reach 035 For the P4P2 comparison the TPFP ratio estimates to mere 014
The related risks and often substantial costs for deducing potential biomarkers would be 25 times
higher Although we demonstrated in the presented example the influence of changes in data
evaluation pipeline within an integrated RNA-Seq workflow the same principles apply to the front
end - the RNA treatment NGS library preparation and sequencing Here unintended variations in
particular sample preparations can only be detected by these external spike-in controls which
operate as markers and reference spots By these means SIRV controls increase the comparability
within and between sequencing experiments at the transcript isoform level SIRVs are designed for
the co-development improvement and monitoring of library preparations sequencing and data
processing
Outlook The presented module and the 92 ERCCs which probe the wide dynamic range using
monocistronic transcripts can be stepwise extended in the future by a) ca 15 poly(A)-tail variations
of monocistronic sequences with defined lengths of 20 and 30 adenosines as well as polyadenylated
and purified RNAs with poly(A)-tail lengths close to 50 100 and above 200 nucleotides b) around 12
above-average long RNAs with 3 5 7 and 10 kb c) approx 3 RNAs each with a low medium and
not peer-reviewed) is the authorfunder All rights reserved No reuse allowed without permission The copyright holder for this preprint (which was httpdxdoiorg101101080747doi bioRxiv preprint first posted online Oct 13 2016
Spike-In RNA variant controls for RNA-Sequencing bioRxiv upload 2016-10-13
20
high GC-content d) a set of 13 mRNA relevant chemical modifications most prominent the cap-
structure (Bokar and Rottman 1998) e) variants which cover aspects of SNPs alleles inversions and
fusion genes which needs to be accounted for in the corresponding sequence annotation files and f)
a random set of small and micro RNAs that comprise all sequence variations at their termini to
account for ligation biases The external control modules need to be fine-tuned with respect to the
dynamic concentration and concentration ratio range and the reference annotations must provide a
mixture of correctly over- and under-annotated genes to better emulate the challenging conditions
for bioinformatical data evaluation Both optimizations will also further increase the congruence of
the presented SIRV module with the endogenous RNAs Eventually all modules together would
develop into a comprehensive set of approximately 250 long RNA controls plus a microRNA module
which will become sufficient for calibration and normalization purposes This new estimate reduces
the scope of designing better spike-in controls compared to the maybe thousands of IVTs which have
been previously anticipated (Kratz and Carninci 2014)
METHODS
SIRV DESIGN AND IN SILICO ANALYSIS The gene structures of seven human model genes
(KLK5 LDHD LGALS17A DAPK3 HAUS5 USF2 and TESK2) were used as scaffold for the design of
SIRV1 to SIRV7 The ENCODE-annotated transcripts as well as added variants were edited to
represent in a redundant and comprehensive manner known transcription and alternative splicing
variations (complete gene structures are shown in the odd-numbered suppl Fig from S3 to S15) All
exon sequences descend from a pool of database-derived genomes (gene fragments from viruses
and bacteriophage capsid proteins and glycoproteins selected based on a GC-content in a range of
30-50) which were modified by inverting the sequence to lose identity while maintaining a kind of
naturally occurring order in the sequences Intron sequences that do not align with exons of another
isoform were drawn from random sequences whereby the GC content was balanced to comply with
not peer-reviewed) is the authorfunder All rights reserved No reuse allowed without permission The copyright holder for this preprint (which was httpdxdoiorg101101080747doi bioRxiv preprint first posted online Oct 13 2016
Spike-In RNA variant controls for RNA-Sequencing bioRxiv upload 2016-10-13
21
the adjacent exonic sequences (Random DNA Sequence Generator
httpwwwfacultyucredu~mmadurorandomhtm)
To verify the sequence exclusivity first the exon sequences were blasted against the entire NCBI
database including ERCCs on the nucleotide and protein level (program BLASTN 2229
httpsblastncbinlmnihgov) The default BLAST parameters used were word size 28 expected
threshold 10 Max matches in query rang 20 MatchMismatch Score 1 -2 Gap Costs Linear Filter
Low complexity regions Mask for lookup table only Search of the nucleotide collection resulted for
all SIRVs in ldquono significant similarity foundrdquo Second in silico generated reads (Griebel t al 2012)
(FLUX-Generator httpsammethnetconfluencedisplaySIMHome command line flux-simulator
-p ~hellipFluxsirv1par -t simulator -x -l -s) were mapped to nine individually selected genomes using
TopHat2 (Kim et al 2013) and Bowtie2 (Langmead and Salzberg2012) Because Bowtie2-aligned
reads can be as short as 20 nt the resulting limited number of mapping reads would be deemed to
be not significant in standard NGS work-flows In contrast when mapping reads with the standard
setting of the splicing-aware TopHat2 program not a single read aligned to any of the tested
genomes Given that both searches found no significant matches off-target mapping of the SIRVs can
essentially be ruled out Therefore the artificial SIRV sequences are suitable for noninterfering
qualitative and quantitative assessments in the context of known genomic systems and
complementary to the ERCC sequences (National Institute of Standards and Technology (NIST)
certified DNA plasmids Standard Reference Materialreg 2374) The SIRV sequences can be found at
httpswwwlexogencomsirvssirvsdownloads in the Source Data files and they are also
deposited at the NCBI Nucleotide Database (PRJNA312485)
SIRV CONSTRUCTS AND THE PRODUCTION OF IN-VITRO TRANSCRIPTS Synthetic gene constructs
were produced (Bio Basic Inc Markham ON Canada) that comprised 5rsquo to 3rsquo a unique restriction
site a T7 RNA polymerase promoter whose 3rsquo G is the first nucleotide of the actual SIRV sequence
which is seamlessly followed by a (A30)-tail that is fused with an exclusive 2nd restriction site These
not peer-reviewed) is the authorfunder All rights reserved No reuse allowed without permission The copyright holder for this preprint (which was httpdxdoiorg101101080747doi bioRxiv preprint first posted online Oct 13 2016
Spike-In RNA variant controls for RNA-Sequencing bioRxiv upload 2016-10-13
22
gene cassettes were cloned into a vector colony-amplified and singularized All SIRV sequence in the
purified plasmids were verified by Sanger-sequencing to identify the correct clones The E coli
cultures were grown in batches to obtain plasmids in the lower microg-scale Double digestion of isolated
plasmids with XhoI and NsiI showed correct insert size and complete restriction Linearized silica-
purified plasmids served as templates in in vitro transcription reactions using T7 transcription kits
(AmpliScribe T7 High Yield Transcription Kit and AmpliScribe T7 Flash Transcription Kit Epicentre
Madison WI) The DNase-treated phenol-extracted and silica-purified in vitro transcription products
were assessed for concentration and purity by spectrophotometry (NanoDrop Thermo Fisher
Scientific Waltham MA) and for integrity by capillary electrophoresis (2100 Bioanalyzer RNA 6000
Pico Kit Agilent Technologies Santa Clara CA)
In the context of variant verification RNA integrity is a very important measure Fragments
arising from incomplete transcription might impose errors on the correct determination of variants
which share those sequences and thereby also affect the overall gene coverage The integrity of the
transcription products was very heterogeneous as expected given the broad sequence variation and
the length of the SIRV transcripts (average 11 kb with 14 RNAs between 20 and 25 kb) A majority
of transcripts therefore had to be purified by at least one of two purification methods Purification
method PP1 is selective for poly(A)-tails and neglects prematurely terminated transcription products
Purification method PP2 is based on size-selective quantitative electrophoresis separating the
correctly sized main products from shorter fragments (transcription break off and degraded
products) and longer fragments (run-through transcription products) After purification the 69 SIRV
RNAs were assessed to be on average 736plusmn343 in the pre-peak fraction 9031plusmn372 in the
main-peak fraction (corresponding to RNAs of correct length) and 236plusmn304 in the post-peak
fraction (mass percentages wt) Noteworthy the risks of a beginning degradation during the initial
denaturation (2 min at 70degC) and the not fully denaturing conditions during RNA microcapillary
electrophoresis tiny noise levels in the baseline and slightly different shapes of the main peak result
in a rather over- than underestimation of pre- and post-peak fractions
not peer-reviewed) is the authorfunder All rights reserved No reuse allowed without permission The copyright holder for this preprint (which was httpdxdoiorg101101080747doi bioRxiv preprint first posted online Oct 13 2016
Spike-In RNA variant controls for RNA-Sequencing bioRxiv upload 2016-10-13
23
rRNasin (Promega Madison WI) was added to 08 Umicrol to minimize the risks of RNase
contamination induced RNA degradation The SIRVs were quantified by absorbance spectroscopy to
adjust all stock solutions to a base concentration of close to but above 50 ngmicrol RNA purity was very
high with A 260280 214plusmn012 and A 260230 217plusmn020
SIRV MIXING SIRV mixes were designed that contain pools of SIRVs (SubMixes) in defined
amounts and ratios by combining accurate volumes of the stock solutions in sufficiently large batch
sizes Pipetting errors vary depending on transfer volumes and range from plusmn4 for 2 microl to plusmn08 for
gt100 microl transfers The precision was experimentally determined with blank solutions Starting with
the stock concentration measurement (NanoDrop accuracy plusmn2 ngmicrol for 50 ngmicrol or plusmn4 ) and
accounting for the entire mixing pathway the accumulative concentration error is expected to range
between plusmn8 and plusmn47 Therefore in the data evaluation one has to account for the experimental
fuzziness by allowing for lower accuracy thresholds of plusmn8 on the linear scale or plusmn011 on the log2-
fold scale respectively The SIRV concentration ratios between two mixes are more precise because
only one final pipetting step defines the concentration differences and synchronizes all SIRVs which
belong to the same SubMix Here a maximal error of plusmn4 (or plusmn0057 on the log2-fold scale) can be
expected between SubMixes while all SIRVs of the same SubMix must propagate coherently into the
final mixes Bioanalyzer traces were used to monitor the relative propagation of the SIRVs PreMixes
and SubMixes during the mixing (Fig 2B) In addition the accurate pipetting of the 8 PreMixes was
controlled by checksums of Nanodrop concentration measurements which deviated by only
0002plusmn34 from the calculated target concentrations and by weighing on an analytical balance
which showed a deviation of 18plusmn065 The final concentration of the SIRV mixes are set to be 253
ngmicrol
not peer-reviewed) is the authorfunder All rights reserved No reuse allowed without permission The copyright holder for this preprint (which was httpdxdoiorg101101080747doi bioRxiv preprint first posted online Oct 13 2016
Spike-In RNA variant controls for RNA-Sequencing bioRxiv upload 2016-10-13
24
SPIKING OF REFERENCE RNA WITH SIRV MIXES In general SIRV mixes can be used with crude
cell extracts purified total RNA rRNA-depleted RNA or poly(A)-enriched RNA Important the spike-in
ratios have to be chosen in concordance with the desired final SIRV content the RNA preparation
method and if known the expected mRNA content One widely applicable spike-in ratio can be
obtained by adding 006 ng of controls to approximately 100 ng of total RNA In the presented
examples the total RNA mass of one single aliquot RNA was 100 ng of UHRR in RC-0 and 1128 ng of
HBRR in RC-1 The reference RNA in RC-2 was calculated to be 10427 ng (Fig S2) The high-
concentrated and thereby stable SIRV mix stocks with 253 ngmicrol and ERCC mix stocks with 30 ngmicrol
(ERCC Spike-In Mixes 1 and 2 by Ambion Thermo Fisher Waltham MA) were diluted just prior to the
spiking to facilitate the mixing of manageable volumes For example the final 11000 dilution
reduced the SIRV mix concentration to 253 pgmicrol from which 237 microl were required to spike a 100 ng
total RNA sample with 006 ng SIRVs The RC-samples were produced in large batches to yield
hundreds of samples allowing for a protocol with fewer dilutions and larger volumes reducing
thereby sources of experimental errors
NGS LIBRARY PREPARATION AND SEQUENCING The experiments were carried out in technical
triplicates From 1 microg RC-0 RC-1 or RC-2 RNA in total nine NGS libraries were prepared by Fasteris SA
(Plan-les-Ouates CH) using the TruSeq stranded mRNA library preparation kit with polyA selection
(Illumina Inc San Diego CA) All primary library templates were amplified with 14 PCR cycles to
reach reproducible concentrations 155plusmn45 nM and insert sizes 165plusmn10 bp An equimolar lane-mix
was sequenced at the CSF Campus Science Support Facilities GmbH (CSF Vienna AUT) in PE125
mode in one lane of a HiSeq 2500 flowcell in 125 bp paired-end mode using V4 chemistry The run
yielded 305 M raw reads 293 M after demultiplexing and trimming which corresponds to a read
depth of 326plusmn22 M reads per library
not peer-reviewed) is the authorfunder All rights reserved No reuse allowed without permission The copyright holder for this preprint (which was httpdxdoiorg101101080747doi bioRxiv preprint first posted online Oct 13 2016
Spike-In RNA variant controls for RNA-Sequencing bioRxiv upload 2016-10-13
25
READ PROCESSING AND MAPPING Standard data processing routines (bbduk part of BBMap by
B Bushnell to be found at sourceforgenetprojectsbbmap) were applied removing low quality
reads and trimming adapter sequences Due to variable stringencies the mappers produced different
read statistics STAR mapped against the genome 897plusmn59 of the reads (864plusmn56 uniquely) and
TopHat2 852plusmn57 (794plusmn52 uniquely) Bowtie2 mapped against the transcriptome 693plusmn18
reads (151plusmn15 uniquely)
ESTIMATION OF THE MRNA CONTENTS Based on the obtained read distributions the relative
mass partition between external controls and endogenous RNA fraction can be estimated Because
the library preparation uses a poly(A)-enrichment step the targeted endogenous RNA corresponds
almost exclusively to the mRNA content of the samples The propagation of the input mass ratio to
the output read ratio depends on both the mRNA content and the efficiencies of how controls and
mRNA proceed through the library preparation The relationship is described by Eqn 1
reRNA times prod(1 rconifrasl )
j
i=1
= (EeRNA times meRNA) times prod(1 (Econi times mconi)frasl )
j
i=1
Equation 1
with r number of reads from eRNA the endogenous RNA fraction here mRNA and con the
controls here SIRVs and ERCC E the relative efficiency of how the fraction proceeds through the
workflow and m the input mass
Ratios are measured as relative read counts and the results as a product of efficiencies and
apparent amounts are also relative measures Therefore at least one de facto arbitrary reference
point needs to be defined to deduce comparable absolute results Several reference points or
default values can be defined which lead to different dependent variables and imply slightly variable
interpretation of the results The following three calculation examples are simple deductions from
not peer-reviewed) is the authorfunder All rights reserved No reuse allowed without permission The copyright holder for this preprint (which was httpdxdoiorg101101080747doi bioRxiv preprint first posted online Oct 13 2016
Spike-In RNA variant controls for RNA-Sequencing bioRxiv upload 2016-10-13
26
the ratio shown in Eqn 1 with the ERCC (con1) and the SIRVs (con2) respectively Variation 1 is
explained in greater detail while in the other variants only the differing aspects are highlighted
Variation 1 i) Here the first assumption is that the mRNA content in UHRR (Agilent Santa
Clara CA) is 3 (factor 003) and 2 (factor 002) in HBRR (Ambion Thermo Fisher Waltham MA)
which stays in close agreement to previous estimates concluded from experiments by Shippy et al in
2006 The amounts of total RNA were measured by Nanodrop absorbance spectroscopy The UHRR
samples contained 100 ng and the HBRR samples 1128 ng The mixing ratio of (2times RC-0) (1times RC-1)
determines the concentration of the 3rd sample RC-2 and further the amount of total RNA (10427
ng) as well as its related mRNA content (2times100 ng times 3 + 1times1128 ng times 2 ) (2times100 ng + 1times1128
ng) = 264 (factor 0026) The mRNA masses of the samples are calculated by the measured total
RNA input amounts and default mRNA contents are 3 ng 2256 ng and 2752 ng The second
assumption is that the endogenous mRNAs proceed with the maximal efficiency of 100 (factor 1)
through library preparation and sequencing The input of the spike-in controls is the product of the
concentration values which were either measured as in the case of the SIRV stocks or stated by the
vendor as in the case of the ERCC stocks and the pipetted volumes Both are treated as de facto
measured values
ii) The relative amounts of reads which have been assigned to either endogenous mRNA
ERCCs or SIRVs are obtained from the mapping statistics (read classification)
iii) The ratio of mass input to reads output allows to calculate the propagation efficiency of
the controls relative to the default efficiency of the endogenous mRNA In the present experiment
the SIRVs progress with a relative efficiency of 867plusmn57 and the ERCCs with 416plusmn47 The
significant difference between the relative efficiency of both controls is very likely caused by the
different lengths of the poly(A)-tails which might influence a different binding efficiency during
poly(A)-enrichment step The SIRVs with a 30 nt long poly(A)-tail perform much more in concordance
with the endogenous mRNA as the ERCCs which contain shorter and variable poly(A)-tails ( 23 nt)
The observed small differences in the experiments using RC-0 RC-1 or RC-2 could be caused by a
not peer-reviewed) is the authorfunder All rights reserved No reuse allowed without permission The copyright holder for this preprint (which was httpdxdoiorg101101080747doi bioRxiv preprint first posted online Oct 13 2016
Spike-In RNA variant controls for RNA-Sequencing bioRxiv upload 2016-10-13
27
two-way interference of samples and controls However the deviations are small and can rather be a
result of minor inaccuracies in determining the relative input amounts Both hypotheses would need
to be verified by a series of repeats with the aim to resolve potential influences of pipetting during
the sample preparation variations in the library preparation and other contributions
Variation 2 Here no varying interferences between samples and controls are permitted
which means that relative efficiencies of the controls are considered to be constant The causes of
the experimental variations are exclusively assigned to the input amounts (alike hypothesis two in
the above example in discussing the deviation of the results in RC-2) This would translate into input
standard deviations of 118 (SIRVs) and 76 (ERCCs) The variations meld all accumulating errors
made in determining the concentration of the control stock solutions preparing the subsequent
dilutions pipetting the samples and controls during the spike-in step itself as well as determining the
amount of sample RNA in the first place Against the background of potential errors the calculated
results can be considered as highly consistent
Variation 3 In addition to the assumptions made for the measurement of sample RC-0
the spike-in of 006 ng SIRVs to all samples is also set as default Alike variation 2 the experiments in
RC-1 and RC-2 adopt the same default setting for the relative efficiencies calculated in RC-0
According to the ratio of Eqn 1 one can obtain mRNA contents as well as ERCC input amounts in this
case for samples RC-1 and RC-2 The mRNA content of the HBRR sample (RC-1) relative to the default
mRNA content in the UHRR sample (set to 3 ) would be 172 lower than the previously assumed
2 According to the present mixing scheme it would also imply that sample RC-2 has an mRNA
content of 254 up from the calculated 234 The offsets of -79 is again small and very likely
refers to the level of accuracy in the experimental results as discussed above Using this method the
spiking of samples with controls such as the SIRVs allows to closely estimate the relative mRNA
content of any unknown sample and to draw conclusions eg on the transcriptional state of tissues
cell suspension or individual cells
not peer-reviewed) is the authorfunder All rights reserved No reuse allowed without permission The copyright holder for this preprint (which was httpdxdoiorg101101080747doi bioRxiv preprint first posted online Oct 13 2016
Spike-In RNA variant controls for RNA-Sequencing bioRxiv upload 2016-10-13
28
COEFFICIENT OF DEVIATION We implemented a strand specific Coefficient of Deviation
(CoD) which aims to reflect the quality of NGS pipelines targeted at specific effects in particular
lsquospikenessrsquo of the coverage while systematic effects like drop of the coverage at Transcription Start
Sites (TSS) and Transcription End Sites (TES) are being suppressed The CoD is implemented by Eqn
2
CoD = CoD(LTSSLTES) = sum (cidealp- crealp)2
TESe
p=TSS1
divide sum cidealp
TESe
p=TSS1
Equation 2
which is calculated in strand orientation for contigs along all exonic nucleotide position (p) from the
first annotated TSS (TSS1) up to the last annotated TES (TESe) whereby cideal are the ideal coverages
with the optimized transient regions (LrsquoTSS LrsquoTES) and creal are the real coverages scaled as such that
the total integrals along all positions of ideal and real coverages are equal
The transient function at TSS and TES is the error function erf(x) which corresponds to
Cufflinks assumption about normally distributed fragment lengths (Trapnell et al 2012) Since erf(x)
is a non-algebraic function we used the algebraic approximation by Abramowitz and Stegun
(httpsenwikipediaorgwikiError_function eq 7125) Once the optima (LrsquoTSS LrsquoTES ) are found
we declare CoD(LrsquoTSS LrsquoTES) to be the ultimate CoD value which mostly eliminated the transient region
effects We implemented an optimization algorithm (Nelder-Mead downhill simplex method) and
used as starting values (L0TSS L0
TES ) lengths of 150 In some cases the optimum found can be beyond
a reasonable range of values Therefore we censor the output Lopt of the mathematical optimization
as follows Lcensored = 50 if Lrsquo lt 50 Lcensored = 350 if Lrsquo gt 350 This corresponds to the maximal range of
not peer-reviewed) is the authorfunder All rights reserved No reuse allowed without permission The copyright holder for this preprint (which was httpdxdoiorg101101080747doi bioRxiv preprint first posted online Oct 13 2016
Spike-In RNA variant controls for RNA-Sequencing bioRxiv upload 2016-10-13
29
200plusmn150 This censoring needed to be applied in 8 cases out of 84 SIRVmixstrandend
combinations ie less than in 10
TRANSCRIPT CONCENTRATION MEASUREMENTS In order to estimate expression values on
transcript levels we applied RSEM (Li and Dewey 2011) which uses a Bayesian Network to compute
the likelihood of each fragment belonging to a given transcript Salmon (Patro et al 2015) estimates
the transcript expression values by a k-mer based mapping Similar to RSEM it uses an expectation-
maximization (EM) algorithm to compute the maximum likelihood of relative abundances Cufflinks2
(Trapnell et al 2013) estimates the transcript abundances with a coverage-based maximum
likelihood approach It determines the probability of read assignments to isoforms
DIFFERENTIAL EXPRESSION ANALYSIS We used the DESeq2 package (Love et al 2014) for
calculation of fold-differences between the results from different pipelines and different input samples
mixtures As explained in the main text all outputs from the evaluated pipelines (in form of relative
concentration measures) have been scaled Scaling by linear transformation is needed as a
consequence of the different mRNA contents in the samples but also to eventually compensate any
potential pipetting errors when small aliquots typically in the range of very few microliter are added
to individual samples The RC-samples in this experiment were produced in a large batch to ensure
high accuracy in volumetric ratios The main sample pool is practically invariant to the small relative
contribution of the controls but was technically treated in the same way by scaling the main sample
pools to identical sizes First SIRV concentrations were scaled to reach together 69 in E0 685 in E1
and 708 in E2 which is the dimensionless value identical to the fmolmicrol in the respective SIRV stock
solutions Then the lower threshold was set to 10-6 which corresponds to original FPKM values of
around 5∙10-3 ⅟7th of one read for a 1 kb long transcript at a read depth of 30 Mio reads or 1 gene
specific read to be divided between 7 equally possible transcript variants at said 1 kb length section
The threshold is to be understood as less than or equal to 10-6 which defines an averaged read
not peer-reviewed) is the authorfunder All rights reserved No reuse allowed without permission The copyright holder for this preprint (which was httpdxdoiorg101101080747doi bioRxiv preprint first posted online Oct 13 2016
Spike-In RNA variant controls for RNA-Sequencing bioRxiv upload 2016-10-13
30
resolution of the particular workflow at the given read depth By these means all ratios remain defined
Second for the DESeq2 calculations we multiplied all values with 106 after which fractions were
rounded to the closest integer We understand that for no-change hypothesis testing which is the
main purpose of the DESeq2 package transforming the relative concentrations (FPKM or TPM) to
lsquoquasi-read-countsrsquo is not recommended since DESeq2 internally corrects for library size by using size
factors However in our application we do not use the probability of the hypothesis rejection (P
values) but the raw fold changes detected (irrespectively of the dispersion values for that given
transcript) We also took into account the potential danger of censoring the input (by unintentionally
eliminating transcripts represented by extremely low FPKM or TPM values) by setting a suitable
threshold as described above The figures show only two differential expression analyses because the
3rd concentration ratio E2E0 is the product of E1E0 and E2E1
ERROR RATE ANALYSIS The four red data points two from the SIRV controls (circles) and two
from the endogenous mRNAs (squares) from the best agreement (P3 vs P1) and the four
corresponding black data points from the worst agreement (P4 vs P2) as shown in fig 5E were fitted
by linear approximation using the relationship as derived for Eqn 3
TP + FP = 1
FP = N times ER = (1-TP) times ER
(TP+FP) = TP + ER - TP times ER
(TP+FP) = (1-ER) times TP + ER Equation 3
where TP is the relative portion of true positives (differentially expressed as in our definition
possessing a LFC gt 1) N the relative portion of negatives ER the error rate at which negatives are
falsely detected as positives to result in false positives FP The least squares fitting method was
applied to derive values for the slope (1-ER) and the intercept ER
not peer-reviewed) is the authorfunder All rights reserved No reuse allowed without permission The copyright holder for this preprint (which was httpdxdoiorg101101080747doi bioRxiv preprint first posted online Oct 13 2016
Spike-In RNA variant controls for RNA-Sequencing bioRxiv upload 2016-10-13
31
The transformation of Eqn 3 leads to the relationship of Eqn 4
TP FPfrasl = (TP+FP) TPfrasl -1 Equation 4
which has been used for the graph in fig 5F In the present context the concept of ROC-curves is not
applicable because the true or false negatives are indistinguishable as long the ground truth of the
endogenous RNA are unknown
DATA ACCESS Sequencces and source data files data are in the process to be deposited at
NCBI under BioProject ID PRJNA312485
ACKNOWLEDGMENTS We thank SA Munro and M Salit (Material Measurement
Laboratory National Institute of Standards and Technology) for their efforts in further developing the
concepts of the External RNA Control Consortium (ERCC) in an updated suite of RNA controls and
analysis methods called ERCC 20 We thank A Tuerk for his contributions in finding suitable human
model genes G Wiktorin for carrying out the RSEM calculations M Mihaylova in helping with the
graphics design and I Gabler for critically reading the manuscript
AUTHOR CONTRIBUTIONS LP PK and TR designed the sequences and mixtures PK and GH
prepared the in vitro transcripts and spike-in mixtures TR AS and LP designed the research and
the experiments MA IH and TR evaluated the data TR and LP wrote the manuscript
DISCLOSURE DECLARATION The authors are employees of Lexogen GmbH from which the SIRVs
can be bought and AS has equity stakes in Lexogen GmbH LP PK and TR are named as
not peer-reviewed) is the authorfunder All rights reserved No reuse allowed without permission The copyright holder for this preprint (which was httpdxdoiorg101101080747doi bioRxiv preprint first posted online Oct 13 2016
Spike-In RNA variant controls for RNA-Sequencing bioRxiv upload 2016-10-13
32
inventors on a patent application regarding the production and use of RNA transcript variants and
Lexogen GmbH is the owner of this patent application
REFERENCES
Baker SC Bauer SR Beyer RP Brenton JD Bromley B Burrill J Causton H Conley MP Elespuru R Fero M et al 2005 The External RNA Controls Consortium a progress report Nat Methods 2(10) 731-4 Bokar JA Rottman FM 1998 Biosynthesis and Functions of Modified Nucleosides in Eukaryotic mRNA In Modification and Editing of RNA (eds Grosjean H Benne R) pp 183-200 ASM Press Washington DC Dobin A Davis CA Schlesinger F Drenkow J Zaleski C Jha S Batut P Chaisson M Gingeras TR 2013 STAR ultrafast universal RNA-seq aligner Bioinformatics 29(1) 15-21 Fed Reg Doc 2015-19742 2015 External RNA Controls Consortium - Call for Participation and Contributions to a Sequence Library Federal Register Citation 80 FR 48296 Griebel T Zacher B Ribeca P Raineri E Lacroix V Guigoacute R Sammeth M 2012 Modelling and simulating generic RNA-Seq experiments with the flux simulator Nucleic Acids Res 40(20) 10073-83 Jiang L Schlesinger F Davis CA Zhang Y Li R Salit M Gingeras TR Oliver B 2011 Synthetic spike-in standards for RNA-seq experiments Genome Res 21(9) 1543-51 Kim D Pertea G Trapnell C Pimentel H Kelley R Salzberg SL 2013 TopHat2 accurate alignment of transcriptomes in the presence of insertions deletions and gene fusions Genome Biol 14(4) R36 Kratz A Carninci P 2014 The devil in the details of RNA-seq Nat Biotechnol 32(9) 882-4 Lahens NF Kavakli IH Zhang R Hayer K Black MB Dueck H Pizarro A Kim J Irizarry R Thomas RS et al 2014 IVT-seq reveals extreme bias in RNA sequencing Genome Biol 15(6) R86 Langmead B Salzberg SL 2012 Fast gapped-read alignment with Bowtie 2 Nat Methods 9(4) 357-9 Li B Dewey CN 2011 RSEM accurate transcript quantification from RNA-Seq data with or without a reference genome BMC Bioinformatics 12 323 Li J Jiang H Wong WH 2010 Modeling non-uniformity in short-read rates in RNA-Seq data Genome Biol 11 R50 Li S Tighe SW Nicolet CM Grove D Levy S Farmerie W Viale A Wright C Schweitzer PA Gao Y et al 2014 Multi-platform assessment of transcriptome profiling using RNA-seq in the ABRF next-generation sequencing study Nat Biotechnology 32 915-25 Love MI Huber W Anders S 2014 Moderated estimation of fold change and dispersion for RNA-seq data with DESeq2 Genome Biol 15(12) 550
not peer-reviewed) is the authorfunder All rights reserved No reuse allowed without permission The copyright holder for this preprint (which was httpdxdoiorg101101080747doi bioRxiv preprint first posted online Oct 13 2016
Spike-In RNA variant controls for RNA-Sequencing bioRxiv upload 2016-10-13
33
Mortazavi A Williams BA McCue K Schaeffer L Wold B 2008 Mapping and quantifying mammalian transcriptomes by RNA-Seq Nat Methods 5(7) 621-8 Patro R Duggal G Kingsford C 2015 Accurate fast and model-aware transcript expression quantification with Salmon bioRxiv preprint doi httpdxdoiorg101101021592 Shippy R Fulmer-Smentek S Jensen RV Jones WD Wolber PK Johnson CD Pine PS Boysen C Guo X Chudin E et al 2006 Using RNA sample titrations to assess microarray platform performance and normalization techniques Nat Biotechnol 24(9) 1123-31 SEQCMAQC-III Consortium 2014 A comprehensive assessment of RNA-seq accuracy reproducibility and information content by the Sequencing Quality Control Consortium Nat Biotechnology 32 903-14 Tembe WD Pond SJ Legendre C Chuang HY Liang WS Kim NE Montel V Wong S McDaniel TK Craig DW Carpten JD 2014 Open-access synthetic spike-in mRNA-seq data for cancer gene fusions BMC Genomics 15 824 Trapnell C Roberts A Goff L Pertea G Kim D Kelley DR Pimentel H Salzberg SL Rinn JL Pachter L 2012 Differential gene and transcript expression analysis of RNA-seq experiments with TopHat and Cufflinks Nat Protoc 7(3) 562-78 Trapnell C Hendrickson DG Sauvageau M Goff L Rinn JL Pachter L 2013 Differential analysis of gene regulation at transcript resolution with RNA-seq Nat Biotechnol 31(1) 46-53 van Dijk EL Jaszczyszyn Y Thermes C 2014 Library preparation methods for next-generation sequencing tone down the bias Exp Cell Res 322(1) 12-20 Wang Z Gerstein M Snyder M 2009 RNA-Seq a revolutionary tool for transcriptomics Nat Rev Genet 1 57-63 Zheng W Chung LM Zhao H 2011 Bias detection and correction in RNA-Sequencing data BMC Bioinformatics 12290
not peer-reviewed) is the authorfunder All rights reserved No reuse allowed without permission The copyright holder for this preprint (which was httpdxdoiorg101101080747doi bioRxiv preprint first posted online Oct 13 2016
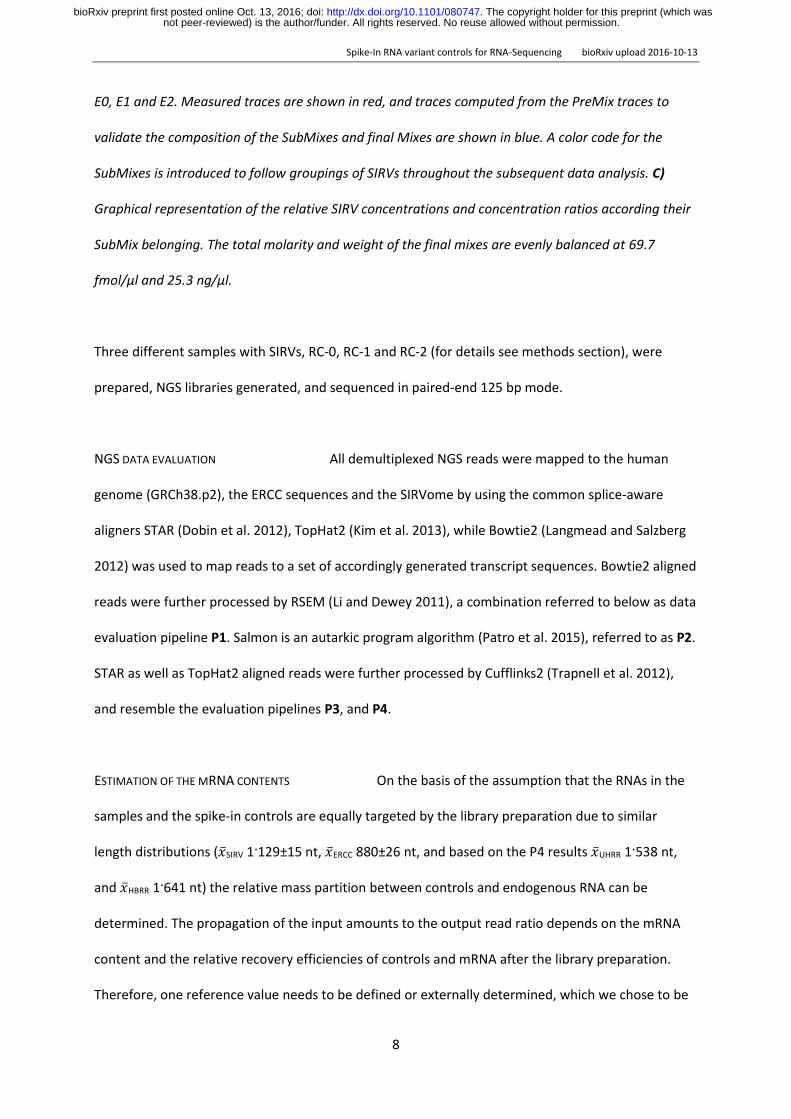
Spike-In RNA variant controls for RNA-Sequencing bioRxiv upload 2016-10-13
8
E0 E1 and E2 Measured traces are shown in red and traces computed from the PreMix traces to
validate the composition of the SubMixes and final Mixes are shown in blue A color code for the
SubMixes is introduced to follow groupings of SIRVs throughout the subsequent data analysis C)
Graphical representation of the relative SIRV concentrations and concentration ratios according their
SubMix belonging The total molarity and weight of the final mixes are evenly balanced at 697
fmolmicrol and 253 ngmicrol
Three different samples with SIRVs RC-0 RC-1 and RC-2 (for details see methods section) were
prepared NGS libraries generated and sequenced in paired-end 125 bp mode
NGS DATA EVALUATION All demultiplexed NGS reads were mapped to the human
genome (GRCh38p2) the ERCC sequences and the SIRVome by using the common splice-aware
aligners STAR (Dobin et al 2012) TopHat2 (Kim et al 2013) while Bowtie2 (Langmead and Salzberg
2012) was used to map reads to a set of accordingly generated transcript sequences Bowtie2 aligned
reads were further processed by RSEM (Li and Dewey 2011) a combination referred to below as data
evaluation pipeline P1 Salmon is an autarkic program algorithm (Patro et al 2015) referred to as P2
STAR as well as TopHat2 aligned reads were further processed by Cufflinks2 (Trapnell et al 2012)
and resemble the evaluation pipelines P3 and P4
ESTIMATION OF THE MRNA CONTENTS On the basis of the assumption that the RNAs in the
samples and the spike-in controls are equally targeted by the library preparation due to similar
length distributions (SIRV 1129plusmn15 nt ERCC 880plusmn26 nt and based on the P4 results UHRR 1538 nt
and HBRR 1641 nt) the relative mass partition between controls and endogenous RNA can be
determined The propagation of the input amounts to the output read ratio depends on the mRNA
content and the relative recovery efficiencies of controls and mRNA after the library preparation
Therefore one reference value needs to be defined or externally determined which we chose to be
not peer-reviewed) is the authorfunder All rights reserved No reuse allowed without permission The copyright holder for this preprint (which was httpdxdoiorg101101080747doi bioRxiv preprint first posted online Oct 13 2016
Spike-In RNA variant controls for RNA-Sequencing bioRxiv upload 2016-10-13
9
an mRNA content of 3 in UHRR (Shippy et al 2006) We further set the efficiency of the
endogenous mRNA proceeding through this particular library preparation to 100 The SIRVs can
then be calculated to progress with a relative efficiency of 870plusmn6 allowing to determine the
mRNA content in the second sample HBRR to be 172 The mRNA content in the mixed samples
RC-2 is then assessed to be 234 which corresponds to a minor -91 offset relative to the
theoretical outcome based on the RC-0 and RC-1 measurements In the TruSeq library preparation
the 30 nt long poly(A)-tail of the SIRVs ensures an enrichment similar to the endogenous mRNAs The
ERCC controls show a lower recovery efficiency of 416plusmn47 most likely due to their shorter poly(A)-
tails which vary between 19 and 25 adenines ( 23 nt) The results are summarized in suppl Tab S1
COMPARISON BETWEEN EXPECTED AND MEASURED COVERAGE AND CONCENTRATION MEASURES For the first
time the ground truth of complex input sequences is available allowing detailed target-performance
comparisons for read alignment relative abundance calculation and differential expression
determination Fig 3 shows for one example gene SIRV 3 in E0 the expected coverages and counts
of the telling junctions together with the coverages obtained by STAR and TopHat2 mapping NGS
workflow-specific read start-site distributions lead to coverage patterns with inherent terminal
deficiencies for which the expected coverage has been adjusted accordingly However in the
measured coverages these systematic start- and end-site biases are accompanied by a variety of
biases which introduce severe local deviations from the expected coverage
not peer-reviewed) is the authorfunder All rights reserved No reuse allowed without permission The copyright holder for this preprint (which was httpdxdoiorg101101080747doi bioRxiv preprint first posted online Oct 13 2016
Spike-In RNA variant controls for RNA-Sequencing bioRxiv upload 2016-10-13
10
Figure 3 ǀ Comparison of the expected and the measured coverages for the SIRV3 locus in mix E0
A) Individual transcripts of SIRV3 with transcripts on the plus strand in blue and in red for the ones on
the minus strand Color code indicates the SubMix allocation B) The expected SIRV3 coverage is
shown as superposition of individual transcript coverages in which the terminal sites have been
modelled by a transient error function The measured coverages after read mapping by TopHat2 are
shown in grey The measured coverages and number of splice junction reads were normalized to
obtained identical areas under the curves and identical sums of all junctions for the expected and
measured data The measured splice junction reads are shown by the numbers before the brackets
not peer-reviewed) is the authorfunder All rights reserved No reuse allowed without permission The copyright holder for this preprint (which was httpdxdoiorg101101080747doi bioRxiv preprint first posted online Oct 13 2016
Spike-In RNA variant controls for RNA-Sequencing bioRxiv upload 2016-10-13
11
while the expected values are shown inside the brackets The CoD values are given for the plus and
minus strand in the respective colors C) Differences between mapping by STAR aligner and TopHat2
The black arrows indicate the direction of positive differences Percentages refer to the relative
changes of the measured splice junction reads
To obtain a comparative measure gene-specific coefficients of deviation CoD were calculated CoDs
describe the often hidden biases in the sequence data predominantly caused by an inhomogeneous
library preparation but also by the subsequent sequencing and mapping In the presented example
the stranded TruSeq library preparation with the Illumina HiSeq2500 sequencing and mapping by
TopHat2 results in a mean CoD of 0190plusmn0193 across all SIRVs For the sense oriented SIRVs the
mean CoD is 0275plusmn0223 and for the antisense SIRVs which cover a region of fewer overlapping
transcript annotations the mean CoD is 0090plusmn0076 The coverage target-performance comparison
highlights the inherent difficulties in deconvoluting read distributions to correctly identify transcript
variants and determine concentrations The distribution of telling reads splice junctions and reads
towards the termini are references for the assignment of the remaining reads before calculating
relative transcript variant abundances Not surprisingly although the majority of junction counts
correlates well with the expected values the high CoD values indicate that numerous telling reads
deviate significantly within the context of the individual mixes They also differ between mixes which
affects differential expression measurements (see Fig 3B and for the coverage of all seven SIRV
genes the even suppl Fig from S4 to S16)
The CoD does not allow to distinguish between periodicity and randomness in the biases nor
does it forecast how well a data evaluation strategy can cope with the bias contributions
Nevertheless smaller CoD values are expected to correlate with a simpler and less error-prone data
evaluation The CoD values can be taken as a first indicative measure to characterize the mapped
data and to compare data sets for similarity up to this point in the workflow Target-performance
comparisons of all SIRV genes in all three mixes can be found in the supplemental information
not peer-reviewed) is the authorfunder All rights reserved No reuse allowed without permission The copyright holder for this preprint (which was httpdxdoiorg101101080747doi bioRxiv preprint first posted online Oct 13 2016
Spike-In RNA variant controls for RNA-Sequencing bioRxiv upload 2016-10-13
12
The above described four data analysis pipelines P1 to P4 were used to calculate transcript
abundances for 69 SIRV and 196˙165 annotated endogenous transcripts All obtained results are
relative concentration measures yielding either Fragments Per Kilobase of exon per Million
fragments mapped (FPKM) (Mortazavi 2008) or Transcripts Per Million (TPM) (Li and Dewey 2011)
The concentrations were scaled by linear transformation in such way that all SIRVs together reach 69
in E0 685 in E1 and 708 in E2 which is the dimensionless value identical to the fmolmicrol in the
respective SIRV stock solutions In consequence the relative quantities of the SIRVs are compatible
to the normalized scale which was introduced in Fig 2C Boxplots in Fig 4 show exemplarily the SIRV
concentrations and two discrete differentials as measured by P3 (results from P1 P2 and P4 are
shown in suppl Fig S17 and standard correlation plots of the four pipelines are shown in suppl Fig
S18) The majority of all SubMix mean concentration values are in concordance with the expected
values The concentration ratios simulating differential expression measurements are less prone to
systematic offsets and show by trend narrower distributions However these correlations highlight
already the issue of obvious and frequent outliers ie transcript variants that are not well resolved
not peer-reviewed) is the authorfunder All rights reserved No reuse allowed without permission The copyright holder for this preprint (which was httpdxdoiorg101101080747doi bioRxiv preprint first posted online Oct 13 2016
Spike-In RNA variant controls for RNA-Sequencing bioRxiv upload 2016-10-13
13
Figure 4 ǀ Box plot overview of calculated concentration values for SIRV mixes and mix ratios
Reads from SIRV mixes E0 E1 and E2 were processed by four different data evaluation algorithms for
transcript quantification Results derived by pipeline P3 are exemplarily shown in reference to the
known inputs (bars in colors corresponding to the SIRV SubMixes of Fig 2) The black circles mark the
mean and the bold dashes the medians of the data points which are shown in grey the boxes span
the 25 to 75 region of the data points and the black whiskers with connecting lines reach up to the
min and max values and indicate also outliers outside the scale of the graph The comparison E1 vs
E0 from sample RC-1 and RC-0 (2nd row) was used for building the histogram of Fig 5B The shaded
area resembles the 1st bin (0leǀLFCǀle1) while the inner section (b1) comprises the fraction 0leǀLFCǀlt05
where the majority of data points originates from SubMix4 (ratio 11) and some ldquooutliersrdquo from
SubMix2 which were actually spiked in at the ratio 21
Heat maps allow to inspect each SIRV in the context of competing transcripts Tab 1B shows
the abundancies as log2-fold changes LFC relative to the expected values for the example of SIRV 6
LFC values consider relative increases and decreases across all concentration ranges likewise An LFC
window of plusmn011 presents the confidence interval as a result from the currently achievable accuracy
not peer-reviewed) is the authorfunder All rights reserved No reuse allowed without permission The copyright holder for this preprint (which was httpdxdoiorg101101080747doi bioRxiv preprint first posted online Oct 13 2016
Spike-In RNA variant controls for RNA-Sequencing bioRxiv upload 2016-10-13
14
in producing the SIRV mixtures We examine the LFC values uncoupled from the adjusted p-values
which provide a statistical measure of the significance level for apparent differential expression By
these means we prevent pipelines to appear more coherent only due to higher noise levels The
accuracy has been calculated for each SIRV as the mean of the LFCs in all three mixes The precision is
a measure of how consistent SIRVs are quantified and has been calculated as the LFC standard
deviation for each SIRV and further for entire pipelines by using all SIRVs Within the presented
example SIRVs can obtain in all four pipelines high precisions of up to 018plusmn007 and high accuracies
of up to -001plusmn010 (SIRV604) In contrast SIRV612 of similar length has an average precision of
569plusmn368 and an accuracy of -386plusmn270 although it was detected by P2 with a high precision of 012
at an accuracy of 018 This quantification of differences between pipelines now directly permits to
assess the effect of changes in workflows and individual experiments
COMPARISON BETWEEN DIFFERENT WORKFLOWS When ranking the four pipelines by said precision P3
gives the lowest value with 129 followed by P4 with 164 P1 with 198 and P2 with 214 However
a sample-specific global target-performance comparison is not the strongest criteria for evaluating
performance differences at transcript resolution For this purpose the apparent differential
expression shows if similar errors are caused by the same or different transcripts The highest
concordance was found between P3 and P1 (labelled P3P1) calculated as standard deviation of all
SIRV LFCs with 101 followed by P4P3 (104) P4P1 (255) P2P1 (288) and P3P2 (309) The
lowest concordance has P4P2 with a value of 412 One section of the resulting heat map for both
extremes is shown in Tab 1C
not peer-reviewed) is the authorfunder All rights reserved No reuse allowed without permission The copyright holder for this preprint (which was httpdxdoiorg101101080747doi bioRxiv preprint first posted online Oct 13 2016
Spike-In RNA variant controls for RNA-Sequencing bioRxiv upload 2016-10-13
15
Table 1 ǀ Variance heat map of SIRV concentration measures detailing SIRV6 by the 4 different
pipelines P1 to P4 A) Given are SIRV transcript identifier SubMix (SM) color code and transcript
lengths (in nucleotides) B) Heat maps showing the log-fold changes (LFC) for the comparison of the
normalized expected and measured SIRV concentrations as a result from the four data evaluation
pipelines P1 to P4 evaluating E0 E1 and E2 Fields with -1 le LFC le 1 are filled with gradient green all
fields with LFC lt -1 with straight blue and all fields with LFC gt 1 with straight red C) From all 6
possible pairwise comparisons P2P1 P3P1 to P4P3 of the normalized measured SIRV
concentrations the one with the smallest (P3P1) and largest (P4P2) median of all LFC are shown
The complete heat map is shown in the suppl Tab S2
not peer-reviewed) is the authorfunder All rights reserved No reuse allowed without permission The copyright holder for this preprint (which was httpdxdoiorg101101080747doi bioRxiv preprint first posted online Oct 13 2016
Spike-In RNA variant controls for RNA-Sequencing bioRxiv upload 2016-10-13
16
The same pipeline comparisons were made with either all endogenous transcripts or the ones in the
higher SIRV expression range and compared to the pipeline concordances calculated with the SIRV
controls (Fig 5) We define the first bin with ǀLFCǀ lt 1 as the bin of no apparently differentially
expressed transcripts independent of the corresponding p-values The other bins contain transcripts
for which the calculated concentrations differ by more than 2-fold hence convene apparently
differentially expressed transcripts (DE) We find that SIRV controls and endogenous transcripts are
evaluated coherently While theoretically no differences are expected pipelines P3 and P1 differ in
their quantification of the same data by 44 for the SIRVs and by 69 for endogenous RNAs in the
SIRV concentration range (Fig 5A) Pipelines P2 and P4 differ to a larger extent when evaluating the
same samples (Fig 5B C) The same correlation is seen in comparisons between different samples
(shown here for RC-0 vs RC-1) The expected DE between reference RNAs UHRR and HBRR of
approximately 50 is evaluated differently by P3 vs P1 (DE of 24 ) and this is mirrored in the
evaluation of the SIRV mixes spiked into these reference RNAs (DE of 49 ) P4 vs P2 performed
worse with a pipeline difference of 39 and 103 for endogenous and SIRV transcripts The
controls show a highly similar increase when comparing P3P1 with P4P2 (21-fold from 49 to
103 ) to the endogenous RNAs (16-fold from 24 to 39 ) Here the average measurement
using the same pipeline provide a pseudo-ground truth which is compared to the measurement
using different pipelines It allows to quantify the additional error caused solely by changes in the
pipeline A change from pipeline P3 to P1 would increase the number of DE-detected transcripts to a
smaller extent than a change from P2 to P4 and this is true for both the SIRV controls and the
endogenous transcripts
not peer-reviewed) is the authorfunder All rights reserved No reuse allowed without permission The copyright holder for this preprint (which was httpdxdoiorg101101080747doi bioRxiv preprint first posted online Oct 13 2016
Spike-In RNA variant controls for RNA-Sequencing bioRxiv upload 2016-10-13
17
Figure 5 ǀ SIRV and endogenous mRNA expression analyses are affected similarly when changing
data evaluation pipelines Binned apparent LFC-moduli are shown in histograms when comparing
results obtained by different pipelines evaluating identical NGS data sets from A C) the same
samples or B D) different samples Exemplarily the comparison with the best P3 vs P1 (black
symbols) and the worst agreement P4 vs P2 (red symbols) are shown The charts compare side-by-
side the results from the SIRV controls (green) all endogenous transcripts (black outline) and
endogenous transcripts within the medium-to-high concentration range of 10 to 2250 TPM or FPKM
(blue) The average of all intra-pipeline results are shown in grey The differences Δ between
not peer-reviewed) is the authorfunder All rights reserved No reuse allowed without permission The copyright holder for this preprint (which was httpdxdoiorg101101080747doi bioRxiv preprint first posted online Oct 13 2016
Spike-In RNA variant controls for RNA-Sequencing bioRxiv upload 2016-10-13
18
analyses with the same and with different pipelines show the losses in the bins 0 lt ǀLFCǀ lt 1 and the
corresponding gain in the other bins ǀLFCǀ gt 1 The increase of the FP-rate purely caused by the
pipeline changes vs the TP range is given in the summary graphs E and F) The 1st bins 0 lt ǀLFCǀ lt 1
are divided into two 0 lt ǀLFCǀ lt 05 and 05 lt ǀLFCǀ lt 1 which facilitates the easier tracking of the
results from the SubMixes4 as shown in Fig 4 were in both figures the 1st fraction is signed with 1b
DISCUSSION
We report a significant contribution to the external RNA controls toolbox in the form of Spike-In RNA
Variants (SIRVs) that address transcription variation and alternative splicing The highly defined mixes
of 69 transcripts aligning to 7 genes enable accurate target-performance evaluations of gene
expression analysis methods which is not possible eg by analyzing larger but only loosely defined
pools of in vitro transcripts (Lahens et al 2014) or limited sets addressing special problems like
fusion genes (Tembe et al 2014) The results presented here demonstrate that the condensed
complexity of the SIRV controls mimic very closely main properties of endogenous mRNAs when
analyzing high-throughput RNA sequencing workflows for their capabilities to determine transcript
variants and their relative quantities The responses of the SIRV controls to changes in the workflows
allow to extrapolate measures for the accuracy precision and foremost inter-experiment
comparability (concordance) to the large pool of endogenous RNAs With the help of the external
controls we could confirm that biases in sequence coverage could mostly be balanced by the
exemplary chosen data evaluation algorithms and for the majority of transcripts consistent relative
abundances were obtained However in our most concordant same sample pipeline comparison
P3P1 already 44 of the controls and 69 of the endogenous RNAs in the medium to high
concentration range appeared to be differentially expressed although none of those were true
positives (TP) because the reductio ad absurdum same sample comparison was using the very same
sets of NGS reads In consequence more than 700 potential endogenous mRNA leads would be non-
validatable false positives (FP) only because of a change in data evaluation pipelines With a
not peer-reviewed) is the authorfunder All rights reserved No reuse allowed without permission The copyright holder for this preprint (which was httpdxdoiorg101101080747doi bioRxiv preprint first posted online Oct 13 2016
Spike-In RNA variant controls for RNA-Sequencing bioRxiv upload 2016-10-13
19
difference between P4 and P2 of 12 at the level of endogenous RNAs an extra 1200 FPs would
obscure the evaluation
The inter-sample comparison between UHRR and HBRR presents a rather extreme case
where around half of all transcripts were calculated to differ by more than 2-fold However the
relative FPTP weight of both comparisons remains similar as P4P2 shows again clearly higher FP-
rates in both controls and endogenous RNAs The linear interpolation (Fig 5E) allows to estimate the
effect of the experimental changes to relative small number of differences as they would be seen in
typical RNA-Seq experiments Exemplarily highlighted are the intersections at 002 and 01 in Fig 5F
TP call rates and FPTP ratios are the important figures to estimate the likelihood and inversely
related effort to validate differentially expressed transcripts For the P3P1 comparison at 2 TP we
approximate an FPTP ratio of 289 The likelihood to actually validate DE transcripts under such
circumstances would reach 035 For the P4P2 comparison the TPFP ratio estimates to mere 014
The related risks and often substantial costs for deducing potential biomarkers would be 25 times
higher Although we demonstrated in the presented example the influence of changes in data
evaluation pipeline within an integrated RNA-Seq workflow the same principles apply to the front
end - the RNA treatment NGS library preparation and sequencing Here unintended variations in
particular sample preparations can only be detected by these external spike-in controls which
operate as markers and reference spots By these means SIRV controls increase the comparability
within and between sequencing experiments at the transcript isoform level SIRVs are designed for
the co-development improvement and monitoring of library preparations sequencing and data
processing
Outlook The presented module and the 92 ERCCs which probe the wide dynamic range using
monocistronic transcripts can be stepwise extended in the future by a) ca 15 poly(A)-tail variations
of monocistronic sequences with defined lengths of 20 and 30 adenosines as well as polyadenylated
and purified RNAs with poly(A)-tail lengths close to 50 100 and above 200 nucleotides b) around 12
above-average long RNAs with 3 5 7 and 10 kb c) approx 3 RNAs each with a low medium and
not peer-reviewed) is the authorfunder All rights reserved No reuse allowed without permission The copyright holder for this preprint (which was httpdxdoiorg101101080747doi bioRxiv preprint first posted online Oct 13 2016
Spike-In RNA variant controls for RNA-Sequencing bioRxiv upload 2016-10-13
20
high GC-content d) a set of 13 mRNA relevant chemical modifications most prominent the cap-
structure (Bokar and Rottman 1998) e) variants which cover aspects of SNPs alleles inversions and
fusion genes which needs to be accounted for in the corresponding sequence annotation files and f)
a random set of small and micro RNAs that comprise all sequence variations at their termini to
account for ligation biases The external control modules need to be fine-tuned with respect to the
dynamic concentration and concentration ratio range and the reference annotations must provide a
mixture of correctly over- and under-annotated genes to better emulate the challenging conditions
for bioinformatical data evaluation Both optimizations will also further increase the congruence of
the presented SIRV module with the endogenous RNAs Eventually all modules together would
develop into a comprehensive set of approximately 250 long RNA controls plus a microRNA module
which will become sufficient for calibration and normalization purposes This new estimate reduces
the scope of designing better spike-in controls compared to the maybe thousands of IVTs which have
been previously anticipated (Kratz and Carninci 2014)
METHODS
SIRV DESIGN AND IN SILICO ANALYSIS The gene structures of seven human model genes
(KLK5 LDHD LGALS17A DAPK3 HAUS5 USF2 and TESK2) were used as scaffold for the design of
SIRV1 to SIRV7 The ENCODE-annotated transcripts as well as added variants were edited to
represent in a redundant and comprehensive manner known transcription and alternative splicing
variations (complete gene structures are shown in the odd-numbered suppl Fig from S3 to S15) All
exon sequences descend from a pool of database-derived genomes (gene fragments from viruses
and bacteriophage capsid proteins and glycoproteins selected based on a GC-content in a range of
30-50) which were modified by inverting the sequence to lose identity while maintaining a kind of
naturally occurring order in the sequences Intron sequences that do not align with exons of another
isoform were drawn from random sequences whereby the GC content was balanced to comply with
not peer-reviewed) is the authorfunder All rights reserved No reuse allowed without permission The copyright holder for this preprint (which was httpdxdoiorg101101080747doi bioRxiv preprint first posted online Oct 13 2016
Spike-In RNA variant controls for RNA-Sequencing bioRxiv upload 2016-10-13
21
the adjacent exonic sequences (Random DNA Sequence Generator
httpwwwfacultyucredu~mmadurorandomhtm)
To verify the sequence exclusivity first the exon sequences were blasted against the entire NCBI
database including ERCCs on the nucleotide and protein level (program BLASTN 2229
httpsblastncbinlmnihgov) The default BLAST parameters used were word size 28 expected
threshold 10 Max matches in query rang 20 MatchMismatch Score 1 -2 Gap Costs Linear Filter
Low complexity regions Mask for lookup table only Search of the nucleotide collection resulted for
all SIRVs in ldquono significant similarity foundrdquo Second in silico generated reads (Griebel t al 2012)
(FLUX-Generator httpsammethnetconfluencedisplaySIMHome command line flux-simulator
-p ~hellipFluxsirv1par -t simulator -x -l -s) were mapped to nine individually selected genomes using
TopHat2 (Kim et al 2013) and Bowtie2 (Langmead and Salzberg2012) Because Bowtie2-aligned
reads can be as short as 20 nt the resulting limited number of mapping reads would be deemed to
be not significant in standard NGS work-flows In contrast when mapping reads with the standard
setting of the splicing-aware TopHat2 program not a single read aligned to any of the tested
genomes Given that both searches found no significant matches off-target mapping of the SIRVs can
essentially be ruled out Therefore the artificial SIRV sequences are suitable for noninterfering
qualitative and quantitative assessments in the context of known genomic systems and
complementary to the ERCC sequences (National Institute of Standards and Technology (NIST)
certified DNA plasmids Standard Reference Materialreg 2374) The SIRV sequences can be found at
httpswwwlexogencomsirvssirvsdownloads in the Source Data files and they are also
deposited at the NCBI Nucleotide Database (PRJNA312485)
SIRV CONSTRUCTS AND THE PRODUCTION OF IN-VITRO TRANSCRIPTS Synthetic gene constructs
were produced (Bio Basic Inc Markham ON Canada) that comprised 5rsquo to 3rsquo a unique restriction
site a T7 RNA polymerase promoter whose 3rsquo G is the first nucleotide of the actual SIRV sequence
which is seamlessly followed by a (A30)-tail that is fused with an exclusive 2nd restriction site These
not peer-reviewed) is the authorfunder All rights reserved No reuse allowed without permission The copyright holder for this preprint (which was httpdxdoiorg101101080747doi bioRxiv preprint first posted online Oct 13 2016
Spike-In RNA variant controls for RNA-Sequencing bioRxiv upload 2016-10-13
22
gene cassettes were cloned into a vector colony-amplified and singularized All SIRV sequence in the
purified plasmids were verified by Sanger-sequencing to identify the correct clones The E coli
cultures were grown in batches to obtain plasmids in the lower microg-scale Double digestion of isolated
plasmids with XhoI and NsiI showed correct insert size and complete restriction Linearized silica-
purified plasmids served as templates in in vitro transcription reactions using T7 transcription kits
(AmpliScribe T7 High Yield Transcription Kit and AmpliScribe T7 Flash Transcription Kit Epicentre
Madison WI) The DNase-treated phenol-extracted and silica-purified in vitro transcription products
were assessed for concentration and purity by spectrophotometry (NanoDrop Thermo Fisher
Scientific Waltham MA) and for integrity by capillary electrophoresis (2100 Bioanalyzer RNA 6000
Pico Kit Agilent Technologies Santa Clara CA)
In the context of variant verification RNA integrity is a very important measure Fragments
arising from incomplete transcription might impose errors on the correct determination of variants
which share those sequences and thereby also affect the overall gene coverage The integrity of the
transcription products was very heterogeneous as expected given the broad sequence variation and
the length of the SIRV transcripts (average 11 kb with 14 RNAs between 20 and 25 kb) A majority
of transcripts therefore had to be purified by at least one of two purification methods Purification
method PP1 is selective for poly(A)-tails and neglects prematurely terminated transcription products
Purification method PP2 is based on size-selective quantitative electrophoresis separating the
correctly sized main products from shorter fragments (transcription break off and degraded
products) and longer fragments (run-through transcription products) After purification the 69 SIRV
RNAs were assessed to be on average 736plusmn343 in the pre-peak fraction 9031plusmn372 in the
main-peak fraction (corresponding to RNAs of correct length) and 236plusmn304 in the post-peak
fraction (mass percentages wt) Noteworthy the risks of a beginning degradation during the initial
denaturation (2 min at 70degC) and the not fully denaturing conditions during RNA microcapillary
electrophoresis tiny noise levels in the baseline and slightly different shapes of the main peak result
in a rather over- than underestimation of pre- and post-peak fractions
not peer-reviewed) is the authorfunder All rights reserved No reuse allowed without permission The copyright holder for this preprint (which was httpdxdoiorg101101080747doi bioRxiv preprint first posted online Oct 13 2016
Spike-In RNA variant controls for RNA-Sequencing bioRxiv upload 2016-10-13
23
rRNasin (Promega Madison WI) was added to 08 Umicrol to minimize the risks of RNase
contamination induced RNA degradation The SIRVs were quantified by absorbance spectroscopy to
adjust all stock solutions to a base concentration of close to but above 50 ngmicrol RNA purity was very
high with A 260280 214plusmn012 and A 260230 217plusmn020
SIRV MIXING SIRV mixes were designed that contain pools of SIRVs (SubMixes) in defined
amounts and ratios by combining accurate volumes of the stock solutions in sufficiently large batch
sizes Pipetting errors vary depending on transfer volumes and range from plusmn4 for 2 microl to plusmn08 for
gt100 microl transfers The precision was experimentally determined with blank solutions Starting with
the stock concentration measurement (NanoDrop accuracy plusmn2 ngmicrol for 50 ngmicrol or plusmn4 ) and
accounting for the entire mixing pathway the accumulative concentration error is expected to range
between plusmn8 and plusmn47 Therefore in the data evaluation one has to account for the experimental
fuzziness by allowing for lower accuracy thresholds of plusmn8 on the linear scale or plusmn011 on the log2-
fold scale respectively The SIRV concentration ratios between two mixes are more precise because
only one final pipetting step defines the concentration differences and synchronizes all SIRVs which
belong to the same SubMix Here a maximal error of plusmn4 (or plusmn0057 on the log2-fold scale) can be
expected between SubMixes while all SIRVs of the same SubMix must propagate coherently into the
final mixes Bioanalyzer traces were used to monitor the relative propagation of the SIRVs PreMixes
and SubMixes during the mixing (Fig 2B) In addition the accurate pipetting of the 8 PreMixes was
controlled by checksums of Nanodrop concentration measurements which deviated by only
0002plusmn34 from the calculated target concentrations and by weighing on an analytical balance
which showed a deviation of 18plusmn065 The final concentration of the SIRV mixes are set to be 253
ngmicrol
not peer-reviewed) is the authorfunder All rights reserved No reuse allowed without permission The copyright holder for this preprint (which was httpdxdoiorg101101080747doi bioRxiv preprint first posted online Oct 13 2016
Spike-In RNA variant controls for RNA-Sequencing bioRxiv upload 2016-10-13
24
SPIKING OF REFERENCE RNA WITH SIRV MIXES In general SIRV mixes can be used with crude
cell extracts purified total RNA rRNA-depleted RNA or poly(A)-enriched RNA Important the spike-in
ratios have to be chosen in concordance with the desired final SIRV content the RNA preparation
method and if known the expected mRNA content One widely applicable spike-in ratio can be
obtained by adding 006 ng of controls to approximately 100 ng of total RNA In the presented
examples the total RNA mass of one single aliquot RNA was 100 ng of UHRR in RC-0 and 1128 ng of
HBRR in RC-1 The reference RNA in RC-2 was calculated to be 10427 ng (Fig S2) The high-
concentrated and thereby stable SIRV mix stocks with 253 ngmicrol and ERCC mix stocks with 30 ngmicrol
(ERCC Spike-In Mixes 1 and 2 by Ambion Thermo Fisher Waltham MA) were diluted just prior to the
spiking to facilitate the mixing of manageable volumes For example the final 11000 dilution
reduced the SIRV mix concentration to 253 pgmicrol from which 237 microl were required to spike a 100 ng
total RNA sample with 006 ng SIRVs The RC-samples were produced in large batches to yield
hundreds of samples allowing for a protocol with fewer dilutions and larger volumes reducing
thereby sources of experimental errors
NGS LIBRARY PREPARATION AND SEQUENCING The experiments were carried out in technical
triplicates From 1 microg RC-0 RC-1 or RC-2 RNA in total nine NGS libraries were prepared by Fasteris SA
(Plan-les-Ouates CH) using the TruSeq stranded mRNA library preparation kit with polyA selection
(Illumina Inc San Diego CA) All primary library templates were amplified with 14 PCR cycles to
reach reproducible concentrations 155plusmn45 nM and insert sizes 165plusmn10 bp An equimolar lane-mix
was sequenced at the CSF Campus Science Support Facilities GmbH (CSF Vienna AUT) in PE125
mode in one lane of a HiSeq 2500 flowcell in 125 bp paired-end mode using V4 chemistry The run
yielded 305 M raw reads 293 M after demultiplexing and trimming which corresponds to a read
depth of 326plusmn22 M reads per library
not peer-reviewed) is the authorfunder All rights reserved No reuse allowed without permission The copyright holder for this preprint (which was httpdxdoiorg101101080747doi bioRxiv preprint first posted online Oct 13 2016
Spike-In RNA variant controls for RNA-Sequencing bioRxiv upload 2016-10-13
25
READ PROCESSING AND MAPPING Standard data processing routines (bbduk part of BBMap by
B Bushnell to be found at sourceforgenetprojectsbbmap) were applied removing low quality
reads and trimming adapter sequences Due to variable stringencies the mappers produced different
read statistics STAR mapped against the genome 897plusmn59 of the reads (864plusmn56 uniquely) and
TopHat2 852plusmn57 (794plusmn52 uniquely) Bowtie2 mapped against the transcriptome 693plusmn18
reads (151plusmn15 uniquely)
ESTIMATION OF THE MRNA CONTENTS Based on the obtained read distributions the relative
mass partition between external controls and endogenous RNA fraction can be estimated Because
the library preparation uses a poly(A)-enrichment step the targeted endogenous RNA corresponds
almost exclusively to the mRNA content of the samples The propagation of the input mass ratio to
the output read ratio depends on both the mRNA content and the efficiencies of how controls and
mRNA proceed through the library preparation The relationship is described by Eqn 1
reRNA times prod(1 rconifrasl )
j
i=1
= (EeRNA times meRNA) times prod(1 (Econi times mconi)frasl )
j
i=1
Equation 1
with r number of reads from eRNA the endogenous RNA fraction here mRNA and con the
controls here SIRVs and ERCC E the relative efficiency of how the fraction proceeds through the
workflow and m the input mass
Ratios are measured as relative read counts and the results as a product of efficiencies and
apparent amounts are also relative measures Therefore at least one de facto arbitrary reference
point needs to be defined to deduce comparable absolute results Several reference points or
default values can be defined which lead to different dependent variables and imply slightly variable
interpretation of the results The following three calculation examples are simple deductions from
not peer-reviewed) is the authorfunder All rights reserved No reuse allowed without permission The copyright holder for this preprint (which was httpdxdoiorg101101080747doi bioRxiv preprint first posted online Oct 13 2016
Spike-In RNA variant controls for RNA-Sequencing bioRxiv upload 2016-10-13
26
the ratio shown in Eqn 1 with the ERCC (con1) and the SIRVs (con2) respectively Variation 1 is
explained in greater detail while in the other variants only the differing aspects are highlighted
Variation 1 i) Here the first assumption is that the mRNA content in UHRR (Agilent Santa
Clara CA) is 3 (factor 003) and 2 (factor 002) in HBRR (Ambion Thermo Fisher Waltham MA)
which stays in close agreement to previous estimates concluded from experiments by Shippy et al in
2006 The amounts of total RNA were measured by Nanodrop absorbance spectroscopy The UHRR
samples contained 100 ng and the HBRR samples 1128 ng The mixing ratio of (2times RC-0) (1times RC-1)
determines the concentration of the 3rd sample RC-2 and further the amount of total RNA (10427
ng) as well as its related mRNA content (2times100 ng times 3 + 1times1128 ng times 2 ) (2times100 ng + 1times1128
ng) = 264 (factor 0026) The mRNA masses of the samples are calculated by the measured total
RNA input amounts and default mRNA contents are 3 ng 2256 ng and 2752 ng The second
assumption is that the endogenous mRNAs proceed with the maximal efficiency of 100 (factor 1)
through library preparation and sequencing The input of the spike-in controls is the product of the
concentration values which were either measured as in the case of the SIRV stocks or stated by the
vendor as in the case of the ERCC stocks and the pipetted volumes Both are treated as de facto
measured values
ii) The relative amounts of reads which have been assigned to either endogenous mRNA
ERCCs or SIRVs are obtained from the mapping statistics (read classification)
iii) The ratio of mass input to reads output allows to calculate the propagation efficiency of
the controls relative to the default efficiency of the endogenous mRNA In the present experiment
the SIRVs progress with a relative efficiency of 867plusmn57 and the ERCCs with 416plusmn47 The
significant difference between the relative efficiency of both controls is very likely caused by the
different lengths of the poly(A)-tails which might influence a different binding efficiency during
poly(A)-enrichment step The SIRVs with a 30 nt long poly(A)-tail perform much more in concordance
with the endogenous mRNA as the ERCCs which contain shorter and variable poly(A)-tails ( 23 nt)
The observed small differences in the experiments using RC-0 RC-1 or RC-2 could be caused by a
not peer-reviewed) is the authorfunder All rights reserved No reuse allowed without permission The copyright holder for this preprint (which was httpdxdoiorg101101080747doi bioRxiv preprint first posted online Oct 13 2016
Spike-In RNA variant controls for RNA-Sequencing bioRxiv upload 2016-10-13
27
two-way interference of samples and controls However the deviations are small and can rather be a
result of minor inaccuracies in determining the relative input amounts Both hypotheses would need
to be verified by a series of repeats with the aim to resolve potential influences of pipetting during
the sample preparation variations in the library preparation and other contributions
Variation 2 Here no varying interferences between samples and controls are permitted
which means that relative efficiencies of the controls are considered to be constant The causes of
the experimental variations are exclusively assigned to the input amounts (alike hypothesis two in
the above example in discussing the deviation of the results in RC-2) This would translate into input
standard deviations of 118 (SIRVs) and 76 (ERCCs) The variations meld all accumulating errors
made in determining the concentration of the control stock solutions preparing the subsequent
dilutions pipetting the samples and controls during the spike-in step itself as well as determining the
amount of sample RNA in the first place Against the background of potential errors the calculated
results can be considered as highly consistent
Variation 3 In addition to the assumptions made for the measurement of sample RC-0
the spike-in of 006 ng SIRVs to all samples is also set as default Alike variation 2 the experiments in
RC-1 and RC-2 adopt the same default setting for the relative efficiencies calculated in RC-0
According to the ratio of Eqn 1 one can obtain mRNA contents as well as ERCC input amounts in this
case for samples RC-1 and RC-2 The mRNA content of the HBRR sample (RC-1) relative to the default
mRNA content in the UHRR sample (set to 3 ) would be 172 lower than the previously assumed
2 According to the present mixing scheme it would also imply that sample RC-2 has an mRNA
content of 254 up from the calculated 234 The offsets of -79 is again small and very likely
refers to the level of accuracy in the experimental results as discussed above Using this method the
spiking of samples with controls such as the SIRVs allows to closely estimate the relative mRNA
content of any unknown sample and to draw conclusions eg on the transcriptional state of tissues
cell suspension or individual cells
not peer-reviewed) is the authorfunder All rights reserved No reuse allowed without permission The copyright holder for this preprint (which was httpdxdoiorg101101080747doi bioRxiv preprint first posted online Oct 13 2016
Spike-In RNA variant controls for RNA-Sequencing bioRxiv upload 2016-10-13
28
COEFFICIENT OF DEVIATION We implemented a strand specific Coefficient of Deviation
(CoD) which aims to reflect the quality of NGS pipelines targeted at specific effects in particular
lsquospikenessrsquo of the coverage while systematic effects like drop of the coverage at Transcription Start
Sites (TSS) and Transcription End Sites (TES) are being suppressed The CoD is implemented by Eqn
2
CoD = CoD(LTSSLTES) = sum (cidealp- crealp)2
TESe
p=TSS1
divide sum cidealp
TESe
p=TSS1
Equation 2
which is calculated in strand orientation for contigs along all exonic nucleotide position (p) from the
first annotated TSS (TSS1) up to the last annotated TES (TESe) whereby cideal are the ideal coverages
with the optimized transient regions (LrsquoTSS LrsquoTES) and creal are the real coverages scaled as such that
the total integrals along all positions of ideal and real coverages are equal
The transient function at TSS and TES is the error function erf(x) which corresponds to
Cufflinks assumption about normally distributed fragment lengths (Trapnell et al 2012) Since erf(x)
is a non-algebraic function we used the algebraic approximation by Abramowitz and Stegun
(httpsenwikipediaorgwikiError_function eq 7125) Once the optima (LrsquoTSS LrsquoTES ) are found
we declare CoD(LrsquoTSS LrsquoTES) to be the ultimate CoD value which mostly eliminated the transient region
effects We implemented an optimization algorithm (Nelder-Mead downhill simplex method) and
used as starting values (L0TSS L0
TES ) lengths of 150 In some cases the optimum found can be beyond
a reasonable range of values Therefore we censor the output Lopt of the mathematical optimization
as follows Lcensored = 50 if Lrsquo lt 50 Lcensored = 350 if Lrsquo gt 350 This corresponds to the maximal range of
not peer-reviewed) is the authorfunder All rights reserved No reuse allowed without permission The copyright holder for this preprint (which was httpdxdoiorg101101080747doi bioRxiv preprint first posted online Oct 13 2016
Spike-In RNA variant controls for RNA-Sequencing bioRxiv upload 2016-10-13
29
200plusmn150 This censoring needed to be applied in 8 cases out of 84 SIRVmixstrandend
combinations ie less than in 10
TRANSCRIPT CONCENTRATION MEASUREMENTS In order to estimate expression values on
transcript levels we applied RSEM (Li and Dewey 2011) which uses a Bayesian Network to compute
the likelihood of each fragment belonging to a given transcript Salmon (Patro et al 2015) estimates
the transcript expression values by a k-mer based mapping Similar to RSEM it uses an expectation-
maximization (EM) algorithm to compute the maximum likelihood of relative abundances Cufflinks2
(Trapnell et al 2013) estimates the transcript abundances with a coverage-based maximum
likelihood approach It determines the probability of read assignments to isoforms
DIFFERENTIAL EXPRESSION ANALYSIS We used the DESeq2 package (Love et al 2014) for
calculation of fold-differences between the results from different pipelines and different input samples
mixtures As explained in the main text all outputs from the evaluated pipelines (in form of relative
concentration measures) have been scaled Scaling by linear transformation is needed as a
consequence of the different mRNA contents in the samples but also to eventually compensate any
potential pipetting errors when small aliquots typically in the range of very few microliter are added
to individual samples The RC-samples in this experiment were produced in a large batch to ensure
high accuracy in volumetric ratios The main sample pool is practically invariant to the small relative
contribution of the controls but was technically treated in the same way by scaling the main sample
pools to identical sizes First SIRV concentrations were scaled to reach together 69 in E0 685 in E1
and 708 in E2 which is the dimensionless value identical to the fmolmicrol in the respective SIRV stock
solutions Then the lower threshold was set to 10-6 which corresponds to original FPKM values of
around 5∙10-3 ⅟7th of one read for a 1 kb long transcript at a read depth of 30 Mio reads or 1 gene
specific read to be divided between 7 equally possible transcript variants at said 1 kb length section
The threshold is to be understood as less than or equal to 10-6 which defines an averaged read
not peer-reviewed) is the authorfunder All rights reserved No reuse allowed without permission The copyright holder for this preprint (which was httpdxdoiorg101101080747doi bioRxiv preprint first posted online Oct 13 2016
Spike-In RNA variant controls for RNA-Sequencing bioRxiv upload 2016-10-13
30
resolution of the particular workflow at the given read depth By these means all ratios remain defined
Second for the DESeq2 calculations we multiplied all values with 106 after which fractions were
rounded to the closest integer We understand that for no-change hypothesis testing which is the
main purpose of the DESeq2 package transforming the relative concentrations (FPKM or TPM) to
lsquoquasi-read-countsrsquo is not recommended since DESeq2 internally corrects for library size by using size
factors However in our application we do not use the probability of the hypothesis rejection (P
values) but the raw fold changes detected (irrespectively of the dispersion values for that given
transcript) We also took into account the potential danger of censoring the input (by unintentionally
eliminating transcripts represented by extremely low FPKM or TPM values) by setting a suitable
threshold as described above The figures show only two differential expression analyses because the
3rd concentration ratio E2E0 is the product of E1E0 and E2E1
ERROR RATE ANALYSIS The four red data points two from the SIRV controls (circles) and two
from the endogenous mRNAs (squares) from the best agreement (P3 vs P1) and the four
corresponding black data points from the worst agreement (P4 vs P2) as shown in fig 5E were fitted
by linear approximation using the relationship as derived for Eqn 3
TP + FP = 1
FP = N times ER = (1-TP) times ER
(TP+FP) = TP + ER - TP times ER
(TP+FP) = (1-ER) times TP + ER Equation 3
where TP is the relative portion of true positives (differentially expressed as in our definition
possessing a LFC gt 1) N the relative portion of negatives ER the error rate at which negatives are
falsely detected as positives to result in false positives FP The least squares fitting method was
applied to derive values for the slope (1-ER) and the intercept ER
not peer-reviewed) is the authorfunder All rights reserved No reuse allowed without permission The copyright holder for this preprint (which was httpdxdoiorg101101080747doi bioRxiv preprint first posted online Oct 13 2016
Spike-In RNA variant controls for RNA-Sequencing bioRxiv upload 2016-10-13
31
The transformation of Eqn 3 leads to the relationship of Eqn 4
TP FPfrasl = (TP+FP) TPfrasl -1 Equation 4
which has been used for the graph in fig 5F In the present context the concept of ROC-curves is not
applicable because the true or false negatives are indistinguishable as long the ground truth of the
endogenous RNA are unknown
DATA ACCESS Sequencces and source data files data are in the process to be deposited at
NCBI under BioProject ID PRJNA312485
ACKNOWLEDGMENTS We thank SA Munro and M Salit (Material Measurement
Laboratory National Institute of Standards and Technology) for their efforts in further developing the
concepts of the External RNA Control Consortium (ERCC) in an updated suite of RNA controls and
analysis methods called ERCC 20 We thank A Tuerk for his contributions in finding suitable human
model genes G Wiktorin for carrying out the RSEM calculations M Mihaylova in helping with the
graphics design and I Gabler for critically reading the manuscript
AUTHOR CONTRIBUTIONS LP PK and TR designed the sequences and mixtures PK and GH
prepared the in vitro transcripts and spike-in mixtures TR AS and LP designed the research and
the experiments MA IH and TR evaluated the data TR and LP wrote the manuscript
DISCLOSURE DECLARATION The authors are employees of Lexogen GmbH from which the SIRVs
can be bought and AS has equity stakes in Lexogen GmbH LP PK and TR are named as
not peer-reviewed) is the authorfunder All rights reserved No reuse allowed without permission The copyright holder for this preprint (which was httpdxdoiorg101101080747doi bioRxiv preprint first posted online Oct 13 2016
Spike-In RNA variant controls for RNA-Sequencing bioRxiv upload 2016-10-13
32
inventors on a patent application regarding the production and use of RNA transcript variants and
Lexogen GmbH is the owner of this patent application
REFERENCES
Baker SC Bauer SR Beyer RP Brenton JD Bromley B Burrill J Causton H Conley MP Elespuru R Fero M et al 2005 The External RNA Controls Consortium a progress report Nat Methods 2(10) 731-4 Bokar JA Rottman FM 1998 Biosynthesis and Functions of Modified Nucleosides in Eukaryotic mRNA In Modification and Editing of RNA (eds Grosjean H Benne R) pp 183-200 ASM Press Washington DC Dobin A Davis CA Schlesinger F Drenkow J Zaleski C Jha S Batut P Chaisson M Gingeras TR 2013 STAR ultrafast universal RNA-seq aligner Bioinformatics 29(1) 15-21 Fed Reg Doc 2015-19742 2015 External RNA Controls Consortium - Call for Participation and Contributions to a Sequence Library Federal Register Citation 80 FR 48296 Griebel T Zacher B Ribeca P Raineri E Lacroix V Guigoacute R Sammeth M 2012 Modelling and simulating generic RNA-Seq experiments with the flux simulator Nucleic Acids Res 40(20) 10073-83 Jiang L Schlesinger F Davis CA Zhang Y Li R Salit M Gingeras TR Oliver B 2011 Synthetic spike-in standards for RNA-seq experiments Genome Res 21(9) 1543-51 Kim D Pertea G Trapnell C Pimentel H Kelley R Salzberg SL 2013 TopHat2 accurate alignment of transcriptomes in the presence of insertions deletions and gene fusions Genome Biol 14(4) R36 Kratz A Carninci P 2014 The devil in the details of RNA-seq Nat Biotechnol 32(9) 882-4 Lahens NF Kavakli IH Zhang R Hayer K Black MB Dueck H Pizarro A Kim J Irizarry R Thomas RS et al 2014 IVT-seq reveals extreme bias in RNA sequencing Genome Biol 15(6) R86 Langmead B Salzberg SL 2012 Fast gapped-read alignment with Bowtie 2 Nat Methods 9(4) 357-9 Li B Dewey CN 2011 RSEM accurate transcript quantification from RNA-Seq data with or without a reference genome BMC Bioinformatics 12 323 Li J Jiang H Wong WH 2010 Modeling non-uniformity in short-read rates in RNA-Seq data Genome Biol 11 R50 Li S Tighe SW Nicolet CM Grove D Levy S Farmerie W Viale A Wright C Schweitzer PA Gao Y et al 2014 Multi-platform assessment of transcriptome profiling using RNA-seq in the ABRF next-generation sequencing study Nat Biotechnology 32 915-25 Love MI Huber W Anders S 2014 Moderated estimation of fold change and dispersion for RNA-seq data with DESeq2 Genome Biol 15(12) 550
not peer-reviewed) is the authorfunder All rights reserved No reuse allowed without permission The copyright holder for this preprint (which was httpdxdoiorg101101080747doi bioRxiv preprint first posted online Oct 13 2016
Spike-In RNA variant controls for RNA-Sequencing bioRxiv upload 2016-10-13
33
Mortazavi A Williams BA McCue K Schaeffer L Wold B 2008 Mapping and quantifying mammalian transcriptomes by RNA-Seq Nat Methods 5(7) 621-8 Patro R Duggal G Kingsford C 2015 Accurate fast and model-aware transcript expression quantification with Salmon bioRxiv preprint doi httpdxdoiorg101101021592 Shippy R Fulmer-Smentek S Jensen RV Jones WD Wolber PK Johnson CD Pine PS Boysen C Guo X Chudin E et al 2006 Using RNA sample titrations to assess microarray platform performance and normalization techniques Nat Biotechnol 24(9) 1123-31 SEQCMAQC-III Consortium 2014 A comprehensive assessment of RNA-seq accuracy reproducibility and information content by the Sequencing Quality Control Consortium Nat Biotechnology 32 903-14 Tembe WD Pond SJ Legendre C Chuang HY Liang WS Kim NE Montel V Wong S McDaniel TK Craig DW Carpten JD 2014 Open-access synthetic spike-in mRNA-seq data for cancer gene fusions BMC Genomics 15 824 Trapnell C Roberts A Goff L Pertea G Kim D Kelley DR Pimentel H Salzberg SL Rinn JL Pachter L 2012 Differential gene and transcript expression analysis of RNA-seq experiments with TopHat and Cufflinks Nat Protoc 7(3) 562-78 Trapnell C Hendrickson DG Sauvageau M Goff L Rinn JL Pachter L 2013 Differential analysis of gene regulation at transcript resolution with RNA-seq Nat Biotechnol 31(1) 46-53 van Dijk EL Jaszczyszyn Y Thermes C 2014 Library preparation methods for next-generation sequencing tone down the bias Exp Cell Res 322(1) 12-20 Wang Z Gerstein M Snyder M 2009 RNA-Seq a revolutionary tool for transcriptomics Nat Rev Genet 1 57-63 Zheng W Chung LM Zhao H 2011 Bias detection and correction in RNA-Sequencing data BMC Bioinformatics 12290
not peer-reviewed) is the authorfunder All rights reserved No reuse allowed without permission The copyright holder for this preprint (which was httpdxdoiorg101101080747doi bioRxiv preprint first posted online Oct 13 2016
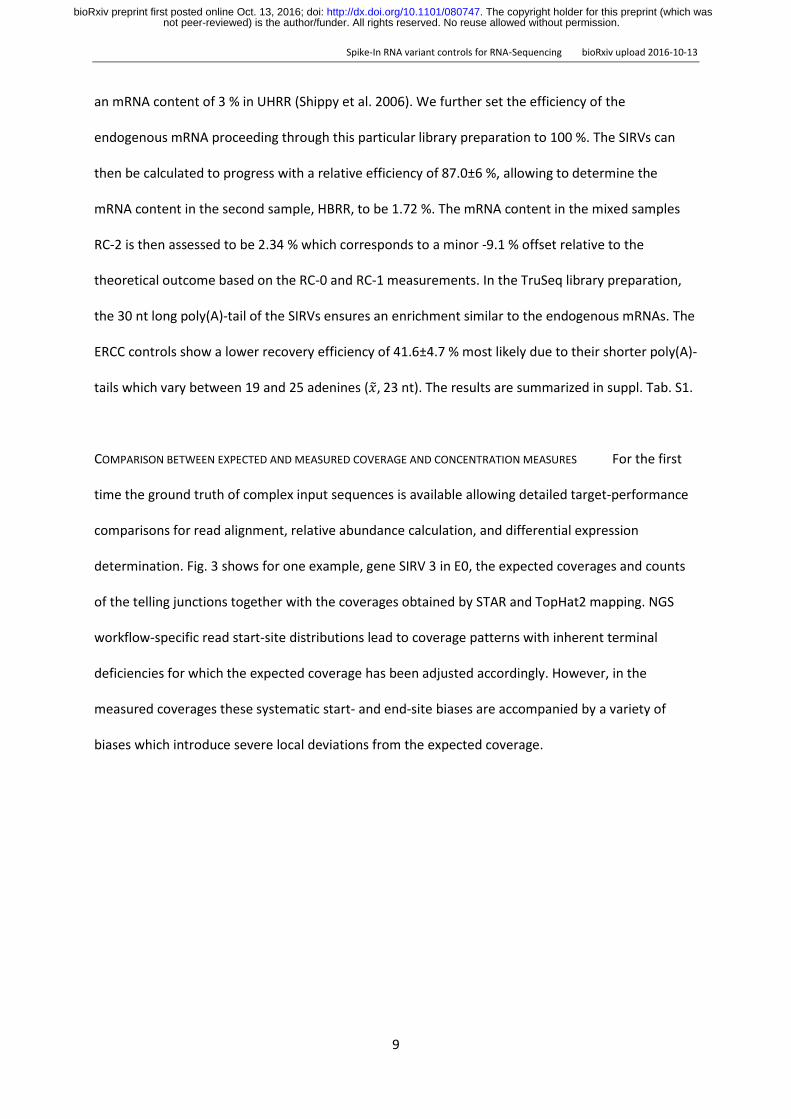
Spike-In RNA variant controls for RNA-Sequencing bioRxiv upload 2016-10-13
9
an mRNA content of 3 in UHRR (Shippy et al 2006) We further set the efficiency of the
endogenous mRNA proceeding through this particular library preparation to 100 The SIRVs can
then be calculated to progress with a relative efficiency of 870plusmn6 allowing to determine the
mRNA content in the second sample HBRR to be 172 The mRNA content in the mixed samples
RC-2 is then assessed to be 234 which corresponds to a minor -91 offset relative to the
theoretical outcome based on the RC-0 and RC-1 measurements In the TruSeq library preparation
the 30 nt long poly(A)-tail of the SIRVs ensures an enrichment similar to the endogenous mRNAs The
ERCC controls show a lower recovery efficiency of 416plusmn47 most likely due to their shorter poly(A)-
tails which vary between 19 and 25 adenines ( 23 nt) The results are summarized in suppl Tab S1
COMPARISON BETWEEN EXPECTED AND MEASURED COVERAGE AND CONCENTRATION MEASURES For the first
time the ground truth of complex input sequences is available allowing detailed target-performance
comparisons for read alignment relative abundance calculation and differential expression
determination Fig 3 shows for one example gene SIRV 3 in E0 the expected coverages and counts
of the telling junctions together with the coverages obtained by STAR and TopHat2 mapping NGS
workflow-specific read start-site distributions lead to coverage patterns with inherent terminal
deficiencies for which the expected coverage has been adjusted accordingly However in the
measured coverages these systematic start- and end-site biases are accompanied by a variety of
biases which introduce severe local deviations from the expected coverage
not peer-reviewed) is the authorfunder All rights reserved No reuse allowed without permission The copyright holder for this preprint (which was httpdxdoiorg101101080747doi bioRxiv preprint first posted online Oct 13 2016
Spike-In RNA variant controls for RNA-Sequencing bioRxiv upload 2016-10-13
10
Figure 3 ǀ Comparison of the expected and the measured coverages for the SIRV3 locus in mix E0
A) Individual transcripts of SIRV3 with transcripts on the plus strand in blue and in red for the ones on
the minus strand Color code indicates the SubMix allocation B) The expected SIRV3 coverage is
shown as superposition of individual transcript coverages in which the terminal sites have been
modelled by a transient error function The measured coverages after read mapping by TopHat2 are
shown in grey The measured coverages and number of splice junction reads were normalized to
obtained identical areas under the curves and identical sums of all junctions for the expected and
measured data The measured splice junction reads are shown by the numbers before the brackets
not peer-reviewed) is the authorfunder All rights reserved No reuse allowed without permission The copyright holder for this preprint (which was httpdxdoiorg101101080747doi bioRxiv preprint first posted online Oct 13 2016
Spike-In RNA variant controls for RNA-Sequencing bioRxiv upload 2016-10-13
11
while the expected values are shown inside the brackets The CoD values are given for the plus and
minus strand in the respective colors C) Differences between mapping by STAR aligner and TopHat2
The black arrows indicate the direction of positive differences Percentages refer to the relative
changes of the measured splice junction reads
To obtain a comparative measure gene-specific coefficients of deviation CoD were calculated CoDs
describe the often hidden biases in the sequence data predominantly caused by an inhomogeneous
library preparation but also by the subsequent sequencing and mapping In the presented example
the stranded TruSeq library preparation with the Illumina HiSeq2500 sequencing and mapping by
TopHat2 results in a mean CoD of 0190plusmn0193 across all SIRVs For the sense oriented SIRVs the
mean CoD is 0275plusmn0223 and for the antisense SIRVs which cover a region of fewer overlapping
transcript annotations the mean CoD is 0090plusmn0076 The coverage target-performance comparison
highlights the inherent difficulties in deconvoluting read distributions to correctly identify transcript
variants and determine concentrations The distribution of telling reads splice junctions and reads
towards the termini are references for the assignment of the remaining reads before calculating
relative transcript variant abundances Not surprisingly although the majority of junction counts
correlates well with the expected values the high CoD values indicate that numerous telling reads
deviate significantly within the context of the individual mixes They also differ between mixes which
affects differential expression measurements (see Fig 3B and for the coverage of all seven SIRV
genes the even suppl Fig from S4 to S16)
The CoD does not allow to distinguish between periodicity and randomness in the biases nor
does it forecast how well a data evaluation strategy can cope with the bias contributions
Nevertheless smaller CoD values are expected to correlate with a simpler and less error-prone data
evaluation The CoD values can be taken as a first indicative measure to characterize the mapped
data and to compare data sets for similarity up to this point in the workflow Target-performance
comparisons of all SIRV genes in all three mixes can be found in the supplemental information
not peer-reviewed) is the authorfunder All rights reserved No reuse allowed without permission The copyright holder for this preprint (which was httpdxdoiorg101101080747doi bioRxiv preprint first posted online Oct 13 2016
Spike-In RNA variant controls for RNA-Sequencing bioRxiv upload 2016-10-13
12
The above described four data analysis pipelines P1 to P4 were used to calculate transcript
abundances for 69 SIRV and 196˙165 annotated endogenous transcripts All obtained results are
relative concentration measures yielding either Fragments Per Kilobase of exon per Million
fragments mapped (FPKM) (Mortazavi 2008) or Transcripts Per Million (TPM) (Li and Dewey 2011)
The concentrations were scaled by linear transformation in such way that all SIRVs together reach 69
in E0 685 in E1 and 708 in E2 which is the dimensionless value identical to the fmolmicrol in the
respective SIRV stock solutions In consequence the relative quantities of the SIRVs are compatible
to the normalized scale which was introduced in Fig 2C Boxplots in Fig 4 show exemplarily the SIRV
concentrations and two discrete differentials as measured by P3 (results from P1 P2 and P4 are
shown in suppl Fig S17 and standard correlation plots of the four pipelines are shown in suppl Fig
S18) The majority of all SubMix mean concentration values are in concordance with the expected
values The concentration ratios simulating differential expression measurements are less prone to
systematic offsets and show by trend narrower distributions However these correlations highlight
already the issue of obvious and frequent outliers ie transcript variants that are not well resolved
not peer-reviewed) is the authorfunder All rights reserved No reuse allowed without permission The copyright holder for this preprint (which was httpdxdoiorg101101080747doi bioRxiv preprint first posted online Oct 13 2016
Spike-In RNA variant controls for RNA-Sequencing bioRxiv upload 2016-10-13
13
Figure 4 ǀ Box plot overview of calculated concentration values for SIRV mixes and mix ratios
Reads from SIRV mixes E0 E1 and E2 were processed by four different data evaluation algorithms for
transcript quantification Results derived by pipeline P3 are exemplarily shown in reference to the
known inputs (bars in colors corresponding to the SIRV SubMixes of Fig 2) The black circles mark the
mean and the bold dashes the medians of the data points which are shown in grey the boxes span
the 25 to 75 region of the data points and the black whiskers with connecting lines reach up to the
min and max values and indicate also outliers outside the scale of the graph The comparison E1 vs
E0 from sample RC-1 and RC-0 (2nd row) was used for building the histogram of Fig 5B The shaded
area resembles the 1st bin (0leǀLFCǀle1) while the inner section (b1) comprises the fraction 0leǀLFCǀlt05
where the majority of data points originates from SubMix4 (ratio 11) and some ldquooutliersrdquo from
SubMix2 which were actually spiked in at the ratio 21
Heat maps allow to inspect each SIRV in the context of competing transcripts Tab 1B shows
the abundancies as log2-fold changes LFC relative to the expected values for the example of SIRV 6
LFC values consider relative increases and decreases across all concentration ranges likewise An LFC
window of plusmn011 presents the confidence interval as a result from the currently achievable accuracy
not peer-reviewed) is the authorfunder All rights reserved No reuse allowed without permission The copyright holder for this preprint (which was httpdxdoiorg101101080747doi bioRxiv preprint first posted online Oct 13 2016
Spike-In RNA variant controls for RNA-Sequencing bioRxiv upload 2016-10-13
14
in producing the SIRV mixtures We examine the LFC values uncoupled from the adjusted p-values
which provide a statistical measure of the significance level for apparent differential expression By
these means we prevent pipelines to appear more coherent only due to higher noise levels The
accuracy has been calculated for each SIRV as the mean of the LFCs in all three mixes The precision is
a measure of how consistent SIRVs are quantified and has been calculated as the LFC standard
deviation for each SIRV and further for entire pipelines by using all SIRVs Within the presented
example SIRVs can obtain in all four pipelines high precisions of up to 018plusmn007 and high accuracies
of up to -001plusmn010 (SIRV604) In contrast SIRV612 of similar length has an average precision of
569plusmn368 and an accuracy of -386plusmn270 although it was detected by P2 with a high precision of 012
at an accuracy of 018 This quantification of differences between pipelines now directly permits to
assess the effect of changes in workflows and individual experiments
COMPARISON BETWEEN DIFFERENT WORKFLOWS When ranking the four pipelines by said precision P3
gives the lowest value with 129 followed by P4 with 164 P1 with 198 and P2 with 214 However
a sample-specific global target-performance comparison is not the strongest criteria for evaluating
performance differences at transcript resolution For this purpose the apparent differential
expression shows if similar errors are caused by the same or different transcripts The highest
concordance was found between P3 and P1 (labelled P3P1) calculated as standard deviation of all
SIRV LFCs with 101 followed by P4P3 (104) P4P1 (255) P2P1 (288) and P3P2 (309) The
lowest concordance has P4P2 with a value of 412 One section of the resulting heat map for both
extremes is shown in Tab 1C
not peer-reviewed) is the authorfunder All rights reserved No reuse allowed without permission The copyright holder for this preprint (which was httpdxdoiorg101101080747doi bioRxiv preprint first posted online Oct 13 2016
Spike-In RNA variant controls for RNA-Sequencing bioRxiv upload 2016-10-13
15
Table 1 ǀ Variance heat map of SIRV concentration measures detailing SIRV6 by the 4 different
pipelines P1 to P4 A) Given are SIRV transcript identifier SubMix (SM) color code and transcript
lengths (in nucleotides) B) Heat maps showing the log-fold changes (LFC) for the comparison of the
normalized expected and measured SIRV concentrations as a result from the four data evaluation
pipelines P1 to P4 evaluating E0 E1 and E2 Fields with -1 le LFC le 1 are filled with gradient green all
fields with LFC lt -1 with straight blue and all fields with LFC gt 1 with straight red C) From all 6
possible pairwise comparisons P2P1 P3P1 to P4P3 of the normalized measured SIRV
concentrations the one with the smallest (P3P1) and largest (P4P2) median of all LFC are shown
The complete heat map is shown in the suppl Tab S2
not peer-reviewed) is the authorfunder All rights reserved No reuse allowed without permission The copyright holder for this preprint (which was httpdxdoiorg101101080747doi bioRxiv preprint first posted online Oct 13 2016
Spike-In RNA variant controls for RNA-Sequencing bioRxiv upload 2016-10-13
16
The same pipeline comparisons were made with either all endogenous transcripts or the ones in the
higher SIRV expression range and compared to the pipeline concordances calculated with the SIRV
controls (Fig 5) We define the first bin with ǀLFCǀ lt 1 as the bin of no apparently differentially
expressed transcripts independent of the corresponding p-values The other bins contain transcripts
for which the calculated concentrations differ by more than 2-fold hence convene apparently
differentially expressed transcripts (DE) We find that SIRV controls and endogenous transcripts are
evaluated coherently While theoretically no differences are expected pipelines P3 and P1 differ in
their quantification of the same data by 44 for the SIRVs and by 69 for endogenous RNAs in the
SIRV concentration range (Fig 5A) Pipelines P2 and P4 differ to a larger extent when evaluating the
same samples (Fig 5B C) The same correlation is seen in comparisons between different samples
(shown here for RC-0 vs RC-1) The expected DE between reference RNAs UHRR and HBRR of
approximately 50 is evaluated differently by P3 vs P1 (DE of 24 ) and this is mirrored in the
evaluation of the SIRV mixes spiked into these reference RNAs (DE of 49 ) P4 vs P2 performed
worse with a pipeline difference of 39 and 103 for endogenous and SIRV transcripts The
controls show a highly similar increase when comparing P3P1 with P4P2 (21-fold from 49 to
103 ) to the endogenous RNAs (16-fold from 24 to 39 ) Here the average measurement
using the same pipeline provide a pseudo-ground truth which is compared to the measurement
using different pipelines It allows to quantify the additional error caused solely by changes in the
pipeline A change from pipeline P3 to P1 would increase the number of DE-detected transcripts to a
smaller extent than a change from P2 to P4 and this is true for both the SIRV controls and the
endogenous transcripts
not peer-reviewed) is the authorfunder All rights reserved No reuse allowed without permission The copyright holder for this preprint (which was httpdxdoiorg101101080747doi bioRxiv preprint first posted online Oct 13 2016
Spike-In RNA variant controls for RNA-Sequencing bioRxiv upload 2016-10-13
17
Figure 5 ǀ SIRV and endogenous mRNA expression analyses are affected similarly when changing
data evaluation pipelines Binned apparent LFC-moduli are shown in histograms when comparing
results obtained by different pipelines evaluating identical NGS data sets from A C) the same
samples or B D) different samples Exemplarily the comparison with the best P3 vs P1 (black
symbols) and the worst agreement P4 vs P2 (red symbols) are shown The charts compare side-by-
side the results from the SIRV controls (green) all endogenous transcripts (black outline) and
endogenous transcripts within the medium-to-high concentration range of 10 to 2250 TPM or FPKM
(blue) The average of all intra-pipeline results are shown in grey The differences Δ between
not peer-reviewed) is the authorfunder All rights reserved No reuse allowed without permission The copyright holder for this preprint (which was httpdxdoiorg101101080747doi bioRxiv preprint first posted online Oct 13 2016
Spike-In RNA variant controls for RNA-Sequencing bioRxiv upload 2016-10-13
18
analyses with the same and with different pipelines show the losses in the bins 0 lt ǀLFCǀ lt 1 and the
corresponding gain in the other bins ǀLFCǀ gt 1 The increase of the FP-rate purely caused by the
pipeline changes vs the TP range is given in the summary graphs E and F) The 1st bins 0 lt ǀLFCǀ lt 1
are divided into two 0 lt ǀLFCǀ lt 05 and 05 lt ǀLFCǀ lt 1 which facilitates the easier tracking of the
results from the SubMixes4 as shown in Fig 4 were in both figures the 1st fraction is signed with 1b
DISCUSSION
We report a significant contribution to the external RNA controls toolbox in the form of Spike-In RNA
Variants (SIRVs) that address transcription variation and alternative splicing The highly defined mixes
of 69 transcripts aligning to 7 genes enable accurate target-performance evaluations of gene
expression analysis methods which is not possible eg by analyzing larger but only loosely defined
pools of in vitro transcripts (Lahens et al 2014) or limited sets addressing special problems like
fusion genes (Tembe et al 2014) The results presented here demonstrate that the condensed
complexity of the SIRV controls mimic very closely main properties of endogenous mRNAs when
analyzing high-throughput RNA sequencing workflows for their capabilities to determine transcript
variants and their relative quantities The responses of the SIRV controls to changes in the workflows
allow to extrapolate measures for the accuracy precision and foremost inter-experiment
comparability (concordance) to the large pool of endogenous RNAs With the help of the external
controls we could confirm that biases in sequence coverage could mostly be balanced by the
exemplary chosen data evaluation algorithms and for the majority of transcripts consistent relative
abundances were obtained However in our most concordant same sample pipeline comparison
P3P1 already 44 of the controls and 69 of the endogenous RNAs in the medium to high
concentration range appeared to be differentially expressed although none of those were true
positives (TP) because the reductio ad absurdum same sample comparison was using the very same
sets of NGS reads In consequence more than 700 potential endogenous mRNA leads would be non-
validatable false positives (FP) only because of a change in data evaluation pipelines With a
not peer-reviewed) is the authorfunder All rights reserved No reuse allowed without permission The copyright holder for this preprint (which was httpdxdoiorg101101080747doi bioRxiv preprint first posted online Oct 13 2016
Spike-In RNA variant controls for RNA-Sequencing bioRxiv upload 2016-10-13
19
difference between P4 and P2 of 12 at the level of endogenous RNAs an extra 1200 FPs would
obscure the evaluation
The inter-sample comparison between UHRR and HBRR presents a rather extreme case
where around half of all transcripts were calculated to differ by more than 2-fold However the
relative FPTP weight of both comparisons remains similar as P4P2 shows again clearly higher FP-
rates in both controls and endogenous RNAs The linear interpolation (Fig 5E) allows to estimate the
effect of the experimental changes to relative small number of differences as they would be seen in
typical RNA-Seq experiments Exemplarily highlighted are the intersections at 002 and 01 in Fig 5F
TP call rates and FPTP ratios are the important figures to estimate the likelihood and inversely
related effort to validate differentially expressed transcripts For the P3P1 comparison at 2 TP we
approximate an FPTP ratio of 289 The likelihood to actually validate DE transcripts under such
circumstances would reach 035 For the P4P2 comparison the TPFP ratio estimates to mere 014
The related risks and often substantial costs for deducing potential biomarkers would be 25 times
higher Although we demonstrated in the presented example the influence of changes in data
evaluation pipeline within an integrated RNA-Seq workflow the same principles apply to the front
end - the RNA treatment NGS library preparation and sequencing Here unintended variations in
particular sample preparations can only be detected by these external spike-in controls which
operate as markers and reference spots By these means SIRV controls increase the comparability
within and between sequencing experiments at the transcript isoform level SIRVs are designed for
the co-development improvement and monitoring of library preparations sequencing and data
processing
Outlook The presented module and the 92 ERCCs which probe the wide dynamic range using
monocistronic transcripts can be stepwise extended in the future by a) ca 15 poly(A)-tail variations
of monocistronic sequences with defined lengths of 20 and 30 adenosines as well as polyadenylated
and purified RNAs with poly(A)-tail lengths close to 50 100 and above 200 nucleotides b) around 12
above-average long RNAs with 3 5 7 and 10 kb c) approx 3 RNAs each with a low medium and
not peer-reviewed) is the authorfunder All rights reserved No reuse allowed without permission The copyright holder for this preprint (which was httpdxdoiorg101101080747doi bioRxiv preprint first posted online Oct 13 2016
Spike-In RNA variant controls for RNA-Sequencing bioRxiv upload 2016-10-13
20
high GC-content d) a set of 13 mRNA relevant chemical modifications most prominent the cap-
structure (Bokar and Rottman 1998) e) variants which cover aspects of SNPs alleles inversions and
fusion genes which needs to be accounted for in the corresponding sequence annotation files and f)
a random set of small and micro RNAs that comprise all sequence variations at their termini to
account for ligation biases The external control modules need to be fine-tuned with respect to the
dynamic concentration and concentration ratio range and the reference annotations must provide a
mixture of correctly over- and under-annotated genes to better emulate the challenging conditions
for bioinformatical data evaluation Both optimizations will also further increase the congruence of
the presented SIRV module with the endogenous RNAs Eventually all modules together would
develop into a comprehensive set of approximately 250 long RNA controls plus a microRNA module
which will become sufficient for calibration and normalization purposes This new estimate reduces
the scope of designing better spike-in controls compared to the maybe thousands of IVTs which have
been previously anticipated (Kratz and Carninci 2014)
METHODS
SIRV DESIGN AND IN SILICO ANALYSIS The gene structures of seven human model genes
(KLK5 LDHD LGALS17A DAPK3 HAUS5 USF2 and TESK2) were used as scaffold for the design of
SIRV1 to SIRV7 The ENCODE-annotated transcripts as well as added variants were edited to
represent in a redundant and comprehensive manner known transcription and alternative splicing
variations (complete gene structures are shown in the odd-numbered suppl Fig from S3 to S15) All
exon sequences descend from a pool of database-derived genomes (gene fragments from viruses
and bacteriophage capsid proteins and glycoproteins selected based on a GC-content in a range of
30-50) which were modified by inverting the sequence to lose identity while maintaining a kind of
naturally occurring order in the sequences Intron sequences that do not align with exons of another
isoform were drawn from random sequences whereby the GC content was balanced to comply with
not peer-reviewed) is the authorfunder All rights reserved No reuse allowed without permission The copyright holder for this preprint (which was httpdxdoiorg101101080747doi bioRxiv preprint first posted online Oct 13 2016
Spike-In RNA variant controls for RNA-Sequencing bioRxiv upload 2016-10-13
21
the adjacent exonic sequences (Random DNA Sequence Generator
httpwwwfacultyucredu~mmadurorandomhtm)
To verify the sequence exclusivity first the exon sequences were blasted against the entire NCBI
database including ERCCs on the nucleotide and protein level (program BLASTN 2229
httpsblastncbinlmnihgov) The default BLAST parameters used were word size 28 expected
threshold 10 Max matches in query rang 20 MatchMismatch Score 1 -2 Gap Costs Linear Filter
Low complexity regions Mask for lookup table only Search of the nucleotide collection resulted for
all SIRVs in ldquono significant similarity foundrdquo Second in silico generated reads (Griebel t al 2012)
(FLUX-Generator httpsammethnetconfluencedisplaySIMHome command line flux-simulator
-p ~hellipFluxsirv1par -t simulator -x -l -s) were mapped to nine individually selected genomes using
TopHat2 (Kim et al 2013) and Bowtie2 (Langmead and Salzberg2012) Because Bowtie2-aligned
reads can be as short as 20 nt the resulting limited number of mapping reads would be deemed to
be not significant in standard NGS work-flows In contrast when mapping reads with the standard
setting of the splicing-aware TopHat2 program not a single read aligned to any of the tested
genomes Given that both searches found no significant matches off-target mapping of the SIRVs can
essentially be ruled out Therefore the artificial SIRV sequences are suitable for noninterfering
qualitative and quantitative assessments in the context of known genomic systems and
complementary to the ERCC sequences (National Institute of Standards and Technology (NIST)
certified DNA plasmids Standard Reference Materialreg 2374) The SIRV sequences can be found at
httpswwwlexogencomsirvssirvsdownloads in the Source Data files and they are also
deposited at the NCBI Nucleotide Database (PRJNA312485)
SIRV CONSTRUCTS AND THE PRODUCTION OF IN-VITRO TRANSCRIPTS Synthetic gene constructs
were produced (Bio Basic Inc Markham ON Canada) that comprised 5rsquo to 3rsquo a unique restriction
site a T7 RNA polymerase promoter whose 3rsquo G is the first nucleotide of the actual SIRV sequence
which is seamlessly followed by a (A30)-tail that is fused with an exclusive 2nd restriction site These
not peer-reviewed) is the authorfunder All rights reserved No reuse allowed without permission The copyright holder for this preprint (which was httpdxdoiorg101101080747doi bioRxiv preprint first posted online Oct 13 2016
Spike-In RNA variant controls for RNA-Sequencing bioRxiv upload 2016-10-13
22
gene cassettes were cloned into a vector colony-amplified and singularized All SIRV sequence in the
purified plasmids were verified by Sanger-sequencing to identify the correct clones The E coli
cultures were grown in batches to obtain plasmids in the lower microg-scale Double digestion of isolated
plasmids with XhoI and NsiI showed correct insert size and complete restriction Linearized silica-
purified plasmids served as templates in in vitro transcription reactions using T7 transcription kits
(AmpliScribe T7 High Yield Transcription Kit and AmpliScribe T7 Flash Transcription Kit Epicentre
Madison WI) The DNase-treated phenol-extracted and silica-purified in vitro transcription products
were assessed for concentration and purity by spectrophotometry (NanoDrop Thermo Fisher
Scientific Waltham MA) and for integrity by capillary electrophoresis (2100 Bioanalyzer RNA 6000
Pico Kit Agilent Technologies Santa Clara CA)
In the context of variant verification RNA integrity is a very important measure Fragments
arising from incomplete transcription might impose errors on the correct determination of variants
which share those sequences and thereby also affect the overall gene coverage The integrity of the
transcription products was very heterogeneous as expected given the broad sequence variation and
the length of the SIRV transcripts (average 11 kb with 14 RNAs between 20 and 25 kb) A majority
of transcripts therefore had to be purified by at least one of two purification methods Purification
method PP1 is selective for poly(A)-tails and neglects prematurely terminated transcription products
Purification method PP2 is based on size-selective quantitative electrophoresis separating the
correctly sized main products from shorter fragments (transcription break off and degraded
products) and longer fragments (run-through transcription products) After purification the 69 SIRV
RNAs were assessed to be on average 736plusmn343 in the pre-peak fraction 9031plusmn372 in the
main-peak fraction (corresponding to RNAs of correct length) and 236plusmn304 in the post-peak
fraction (mass percentages wt) Noteworthy the risks of a beginning degradation during the initial
denaturation (2 min at 70degC) and the not fully denaturing conditions during RNA microcapillary
electrophoresis tiny noise levels in the baseline and slightly different shapes of the main peak result
in a rather over- than underestimation of pre- and post-peak fractions
not peer-reviewed) is the authorfunder All rights reserved No reuse allowed without permission The copyright holder for this preprint (which was httpdxdoiorg101101080747doi bioRxiv preprint first posted online Oct 13 2016
Spike-In RNA variant controls for RNA-Sequencing bioRxiv upload 2016-10-13
23
rRNasin (Promega Madison WI) was added to 08 Umicrol to minimize the risks of RNase
contamination induced RNA degradation The SIRVs were quantified by absorbance spectroscopy to
adjust all stock solutions to a base concentration of close to but above 50 ngmicrol RNA purity was very
high with A 260280 214plusmn012 and A 260230 217plusmn020
SIRV MIXING SIRV mixes were designed that contain pools of SIRVs (SubMixes) in defined
amounts and ratios by combining accurate volumes of the stock solutions in sufficiently large batch
sizes Pipetting errors vary depending on transfer volumes and range from plusmn4 for 2 microl to plusmn08 for
gt100 microl transfers The precision was experimentally determined with blank solutions Starting with
the stock concentration measurement (NanoDrop accuracy plusmn2 ngmicrol for 50 ngmicrol or plusmn4 ) and
accounting for the entire mixing pathway the accumulative concentration error is expected to range
between plusmn8 and plusmn47 Therefore in the data evaluation one has to account for the experimental
fuzziness by allowing for lower accuracy thresholds of plusmn8 on the linear scale or plusmn011 on the log2-
fold scale respectively The SIRV concentration ratios between two mixes are more precise because
only one final pipetting step defines the concentration differences and synchronizes all SIRVs which
belong to the same SubMix Here a maximal error of plusmn4 (or plusmn0057 on the log2-fold scale) can be
expected between SubMixes while all SIRVs of the same SubMix must propagate coherently into the
final mixes Bioanalyzer traces were used to monitor the relative propagation of the SIRVs PreMixes
and SubMixes during the mixing (Fig 2B) In addition the accurate pipetting of the 8 PreMixes was
controlled by checksums of Nanodrop concentration measurements which deviated by only
0002plusmn34 from the calculated target concentrations and by weighing on an analytical balance
which showed a deviation of 18plusmn065 The final concentration of the SIRV mixes are set to be 253
ngmicrol
not peer-reviewed) is the authorfunder All rights reserved No reuse allowed without permission The copyright holder for this preprint (which was httpdxdoiorg101101080747doi bioRxiv preprint first posted online Oct 13 2016
Spike-In RNA variant controls for RNA-Sequencing bioRxiv upload 2016-10-13
24
SPIKING OF REFERENCE RNA WITH SIRV MIXES In general SIRV mixes can be used with crude
cell extracts purified total RNA rRNA-depleted RNA or poly(A)-enriched RNA Important the spike-in
ratios have to be chosen in concordance with the desired final SIRV content the RNA preparation
method and if known the expected mRNA content One widely applicable spike-in ratio can be
obtained by adding 006 ng of controls to approximately 100 ng of total RNA In the presented
examples the total RNA mass of one single aliquot RNA was 100 ng of UHRR in RC-0 and 1128 ng of
HBRR in RC-1 The reference RNA in RC-2 was calculated to be 10427 ng (Fig S2) The high-
concentrated and thereby stable SIRV mix stocks with 253 ngmicrol and ERCC mix stocks with 30 ngmicrol
(ERCC Spike-In Mixes 1 and 2 by Ambion Thermo Fisher Waltham MA) were diluted just prior to the
spiking to facilitate the mixing of manageable volumes For example the final 11000 dilution
reduced the SIRV mix concentration to 253 pgmicrol from which 237 microl were required to spike a 100 ng
total RNA sample with 006 ng SIRVs The RC-samples were produced in large batches to yield
hundreds of samples allowing for a protocol with fewer dilutions and larger volumes reducing
thereby sources of experimental errors
NGS LIBRARY PREPARATION AND SEQUENCING The experiments were carried out in technical
triplicates From 1 microg RC-0 RC-1 or RC-2 RNA in total nine NGS libraries were prepared by Fasteris SA
(Plan-les-Ouates CH) using the TruSeq stranded mRNA library preparation kit with polyA selection
(Illumina Inc San Diego CA) All primary library templates were amplified with 14 PCR cycles to
reach reproducible concentrations 155plusmn45 nM and insert sizes 165plusmn10 bp An equimolar lane-mix
was sequenced at the CSF Campus Science Support Facilities GmbH (CSF Vienna AUT) in PE125
mode in one lane of a HiSeq 2500 flowcell in 125 bp paired-end mode using V4 chemistry The run
yielded 305 M raw reads 293 M after demultiplexing and trimming which corresponds to a read
depth of 326plusmn22 M reads per library
not peer-reviewed) is the authorfunder All rights reserved No reuse allowed without permission The copyright holder for this preprint (which was httpdxdoiorg101101080747doi bioRxiv preprint first posted online Oct 13 2016
Spike-In RNA variant controls for RNA-Sequencing bioRxiv upload 2016-10-13
25
READ PROCESSING AND MAPPING Standard data processing routines (bbduk part of BBMap by
B Bushnell to be found at sourceforgenetprojectsbbmap) were applied removing low quality
reads and trimming adapter sequences Due to variable stringencies the mappers produced different
read statistics STAR mapped against the genome 897plusmn59 of the reads (864plusmn56 uniquely) and
TopHat2 852plusmn57 (794plusmn52 uniquely) Bowtie2 mapped against the transcriptome 693plusmn18
reads (151plusmn15 uniquely)
ESTIMATION OF THE MRNA CONTENTS Based on the obtained read distributions the relative
mass partition between external controls and endogenous RNA fraction can be estimated Because
the library preparation uses a poly(A)-enrichment step the targeted endogenous RNA corresponds
almost exclusively to the mRNA content of the samples The propagation of the input mass ratio to
the output read ratio depends on both the mRNA content and the efficiencies of how controls and
mRNA proceed through the library preparation The relationship is described by Eqn 1
reRNA times prod(1 rconifrasl )
j
i=1
= (EeRNA times meRNA) times prod(1 (Econi times mconi)frasl )
j
i=1
Equation 1
with r number of reads from eRNA the endogenous RNA fraction here mRNA and con the
controls here SIRVs and ERCC E the relative efficiency of how the fraction proceeds through the
workflow and m the input mass
Ratios are measured as relative read counts and the results as a product of efficiencies and
apparent amounts are also relative measures Therefore at least one de facto arbitrary reference
point needs to be defined to deduce comparable absolute results Several reference points or
default values can be defined which lead to different dependent variables and imply slightly variable
interpretation of the results The following three calculation examples are simple deductions from
not peer-reviewed) is the authorfunder All rights reserved No reuse allowed without permission The copyright holder for this preprint (which was httpdxdoiorg101101080747doi bioRxiv preprint first posted online Oct 13 2016
Spike-In RNA variant controls for RNA-Sequencing bioRxiv upload 2016-10-13
26
the ratio shown in Eqn 1 with the ERCC (con1) and the SIRVs (con2) respectively Variation 1 is
explained in greater detail while in the other variants only the differing aspects are highlighted
Variation 1 i) Here the first assumption is that the mRNA content in UHRR (Agilent Santa
Clara CA) is 3 (factor 003) and 2 (factor 002) in HBRR (Ambion Thermo Fisher Waltham MA)
which stays in close agreement to previous estimates concluded from experiments by Shippy et al in
2006 The amounts of total RNA were measured by Nanodrop absorbance spectroscopy The UHRR
samples contained 100 ng and the HBRR samples 1128 ng The mixing ratio of (2times RC-0) (1times RC-1)
determines the concentration of the 3rd sample RC-2 and further the amount of total RNA (10427
ng) as well as its related mRNA content (2times100 ng times 3 + 1times1128 ng times 2 ) (2times100 ng + 1times1128
ng) = 264 (factor 0026) The mRNA masses of the samples are calculated by the measured total
RNA input amounts and default mRNA contents are 3 ng 2256 ng and 2752 ng The second
assumption is that the endogenous mRNAs proceed with the maximal efficiency of 100 (factor 1)
through library preparation and sequencing The input of the spike-in controls is the product of the
concentration values which were either measured as in the case of the SIRV stocks or stated by the
vendor as in the case of the ERCC stocks and the pipetted volumes Both are treated as de facto
measured values
ii) The relative amounts of reads which have been assigned to either endogenous mRNA
ERCCs or SIRVs are obtained from the mapping statistics (read classification)
iii) The ratio of mass input to reads output allows to calculate the propagation efficiency of
the controls relative to the default efficiency of the endogenous mRNA In the present experiment
the SIRVs progress with a relative efficiency of 867plusmn57 and the ERCCs with 416plusmn47 The
significant difference between the relative efficiency of both controls is very likely caused by the
different lengths of the poly(A)-tails which might influence a different binding efficiency during
poly(A)-enrichment step The SIRVs with a 30 nt long poly(A)-tail perform much more in concordance
with the endogenous mRNA as the ERCCs which contain shorter and variable poly(A)-tails ( 23 nt)
The observed small differences in the experiments using RC-0 RC-1 or RC-2 could be caused by a
not peer-reviewed) is the authorfunder All rights reserved No reuse allowed without permission The copyright holder for this preprint (which was httpdxdoiorg101101080747doi bioRxiv preprint first posted online Oct 13 2016
Spike-In RNA variant controls for RNA-Sequencing bioRxiv upload 2016-10-13
27
two-way interference of samples and controls However the deviations are small and can rather be a
result of minor inaccuracies in determining the relative input amounts Both hypotheses would need
to be verified by a series of repeats with the aim to resolve potential influences of pipetting during
the sample preparation variations in the library preparation and other contributions
Variation 2 Here no varying interferences between samples and controls are permitted
which means that relative efficiencies of the controls are considered to be constant The causes of
the experimental variations are exclusively assigned to the input amounts (alike hypothesis two in
the above example in discussing the deviation of the results in RC-2) This would translate into input
standard deviations of 118 (SIRVs) and 76 (ERCCs) The variations meld all accumulating errors
made in determining the concentration of the control stock solutions preparing the subsequent
dilutions pipetting the samples and controls during the spike-in step itself as well as determining the
amount of sample RNA in the first place Against the background of potential errors the calculated
results can be considered as highly consistent
Variation 3 In addition to the assumptions made for the measurement of sample RC-0
the spike-in of 006 ng SIRVs to all samples is also set as default Alike variation 2 the experiments in
RC-1 and RC-2 adopt the same default setting for the relative efficiencies calculated in RC-0
According to the ratio of Eqn 1 one can obtain mRNA contents as well as ERCC input amounts in this
case for samples RC-1 and RC-2 The mRNA content of the HBRR sample (RC-1) relative to the default
mRNA content in the UHRR sample (set to 3 ) would be 172 lower than the previously assumed
2 According to the present mixing scheme it would also imply that sample RC-2 has an mRNA
content of 254 up from the calculated 234 The offsets of -79 is again small and very likely
refers to the level of accuracy in the experimental results as discussed above Using this method the
spiking of samples with controls such as the SIRVs allows to closely estimate the relative mRNA
content of any unknown sample and to draw conclusions eg on the transcriptional state of tissues
cell suspension or individual cells
not peer-reviewed) is the authorfunder All rights reserved No reuse allowed without permission The copyright holder for this preprint (which was httpdxdoiorg101101080747doi bioRxiv preprint first posted online Oct 13 2016
Spike-In RNA variant controls for RNA-Sequencing bioRxiv upload 2016-10-13
28
COEFFICIENT OF DEVIATION We implemented a strand specific Coefficient of Deviation
(CoD) which aims to reflect the quality of NGS pipelines targeted at specific effects in particular
lsquospikenessrsquo of the coverage while systematic effects like drop of the coverage at Transcription Start
Sites (TSS) and Transcription End Sites (TES) are being suppressed The CoD is implemented by Eqn
2
CoD = CoD(LTSSLTES) = sum (cidealp- crealp)2
TESe
p=TSS1
divide sum cidealp
TESe
p=TSS1
Equation 2
which is calculated in strand orientation for contigs along all exonic nucleotide position (p) from the
first annotated TSS (TSS1) up to the last annotated TES (TESe) whereby cideal are the ideal coverages
with the optimized transient regions (LrsquoTSS LrsquoTES) and creal are the real coverages scaled as such that
the total integrals along all positions of ideal and real coverages are equal
The transient function at TSS and TES is the error function erf(x) which corresponds to
Cufflinks assumption about normally distributed fragment lengths (Trapnell et al 2012) Since erf(x)
is a non-algebraic function we used the algebraic approximation by Abramowitz and Stegun
(httpsenwikipediaorgwikiError_function eq 7125) Once the optima (LrsquoTSS LrsquoTES ) are found
we declare CoD(LrsquoTSS LrsquoTES) to be the ultimate CoD value which mostly eliminated the transient region
effects We implemented an optimization algorithm (Nelder-Mead downhill simplex method) and
used as starting values (L0TSS L0
TES ) lengths of 150 In some cases the optimum found can be beyond
a reasonable range of values Therefore we censor the output Lopt of the mathematical optimization
as follows Lcensored = 50 if Lrsquo lt 50 Lcensored = 350 if Lrsquo gt 350 This corresponds to the maximal range of
not peer-reviewed) is the authorfunder All rights reserved No reuse allowed without permission The copyright holder for this preprint (which was httpdxdoiorg101101080747doi bioRxiv preprint first posted online Oct 13 2016
Spike-In RNA variant controls for RNA-Sequencing bioRxiv upload 2016-10-13
29
200plusmn150 This censoring needed to be applied in 8 cases out of 84 SIRVmixstrandend
combinations ie less than in 10
TRANSCRIPT CONCENTRATION MEASUREMENTS In order to estimate expression values on
transcript levels we applied RSEM (Li and Dewey 2011) which uses a Bayesian Network to compute
the likelihood of each fragment belonging to a given transcript Salmon (Patro et al 2015) estimates
the transcript expression values by a k-mer based mapping Similar to RSEM it uses an expectation-
maximization (EM) algorithm to compute the maximum likelihood of relative abundances Cufflinks2
(Trapnell et al 2013) estimates the transcript abundances with a coverage-based maximum
likelihood approach It determines the probability of read assignments to isoforms
DIFFERENTIAL EXPRESSION ANALYSIS We used the DESeq2 package (Love et al 2014) for
calculation of fold-differences between the results from different pipelines and different input samples
mixtures As explained in the main text all outputs from the evaluated pipelines (in form of relative
concentration measures) have been scaled Scaling by linear transformation is needed as a
consequence of the different mRNA contents in the samples but also to eventually compensate any
potential pipetting errors when small aliquots typically in the range of very few microliter are added
to individual samples The RC-samples in this experiment were produced in a large batch to ensure
high accuracy in volumetric ratios The main sample pool is practically invariant to the small relative
contribution of the controls but was technically treated in the same way by scaling the main sample
pools to identical sizes First SIRV concentrations were scaled to reach together 69 in E0 685 in E1
and 708 in E2 which is the dimensionless value identical to the fmolmicrol in the respective SIRV stock
solutions Then the lower threshold was set to 10-6 which corresponds to original FPKM values of
around 5∙10-3 ⅟7th of one read for a 1 kb long transcript at a read depth of 30 Mio reads or 1 gene
specific read to be divided between 7 equally possible transcript variants at said 1 kb length section
The threshold is to be understood as less than or equal to 10-6 which defines an averaged read
not peer-reviewed) is the authorfunder All rights reserved No reuse allowed without permission The copyright holder for this preprint (which was httpdxdoiorg101101080747doi bioRxiv preprint first posted online Oct 13 2016
Spike-In RNA variant controls for RNA-Sequencing bioRxiv upload 2016-10-13
30
resolution of the particular workflow at the given read depth By these means all ratios remain defined
Second for the DESeq2 calculations we multiplied all values with 106 after which fractions were
rounded to the closest integer We understand that for no-change hypothesis testing which is the
main purpose of the DESeq2 package transforming the relative concentrations (FPKM or TPM) to
lsquoquasi-read-countsrsquo is not recommended since DESeq2 internally corrects for library size by using size
factors However in our application we do not use the probability of the hypothesis rejection (P
values) but the raw fold changes detected (irrespectively of the dispersion values for that given
transcript) We also took into account the potential danger of censoring the input (by unintentionally
eliminating transcripts represented by extremely low FPKM or TPM values) by setting a suitable
threshold as described above The figures show only two differential expression analyses because the
3rd concentration ratio E2E0 is the product of E1E0 and E2E1
ERROR RATE ANALYSIS The four red data points two from the SIRV controls (circles) and two
from the endogenous mRNAs (squares) from the best agreement (P3 vs P1) and the four
corresponding black data points from the worst agreement (P4 vs P2) as shown in fig 5E were fitted
by linear approximation using the relationship as derived for Eqn 3
TP + FP = 1
FP = N times ER = (1-TP) times ER
(TP+FP) = TP + ER - TP times ER
(TP+FP) = (1-ER) times TP + ER Equation 3
where TP is the relative portion of true positives (differentially expressed as in our definition
possessing a LFC gt 1) N the relative portion of negatives ER the error rate at which negatives are
falsely detected as positives to result in false positives FP The least squares fitting method was
applied to derive values for the slope (1-ER) and the intercept ER
not peer-reviewed) is the authorfunder All rights reserved No reuse allowed without permission The copyright holder for this preprint (which was httpdxdoiorg101101080747doi bioRxiv preprint first posted online Oct 13 2016
Spike-In RNA variant controls for RNA-Sequencing bioRxiv upload 2016-10-13
31
The transformation of Eqn 3 leads to the relationship of Eqn 4
TP FPfrasl = (TP+FP) TPfrasl -1 Equation 4
which has been used for the graph in fig 5F In the present context the concept of ROC-curves is not
applicable because the true or false negatives are indistinguishable as long the ground truth of the
endogenous RNA are unknown
DATA ACCESS Sequencces and source data files data are in the process to be deposited at
NCBI under BioProject ID PRJNA312485
ACKNOWLEDGMENTS We thank SA Munro and M Salit (Material Measurement
Laboratory National Institute of Standards and Technology) for their efforts in further developing the
concepts of the External RNA Control Consortium (ERCC) in an updated suite of RNA controls and
analysis methods called ERCC 20 We thank A Tuerk for his contributions in finding suitable human
model genes G Wiktorin for carrying out the RSEM calculations M Mihaylova in helping with the
graphics design and I Gabler for critically reading the manuscript
AUTHOR CONTRIBUTIONS LP PK and TR designed the sequences and mixtures PK and GH
prepared the in vitro transcripts and spike-in mixtures TR AS and LP designed the research and
the experiments MA IH and TR evaluated the data TR and LP wrote the manuscript
DISCLOSURE DECLARATION The authors are employees of Lexogen GmbH from which the SIRVs
can be bought and AS has equity stakes in Lexogen GmbH LP PK and TR are named as
not peer-reviewed) is the authorfunder All rights reserved No reuse allowed without permission The copyright holder for this preprint (which was httpdxdoiorg101101080747doi bioRxiv preprint first posted online Oct 13 2016
Spike-In RNA variant controls for RNA-Sequencing bioRxiv upload 2016-10-13
32
inventors on a patent application regarding the production and use of RNA transcript variants and
Lexogen GmbH is the owner of this patent application
REFERENCES
Baker SC Bauer SR Beyer RP Brenton JD Bromley B Burrill J Causton H Conley MP Elespuru R Fero M et al 2005 The External RNA Controls Consortium a progress report Nat Methods 2(10) 731-4 Bokar JA Rottman FM 1998 Biosynthesis and Functions of Modified Nucleosides in Eukaryotic mRNA In Modification and Editing of RNA (eds Grosjean H Benne R) pp 183-200 ASM Press Washington DC Dobin A Davis CA Schlesinger F Drenkow J Zaleski C Jha S Batut P Chaisson M Gingeras TR 2013 STAR ultrafast universal RNA-seq aligner Bioinformatics 29(1) 15-21 Fed Reg Doc 2015-19742 2015 External RNA Controls Consortium - Call for Participation and Contributions to a Sequence Library Federal Register Citation 80 FR 48296 Griebel T Zacher B Ribeca P Raineri E Lacroix V Guigoacute R Sammeth M 2012 Modelling and simulating generic RNA-Seq experiments with the flux simulator Nucleic Acids Res 40(20) 10073-83 Jiang L Schlesinger F Davis CA Zhang Y Li R Salit M Gingeras TR Oliver B 2011 Synthetic spike-in standards for RNA-seq experiments Genome Res 21(9) 1543-51 Kim D Pertea G Trapnell C Pimentel H Kelley R Salzberg SL 2013 TopHat2 accurate alignment of transcriptomes in the presence of insertions deletions and gene fusions Genome Biol 14(4) R36 Kratz A Carninci P 2014 The devil in the details of RNA-seq Nat Biotechnol 32(9) 882-4 Lahens NF Kavakli IH Zhang R Hayer K Black MB Dueck H Pizarro A Kim J Irizarry R Thomas RS et al 2014 IVT-seq reveals extreme bias in RNA sequencing Genome Biol 15(6) R86 Langmead B Salzberg SL 2012 Fast gapped-read alignment with Bowtie 2 Nat Methods 9(4) 357-9 Li B Dewey CN 2011 RSEM accurate transcript quantification from RNA-Seq data with or without a reference genome BMC Bioinformatics 12 323 Li J Jiang H Wong WH 2010 Modeling non-uniformity in short-read rates in RNA-Seq data Genome Biol 11 R50 Li S Tighe SW Nicolet CM Grove D Levy S Farmerie W Viale A Wright C Schweitzer PA Gao Y et al 2014 Multi-platform assessment of transcriptome profiling using RNA-seq in the ABRF next-generation sequencing study Nat Biotechnology 32 915-25 Love MI Huber W Anders S 2014 Moderated estimation of fold change and dispersion for RNA-seq data with DESeq2 Genome Biol 15(12) 550
not peer-reviewed) is the authorfunder All rights reserved No reuse allowed without permission The copyright holder for this preprint (which was httpdxdoiorg101101080747doi bioRxiv preprint first posted online Oct 13 2016
Spike-In RNA variant controls for RNA-Sequencing bioRxiv upload 2016-10-13
33
Mortazavi A Williams BA McCue K Schaeffer L Wold B 2008 Mapping and quantifying mammalian transcriptomes by RNA-Seq Nat Methods 5(7) 621-8 Patro R Duggal G Kingsford C 2015 Accurate fast and model-aware transcript expression quantification with Salmon bioRxiv preprint doi httpdxdoiorg101101021592 Shippy R Fulmer-Smentek S Jensen RV Jones WD Wolber PK Johnson CD Pine PS Boysen C Guo X Chudin E et al 2006 Using RNA sample titrations to assess microarray platform performance and normalization techniques Nat Biotechnol 24(9) 1123-31 SEQCMAQC-III Consortium 2014 A comprehensive assessment of RNA-seq accuracy reproducibility and information content by the Sequencing Quality Control Consortium Nat Biotechnology 32 903-14 Tembe WD Pond SJ Legendre C Chuang HY Liang WS Kim NE Montel V Wong S McDaniel TK Craig DW Carpten JD 2014 Open-access synthetic spike-in mRNA-seq data for cancer gene fusions BMC Genomics 15 824 Trapnell C Roberts A Goff L Pertea G Kim D Kelley DR Pimentel H Salzberg SL Rinn JL Pachter L 2012 Differential gene and transcript expression analysis of RNA-seq experiments with TopHat and Cufflinks Nat Protoc 7(3) 562-78 Trapnell C Hendrickson DG Sauvageau M Goff L Rinn JL Pachter L 2013 Differential analysis of gene regulation at transcript resolution with RNA-seq Nat Biotechnol 31(1) 46-53 van Dijk EL Jaszczyszyn Y Thermes C 2014 Library preparation methods for next-generation sequencing tone down the bias Exp Cell Res 322(1) 12-20 Wang Z Gerstein M Snyder M 2009 RNA-Seq a revolutionary tool for transcriptomics Nat Rev Genet 1 57-63 Zheng W Chung LM Zhao H 2011 Bias detection and correction in RNA-Sequencing data BMC Bioinformatics 12290
not peer-reviewed) is the authorfunder All rights reserved No reuse allowed without permission The copyright holder for this preprint (which was httpdxdoiorg101101080747doi bioRxiv preprint first posted online Oct 13 2016
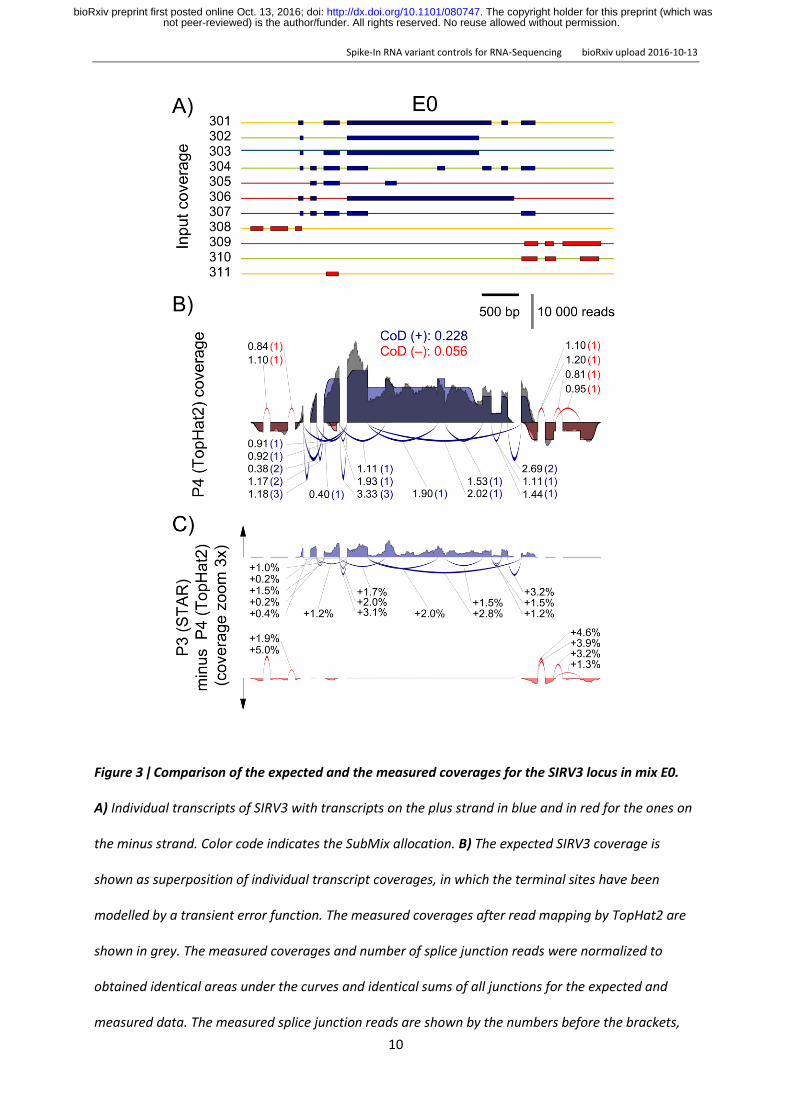
Spike-In RNA variant controls for RNA-Sequencing bioRxiv upload 2016-10-13
10
Figure 3 ǀ Comparison of the expected and the measured coverages for the SIRV3 locus in mix E0
A) Individual transcripts of SIRV3 with transcripts on the plus strand in blue and in red for the ones on
the minus strand Color code indicates the SubMix allocation B) The expected SIRV3 coverage is
shown as superposition of individual transcript coverages in which the terminal sites have been
modelled by a transient error function The measured coverages after read mapping by TopHat2 are
shown in grey The measured coverages and number of splice junction reads were normalized to
obtained identical areas under the curves and identical sums of all junctions for the expected and
measured data The measured splice junction reads are shown by the numbers before the brackets
not peer-reviewed) is the authorfunder All rights reserved No reuse allowed without permission The copyright holder for this preprint (which was httpdxdoiorg101101080747doi bioRxiv preprint first posted online Oct 13 2016
Spike-In RNA variant controls for RNA-Sequencing bioRxiv upload 2016-10-13
11
while the expected values are shown inside the brackets The CoD values are given for the plus and
minus strand in the respective colors C) Differences between mapping by STAR aligner and TopHat2
The black arrows indicate the direction of positive differences Percentages refer to the relative
changes of the measured splice junction reads
To obtain a comparative measure gene-specific coefficients of deviation CoD were calculated CoDs
describe the often hidden biases in the sequence data predominantly caused by an inhomogeneous
library preparation but also by the subsequent sequencing and mapping In the presented example
the stranded TruSeq library preparation with the Illumina HiSeq2500 sequencing and mapping by
TopHat2 results in a mean CoD of 0190plusmn0193 across all SIRVs For the sense oriented SIRVs the
mean CoD is 0275plusmn0223 and for the antisense SIRVs which cover a region of fewer overlapping
transcript annotations the mean CoD is 0090plusmn0076 The coverage target-performance comparison
highlights the inherent difficulties in deconvoluting read distributions to correctly identify transcript
variants and determine concentrations The distribution of telling reads splice junctions and reads
towards the termini are references for the assignment of the remaining reads before calculating
relative transcript variant abundances Not surprisingly although the majority of junction counts
correlates well with the expected values the high CoD values indicate that numerous telling reads
deviate significantly within the context of the individual mixes They also differ between mixes which
affects differential expression measurements (see Fig 3B and for the coverage of all seven SIRV
genes the even suppl Fig from S4 to S16)
The CoD does not allow to distinguish between periodicity and randomness in the biases nor
does it forecast how well a data evaluation strategy can cope with the bias contributions
Nevertheless smaller CoD values are expected to correlate with a simpler and less error-prone data
evaluation The CoD values can be taken as a first indicative measure to characterize the mapped
data and to compare data sets for similarity up to this point in the workflow Target-performance
comparisons of all SIRV genes in all three mixes can be found in the supplemental information
not peer-reviewed) is the authorfunder All rights reserved No reuse allowed without permission The copyright holder for this preprint (which was httpdxdoiorg101101080747doi bioRxiv preprint first posted online Oct 13 2016
Spike-In RNA variant controls for RNA-Sequencing bioRxiv upload 2016-10-13
12
The above described four data analysis pipelines P1 to P4 were used to calculate transcript
abundances for 69 SIRV and 196˙165 annotated endogenous transcripts All obtained results are
relative concentration measures yielding either Fragments Per Kilobase of exon per Million
fragments mapped (FPKM) (Mortazavi 2008) or Transcripts Per Million (TPM) (Li and Dewey 2011)
The concentrations were scaled by linear transformation in such way that all SIRVs together reach 69
in E0 685 in E1 and 708 in E2 which is the dimensionless value identical to the fmolmicrol in the
respective SIRV stock solutions In consequence the relative quantities of the SIRVs are compatible
to the normalized scale which was introduced in Fig 2C Boxplots in Fig 4 show exemplarily the SIRV
concentrations and two discrete differentials as measured by P3 (results from P1 P2 and P4 are
shown in suppl Fig S17 and standard correlation plots of the four pipelines are shown in suppl Fig
S18) The majority of all SubMix mean concentration values are in concordance with the expected
values The concentration ratios simulating differential expression measurements are less prone to
systematic offsets and show by trend narrower distributions However these correlations highlight
already the issue of obvious and frequent outliers ie transcript variants that are not well resolved
not peer-reviewed) is the authorfunder All rights reserved No reuse allowed without permission The copyright holder for this preprint (which was httpdxdoiorg101101080747doi bioRxiv preprint first posted online Oct 13 2016
Spike-In RNA variant controls for RNA-Sequencing bioRxiv upload 2016-10-13
13
Figure 4 ǀ Box plot overview of calculated concentration values for SIRV mixes and mix ratios
Reads from SIRV mixes E0 E1 and E2 were processed by four different data evaluation algorithms for
transcript quantification Results derived by pipeline P3 are exemplarily shown in reference to the
known inputs (bars in colors corresponding to the SIRV SubMixes of Fig 2) The black circles mark the
mean and the bold dashes the medians of the data points which are shown in grey the boxes span
the 25 to 75 region of the data points and the black whiskers with connecting lines reach up to the
min and max values and indicate also outliers outside the scale of the graph The comparison E1 vs
E0 from sample RC-1 and RC-0 (2nd row) was used for building the histogram of Fig 5B The shaded
area resembles the 1st bin (0leǀLFCǀle1) while the inner section (b1) comprises the fraction 0leǀLFCǀlt05
where the majority of data points originates from SubMix4 (ratio 11) and some ldquooutliersrdquo from
SubMix2 which were actually spiked in at the ratio 21
Heat maps allow to inspect each SIRV in the context of competing transcripts Tab 1B shows
the abundancies as log2-fold changes LFC relative to the expected values for the example of SIRV 6
LFC values consider relative increases and decreases across all concentration ranges likewise An LFC
window of plusmn011 presents the confidence interval as a result from the currently achievable accuracy
not peer-reviewed) is the authorfunder All rights reserved No reuse allowed without permission The copyright holder for this preprint (which was httpdxdoiorg101101080747doi bioRxiv preprint first posted online Oct 13 2016
Spike-In RNA variant controls for RNA-Sequencing bioRxiv upload 2016-10-13
14
in producing the SIRV mixtures We examine the LFC values uncoupled from the adjusted p-values
which provide a statistical measure of the significance level for apparent differential expression By
these means we prevent pipelines to appear more coherent only due to higher noise levels The
accuracy has been calculated for each SIRV as the mean of the LFCs in all three mixes The precision is
a measure of how consistent SIRVs are quantified and has been calculated as the LFC standard
deviation for each SIRV and further for entire pipelines by using all SIRVs Within the presented
example SIRVs can obtain in all four pipelines high precisions of up to 018plusmn007 and high accuracies
of up to -001plusmn010 (SIRV604) In contrast SIRV612 of similar length has an average precision of
569plusmn368 and an accuracy of -386plusmn270 although it was detected by P2 with a high precision of 012
at an accuracy of 018 This quantification of differences between pipelines now directly permits to
assess the effect of changes in workflows and individual experiments
COMPARISON BETWEEN DIFFERENT WORKFLOWS When ranking the four pipelines by said precision P3
gives the lowest value with 129 followed by P4 with 164 P1 with 198 and P2 with 214 However
a sample-specific global target-performance comparison is not the strongest criteria for evaluating
performance differences at transcript resolution For this purpose the apparent differential
expression shows if similar errors are caused by the same or different transcripts The highest
concordance was found between P3 and P1 (labelled P3P1) calculated as standard deviation of all
SIRV LFCs with 101 followed by P4P3 (104) P4P1 (255) P2P1 (288) and P3P2 (309) The
lowest concordance has P4P2 with a value of 412 One section of the resulting heat map for both
extremes is shown in Tab 1C
not peer-reviewed) is the authorfunder All rights reserved No reuse allowed without permission The copyright holder for this preprint (which was httpdxdoiorg101101080747doi bioRxiv preprint first posted online Oct 13 2016
Spike-In RNA variant controls for RNA-Sequencing bioRxiv upload 2016-10-13
15
Table 1 ǀ Variance heat map of SIRV concentration measures detailing SIRV6 by the 4 different
pipelines P1 to P4 A) Given are SIRV transcript identifier SubMix (SM) color code and transcript
lengths (in nucleotides) B) Heat maps showing the log-fold changes (LFC) for the comparison of the
normalized expected and measured SIRV concentrations as a result from the four data evaluation
pipelines P1 to P4 evaluating E0 E1 and E2 Fields with -1 le LFC le 1 are filled with gradient green all
fields with LFC lt -1 with straight blue and all fields with LFC gt 1 with straight red C) From all 6
possible pairwise comparisons P2P1 P3P1 to P4P3 of the normalized measured SIRV
concentrations the one with the smallest (P3P1) and largest (P4P2) median of all LFC are shown
The complete heat map is shown in the suppl Tab S2
not peer-reviewed) is the authorfunder All rights reserved No reuse allowed without permission The copyright holder for this preprint (which was httpdxdoiorg101101080747doi bioRxiv preprint first posted online Oct 13 2016
Spike-In RNA variant controls for RNA-Sequencing bioRxiv upload 2016-10-13
16
The same pipeline comparisons were made with either all endogenous transcripts or the ones in the
higher SIRV expression range and compared to the pipeline concordances calculated with the SIRV
controls (Fig 5) We define the first bin with ǀLFCǀ lt 1 as the bin of no apparently differentially
expressed transcripts independent of the corresponding p-values The other bins contain transcripts
for which the calculated concentrations differ by more than 2-fold hence convene apparently
differentially expressed transcripts (DE) We find that SIRV controls and endogenous transcripts are
evaluated coherently While theoretically no differences are expected pipelines P3 and P1 differ in
their quantification of the same data by 44 for the SIRVs and by 69 for endogenous RNAs in the
SIRV concentration range (Fig 5A) Pipelines P2 and P4 differ to a larger extent when evaluating the
same samples (Fig 5B C) The same correlation is seen in comparisons between different samples
(shown here for RC-0 vs RC-1) The expected DE between reference RNAs UHRR and HBRR of
approximately 50 is evaluated differently by P3 vs P1 (DE of 24 ) and this is mirrored in the
evaluation of the SIRV mixes spiked into these reference RNAs (DE of 49 ) P4 vs P2 performed
worse with a pipeline difference of 39 and 103 for endogenous and SIRV transcripts The
controls show a highly similar increase when comparing P3P1 with P4P2 (21-fold from 49 to
103 ) to the endogenous RNAs (16-fold from 24 to 39 ) Here the average measurement
using the same pipeline provide a pseudo-ground truth which is compared to the measurement
using different pipelines It allows to quantify the additional error caused solely by changes in the
pipeline A change from pipeline P3 to P1 would increase the number of DE-detected transcripts to a
smaller extent than a change from P2 to P4 and this is true for both the SIRV controls and the
endogenous transcripts
not peer-reviewed) is the authorfunder All rights reserved No reuse allowed without permission The copyright holder for this preprint (which was httpdxdoiorg101101080747doi bioRxiv preprint first posted online Oct 13 2016
Spike-In RNA variant controls for RNA-Sequencing bioRxiv upload 2016-10-13
17
Figure 5 ǀ SIRV and endogenous mRNA expression analyses are affected similarly when changing
data evaluation pipelines Binned apparent LFC-moduli are shown in histograms when comparing
results obtained by different pipelines evaluating identical NGS data sets from A C) the same
samples or B D) different samples Exemplarily the comparison with the best P3 vs P1 (black
symbols) and the worst agreement P4 vs P2 (red symbols) are shown The charts compare side-by-
side the results from the SIRV controls (green) all endogenous transcripts (black outline) and
endogenous transcripts within the medium-to-high concentration range of 10 to 2250 TPM or FPKM
(blue) The average of all intra-pipeline results are shown in grey The differences Δ between
not peer-reviewed) is the authorfunder All rights reserved No reuse allowed without permission The copyright holder for this preprint (which was httpdxdoiorg101101080747doi bioRxiv preprint first posted online Oct 13 2016
Spike-In RNA variant controls for RNA-Sequencing bioRxiv upload 2016-10-13
18
analyses with the same and with different pipelines show the losses in the bins 0 lt ǀLFCǀ lt 1 and the
corresponding gain in the other bins ǀLFCǀ gt 1 The increase of the FP-rate purely caused by the
pipeline changes vs the TP range is given in the summary graphs E and F) The 1st bins 0 lt ǀLFCǀ lt 1
are divided into two 0 lt ǀLFCǀ lt 05 and 05 lt ǀLFCǀ lt 1 which facilitates the easier tracking of the
results from the SubMixes4 as shown in Fig 4 were in both figures the 1st fraction is signed with 1b
DISCUSSION
We report a significant contribution to the external RNA controls toolbox in the form of Spike-In RNA
Variants (SIRVs) that address transcription variation and alternative splicing The highly defined mixes
of 69 transcripts aligning to 7 genes enable accurate target-performance evaluations of gene
expression analysis methods which is not possible eg by analyzing larger but only loosely defined
pools of in vitro transcripts (Lahens et al 2014) or limited sets addressing special problems like
fusion genes (Tembe et al 2014) The results presented here demonstrate that the condensed
complexity of the SIRV controls mimic very closely main properties of endogenous mRNAs when
analyzing high-throughput RNA sequencing workflows for their capabilities to determine transcript
variants and their relative quantities The responses of the SIRV controls to changes in the workflows
allow to extrapolate measures for the accuracy precision and foremost inter-experiment
comparability (concordance) to the large pool of endogenous RNAs With the help of the external
controls we could confirm that biases in sequence coverage could mostly be balanced by the
exemplary chosen data evaluation algorithms and for the majority of transcripts consistent relative
abundances were obtained However in our most concordant same sample pipeline comparison
P3P1 already 44 of the controls and 69 of the endogenous RNAs in the medium to high
concentration range appeared to be differentially expressed although none of those were true
positives (TP) because the reductio ad absurdum same sample comparison was using the very same
sets of NGS reads In consequence more than 700 potential endogenous mRNA leads would be non-
validatable false positives (FP) only because of a change in data evaluation pipelines With a
not peer-reviewed) is the authorfunder All rights reserved No reuse allowed without permission The copyright holder for this preprint (which was httpdxdoiorg101101080747doi bioRxiv preprint first posted online Oct 13 2016
Spike-In RNA variant controls for RNA-Sequencing bioRxiv upload 2016-10-13
19
difference between P4 and P2 of 12 at the level of endogenous RNAs an extra 1200 FPs would
obscure the evaluation
The inter-sample comparison between UHRR and HBRR presents a rather extreme case
where around half of all transcripts were calculated to differ by more than 2-fold However the
relative FPTP weight of both comparisons remains similar as P4P2 shows again clearly higher FP-
rates in both controls and endogenous RNAs The linear interpolation (Fig 5E) allows to estimate the
effect of the experimental changes to relative small number of differences as they would be seen in
typical RNA-Seq experiments Exemplarily highlighted are the intersections at 002 and 01 in Fig 5F
TP call rates and FPTP ratios are the important figures to estimate the likelihood and inversely
related effort to validate differentially expressed transcripts For the P3P1 comparison at 2 TP we
approximate an FPTP ratio of 289 The likelihood to actually validate DE transcripts under such
circumstances would reach 035 For the P4P2 comparison the TPFP ratio estimates to mere 014
The related risks and often substantial costs for deducing potential biomarkers would be 25 times
higher Although we demonstrated in the presented example the influence of changes in data
evaluation pipeline within an integrated RNA-Seq workflow the same principles apply to the front
end - the RNA treatment NGS library preparation and sequencing Here unintended variations in
particular sample preparations can only be detected by these external spike-in controls which
operate as markers and reference spots By these means SIRV controls increase the comparability
within and between sequencing experiments at the transcript isoform level SIRVs are designed for
the co-development improvement and monitoring of library preparations sequencing and data
processing
Outlook The presented module and the 92 ERCCs which probe the wide dynamic range using
monocistronic transcripts can be stepwise extended in the future by a) ca 15 poly(A)-tail variations
of monocistronic sequences with defined lengths of 20 and 30 adenosines as well as polyadenylated
and purified RNAs with poly(A)-tail lengths close to 50 100 and above 200 nucleotides b) around 12
above-average long RNAs with 3 5 7 and 10 kb c) approx 3 RNAs each with a low medium and
not peer-reviewed) is the authorfunder All rights reserved No reuse allowed without permission The copyright holder for this preprint (which was httpdxdoiorg101101080747doi bioRxiv preprint first posted online Oct 13 2016
Spike-In RNA variant controls for RNA-Sequencing bioRxiv upload 2016-10-13
20
high GC-content d) a set of 13 mRNA relevant chemical modifications most prominent the cap-
structure (Bokar and Rottman 1998) e) variants which cover aspects of SNPs alleles inversions and
fusion genes which needs to be accounted for in the corresponding sequence annotation files and f)
a random set of small and micro RNAs that comprise all sequence variations at their termini to
account for ligation biases The external control modules need to be fine-tuned with respect to the
dynamic concentration and concentration ratio range and the reference annotations must provide a
mixture of correctly over- and under-annotated genes to better emulate the challenging conditions
for bioinformatical data evaluation Both optimizations will also further increase the congruence of
the presented SIRV module with the endogenous RNAs Eventually all modules together would
develop into a comprehensive set of approximately 250 long RNA controls plus a microRNA module
which will become sufficient for calibration and normalization purposes This new estimate reduces
the scope of designing better spike-in controls compared to the maybe thousands of IVTs which have
been previously anticipated (Kratz and Carninci 2014)
METHODS
SIRV DESIGN AND IN SILICO ANALYSIS The gene structures of seven human model genes
(KLK5 LDHD LGALS17A DAPK3 HAUS5 USF2 and TESK2) were used as scaffold for the design of
SIRV1 to SIRV7 The ENCODE-annotated transcripts as well as added variants were edited to
represent in a redundant and comprehensive manner known transcription and alternative splicing
variations (complete gene structures are shown in the odd-numbered suppl Fig from S3 to S15) All
exon sequences descend from a pool of database-derived genomes (gene fragments from viruses
and bacteriophage capsid proteins and glycoproteins selected based on a GC-content in a range of
30-50) which were modified by inverting the sequence to lose identity while maintaining a kind of
naturally occurring order in the sequences Intron sequences that do not align with exons of another
isoform were drawn from random sequences whereby the GC content was balanced to comply with
not peer-reviewed) is the authorfunder All rights reserved No reuse allowed without permission The copyright holder for this preprint (which was httpdxdoiorg101101080747doi bioRxiv preprint first posted online Oct 13 2016
Spike-In RNA variant controls for RNA-Sequencing bioRxiv upload 2016-10-13
21
the adjacent exonic sequences (Random DNA Sequence Generator
httpwwwfacultyucredu~mmadurorandomhtm)
To verify the sequence exclusivity first the exon sequences were blasted against the entire NCBI
database including ERCCs on the nucleotide and protein level (program BLASTN 2229
httpsblastncbinlmnihgov) The default BLAST parameters used were word size 28 expected
threshold 10 Max matches in query rang 20 MatchMismatch Score 1 -2 Gap Costs Linear Filter
Low complexity regions Mask for lookup table only Search of the nucleotide collection resulted for
all SIRVs in ldquono significant similarity foundrdquo Second in silico generated reads (Griebel t al 2012)
(FLUX-Generator httpsammethnetconfluencedisplaySIMHome command line flux-simulator
-p ~hellipFluxsirv1par -t simulator -x -l -s) were mapped to nine individually selected genomes using
TopHat2 (Kim et al 2013) and Bowtie2 (Langmead and Salzberg2012) Because Bowtie2-aligned
reads can be as short as 20 nt the resulting limited number of mapping reads would be deemed to
be not significant in standard NGS work-flows In contrast when mapping reads with the standard
setting of the splicing-aware TopHat2 program not a single read aligned to any of the tested
genomes Given that both searches found no significant matches off-target mapping of the SIRVs can
essentially be ruled out Therefore the artificial SIRV sequences are suitable for noninterfering
qualitative and quantitative assessments in the context of known genomic systems and
complementary to the ERCC sequences (National Institute of Standards and Technology (NIST)
certified DNA plasmids Standard Reference Materialreg 2374) The SIRV sequences can be found at
httpswwwlexogencomsirvssirvsdownloads in the Source Data files and they are also
deposited at the NCBI Nucleotide Database (PRJNA312485)
SIRV CONSTRUCTS AND THE PRODUCTION OF IN-VITRO TRANSCRIPTS Synthetic gene constructs
were produced (Bio Basic Inc Markham ON Canada) that comprised 5rsquo to 3rsquo a unique restriction
site a T7 RNA polymerase promoter whose 3rsquo G is the first nucleotide of the actual SIRV sequence
which is seamlessly followed by a (A30)-tail that is fused with an exclusive 2nd restriction site These
not peer-reviewed) is the authorfunder All rights reserved No reuse allowed without permission The copyright holder for this preprint (which was httpdxdoiorg101101080747doi bioRxiv preprint first posted online Oct 13 2016
Spike-In RNA variant controls for RNA-Sequencing bioRxiv upload 2016-10-13
22
gene cassettes were cloned into a vector colony-amplified and singularized All SIRV sequence in the
purified plasmids were verified by Sanger-sequencing to identify the correct clones The E coli
cultures were grown in batches to obtain plasmids in the lower microg-scale Double digestion of isolated
plasmids with XhoI and NsiI showed correct insert size and complete restriction Linearized silica-
purified plasmids served as templates in in vitro transcription reactions using T7 transcription kits
(AmpliScribe T7 High Yield Transcription Kit and AmpliScribe T7 Flash Transcription Kit Epicentre
Madison WI) The DNase-treated phenol-extracted and silica-purified in vitro transcription products
were assessed for concentration and purity by spectrophotometry (NanoDrop Thermo Fisher
Scientific Waltham MA) and for integrity by capillary electrophoresis (2100 Bioanalyzer RNA 6000
Pico Kit Agilent Technologies Santa Clara CA)
In the context of variant verification RNA integrity is a very important measure Fragments
arising from incomplete transcription might impose errors on the correct determination of variants
which share those sequences and thereby also affect the overall gene coverage The integrity of the
transcription products was very heterogeneous as expected given the broad sequence variation and
the length of the SIRV transcripts (average 11 kb with 14 RNAs between 20 and 25 kb) A majority
of transcripts therefore had to be purified by at least one of two purification methods Purification
method PP1 is selective for poly(A)-tails and neglects prematurely terminated transcription products
Purification method PP2 is based on size-selective quantitative electrophoresis separating the
correctly sized main products from shorter fragments (transcription break off and degraded
products) and longer fragments (run-through transcription products) After purification the 69 SIRV
RNAs were assessed to be on average 736plusmn343 in the pre-peak fraction 9031plusmn372 in the
main-peak fraction (corresponding to RNAs of correct length) and 236plusmn304 in the post-peak
fraction (mass percentages wt) Noteworthy the risks of a beginning degradation during the initial
denaturation (2 min at 70degC) and the not fully denaturing conditions during RNA microcapillary
electrophoresis tiny noise levels in the baseline and slightly different shapes of the main peak result
in a rather over- than underestimation of pre- and post-peak fractions
not peer-reviewed) is the authorfunder All rights reserved No reuse allowed without permission The copyright holder for this preprint (which was httpdxdoiorg101101080747doi bioRxiv preprint first posted online Oct 13 2016
Spike-In RNA variant controls for RNA-Sequencing bioRxiv upload 2016-10-13
23
rRNasin (Promega Madison WI) was added to 08 Umicrol to minimize the risks of RNase
contamination induced RNA degradation The SIRVs were quantified by absorbance spectroscopy to
adjust all stock solutions to a base concentration of close to but above 50 ngmicrol RNA purity was very
high with A 260280 214plusmn012 and A 260230 217plusmn020
SIRV MIXING SIRV mixes were designed that contain pools of SIRVs (SubMixes) in defined
amounts and ratios by combining accurate volumes of the stock solutions in sufficiently large batch
sizes Pipetting errors vary depending on transfer volumes and range from plusmn4 for 2 microl to plusmn08 for
gt100 microl transfers The precision was experimentally determined with blank solutions Starting with
the stock concentration measurement (NanoDrop accuracy plusmn2 ngmicrol for 50 ngmicrol or plusmn4 ) and
accounting for the entire mixing pathway the accumulative concentration error is expected to range
between plusmn8 and plusmn47 Therefore in the data evaluation one has to account for the experimental
fuzziness by allowing for lower accuracy thresholds of plusmn8 on the linear scale or plusmn011 on the log2-
fold scale respectively The SIRV concentration ratios between two mixes are more precise because
only one final pipetting step defines the concentration differences and synchronizes all SIRVs which
belong to the same SubMix Here a maximal error of plusmn4 (or plusmn0057 on the log2-fold scale) can be
expected between SubMixes while all SIRVs of the same SubMix must propagate coherently into the
final mixes Bioanalyzer traces were used to monitor the relative propagation of the SIRVs PreMixes
and SubMixes during the mixing (Fig 2B) In addition the accurate pipetting of the 8 PreMixes was
controlled by checksums of Nanodrop concentration measurements which deviated by only
0002plusmn34 from the calculated target concentrations and by weighing on an analytical balance
which showed a deviation of 18plusmn065 The final concentration of the SIRV mixes are set to be 253
ngmicrol
not peer-reviewed) is the authorfunder All rights reserved No reuse allowed without permission The copyright holder for this preprint (which was httpdxdoiorg101101080747doi bioRxiv preprint first posted online Oct 13 2016
Spike-In RNA variant controls for RNA-Sequencing bioRxiv upload 2016-10-13
24
SPIKING OF REFERENCE RNA WITH SIRV MIXES In general SIRV mixes can be used with crude
cell extracts purified total RNA rRNA-depleted RNA or poly(A)-enriched RNA Important the spike-in
ratios have to be chosen in concordance with the desired final SIRV content the RNA preparation
method and if known the expected mRNA content One widely applicable spike-in ratio can be
obtained by adding 006 ng of controls to approximately 100 ng of total RNA In the presented
examples the total RNA mass of one single aliquot RNA was 100 ng of UHRR in RC-0 and 1128 ng of
HBRR in RC-1 The reference RNA in RC-2 was calculated to be 10427 ng (Fig S2) The high-
concentrated and thereby stable SIRV mix stocks with 253 ngmicrol and ERCC mix stocks with 30 ngmicrol
(ERCC Spike-In Mixes 1 and 2 by Ambion Thermo Fisher Waltham MA) were diluted just prior to the
spiking to facilitate the mixing of manageable volumes For example the final 11000 dilution
reduced the SIRV mix concentration to 253 pgmicrol from which 237 microl were required to spike a 100 ng
total RNA sample with 006 ng SIRVs The RC-samples were produced in large batches to yield
hundreds of samples allowing for a protocol with fewer dilutions and larger volumes reducing
thereby sources of experimental errors
NGS LIBRARY PREPARATION AND SEQUENCING The experiments were carried out in technical
triplicates From 1 microg RC-0 RC-1 or RC-2 RNA in total nine NGS libraries were prepared by Fasteris SA
(Plan-les-Ouates CH) using the TruSeq stranded mRNA library preparation kit with polyA selection
(Illumina Inc San Diego CA) All primary library templates were amplified with 14 PCR cycles to
reach reproducible concentrations 155plusmn45 nM and insert sizes 165plusmn10 bp An equimolar lane-mix
was sequenced at the CSF Campus Science Support Facilities GmbH (CSF Vienna AUT) in PE125
mode in one lane of a HiSeq 2500 flowcell in 125 bp paired-end mode using V4 chemistry The run
yielded 305 M raw reads 293 M after demultiplexing and trimming which corresponds to a read
depth of 326plusmn22 M reads per library
not peer-reviewed) is the authorfunder All rights reserved No reuse allowed without permission The copyright holder for this preprint (which was httpdxdoiorg101101080747doi bioRxiv preprint first posted online Oct 13 2016
Spike-In RNA variant controls for RNA-Sequencing bioRxiv upload 2016-10-13
25
READ PROCESSING AND MAPPING Standard data processing routines (bbduk part of BBMap by
B Bushnell to be found at sourceforgenetprojectsbbmap) were applied removing low quality
reads and trimming adapter sequences Due to variable stringencies the mappers produced different
read statistics STAR mapped against the genome 897plusmn59 of the reads (864plusmn56 uniquely) and
TopHat2 852plusmn57 (794plusmn52 uniquely) Bowtie2 mapped against the transcriptome 693plusmn18
reads (151plusmn15 uniquely)
ESTIMATION OF THE MRNA CONTENTS Based on the obtained read distributions the relative
mass partition between external controls and endogenous RNA fraction can be estimated Because
the library preparation uses a poly(A)-enrichment step the targeted endogenous RNA corresponds
almost exclusively to the mRNA content of the samples The propagation of the input mass ratio to
the output read ratio depends on both the mRNA content and the efficiencies of how controls and
mRNA proceed through the library preparation The relationship is described by Eqn 1
reRNA times prod(1 rconifrasl )
j
i=1
= (EeRNA times meRNA) times prod(1 (Econi times mconi)frasl )
j
i=1
Equation 1
with r number of reads from eRNA the endogenous RNA fraction here mRNA and con the
controls here SIRVs and ERCC E the relative efficiency of how the fraction proceeds through the
workflow and m the input mass
Ratios are measured as relative read counts and the results as a product of efficiencies and
apparent amounts are also relative measures Therefore at least one de facto arbitrary reference
point needs to be defined to deduce comparable absolute results Several reference points or
default values can be defined which lead to different dependent variables and imply slightly variable
interpretation of the results The following three calculation examples are simple deductions from
not peer-reviewed) is the authorfunder All rights reserved No reuse allowed without permission The copyright holder for this preprint (which was httpdxdoiorg101101080747doi bioRxiv preprint first posted online Oct 13 2016
Spike-In RNA variant controls for RNA-Sequencing bioRxiv upload 2016-10-13
26
the ratio shown in Eqn 1 with the ERCC (con1) and the SIRVs (con2) respectively Variation 1 is
explained in greater detail while in the other variants only the differing aspects are highlighted
Variation 1 i) Here the first assumption is that the mRNA content in UHRR (Agilent Santa
Clara CA) is 3 (factor 003) and 2 (factor 002) in HBRR (Ambion Thermo Fisher Waltham MA)
which stays in close agreement to previous estimates concluded from experiments by Shippy et al in
2006 The amounts of total RNA were measured by Nanodrop absorbance spectroscopy The UHRR
samples contained 100 ng and the HBRR samples 1128 ng The mixing ratio of (2times RC-0) (1times RC-1)
determines the concentration of the 3rd sample RC-2 and further the amount of total RNA (10427
ng) as well as its related mRNA content (2times100 ng times 3 + 1times1128 ng times 2 ) (2times100 ng + 1times1128
ng) = 264 (factor 0026) The mRNA masses of the samples are calculated by the measured total
RNA input amounts and default mRNA contents are 3 ng 2256 ng and 2752 ng The second
assumption is that the endogenous mRNAs proceed with the maximal efficiency of 100 (factor 1)
through library preparation and sequencing The input of the spike-in controls is the product of the
concentration values which were either measured as in the case of the SIRV stocks or stated by the
vendor as in the case of the ERCC stocks and the pipetted volumes Both are treated as de facto
measured values
ii) The relative amounts of reads which have been assigned to either endogenous mRNA
ERCCs or SIRVs are obtained from the mapping statistics (read classification)
iii) The ratio of mass input to reads output allows to calculate the propagation efficiency of
the controls relative to the default efficiency of the endogenous mRNA In the present experiment
the SIRVs progress with a relative efficiency of 867plusmn57 and the ERCCs with 416plusmn47 The
significant difference between the relative efficiency of both controls is very likely caused by the
different lengths of the poly(A)-tails which might influence a different binding efficiency during
poly(A)-enrichment step The SIRVs with a 30 nt long poly(A)-tail perform much more in concordance
with the endogenous mRNA as the ERCCs which contain shorter and variable poly(A)-tails ( 23 nt)
The observed small differences in the experiments using RC-0 RC-1 or RC-2 could be caused by a
not peer-reviewed) is the authorfunder All rights reserved No reuse allowed without permission The copyright holder for this preprint (which was httpdxdoiorg101101080747doi bioRxiv preprint first posted online Oct 13 2016
Spike-In RNA variant controls for RNA-Sequencing bioRxiv upload 2016-10-13
27
two-way interference of samples and controls However the deviations are small and can rather be a
result of minor inaccuracies in determining the relative input amounts Both hypotheses would need
to be verified by a series of repeats with the aim to resolve potential influences of pipetting during
the sample preparation variations in the library preparation and other contributions
Variation 2 Here no varying interferences between samples and controls are permitted
which means that relative efficiencies of the controls are considered to be constant The causes of
the experimental variations are exclusively assigned to the input amounts (alike hypothesis two in
the above example in discussing the deviation of the results in RC-2) This would translate into input
standard deviations of 118 (SIRVs) and 76 (ERCCs) The variations meld all accumulating errors
made in determining the concentration of the control stock solutions preparing the subsequent
dilutions pipetting the samples and controls during the spike-in step itself as well as determining the
amount of sample RNA in the first place Against the background of potential errors the calculated
results can be considered as highly consistent
Variation 3 In addition to the assumptions made for the measurement of sample RC-0
the spike-in of 006 ng SIRVs to all samples is also set as default Alike variation 2 the experiments in
RC-1 and RC-2 adopt the same default setting for the relative efficiencies calculated in RC-0
According to the ratio of Eqn 1 one can obtain mRNA contents as well as ERCC input amounts in this
case for samples RC-1 and RC-2 The mRNA content of the HBRR sample (RC-1) relative to the default
mRNA content in the UHRR sample (set to 3 ) would be 172 lower than the previously assumed
2 According to the present mixing scheme it would also imply that sample RC-2 has an mRNA
content of 254 up from the calculated 234 The offsets of -79 is again small and very likely
refers to the level of accuracy in the experimental results as discussed above Using this method the
spiking of samples with controls such as the SIRVs allows to closely estimate the relative mRNA
content of any unknown sample and to draw conclusions eg on the transcriptional state of tissues
cell suspension or individual cells
not peer-reviewed) is the authorfunder All rights reserved No reuse allowed without permission The copyright holder for this preprint (which was httpdxdoiorg101101080747doi bioRxiv preprint first posted online Oct 13 2016
Spike-In RNA variant controls for RNA-Sequencing bioRxiv upload 2016-10-13
28
COEFFICIENT OF DEVIATION We implemented a strand specific Coefficient of Deviation
(CoD) which aims to reflect the quality of NGS pipelines targeted at specific effects in particular
lsquospikenessrsquo of the coverage while systematic effects like drop of the coverage at Transcription Start
Sites (TSS) and Transcription End Sites (TES) are being suppressed The CoD is implemented by Eqn
2
CoD = CoD(LTSSLTES) = sum (cidealp- crealp)2
TESe
p=TSS1
divide sum cidealp
TESe
p=TSS1
Equation 2
which is calculated in strand orientation for contigs along all exonic nucleotide position (p) from the
first annotated TSS (TSS1) up to the last annotated TES (TESe) whereby cideal are the ideal coverages
with the optimized transient regions (LrsquoTSS LrsquoTES) and creal are the real coverages scaled as such that
the total integrals along all positions of ideal and real coverages are equal
The transient function at TSS and TES is the error function erf(x) which corresponds to
Cufflinks assumption about normally distributed fragment lengths (Trapnell et al 2012) Since erf(x)
is a non-algebraic function we used the algebraic approximation by Abramowitz and Stegun
(httpsenwikipediaorgwikiError_function eq 7125) Once the optima (LrsquoTSS LrsquoTES ) are found
we declare CoD(LrsquoTSS LrsquoTES) to be the ultimate CoD value which mostly eliminated the transient region
effects We implemented an optimization algorithm (Nelder-Mead downhill simplex method) and
used as starting values (L0TSS L0
TES ) lengths of 150 In some cases the optimum found can be beyond
a reasonable range of values Therefore we censor the output Lopt of the mathematical optimization
as follows Lcensored = 50 if Lrsquo lt 50 Lcensored = 350 if Lrsquo gt 350 This corresponds to the maximal range of
not peer-reviewed) is the authorfunder All rights reserved No reuse allowed without permission The copyright holder for this preprint (which was httpdxdoiorg101101080747doi bioRxiv preprint first posted online Oct 13 2016
Spike-In RNA variant controls for RNA-Sequencing bioRxiv upload 2016-10-13
29
200plusmn150 This censoring needed to be applied in 8 cases out of 84 SIRVmixstrandend
combinations ie less than in 10
TRANSCRIPT CONCENTRATION MEASUREMENTS In order to estimate expression values on
transcript levels we applied RSEM (Li and Dewey 2011) which uses a Bayesian Network to compute
the likelihood of each fragment belonging to a given transcript Salmon (Patro et al 2015) estimates
the transcript expression values by a k-mer based mapping Similar to RSEM it uses an expectation-
maximization (EM) algorithm to compute the maximum likelihood of relative abundances Cufflinks2
(Trapnell et al 2013) estimates the transcript abundances with a coverage-based maximum
likelihood approach It determines the probability of read assignments to isoforms
DIFFERENTIAL EXPRESSION ANALYSIS We used the DESeq2 package (Love et al 2014) for
calculation of fold-differences between the results from different pipelines and different input samples
mixtures As explained in the main text all outputs from the evaluated pipelines (in form of relative
concentration measures) have been scaled Scaling by linear transformation is needed as a
consequence of the different mRNA contents in the samples but also to eventually compensate any
potential pipetting errors when small aliquots typically in the range of very few microliter are added
to individual samples The RC-samples in this experiment were produced in a large batch to ensure
high accuracy in volumetric ratios The main sample pool is practically invariant to the small relative
contribution of the controls but was technically treated in the same way by scaling the main sample
pools to identical sizes First SIRV concentrations were scaled to reach together 69 in E0 685 in E1
and 708 in E2 which is the dimensionless value identical to the fmolmicrol in the respective SIRV stock
solutions Then the lower threshold was set to 10-6 which corresponds to original FPKM values of
around 5∙10-3 ⅟7th of one read for a 1 kb long transcript at a read depth of 30 Mio reads or 1 gene
specific read to be divided between 7 equally possible transcript variants at said 1 kb length section
The threshold is to be understood as less than or equal to 10-6 which defines an averaged read
not peer-reviewed) is the authorfunder All rights reserved No reuse allowed without permission The copyright holder for this preprint (which was httpdxdoiorg101101080747doi bioRxiv preprint first posted online Oct 13 2016
Spike-In RNA variant controls for RNA-Sequencing bioRxiv upload 2016-10-13
30
resolution of the particular workflow at the given read depth By these means all ratios remain defined
Second for the DESeq2 calculations we multiplied all values with 106 after which fractions were
rounded to the closest integer We understand that for no-change hypothesis testing which is the
main purpose of the DESeq2 package transforming the relative concentrations (FPKM or TPM) to
lsquoquasi-read-countsrsquo is not recommended since DESeq2 internally corrects for library size by using size
factors However in our application we do not use the probability of the hypothesis rejection (P
values) but the raw fold changes detected (irrespectively of the dispersion values for that given
transcript) We also took into account the potential danger of censoring the input (by unintentionally
eliminating transcripts represented by extremely low FPKM or TPM values) by setting a suitable
threshold as described above The figures show only two differential expression analyses because the
3rd concentration ratio E2E0 is the product of E1E0 and E2E1
ERROR RATE ANALYSIS The four red data points two from the SIRV controls (circles) and two
from the endogenous mRNAs (squares) from the best agreement (P3 vs P1) and the four
corresponding black data points from the worst agreement (P4 vs P2) as shown in fig 5E were fitted
by linear approximation using the relationship as derived for Eqn 3
TP + FP = 1
FP = N times ER = (1-TP) times ER
(TP+FP) = TP + ER - TP times ER
(TP+FP) = (1-ER) times TP + ER Equation 3
where TP is the relative portion of true positives (differentially expressed as in our definition
possessing a LFC gt 1) N the relative portion of negatives ER the error rate at which negatives are
falsely detected as positives to result in false positives FP The least squares fitting method was
applied to derive values for the slope (1-ER) and the intercept ER
not peer-reviewed) is the authorfunder All rights reserved No reuse allowed without permission The copyright holder for this preprint (which was httpdxdoiorg101101080747doi bioRxiv preprint first posted online Oct 13 2016
Spike-In RNA variant controls for RNA-Sequencing bioRxiv upload 2016-10-13
31
The transformation of Eqn 3 leads to the relationship of Eqn 4
TP FPfrasl = (TP+FP) TPfrasl -1 Equation 4
which has been used for the graph in fig 5F In the present context the concept of ROC-curves is not
applicable because the true or false negatives are indistinguishable as long the ground truth of the
endogenous RNA are unknown
DATA ACCESS Sequencces and source data files data are in the process to be deposited at
NCBI under BioProject ID PRJNA312485
ACKNOWLEDGMENTS We thank SA Munro and M Salit (Material Measurement
Laboratory National Institute of Standards and Technology) for their efforts in further developing the
concepts of the External RNA Control Consortium (ERCC) in an updated suite of RNA controls and
analysis methods called ERCC 20 We thank A Tuerk for his contributions in finding suitable human
model genes G Wiktorin for carrying out the RSEM calculations M Mihaylova in helping with the
graphics design and I Gabler for critically reading the manuscript
AUTHOR CONTRIBUTIONS LP PK and TR designed the sequences and mixtures PK and GH
prepared the in vitro transcripts and spike-in mixtures TR AS and LP designed the research and
the experiments MA IH and TR evaluated the data TR and LP wrote the manuscript
DISCLOSURE DECLARATION The authors are employees of Lexogen GmbH from which the SIRVs
can be bought and AS has equity stakes in Lexogen GmbH LP PK and TR are named as
not peer-reviewed) is the authorfunder All rights reserved No reuse allowed without permission The copyright holder for this preprint (which was httpdxdoiorg101101080747doi bioRxiv preprint first posted online Oct 13 2016
Spike-In RNA variant controls for RNA-Sequencing bioRxiv upload 2016-10-13
32
inventors on a patent application regarding the production and use of RNA transcript variants and
Lexogen GmbH is the owner of this patent application
REFERENCES
Baker SC Bauer SR Beyer RP Brenton JD Bromley B Burrill J Causton H Conley MP Elespuru R Fero M et al 2005 The External RNA Controls Consortium a progress report Nat Methods 2(10) 731-4 Bokar JA Rottman FM 1998 Biosynthesis and Functions of Modified Nucleosides in Eukaryotic mRNA In Modification and Editing of RNA (eds Grosjean H Benne R) pp 183-200 ASM Press Washington DC Dobin A Davis CA Schlesinger F Drenkow J Zaleski C Jha S Batut P Chaisson M Gingeras TR 2013 STAR ultrafast universal RNA-seq aligner Bioinformatics 29(1) 15-21 Fed Reg Doc 2015-19742 2015 External RNA Controls Consortium - Call for Participation and Contributions to a Sequence Library Federal Register Citation 80 FR 48296 Griebel T Zacher B Ribeca P Raineri E Lacroix V Guigoacute R Sammeth M 2012 Modelling and simulating generic RNA-Seq experiments with the flux simulator Nucleic Acids Res 40(20) 10073-83 Jiang L Schlesinger F Davis CA Zhang Y Li R Salit M Gingeras TR Oliver B 2011 Synthetic spike-in standards for RNA-seq experiments Genome Res 21(9) 1543-51 Kim D Pertea G Trapnell C Pimentel H Kelley R Salzberg SL 2013 TopHat2 accurate alignment of transcriptomes in the presence of insertions deletions and gene fusions Genome Biol 14(4) R36 Kratz A Carninci P 2014 The devil in the details of RNA-seq Nat Biotechnol 32(9) 882-4 Lahens NF Kavakli IH Zhang R Hayer K Black MB Dueck H Pizarro A Kim J Irizarry R Thomas RS et al 2014 IVT-seq reveals extreme bias in RNA sequencing Genome Biol 15(6) R86 Langmead B Salzberg SL 2012 Fast gapped-read alignment with Bowtie 2 Nat Methods 9(4) 357-9 Li B Dewey CN 2011 RSEM accurate transcript quantification from RNA-Seq data with or without a reference genome BMC Bioinformatics 12 323 Li J Jiang H Wong WH 2010 Modeling non-uniformity in short-read rates in RNA-Seq data Genome Biol 11 R50 Li S Tighe SW Nicolet CM Grove D Levy S Farmerie W Viale A Wright C Schweitzer PA Gao Y et al 2014 Multi-platform assessment of transcriptome profiling using RNA-seq in the ABRF next-generation sequencing study Nat Biotechnology 32 915-25 Love MI Huber W Anders S 2014 Moderated estimation of fold change and dispersion for RNA-seq data with DESeq2 Genome Biol 15(12) 550
not peer-reviewed) is the authorfunder All rights reserved No reuse allowed without permission The copyright holder for this preprint (which was httpdxdoiorg101101080747doi bioRxiv preprint first posted online Oct 13 2016
Spike-In RNA variant controls for RNA-Sequencing bioRxiv upload 2016-10-13
33
Mortazavi A Williams BA McCue K Schaeffer L Wold B 2008 Mapping and quantifying mammalian transcriptomes by RNA-Seq Nat Methods 5(7) 621-8 Patro R Duggal G Kingsford C 2015 Accurate fast and model-aware transcript expression quantification with Salmon bioRxiv preprint doi httpdxdoiorg101101021592 Shippy R Fulmer-Smentek S Jensen RV Jones WD Wolber PK Johnson CD Pine PS Boysen C Guo X Chudin E et al 2006 Using RNA sample titrations to assess microarray platform performance and normalization techniques Nat Biotechnol 24(9) 1123-31 SEQCMAQC-III Consortium 2014 A comprehensive assessment of RNA-seq accuracy reproducibility and information content by the Sequencing Quality Control Consortium Nat Biotechnology 32 903-14 Tembe WD Pond SJ Legendre C Chuang HY Liang WS Kim NE Montel V Wong S McDaniel TK Craig DW Carpten JD 2014 Open-access synthetic spike-in mRNA-seq data for cancer gene fusions BMC Genomics 15 824 Trapnell C Roberts A Goff L Pertea G Kim D Kelley DR Pimentel H Salzberg SL Rinn JL Pachter L 2012 Differential gene and transcript expression analysis of RNA-seq experiments with TopHat and Cufflinks Nat Protoc 7(3) 562-78 Trapnell C Hendrickson DG Sauvageau M Goff L Rinn JL Pachter L 2013 Differential analysis of gene regulation at transcript resolution with RNA-seq Nat Biotechnol 31(1) 46-53 van Dijk EL Jaszczyszyn Y Thermes C 2014 Library preparation methods for next-generation sequencing tone down the bias Exp Cell Res 322(1) 12-20 Wang Z Gerstein M Snyder M 2009 RNA-Seq a revolutionary tool for transcriptomics Nat Rev Genet 1 57-63 Zheng W Chung LM Zhao H 2011 Bias detection and correction in RNA-Sequencing data BMC Bioinformatics 12290
not peer-reviewed) is the authorfunder All rights reserved No reuse allowed without permission The copyright holder for this preprint (which was httpdxdoiorg101101080747doi bioRxiv preprint first posted online Oct 13 2016
Spike-In RNA variant controls for RNA-Sequencing bioRxiv upload 2016-10-13
12
The above described four data analysis pipelines P1 to P4 were used to calculate transcript
abundances for 69 SIRV and 196˙165 annotated endogenous transcripts All obtained results are
relative concentration measures yielding either Fragments Per Kilobase of exon per Million
fragments mapped (FPKM) (Mortazavi 2008) or Transcripts Per Million (TPM) (Li and Dewey 2011)
The concentrations were scaled by linear transformation in such way that all SIRVs together reach 69
in E0 685 in E1 and 708 in E2 which is the dimensionless value identical to the fmolmicrol in the
respective SIRV stock solutions In consequence the relative quantities of the SIRVs are compatible
to the normalized scale which was introduced in Fig 2C Boxplots in Fig 4 show exemplarily the SIRV
concentrations and two discrete differentials as measured by P3 (results from P1 P2 and P4 are
shown in suppl Fig S17 and standard correlation plots of the four pipelines are shown in suppl Fig
S18) The majority of all SubMix mean concentration values are in concordance with the expected
values The concentration ratios simulating differential expression measurements are less prone to
systematic offsets and show by trend narrower distributions However these correlations highlight
already the issue of obvious and frequent outliers ie transcript variants that are not well resolved
not peer-reviewed) is the authorfunder All rights reserved No reuse allowed without permission The copyright holder for this preprint (which was httpdxdoiorg101101080747doi bioRxiv preprint first posted online Oct 13 2016
Spike-In RNA variant controls for RNA-Sequencing bioRxiv upload 2016-10-13
13
Figure 4 ǀ Box plot overview of calculated concentration values for SIRV mixes and mix ratios
Reads from SIRV mixes E0 E1 and E2 were processed by four different data evaluation algorithms for
transcript quantification Results derived by pipeline P3 are exemplarily shown in reference to the
known inputs (bars in colors corresponding to the SIRV SubMixes of Fig 2) The black circles mark the
mean and the bold dashes the medians of the data points which are shown in grey the boxes span
the 25 to 75 region of the data points and the black whiskers with connecting lines reach up to the
min and max values and indicate also outliers outside the scale of the graph The comparison E1 vs
E0 from sample RC-1 and RC-0 (2nd row) was used for building the histogram of Fig 5B The shaded
area resembles the 1st bin (0leǀLFCǀle1) while the inner section (b1) comprises the fraction 0leǀLFCǀlt05
where the majority of data points originates from SubMix4 (ratio 11) and some ldquooutliersrdquo from
SubMix2 which were actually spiked in at the ratio 21
Heat maps allow to inspect each SIRV in the context of competing transcripts Tab 1B shows
the abundancies as log2-fold changes LFC relative to the expected values for the example of SIRV 6
LFC values consider relative increases and decreases across all concentration ranges likewise An LFC
window of plusmn011 presents the confidence interval as a result from the currently achievable accuracy
not peer-reviewed) is the authorfunder All rights reserved No reuse allowed without permission The copyright holder for this preprint (which was httpdxdoiorg101101080747doi bioRxiv preprint first posted online Oct 13 2016
Spike-In RNA variant controls for RNA-Sequencing bioRxiv upload 2016-10-13
14
in producing the SIRV mixtures We examine the LFC values uncoupled from the adjusted p-values
which provide a statistical measure of the significance level for apparent differential expression By
these means we prevent pipelines to appear more coherent only due to higher noise levels The
accuracy has been calculated for each SIRV as the mean of the LFCs in all three mixes The precision is
a measure of how consistent SIRVs are quantified and has been calculated as the LFC standard
deviation for each SIRV and further for entire pipelines by using all SIRVs Within the presented
example SIRVs can obtain in all four pipelines high precisions of up to 018plusmn007 and high accuracies
of up to -001plusmn010 (SIRV604) In contrast SIRV612 of similar length has an average precision of
569plusmn368 and an accuracy of -386plusmn270 although it was detected by P2 with a high precision of 012
at an accuracy of 018 This quantification of differences between pipelines now directly permits to
assess the effect of changes in workflows and individual experiments
COMPARISON BETWEEN DIFFERENT WORKFLOWS When ranking the four pipelines by said precision P3
gives the lowest value with 129 followed by P4 with 164 P1 with 198 and P2 with 214 However
a sample-specific global target-performance comparison is not the strongest criteria for evaluating
performance differences at transcript resolution For this purpose the apparent differential
expression shows if similar errors are caused by the same or different transcripts The highest
concordance was found between P3 and P1 (labelled P3P1) calculated as standard deviation of all
SIRV LFCs with 101 followed by P4P3 (104) P4P1 (255) P2P1 (288) and P3P2 (309) The
lowest concordance has P4P2 with a value of 412 One section of the resulting heat map for both
extremes is shown in Tab 1C
not peer-reviewed) is the authorfunder All rights reserved No reuse allowed without permission The copyright holder for this preprint (which was httpdxdoiorg101101080747doi bioRxiv preprint first posted online Oct 13 2016
Spike-In RNA variant controls for RNA-Sequencing bioRxiv upload 2016-10-13
15
Table 1 ǀ Variance heat map of SIRV concentration measures detailing SIRV6 by the 4 different
pipelines P1 to P4 A) Given are SIRV transcript identifier SubMix (SM) color code and transcript
lengths (in nucleotides) B) Heat maps showing the log-fold changes (LFC) for the comparison of the
normalized expected and measured SIRV concentrations as a result from the four data evaluation
pipelines P1 to P4 evaluating E0 E1 and E2 Fields with -1 le LFC le 1 are filled with gradient green all
fields with LFC lt -1 with straight blue and all fields with LFC gt 1 with straight red C) From all 6
possible pairwise comparisons P2P1 P3P1 to P4P3 of the normalized measured SIRV
concentrations the one with the smallest (P3P1) and largest (P4P2) median of all LFC are shown
The complete heat map is shown in the suppl Tab S2
not peer-reviewed) is the authorfunder All rights reserved No reuse allowed without permission The copyright holder for this preprint (which was httpdxdoiorg101101080747doi bioRxiv preprint first posted online Oct 13 2016
Spike-In RNA variant controls for RNA-Sequencing bioRxiv upload 2016-10-13
16
The same pipeline comparisons were made with either all endogenous transcripts or the ones in the
higher SIRV expression range and compared to the pipeline concordances calculated with the SIRV
controls (Fig 5) We define the first bin with ǀLFCǀ lt 1 as the bin of no apparently differentially
expressed transcripts independent of the corresponding p-values The other bins contain transcripts
for which the calculated concentrations differ by more than 2-fold hence convene apparently
differentially expressed transcripts (DE) We find that SIRV controls and endogenous transcripts are
evaluated coherently While theoretically no differences are expected pipelines P3 and P1 differ in
their quantification of the same data by 44 for the SIRVs and by 69 for endogenous RNAs in the
SIRV concentration range (Fig 5A) Pipelines P2 and P4 differ to a larger extent when evaluating the
same samples (Fig 5B C) The same correlation is seen in comparisons between different samples
(shown here for RC-0 vs RC-1) The expected DE between reference RNAs UHRR and HBRR of
approximately 50 is evaluated differently by P3 vs P1 (DE of 24 ) and this is mirrored in the
evaluation of the SIRV mixes spiked into these reference RNAs (DE of 49 ) P4 vs P2 performed
worse with a pipeline difference of 39 and 103 for endogenous and SIRV transcripts The
controls show a highly similar increase when comparing P3P1 with P4P2 (21-fold from 49 to
103 ) to the endogenous RNAs (16-fold from 24 to 39 ) Here the average measurement
using the same pipeline provide a pseudo-ground truth which is compared to the measurement
using different pipelines It allows to quantify the additional error caused solely by changes in the
pipeline A change from pipeline P3 to P1 would increase the number of DE-detected transcripts to a
smaller extent than a change from P2 to P4 and this is true for both the SIRV controls and the
endogenous transcripts
not peer-reviewed) is the authorfunder All rights reserved No reuse allowed without permission The copyright holder for this preprint (which was httpdxdoiorg101101080747doi bioRxiv preprint first posted online Oct 13 2016
Spike-In RNA variant controls for RNA-Sequencing bioRxiv upload 2016-10-13
17
Figure 5 ǀ SIRV and endogenous mRNA expression analyses are affected similarly when changing
data evaluation pipelines Binned apparent LFC-moduli are shown in histograms when comparing
results obtained by different pipelines evaluating identical NGS data sets from A C) the same
samples or B D) different samples Exemplarily the comparison with the best P3 vs P1 (black
symbols) and the worst agreement P4 vs P2 (red symbols) are shown The charts compare side-by-
side the results from the SIRV controls (green) all endogenous transcripts (black outline) and
endogenous transcripts within the medium-to-high concentration range of 10 to 2250 TPM or FPKM
(blue) The average of all intra-pipeline results are shown in grey The differences Δ between
not peer-reviewed) is the authorfunder All rights reserved No reuse allowed without permission The copyright holder for this preprint (which was httpdxdoiorg101101080747doi bioRxiv preprint first posted online Oct 13 2016
Spike-In RNA variant controls for RNA-Sequencing bioRxiv upload 2016-10-13
18
analyses with the same and with different pipelines show the losses in the bins 0 lt ǀLFCǀ lt 1 and the
corresponding gain in the other bins ǀLFCǀ gt 1 The increase of the FP-rate purely caused by the
pipeline changes vs the TP range is given in the summary graphs E and F) The 1st bins 0 lt ǀLFCǀ lt 1
are divided into two 0 lt ǀLFCǀ lt 05 and 05 lt ǀLFCǀ lt 1 which facilitates the easier tracking of the
results from the SubMixes4 as shown in Fig 4 were in both figures the 1st fraction is signed with 1b
DISCUSSION
We report a significant contribution to the external RNA controls toolbox in the form of Spike-In RNA
Variants (SIRVs) that address transcription variation and alternative splicing The highly defined mixes
of 69 transcripts aligning to 7 genes enable accurate target-performance evaluations of gene
expression analysis methods which is not possible eg by analyzing larger but only loosely defined
pools of in vitro transcripts (Lahens et al 2014) or limited sets addressing special problems like
fusion genes (Tembe et al 2014) The results presented here demonstrate that the condensed
complexity of the SIRV controls mimic very closely main properties of endogenous mRNAs when
analyzing high-throughput RNA sequencing workflows for their capabilities to determine transcript
variants and their relative quantities The responses of the SIRV controls to changes in the workflows
allow to extrapolate measures for the accuracy precision and foremost inter-experiment
comparability (concordance) to the large pool of endogenous RNAs With the help of the external
controls we could confirm that biases in sequence coverage could mostly be balanced by the
exemplary chosen data evaluation algorithms and for the majority of transcripts consistent relative
abundances were obtained However in our most concordant same sample pipeline comparison
P3P1 already 44 of the controls and 69 of the endogenous RNAs in the medium to high
concentration range appeared to be differentially expressed although none of those were true
positives (TP) because the reductio ad absurdum same sample comparison was using the very same
sets of NGS reads In consequence more than 700 potential endogenous mRNA leads would be non-
validatable false positives (FP) only because of a change in data evaluation pipelines With a
not peer-reviewed) is the authorfunder All rights reserved No reuse allowed without permission The copyright holder for this preprint (which was httpdxdoiorg101101080747doi bioRxiv preprint first posted online Oct 13 2016
Spike-In RNA variant controls for RNA-Sequencing bioRxiv upload 2016-10-13
19
difference between P4 and P2 of 12 at the level of endogenous RNAs an extra 1200 FPs would
obscure the evaluation
The inter-sample comparison between UHRR and HBRR presents a rather extreme case
where around half of all transcripts were calculated to differ by more than 2-fold However the
relative FPTP weight of both comparisons remains similar as P4P2 shows again clearly higher FP-
rates in both controls and endogenous RNAs The linear interpolation (Fig 5E) allows to estimate the
effect of the experimental changes to relative small number of differences as they would be seen in
typical RNA-Seq experiments Exemplarily highlighted are the intersections at 002 and 01 in Fig 5F
TP call rates and FPTP ratios are the important figures to estimate the likelihood and inversely
related effort to validate differentially expressed transcripts For the P3P1 comparison at 2 TP we
approximate an FPTP ratio of 289 The likelihood to actually validate DE transcripts under such
circumstances would reach 035 For the P4P2 comparison the TPFP ratio estimates to mere 014
The related risks and often substantial costs for deducing potential biomarkers would be 25 times
higher Although we demonstrated in the presented example the influence of changes in data
evaluation pipeline within an integrated RNA-Seq workflow the same principles apply to the front
end - the RNA treatment NGS library preparation and sequencing Here unintended variations in
particular sample preparations can only be detected by these external spike-in controls which
operate as markers and reference spots By these means SIRV controls increase the comparability
within and between sequencing experiments at the transcript isoform level SIRVs are designed for
the co-development improvement and monitoring of library preparations sequencing and data
processing
Outlook The presented module and the 92 ERCCs which probe the wide dynamic range using
monocistronic transcripts can be stepwise extended in the future by a) ca 15 poly(A)-tail variations
of monocistronic sequences with defined lengths of 20 and 30 adenosines as well as polyadenylated
and purified RNAs with poly(A)-tail lengths close to 50 100 and above 200 nucleotides b) around 12
above-average long RNAs with 3 5 7 and 10 kb c) approx 3 RNAs each with a low medium and
not peer-reviewed) is the authorfunder All rights reserved No reuse allowed without permission The copyright holder for this preprint (which was httpdxdoiorg101101080747doi bioRxiv preprint first posted online Oct 13 2016
Spike-In RNA variant controls for RNA-Sequencing bioRxiv upload 2016-10-13
20
high GC-content d) a set of 13 mRNA relevant chemical modifications most prominent the cap-
structure (Bokar and Rottman 1998) e) variants which cover aspects of SNPs alleles inversions and
fusion genes which needs to be accounted for in the corresponding sequence annotation files and f)
a random set of small and micro RNAs that comprise all sequence variations at their termini to
account for ligation biases The external control modules need to be fine-tuned with respect to the
dynamic concentration and concentration ratio range and the reference annotations must provide a
mixture of correctly over- and under-annotated genes to better emulate the challenging conditions
for bioinformatical data evaluation Both optimizations will also further increase the congruence of
the presented SIRV module with the endogenous RNAs Eventually all modules together would
develop into a comprehensive set of approximately 250 long RNA controls plus a microRNA module
which will become sufficient for calibration and normalization purposes This new estimate reduces
the scope of designing better spike-in controls compared to the maybe thousands of IVTs which have
been previously anticipated (Kratz and Carninci 2014)
METHODS
SIRV DESIGN AND IN SILICO ANALYSIS The gene structures of seven human model genes
(KLK5 LDHD LGALS17A DAPK3 HAUS5 USF2 and TESK2) were used as scaffold for the design of
SIRV1 to SIRV7 The ENCODE-annotated transcripts as well as added variants were edited to
represent in a redundant and comprehensive manner known transcription and alternative splicing
variations (complete gene structures are shown in the odd-numbered suppl Fig from S3 to S15) All
exon sequences descend from a pool of database-derived genomes (gene fragments from viruses
and bacteriophage capsid proteins and glycoproteins selected based on a GC-content in a range of
30-50) which were modified by inverting the sequence to lose identity while maintaining a kind of
naturally occurring order in the sequences Intron sequences that do not align with exons of another
isoform were drawn from random sequences whereby the GC content was balanced to comply with
not peer-reviewed) is the authorfunder All rights reserved No reuse allowed without permission The copyright holder for this preprint (which was httpdxdoiorg101101080747doi bioRxiv preprint first posted online Oct 13 2016
Spike-In RNA variant controls for RNA-Sequencing bioRxiv upload 2016-10-13
21
the adjacent exonic sequences (Random DNA Sequence Generator
httpwwwfacultyucredu~mmadurorandomhtm)
To verify the sequence exclusivity first the exon sequences were blasted against the entire NCBI
database including ERCCs on the nucleotide and protein level (program BLASTN 2229
httpsblastncbinlmnihgov) The default BLAST parameters used were word size 28 expected
threshold 10 Max matches in query rang 20 MatchMismatch Score 1 -2 Gap Costs Linear Filter
Low complexity regions Mask for lookup table only Search of the nucleotide collection resulted for
all SIRVs in ldquono significant similarity foundrdquo Second in silico generated reads (Griebel t al 2012)
(FLUX-Generator httpsammethnetconfluencedisplaySIMHome command line flux-simulator
-p ~hellipFluxsirv1par -t simulator -x -l -s) were mapped to nine individually selected genomes using
TopHat2 (Kim et al 2013) and Bowtie2 (Langmead and Salzberg2012) Because Bowtie2-aligned
reads can be as short as 20 nt the resulting limited number of mapping reads would be deemed to
be not significant in standard NGS work-flows In contrast when mapping reads with the standard
setting of the splicing-aware TopHat2 program not a single read aligned to any of the tested
genomes Given that both searches found no significant matches off-target mapping of the SIRVs can
essentially be ruled out Therefore the artificial SIRV sequences are suitable for noninterfering
qualitative and quantitative assessments in the context of known genomic systems and
complementary to the ERCC sequences (National Institute of Standards and Technology (NIST)
certified DNA plasmids Standard Reference Materialreg 2374) The SIRV sequences can be found at
httpswwwlexogencomsirvssirvsdownloads in the Source Data files and they are also
deposited at the NCBI Nucleotide Database (PRJNA312485)
SIRV CONSTRUCTS AND THE PRODUCTION OF IN-VITRO TRANSCRIPTS Synthetic gene constructs
were produced (Bio Basic Inc Markham ON Canada) that comprised 5rsquo to 3rsquo a unique restriction
site a T7 RNA polymerase promoter whose 3rsquo G is the first nucleotide of the actual SIRV sequence
which is seamlessly followed by a (A30)-tail that is fused with an exclusive 2nd restriction site These
not peer-reviewed) is the authorfunder All rights reserved No reuse allowed without permission The copyright holder for this preprint (which was httpdxdoiorg101101080747doi bioRxiv preprint first posted online Oct 13 2016
Spike-In RNA variant controls for RNA-Sequencing bioRxiv upload 2016-10-13
22
gene cassettes were cloned into a vector colony-amplified and singularized All SIRV sequence in the
purified plasmids were verified by Sanger-sequencing to identify the correct clones The E coli
cultures were grown in batches to obtain plasmids in the lower microg-scale Double digestion of isolated
plasmids with XhoI and NsiI showed correct insert size and complete restriction Linearized silica-
purified plasmids served as templates in in vitro transcription reactions using T7 transcription kits
(AmpliScribe T7 High Yield Transcription Kit and AmpliScribe T7 Flash Transcription Kit Epicentre
Madison WI) The DNase-treated phenol-extracted and silica-purified in vitro transcription products
were assessed for concentration and purity by spectrophotometry (NanoDrop Thermo Fisher
Scientific Waltham MA) and for integrity by capillary electrophoresis (2100 Bioanalyzer RNA 6000
Pico Kit Agilent Technologies Santa Clara CA)
In the context of variant verification RNA integrity is a very important measure Fragments
arising from incomplete transcription might impose errors on the correct determination of variants
which share those sequences and thereby also affect the overall gene coverage The integrity of the
transcription products was very heterogeneous as expected given the broad sequence variation and
the length of the SIRV transcripts (average 11 kb with 14 RNAs between 20 and 25 kb) A majority
of transcripts therefore had to be purified by at least one of two purification methods Purification
method PP1 is selective for poly(A)-tails and neglects prematurely terminated transcription products
Purification method PP2 is based on size-selective quantitative electrophoresis separating the
correctly sized main products from shorter fragments (transcription break off and degraded
products) and longer fragments (run-through transcription products) After purification the 69 SIRV
RNAs were assessed to be on average 736plusmn343 in the pre-peak fraction 9031plusmn372 in the
main-peak fraction (corresponding to RNAs of correct length) and 236plusmn304 in the post-peak
fraction (mass percentages wt) Noteworthy the risks of a beginning degradation during the initial
denaturation (2 min at 70degC) and the not fully denaturing conditions during RNA microcapillary
electrophoresis tiny noise levels in the baseline and slightly different shapes of the main peak result
in a rather over- than underestimation of pre- and post-peak fractions
not peer-reviewed) is the authorfunder All rights reserved No reuse allowed without permission The copyright holder for this preprint (which was httpdxdoiorg101101080747doi bioRxiv preprint first posted online Oct 13 2016
Spike-In RNA variant controls for RNA-Sequencing bioRxiv upload 2016-10-13
23
rRNasin (Promega Madison WI) was added to 08 Umicrol to minimize the risks of RNase
contamination induced RNA degradation The SIRVs were quantified by absorbance spectroscopy to
adjust all stock solutions to a base concentration of close to but above 50 ngmicrol RNA purity was very
high with A 260280 214plusmn012 and A 260230 217plusmn020
SIRV MIXING SIRV mixes were designed that contain pools of SIRVs (SubMixes) in defined
amounts and ratios by combining accurate volumes of the stock solutions in sufficiently large batch
sizes Pipetting errors vary depending on transfer volumes and range from plusmn4 for 2 microl to plusmn08 for
gt100 microl transfers The precision was experimentally determined with blank solutions Starting with
the stock concentration measurement (NanoDrop accuracy plusmn2 ngmicrol for 50 ngmicrol or plusmn4 ) and
accounting for the entire mixing pathway the accumulative concentration error is expected to range
between plusmn8 and plusmn47 Therefore in the data evaluation one has to account for the experimental
fuzziness by allowing for lower accuracy thresholds of plusmn8 on the linear scale or plusmn011 on the log2-
fold scale respectively The SIRV concentration ratios between two mixes are more precise because
only one final pipetting step defines the concentration differences and synchronizes all SIRVs which
belong to the same SubMix Here a maximal error of plusmn4 (or plusmn0057 on the log2-fold scale) can be
expected between SubMixes while all SIRVs of the same SubMix must propagate coherently into the
final mixes Bioanalyzer traces were used to monitor the relative propagation of the SIRVs PreMixes
and SubMixes during the mixing (Fig 2B) In addition the accurate pipetting of the 8 PreMixes was
controlled by checksums of Nanodrop concentration measurements which deviated by only
0002plusmn34 from the calculated target concentrations and by weighing on an analytical balance
which showed a deviation of 18plusmn065 The final concentration of the SIRV mixes are set to be 253
ngmicrol
not peer-reviewed) is the authorfunder All rights reserved No reuse allowed without permission The copyright holder for this preprint (which was httpdxdoiorg101101080747doi bioRxiv preprint first posted online Oct 13 2016
Spike-In RNA variant controls for RNA-Sequencing bioRxiv upload 2016-10-13
24
SPIKING OF REFERENCE RNA WITH SIRV MIXES In general SIRV mixes can be used with crude
cell extracts purified total RNA rRNA-depleted RNA or poly(A)-enriched RNA Important the spike-in
ratios have to be chosen in concordance with the desired final SIRV content the RNA preparation
method and if known the expected mRNA content One widely applicable spike-in ratio can be
obtained by adding 006 ng of controls to approximately 100 ng of total RNA In the presented
examples the total RNA mass of one single aliquot RNA was 100 ng of UHRR in RC-0 and 1128 ng of
HBRR in RC-1 The reference RNA in RC-2 was calculated to be 10427 ng (Fig S2) The high-
concentrated and thereby stable SIRV mix stocks with 253 ngmicrol and ERCC mix stocks with 30 ngmicrol
(ERCC Spike-In Mixes 1 and 2 by Ambion Thermo Fisher Waltham MA) were diluted just prior to the
spiking to facilitate the mixing of manageable volumes For example the final 11000 dilution
reduced the SIRV mix concentration to 253 pgmicrol from which 237 microl were required to spike a 100 ng
total RNA sample with 006 ng SIRVs The RC-samples were produced in large batches to yield
hundreds of samples allowing for a protocol with fewer dilutions and larger volumes reducing
thereby sources of experimental errors
NGS LIBRARY PREPARATION AND SEQUENCING The experiments were carried out in technical
triplicates From 1 microg RC-0 RC-1 or RC-2 RNA in total nine NGS libraries were prepared by Fasteris SA
(Plan-les-Ouates CH) using the TruSeq stranded mRNA library preparation kit with polyA selection
(Illumina Inc San Diego CA) All primary library templates were amplified with 14 PCR cycles to
reach reproducible concentrations 155plusmn45 nM and insert sizes 165plusmn10 bp An equimolar lane-mix
was sequenced at the CSF Campus Science Support Facilities GmbH (CSF Vienna AUT) in PE125
mode in one lane of a HiSeq 2500 flowcell in 125 bp paired-end mode using V4 chemistry The run
yielded 305 M raw reads 293 M after demultiplexing and trimming which corresponds to a read
depth of 326plusmn22 M reads per library
not peer-reviewed) is the authorfunder All rights reserved No reuse allowed without permission The copyright holder for this preprint (which was httpdxdoiorg101101080747doi bioRxiv preprint first posted online Oct 13 2016
Spike-In RNA variant controls for RNA-Sequencing bioRxiv upload 2016-10-13
25
READ PROCESSING AND MAPPING Standard data processing routines (bbduk part of BBMap by
B Bushnell to be found at sourceforgenetprojectsbbmap) were applied removing low quality
reads and trimming adapter sequences Due to variable stringencies the mappers produced different
read statistics STAR mapped against the genome 897plusmn59 of the reads (864plusmn56 uniquely) and
TopHat2 852plusmn57 (794plusmn52 uniquely) Bowtie2 mapped against the transcriptome 693plusmn18
reads (151plusmn15 uniquely)
ESTIMATION OF THE MRNA CONTENTS Based on the obtained read distributions the relative
mass partition between external controls and endogenous RNA fraction can be estimated Because
the library preparation uses a poly(A)-enrichment step the targeted endogenous RNA corresponds
almost exclusively to the mRNA content of the samples The propagation of the input mass ratio to
the output read ratio depends on both the mRNA content and the efficiencies of how controls and
mRNA proceed through the library preparation The relationship is described by Eqn 1
reRNA times prod(1 rconifrasl )
j
i=1
= (EeRNA times meRNA) times prod(1 (Econi times mconi)frasl )
j
i=1
Equation 1
with r number of reads from eRNA the endogenous RNA fraction here mRNA and con the
controls here SIRVs and ERCC E the relative efficiency of how the fraction proceeds through the
workflow and m the input mass
Ratios are measured as relative read counts and the results as a product of efficiencies and
apparent amounts are also relative measures Therefore at least one de facto arbitrary reference
point needs to be defined to deduce comparable absolute results Several reference points or
default values can be defined which lead to different dependent variables and imply slightly variable
interpretation of the results The following three calculation examples are simple deductions from
not peer-reviewed) is the authorfunder All rights reserved No reuse allowed without permission The copyright holder for this preprint (which was httpdxdoiorg101101080747doi bioRxiv preprint first posted online Oct 13 2016
Spike-In RNA variant controls for RNA-Sequencing bioRxiv upload 2016-10-13
26
the ratio shown in Eqn 1 with the ERCC (con1) and the SIRVs (con2) respectively Variation 1 is
explained in greater detail while in the other variants only the differing aspects are highlighted
Variation 1 i) Here the first assumption is that the mRNA content in UHRR (Agilent Santa
Clara CA) is 3 (factor 003) and 2 (factor 002) in HBRR (Ambion Thermo Fisher Waltham MA)
which stays in close agreement to previous estimates concluded from experiments by Shippy et al in
2006 The amounts of total RNA were measured by Nanodrop absorbance spectroscopy The UHRR
samples contained 100 ng and the HBRR samples 1128 ng The mixing ratio of (2times RC-0) (1times RC-1)
determines the concentration of the 3rd sample RC-2 and further the amount of total RNA (10427
ng) as well as its related mRNA content (2times100 ng times 3 + 1times1128 ng times 2 ) (2times100 ng + 1times1128
ng) = 264 (factor 0026) The mRNA masses of the samples are calculated by the measured total
RNA input amounts and default mRNA contents are 3 ng 2256 ng and 2752 ng The second
assumption is that the endogenous mRNAs proceed with the maximal efficiency of 100 (factor 1)
through library preparation and sequencing The input of the spike-in controls is the product of the
concentration values which were either measured as in the case of the SIRV stocks or stated by the
vendor as in the case of the ERCC stocks and the pipetted volumes Both are treated as de facto
measured values
ii) The relative amounts of reads which have been assigned to either endogenous mRNA
ERCCs or SIRVs are obtained from the mapping statistics (read classification)
iii) The ratio of mass input to reads output allows to calculate the propagation efficiency of
the controls relative to the default efficiency of the endogenous mRNA In the present experiment
the SIRVs progress with a relative efficiency of 867plusmn57 and the ERCCs with 416plusmn47 The
significant difference between the relative efficiency of both controls is very likely caused by the
different lengths of the poly(A)-tails which might influence a different binding efficiency during
poly(A)-enrichment step The SIRVs with a 30 nt long poly(A)-tail perform much more in concordance
with the endogenous mRNA as the ERCCs which contain shorter and variable poly(A)-tails ( 23 nt)
The observed small differences in the experiments using RC-0 RC-1 or RC-2 could be caused by a
not peer-reviewed) is the authorfunder All rights reserved No reuse allowed without permission The copyright holder for this preprint (which was httpdxdoiorg101101080747doi bioRxiv preprint first posted online Oct 13 2016
Spike-In RNA variant controls for RNA-Sequencing bioRxiv upload 2016-10-13
27
two-way interference of samples and controls However the deviations are small and can rather be a
result of minor inaccuracies in determining the relative input amounts Both hypotheses would need
to be verified by a series of repeats with the aim to resolve potential influences of pipetting during
the sample preparation variations in the library preparation and other contributions
Variation 2 Here no varying interferences between samples and controls are permitted
which means that relative efficiencies of the controls are considered to be constant The causes of
the experimental variations are exclusively assigned to the input amounts (alike hypothesis two in
the above example in discussing the deviation of the results in RC-2) This would translate into input
standard deviations of 118 (SIRVs) and 76 (ERCCs) The variations meld all accumulating errors
made in determining the concentration of the control stock solutions preparing the subsequent
dilutions pipetting the samples and controls during the spike-in step itself as well as determining the
amount of sample RNA in the first place Against the background of potential errors the calculated
results can be considered as highly consistent
Variation 3 In addition to the assumptions made for the measurement of sample RC-0
the spike-in of 006 ng SIRVs to all samples is also set as default Alike variation 2 the experiments in
RC-1 and RC-2 adopt the same default setting for the relative efficiencies calculated in RC-0
According to the ratio of Eqn 1 one can obtain mRNA contents as well as ERCC input amounts in this
case for samples RC-1 and RC-2 The mRNA content of the HBRR sample (RC-1) relative to the default
mRNA content in the UHRR sample (set to 3 ) would be 172 lower than the previously assumed
2 According to the present mixing scheme it would also imply that sample RC-2 has an mRNA
content of 254 up from the calculated 234 The offsets of -79 is again small and very likely
refers to the level of accuracy in the experimental results as discussed above Using this method the
spiking of samples with controls such as the SIRVs allows to closely estimate the relative mRNA
content of any unknown sample and to draw conclusions eg on the transcriptional state of tissues
cell suspension or individual cells
not peer-reviewed) is the authorfunder All rights reserved No reuse allowed without permission The copyright holder for this preprint (which was httpdxdoiorg101101080747doi bioRxiv preprint first posted online Oct 13 2016
Spike-In RNA variant controls for RNA-Sequencing bioRxiv upload 2016-10-13
28
COEFFICIENT OF DEVIATION We implemented a strand specific Coefficient of Deviation
(CoD) which aims to reflect the quality of NGS pipelines targeted at specific effects in particular
lsquospikenessrsquo of the coverage while systematic effects like drop of the coverage at Transcription Start
Sites (TSS) and Transcription End Sites (TES) are being suppressed The CoD is implemented by Eqn
2
CoD = CoD(LTSSLTES) = sum (cidealp- crealp)2
TESe
p=TSS1
divide sum cidealp
TESe
p=TSS1
Equation 2
which is calculated in strand orientation for contigs along all exonic nucleotide position (p) from the
first annotated TSS (TSS1) up to the last annotated TES (TESe) whereby cideal are the ideal coverages
with the optimized transient regions (LrsquoTSS LrsquoTES) and creal are the real coverages scaled as such that
the total integrals along all positions of ideal and real coverages are equal
The transient function at TSS and TES is the error function erf(x) which corresponds to
Cufflinks assumption about normally distributed fragment lengths (Trapnell et al 2012) Since erf(x)
is a non-algebraic function we used the algebraic approximation by Abramowitz and Stegun
(httpsenwikipediaorgwikiError_function eq 7125) Once the optima (LrsquoTSS LrsquoTES ) are found
we declare CoD(LrsquoTSS LrsquoTES) to be the ultimate CoD value which mostly eliminated the transient region
effects We implemented an optimization algorithm (Nelder-Mead downhill simplex method) and
used as starting values (L0TSS L0
TES ) lengths of 150 In some cases the optimum found can be beyond
a reasonable range of values Therefore we censor the output Lopt of the mathematical optimization
as follows Lcensored = 50 if Lrsquo lt 50 Lcensored = 350 if Lrsquo gt 350 This corresponds to the maximal range of
not peer-reviewed) is the authorfunder All rights reserved No reuse allowed without permission The copyright holder for this preprint (which was httpdxdoiorg101101080747doi bioRxiv preprint first posted online Oct 13 2016
Spike-In RNA variant controls for RNA-Sequencing bioRxiv upload 2016-10-13
29
200plusmn150 This censoring needed to be applied in 8 cases out of 84 SIRVmixstrandend
combinations ie less than in 10
TRANSCRIPT CONCENTRATION MEASUREMENTS In order to estimate expression values on
transcript levels we applied RSEM (Li and Dewey 2011) which uses a Bayesian Network to compute
the likelihood of each fragment belonging to a given transcript Salmon (Patro et al 2015) estimates
the transcript expression values by a k-mer based mapping Similar to RSEM it uses an expectation-
maximization (EM) algorithm to compute the maximum likelihood of relative abundances Cufflinks2
(Trapnell et al 2013) estimates the transcript abundances with a coverage-based maximum
likelihood approach It determines the probability of read assignments to isoforms
DIFFERENTIAL EXPRESSION ANALYSIS We used the DESeq2 package (Love et al 2014) for
calculation of fold-differences between the results from different pipelines and different input samples
mixtures As explained in the main text all outputs from the evaluated pipelines (in form of relative
concentration measures) have been scaled Scaling by linear transformation is needed as a
consequence of the different mRNA contents in the samples but also to eventually compensate any
potential pipetting errors when small aliquots typically in the range of very few microliter are added
to individual samples The RC-samples in this experiment were produced in a large batch to ensure
high accuracy in volumetric ratios The main sample pool is practically invariant to the small relative
contribution of the controls but was technically treated in the same way by scaling the main sample
pools to identical sizes First SIRV concentrations were scaled to reach together 69 in E0 685 in E1
and 708 in E2 which is the dimensionless value identical to the fmolmicrol in the respective SIRV stock
solutions Then the lower threshold was set to 10-6 which corresponds to original FPKM values of
around 5∙10-3 ⅟7th of one read for a 1 kb long transcript at a read depth of 30 Mio reads or 1 gene
specific read to be divided between 7 equally possible transcript variants at said 1 kb length section
The threshold is to be understood as less than or equal to 10-6 which defines an averaged read
not peer-reviewed) is the authorfunder All rights reserved No reuse allowed without permission The copyright holder for this preprint (which was httpdxdoiorg101101080747doi bioRxiv preprint first posted online Oct 13 2016
Spike-In RNA variant controls for RNA-Sequencing bioRxiv upload 2016-10-13
30
resolution of the particular workflow at the given read depth By these means all ratios remain defined
Second for the DESeq2 calculations we multiplied all values with 106 after which fractions were
rounded to the closest integer We understand that for no-change hypothesis testing which is the
main purpose of the DESeq2 package transforming the relative concentrations (FPKM or TPM) to
lsquoquasi-read-countsrsquo is not recommended since DESeq2 internally corrects for library size by using size
factors However in our application we do not use the probability of the hypothesis rejection (P
values) but the raw fold changes detected (irrespectively of the dispersion values for that given
transcript) We also took into account the potential danger of censoring the input (by unintentionally
eliminating transcripts represented by extremely low FPKM or TPM values) by setting a suitable
threshold as described above The figures show only two differential expression analyses because the
3rd concentration ratio E2E0 is the product of E1E0 and E2E1
ERROR RATE ANALYSIS The four red data points two from the SIRV controls (circles) and two
from the endogenous mRNAs (squares) from the best agreement (P3 vs P1) and the four
corresponding black data points from the worst agreement (P4 vs P2) as shown in fig 5E were fitted
by linear approximation using the relationship as derived for Eqn 3
TP + FP = 1
FP = N times ER = (1-TP) times ER
(TP+FP) = TP + ER - TP times ER
(TP+FP) = (1-ER) times TP + ER Equation 3
where TP is the relative portion of true positives (differentially expressed as in our definition
possessing a LFC gt 1) N the relative portion of negatives ER the error rate at which negatives are
falsely detected as positives to result in false positives FP The least squares fitting method was
applied to derive values for the slope (1-ER) and the intercept ER
not peer-reviewed) is the authorfunder All rights reserved No reuse allowed without permission The copyright holder for this preprint (which was httpdxdoiorg101101080747doi bioRxiv preprint first posted online Oct 13 2016
Spike-In RNA variant controls for RNA-Sequencing bioRxiv upload 2016-10-13
31
The transformation of Eqn 3 leads to the relationship of Eqn 4
TP FPfrasl = (TP+FP) TPfrasl -1 Equation 4
which has been used for the graph in fig 5F In the present context the concept of ROC-curves is not
applicable because the true or false negatives are indistinguishable as long the ground truth of the
endogenous RNA are unknown
DATA ACCESS Sequencces and source data files data are in the process to be deposited at
NCBI under BioProject ID PRJNA312485
ACKNOWLEDGMENTS We thank SA Munro and M Salit (Material Measurement
Laboratory National Institute of Standards and Technology) for their efforts in further developing the
concepts of the External RNA Control Consortium (ERCC) in an updated suite of RNA controls and
analysis methods called ERCC 20 We thank A Tuerk for his contributions in finding suitable human
model genes G Wiktorin for carrying out the RSEM calculations M Mihaylova in helping with the
graphics design and I Gabler for critically reading the manuscript
AUTHOR CONTRIBUTIONS LP PK and TR designed the sequences and mixtures PK and GH
prepared the in vitro transcripts and spike-in mixtures TR AS and LP designed the research and
the experiments MA IH and TR evaluated the data TR and LP wrote the manuscript
DISCLOSURE DECLARATION The authors are employees of Lexogen GmbH from which the SIRVs
can be bought and AS has equity stakes in Lexogen GmbH LP PK and TR are named as
not peer-reviewed) is the authorfunder All rights reserved No reuse allowed without permission The copyright holder for this preprint (which was httpdxdoiorg101101080747doi bioRxiv preprint first posted online Oct 13 2016
Spike-In RNA variant controls for RNA-Sequencing bioRxiv upload 2016-10-13
32
inventors on a patent application regarding the production and use of RNA transcript variants and
Lexogen GmbH is the owner of this patent application
REFERENCES
Baker SC Bauer SR Beyer RP Brenton JD Bromley B Burrill J Causton H Conley MP Elespuru R Fero M et al 2005 The External RNA Controls Consortium a progress report Nat Methods 2(10) 731-4 Bokar JA Rottman FM 1998 Biosynthesis and Functions of Modified Nucleosides in Eukaryotic mRNA In Modification and Editing of RNA (eds Grosjean H Benne R) pp 183-200 ASM Press Washington DC Dobin A Davis CA Schlesinger F Drenkow J Zaleski C Jha S Batut P Chaisson M Gingeras TR 2013 STAR ultrafast universal RNA-seq aligner Bioinformatics 29(1) 15-21 Fed Reg Doc 2015-19742 2015 External RNA Controls Consortium - Call for Participation and Contributions to a Sequence Library Federal Register Citation 80 FR 48296 Griebel T Zacher B Ribeca P Raineri E Lacroix V Guigoacute R Sammeth M 2012 Modelling and simulating generic RNA-Seq experiments with the flux simulator Nucleic Acids Res 40(20) 10073-83 Jiang L Schlesinger F Davis CA Zhang Y Li R Salit M Gingeras TR Oliver B 2011 Synthetic spike-in standards for RNA-seq experiments Genome Res 21(9) 1543-51 Kim D Pertea G Trapnell C Pimentel H Kelley R Salzberg SL 2013 TopHat2 accurate alignment of transcriptomes in the presence of insertions deletions and gene fusions Genome Biol 14(4) R36 Kratz A Carninci P 2014 The devil in the details of RNA-seq Nat Biotechnol 32(9) 882-4 Lahens NF Kavakli IH Zhang R Hayer K Black MB Dueck H Pizarro A Kim J Irizarry R Thomas RS et al 2014 IVT-seq reveals extreme bias in RNA sequencing Genome Biol 15(6) R86 Langmead B Salzberg SL 2012 Fast gapped-read alignment with Bowtie 2 Nat Methods 9(4) 357-9 Li B Dewey CN 2011 RSEM accurate transcript quantification from RNA-Seq data with or without a reference genome BMC Bioinformatics 12 323 Li J Jiang H Wong WH 2010 Modeling non-uniformity in short-read rates in RNA-Seq data Genome Biol 11 R50 Li S Tighe SW Nicolet CM Grove D Levy S Farmerie W Viale A Wright C Schweitzer PA Gao Y et al 2014 Multi-platform assessment of transcriptome profiling using RNA-seq in the ABRF next-generation sequencing study Nat Biotechnology 32 915-25 Love MI Huber W Anders S 2014 Moderated estimation of fold change and dispersion for RNA-seq data with DESeq2 Genome Biol 15(12) 550
not peer-reviewed) is the authorfunder All rights reserved No reuse allowed without permission The copyright holder for this preprint (which was httpdxdoiorg101101080747doi bioRxiv preprint first posted online Oct 13 2016
Spike-In RNA variant controls for RNA-Sequencing bioRxiv upload 2016-10-13
33
Mortazavi A Williams BA McCue K Schaeffer L Wold B 2008 Mapping and quantifying mammalian transcriptomes by RNA-Seq Nat Methods 5(7) 621-8 Patro R Duggal G Kingsford C 2015 Accurate fast and model-aware transcript expression quantification with Salmon bioRxiv preprint doi httpdxdoiorg101101021592 Shippy R Fulmer-Smentek S Jensen RV Jones WD Wolber PK Johnson CD Pine PS Boysen C Guo X Chudin E et al 2006 Using RNA sample titrations to assess microarray platform performance and normalization techniques Nat Biotechnol 24(9) 1123-31 SEQCMAQC-III Consortium 2014 A comprehensive assessment of RNA-seq accuracy reproducibility and information content by the Sequencing Quality Control Consortium Nat Biotechnology 32 903-14 Tembe WD Pond SJ Legendre C Chuang HY Liang WS Kim NE Montel V Wong S McDaniel TK Craig DW Carpten JD 2014 Open-access synthetic spike-in mRNA-seq data for cancer gene fusions BMC Genomics 15 824 Trapnell C Roberts A Goff L Pertea G Kim D Kelley DR Pimentel H Salzberg SL Rinn JL Pachter L 2012 Differential gene and transcript expression analysis of RNA-seq experiments with TopHat and Cufflinks Nat Protoc 7(3) 562-78 Trapnell C Hendrickson DG Sauvageau M Goff L Rinn JL Pachter L 2013 Differential analysis of gene regulation at transcript resolution with RNA-seq Nat Biotechnol 31(1) 46-53 van Dijk EL Jaszczyszyn Y Thermes C 2014 Library preparation methods for next-generation sequencing tone down the bias Exp Cell Res 322(1) 12-20 Wang Z Gerstein M Snyder M 2009 RNA-Seq a revolutionary tool for transcriptomics Nat Rev Genet 1 57-63 Zheng W Chung LM Zhao H 2011 Bias detection and correction in RNA-Sequencing data BMC Bioinformatics 12290
not peer-reviewed) is the authorfunder All rights reserved No reuse allowed without permission The copyright holder for this preprint (which was httpdxdoiorg101101080747doi bioRxiv preprint first posted online Oct 13 2016
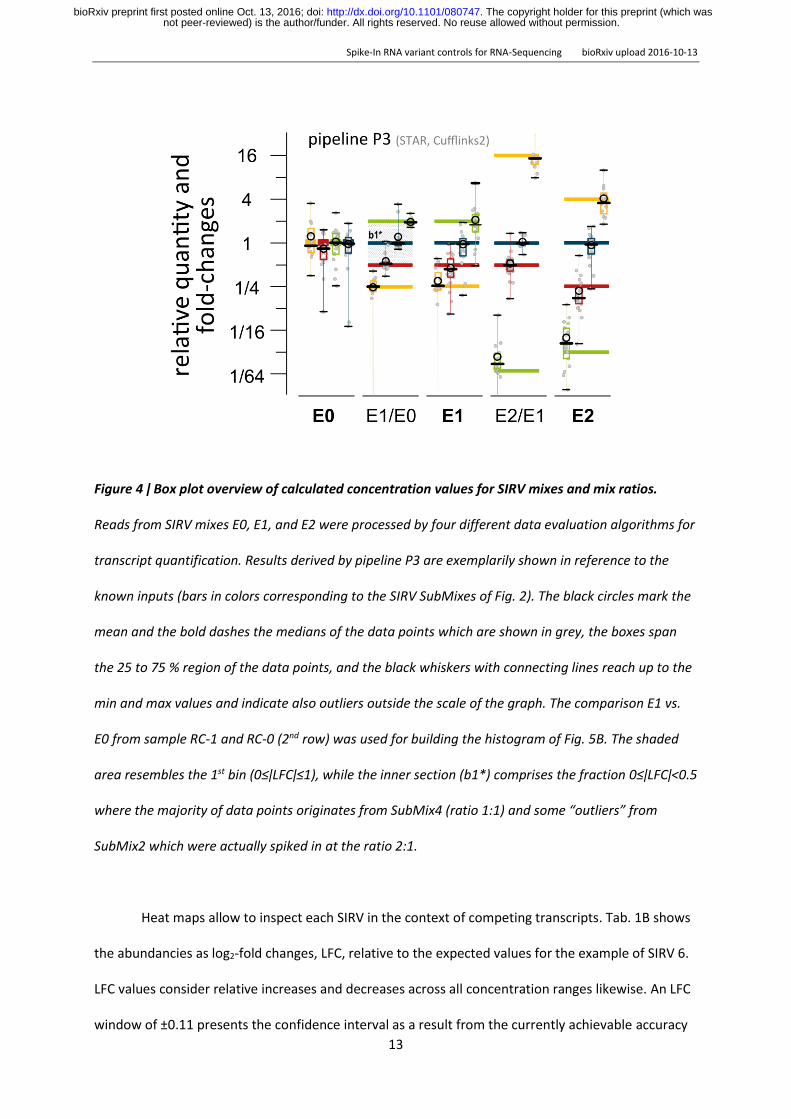
Spike-In RNA variant controls for RNA-Sequencing bioRxiv upload 2016-10-13
13
Figure 4 ǀ Box plot overview of calculated concentration values for SIRV mixes and mix ratios
Reads from SIRV mixes E0 E1 and E2 were processed by four different data evaluation algorithms for
transcript quantification Results derived by pipeline P3 are exemplarily shown in reference to the
known inputs (bars in colors corresponding to the SIRV SubMixes of Fig 2) The black circles mark the
mean and the bold dashes the medians of the data points which are shown in grey the boxes span
the 25 to 75 region of the data points and the black whiskers with connecting lines reach up to the
min and max values and indicate also outliers outside the scale of the graph The comparison E1 vs
E0 from sample RC-1 and RC-0 (2nd row) was used for building the histogram of Fig 5B The shaded
area resembles the 1st bin (0leǀLFCǀle1) while the inner section (b1) comprises the fraction 0leǀLFCǀlt05
where the majority of data points originates from SubMix4 (ratio 11) and some ldquooutliersrdquo from
SubMix2 which were actually spiked in at the ratio 21
Heat maps allow to inspect each SIRV in the context of competing transcripts Tab 1B shows
the abundancies as log2-fold changes LFC relative to the expected values for the example of SIRV 6
LFC values consider relative increases and decreases across all concentration ranges likewise An LFC
window of plusmn011 presents the confidence interval as a result from the currently achievable accuracy
not peer-reviewed) is the authorfunder All rights reserved No reuse allowed without permission The copyright holder for this preprint (which was httpdxdoiorg101101080747doi bioRxiv preprint first posted online Oct 13 2016
Spike-In RNA variant controls for RNA-Sequencing bioRxiv upload 2016-10-13
14
in producing the SIRV mixtures We examine the LFC values uncoupled from the adjusted p-values
which provide a statistical measure of the significance level for apparent differential expression By
these means we prevent pipelines to appear more coherent only due to higher noise levels The
accuracy has been calculated for each SIRV as the mean of the LFCs in all three mixes The precision is
a measure of how consistent SIRVs are quantified and has been calculated as the LFC standard
deviation for each SIRV and further for entire pipelines by using all SIRVs Within the presented
example SIRVs can obtain in all four pipelines high precisions of up to 018plusmn007 and high accuracies
of up to -001plusmn010 (SIRV604) In contrast SIRV612 of similar length has an average precision of
569plusmn368 and an accuracy of -386plusmn270 although it was detected by P2 with a high precision of 012
at an accuracy of 018 This quantification of differences between pipelines now directly permits to
assess the effect of changes in workflows and individual experiments
COMPARISON BETWEEN DIFFERENT WORKFLOWS When ranking the four pipelines by said precision P3
gives the lowest value with 129 followed by P4 with 164 P1 with 198 and P2 with 214 However
a sample-specific global target-performance comparison is not the strongest criteria for evaluating
performance differences at transcript resolution For this purpose the apparent differential
expression shows if similar errors are caused by the same or different transcripts The highest
concordance was found between P3 and P1 (labelled P3P1) calculated as standard deviation of all
SIRV LFCs with 101 followed by P4P3 (104) P4P1 (255) P2P1 (288) and P3P2 (309) The
lowest concordance has P4P2 with a value of 412 One section of the resulting heat map for both
extremes is shown in Tab 1C
not peer-reviewed) is the authorfunder All rights reserved No reuse allowed without permission The copyright holder for this preprint (which was httpdxdoiorg101101080747doi bioRxiv preprint first posted online Oct 13 2016
Spike-In RNA variant controls for RNA-Sequencing bioRxiv upload 2016-10-13
15
Table 1 ǀ Variance heat map of SIRV concentration measures detailing SIRV6 by the 4 different
pipelines P1 to P4 A) Given are SIRV transcript identifier SubMix (SM) color code and transcript
lengths (in nucleotides) B) Heat maps showing the log-fold changes (LFC) for the comparison of the
normalized expected and measured SIRV concentrations as a result from the four data evaluation
pipelines P1 to P4 evaluating E0 E1 and E2 Fields with -1 le LFC le 1 are filled with gradient green all
fields with LFC lt -1 with straight blue and all fields with LFC gt 1 with straight red C) From all 6
possible pairwise comparisons P2P1 P3P1 to P4P3 of the normalized measured SIRV
concentrations the one with the smallest (P3P1) and largest (P4P2) median of all LFC are shown
The complete heat map is shown in the suppl Tab S2
not peer-reviewed) is the authorfunder All rights reserved No reuse allowed without permission The copyright holder for this preprint (which was httpdxdoiorg101101080747doi bioRxiv preprint first posted online Oct 13 2016
Spike-In RNA variant controls for RNA-Sequencing bioRxiv upload 2016-10-13
16
The same pipeline comparisons were made with either all endogenous transcripts or the ones in the
higher SIRV expression range and compared to the pipeline concordances calculated with the SIRV
controls (Fig 5) We define the first bin with ǀLFCǀ lt 1 as the bin of no apparently differentially
expressed transcripts independent of the corresponding p-values The other bins contain transcripts
for which the calculated concentrations differ by more than 2-fold hence convene apparently
differentially expressed transcripts (DE) We find that SIRV controls and endogenous transcripts are
evaluated coherently While theoretically no differences are expected pipelines P3 and P1 differ in
their quantification of the same data by 44 for the SIRVs and by 69 for endogenous RNAs in the
SIRV concentration range (Fig 5A) Pipelines P2 and P4 differ to a larger extent when evaluating the
same samples (Fig 5B C) The same correlation is seen in comparisons between different samples
(shown here for RC-0 vs RC-1) The expected DE between reference RNAs UHRR and HBRR of
approximately 50 is evaluated differently by P3 vs P1 (DE of 24 ) and this is mirrored in the
evaluation of the SIRV mixes spiked into these reference RNAs (DE of 49 ) P4 vs P2 performed
worse with a pipeline difference of 39 and 103 for endogenous and SIRV transcripts The
controls show a highly similar increase when comparing P3P1 with P4P2 (21-fold from 49 to
103 ) to the endogenous RNAs (16-fold from 24 to 39 ) Here the average measurement
using the same pipeline provide a pseudo-ground truth which is compared to the measurement
using different pipelines It allows to quantify the additional error caused solely by changes in the
pipeline A change from pipeline P3 to P1 would increase the number of DE-detected transcripts to a
smaller extent than a change from P2 to P4 and this is true for both the SIRV controls and the
endogenous transcripts
not peer-reviewed) is the authorfunder All rights reserved No reuse allowed without permission The copyright holder for this preprint (which was httpdxdoiorg101101080747doi bioRxiv preprint first posted online Oct 13 2016
Spike-In RNA variant controls for RNA-Sequencing bioRxiv upload 2016-10-13
17
Figure 5 ǀ SIRV and endogenous mRNA expression analyses are affected similarly when changing
data evaluation pipelines Binned apparent LFC-moduli are shown in histograms when comparing
results obtained by different pipelines evaluating identical NGS data sets from A C) the same
samples or B D) different samples Exemplarily the comparison with the best P3 vs P1 (black
symbols) and the worst agreement P4 vs P2 (red symbols) are shown The charts compare side-by-
side the results from the SIRV controls (green) all endogenous transcripts (black outline) and
endogenous transcripts within the medium-to-high concentration range of 10 to 2250 TPM or FPKM
(blue) The average of all intra-pipeline results are shown in grey The differences Δ between
not peer-reviewed) is the authorfunder All rights reserved No reuse allowed without permission The copyright holder for this preprint (which was httpdxdoiorg101101080747doi bioRxiv preprint first posted online Oct 13 2016
Spike-In RNA variant controls for RNA-Sequencing bioRxiv upload 2016-10-13
18
analyses with the same and with different pipelines show the losses in the bins 0 lt ǀLFCǀ lt 1 and the
corresponding gain in the other bins ǀLFCǀ gt 1 The increase of the FP-rate purely caused by the
pipeline changes vs the TP range is given in the summary graphs E and F) The 1st bins 0 lt ǀLFCǀ lt 1
are divided into two 0 lt ǀLFCǀ lt 05 and 05 lt ǀLFCǀ lt 1 which facilitates the easier tracking of the
results from the SubMixes4 as shown in Fig 4 were in both figures the 1st fraction is signed with 1b
DISCUSSION
We report a significant contribution to the external RNA controls toolbox in the form of Spike-In RNA
Variants (SIRVs) that address transcription variation and alternative splicing The highly defined mixes
of 69 transcripts aligning to 7 genes enable accurate target-performance evaluations of gene
expression analysis methods which is not possible eg by analyzing larger but only loosely defined
pools of in vitro transcripts (Lahens et al 2014) or limited sets addressing special problems like
fusion genes (Tembe et al 2014) The results presented here demonstrate that the condensed
complexity of the SIRV controls mimic very closely main properties of endogenous mRNAs when
analyzing high-throughput RNA sequencing workflows for their capabilities to determine transcript
variants and their relative quantities The responses of the SIRV controls to changes in the workflows
allow to extrapolate measures for the accuracy precision and foremost inter-experiment
comparability (concordance) to the large pool of endogenous RNAs With the help of the external
controls we could confirm that biases in sequence coverage could mostly be balanced by the
exemplary chosen data evaluation algorithms and for the majority of transcripts consistent relative
abundances were obtained However in our most concordant same sample pipeline comparison
P3P1 already 44 of the controls and 69 of the endogenous RNAs in the medium to high
concentration range appeared to be differentially expressed although none of those were true
positives (TP) because the reductio ad absurdum same sample comparison was using the very same
sets of NGS reads In consequence more than 700 potential endogenous mRNA leads would be non-
validatable false positives (FP) only because of a change in data evaluation pipelines With a
not peer-reviewed) is the authorfunder All rights reserved No reuse allowed without permission The copyright holder for this preprint (which was httpdxdoiorg101101080747doi bioRxiv preprint first posted online Oct 13 2016
Spike-In RNA variant controls for RNA-Sequencing bioRxiv upload 2016-10-13
19
difference between P4 and P2 of 12 at the level of endogenous RNAs an extra 1200 FPs would
obscure the evaluation
The inter-sample comparison between UHRR and HBRR presents a rather extreme case
where around half of all transcripts were calculated to differ by more than 2-fold However the
relative FPTP weight of both comparisons remains similar as P4P2 shows again clearly higher FP-
rates in both controls and endogenous RNAs The linear interpolation (Fig 5E) allows to estimate the
effect of the experimental changes to relative small number of differences as they would be seen in
typical RNA-Seq experiments Exemplarily highlighted are the intersections at 002 and 01 in Fig 5F
TP call rates and FPTP ratios are the important figures to estimate the likelihood and inversely
related effort to validate differentially expressed transcripts For the P3P1 comparison at 2 TP we
approximate an FPTP ratio of 289 The likelihood to actually validate DE transcripts under such
circumstances would reach 035 For the P4P2 comparison the TPFP ratio estimates to mere 014
The related risks and often substantial costs for deducing potential biomarkers would be 25 times
higher Although we demonstrated in the presented example the influence of changes in data
evaluation pipeline within an integrated RNA-Seq workflow the same principles apply to the front
end - the RNA treatment NGS library preparation and sequencing Here unintended variations in
particular sample preparations can only be detected by these external spike-in controls which
operate as markers and reference spots By these means SIRV controls increase the comparability
within and between sequencing experiments at the transcript isoform level SIRVs are designed for
the co-development improvement and monitoring of library preparations sequencing and data
processing
Outlook The presented module and the 92 ERCCs which probe the wide dynamic range using
monocistronic transcripts can be stepwise extended in the future by a) ca 15 poly(A)-tail variations
of monocistronic sequences with defined lengths of 20 and 30 adenosines as well as polyadenylated
and purified RNAs with poly(A)-tail lengths close to 50 100 and above 200 nucleotides b) around 12
above-average long RNAs with 3 5 7 and 10 kb c) approx 3 RNAs each with a low medium and
not peer-reviewed) is the authorfunder All rights reserved No reuse allowed without permission The copyright holder for this preprint (which was httpdxdoiorg101101080747doi bioRxiv preprint first posted online Oct 13 2016
Spike-In RNA variant controls for RNA-Sequencing bioRxiv upload 2016-10-13
20
high GC-content d) a set of 13 mRNA relevant chemical modifications most prominent the cap-
structure (Bokar and Rottman 1998) e) variants which cover aspects of SNPs alleles inversions and
fusion genes which needs to be accounted for in the corresponding sequence annotation files and f)
a random set of small and micro RNAs that comprise all sequence variations at their termini to
account for ligation biases The external control modules need to be fine-tuned with respect to the
dynamic concentration and concentration ratio range and the reference annotations must provide a
mixture of correctly over- and under-annotated genes to better emulate the challenging conditions
for bioinformatical data evaluation Both optimizations will also further increase the congruence of
the presented SIRV module with the endogenous RNAs Eventually all modules together would
develop into a comprehensive set of approximately 250 long RNA controls plus a microRNA module
which will become sufficient for calibration and normalization purposes This new estimate reduces
the scope of designing better spike-in controls compared to the maybe thousands of IVTs which have
been previously anticipated (Kratz and Carninci 2014)
METHODS
SIRV DESIGN AND IN SILICO ANALYSIS The gene structures of seven human model genes
(KLK5 LDHD LGALS17A DAPK3 HAUS5 USF2 and TESK2) were used as scaffold for the design of
SIRV1 to SIRV7 The ENCODE-annotated transcripts as well as added variants were edited to
represent in a redundant and comprehensive manner known transcription and alternative splicing
variations (complete gene structures are shown in the odd-numbered suppl Fig from S3 to S15) All
exon sequences descend from a pool of database-derived genomes (gene fragments from viruses
and bacteriophage capsid proteins and glycoproteins selected based on a GC-content in a range of
30-50) which were modified by inverting the sequence to lose identity while maintaining a kind of
naturally occurring order in the sequences Intron sequences that do not align with exons of another
isoform were drawn from random sequences whereby the GC content was balanced to comply with
not peer-reviewed) is the authorfunder All rights reserved No reuse allowed without permission The copyright holder for this preprint (which was httpdxdoiorg101101080747doi bioRxiv preprint first posted online Oct 13 2016
Spike-In RNA variant controls for RNA-Sequencing bioRxiv upload 2016-10-13
21
the adjacent exonic sequences (Random DNA Sequence Generator
httpwwwfacultyucredu~mmadurorandomhtm)
To verify the sequence exclusivity first the exon sequences were blasted against the entire NCBI
database including ERCCs on the nucleotide and protein level (program BLASTN 2229
httpsblastncbinlmnihgov) The default BLAST parameters used were word size 28 expected
threshold 10 Max matches in query rang 20 MatchMismatch Score 1 -2 Gap Costs Linear Filter
Low complexity regions Mask for lookup table only Search of the nucleotide collection resulted for
all SIRVs in ldquono significant similarity foundrdquo Second in silico generated reads (Griebel t al 2012)
(FLUX-Generator httpsammethnetconfluencedisplaySIMHome command line flux-simulator
-p ~hellipFluxsirv1par -t simulator -x -l -s) were mapped to nine individually selected genomes using
TopHat2 (Kim et al 2013) and Bowtie2 (Langmead and Salzberg2012) Because Bowtie2-aligned
reads can be as short as 20 nt the resulting limited number of mapping reads would be deemed to
be not significant in standard NGS work-flows In contrast when mapping reads with the standard
setting of the splicing-aware TopHat2 program not a single read aligned to any of the tested
genomes Given that both searches found no significant matches off-target mapping of the SIRVs can
essentially be ruled out Therefore the artificial SIRV sequences are suitable for noninterfering
qualitative and quantitative assessments in the context of known genomic systems and
complementary to the ERCC sequences (National Institute of Standards and Technology (NIST)
certified DNA plasmids Standard Reference Materialreg 2374) The SIRV sequences can be found at
httpswwwlexogencomsirvssirvsdownloads in the Source Data files and they are also
deposited at the NCBI Nucleotide Database (PRJNA312485)
SIRV CONSTRUCTS AND THE PRODUCTION OF IN-VITRO TRANSCRIPTS Synthetic gene constructs
were produced (Bio Basic Inc Markham ON Canada) that comprised 5rsquo to 3rsquo a unique restriction
site a T7 RNA polymerase promoter whose 3rsquo G is the first nucleotide of the actual SIRV sequence
which is seamlessly followed by a (A30)-tail that is fused with an exclusive 2nd restriction site These
not peer-reviewed) is the authorfunder All rights reserved No reuse allowed without permission The copyright holder for this preprint (which was httpdxdoiorg101101080747doi bioRxiv preprint first posted online Oct 13 2016
Spike-In RNA variant controls for RNA-Sequencing bioRxiv upload 2016-10-13
22
gene cassettes were cloned into a vector colony-amplified and singularized All SIRV sequence in the
purified plasmids were verified by Sanger-sequencing to identify the correct clones The E coli
cultures were grown in batches to obtain plasmids in the lower microg-scale Double digestion of isolated
plasmids with XhoI and NsiI showed correct insert size and complete restriction Linearized silica-
purified plasmids served as templates in in vitro transcription reactions using T7 transcription kits
(AmpliScribe T7 High Yield Transcription Kit and AmpliScribe T7 Flash Transcription Kit Epicentre
Madison WI) The DNase-treated phenol-extracted and silica-purified in vitro transcription products
were assessed for concentration and purity by spectrophotometry (NanoDrop Thermo Fisher
Scientific Waltham MA) and for integrity by capillary electrophoresis (2100 Bioanalyzer RNA 6000
Pico Kit Agilent Technologies Santa Clara CA)
In the context of variant verification RNA integrity is a very important measure Fragments
arising from incomplete transcription might impose errors on the correct determination of variants
which share those sequences and thereby also affect the overall gene coverage The integrity of the
transcription products was very heterogeneous as expected given the broad sequence variation and
the length of the SIRV transcripts (average 11 kb with 14 RNAs between 20 and 25 kb) A majority
of transcripts therefore had to be purified by at least one of two purification methods Purification
method PP1 is selective for poly(A)-tails and neglects prematurely terminated transcription products
Purification method PP2 is based on size-selective quantitative electrophoresis separating the
correctly sized main products from shorter fragments (transcription break off and degraded
products) and longer fragments (run-through transcription products) After purification the 69 SIRV
RNAs were assessed to be on average 736plusmn343 in the pre-peak fraction 9031plusmn372 in the
main-peak fraction (corresponding to RNAs of correct length) and 236plusmn304 in the post-peak
fraction (mass percentages wt) Noteworthy the risks of a beginning degradation during the initial
denaturation (2 min at 70degC) and the not fully denaturing conditions during RNA microcapillary
electrophoresis tiny noise levels in the baseline and slightly different shapes of the main peak result
in a rather over- than underestimation of pre- and post-peak fractions
not peer-reviewed) is the authorfunder All rights reserved No reuse allowed without permission The copyright holder for this preprint (which was httpdxdoiorg101101080747doi bioRxiv preprint first posted online Oct 13 2016
Spike-In RNA variant controls for RNA-Sequencing bioRxiv upload 2016-10-13
23
rRNasin (Promega Madison WI) was added to 08 Umicrol to minimize the risks of RNase
contamination induced RNA degradation The SIRVs were quantified by absorbance spectroscopy to
adjust all stock solutions to a base concentration of close to but above 50 ngmicrol RNA purity was very
high with A 260280 214plusmn012 and A 260230 217plusmn020
SIRV MIXING SIRV mixes were designed that contain pools of SIRVs (SubMixes) in defined
amounts and ratios by combining accurate volumes of the stock solutions in sufficiently large batch
sizes Pipetting errors vary depending on transfer volumes and range from plusmn4 for 2 microl to plusmn08 for
gt100 microl transfers The precision was experimentally determined with blank solutions Starting with
the stock concentration measurement (NanoDrop accuracy plusmn2 ngmicrol for 50 ngmicrol or plusmn4 ) and
accounting for the entire mixing pathway the accumulative concentration error is expected to range
between plusmn8 and plusmn47 Therefore in the data evaluation one has to account for the experimental
fuzziness by allowing for lower accuracy thresholds of plusmn8 on the linear scale or plusmn011 on the log2-
fold scale respectively The SIRV concentration ratios between two mixes are more precise because
only one final pipetting step defines the concentration differences and synchronizes all SIRVs which
belong to the same SubMix Here a maximal error of plusmn4 (or plusmn0057 on the log2-fold scale) can be
expected between SubMixes while all SIRVs of the same SubMix must propagate coherently into the
final mixes Bioanalyzer traces were used to monitor the relative propagation of the SIRVs PreMixes
and SubMixes during the mixing (Fig 2B) In addition the accurate pipetting of the 8 PreMixes was
controlled by checksums of Nanodrop concentration measurements which deviated by only
0002plusmn34 from the calculated target concentrations and by weighing on an analytical balance
which showed a deviation of 18plusmn065 The final concentration of the SIRV mixes are set to be 253
ngmicrol
not peer-reviewed) is the authorfunder All rights reserved No reuse allowed without permission The copyright holder for this preprint (which was httpdxdoiorg101101080747doi bioRxiv preprint first posted online Oct 13 2016
Spike-In RNA variant controls for RNA-Sequencing bioRxiv upload 2016-10-13
24
SPIKING OF REFERENCE RNA WITH SIRV MIXES In general SIRV mixes can be used with crude
cell extracts purified total RNA rRNA-depleted RNA or poly(A)-enriched RNA Important the spike-in
ratios have to be chosen in concordance with the desired final SIRV content the RNA preparation
method and if known the expected mRNA content One widely applicable spike-in ratio can be
obtained by adding 006 ng of controls to approximately 100 ng of total RNA In the presented
examples the total RNA mass of one single aliquot RNA was 100 ng of UHRR in RC-0 and 1128 ng of
HBRR in RC-1 The reference RNA in RC-2 was calculated to be 10427 ng (Fig S2) The high-
concentrated and thereby stable SIRV mix stocks with 253 ngmicrol and ERCC mix stocks with 30 ngmicrol
(ERCC Spike-In Mixes 1 and 2 by Ambion Thermo Fisher Waltham MA) were diluted just prior to the
spiking to facilitate the mixing of manageable volumes For example the final 11000 dilution
reduced the SIRV mix concentration to 253 pgmicrol from which 237 microl were required to spike a 100 ng
total RNA sample with 006 ng SIRVs The RC-samples were produced in large batches to yield
hundreds of samples allowing for a protocol with fewer dilutions and larger volumes reducing
thereby sources of experimental errors
NGS LIBRARY PREPARATION AND SEQUENCING The experiments were carried out in technical
triplicates From 1 microg RC-0 RC-1 or RC-2 RNA in total nine NGS libraries were prepared by Fasteris SA
(Plan-les-Ouates CH) using the TruSeq stranded mRNA library preparation kit with polyA selection
(Illumina Inc San Diego CA) All primary library templates were amplified with 14 PCR cycles to
reach reproducible concentrations 155plusmn45 nM and insert sizes 165plusmn10 bp An equimolar lane-mix
was sequenced at the CSF Campus Science Support Facilities GmbH (CSF Vienna AUT) in PE125
mode in one lane of a HiSeq 2500 flowcell in 125 bp paired-end mode using V4 chemistry The run
yielded 305 M raw reads 293 M after demultiplexing and trimming which corresponds to a read
depth of 326plusmn22 M reads per library
not peer-reviewed) is the authorfunder All rights reserved No reuse allowed without permission The copyright holder for this preprint (which was httpdxdoiorg101101080747doi bioRxiv preprint first posted online Oct 13 2016
Spike-In RNA variant controls for RNA-Sequencing bioRxiv upload 2016-10-13
25
READ PROCESSING AND MAPPING Standard data processing routines (bbduk part of BBMap by
B Bushnell to be found at sourceforgenetprojectsbbmap) were applied removing low quality
reads and trimming adapter sequences Due to variable stringencies the mappers produced different
read statistics STAR mapped against the genome 897plusmn59 of the reads (864plusmn56 uniquely) and
TopHat2 852plusmn57 (794plusmn52 uniquely) Bowtie2 mapped against the transcriptome 693plusmn18
reads (151plusmn15 uniquely)
ESTIMATION OF THE MRNA CONTENTS Based on the obtained read distributions the relative
mass partition between external controls and endogenous RNA fraction can be estimated Because
the library preparation uses a poly(A)-enrichment step the targeted endogenous RNA corresponds
almost exclusively to the mRNA content of the samples The propagation of the input mass ratio to
the output read ratio depends on both the mRNA content and the efficiencies of how controls and
mRNA proceed through the library preparation The relationship is described by Eqn 1
reRNA times prod(1 rconifrasl )
j
i=1
= (EeRNA times meRNA) times prod(1 (Econi times mconi)frasl )
j
i=1
Equation 1
with r number of reads from eRNA the endogenous RNA fraction here mRNA and con the
controls here SIRVs and ERCC E the relative efficiency of how the fraction proceeds through the
workflow and m the input mass
Ratios are measured as relative read counts and the results as a product of efficiencies and
apparent amounts are also relative measures Therefore at least one de facto arbitrary reference
point needs to be defined to deduce comparable absolute results Several reference points or
default values can be defined which lead to different dependent variables and imply slightly variable
interpretation of the results The following three calculation examples are simple deductions from
not peer-reviewed) is the authorfunder All rights reserved No reuse allowed without permission The copyright holder for this preprint (which was httpdxdoiorg101101080747doi bioRxiv preprint first posted online Oct 13 2016
Spike-In RNA variant controls for RNA-Sequencing bioRxiv upload 2016-10-13
26
the ratio shown in Eqn 1 with the ERCC (con1) and the SIRVs (con2) respectively Variation 1 is
explained in greater detail while in the other variants only the differing aspects are highlighted
Variation 1 i) Here the first assumption is that the mRNA content in UHRR (Agilent Santa
Clara CA) is 3 (factor 003) and 2 (factor 002) in HBRR (Ambion Thermo Fisher Waltham MA)
which stays in close agreement to previous estimates concluded from experiments by Shippy et al in
2006 The amounts of total RNA were measured by Nanodrop absorbance spectroscopy The UHRR
samples contained 100 ng and the HBRR samples 1128 ng The mixing ratio of (2times RC-0) (1times RC-1)
determines the concentration of the 3rd sample RC-2 and further the amount of total RNA (10427
ng) as well as its related mRNA content (2times100 ng times 3 + 1times1128 ng times 2 ) (2times100 ng + 1times1128
ng) = 264 (factor 0026) The mRNA masses of the samples are calculated by the measured total
RNA input amounts and default mRNA contents are 3 ng 2256 ng and 2752 ng The second
assumption is that the endogenous mRNAs proceed with the maximal efficiency of 100 (factor 1)
through library preparation and sequencing The input of the spike-in controls is the product of the
concentration values which were either measured as in the case of the SIRV stocks or stated by the
vendor as in the case of the ERCC stocks and the pipetted volumes Both are treated as de facto
measured values
ii) The relative amounts of reads which have been assigned to either endogenous mRNA
ERCCs or SIRVs are obtained from the mapping statistics (read classification)
iii) The ratio of mass input to reads output allows to calculate the propagation efficiency of
the controls relative to the default efficiency of the endogenous mRNA In the present experiment
the SIRVs progress with a relative efficiency of 867plusmn57 and the ERCCs with 416plusmn47 The
significant difference between the relative efficiency of both controls is very likely caused by the
different lengths of the poly(A)-tails which might influence a different binding efficiency during
poly(A)-enrichment step The SIRVs with a 30 nt long poly(A)-tail perform much more in concordance
with the endogenous mRNA as the ERCCs which contain shorter and variable poly(A)-tails ( 23 nt)
The observed small differences in the experiments using RC-0 RC-1 or RC-2 could be caused by a
not peer-reviewed) is the authorfunder All rights reserved No reuse allowed without permission The copyright holder for this preprint (which was httpdxdoiorg101101080747doi bioRxiv preprint first posted online Oct 13 2016
Spike-In RNA variant controls for RNA-Sequencing bioRxiv upload 2016-10-13
27
two-way interference of samples and controls However the deviations are small and can rather be a
result of minor inaccuracies in determining the relative input amounts Both hypotheses would need
to be verified by a series of repeats with the aim to resolve potential influences of pipetting during
the sample preparation variations in the library preparation and other contributions
Variation 2 Here no varying interferences between samples and controls are permitted
which means that relative efficiencies of the controls are considered to be constant The causes of
the experimental variations are exclusively assigned to the input amounts (alike hypothesis two in
the above example in discussing the deviation of the results in RC-2) This would translate into input
standard deviations of 118 (SIRVs) and 76 (ERCCs) The variations meld all accumulating errors
made in determining the concentration of the control stock solutions preparing the subsequent
dilutions pipetting the samples and controls during the spike-in step itself as well as determining the
amount of sample RNA in the first place Against the background of potential errors the calculated
results can be considered as highly consistent
Variation 3 In addition to the assumptions made for the measurement of sample RC-0
the spike-in of 006 ng SIRVs to all samples is also set as default Alike variation 2 the experiments in
RC-1 and RC-2 adopt the same default setting for the relative efficiencies calculated in RC-0
According to the ratio of Eqn 1 one can obtain mRNA contents as well as ERCC input amounts in this
case for samples RC-1 and RC-2 The mRNA content of the HBRR sample (RC-1) relative to the default
mRNA content in the UHRR sample (set to 3 ) would be 172 lower than the previously assumed
2 According to the present mixing scheme it would also imply that sample RC-2 has an mRNA
content of 254 up from the calculated 234 The offsets of -79 is again small and very likely
refers to the level of accuracy in the experimental results as discussed above Using this method the
spiking of samples with controls such as the SIRVs allows to closely estimate the relative mRNA
content of any unknown sample and to draw conclusions eg on the transcriptional state of tissues
cell suspension or individual cells
not peer-reviewed) is the authorfunder All rights reserved No reuse allowed without permission The copyright holder for this preprint (which was httpdxdoiorg101101080747doi bioRxiv preprint first posted online Oct 13 2016
Spike-In RNA variant controls for RNA-Sequencing bioRxiv upload 2016-10-13
28
COEFFICIENT OF DEVIATION We implemented a strand specific Coefficient of Deviation
(CoD) which aims to reflect the quality of NGS pipelines targeted at specific effects in particular
lsquospikenessrsquo of the coverage while systematic effects like drop of the coverage at Transcription Start
Sites (TSS) and Transcription End Sites (TES) are being suppressed The CoD is implemented by Eqn
2
CoD = CoD(LTSSLTES) = sum (cidealp- crealp)2
TESe
p=TSS1
divide sum cidealp
TESe
p=TSS1
Equation 2
which is calculated in strand orientation for contigs along all exonic nucleotide position (p) from the
first annotated TSS (TSS1) up to the last annotated TES (TESe) whereby cideal are the ideal coverages
with the optimized transient regions (LrsquoTSS LrsquoTES) and creal are the real coverages scaled as such that
the total integrals along all positions of ideal and real coverages are equal
The transient function at TSS and TES is the error function erf(x) which corresponds to
Cufflinks assumption about normally distributed fragment lengths (Trapnell et al 2012) Since erf(x)
is a non-algebraic function we used the algebraic approximation by Abramowitz and Stegun
(httpsenwikipediaorgwikiError_function eq 7125) Once the optima (LrsquoTSS LrsquoTES ) are found
we declare CoD(LrsquoTSS LrsquoTES) to be the ultimate CoD value which mostly eliminated the transient region
effects We implemented an optimization algorithm (Nelder-Mead downhill simplex method) and
used as starting values (L0TSS L0
TES ) lengths of 150 In some cases the optimum found can be beyond
a reasonable range of values Therefore we censor the output Lopt of the mathematical optimization
as follows Lcensored = 50 if Lrsquo lt 50 Lcensored = 350 if Lrsquo gt 350 This corresponds to the maximal range of
not peer-reviewed) is the authorfunder All rights reserved No reuse allowed without permission The copyright holder for this preprint (which was httpdxdoiorg101101080747doi bioRxiv preprint first posted online Oct 13 2016
Spike-In RNA variant controls for RNA-Sequencing bioRxiv upload 2016-10-13
29
200plusmn150 This censoring needed to be applied in 8 cases out of 84 SIRVmixstrandend
combinations ie less than in 10
TRANSCRIPT CONCENTRATION MEASUREMENTS In order to estimate expression values on
transcript levels we applied RSEM (Li and Dewey 2011) which uses a Bayesian Network to compute
the likelihood of each fragment belonging to a given transcript Salmon (Patro et al 2015) estimates
the transcript expression values by a k-mer based mapping Similar to RSEM it uses an expectation-
maximization (EM) algorithm to compute the maximum likelihood of relative abundances Cufflinks2
(Trapnell et al 2013) estimates the transcript abundances with a coverage-based maximum
likelihood approach It determines the probability of read assignments to isoforms
DIFFERENTIAL EXPRESSION ANALYSIS We used the DESeq2 package (Love et al 2014) for
calculation of fold-differences between the results from different pipelines and different input samples
mixtures As explained in the main text all outputs from the evaluated pipelines (in form of relative
concentration measures) have been scaled Scaling by linear transformation is needed as a
consequence of the different mRNA contents in the samples but also to eventually compensate any
potential pipetting errors when small aliquots typically in the range of very few microliter are added
to individual samples The RC-samples in this experiment were produced in a large batch to ensure
high accuracy in volumetric ratios The main sample pool is practically invariant to the small relative
contribution of the controls but was technically treated in the same way by scaling the main sample
pools to identical sizes First SIRV concentrations were scaled to reach together 69 in E0 685 in E1
and 708 in E2 which is the dimensionless value identical to the fmolmicrol in the respective SIRV stock
solutions Then the lower threshold was set to 10-6 which corresponds to original FPKM values of
around 5∙10-3 ⅟7th of one read for a 1 kb long transcript at a read depth of 30 Mio reads or 1 gene
specific read to be divided between 7 equally possible transcript variants at said 1 kb length section
The threshold is to be understood as less than or equal to 10-6 which defines an averaged read
not peer-reviewed) is the authorfunder All rights reserved No reuse allowed without permission The copyright holder for this preprint (which was httpdxdoiorg101101080747doi bioRxiv preprint first posted online Oct 13 2016
Spike-In RNA variant controls for RNA-Sequencing bioRxiv upload 2016-10-13
30
resolution of the particular workflow at the given read depth By these means all ratios remain defined
Second for the DESeq2 calculations we multiplied all values with 106 after which fractions were
rounded to the closest integer We understand that for no-change hypothesis testing which is the
main purpose of the DESeq2 package transforming the relative concentrations (FPKM or TPM) to
lsquoquasi-read-countsrsquo is not recommended since DESeq2 internally corrects for library size by using size
factors However in our application we do not use the probability of the hypothesis rejection (P
values) but the raw fold changes detected (irrespectively of the dispersion values for that given
transcript) We also took into account the potential danger of censoring the input (by unintentionally
eliminating transcripts represented by extremely low FPKM or TPM values) by setting a suitable
threshold as described above The figures show only two differential expression analyses because the
3rd concentration ratio E2E0 is the product of E1E0 and E2E1
ERROR RATE ANALYSIS The four red data points two from the SIRV controls (circles) and two
from the endogenous mRNAs (squares) from the best agreement (P3 vs P1) and the four
corresponding black data points from the worst agreement (P4 vs P2) as shown in fig 5E were fitted
by linear approximation using the relationship as derived for Eqn 3
TP + FP = 1
FP = N times ER = (1-TP) times ER
(TP+FP) = TP + ER - TP times ER
(TP+FP) = (1-ER) times TP + ER Equation 3
where TP is the relative portion of true positives (differentially expressed as in our definition
possessing a LFC gt 1) N the relative portion of negatives ER the error rate at which negatives are
falsely detected as positives to result in false positives FP The least squares fitting method was
applied to derive values for the slope (1-ER) and the intercept ER
not peer-reviewed) is the authorfunder All rights reserved No reuse allowed without permission The copyright holder for this preprint (which was httpdxdoiorg101101080747doi bioRxiv preprint first posted online Oct 13 2016
Spike-In RNA variant controls for RNA-Sequencing bioRxiv upload 2016-10-13
31
The transformation of Eqn 3 leads to the relationship of Eqn 4
TP FPfrasl = (TP+FP) TPfrasl -1 Equation 4
which has been used for the graph in fig 5F In the present context the concept of ROC-curves is not
applicable because the true or false negatives are indistinguishable as long the ground truth of the
endogenous RNA are unknown
DATA ACCESS Sequencces and source data files data are in the process to be deposited at
NCBI under BioProject ID PRJNA312485
ACKNOWLEDGMENTS We thank SA Munro and M Salit (Material Measurement
Laboratory National Institute of Standards and Technology) for their efforts in further developing the
concepts of the External RNA Control Consortium (ERCC) in an updated suite of RNA controls and
analysis methods called ERCC 20 We thank A Tuerk for his contributions in finding suitable human
model genes G Wiktorin for carrying out the RSEM calculations M Mihaylova in helping with the
graphics design and I Gabler for critically reading the manuscript
AUTHOR CONTRIBUTIONS LP PK and TR designed the sequences and mixtures PK and GH
prepared the in vitro transcripts and spike-in mixtures TR AS and LP designed the research and
the experiments MA IH and TR evaluated the data TR and LP wrote the manuscript
DISCLOSURE DECLARATION The authors are employees of Lexogen GmbH from which the SIRVs
can be bought and AS has equity stakes in Lexogen GmbH LP PK and TR are named as
not peer-reviewed) is the authorfunder All rights reserved No reuse allowed without permission The copyright holder for this preprint (which was httpdxdoiorg101101080747doi bioRxiv preprint first posted online Oct 13 2016
Spike-In RNA variant controls for RNA-Sequencing bioRxiv upload 2016-10-13
32
inventors on a patent application regarding the production and use of RNA transcript variants and
Lexogen GmbH is the owner of this patent application
REFERENCES
Baker SC Bauer SR Beyer RP Brenton JD Bromley B Burrill J Causton H Conley MP Elespuru R Fero M et al 2005 The External RNA Controls Consortium a progress report Nat Methods 2(10) 731-4 Bokar JA Rottman FM 1998 Biosynthesis and Functions of Modified Nucleosides in Eukaryotic mRNA In Modification and Editing of RNA (eds Grosjean H Benne R) pp 183-200 ASM Press Washington DC Dobin A Davis CA Schlesinger F Drenkow J Zaleski C Jha S Batut P Chaisson M Gingeras TR 2013 STAR ultrafast universal RNA-seq aligner Bioinformatics 29(1) 15-21 Fed Reg Doc 2015-19742 2015 External RNA Controls Consortium - Call for Participation and Contributions to a Sequence Library Federal Register Citation 80 FR 48296 Griebel T Zacher B Ribeca P Raineri E Lacroix V Guigoacute R Sammeth M 2012 Modelling and simulating generic RNA-Seq experiments with the flux simulator Nucleic Acids Res 40(20) 10073-83 Jiang L Schlesinger F Davis CA Zhang Y Li R Salit M Gingeras TR Oliver B 2011 Synthetic spike-in standards for RNA-seq experiments Genome Res 21(9) 1543-51 Kim D Pertea G Trapnell C Pimentel H Kelley R Salzberg SL 2013 TopHat2 accurate alignment of transcriptomes in the presence of insertions deletions and gene fusions Genome Biol 14(4) R36 Kratz A Carninci P 2014 The devil in the details of RNA-seq Nat Biotechnol 32(9) 882-4 Lahens NF Kavakli IH Zhang R Hayer K Black MB Dueck H Pizarro A Kim J Irizarry R Thomas RS et al 2014 IVT-seq reveals extreme bias in RNA sequencing Genome Biol 15(6) R86 Langmead B Salzberg SL 2012 Fast gapped-read alignment with Bowtie 2 Nat Methods 9(4) 357-9 Li B Dewey CN 2011 RSEM accurate transcript quantification from RNA-Seq data with or without a reference genome BMC Bioinformatics 12 323 Li J Jiang H Wong WH 2010 Modeling non-uniformity in short-read rates in RNA-Seq data Genome Biol 11 R50 Li S Tighe SW Nicolet CM Grove D Levy S Farmerie W Viale A Wright C Schweitzer PA Gao Y et al 2014 Multi-platform assessment of transcriptome profiling using RNA-seq in the ABRF next-generation sequencing study Nat Biotechnology 32 915-25 Love MI Huber W Anders S 2014 Moderated estimation of fold change and dispersion for RNA-seq data with DESeq2 Genome Biol 15(12) 550
not peer-reviewed) is the authorfunder All rights reserved No reuse allowed without permission The copyright holder for this preprint (which was httpdxdoiorg101101080747doi bioRxiv preprint first posted online Oct 13 2016
Spike-In RNA variant controls for RNA-Sequencing bioRxiv upload 2016-10-13
33
Mortazavi A Williams BA McCue K Schaeffer L Wold B 2008 Mapping and quantifying mammalian transcriptomes by RNA-Seq Nat Methods 5(7) 621-8 Patro R Duggal G Kingsford C 2015 Accurate fast and model-aware transcript expression quantification with Salmon bioRxiv preprint doi httpdxdoiorg101101021592 Shippy R Fulmer-Smentek S Jensen RV Jones WD Wolber PK Johnson CD Pine PS Boysen C Guo X Chudin E et al 2006 Using RNA sample titrations to assess microarray platform performance and normalization techniques Nat Biotechnol 24(9) 1123-31 SEQCMAQC-III Consortium 2014 A comprehensive assessment of RNA-seq accuracy reproducibility and information content by the Sequencing Quality Control Consortium Nat Biotechnology 32 903-14 Tembe WD Pond SJ Legendre C Chuang HY Liang WS Kim NE Montel V Wong S McDaniel TK Craig DW Carpten JD 2014 Open-access synthetic spike-in mRNA-seq data for cancer gene fusions BMC Genomics 15 824 Trapnell C Roberts A Goff L Pertea G Kim D Kelley DR Pimentel H Salzberg SL Rinn JL Pachter L 2012 Differential gene and transcript expression analysis of RNA-seq experiments with TopHat and Cufflinks Nat Protoc 7(3) 562-78 Trapnell C Hendrickson DG Sauvageau M Goff L Rinn JL Pachter L 2013 Differential analysis of gene regulation at transcript resolution with RNA-seq Nat Biotechnol 31(1) 46-53 van Dijk EL Jaszczyszyn Y Thermes C 2014 Library preparation methods for next-generation sequencing tone down the bias Exp Cell Res 322(1) 12-20 Wang Z Gerstein M Snyder M 2009 RNA-Seq a revolutionary tool for transcriptomics Nat Rev Genet 1 57-63 Zheng W Chung LM Zhao H 2011 Bias detection and correction in RNA-Sequencing data BMC Bioinformatics 12290
not peer-reviewed) is the authorfunder All rights reserved No reuse allowed without permission The copyright holder for this preprint (which was httpdxdoiorg101101080747doi bioRxiv preprint first posted online Oct 13 2016
Spike-In RNA variant controls for RNA-Sequencing bioRxiv upload 2016-10-13
14
in producing the SIRV mixtures We examine the LFC values uncoupled from the adjusted p-values
which provide a statistical measure of the significance level for apparent differential expression By
these means we prevent pipelines to appear more coherent only due to higher noise levels The
accuracy has been calculated for each SIRV as the mean of the LFCs in all three mixes The precision is
a measure of how consistent SIRVs are quantified and has been calculated as the LFC standard
deviation for each SIRV and further for entire pipelines by using all SIRVs Within the presented
example SIRVs can obtain in all four pipelines high precisions of up to 018plusmn007 and high accuracies
of up to -001plusmn010 (SIRV604) In contrast SIRV612 of similar length has an average precision of
569plusmn368 and an accuracy of -386plusmn270 although it was detected by P2 with a high precision of 012
at an accuracy of 018 This quantification of differences between pipelines now directly permits to
assess the effect of changes in workflows and individual experiments
COMPARISON BETWEEN DIFFERENT WORKFLOWS When ranking the four pipelines by said precision P3
gives the lowest value with 129 followed by P4 with 164 P1 with 198 and P2 with 214 However
a sample-specific global target-performance comparison is not the strongest criteria for evaluating
performance differences at transcript resolution For this purpose the apparent differential
expression shows if similar errors are caused by the same or different transcripts The highest
concordance was found between P3 and P1 (labelled P3P1) calculated as standard deviation of all
SIRV LFCs with 101 followed by P4P3 (104) P4P1 (255) P2P1 (288) and P3P2 (309) The
lowest concordance has P4P2 with a value of 412 One section of the resulting heat map for both
extremes is shown in Tab 1C
not peer-reviewed) is the authorfunder All rights reserved No reuse allowed without permission The copyright holder for this preprint (which was httpdxdoiorg101101080747doi bioRxiv preprint first posted online Oct 13 2016
Spike-In RNA variant controls for RNA-Sequencing bioRxiv upload 2016-10-13
15
Table 1 ǀ Variance heat map of SIRV concentration measures detailing SIRV6 by the 4 different
pipelines P1 to P4 A) Given are SIRV transcript identifier SubMix (SM) color code and transcript
lengths (in nucleotides) B) Heat maps showing the log-fold changes (LFC) for the comparison of the
normalized expected and measured SIRV concentrations as a result from the four data evaluation
pipelines P1 to P4 evaluating E0 E1 and E2 Fields with -1 le LFC le 1 are filled with gradient green all
fields with LFC lt -1 with straight blue and all fields with LFC gt 1 with straight red C) From all 6
possible pairwise comparisons P2P1 P3P1 to P4P3 of the normalized measured SIRV
concentrations the one with the smallest (P3P1) and largest (P4P2) median of all LFC are shown
The complete heat map is shown in the suppl Tab S2
not peer-reviewed) is the authorfunder All rights reserved No reuse allowed without permission The copyright holder for this preprint (which was httpdxdoiorg101101080747doi bioRxiv preprint first posted online Oct 13 2016
Spike-In RNA variant controls for RNA-Sequencing bioRxiv upload 2016-10-13
16
The same pipeline comparisons were made with either all endogenous transcripts or the ones in the
higher SIRV expression range and compared to the pipeline concordances calculated with the SIRV
controls (Fig 5) We define the first bin with ǀLFCǀ lt 1 as the bin of no apparently differentially
expressed transcripts independent of the corresponding p-values The other bins contain transcripts
for which the calculated concentrations differ by more than 2-fold hence convene apparently
differentially expressed transcripts (DE) We find that SIRV controls and endogenous transcripts are
evaluated coherently While theoretically no differences are expected pipelines P3 and P1 differ in
their quantification of the same data by 44 for the SIRVs and by 69 for endogenous RNAs in the
SIRV concentration range (Fig 5A) Pipelines P2 and P4 differ to a larger extent when evaluating the
same samples (Fig 5B C) The same correlation is seen in comparisons between different samples
(shown here for RC-0 vs RC-1) The expected DE between reference RNAs UHRR and HBRR of
approximately 50 is evaluated differently by P3 vs P1 (DE of 24 ) and this is mirrored in the
evaluation of the SIRV mixes spiked into these reference RNAs (DE of 49 ) P4 vs P2 performed
worse with a pipeline difference of 39 and 103 for endogenous and SIRV transcripts The
controls show a highly similar increase when comparing P3P1 with P4P2 (21-fold from 49 to
103 ) to the endogenous RNAs (16-fold from 24 to 39 ) Here the average measurement
using the same pipeline provide a pseudo-ground truth which is compared to the measurement
using different pipelines It allows to quantify the additional error caused solely by changes in the
pipeline A change from pipeline P3 to P1 would increase the number of DE-detected transcripts to a
smaller extent than a change from P2 to P4 and this is true for both the SIRV controls and the
endogenous transcripts
not peer-reviewed) is the authorfunder All rights reserved No reuse allowed without permission The copyright holder for this preprint (which was httpdxdoiorg101101080747doi bioRxiv preprint first posted online Oct 13 2016
Spike-In RNA variant controls for RNA-Sequencing bioRxiv upload 2016-10-13
17
Figure 5 ǀ SIRV and endogenous mRNA expression analyses are affected similarly when changing
data evaluation pipelines Binned apparent LFC-moduli are shown in histograms when comparing
results obtained by different pipelines evaluating identical NGS data sets from A C) the same
samples or B D) different samples Exemplarily the comparison with the best P3 vs P1 (black
symbols) and the worst agreement P4 vs P2 (red symbols) are shown The charts compare side-by-
side the results from the SIRV controls (green) all endogenous transcripts (black outline) and
endogenous transcripts within the medium-to-high concentration range of 10 to 2250 TPM or FPKM
(blue) The average of all intra-pipeline results are shown in grey The differences Δ between
not peer-reviewed) is the authorfunder All rights reserved No reuse allowed without permission The copyright holder for this preprint (which was httpdxdoiorg101101080747doi bioRxiv preprint first posted online Oct 13 2016
Spike-In RNA variant controls for RNA-Sequencing bioRxiv upload 2016-10-13
18
analyses with the same and with different pipelines show the losses in the bins 0 lt ǀLFCǀ lt 1 and the
corresponding gain in the other bins ǀLFCǀ gt 1 The increase of the FP-rate purely caused by the
pipeline changes vs the TP range is given in the summary graphs E and F) The 1st bins 0 lt ǀLFCǀ lt 1
are divided into two 0 lt ǀLFCǀ lt 05 and 05 lt ǀLFCǀ lt 1 which facilitates the easier tracking of the
results from the SubMixes4 as shown in Fig 4 were in both figures the 1st fraction is signed with 1b
DISCUSSION
We report a significant contribution to the external RNA controls toolbox in the form of Spike-In RNA
Variants (SIRVs) that address transcription variation and alternative splicing The highly defined mixes
of 69 transcripts aligning to 7 genes enable accurate target-performance evaluations of gene
expression analysis methods which is not possible eg by analyzing larger but only loosely defined
pools of in vitro transcripts (Lahens et al 2014) or limited sets addressing special problems like
fusion genes (Tembe et al 2014) The results presented here demonstrate that the condensed
complexity of the SIRV controls mimic very closely main properties of endogenous mRNAs when
analyzing high-throughput RNA sequencing workflows for their capabilities to determine transcript
variants and their relative quantities The responses of the SIRV controls to changes in the workflows
allow to extrapolate measures for the accuracy precision and foremost inter-experiment
comparability (concordance) to the large pool of endogenous RNAs With the help of the external
controls we could confirm that biases in sequence coverage could mostly be balanced by the
exemplary chosen data evaluation algorithms and for the majority of transcripts consistent relative
abundances were obtained However in our most concordant same sample pipeline comparison
P3P1 already 44 of the controls and 69 of the endogenous RNAs in the medium to high
concentration range appeared to be differentially expressed although none of those were true
positives (TP) because the reductio ad absurdum same sample comparison was using the very same
sets of NGS reads In consequence more than 700 potential endogenous mRNA leads would be non-
validatable false positives (FP) only because of a change in data evaluation pipelines With a
not peer-reviewed) is the authorfunder All rights reserved No reuse allowed without permission The copyright holder for this preprint (which was httpdxdoiorg101101080747doi bioRxiv preprint first posted online Oct 13 2016
Spike-In RNA variant controls for RNA-Sequencing bioRxiv upload 2016-10-13
19
difference between P4 and P2 of 12 at the level of endogenous RNAs an extra 1200 FPs would
obscure the evaluation
The inter-sample comparison between UHRR and HBRR presents a rather extreme case
where around half of all transcripts were calculated to differ by more than 2-fold However the
relative FPTP weight of both comparisons remains similar as P4P2 shows again clearly higher FP-
rates in both controls and endogenous RNAs The linear interpolation (Fig 5E) allows to estimate the
effect of the experimental changes to relative small number of differences as they would be seen in
typical RNA-Seq experiments Exemplarily highlighted are the intersections at 002 and 01 in Fig 5F
TP call rates and FPTP ratios are the important figures to estimate the likelihood and inversely
related effort to validate differentially expressed transcripts For the P3P1 comparison at 2 TP we
approximate an FPTP ratio of 289 The likelihood to actually validate DE transcripts under such
circumstances would reach 035 For the P4P2 comparison the TPFP ratio estimates to mere 014
The related risks and often substantial costs for deducing potential biomarkers would be 25 times
higher Although we demonstrated in the presented example the influence of changes in data
evaluation pipeline within an integrated RNA-Seq workflow the same principles apply to the front
end - the RNA treatment NGS library preparation and sequencing Here unintended variations in
particular sample preparations can only be detected by these external spike-in controls which
operate as markers and reference spots By these means SIRV controls increase the comparability
within and between sequencing experiments at the transcript isoform level SIRVs are designed for
the co-development improvement and monitoring of library preparations sequencing and data
processing
Outlook The presented module and the 92 ERCCs which probe the wide dynamic range using
monocistronic transcripts can be stepwise extended in the future by a) ca 15 poly(A)-tail variations
of monocistronic sequences with defined lengths of 20 and 30 adenosines as well as polyadenylated
and purified RNAs with poly(A)-tail lengths close to 50 100 and above 200 nucleotides b) around 12
above-average long RNAs with 3 5 7 and 10 kb c) approx 3 RNAs each with a low medium and
not peer-reviewed) is the authorfunder All rights reserved No reuse allowed without permission The copyright holder for this preprint (which was httpdxdoiorg101101080747doi bioRxiv preprint first posted online Oct 13 2016
Spike-In RNA variant controls for RNA-Sequencing bioRxiv upload 2016-10-13
20
high GC-content d) a set of 13 mRNA relevant chemical modifications most prominent the cap-
structure (Bokar and Rottman 1998) e) variants which cover aspects of SNPs alleles inversions and
fusion genes which needs to be accounted for in the corresponding sequence annotation files and f)
a random set of small and micro RNAs that comprise all sequence variations at their termini to
account for ligation biases The external control modules need to be fine-tuned with respect to the
dynamic concentration and concentration ratio range and the reference annotations must provide a
mixture of correctly over- and under-annotated genes to better emulate the challenging conditions
for bioinformatical data evaluation Both optimizations will also further increase the congruence of
the presented SIRV module with the endogenous RNAs Eventually all modules together would
develop into a comprehensive set of approximately 250 long RNA controls plus a microRNA module
which will become sufficient for calibration and normalization purposes This new estimate reduces
the scope of designing better spike-in controls compared to the maybe thousands of IVTs which have
been previously anticipated (Kratz and Carninci 2014)
METHODS
SIRV DESIGN AND IN SILICO ANALYSIS The gene structures of seven human model genes
(KLK5 LDHD LGALS17A DAPK3 HAUS5 USF2 and TESK2) were used as scaffold for the design of
SIRV1 to SIRV7 The ENCODE-annotated transcripts as well as added variants were edited to
represent in a redundant and comprehensive manner known transcription and alternative splicing
variations (complete gene structures are shown in the odd-numbered suppl Fig from S3 to S15) All
exon sequences descend from a pool of database-derived genomes (gene fragments from viruses
and bacteriophage capsid proteins and glycoproteins selected based on a GC-content in a range of
30-50) which were modified by inverting the sequence to lose identity while maintaining a kind of
naturally occurring order in the sequences Intron sequences that do not align with exons of another
isoform were drawn from random sequences whereby the GC content was balanced to comply with
not peer-reviewed) is the authorfunder All rights reserved No reuse allowed without permission The copyright holder for this preprint (which was httpdxdoiorg101101080747doi bioRxiv preprint first posted online Oct 13 2016
Spike-In RNA variant controls for RNA-Sequencing bioRxiv upload 2016-10-13
21
the adjacent exonic sequences (Random DNA Sequence Generator
httpwwwfacultyucredu~mmadurorandomhtm)
To verify the sequence exclusivity first the exon sequences were blasted against the entire NCBI
database including ERCCs on the nucleotide and protein level (program BLASTN 2229
httpsblastncbinlmnihgov) The default BLAST parameters used were word size 28 expected
threshold 10 Max matches in query rang 20 MatchMismatch Score 1 -2 Gap Costs Linear Filter
Low complexity regions Mask for lookup table only Search of the nucleotide collection resulted for
all SIRVs in ldquono significant similarity foundrdquo Second in silico generated reads (Griebel t al 2012)
(FLUX-Generator httpsammethnetconfluencedisplaySIMHome command line flux-simulator
-p ~hellipFluxsirv1par -t simulator -x -l -s) were mapped to nine individually selected genomes using
TopHat2 (Kim et al 2013) and Bowtie2 (Langmead and Salzberg2012) Because Bowtie2-aligned
reads can be as short as 20 nt the resulting limited number of mapping reads would be deemed to
be not significant in standard NGS work-flows In contrast when mapping reads with the standard
setting of the splicing-aware TopHat2 program not a single read aligned to any of the tested
genomes Given that both searches found no significant matches off-target mapping of the SIRVs can
essentially be ruled out Therefore the artificial SIRV sequences are suitable for noninterfering
qualitative and quantitative assessments in the context of known genomic systems and
complementary to the ERCC sequences (National Institute of Standards and Technology (NIST)
certified DNA plasmids Standard Reference Materialreg 2374) The SIRV sequences can be found at
httpswwwlexogencomsirvssirvsdownloads in the Source Data files and they are also
deposited at the NCBI Nucleotide Database (PRJNA312485)
SIRV CONSTRUCTS AND THE PRODUCTION OF IN-VITRO TRANSCRIPTS Synthetic gene constructs
were produced (Bio Basic Inc Markham ON Canada) that comprised 5rsquo to 3rsquo a unique restriction
site a T7 RNA polymerase promoter whose 3rsquo G is the first nucleotide of the actual SIRV sequence
which is seamlessly followed by a (A30)-tail that is fused with an exclusive 2nd restriction site These
not peer-reviewed) is the authorfunder All rights reserved No reuse allowed without permission The copyright holder for this preprint (which was httpdxdoiorg101101080747doi bioRxiv preprint first posted online Oct 13 2016
Spike-In RNA variant controls for RNA-Sequencing bioRxiv upload 2016-10-13
22
gene cassettes were cloned into a vector colony-amplified and singularized All SIRV sequence in the
purified plasmids were verified by Sanger-sequencing to identify the correct clones The E coli
cultures were grown in batches to obtain plasmids in the lower microg-scale Double digestion of isolated
plasmids with XhoI and NsiI showed correct insert size and complete restriction Linearized silica-
purified plasmids served as templates in in vitro transcription reactions using T7 transcription kits
(AmpliScribe T7 High Yield Transcription Kit and AmpliScribe T7 Flash Transcription Kit Epicentre
Madison WI) The DNase-treated phenol-extracted and silica-purified in vitro transcription products
were assessed for concentration and purity by spectrophotometry (NanoDrop Thermo Fisher
Scientific Waltham MA) and for integrity by capillary electrophoresis (2100 Bioanalyzer RNA 6000
Pico Kit Agilent Technologies Santa Clara CA)
In the context of variant verification RNA integrity is a very important measure Fragments
arising from incomplete transcription might impose errors on the correct determination of variants
which share those sequences and thereby also affect the overall gene coverage The integrity of the
transcription products was very heterogeneous as expected given the broad sequence variation and
the length of the SIRV transcripts (average 11 kb with 14 RNAs between 20 and 25 kb) A majority
of transcripts therefore had to be purified by at least one of two purification methods Purification
method PP1 is selective for poly(A)-tails and neglects prematurely terminated transcription products
Purification method PP2 is based on size-selective quantitative electrophoresis separating the
correctly sized main products from shorter fragments (transcription break off and degraded
products) and longer fragments (run-through transcription products) After purification the 69 SIRV
RNAs were assessed to be on average 736plusmn343 in the pre-peak fraction 9031plusmn372 in the
main-peak fraction (corresponding to RNAs of correct length) and 236plusmn304 in the post-peak
fraction (mass percentages wt) Noteworthy the risks of a beginning degradation during the initial
denaturation (2 min at 70degC) and the not fully denaturing conditions during RNA microcapillary
electrophoresis tiny noise levels in the baseline and slightly different shapes of the main peak result
in a rather over- than underestimation of pre- and post-peak fractions
not peer-reviewed) is the authorfunder All rights reserved No reuse allowed without permission The copyright holder for this preprint (which was httpdxdoiorg101101080747doi bioRxiv preprint first posted online Oct 13 2016
Spike-In RNA variant controls for RNA-Sequencing bioRxiv upload 2016-10-13
23
rRNasin (Promega Madison WI) was added to 08 Umicrol to minimize the risks of RNase
contamination induced RNA degradation The SIRVs were quantified by absorbance spectroscopy to
adjust all stock solutions to a base concentration of close to but above 50 ngmicrol RNA purity was very
high with A 260280 214plusmn012 and A 260230 217plusmn020
SIRV MIXING SIRV mixes were designed that contain pools of SIRVs (SubMixes) in defined
amounts and ratios by combining accurate volumes of the stock solutions in sufficiently large batch
sizes Pipetting errors vary depending on transfer volumes and range from plusmn4 for 2 microl to plusmn08 for
gt100 microl transfers The precision was experimentally determined with blank solutions Starting with
the stock concentration measurement (NanoDrop accuracy plusmn2 ngmicrol for 50 ngmicrol or plusmn4 ) and
accounting for the entire mixing pathway the accumulative concentration error is expected to range
between plusmn8 and plusmn47 Therefore in the data evaluation one has to account for the experimental
fuzziness by allowing for lower accuracy thresholds of plusmn8 on the linear scale or plusmn011 on the log2-
fold scale respectively The SIRV concentration ratios between two mixes are more precise because
only one final pipetting step defines the concentration differences and synchronizes all SIRVs which
belong to the same SubMix Here a maximal error of plusmn4 (or plusmn0057 on the log2-fold scale) can be
expected between SubMixes while all SIRVs of the same SubMix must propagate coherently into the
final mixes Bioanalyzer traces were used to monitor the relative propagation of the SIRVs PreMixes
and SubMixes during the mixing (Fig 2B) In addition the accurate pipetting of the 8 PreMixes was
controlled by checksums of Nanodrop concentration measurements which deviated by only
0002plusmn34 from the calculated target concentrations and by weighing on an analytical balance
which showed a deviation of 18plusmn065 The final concentration of the SIRV mixes are set to be 253
ngmicrol
not peer-reviewed) is the authorfunder All rights reserved No reuse allowed without permission The copyright holder for this preprint (which was httpdxdoiorg101101080747doi bioRxiv preprint first posted online Oct 13 2016
Spike-In RNA variant controls for RNA-Sequencing bioRxiv upload 2016-10-13
24
SPIKING OF REFERENCE RNA WITH SIRV MIXES In general SIRV mixes can be used with crude
cell extracts purified total RNA rRNA-depleted RNA or poly(A)-enriched RNA Important the spike-in
ratios have to be chosen in concordance with the desired final SIRV content the RNA preparation
method and if known the expected mRNA content One widely applicable spike-in ratio can be
obtained by adding 006 ng of controls to approximately 100 ng of total RNA In the presented
examples the total RNA mass of one single aliquot RNA was 100 ng of UHRR in RC-0 and 1128 ng of
HBRR in RC-1 The reference RNA in RC-2 was calculated to be 10427 ng (Fig S2) The high-
concentrated and thereby stable SIRV mix stocks with 253 ngmicrol and ERCC mix stocks with 30 ngmicrol
(ERCC Spike-In Mixes 1 and 2 by Ambion Thermo Fisher Waltham MA) were diluted just prior to the
spiking to facilitate the mixing of manageable volumes For example the final 11000 dilution
reduced the SIRV mix concentration to 253 pgmicrol from which 237 microl were required to spike a 100 ng
total RNA sample with 006 ng SIRVs The RC-samples were produced in large batches to yield
hundreds of samples allowing for a protocol with fewer dilutions and larger volumes reducing
thereby sources of experimental errors
NGS LIBRARY PREPARATION AND SEQUENCING The experiments were carried out in technical
triplicates From 1 microg RC-0 RC-1 or RC-2 RNA in total nine NGS libraries were prepared by Fasteris SA
(Plan-les-Ouates CH) using the TruSeq stranded mRNA library preparation kit with polyA selection
(Illumina Inc San Diego CA) All primary library templates were amplified with 14 PCR cycles to
reach reproducible concentrations 155plusmn45 nM and insert sizes 165plusmn10 bp An equimolar lane-mix
was sequenced at the CSF Campus Science Support Facilities GmbH (CSF Vienna AUT) in PE125
mode in one lane of a HiSeq 2500 flowcell in 125 bp paired-end mode using V4 chemistry The run
yielded 305 M raw reads 293 M after demultiplexing and trimming which corresponds to a read
depth of 326plusmn22 M reads per library
not peer-reviewed) is the authorfunder All rights reserved No reuse allowed without permission The copyright holder for this preprint (which was httpdxdoiorg101101080747doi bioRxiv preprint first posted online Oct 13 2016
Spike-In RNA variant controls for RNA-Sequencing bioRxiv upload 2016-10-13
25
READ PROCESSING AND MAPPING Standard data processing routines (bbduk part of BBMap by
B Bushnell to be found at sourceforgenetprojectsbbmap) were applied removing low quality
reads and trimming adapter sequences Due to variable stringencies the mappers produced different
read statistics STAR mapped against the genome 897plusmn59 of the reads (864plusmn56 uniquely) and
TopHat2 852plusmn57 (794plusmn52 uniquely) Bowtie2 mapped against the transcriptome 693plusmn18
reads (151plusmn15 uniquely)
ESTIMATION OF THE MRNA CONTENTS Based on the obtained read distributions the relative
mass partition between external controls and endogenous RNA fraction can be estimated Because
the library preparation uses a poly(A)-enrichment step the targeted endogenous RNA corresponds
almost exclusively to the mRNA content of the samples The propagation of the input mass ratio to
the output read ratio depends on both the mRNA content and the efficiencies of how controls and
mRNA proceed through the library preparation The relationship is described by Eqn 1
reRNA times prod(1 rconifrasl )
j
i=1
= (EeRNA times meRNA) times prod(1 (Econi times mconi)frasl )
j
i=1
Equation 1
with r number of reads from eRNA the endogenous RNA fraction here mRNA and con the
controls here SIRVs and ERCC E the relative efficiency of how the fraction proceeds through the
workflow and m the input mass
Ratios are measured as relative read counts and the results as a product of efficiencies and
apparent amounts are also relative measures Therefore at least one de facto arbitrary reference
point needs to be defined to deduce comparable absolute results Several reference points or
default values can be defined which lead to different dependent variables and imply slightly variable
interpretation of the results The following three calculation examples are simple deductions from
not peer-reviewed) is the authorfunder All rights reserved No reuse allowed without permission The copyright holder for this preprint (which was httpdxdoiorg101101080747doi bioRxiv preprint first posted online Oct 13 2016
Spike-In RNA variant controls for RNA-Sequencing bioRxiv upload 2016-10-13
26
the ratio shown in Eqn 1 with the ERCC (con1) and the SIRVs (con2) respectively Variation 1 is
explained in greater detail while in the other variants only the differing aspects are highlighted
Variation 1 i) Here the first assumption is that the mRNA content in UHRR (Agilent Santa
Clara CA) is 3 (factor 003) and 2 (factor 002) in HBRR (Ambion Thermo Fisher Waltham MA)
which stays in close agreement to previous estimates concluded from experiments by Shippy et al in
2006 The amounts of total RNA were measured by Nanodrop absorbance spectroscopy The UHRR
samples contained 100 ng and the HBRR samples 1128 ng The mixing ratio of (2times RC-0) (1times RC-1)
determines the concentration of the 3rd sample RC-2 and further the amount of total RNA (10427
ng) as well as its related mRNA content (2times100 ng times 3 + 1times1128 ng times 2 ) (2times100 ng + 1times1128
ng) = 264 (factor 0026) The mRNA masses of the samples are calculated by the measured total
RNA input amounts and default mRNA contents are 3 ng 2256 ng and 2752 ng The second
assumption is that the endogenous mRNAs proceed with the maximal efficiency of 100 (factor 1)
through library preparation and sequencing The input of the spike-in controls is the product of the
concentration values which were either measured as in the case of the SIRV stocks or stated by the
vendor as in the case of the ERCC stocks and the pipetted volumes Both are treated as de facto
measured values
ii) The relative amounts of reads which have been assigned to either endogenous mRNA
ERCCs or SIRVs are obtained from the mapping statistics (read classification)
iii) The ratio of mass input to reads output allows to calculate the propagation efficiency of
the controls relative to the default efficiency of the endogenous mRNA In the present experiment
the SIRVs progress with a relative efficiency of 867plusmn57 and the ERCCs with 416plusmn47 The
significant difference between the relative efficiency of both controls is very likely caused by the
different lengths of the poly(A)-tails which might influence a different binding efficiency during
poly(A)-enrichment step The SIRVs with a 30 nt long poly(A)-tail perform much more in concordance
with the endogenous mRNA as the ERCCs which contain shorter and variable poly(A)-tails ( 23 nt)
The observed small differences in the experiments using RC-0 RC-1 or RC-2 could be caused by a
not peer-reviewed) is the authorfunder All rights reserved No reuse allowed without permission The copyright holder for this preprint (which was httpdxdoiorg101101080747doi bioRxiv preprint first posted online Oct 13 2016
Spike-In RNA variant controls for RNA-Sequencing bioRxiv upload 2016-10-13
27
two-way interference of samples and controls However the deviations are small and can rather be a
result of minor inaccuracies in determining the relative input amounts Both hypotheses would need
to be verified by a series of repeats with the aim to resolve potential influences of pipetting during
the sample preparation variations in the library preparation and other contributions
Variation 2 Here no varying interferences between samples and controls are permitted
which means that relative efficiencies of the controls are considered to be constant The causes of
the experimental variations are exclusively assigned to the input amounts (alike hypothesis two in
the above example in discussing the deviation of the results in RC-2) This would translate into input
standard deviations of 118 (SIRVs) and 76 (ERCCs) The variations meld all accumulating errors
made in determining the concentration of the control stock solutions preparing the subsequent
dilutions pipetting the samples and controls during the spike-in step itself as well as determining the
amount of sample RNA in the first place Against the background of potential errors the calculated
results can be considered as highly consistent
Variation 3 In addition to the assumptions made for the measurement of sample RC-0
the spike-in of 006 ng SIRVs to all samples is also set as default Alike variation 2 the experiments in
RC-1 and RC-2 adopt the same default setting for the relative efficiencies calculated in RC-0
According to the ratio of Eqn 1 one can obtain mRNA contents as well as ERCC input amounts in this
case for samples RC-1 and RC-2 The mRNA content of the HBRR sample (RC-1) relative to the default
mRNA content in the UHRR sample (set to 3 ) would be 172 lower than the previously assumed
2 According to the present mixing scheme it would also imply that sample RC-2 has an mRNA
content of 254 up from the calculated 234 The offsets of -79 is again small and very likely
refers to the level of accuracy in the experimental results as discussed above Using this method the
spiking of samples with controls such as the SIRVs allows to closely estimate the relative mRNA
content of any unknown sample and to draw conclusions eg on the transcriptional state of tissues
cell suspension or individual cells
not peer-reviewed) is the authorfunder All rights reserved No reuse allowed without permission The copyright holder for this preprint (which was httpdxdoiorg101101080747doi bioRxiv preprint first posted online Oct 13 2016
Spike-In RNA variant controls for RNA-Sequencing bioRxiv upload 2016-10-13
28
COEFFICIENT OF DEVIATION We implemented a strand specific Coefficient of Deviation
(CoD) which aims to reflect the quality of NGS pipelines targeted at specific effects in particular
lsquospikenessrsquo of the coverage while systematic effects like drop of the coverage at Transcription Start
Sites (TSS) and Transcription End Sites (TES) are being suppressed The CoD is implemented by Eqn
2
CoD = CoD(LTSSLTES) = sum (cidealp- crealp)2
TESe
p=TSS1
divide sum cidealp
TESe
p=TSS1
Equation 2
which is calculated in strand orientation for contigs along all exonic nucleotide position (p) from the
first annotated TSS (TSS1) up to the last annotated TES (TESe) whereby cideal are the ideal coverages
with the optimized transient regions (LrsquoTSS LrsquoTES) and creal are the real coverages scaled as such that
the total integrals along all positions of ideal and real coverages are equal
The transient function at TSS and TES is the error function erf(x) which corresponds to
Cufflinks assumption about normally distributed fragment lengths (Trapnell et al 2012) Since erf(x)
is a non-algebraic function we used the algebraic approximation by Abramowitz and Stegun
(httpsenwikipediaorgwikiError_function eq 7125) Once the optima (LrsquoTSS LrsquoTES ) are found
we declare CoD(LrsquoTSS LrsquoTES) to be the ultimate CoD value which mostly eliminated the transient region
effects We implemented an optimization algorithm (Nelder-Mead downhill simplex method) and
used as starting values (L0TSS L0
TES ) lengths of 150 In some cases the optimum found can be beyond
a reasonable range of values Therefore we censor the output Lopt of the mathematical optimization
as follows Lcensored = 50 if Lrsquo lt 50 Lcensored = 350 if Lrsquo gt 350 This corresponds to the maximal range of
not peer-reviewed) is the authorfunder All rights reserved No reuse allowed without permission The copyright holder for this preprint (which was httpdxdoiorg101101080747doi bioRxiv preprint first posted online Oct 13 2016
Spike-In RNA variant controls for RNA-Sequencing bioRxiv upload 2016-10-13
29
200plusmn150 This censoring needed to be applied in 8 cases out of 84 SIRVmixstrandend
combinations ie less than in 10
TRANSCRIPT CONCENTRATION MEASUREMENTS In order to estimate expression values on
transcript levels we applied RSEM (Li and Dewey 2011) which uses a Bayesian Network to compute
the likelihood of each fragment belonging to a given transcript Salmon (Patro et al 2015) estimates
the transcript expression values by a k-mer based mapping Similar to RSEM it uses an expectation-
maximization (EM) algorithm to compute the maximum likelihood of relative abundances Cufflinks2
(Trapnell et al 2013) estimates the transcript abundances with a coverage-based maximum
likelihood approach It determines the probability of read assignments to isoforms
DIFFERENTIAL EXPRESSION ANALYSIS We used the DESeq2 package (Love et al 2014) for
calculation of fold-differences between the results from different pipelines and different input samples
mixtures As explained in the main text all outputs from the evaluated pipelines (in form of relative
concentration measures) have been scaled Scaling by linear transformation is needed as a
consequence of the different mRNA contents in the samples but also to eventually compensate any
potential pipetting errors when small aliquots typically in the range of very few microliter are added
to individual samples The RC-samples in this experiment were produced in a large batch to ensure
high accuracy in volumetric ratios The main sample pool is practically invariant to the small relative
contribution of the controls but was technically treated in the same way by scaling the main sample
pools to identical sizes First SIRV concentrations were scaled to reach together 69 in E0 685 in E1
and 708 in E2 which is the dimensionless value identical to the fmolmicrol in the respective SIRV stock
solutions Then the lower threshold was set to 10-6 which corresponds to original FPKM values of
around 5∙10-3 ⅟7th of one read for a 1 kb long transcript at a read depth of 30 Mio reads or 1 gene
specific read to be divided between 7 equally possible transcript variants at said 1 kb length section
The threshold is to be understood as less than or equal to 10-6 which defines an averaged read
not peer-reviewed) is the authorfunder All rights reserved No reuse allowed without permission The copyright holder for this preprint (which was httpdxdoiorg101101080747doi bioRxiv preprint first posted online Oct 13 2016
Spike-In RNA variant controls for RNA-Sequencing bioRxiv upload 2016-10-13
30
resolution of the particular workflow at the given read depth By these means all ratios remain defined
Second for the DESeq2 calculations we multiplied all values with 106 after which fractions were
rounded to the closest integer We understand that for no-change hypothesis testing which is the
main purpose of the DESeq2 package transforming the relative concentrations (FPKM or TPM) to
lsquoquasi-read-countsrsquo is not recommended since DESeq2 internally corrects for library size by using size
factors However in our application we do not use the probability of the hypothesis rejection (P
values) but the raw fold changes detected (irrespectively of the dispersion values for that given
transcript) We also took into account the potential danger of censoring the input (by unintentionally
eliminating transcripts represented by extremely low FPKM or TPM values) by setting a suitable
threshold as described above The figures show only two differential expression analyses because the
3rd concentration ratio E2E0 is the product of E1E0 and E2E1
ERROR RATE ANALYSIS The four red data points two from the SIRV controls (circles) and two
from the endogenous mRNAs (squares) from the best agreement (P3 vs P1) and the four
corresponding black data points from the worst agreement (P4 vs P2) as shown in fig 5E were fitted
by linear approximation using the relationship as derived for Eqn 3
TP + FP = 1
FP = N times ER = (1-TP) times ER
(TP+FP) = TP + ER - TP times ER
(TP+FP) = (1-ER) times TP + ER Equation 3
where TP is the relative portion of true positives (differentially expressed as in our definition
possessing a LFC gt 1) N the relative portion of negatives ER the error rate at which negatives are
falsely detected as positives to result in false positives FP The least squares fitting method was
applied to derive values for the slope (1-ER) and the intercept ER
not peer-reviewed) is the authorfunder All rights reserved No reuse allowed without permission The copyright holder for this preprint (which was httpdxdoiorg101101080747doi bioRxiv preprint first posted online Oct 13 2016
Spike-In RNA variant controls for RNA-Sequencing bioRxiv upload 2016-10-13
31
The transformation of Eqn 3 leads to the relationship of Eqn 4
TP FPfrasl = (TP+FP) TPfrasl -1 Equation 4
which has been used for the graph in fig 5F In the present context the concept of ROC-curves is not
applicable because the true or false negatives are indistinguishable as long the ground truth of the
endogenous RNA are unknown
DATA ACCESS Sequencces and source data files data are in the process to be deposited at
NCBI under BioProject ID PRJNA312485
ACKNOWLEDGMENTS We thank SA Munro and M Salit (Material Measurement
Laboratory National Institute of Standards and Technology) for their efforts in further developing the
concepts of the External RNA Control Consortium (ERCC) in an updated suite of RNA controls and
analysis methods called ERCC 20 We thank A Tuerk for his contributions in finding suitable human
model genes G Wiktorin for carrying out the RSEM calculations M Mihaylova in helping with the
graphics design and I Gabler for critically reading the manuscript
AUTHOR CONTRIBUTIONS LP PK and TR designed the sequences and mixtures PK and GH
prepared the in vitro transcripts and spike-in mixtures TR AS and LP designed the research and
the experiments MA IH and TR evaluated the data TR and LP wrote the manuscript
DISCLOSURE DECLARATION The authors are employees of Lexogen GmbH from which the SIRVs
can be bought and AS has equity stakes in Lexogen GmbH LP PK and TR are named as
not peer-reviewed) is the authorfunder All rights reserved No reuse allowed without permission The copyright holder for this preprint (which was httpdxdoiorg101101080747doi bioRxiv preprint first posted online Oct 13 2016
Spike-In RNA variant controls for RNA-Sequencing bioRxiv upload 2016-10-13
32
inventors on a patent application regarding the production and use of RNA transcript variants and
Lexogen GmbH is the owner of this patent application
REFERENCES
Baker SC Bauer SR Beyer RP Brenton JD Bromley B Burrill J Causton H Conley MP Elespuru R Fero M et al 2005 The External RNA Controls Consortium a progress report Nat Methods 2(10) 731-4 Bokar JA Rottman FM 1998 Biosynthesis and Functions of Modified Nucleosides in Eukaryotic mRNA In Modification and Editing of RNA (eds Grosjean H Benne R) pp 183-200 ASM Press Washington DC Dobin A Davis CA Schlesinger F Drenkow J Zaleski C Jha S Batut P Chaisson M Gingeras TR 2013 STAR ultrafast universal RNA-seq aligner Bioinformatics 29(1) 15-21 Fed Reg Doc 2015-19742 2015 External RNA Controls Consortium - Call for Participation and Contributions to a Sequence Library Federal Register Citation 80 FR 48296 Griebel T Zacher B Ribeca P Raineri E Lacroix V Guigoacute R Sammeth M 2012 Modelling and simulating generic RNA-Seq experiments with the flux simulator Nucleic Acids Res 40(20) 10073-83 Jiang L Schlesinger F Davis CA Zhang Y Li R Salit M Gingeras TR Oliver B 2011 Synthetic spike-in standards for RNA-seq experiments Genome Res 21(9) 1543-51 Kim D Pertea G Trapnell C Pimentel H Kelley R Salzberg SL 2013 TopHat2 accurate alignment of transcriptomes in the presence of insertions deletions and gene fusions Genome Biol 14(4) R36 Kratz A Carninci P 2014 The devil in the details of RNA-seq Nat Biotechnol 32(9) 882-4 Lahens NF Kavakli IH Zhang R Hayer K Black MB Dueck H Pizarro A Kim J Irizarry R Thomas RS et al 2014 IVT-seq reveals extreme bias in RNA sequencing Genome Biol 15(6) R86 Langmead B Salzberg SL 2012 Fast gapped-read alignment with Bowtie 2 Nat Methods 9(4) 357-9 Li B Dewey CN 2011 RSEM accurate transcript quantification from RNA-Seq data with or without a reference genome BMC Bioinformatics 12 323 Li J Jiang H Wong WH 2010 Modeling non-uniformity in short-read rates in RNA-Seq data Genome Biol 11 R50 Li S Tighe SW Nicolet CM Grove D Levy S Farmerie W Viale A Wright C Schweitzer PA Gao Y et al 2014 Multi-platform assessment of transcriptome profiling using RNA-seq in the ABRF next-generation sequencing study Nat Biotechnology 32 915-25 Love MI Huber W Anders S 2014 Moderated estimation of fold change and dispersion for RNA-seq data with DESeq2 Genome Biol 15(12) 550
not peer-reviewed) is the authorfunder All rights reserved No reuse allowed without permission The copyright holder for this preprint (which was httpdxdoiorg101101080747doi bioRxiv preprint first posted online Oct 13 2016
Spike-In RNA variant controls for RNA-Sequencing bioRxiv upload 2016-10-13
33
Mortazavi A Williams BA McCue K Schaeffer L Wold B 2008 Mapping and quantifying mammalian transcriptomes by RNA-Seq Nat Methods 5(7) 621-8 Patro R Duggal G Kingsford C 2015 Accurate fast and model-aware transcript expression quantification with Salmon bioRxiv preprint doi httpdxdoiorg101101021592 Shippy R Fulmer-Smentek S Jensen RV Jones WD Wolber PK Johnson CD Pine PS Boysen C Guo X Chudin E et al 2006 Using RNA sample titrations to assess microarray platform performance and normalization techniques Nat Biotechnol 24(9) 1123-31 SEQCMAQC-III Consortium 2014 A comprehensive assessment of RNA-seq accuracy reproducibility and information content by the Sequencing Quality Control Consortium Nat Biotechnology 32 903-14 Tembe WD Pond SJ Legendre C Chuang HY Liang WS Kim NE Montel V Wong S McDaniel TK Craig DW Carpten JD 2014 Open-access synthetic spike-in mRNA-seq data for cancer gene fusions BMC Genomics 15 824 Trapnell C Roberts A Goff L Pertea G Kim D Kelley DR Pimentel H Salzberg SL Rinn JL Pachter L 2012 Differential gene and transcript expression analysis of RNA-seq experiments with TopHat and Cufflinks Nat Protoc 7(3) 562-78 Trapnell C Hendrickson DG Sauvageau M Goff L Rinn JL Pachter L 2013 Differential analysis of gene regulation at transcript resolution with RNA-seq Nat Biotechnol 31(1) 46-53 van Dijk EL Jaszczyszyn Y Thermes C 2014 Library preparation methods for next-generation sequencing tone down the bias Exp Cell Res 322(1) 12-20 Wang Z Gerstein M Snyder M 2009 RNA-Seq a revolutionary tool for transcriptomics Nat Rev Genet 1 57-63 Zheng W Chung LM Zhao H 2011 Bias detection and correction in RNA-Sequencing data BMC Bioinformatics 12290
not peer-reviewed) is the authorfunder All rights reserved No reuse allowed without permission The copyright holder for this preprint (which was httpdxdoiorg101101080747doi bioRxiv preprint first posted online Oct 13 2016
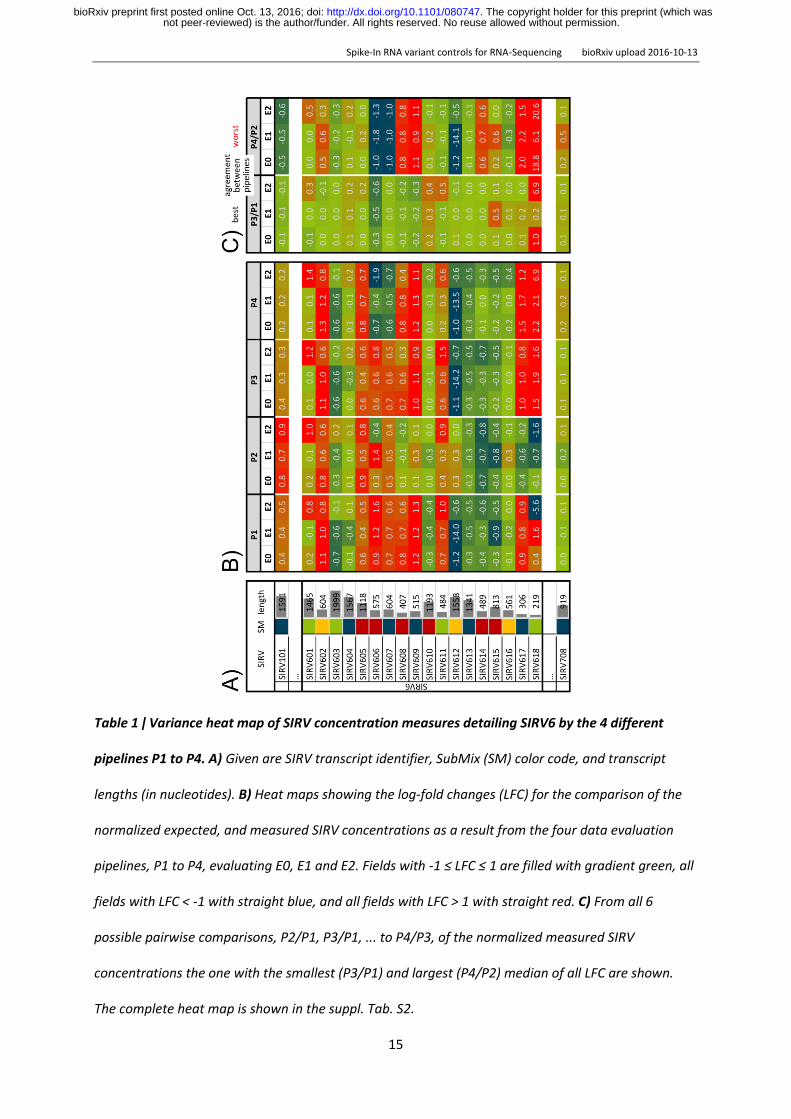
Spike-In RNA variant controls for RNA-Sequencing bioRxiv upload 2016-10-13
15
Table 1 ǀ Variance heat map of SIRV concentration measures detailing SIRV6 by the 4 different
pipelines P1 to P4 A) Given are SIRV transcript identifier SubMix (SM) color code and transcript
lengths (in nucleotides) B) Heat maps showing the log-fold changes (LFC) for the comparison of the
normalized expected and measured SIRV concentrations as a result from the four data evaluation
pipelines P1 to P4 evaluating E0 E1 and E2 Fields with -1 le LFC le 1 are filled with gradient green all
fields with LFC lt -1 with straight blue and all fields with LFC gt 1 with straight red C) From all 6
possible pairwise comparisons P2P1 P3P1 to P4P3 of the normalized measured SIRV
concentrations the one with the smallest (P3P1) and largest (P4P2) median of all LFC are shown
The complete heat map is shown in the suppl Tab S2
not peer-reviewed) is the authorfunder All rights reserved No reuse allowed without permission The copyright holder for this preprint (which was httpdxdoiorg101101080747doi bioRxiv preprint first posted online Oct 13 2016
Spike-In RNA variant controls for RNA-Sequencing bioRxiv upload 2016-10-13
16
The same pipeline comparisons were made with either all endogenous transcripts or the ones in the
higher SIRV expression range and compared to the pipeline concordances calculated with the SIRV
controls (Fig 5) We define the first bin with ǀLFCǀ lt 1 as the bin of no apparently differentially
expressed transcripts independent of the corresponding p-values The other bins contain transcripts
for which the calculated concentrations differ by more than 2-fold hence convene apparently
differentially expressed transcripts (DE) We find that SIRV controls and endogenous transcripts are
evaluated coherently While theoretically no differences are expected pipelines P3 and P1 differ in
their quantification of the same data by 44 for the SIRVs and by 69 for endogenous RNAs in the
SIRV concentration range (Fig 5A) Pipelines P2 and P4 differ to a larger extent when evaluating the
same samples (Fig 5B C) The same correlation is seen in comparisons between different samples
(shown here for RC-0 vs RC-1) The expected DE between reference RNAs UHRR and HBRR of
approximately 50 is evaluated differently by P3 vs P1 (DE of 24 ) and this is mirrored in the
evaluation of the SIRV mixes spiked into these reference RNAs (DE of 49 ) P4 vs P2 performed
worse with a pipeline difference of 39 and 103 for endogenous and SIRV transcripts The
controls show a highly similar increase when comparing P3P1 with P4P2 (21-fold from 49 to
103 ) to the endogenous RNAs (16-fold from 24 to 39 ) Here the average measurement
using the same pipeline provide a pseudo-ground truth which is compared to the measurement
using different pipelines It allows to quantify the additional error caused solely by changes in the
pipeline A change from pipeline P3 to P1 would increase the number of DE-detected transcripts to a
smaller extent than a change from P2 to P4 and this is true for both the SIRV controls and the
endogenous transcripts
not peer-reviewed) is the authorfunder All rights reserved No reuse allowed without permission The copyright holder for this preprint (which was httpdxdoiorg101101080747doi bioRxiv preprint first posted online Oct 13 2016
Spike-In RNA variant controls for RNA-Sequencing bioRxiv upload 2016-10-13
17
Figure 5 ǀ SIRV and endogenous mRNA expression analyses are affected similarly when changing
data evaluation pipelines Binned apparent LFC-moduli are shown in histograms when comparing
results obtained by different pipelines evaluating identical NGS data sets from A C) the same
samples or B D) different samples Exemplarily the comparison with the best P3 vs P1 (black
symbols) and the worst agreement P4 vs P2 (red symbols) are shown The charts compare side-by-
side the results from the SIRV controls (green) all endogenous transcripts (black outline) and
endogenous transcripts within the medium-to-high concentration range of 10 to 2250 TPM or FPKM
(blue) The average of all intra-pipeline results are shown in grey The differences Δ between
not peer-reviewed) is the authorfunder All rights reserved No reuse allowed without permission The copyright holder for this preprint (which was httpdxdoiorg101101080747doi bioRxiv preprint first posted online Oct 13 2016
Spike-In RNA variant controls for RNA-Sequencing bioRxiv upload 2016-10-13
18
analyses with the same and with different pipelines show the losses in the bins 0 lt ǀLFCǀ lt 1 and the
corresponding gain in the other bins ǀLFCǀ gt 1 The increase of the FP-rate purely caused by the
pipeline changes vs the TP range is given in the summary graphs E and F) The 1st bins 0 lt ǀLFCǀ lt 1
are divided into two 0 lt ǀLFCǀ lt 05 and 05 lt ǀLFCǀ lt 1 which facilitates the easier tracking of the
results from the SubMixes4 as shown in Fig 4 were in both figures the 1st fraction is signed with 1b
DISCUSSION
We report a significant contribution to the external RNA controls toolbox in the form of Spike-In RNA
Variants (SIRVs) that address transcription variation and alternative splicing The highly defined mixes
of 69 transcripts aligning to 7 genes enable accurate target-performance evaluations of gene
expression analysis methods which is not possible eg by analyzing larger but only loosely defined
pools of in vitro transcripts (Lahens et al 2014) or limited sets addressing special problems like
fusion genes (Tembe et al 2014) The results presented here demonstrate that the condensed
complexity of the SIRV controls mimic very closely main properties of endogenous mRNAs when
analyzing high-throughput RNA sequencing workflows for their capabilities to determine transcript
variants and their relative quantities The responses of the SIRV controls to changes in the workflows
allow to extrapolate measures for the accuracy precision and foremost inter-experiment
comparability (concordance) to the large pool of endogenous RNAs With the help of the external
controls we could confirm that biases in sequence coverage could mostly be balanced by the
exemplary chosen data evaluation algorithms and for the majority of transcripts consistent relative
abundances were obtained However in our most concordant same sample pipeline comparison
P3P1 already 44 of the controls and 69 of the endogenous RNAs in the medium to high
concentration range appeared to be differentially expressed although none of those were true
positives (TP) because the reductio ad absurdum same sample comparison was using the very same
sets of NGS reads In consequence more than 700 potential endogenous mRNA leads would be non-
validatable false positives (FP) only because of a change in data evaluation pipelines With a
not peer-reviewed) is the authorfunder All rights reserved No reuse allowed without permission The copyright holder for this preprint (which was httpdxdoiorg101101080747doi bioRxiv preprint first posted online Oct 13 2016
Spike-In RNA variant controls for RNA-Sequencing bioRxiv upload 2016-10-13
19
difference between P4 and P2 of 12 at the level of endogenous RNAs an extra 1200 FPs would
obscure the evaluation
The inter-sample comparison between UHRR and HBRR presents a rather extreme case
where around half of all transcripts were calculated to differ by more than 2-fold However the
relative FPTP weight of both comparisons remains similar as P4P2 shows again clearly higher FP-
rates in both controls and endogenous RNAs The linear interpolation (Fig 5E) allows to estimate the
effect of the experimental changes to relative small number of differences as they would be seen in
typical RNA-Seq experiments Exemplarily highlighted are the intersections at 002 and 01 in Fig 5F
TP call rates and FPTP ratios are the important figures to estimate the likelihood and inversely
related effort to validate differentially expressed transcripts For the P3P1 comparison at 2 TP we
approximate an FPTP ratio of 289 The likelihood to actually validate DE transcripts under such
circumstances would reach 035 For the P4P2 comparison the TPFP ratio estimates to mere 014
The related risks and often substantial costs for deducing potential biomarkers would be 25 times
higher Although we demonstrated in the presented example the influence of changes in data
evaluation pipeline within an integrated RNA-Seq workflow the same principles apply to the front
end - the RNA treatment NGS library preparation and sequencing Here unintended variations in
particular sample preparations can only be detected by these external spike-in controls which
operate as markers and reference spots By these means SIRV controls increase the comparability
within and between sequencing experiments at the transcript isoform level SIRVs are designed for
the co-development improvement and monitoring of library preparations sequencing and data
processing
Outlook The presented module and the 92 ERCCs which probe the wide dynamic range using
monocistronic transcripts can be stepwise extended in the future by a) ca 15 poly(A)-tail variations
of monocistronic sequences with defined lengths of 20 and 30 adenosines as well as polyadenylated
and purified RNAs with poly(A)-tail lengths close to 50 100 and above 200 nucleotides b) around 12
above-average long RNAs with 3 5 7 and 10 kb c) approx 3 RNAs each with a low medium and
not peer-reviewed) is the authorfunder All rights reserved No reuse allowed without permission The copyright holder for this preprint (which was httpdxdoiorg101101080747doi bioRxiv preprint first posted online Oct 13 2016
Spike-In RNA variant controls for RNA-Sequencing bioRxiv upload 2016-10-13
20
high GC-content d) a set of 13 mRNA relevant chemical modifications most prominent the cap-
structure (Bokar and Rottman 1998) e) variants which cover aspects of SNPs alleles inversions and
fusion genes which needs to be accounted for in the corresponding sequence annotation files and f)
a random set of small and micro RNAs that comprise all sequence variations at their termini to
account for ligation biases The external control modules need to be fine-tuned with respect to the
dynamic concentration and concentration ratio range and the reference annotations must provide a
mixture of correctly over- and under-annotated genes to better emulate the challenging conditions
for bioinformatical data evaluation Both optimizations will also further increase the congruence of
the presented SIRV module with the endogenous RNAs Eventually all modules together would
develop into a comprehensive set of approximately 250 long RNA controls plus a microRNA module
which will become sufficient for calibration and normalization purposes This new estimate reduces
the scope of designing better spike-in controls compared to the maybe thousands of IVTs which have
been previously anticipated (Kratz and Carninci 2014)
METHODS
SIRV DESIGN AND IN SILICO ANALYSIS The gene structures of seven human model genes
(KLK5 LDHD LGALS17A DAPK3 HAUS5 USF2 and TESK2) were used as scaffold for the design of
SIRV1 to SIRV7 The ENCODE-annotated transcripts as well as added variants were edited to
represent in a redundant and comprehensive manner known transcription and alternative splicing
variations (complete gene structures are shown in the odd-numbered suppl Fig from S3 to S15) All
exon sequences descend from a pool of database-derived genomes (gene fragments from viruses
and bacteriophage capsid proteins and glycoproteins selected based on a GC-content in a range of
30-50) which were modified by inverting the sequence to lose identity while maintaining a kind of
naturally occurring order in the sequences Intron sequences that do not align with exons of another
isoform were drawn from random sequences whereby the GC content was balanced to comply with
not peer-reviewed) is the authorfunder All rights reserved No reuse allowed without permission The copyright holder for this preprint (which was httpdxdoiorg101101080747doi bioRxiv preprint first posted online Oct 13 2016
Spike-In RNA variant controls for RNA-Sequencing bioRxiv upload 2016-10-13
21
the adjacent exonic sequences (Random DNA Sequence Generator
httpwwwfacultyucredu~mmadurorandomhtm)
To verify the sequence exclusivity first the exon sequences were blasted against the entire NCBI
database including ERCCs on the nucleotide and protein level (program BLASTN 2229
httpsblastncbinlmnihgov) The default BLAST parameters used were word size 28 expected
threshold 10 Max matches in query rang 20 MatchMismatch Score 1 -2 Gap Costs Linear Filter
Low complexity regions Mask for lookup table only Search of the nucleotide collection resulted for
all SIRVs in ldquono significant similarity foundrdquo Second in silico generated reads (Griebel t al 2012)
(FLUX-Generator httpsammethnetconfluencedisplaySIMHome command line flux-simulator
-p ~hellipFluxsirv1par -t simulator -x -l -s) were mapped to nine individually selected genomes using
TopHat2 (Kim et al 2013) and Bowtie2 (Langmead and Salzberg2012) Because Bowtie2-aligned
reads can be as short as 20 nt the resulting limited number of mapping reads would be deemed to
be not significant in standard NGS work-flows In contrast when mapping reads with the standard
setting of the splicing-aware TopHat2 program not a single read aligned to any of the tested
genomes Given that both searches found no significant matches off-target mapping of the SIRVs can
essentially be ruled out Therefore the artificial SIRV sequences are suitable for noninterfering
qualitative and quantitative assessments in the context of known genomic systems and
complementary to the ERCC sequences (National Institute of Standards and Technology (NIST)
certified DNA plasmids Standard Reference Materialreg 2374) The SIRV sequences can be found at
httpswwwlexogencomsirvssirvsdownloads in the Source Data files and they are also
deposited at the NCBI Nucleotide Database (PRJNA312485)
SIRV CONSTRUCTS AND THE PRODUCTION OF IN-VITRO TRANSCRIPTS Synthetic gene constructs
were produced (Bio Basic Inc Markham ON Canada) that comprised 5rsquo to 3rsquo a unique restriction
site a T7 RNA polymerase promoter whose 3rsquo G is the first nucleotide of the actual SIRV sequence
which is seamlessly followed by a (A30)-tail that is fused with an exclusive 2nd restriction site These
not peer-reviewed) is the authorfunder All rights reserved No reuse allowed without permission The copyright holder for this preprint (which was httpdxdoiorg101101080747doi bioRxiv preprint first posted online Oct 13 2016
Spike-In RNA variant controls for RNA-Sequencing bioRxiv upload 2016-10-13
22
gene cassettes were cloned into a vector colony-amplified and singularized All SIRV sequence in the
purified plasmids were verified by Sanger-sequencing to identify the correct clones The E coli
cultures were grown in batches to obtain plasmids in the lower microg-scale Double digestion of isolated
plasmids with XhoI and NsiI showed correct insert size and complete restriction Linearized silica-
purified plasmids served as templates in in vitro transcription reactions using T7 transcription kits
(AmpliScribe T7 High Yield Transcription Kit and AmpliScribe T7 Flash Transcription Kit Epicentre
Madison WI) The DNase-treated phenol-extracted and silica-purified in vitro transcription products
were assessed for concentration and purity by spectrophotometry (NanoDrop Thermo Fisher
Scientific Waltham MA) and for integrity by capillary electrophoresis (2100 Bioanalyzer RNA 6000
Pico Kit Agilent Technologies Santa Clara CA)
In the context of variant verification RNA integrity is a very important measure Fragments
arising from incomplete transcription might impose errors on the correct determination of variants
which share those sequences and thereby also affect the overall gene coverage The integrity of the
transcription products was very heterogeneous as expected given the broad sequence variation and
the length of the SIRV transcripts (average 11 kb with 14 RNAs between 20 and 25 kb) A majority
of transcripts therefore had to be purified by at least one of two purification methods Purification
method PP1 is selective for poly(A)-tails and neglects prematurely terminated transcription products
Purification method PP2 is based on size-selective quantitative electrophoresis separating the
correctly sized main products from shorter fragments (transcription break off and degraded
products) and longer fragments (run-through transcription products) After purification the 69 SIRV
RNAs were assessed to be on average 736plusmn343 in the pre-peak fraction 9031plusmn372 in the
main-peak fraction (corresponding to RNAs of correct length) and 236plusmn304 in the post-peak
fraction (mass percentages wt) Noteworthy the risks of a beginning degradation during the initial
denaturation (2 min at 70degC) and the not fully denaturing conditions during RNA microcapillary
electrophoresis tiny noise levels in the baseline and slightly different shapes of the main peak result
in a rather over- than underestimation of pre- and post-peak fractions
not peer-reviewed) is the authorfunder All rights reserved No reuse allowed without permission The copyright holder for this preprint (which was httpdxdoiorg101101080747doi bioRxiv preprint first posted online Oct 13 2016
Spike-In RNA variant controls for RNA-Sequencing bioRxiv upload 2016-10-13
23
rRNasin (Promega Madison WI) was added to 08 Umicrol to minimize the risks of RNase
contamination induced RNA degradation The SIRVs were quantified by absorbance spectroscopy to
adjust all stock solutions to a base concentration of close to but above 50 ngmicrol RNA purity was very
high with A 260280 214plusmn012 and A 260230 217plusmn020
SIRV MIXING SIRV mixes were designed that contain pools of SIRVs (SubMixes) in defined
amounts and ratios by combining accurate volumes of the stock solutions in sufficiently large batch
sizes Pipetting errors vary depending on transfer volumes and range from plusmn4 for 2 microl to plusmn08 for
gt100 microl transfers The precision was experimentally determined with blank solutions Starting with
the stock concentration measurement (NanoDrop accuracy plusmn2 ngmicrol for 50 ngmicrol or plusmn4 ) and
accounting for the entire mixing pathway the accumulative concentration error is expected to range
between plusmn8 and plusmn47 Therefore in the data evaluation one has to account for the experimental
fuzziness by allowing for lower accuracy thresholds of plusmn8 on the linear scale or plusmn011 on the log2-
fold scale respectively The SIRV concentration ratios between two mixes are more precise because
only one final pipetting step defines the concentration differences and synchronizes all SIRVs which
belong to the same SubMix Here a maximal error of plusmn4 (or plusmn0057 on the log2-fold scale) can be
expected between SubMixes while all SIRVs of the same SubMix must propagate coherently into the
final mixes Bioanalyzer traces were used to monitor the relative propagation of the SIRVs PreMixes
and SubMixes during the mixing (Fig 2B) In addition the accurate pipetting of the 8 PreMixes was
controlled by checksums of Nanodrop concentration measurements which deviated by only
0002plusmn34 from the calculated target concentrations and by weighing on an analytical balance
which showed a deviation of 18plusmn065 The final concentration of the SIRV mixes are set to be 253
ngmicrol
not peer-reviewed) is the authorfunder All rights reserved No reuse allowed without permission The copyright holder for this preprint (which was httpdxdoiorg101101080747doi bioRxiv preprint first posted online Oct 13 2016
Spike-In RNA variant controls for RNA-Sequencing bioRxiv upload 2016-10-13
24
SPIKING OF REFERENCE RNA WITH SIRV MIXES In general SIRV mixes can be used with crude
cell extracts purified total RNA rRNA-depleted RNA or poly(A)-enriched RNA Important the spike-in
ratios have to be chosen in concordance with the desired final SIRV content the RNA preparation
method and if known the expected mRNA content One widely applicable spike-in ratio can be
obtained by adding 006 ng of controls to approximately 100 ng of total RNA In the presented
examples the total RNA mass of one single aliquot RNA was 100 ng of UHRR in RC-0 and 1128 ng of
HBRR in RC-1 The reference RNA in RC-2 was calculated to be 10427 ng (Fig S2) The high-
concentrated and thereby stable SIRV mix stocks with 253 ngmicrol and ERCC mix stocks with 30 ngmicrol
(ERCC Spike-In Mixes 1 and 2 by Ambion Thermo Fisher Waltham MA) were diluted just prior to the
spiking to facilitate the mixing of manageable volumes For example the final 11000 dilution
reduced the SIRV mix concentration to 253 pgmicrol from which 237 microl were required to spike a 100 ng
total RNA sample with 006 ng SIRVs The RC-samples were produced in large batches to yield
hundreds of samples allowing for a protocol with fewer dilutions and larger volumes reducing
thereby sources of experimental errors
NGS LIBRARY PREPARATION AND SEQUENCING The experiments were carried out in technical
triplicates From 1 microg RC-0 RC-1 or RC-2 RNA in total nine NGS libraries were prepared by Fasteris SA
(Plan-les-Ouates CH) using the TruSeq stranded mRNA library preparation kit with polyA selection
(Illumina Inc San Diego CA) All primary library templates were amplified with 14 PCR cycles to
reach reproducible concentrations 155plusmn45 nM and insert sizes 165plusmn10 bp An equimolar lane-mix
was sequenced at the CSF Campus Science Support Facilities GmbH (CSF Vienna AUT) in PE125
mode in one lane of a HiSeq 2500 flowcell in 125 bp paired-end mode using V4 chemistry The run
yielded 305 M raw reads 293 M after demultiplexing and trimming which corresponds to a read
depth of 326plusmn22 M reads per library
not peer-reviewed) is the authorfunder All rights reserved No reuse allowed without permission The copyright holder for this preprint (which was httpdxdoiorg101101080747doi bioRxiv preprint first posted online Oct 13 2016
Spike-In RNA variant controls for RNA-Sequencing bioRxiv upload 2016-10-13
25
READ PROCESSING AND MAPPING Standard data processing routines (bbduk part of BBMap by
B Bushnell to be found at sourceforgenetprojectsbbmap) were applied removing low quality
reads and trimming adapter sequences Due to variable stringencies the mappers produced different
read statistics STAR mapped against the genome 897plusmn59 of the reads (864plusmn56 uniquely) and
TopHat2 852plusmn57 (794plusmn52 uniquely) Bowtie2 mapped against the transcriptome 693plusmn18
reads (151plusmn15 uniquely)
ESTIMATION OF THE MRNA CONTENTS Based on the obtained read distributions the relative
mass partition between external controls and endogenous RNA fraction can be estimated Because
the library preparation uses a poly(A)-enrichment step the targeted endogenous RNA corresponds
almost exclusively to the mRNA content of the samples The propagation of the input mass ratio to
the output read ratio depends on both the mRNA content and the efficiencies of how controls and
mRNA proceed through the library preparation The relationship is described by Eqn 1
reRNA times prod(1 rconifrasl )
j
i=1
= (EeRNA times meRNA) times prod(1 (Econi times mconi)frasl )
j
i=1
Equation 1
with r number of reads from eRNA the endogenous RNA fraction here mRNA and con the
controls here SIRVs and ERCC E the relative efficiency of how the fraction proceeds through the
workflow and m the input mass
Ratios are measured as relative read counts and the results as a product of efficiencies and
apparent amounts are also relative measures Therefore at least one de facto arbitrary reference
point needs to be defined to deduce comparable absolute results Several reference points or
default values can be defined which lead to different dependent variables and imply slightly variable
interpretation of the results The following three calculation examples are simple deductions from
not peer-reviewed) is the authorfunder All rights reserved No reuse allowed without permission The copyright holder for this preprint (which was httpdxdoiorg101101080747doi bioRxiv preprint first posted online Oct 13 2016
Spike-In RNA variant controls for RNA-Sequencing bioRxiv upload 2016-10-13
26
the ratio shown in Eqn 1 with the ERCC (con1) and the SIRVs (con2) respectively Variation 1 is
explained in greater detail while in the other variants only the differing aspects are highlighted
Variation 1 i) Here the first assumption is that the mRNA content in UHRR (Agilent Santa
Clara CA) is 3 (factor 003) and 2 (factor 002) in HBRR (Ambion Thermo Fisher Waltham MA)
which stays in close agreement to previous estimates concluded from experiments by Shippy et al in
2006 The amounts of total RNA were measured by Nanodrop absorbance spectroscopy The UHRR
samples contained 100 ng and the HBRR samples 1128 ng The mixing ratio of (2times RC-0) (1times RC-1)
determines the concentration of the 3rd sample RC-2 and further the amount of total RNA (10427
ng) as well as its related mRNA content (2times100 ng times 3 + 1times1128 ng times 2 ) (2times100 ng + 1times1128
ng) = 264 (factor 0026) The mRNA masses of the samples are calculated by the measured total
RNA input amounts and default mRNA contents are 3 ng 2256 ng and 2752 ng The second
assumption is that the endogenous mRNAs proceed with the maximal efficiency of 100 (factor 1)
through library preparation and sequencing The input of the spike-in controls is the product of the
concentration values which were either measured as in the case of the SIRV stocks or stated by the
vendor as in the case of the ERCC stocks and the pipetted volumes Both are treated as de facto
measured values
ii) The relative amounts of reads which have been assigned to either endogenous mRNA
ERCCs or SIRVs are obtained from the mapping statistics (read classification)
iii) The ratio of mass input to reads output allows to calculate the propagation efficiency of
the controls relative to the default efficiency of the endogenous mRNA In the present experiment
the SIRVs progress with a relative efficiency of 867plusmn57 and the ERCCs with 416plusmn47 The
significant difference between the relative efficiency of both controls is very likely caused by the
different lengths of the poly(A)-tails which might influence a different binding efficiency during
poly(A)-enrichment step The SIRVs with a 30 nt long poly(A)-tail perform much more in concordance
with the endogenous mRNA as the ERCCs which contain shorter and variable poly(A)-tails ( 23 nt)
The observed small differences in the experiments using RC-0 RC-1 or RC-2 could be caused by a
not peer-reviewed) is the authorfunder All rights reserved No reuse allowed without permission The copyright holder for this preprint (which was httpdxdoiorg101101080747doi bioRxiv preprint first posted online Oct 13 2016
Spike-In RNA variant controls for RNA-Sequencing bioRxiv upload 2016-10-13
27
two-way interference of samples and controls However the deviations are small and can rather be a
result of minor inaccuracies in determining the relative input amounts Both hypotheses would need
to be verified by a series of repeats with the aim to resolve potential influences of pipetting during
the sample preparation variations in the library preparation and other contributions
Variation 2 Here no varying interferences between samples and controls are permitted
which means that relative efficiencies of the controls are considered to be constant The causes of
the experimental variations are exclusively assigned to the input amounts (alike hypothesis two in
the above example in discussing the deviation of the results in RC-2) This would translate into input
standard deviations of 118 (SIRVs) and 76 (ERCCs) The variations meld all accumulating errors
made in determining the concentration of the control stock solutions preparing the subsequent
dilutions pipetting the samples and controls during the spike-in step itself as well as determining the
amount of sample RNA in the first place Against the background of potential errors the calculated
results can be considered as highly consistent
Variation 3 In addition to the assumptions made for the measurement of sample RC-0
the spike-in of 006 ng SIRVs to all samples is also set as default Alike variation 2 the experiments in
RC-1 and RC-2 adopt the same default setting for the relative efficiencies calculated in RC-0
According to the ratio of Eqn 1 one can obtain mRNA contents as well as ERCC input amounts in this
case for samples RC-1 and RC-2 The mRNA content of the HBRR sample (RC-1) relative to the default
mRNA content in the UHRR sample (set to 3 ) would be 172 lower than the previously assumed
2 According to the present mixing scheme it would also imply that sample RC-2 has an mRNA
content of 254 up from the calculated 234 The offsets of -79 is again small and very likely
refers to the level of accuracy in the experimental results as discussed above Using this method the
spiking of samples with controls such as the SIRVs allows to closely estimate the relative mRNA
content of any unknown sample and to draw conclusions eg on the transcriptional state of tissues
cell suspension or individual cells
not peer-reviewed) is the authorfunder All rights reserved No reuse allowed without permission The copyright holder for this preprint (which was httpdxdoiorg101101080747doi bioRxiv preprint first posted online Oct 13 2016
Spike-In RNA variant controls for RNA-Sequencing bioRxiv upload 2016-10-13
28
COEFFICIENT OF DEVIATION We implemented a strand specific Coefficient of Deviation
(CoD) which aims to reflect the quality of NGS pipelines targeted at specific effects in particular
lsquospikenessrsquo of the coverage while systematic effects like drop of the coverage at Transcription Start
Sites (TSS) and Transcription End Sites (TES) are being suppressed The CoD is implemented by Eqn
2
CoD = CoD(LTSSLTES) = sum (cidealp- crealp)2
TESe
p=TSS1
divide sum cidealp
TESe
p=TSS1
Equation 2
which is calculated in strand orientation for contigs along all exonic nucleotide position (p) from the
first annotated TSS (TSS1) up to the last annotated TES (TESe) whereby cideal are the ideal coverages
with the optimized transient regions (LrsquoTSS LrsquoTES) and creal are the real coverages scaled as such that
the total integrals along all positions of ideal and real coverages are equal
The transient function at TSS and TES is the error function erf(x) which corresponds to
Cufflinks assumption about normally distributed fragment lengths (Trapnell et al 2012) Since erf(x)
is a non-algebraic function we used the algebraic approximation by Abramowitz and Stegun
(httpsenwikipediaorgwikiError_function eq 7125) Once the optima (LrsquoTSS LrsquoTES ) are found
we declare CoD(LrsquoTSS LrsquoTES) to be the ultimate CoD value which mostly eliminated the transient region
effects We implemented an optimization algorithm (Nelder-Mead downhill simplex method) and
used as starting values (L0TSS L0
TES ) lengths of 150 In some cases the optimum found can be beyond
a reasonable range of values Therefore we censor the output Lopt of the mathematical optimization
as follows Lcensored = 50 if Lrsquo lt 50 Lcensored = 350 if Lrsquo gt 350 This corresponds to the maximal range of
not peer-reviewed) is the authorfunder All rights reserved No reuse allowed without permission The copyright holder for this preprint (which was httpdxdoiorg101101080747doi bioRxiv preprint first posted online Oct 13 2016
Spike-In RNA variant controls for RNA-Sequencing bioRxiv upload 2016-10-13
29
200plusmn150 This censoring needed to be applied in 8 cases out of 84 SIRVmixstrandend
combinations ie less than in 10
TRANSCRIPT CONCENTRATION MEASUREMENTS In order to estimate expression values on
transcript levels we applied RSEM (Li and Dewey 2011) which uses a Bayesian Network to compute
the likelihood of each fragment belonging to a given transcript Salmon (Patro et al 2015) estimates
the transcript expression values by a k-mer based mapping Similar to RSEM it uses an expectation-
maximization (EM) algorithm to compute the maximum likelihood of relative abundances Cufflinks2
(Trapnell et al 2013) estimates the transcript abundances with a coverage-based maximum
likelihood approach It determines the probability of read assignments to isoforms
DIFFERENTIAL EXPRESSION ANALYSIS We used the DESeq2 package (Love et al 2014) for
calculation of fold-differences between the results from different pipelines and different input samples
mixtures As explained in the main text all outputs from the evaluated pipelines (in form of relative
concentration measures) have been scaled Scaling by linear transformation is needed as a
consequence of the different mRNA contents in the samples but also to eventually compensate any
potential pipetting errors when small aliquots typically in the range of very few microliter are added
to individual samples The RC-samples in this experiment were produced in a large batch to ensure
high accuracy in volumetric ratios The main sample pool is practically invariant to the small relative
contribution of the controls but was technically treated in the same way by scaling the main sample
pools to identical sizes First SIRV concentrations were scaled to reach together 69 in E0 685 in E1
and 708 in E2 which is the dimensionless value identical to the fmolmicrol in the respective SIRV stock
solutions Then the lower threshold was set to 10-6 which corresponds to original FPKM values of
around 5∙10-3 ⅟7th of one read for a 1 kb long transcript at a read depth of 30 Mio reads or 1 gene
specific read to be divided between 7 equally possible transcript variants at said 1 kb length section
The threshold is to be understood as less than or equal to 10-6 which defines an averaged read
not peer-reviewed) is the authorfunder All rights reserved No reuse allowed without permission The copyright holder for this preprint (which was httpdxdoiorg101101080747doi bioRxiv preprint first posted online Oct 13 2016
Spike-In RNA variant controls for RNA-Sequencing bioRxiv upload 2016-10-13
30
resolution of the particular workflow at the given read depth By these means all ratios remain defined
Second for the DESeq2 calculations we multiplied all values with 106 after which fractions were
rounded to the closest integer We understand that for no-change hypothesis testing which is the
main purpose of the DESeq2 package transforming the relative concentrations (FPKM or TPM) to
lsquoquasi-read-countsrsquo is not recommended since DESeq2 internally corrects for library size by using size
factors However in our application we do not use the probability of the hypothesis rejection (P
values) but the raw fold changes detected (irrespectively of the dispersion values for that given
transcript) We also took into account the potential danger of censoring the input (by unintentionally
eliminating transcripts represented by extremely low FPKM or TPM values) by setting a suitable
threshold as described above The figures show only two differential expression analyses because the
3rd concentration ratio E2E0 is the product of E1E0 and E2E1
ERROR RATE ANALYSIS The four red data points two from the SIRV controls (circles) and two
from the endogenous mRNAs (squares) from the best agreement (P3 vs P1) and the four
corresponding black data points from the worst agreement (P4 vs P2) as shown in fig 5E were fitted
by linear approximation using the relationship as derived for Eqn 3
TP + FP = 1
FP = N times ER = (1-TP) times ER
(TP+FP) = TP + ER - TP times ER
(TP+FP) = (1-ER) times TP + ER Equation 3
where TP is the relative portion of true positives (differentially expressed as in our definition
possessing a LFC gt 1) N the relative portion of negatives ER the error rate at which negatives are
falsely detected as positives to result in false positives FP The least squares fitting method was
applied to derive values for the slope (1-ER) and the intercept ER
not peer-reviewed) is the authorfunder All rights reserved No reuse allowed without permission The copyright holder for this preprint (which was httpdxdoiorg101101080747doi bioRxiv preprint first posted online Oct 13 2016
Spike-In RNA variant controls for RNA-Sequencing bioRxiv upload 2016-10-13
31
The transformation of Eqn 3 leads to the relationship of Eqn 4
TP FPfrasl = (TP+FP) TPfrasl -1 Equation 4
which has been used for the graph in fig 5F In the present context the concept of ROC-curves is not
applicable because the true or false negatives are indistinguishable as long the ground truth of the
endogenous RNA are unknown
DATA ACCESS Sequencces and source data files data are in the process to be deposited at
NCBI under BioProject ID PRJNA312485
ACKNOWLEDGMENTS We thank SA Munro and M Salit (Material Measurement
Laboratory National Institute of Standards and Technology) for their efforts in further developing the
concepts of the External RNA Control Consortium (ERCC) in an updated suite of RNA controls and
analysis methods called ERCC 20 We thank A Tuerk for his contributions in finding suitable human
model genes G Wiktorin for carrying out the RSEM calculations M Mihaylova in helping with the
graphics design and I Gabler for critically reading the manuscript
AUTHOR CONTRIBUTIONS LP PK and TR designed the sequences and mixtures PK and GH
prepared the in vitro transcripts and spike-in mixtures TR AS and LP designed the research and
the experiments MA IH and TR evaluated the data TR and LP wrote the manuscript
DISCLOSURE DECLARATION The authors are employees of Lexogen GmbH from which the SIRVs
can be bought and AS has equity stakes in Lexogen GmbH LP PK and TR are named as
not peer-reviewed) is the authorfunder All rights reserved No reuse allowed without permission The copyright holder for this preprint (which was httpdxdoiorg101101080747doi bioRxiv preprint first posted online Oct 13 2016
Spike-In RNA variant controls for RNA-Sequencing bioRxiv upload 2016-10-13
32
inventors on a patent application regarding the production and use of RNA transcript variants and
Lexogen GmbH is the owner of this patent application
REFERENCES
Baker SC Bauer SR Beyer RP Brenton JD Bromley B Burrill J Causton H Conley MP Elespuru R Fero M et al 2005 The External RNA Controls Consortium a progress report Nat Methods 2(10) 731-4 Bokar JA Rottman FM 1998 Biosynthesis and Functions of Modified Nucleosides in Eukaryotic mRNA In Modification and Editing of RNA (eds Grosjean H Benne R) pp 183-200 ASM Press Washington DC Dobin A Davis CA Schlesinger F Drenkow J Zaleski C Jha S Batut P Chaisson M Gingeras TR 2013 STAR ultrafast universal RNA-seq aligner Bioinformatics 29(1) 15-21 Fed Reg Doc 2015-19742 2015 External RNA Controls Consortium - Call for Participation and Contributions to a Sequence Library Federal Register Citation 80 FR 48296 Griebel T Zacher B Ribeca P Raineri E Lacroix V Guigoacute R Sammeth M 2012 Modelling and simulating generic RNA-Seq experiments with the flux simulator Nucleic Acids Res 40(20) 10073-83 Jiang L Schlesinger F Davis CA Zhang Y Li R Salit M Gingeras TR Oliver B 2011 Synthetic spike-in standards for RNA-seq experiments Genome Res 21(9) 1543-51 Kim D Pertea G Trapnell C Pimentel H Kelley R Salzberg SL 2013 TopHat2 accurate alignment of transcriptomes in the presence of insertions deletions and gene fusions Genome Biol 14(4) R36 Kratz A Carninci P 2014 The devil in the details of RNA-seq Nat Biotechnol 32(9) 882-4 Lahens NF Kavakli IH Zhang R Hayer K Black MB Dueck H Pizarro A Kim J Irizarry R Thomas RS et al 2014 IVT-seq reveals extreme bias in RNA sequencing Genome Biol 15(6) R86 Langmead B Salzberg SL 2012 Fast gapped-read alignment with Bowtie 2 Nat Methods 9(4) 357-9 Li B Dewey CN 2011 RSEM accurate transcript quantification from RNA-Seq data with or without a reference genome BMC Bioinformatics 12 323 Li J Jiang H Wong WH 2010 Modeling non-uniformity in short-read rates in RNA-Seq data Genome Biol 11 R50 Li S Tighe SW Nicolet CM Grove D Levy S Farmerie W Viale A Wright C Schweitzer PA Gao Y et al 2014 Multi-platform assessment of transcriptome profiling using RNA-seq in the ABRF next-generation sequencing study Nat Biotechnology 32 915-25 Love MI Huber W Anders S 2014 Moderated estimation of fold change and dispersion for RNA-seq data with DESeq2 Genome Biol 15(12) 550
not peer-reviewed) is the authorfunder All rights reserved No reuse allowed without permission The copyright holder for this preprint (which was httpdxdoiorg101101080747doi bioRxiv preprint first posted online Oct 13 2016
Spike-In RNA variant controls for RNA-Sequencing bioRxiv upload 2016-10-13
33
Mortazavi A Williams BA McCue K Schaeffer L Wold B 2008 Mapping and quantifying mammalian transcriptomes by RNA-Seq Nat Methods 5(7) 621-8 Patro R Duggal G Kingsford C 2015 Accurate fast and model-aware transcript expression quantification with Salmon bioRxiv preprint doi httpdxdoiorg101101021592 Shippy R Fulmer-Smentek S Jensen RV Jones WD Wolber PK Johnson CD Pine PS Boysen C Guo X Chudin E et al 2006 Using RNA sample titrations to assess microarray platform performance and normalization techniques Nat Biotechnol 24(9) 1123-31 SEQCMAQC-III Consortium 2014 A comprehensive assessment of RNA-seq accuracy reproducibility and information content by the Sequencing Quality Control Consortium Nat Biotechnology 32 903-14 Tembe WD Pond SJ Legendre C Chuang HY Liang WS Kim NE Montel V Wong S McDaniel TK Craig DW Carpten JD 2014 Open-access synthetic spike-in mRNA-seq data for cancer gene fusions BMC Genomics 15 824 Trapnell C Roberts A Goff L Pertea G Kim D Kelley DR Pimentel H Salzberg SL Rinn JL Pachter L 2012 Differential gene and transcript expression analysis of RNA-seq experiments with TopHat and Cufflinks Nat Protoc 7(3) 562-78 Trapnell C Hendrickson DG Sauvageau M Goff L Rinn JL Pachter L 2013 Differential analysis of gene regulation at transcript resolution with RNA-seq Nat Biotechnol 31(1) 46-53 van Dijk EL Jaszczyszyn Y Thermes C 2014 Library preparation methods for next-generation sequencing tone down the bias Exp Cell Res 322(1) 12-20 Wang Z Gerstein M Snyder M 2009 RNA-Seq a revolutionary tool for transcriptomics Nat Rev Genet 1 57-63 Zheng W Chung LM Zhao H 2011 Bias detection and correction in RNA-Sequencing data BMC Bioinformatics 12290
not peer-reviewed) is the authorfunder All rights reserved No reuse allowed without permission The copyright holder for this preprint (which was httpdxdoiorg101101080747doi bioRxiv preprint first posted online Oct 13 2016
Spike-In RNA variant controls for RNA-Sequencing bioRxiv upload 2016-10-13
16
The same pipeline comparisons were made with either all endogenous transcripts or the ones in the
higher SIRV expression range and compared to the pipeline concordances calculated with the SIRV
controls (Fig 5) We define the first bin with ǀLFCǀ lt 1 as the bin of no apparently differentially
expressed transcripts independent of the corresponding p-values The other bins contain transcripts
for which the calculated concentrations differ by more than 2-fold hence convene apparently
differentially expressed transcripts (DE) We find that SIRV controls and endogenous transcripts are
evaluated coherently While theoretically no differences are expected pipelines P3 and P1 differ in
their quantification of the same data by 44 for the SIRVs and by 69 for endogenous RNAs in the
SIRV concentration range (Fig 5A) Pipelines P2 and P4 differ to a larger extent when evaluating the
same samples (Fig 5B C) The same correlation is seen in comparisons between different samples
(shown here for RC-0 vs RC-1) The expected DE between reference RNAs UHRR and HBRR of
approximately 50 is evaluated differently by P3 vs P1 (DE of 24 ) and this is mirrored in the
evaluation of the SIRV mixes spiked into these reference RNAs (DE of 49 ) P4 vs P2 performed
worse with a pipeline difference of 39 and 103 for endogenous and SIRV transcripts The
controls show a highly similar increase when comparing P3P1 with P4P2 (21-fold from 49 to
103 ) to the endogenous RNAs (16-fold from 24 to 39 ) Here the average measurement
using the same pipeline provide a pseudo-ground truth which is compared to the measurement
using different pipelines It allows to quantify the additional error caused solely by changes in the
pipeline A change from pipeline P3 to P1 would increase the number of DE-detected transcripts to a
smaller extent than a change from P2 to P4 and this is true for both the SIRV controls and the
endogenous transcripts
not peer-reviewed) is the authorfunder All rights reserved No reuse allowed without permission The copyright holder for this preprint (which was httpdxdoiorg101101080747doi bioRxiv preprint first posted online Oct 13 2016
Spike-In RNA variant controls for RNA-Sequencing bioRxiv upload 2016-10-13
17
Figure 5 ǀ SIRV and endogenous mRNA expression analyses are affected similarly when changing
data evaluation pipelines Binned apparent LFC-moduli are shown in histograms when comparing
results obtained by different pipelines evaluating identical NGS data sets from A C) the same
samples or B D) different samples Exemplarily the comparison with the best P3 vs P1 (black
symbols) and the worst agreement P4 vs P2 (red symbols) are shown The charts compare side-by-
side the results from the SIRV controls (green) all endogenous transcripts (black outline) and
endogenous transcripts within the medium-to-high concentration range of 10 to 2250 TPM or FPKM
(blue) The average of all intra-pipeline results are shown in grey The differences Δ between
not peer-reviewed) is the authorfunder All rights reserved No reuse allowed without permission The copyright holder for this preprint (which was httpdxdoiorg101101080747doi bioRxiv preprint first posted online Oct 13 2016
Spike-In RNA variant controls for RNA-Sequencing bioRxiv upload 2016-10-13
18
analyses with the same and with different pipelines show the losses in the bins 0 lt ǀLFCǀ lt 1 and the
corresponding gain in the other bins ǀLFCǀ gt 1 The increase of the FP-rate purely caused by the
pipeline changes vs the TP range is given in the summary graphs E and F) The 1st bins 0 lt ǀLFCǀ lt 1
are divided into two 0 lt ǀLFCǀ lt 05 and 05 lt ǀLFCǀ lt 1 which facilitates the easier tracking of the
results from the SubMixes4 as shown in Fig 4 were in both figures the 1st fraction is signed with 1b
DISCUSSION
We report a significant contribution to the external RNA controls toolbox in the form of Spike-In RNA
Variants (SIRVs) that address transcription variation and alternative splicing The highly defined mixes
of 69 transcripts aligning to 7 genes enable accurate target-performance evaluations of gene
expression analysis methods which is not possible eg by analyzing larger but only loosely defined
pools of in vitro transcripts (Lahens et al 2014) or limited sets addressing special problems like
fusion genes (Tembe et al 2014) The results presented here demonstrate that the condensed
complexity of the SIRV controls mimic very closely main properties of endogenous mRNAs when
analyzing high-throughput RNA sequencing workflows for their capabilities to determine transcript
variants and their relative quantities The responses of the SIRV controls to changes in the workflows
allow to extrapolate measures for the accuracy precision and foremost inter-experiment
comparability (concordance) to the large pool of endogenous RNAs With the help of the external
controls we could confirm that biases in sequence coverage could mostly be balanced by the
exemplary chosen data evaluation algorithms and for the majority of transcripts consistent relative
abundances were obtained However in our most concordant same sample pipeline comparison
P3P1 already 44 of the controls and 69 of the endogenous RNAs in the medium to high
concentration range appeared to be differentially expressed although none of those were true
positives (TP) because the reductio ad absurdum same sample comparison was using the very same
sets of NGS reads In consequence more than 700 potential endogenous mRNA leads would be non-
validatable false positives (FP) only because of a change in data evaluation pipelines With a
not peer-reviewed) is the authorfunder All rights reserved No reuse allowed without permission The copyright holder for this preprint (which was httpdxdoiorg101101080747doi bioRxiv preprint first posted online Oct 13 2016
Spike-In RNA variant controls for RNA-Sequencing bioRxiv upload 2016-10-13
19
difference between P4 and P2 of 12 at the level of endogenous RNAs an extra 1200 FPs would
obscure the evaluation
The inter-sample comparison between UHRR and HBRR presents a rather extreme case
where around half of all transcripts were calculated to differ by more than 2-fold However the
relative FPTP weight of both comparisons remains similar as P4P2 shows again clearly higher FP-
rates in both controls and endogenous RNAs The linear interpolation (Fig 5E) allows to estimate the
effect of the experimental changes to relative small number of differences as they would be seen in
typical RNA-Seq experiments Exemplarily highlighted are the intersections at 002 and 01 in Fig 5F
TP call rates and FPTP ratios are the important figures to estimate the likelihood and inversely
related effort to validate differentially expressed transcripts For the P3P1 comparison at 2 TP we
approximate an FPTP ratio of 289 The likelihood to actually validate DE transcripts under such
circumstances would reach 035 For the P4P2 comparison the TPFP ratio estimates to mere 014
The related risks and often substantial costs for deducing potential biomarkers would be 25 times
higher Although we demonstrated in the presented example the influence of changes in data
evaluation pipeline within an integrated RNA-Seq workflow the same principles apply to the front
end - the RNA treatment NGS library preparation and sequencing Here unintended variations in
particular sample preparations can only be detected by these external spike-in controls which
operate as markers and reference spots By these means SIRV controls increase the comparability
within and between sequencing experiments at the transcript isoform level SIRVs are designed for
the co-development improvement and monitoring of library preparations sequencing and data
processing
Outlook The presented module and the 92 ERCCs which probe the wide dynamic range using
monocistronic transcripts can be stepwise extended in the future by a) ca 15 poly(A)-tail variations
of monocistronic sequences with defined lengths of 20 and 30 adenosines as well as polyadenylated
and purified RNAs with poly(A)-tail lengths close to 50 100 and above 200 nucleotides b) around 12
above-average long RNAs with 3 5 7 and 10 kb c) approx 3 RNAs each with a low medium and
not peer-reviewed) is the authorfunder All rights reserved No reuse allowed without permission The copyright holder for this preprint (which was httpdxdoiorg101101080747doi bioRxiv preprint first posted online Oct 13 2016
Spike-In RNA variant controls for RNA-Sequencing bioRxiv upload 2016-10-13
20
high GC-content d) a set of 13 mRNA relevant chemical modifications most prominent the cap-
structure (Bokar and Rottman 1998) e) variants which cover aspects of SNPs alleles inversions and
fusion genes which needs to be accounted for in the corresponding sequence annotation files and f)
a random set of small and micro RNAs that comprise all sequence variations at their termini to
account for ligation biases The external control modules need to be fine-tuned with respect to the
dynamic concentration and concentration ratio range and the reference annotations must provide a
mixture of correctly over- and under-annotated genes to better emulate the challenging conditions
for bioinformatical data evaluation Both optimizations will also further increase the congruence of
the presented SIRV module with the endogenous RNAs Eventually all modules together would
develop into a comprehensive set of approximately 250 long RNA controls plus a microRNA module
which will become sufficient for calibration and normalization purposes This new estimate reduces
the scope of designing better spike-in controls compared to the maybe thousands of IVTs which have
been previously anticipated (Kratz and Carninci 2014)
METHODS
SIRV DESIGN AND IN SILICO ANALYSIS The gene structures of seven human model genes
(KLK5 LDHD LGALS17A DAPK3 HAUS5 USF2 and TESK2) were used as scaffold for the design of
SIRV1 to SIRV7 The ENCODE-annotated transcripts as well as added variants were edited to
represent in a redundant and comprehensive manner known transcription and alternative splicing
variations (complete gene structures are shown in the odd-numbered suppl Fig from S3 to S15) All
exon sequences descend from a pool of database-derived genomes (gene fragments from viruses
and bacteriophage capsid proteins and glycoproteins selected based on a GC-content in a range of
30-50) which were modified by inverting the sequence to lose identity while maintaining a kind of
naturally occurring order in the sequences Intron sequences that do not align with exons of another
isoform were drawn from random sequences whereby the GC content was balanced to comply with
not peer-reviewed) is the authorfunder All rights reserved No reuse allowed without permission The copyright holder for this preprint (which was httpdxdoiorg101101080747doi bioRxiv preprint first posted online Oct 13 2016
Spike-In RNA variant controls for RNA-Sequencing bioRxiv upload 2016-10-13
21
the adjacent exonic sequences (Random DNA Sequence Generator
httpwwwfacultyucredu~mmadurorandomhtm)
To verify the sequence exclusivity first the exon sequences were blasted against the entire NCBI
database including ERCCs on the nucleotide and protein level (program BLASTN 2229
httpsblastncbinlmnihgov) The default BLAST parameters used were word size 28 expected
threshold 10 Max matches in query rang 20 MatchMismatch Score 1 -2 Gap Costs Linear Filter
Low complexity regions Mask for lookup table only Search of the nucleotide collection resulted for
all SIRVs in ldquono significant similarity foundrdquo Second in silico generated reads (Griebel t al 2012)
(FLUX-Generator httpsammethnetconfluencedisplaySIMHome command line flux-simulator
-p ~hellipFluxsirv1par -t simulator -x -l -s) were mapped to nine individually selected genomes using
TopHat2 (Kim et al 2013) and Bowtie2 (Langmead and Salzberg2012) Because Bowtie2-aligned
reads can be as short as 20 nt the resulting limited number of mapping reads would be deemed to
be not significant in standard NGS work-flows In contrast when mapping reads with the standard
setting of the splicing-aware TopHat2 program not a single read aligned to any of the tested
genomes Given that both searches found no significant matches off-target mapping of the SIRVs can
essentially be ruled out Therefore the artificial SIRV sequences are suitable for noninterfering
qualitative and quantitative assessments in the context of known genomic systems and
complementary to the ERCC sequences (National Institute of Standards and Technology (NIST)
certified DNA plasmids Standard Reference Materialreg 2374) The SIRV sequences can be found at
httpswwwlexogencomsirvssirvsdownloads in the Source Data files and they are also
deposited at the NCBI Nucleotide Database (PRJNA312485)
SIRV CONSTRUCTS AND THE PRODUCTION OF IN-VITRO TRANSCRIPTS Synthetic gene constructs
were produced (Bio Basic Inc Markham ON Canada) that comprised 5rsquo to 3rsquo a unique restriction
site a T7 RNA polymerase promoter whose 3rsquo G is the first nucleotide of the actual SIRV sequence
which is seamlessly followed by a (A30)-tail that is fused with an exclusive 2nd restriction site These
not peer-reviewed) is the authorfunder All rights reserved No reuse allowed without permission The copyright holder for this preprint (which was httpdxdoiorg101101080747doi bioRxiv preprint first posted online Oct 13 2016
Spike-In RNA variant controls for RNA-Sequencing bioRxiv upload 2016-10-13
22
gene cassettes were cloned into a vector colony-amplified and singularized All SIRV sequence in the
purified plasmids were verified by Sanger-sequencing to identify the correct clones The E coli
cultures were grown in batches to obtain plasmids in the lower microg-scale Double digestion of isolated
plasmids with XhoI and NsiI showed correct insert size and complete restriction Linearized silica-
purified plasmids served as templates in in vitro transcription reactions using T7 transcription kits
(AmpliScribe T7 High Yield Transcription Kit and AmpliScribe T7 Flash Transcription Kit Epicentre
Madison WI) The DNase-treated phenol-extracted and silica-purified in vitro transcription products
were assessed for concentration and purity by spectrophotometry (NanoDrop Thermo Fisher
Scientific Waltham MA) and for integrity by capillary electrophoresis (2100 Bioanalyzer RNA 6000
Pico Kit Agilent Technologies Santa Clara CA)
In the context of variant verification RNA integrity is a very important measure Fragments
arising from incomplete transcription might impose errors on the correct determination of variants
which share those sequences and thereby also affect the overall gene coverage The integrity of the
transcription products was very heterogeneous as expected given the broad sequence variation and
the length of the SIRV transcripts (average 11 kb with 14 RNAs between 20 and 25 kb) A majority
of transcripts therefore had to be purified by at least one of two purification methods Purification
method PP1 is selective for poly(A)-tails and neglects prematurely terminated transcription products
Purification method PP2 is based on size-selective quantitative electrophoresis separating the
correctly sized main products from shorter fragments (transcription break off and degraded
products) and longer fragments (run-through transcription products) After purification the 69 SIRV
RNAs were assessed to be on average 736plusmn343 in the pre-peak fraction 9031plusmn372 in the
main-peak fraction (corresponding to RNAs of correct length) and 236plusmn304 in the post-peak
fraction (mass percentages wt) Noteworthy the risks of a beginning degradation during the initial
denaturation (2 min at 70degC) and the not fully denaturing conditions during RNA microcapillary
electrophoresis tiny noise levels in the baseline and slightly different shapes of the main peak result
in a rather over- than underestimation of pre- and post-peak fractions
not peer-reviewed) is the authorfunder All rights reserved No reuse allowed without permission The copyright holder for this preprint (which was httpdxdoiorg101101080747doi bioRxiv preprint first posted online Oct 13 2016
Spike-In RNA variant controls for RNA-Sequencing bioRxiv upload 2016-10-13
23
rRNasin (Promega Madison WI) was added to 08 Umicrol to minimize the risks of RNase
contamination induced RNA degradation The SIRVs were quantified by absorbance spectroscopy to
adjust all stock solutions to a base concentration of close to but above 50 ngmicrol RNA purity was very
high with A 260280 214plusmn012 and A 260230 217plusmn020
SIRV MIXING SIRV mixes were designed that contain pools of SIRVs (SubMixes) in defined
amounts and ratios by combining accurate volumes of the stock solutions in sufficiently large batch
sizes Pipetting errors vary depending on transfer volumes and range from plusmn4 for 2 microl to plusmn08 for
gt100 microl transfers The precision was experimentally determined with blank solutions Starting with
the stock concentration measurement (NanoDrop accuracy plusmn2 ngmicrol for 50 ngmicrol or plusmn4 ) and
accounting for the entire mixing pathway the accumulative concentration error is expected to range
between plusmn8 and plusmn47 Therefore in the data evaluation one has to account for the experimental
fuzziness by allowing for lower accuracy thresholds of plusmn8 on the linear scale or plusmn011 on the log2-
fold scale respectively The SIRV concentration ratios between two mixes are more precise because
only one final pipetting step defines the concentration differences and synchronizes all SIRVs which
belong to the same SubMix Here a maximal error of plusmn4 (or plusmn0057 on the log2-fold scale) can be
expected between SubMixes while all SIRVs of the same SubMix must propagate coherently into the
final mixes Bioanalyzer traces were used to monitor the relative propagation of the SIRVs PreMixes
and SubMixes during the mixing (Fig 2B) In addition the accurate pipetting of the 8 PreMixes was
controlled by checksums of Nanodrop concentration measurements which deviated by only
0002plusmn34 from the calculated target concentrations and by weighing on an analytical balance
which showed a deviation of 18plusmn065 The final concentration of the SIRV mixes are set to be 253
ngmicrol
not peer-reviewed) is the authorfunder All rights reserved No reuse allowed without permission The copyright holder for this preprint (which was httpdxdoiorg101101080747doi bioRxiv preprint first posted online Oct 13 2016
Spike-In RNA variant controls for RNA-Sequencing bioRxiv upload 2016-10-13
24
SPIKING OF REFERENCE RNA WITH SIRV MIXES In general SIRV mixes can be used with crude
cell extracts purified total RNA rRNA-depleted RNA or poly(A)-enriched RNA Important the spike-in
ratios have to be chosen in concordance with the desired final SIRV content the RNA preparation
method and if known the expected mRNA content One widely applicable spike-in ratio can be
obtained by adding 006 ng of controls to approximately 100 ng of total RNA In the presented
examples the total RNA mass of one single aliquot RNA was 100 ng of UHRR in RC-0 and 1128 ng of
HBRR in RC-1 The reference RNA in RC-2 was calculated to be 10427 ng (Fig S2) The high-
concentrated and thereby stable SIRV mix stocks with 253 ngmicrol and ERCC mix stocks with 30 ngmicrol
(ERCC Spike-In Mixes 1 and 2 by Ambion Thermo Fisher Waltham MA) were diluted just prior to the
spiking to facilitate the mixing of manageable volumes For example the final 11000 dilution
reduced the SIRV mix concentration to 253 pgmicrol from which 237 microl were required to spike a 100 ng
total RNA sample with 006 ng SIRVs The RC-samples were produced in large batches to yield
hundreds of samples allowing for a protocol with fewer dilutions and larger volumes reducing
thereby sources of experimental errors
NGS LIBRARY PREPARATION AND SEQUENCING The experiments were carried out in technical
triplicates From 1 microg RC-0 RC-1 or RC-2 RNA in total nine NGS libraries were prepared by Fasteris SA
(Plan-les-Ouates CH) using the TruSeq stranded mRNA library preparation kit with polyA selection
(Illumina Inc San Diego CA) All primary library templates were amplified with 14 PCR cycles to
reach reproducible concentrations 155plusmn45 nM and insert sizes 165plusmn10 bp An equimolar lane-mix
was sequenced at the CSF Campus Science Support Facilities GmbH (CSF Vienna AUT) in PE125
mode in one lane of a HiSeq 2500 flowcell in 125 bp paired-end mode using V4 chemistry The run
yielded 305 M raw reads 293 M after demultiplexing and trimming which corresponds to a read
depth of 326plusmn22 M reads per library
not peer-reviewed) is the authorfunder All rights reserved No reuse allowed without permission The copyright holder for this preprint (which was httpdxdoiorg101101080747doi bioRxiv preprint first posted online Oct 13 2016
Spike-In RNA variant controls for RNA-Sequencing bioRxiv upload 2016-10-13
25
READ PROCESSING AND MAPPING Standard data processing routines (bbduk part of BBMap by
B Bushnell to be found at sourceforgenetprojectsbbmap) were applied removing low quality
reads and trimming adapter sequences Due to variable stringencies the mappers produced different
read statistics STAR mapped against the genome 897plusmn59 of the reads (864plusmn56 uniquely) and
TopHat2 852plusmn57 (794plusmn52 uniquely) Bowtie2 mapped against the transcriptome 693plusmn18
reads (151plusmn15 uniquely)
ESTIMATION OF THE MRNA CONTENTS Based on the obtained read distributions the relative
mass partition between external controls and endogenous RNA fraction can be estimated Because
the library preparation uses a poly(A)-enrichment step the targeted endogenous RNA corresponds
almost exclusively to the mRNA content of the samples The propagation of the input mass ratio to
the output read ratio depends on both the mRNA content and the efficiencies of how controls and
mRNA proceed through the library preparation The relationship is described by Eqn 1
reRNA times prod(1 rconifrasl )
j
i=1
= (EeRNA times meRNA) times prod(1 (Econi times mconi)frasl )
j
i=1
Equation 1
with r number of reads from eRNA the endogenous RNA fraction here mRNA and con the
controls here SIRVs and ERCC E the relative efficiency of how the fraction proceeds through the
workflow and m the input mass
Ratios are measured as relative read counts and the results as a product of efficiencies and
apparent amounts are also relative measures Therefore at least one de facto arbitrary reference
point needs to be defined to deduce comparable absolute results Several reference points or
default values can be defined which lead to different dependent variables and imply slightly variable
interpretation of the results The following three calculation examples are simple deductions from
not peer-reviewed) is the authorfunder All rights reserved No reuse allowed without permission The copyright holder for this preprint (which was httpdxdoiorg101101080747doi bioRxiv preprint first posted online Oct 13 2016
Spike-In RNA variant controls for RNA-Sequencing bioRxiv upload 2016-10-13
26
the ratio shown in Eqn 1 with the ERCC (con1) and the SIRVs (con2) respectively Variation 1 is
explained in greater detail while in the other variants only the differing aspects are highlighted
Variation 1 i) Here the first assumption is that the mRNA content in UHRR (Agilent Santa
Clara CA) is 3 (factor 003) and 2 (factor 002) in HBRR (Ambion Thermo Fisher Waltham MA)
which stays in close agreement to previous estimates concluded from experiments by Shippy et al in
2006 The amounts of total RNA were measured by Nanodrop absorbance spectroscopy The UHRR
samples contained 100 ng and the HBRR samples 1128 ng The mixing ratio of (2times RC-0) (1times RC-1)
determines the concentration of the 3rd sample RC-2 and further the amount of total RNA (10427
ng) as well as its related mRNA content (2times100 ng times 3 + 1times1128 ng times 2 ) (2times100 ng + 1times1128
ng) = 264 (factor 0026) The mRNA masses of the samples are calculated by the measured total
RNA input amounts and default mRNA contents are 3 ng 2256 ng and 2752 ng The second
assumption is that the endogenous mRNAs proceed with the maximal efficiency of 100 (factor 1)
through library preparation and sequencing The input of the spike-in controls is the product of the
concentration values which were either measured as in the case of the SIRV stocks or stated by the
vendor as in the case of the ERCC stocks and the pipetted volumes Both are treated as de facto
measured values
ii) The relative amounts of reads which have been assigned to either endogenous mRNA
ERCCs or SIRVs are obtained from the mapping statistics (read classification)
iii) The ratio of mass input to reads output allows to calculate the propagation efficiency of
the controls relative to the default efficiency of the endogenous mRNA In the present experiment
the SIRVs progress with a relative efficiency of 867plusmn57 and the ERCCs with 416plusmn47 The
significant difference between the relative efficiency of both controls is very likely caused by the
different lengths of the poly(A)-tails which might influence a different binding efficiency during
poly(A)-enrichment step The SIRVs with a 30 nt long poly(A)-tail perform much more in concordance
with the endogenous mRNA as the ERCCs which contain shorter and variable poly(A)-tails ( 23 nt)
The observed small differences in the experiments using RC-0 RC-1 or RC-2 could be caused by a
not peer-reviewed) is the authorfunder All rights reserved No reuse allowed without permission The copyright holder for this preprint (which was httpdxdoiorg101101080747doi bioRxiv preprint first posted online Oct 13 2016
Spike-In RNA variant controls for RNA-Sequencing bioRxiv upload 2016-10-13
27
two-way interference of samples and controls However the deviations are small and can rather be a
result of minor inaccuracies in determining the relative input amounts Both hypotheses would need
to be verified by a series of repeats with the aim to resolve potential influences of pipetting during
the sample preparation variations in the library preparation and other contributions
Variation 2 Here no varying interferences between samples and controls are permitted
which means that relative efficiencies of the controls are considered to be constant The causes of
the experimental variations are exclusively assigned to the input amounts (alike hypothesis two in
the above example in discussing the deviation of the results in RC-2) This would translate into input
standard deviations of 118 (SIRVs) and 76 (ERCCs) The variations meld all accumulating errors
made in determining the concentration of the control stock solutions preparing the subsequent
dilutions pipetting the samples and controls during the spike-in step itself as well as determining the
amount of sample RNA in the first place Against the background of potential errors the calculated
results can be considered as highly consistent
Variation 3 In addition to the assumptions made for the measurement of sample RC-0
the spike-in of 006 ng SIRVs to all samples is also set as default Alike variation 2 the experiments in
RC-1 and RC-2 adopt the same default setting for the relative efficiencies calculated in RC-0
According to the ratio of Eqn 1 one can obtain mRNA contents as well as ERCC input amounts in this
case for samples RC-1 and RC-2 The mRNA content of the HBRR sample (RC-1) relative to the default
mRNA content in the UHRR sample (set to 3 ) would be 172 lower than the previously assumed
2 According to the present mixing scheme it would also imply that sample RC-2 has an mRNA
content of 254 up from the calculated 234 The offsets of -79 is again small and very likely
refers to the level of accuracy in the experimental results as discussed above Using this method the
spiking of samples with controls such as the SIRVs allows to closely estimate the relative mRNA
content of any unknown sample and to draw conclusions eg on the transcriptional state of tissues
cell suspension or individual cells
not peer-reviewed) is the authorfunder All rights reserved No reuse allowed without permission The copyright holder for this preprint (which was httpdxdoiorg101101080747doi bioRxiv preprint first posted online Oct 13 2016
Spike-In RNA variant controls for RNA-Sequencing bioRxiv upload 2016-10-13
28
COEFFICIENT OF DEVIATION We implemented a strand specific Coefficient of Deviation
(CoD) which aims to reflect the quality of NGS pipelines targeted at specific effects in particular
lsquospikenessrsquo of the coverage while systematic effects like drop of the coverage at Transcription Start
Sites (TSS) and Transcription End Sites (TES) are being suppressed The CoD is implemented by Eqn
2
CoD = CoD(LTSSLTES) = sum (cidealp- crealp)2
TESe
p=TSS1
divide sum cidealp
TESe
p=TSS1
Equation 2
which is calculated in strand orientation for contigs along all exonic nucleotide position (p) from the
first annotated TSS (TSS1) up to the last annotated TES (TESe) whereby cideal are the ideal coverages
with the optimized transient regions (LrsquoTSS LrsquoTES) and creal are the real coverages scaled as such that
the total integrals along all positions of ideal and real coverages are equal
The transient function at TSS and TES is the error function erf(x) which corresponds to
Cufflinks assumption about normally distributed fragment lengths (Trapnell et al 2012) Since erf(x)
is a non-algebraic function we used the algebraic approximation by Abramowitz and Stegun
(httpsenwikipediaorgwikiError_function eq 7125) Once the optima (LrsquoTSS LrsquoTES ) are found
we declare CoD(LrsquoTSS LrsquoTES) to be the ultimate CoD value which mostly eliminated the transient region
effects We implemented an optimization algorithm (Nelder-Mead downhill simplex method) and
used as starting values (L0TSS L0
TES ) lengths of 150 In some cases the optimum found can be beyond
a reasonable range of values Therefore we censor the output Lopt of the mathematical optimization
as follows Lcensored = 50 if Lrsquo lt 50 Lcensored = 350 if Lrsquo gt 350 This corresponds to the maximal range of
not peer-reviewed) is the authorfunder All rights reserved No reuse allowed without permission The copyright holder for this preprint (which was httpdxdoiorg101101080747doi bioRxiv preprint first posted online Oct 13 2016
Spike-In RNA variant controls for RNA-Sequencing bioRxiv upload 2016-10-13
29
200plusmn150 This censoring needed to be applied in 8 cases out of 84 SIRVmixstrandend
combinations ie less than in 10
TRANSCRIPT CONCENTRATION MEASUREMENTS In order to estimate expression values on
transcript levels we applied RSEM (Li and Dewey 2011) which uses a Bayesian Network to compute
the likelihood of each fragment belonging to a given transcript Salmon (Patro et al 2015) estimates
the transcript expression values by a k-mer based mapping Similar to RSEM it uses an expectation-
maximization (EM) algorithm to compute the maximum likelihood of relative abundances Cufflinks2
(Trapnell et al 2013) estimates the transcript abundances with a coverage-based maximum
likelihood approach It determines the probability of read assignments to isoforms
DIFFERENTIAL EXPRESSION ANALYSIS We used the DESeq2 package (Love et al 2014) for
calculation of fold-differences between the results from different pipelines and different input samples
mixtures As explained in the main text all outputs from the evaluated pipelines (in form of relative
concentration measures) have been scaled Scaling by linear transformation is needed as a
consequence of the different mRNA contents in the samples but also to eventually compensate any
potential pipetting errors when small aliquots typically in the range of very few microliter are added
to individual samples The RC-samples in this experiment were produced in a large batch to ensure
high accuracy in volumetric ratios The main sample pool is practically invariant to the small relative
contribution of the controls but was technically treated in the same way by scaling the main sample
pools to identical sizes First SIRV concentrations were scaled to reach together 69 in E0 685 in E1
and 708 in E2 which is the dimensionless value identical to the fmolmicrol in the respective SIRV stock
solutions Then the lower threshold was set to 10-6 which corresponds to original FPKM values of
around 5∙10-3 ⅟7th of one read for a 1 kb long transcript at a read depth of 30 Mio reads or 1 gene
specific read to be divided between 7 equally possible transcript variants at said 1 kb length section
The threshold is to be understood as less than or equal to 10-6 which defines an averaged read
not peer-reviewed) is the authorfunder All rights reserved No reuse allowed without permission The copyright holder for this preprint (which was httpdxdoiorg101101080747doi bioRxiv preprint first posted online Oct 13 2016
Spike-In RNA variant controls for RNA-Sequencing bioRxiv upload 2016-10-13
30
resolution of the particular workflow at the given read depth By these means all ratios remain defined
Second for the DESeq2 calculations we multiplied all values with 106 after which fractions were
rounded to the closest integer We understand that for no-change hypothesis testing which is the
main purpose of the DESeq2 package transforming the relative concentrations (FPKM or TPM) to
lsquoquasi-read-countsrsquo is not recommended since DESeq2 internally corrects for library size by using size
factors However in our application we do not use the probability of the hypothesis rejection (P
values) but the raw fold changes detected (irrespectively of the dispersion values for that given
transcript) We also took into account the potential danger of censoring the input (by unintentionally
eliminating transcripts represented by extremely low FPKM or TPM values) by setting a suitable
threshold as described above The figures show only two differential expression analyses because the
3rd concentration ratio E2E0 is the product of E1E0 and E2E1
ERROR RATE ANALYSIS The four red data points two from the SIRV controls (circles) and two
from the endogenous mRNAs (squares) from the best agreement (P3 vs P1) and the four
corresponding black data points from the worst agreement (P4 vs P2) as shown in fig 5E were fitted
by linear approximation using the relationship as derived for Eqn 3
TP + FP = 1
FP = N times ER = (1-TP) times ER
(TP+FP) = TP + ER - TP times ER
(TP+FP) = (1-ER) times TP + ER Equation 3
where TP is the relative portion of true positives (differentially expressed as in our definition
possessing a LFC gt 1) N the relative portion of negatives ER the error rate at which negatives are
falsely detected as positives to result in false positives FP The least squares fitting method was
applied to derive values for the slope (1-ER) and the intercept ER
not peer-reviewed) is the authorfunder All rights reserved No reuse allowed without permission The copyright holder for this preprint (which was httpdxdoiorg101101080747doi bioRxiv preprint first posted online Oct 13 2016
Spike-In RNA variant controls for RNA-Sequencing bioRxiv upload 2016-10-13
31
The transformation of Eqn 3 leads to the relationship of Eqn 4
TP FPfrasl = (TP+FP) TPfrasl -1 Equation 4
which has been used for the graph in fig 5F In the present context the concept of ROC-curves is not
applicable because the true or false negatives are indistinguishable as long the ground truth of the
endogenous RNA are unknown
DATA ACCESS Sequencces and source data files data are in the process to be deposited at
NCBI under BioProject ID PRJNA312485
ACKNOWLEDGMENTS We thank SA Munro and M Salit (Material Measurement
Laboratory National Institute of Standards and Technology) for their efforts in further developing the
concepts of the External RNA Control Consortium (ERCC) in an updated suite of RNA controls and
analysis methods called ERCC 20 We thank A Tuerk for his contributions in finding suitable human
model genes G Wiktorin for carrying out the RSEM calculations M Mihaylova in helping with the
graphics design and I Gabler for critically reading the manuscript
AUTHOR CONTRIBUTIONS LP PK and TR designed the sequences and mixtures PK and GH
prepared the in vitro transcripts and spike-in mixtures TR AS and LP designed the research and
the experiments MA IH and TR evaluated the data TR and LP wrote the manuscript
DISCLOSURE DECLARATION The authors are employees of Lexogen GmbH from which the SIRVs
can be bought and AS has equity stakes in Lexogen GmbH LP PK and TR are named as
not peer-reviewed) is the authorfunder All rights reserved No reuse allowed without permission The copyright holder for this preprint (which was httpdxdoiorg101101080747doi bioRxiv preprint first posted online Oct 13 2016
Spike-In RNA variant controls for RNA-Sequencing bioRxiv upload 2016-10-13
32
inventors on a patent application regarding the production and use of RNA transcript variants and
Lexogen GmbH is the owner of this patent application
REFERENCES
Baker SC Bauer SR Beyer RP Brenton JD Bromley B Burrill J Causton H Conley MP Elespuru R Fero M et al 2005 The External RNA Controls Consortium a progress report Nat Methods 2(10) 731-4 Bokar JA Rottman FM 1998 Biosynthesis and Functions of Modified Nucleosides in Eukaryotic mRNA In Modification and Editing of RNA (eds Grosjean H Benne R) pp 183-200 ASM Press Washington DC Dobin A Davis CA Schlesinger F Drenkow J Zaleski C Jha S Batut P Chaisson M Gingeras TR 2013 STAR ultrafast universal RNA-seq aligner Bioinformatics 29(1) 15-21 Fed Reg Doc 2015-19742 2015 External RNA Controls Consortium - Call for Participation and Contributions to a Sequence Library Federal Register Citation 80 FR 48296 Griebel T Zacher B Ribeca P Raineri E Lacroix V Guigoacute R Sammeth M 2012 Modelling and simulating generic RNA-Seq experiments with the flux simulator Nucleic Acids Res 40(20) 10073-83 Jiang L Schlesinger F Davis CA Zhang Y Li R Salit M Gingeras TR Oliver B 2011 Synthetic spike-in standards for RNA-seq experiments Genome Res 21(9) 1543-51 Kim D Pertea G Trapnell C Pimentel H Kelley R Salzberg SL 2013 TopHat2 accurate alignment of transcriptomes in the presence of insertions deletions and gene fusions Genome Biol 14(4) R36 Kratz A Carninci P 2014 The devil in the details of RNA-seq Nat Biotechnol 32(9) 882-4 Lahens NF Kavakli IH Zhang R Hayer K Black MB Dueck H Pizarro A Kim J Irizarry R Thomas RS et al 2014 IVT-seq reveals extreme bias in RNA sequencing Genome Biol 15(6) R86 Langmead B Salzberg SL 2012 Fast gapped-read alignment with Bowtie 2 Nat Methods 9(4) 357-9 Li B Dewey CN 2011 RSEM accurate transcript quantification from RNA-Seq data with or without a reference genome BMC Bioinformatics 12 323 Li J Jiang H Wong WH 2010 Modeling non-uniformity in short-read rates in RNA-Seq data Genome Biol 11 R50 Li S Tighe SW Nicolet CM Grove D Levy S Farmerie W Viale A Wright C Schweitzer PA Gao Y et al 2014 Multi-platform assessment of transcriptome profiling using RNA-seq in the ABRF next-generation sequencing study Nat Biotechnology 32 915-25 Love MI Huber W Anders S 2014 Moderated estimation of fold change and dispersion for RNA-seq data with DESeq2 Genome Biol 15(12) 550
not peer-reviewed) is the authorfunder All rights reserved No reuse allowed without permission The copyright holder for this preprint (which was httpdxdoiorg101101080747doi bioRxiv preprint first posted online Oct 13 2016
Spike-In RNA variant controls for RNA-Sequencing bioRxiv upload 2016-10-13
33
Mortazavi A Williams BA McCue K Schaeffer L Wold B 2008 Mapping and quantifying mammalian transcriptomes by RNA-Seq Nat Methods 5(7) 621-8 Patro R Duggal G Kingsford C 2015 Accurate fast and model-aware transcript expression quantification with Salmon bioRxiv preprint doi httpdxdoiorg101101021592 Shippy R Fulmer-Smentek S Jensen RV Jones WD Wolber PK Johnson CD Pine PS Boysen C Guo X Chudin E et al 2006 Using RNA sample titrations to assess microarray platform performance and normalization techniques Nat Biotechnol 24(9) 1123-31 SEQCMAQC-III Consortium 2014 A comprehensive assessment of RNA-seq accuracy reproducibility and information content by the Sequencing Quality Control Consortium Nat Biotechnology 32 903-14 Tembe WD Pond SJ Legendre C Chuang HY Liang WS Kim NE Montel V Wong S McDaniel TK Craig DW Carpten JD 2014 Open-access synthetic spike-in mRNA-seq data for cancer gene fusions BMC Genomics 15 824 Trapnell C Roberts A Goff L Pertea G Kim D Kelley DR Pimentel H Salzberg SL Rinn JL Pachter L 2012 Differential gene and transcript expression analysis of RNA-seq experiments with TopHat and Cufflinks Nat Protoc 7(3) 562-78 Trapnell C Hendrickson DG Sauvageau M Goff L Rinn JL Pachter L 2013 Differential analysis of gene regulation at transcript resolution with RNA-seq Nat Biotechnol 31(1) 46-53 van Dijk EL Jaszczyszyn Y Thermes C 2014 Library preparation methods for next-generation sequencing tone down the bias Exp Cell Res 322(1) 12-20 Wang Z Gerstein M Snyder M 2009 RNA-Seq a revolutionary tool for transcriptomics Nat Rev Genet 1 57-63 Zheng W Chung LM Zhao H 2011 Bias detection and correction in RNA-Sequencing data BMC Bioinformatics 12290
not peer-reviewed) is the authorfunder All rights reserved No reuse allowed without permission The copyright holder for this preprint (which was httpdxdoiorg101101080747doi bioRxiv preprint first posted online Oct 13 2016
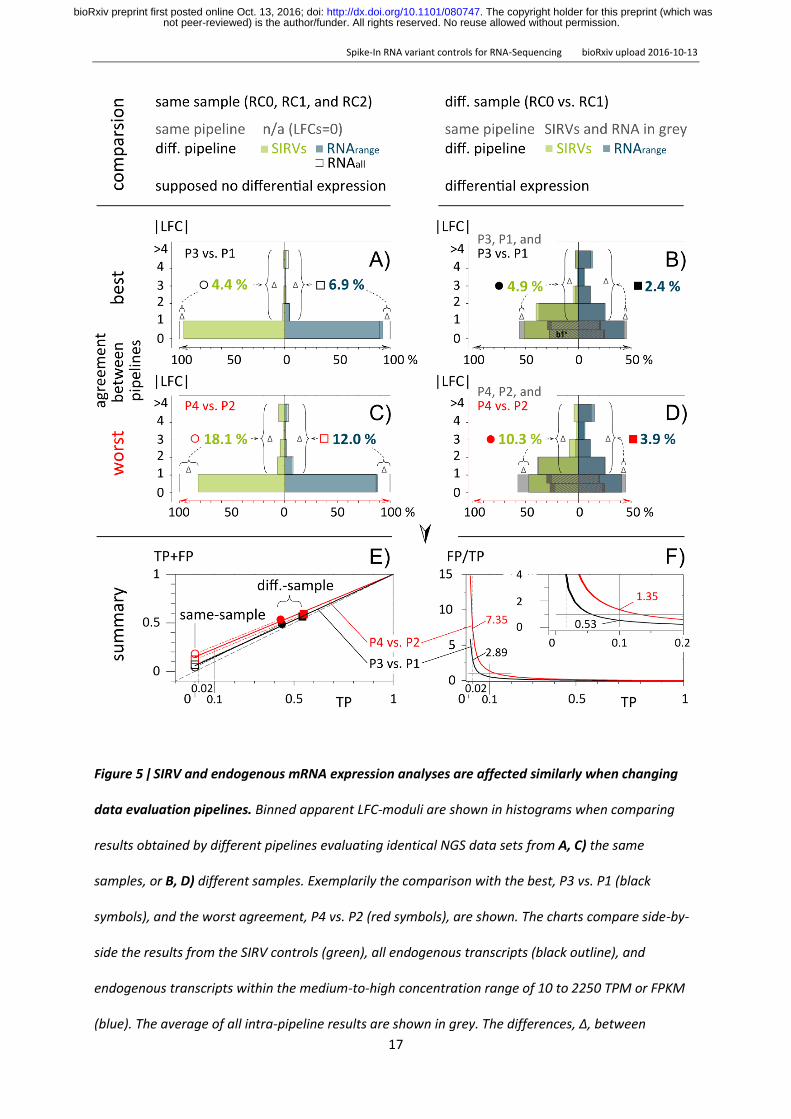
Spike-In RNA variant controls for RNA-Sequencing bioRxiv upload 2016-10-13
17
Figure 5 ǀ SIRV and endogenous mRNA expression analyses are affected similarly when changing
data evaluation pipelines Binned apparent LFC-moduli are shown in histograms when comparing
results obtained by different pipelines evaluating identical NGS data sets from A C) the same
samples or B D) different samples Exemplarily the comparison with the best P3 vs P1 (black
symbols) and the worst agreement P4 vs P2 (red symbols) are shown The charts compare side-by-
side the results from the SIRV controls (green) all endogenous transcripts (black outline) and
endogenous transcripts within the medium-to-high concentration range of 10 to 2250 TPM or FPKM
(blue) The average of all intra-pipeline results are shown in grey The differences Δ between
not peer-reviewed) is the authorfunder All rights reserved No reuse allowed without permission The copyright holder for this preprint (which was httpdxdoiorg101101080747doi bioRxiv preprint first posted online Oct 13 2016
Spike-In RNA variant controls for RNA-Sequencing bioRxiv upload 2016-10-13
18
analyses with the same and with different pipelines show the losses in the bins 0 lt ǀLFCǀ lt 1 and the
corresponding gain in the other bins ǀLFCǀ gt 1 The increase of the FP-rate purely caused by the
pipeline changes vs the TP range is given in the summary graphs E and F) The 1st bins 0 lt ǀLFCǀ lt 1
are divided into two 0 lt ǀLFCǀ lt 05 and 05 lt ǀLFCǀ lt 1 which facilitates the easier tracking of the
results from the SubMixes4 as shown in Fig 4 were in both figures the 1st fraction is signed with 1b
DISCUSSION
We report a significant contribution to the external RNA controls toolbox in the form of Spike-In RNA
Variants (SIRVs) that address transcription variation and alternative splicing The highly defined mixes
of 69 transcripts aligning to 7 genes enable accurate target-performance evaluations of gene
expression analysis methods which is not possible eg by analyzing larger but only loosely defined
pools of in vitro transcripts (Lahens et al 2014) or limited sets addressing special problems like
fusion genes (Tembe et al 2014) The results presented here demonstrate that the condensed
complexity of the SIRV controls mimic very closely main properties of endogenous mRNAs when
analyzing high-throughput RNA sequencing workflows for their capabilities to determine transcript
variants and their relative quantities The responses of the SIRV controls to changes in the workflows
allow to extrapolate measures for the accuracy precision and foremost inter-experiment
comparability (concordance) to the large pool of endogenous RNAs With the help of the external
controls we could confirm that biases in sequence coverage could mostly be balanced by the
exemplary chosen data evaluation algorithms and for the majority of transcripts consistent relative
abundances were obtained However in our most concordant same sample pipeline comparison
P3P1 already 44 of the controls and 69 of the endogenous RNAs in the medium to high
concentration range appeared to be differentially expressed although none of those were true
positives (TP) because the reductio ad absurdum same sample comparison was using the very same
sets of NGS reads In consequence more than 700 potential endogenous mRNA leads would be non-
validatable false positives (FP) only because of a change in data evaluation pipelines With a
not peer-reviewed) is the authorfunder All rights reserved No reuse allowed without permission The copyright holder for this preprint (which was httpdxdoiorg101101080747doi bioRxiv preprint first posted online Oct 13 2016
Spike-In RNA variant controls for RNA-Sequencing bioRxiv upload 2016-10-13
19
difference between P4 and P2 of 12 at the level of endogenous RNAs an extra 1200 FPs would
obscure the evaluation
The inter-sample comparison between UHRR and HBRR presents a rather extreme case
where around half of all transcripts were calculated to differ by more than 2-fold However the
relative FPTP weight of both comparisons remains similar as P4P2 shows again clearly higher FP-
rates in both controls and endogenous RNAs The linear interpolation (Fig 5E) allows to estimate the
effect of the experimental changes to relative small number of differences as they would be seen in
typical RNA-Seq experiments Exemplarily highlighted are the intersections at 002 and 01 in Fig 5F
TP call rates and FPTP ratios are the important figures to estimate the likelihood and inversely
related effort to validate differentially expressed transcripts For the P3P1 comparison at 2 TP we
approximate an FPTP ratio of 289 The likelihood to actually validate DE transcripts under such
circumstances would reach 035 For the P4P2 comparison the TPFP ratio estimates to mere 014
The related risks and often substantial costs for deducing potential biomarkers would be 25 times
higher Although we demonstrated in the presented example the influence of changes in data
evaluation pipeline within an integrated RNA-Seq workflow the same principles apply to the front
end - the RNA treatment NGS library preparation and sequencing Here unintended variations in
particular sample preparations can only be detected by these external spike-in controls which
operate as markers and reference spots By these means SIRV controls increase the comparability
within and between sequencing experiments at the transcript isoform level SIRVs are designed for
the co-development improvement and monitoring of library preparations sequencing and data
processing
Outlook The presented module and the 92 ERCCs which probe the wide dynamic range using
monocistronic transcripts can be stepwise extended in the future by a) ca 15 poly(A)-tail variations
of monocistronic sequences with defined lengths of 20 and 30 adenosines as well as polyadenylated
and purified RNAs with poly(A)-tail lengths close to 50 100 and above 200 nucleotides b) around 12
above-average long RNAs with 3 5 7 and 10 kb c) approx 3 RNAs each with a low medium and
not peer-reviewed) is the authorfunder All rights reserved No reuse allowed without permission The copyright holder for this preprint (which was httpdxdoiorg101101080747doi bioRxiv preprint first posted online Oct 13 2016
Spike-In RNA variant controls for RNA-Sequencing bioRxiv upload 2016-10-13
20
high GC-content d) a set of 13 mRNA relevant chemical modifications most prominent the cap-
structure (Bokar and Rottman 1998) e) variants which cover aspects of SNPs alleles inversions and
fusion genes which needs to be accounted for in the corresponding sequence annotation files and f)
a random set of small and micro RNAs that comprise all sequence variations at their termini to
account for ligation biases The external control modules need to be fine-tuned with respect to the
dynamic concentration and concentration ratio range and the reference annotations must provide a
mixture of correctly over- and under-annotated genes to better emulate the challenging conditions
for bioinformatical data evaluation Both optimizations will also further increase the congruence of
the presented SIRV module with the endogenous RNAs Eventually all modules together would
develop into a comprehensive set of approximately 250 long RNA controls plus a microRNA module
which will become sufficient for calibration and normalization purposes This new estimate reduces
the scope of designing better spike-in controls compared to the maybe thousands of IVTs which have
been previously anticipated (Kratz and Carninci 2014)
METHODS
SIRV DESIGN AND IN SILICO ANALYSIS The gene structures of seven human model genes
(KLK5 LDHD LGALS17A DAPK3 HAUS5 USF2 and TESK2) were used as scaffold for the design of
SIRV1 to SIRV7 The ENCODE-annotated transcripts as well as added variants were edited to
represent in a redundant and comprehensive manner known transcription and alternative splicing
variations (complete gene structures are shown in the odd-numbered suppl Fig from S3 to S15) All
exon sequences descend from a pool of database-derived genomes (gene fragments from viruses
and bacteriophage capsid proteins and glycoproteins selected based on a GC-content in a range of
30-50) which were modified by inverting the sequence to lose identity while maintaining a kind of
naturally occurring order in the sequences Intron sequences that do not align with exons of another
isoform were drawn from random sequences whereby the GC content was balanced to comply with
not peer-reviewed) is the authorfunder All rights reserved No reuse allowed without permission The copyright holder for this preprint (which was httpdxdoiorg101101080747doi bioRxiv preprint first posted online Oct 13 2016
Spike-In RNA variant controls for RNA-Sequencing bioRxiv upload 2016-10-13
21
the adjacent exonic sequences (Random DNA Sequence Generator
httpwwwfacultyucredu~mmadurorandomhtm)
To verify the sequence exclusivity first the exon sequences were blasted against the entire NCBI
database including ERCCs on the nucleotide and protein level (program BLASTN 2229
httpsblastncbinlmnihgov) The default BLAST parameters used were word size 28 expected
threshold 10 Max matches in query rang 20 MatchMismatch Score 1 -2 Gap Costs Linear Filter
Low complexity regions Mask for lookup table only Search of the nucleotide collection resulted for
all SIRVs in ldquono significant similarity foundrdquo Second in silico generated reads (Griebel t al 2012)
(FLUX-Generator httpsammethnetconfluencedisplaySIMHome command line flux-simulator
-p ~hellipFluxsirv1par -t simulator -x -l -s) were mapped to nine individually selected genomes using
TopHat2 (Kim et al 2013) and Bowtie2 (Langmead and Salzberg2012) Because Bowtie2-aligned
reads can be as short as 20 nt the resulting limited number of mapping reads would be deemed to
be not significant in standard NGS work-flows In contrast when mapping reads with the standard
setting of the splicing-aware TopHat2 program not a single read aligned to any of the tested
genomes Given that both searches found no significant matches off-target mapping of the SIRVs can
essentially be ruled out Therefore the artificial SIRV sequences are suitable for noninterfering
qualitative and quantitative assessments in the context of known genomic systems and
complementary to the ERCC sequences (National Institute of Standards and Technology (NIST)
certified DNA plasmids Standard Reference Materialreg 2374) The SIRV sequences can be found at
httpswwwlexogencomsirvssirvsdownloads in the Source Data files and they are also
deposited at the NCBI Nucleotide Database (PRJNA312485)
SIRV CONSTRUCTS AND THE PRODUCTION OF IN-VITRO TRANSCRIPTS Synthetic gene constructs
were produced (Bio Basic Inc Markham ON Canada) that comprised 5rsquo to 3rsquo a unique restriction
site a T7 RNA polymerase promoter whose 3rsquo G is the first nucleotide of the actual SIRV sequence
which is seamlessly followed by a (A30)-tail that is fused with an exclusive 2nd restriction site These
not peer-reviewed) is the authorfunder All rights reserved No reuse allowed without permission The copyright holder for this preprint (which was httpdxdoiorg101101080747doi bioRxiv preprint first posted online Oct 13 2016
Spike-In RNA variant controls for RNA-Sequencing bioRxiv upload 2016-10-13
22
gene cassettes were cloned into a vector colony-amplified and singularized All SIRV sequence in the
purified plasmids were verified by Sanger-sequencing to identify the correct clones The E coli
cultures were grown in batches to obtain plasmids in the lower microg-scale Double digestion of isolated
plasmids with XhoI and NsiI showed correct insert size and complete restriction Linearized silica-
purified plasmids served as templates in in vitro transcription reactions using T7 transcription kits
(AmpliScribe T7 High Yield Transcription Kit and AmpliScribe T7 Flash Transcription Kit Epicentre
Madison WI) The DNase-treated phenol-extracted and silica-purified in vitro transcription products
were assessed for concentration and purity by spectrophotometry (NanoDrop Thermo Fisher
Scientific Waltham MA) and for integrity by capillary electrophoresis (2100 Bioanalyzer RNA 6000
Pico Kit Agilent Technologies Santa Clara CA)
In the context of variant verification RNA integrity is a very important measure Fragments
arising from incomplete transcription might impose errors on the correct determination of variants
which share those sequences and thereby also affect the overall gene coverage The integrity of the
transcription products was very heterogeneous as expected given the broad sequence variation and
the length of the SIRV transcripts (average 11 kb with 14 RNAs between 20 and 25 kb) A majority
of transcripts therefore had to be purified by at least one of two purification methods Purification
method PP1 is selective for poly(A)-tails and neglects prematurely terminated transcription products
Purification method PP2 is based on size-selective quantitative electrophoresis separating the
correctly sized main products from shorter fragments (transcription break off and degraded
products) and longer fragments (run-through transcription products) After purification the 69 SIRV
RNAs were assessed to be on average 736plusmn343 in the pre-peak fraction 9031plusmn372 in the
main-peak fraction (corresponding to RNAs of correct length) and 236plusmn304 in the post-peak
fraction (mass percentages wt) Noteworthy the risks of a beginning degradation during the initial
denaturation (2 min at 70degC) and the not fully denaturing conditions during RNA microcapillary
electrophoresis tiny noise levels in the baseline and slightly different shapes of the main peak result
in a rather over- than underestimation of pre- and post-peak fractions
not peer-reviewed) is the authorfunder All rights reserved No reuse allowed without permission The copyright holder for this preprint (which was httpdxdoiorg101101080747doi bioRxiv preprint first posted online Oct 13 2016
Spike-In RNA variant controls for RNA-Sequencing bioRxiv upload 2016-10-13
23
rRNasin (Promega Madison WI) was added to 08 Umicrol to minimize the risks of RNase
contamination induced RNA degradation The SIRVs were quantified by absorbance spectroscopy to
adjust all stock solutions to a base concentration of close to but above 50 ngmicrol RNA purity was very
high with A 260280 214plusmn012 and A 260230 217plusmn020
SIRV MIXING SIRV mixes were designed that contain pools of SIRVs (SubMixes) in defined
amounts and ratios by combining accurate volumes of the stock solutions in sufficiently large batch
sizes Pipetting errors vary depending on transfer volumes and range from plusmn4 for 2 microl to plusmn08 for
gt100 microl transfers The precision was experimentally determined with blank solutions Starting with
the stock concentration measurement (NanoDrop accuracy plusmn2 ngmicrol for 50 ngmicrol or plusmn4 ) and
accounting for the entire mixing pathway the accumulative concentration error is expected to range
between plusmn8 and plusmn47 Therefore in the data evaluation one has to account for the experimental
fuzziness by allowing for lower accuracy thresholds of plusmn8 on the linear scale or plusmn011 on the log2-
fold scale respectively The SIRV concentration ratios between two mixes are more precise because
only one final pipetting step defines the concentration differences and synchronizes all SIRVs which
belong to the same SubMix Here a maximal error of plusmn4 (or plusmn0057 on the log2-fold scale) can be
expected between SubMixes while all SIRVs of the same SubMix must propagate coherently into the
final mixes Bioanalyzer traces were used to monitor the relative propagation of the SIRVs PreMixes
and SubMixes during the mixing (Fig 2B) In addition the accurate pipetting of the 8 PreMixes was
controlled by checksums of Nanodrop concentration measurements which deviated by only
0002plusmn34 from the calculated target concentrations and by weighing on an analytical balance
which showed a deviation of 18plusmn065 The final concentration of the SIRV mixes are set to be 253
ngmicrol
not peer-reviewed) is the authorfunder All rights reserved No reuse allowed without permission The copyright holder for this preprint (which was httpdxdoiorg101101080747doi bioRxiv preprint first posted online Oct 13 2016
Spike-In RNA variant controls for RNA-Sequencing bioRxiv upload 2016-10-13
24
SPIKING OF REFERENCE RNA WITH SIRV MIXES In general SIRV mixes can be used with crude
cell extracts purified total RNA rRNA-depleted RNA or poly(A)-enriched RNA Important the spike-in
ratios have to be chosen in concordance with the desired final SIRV content the RNA preparation
method and if known the expected mRNA content One widely applicable spike-in ratio can be
obtained by adding 006 ng of controls to approximately 100 ng of total RNA In the presented
examples the total RNA mass of one single aliquot RNA was 100 ng of UHRR in RC-0 and 1128 ng of
HBRR in RC-1 The reference RNA in RC-2 was calculated to be 10427 ng (Fig S2) The high-
concentrated and thereby stable SIRV mix stocks with 253 ngmicrol and ERCC mix stocks with 30 ngmicrol
(ERCC Spike-In Mixes 1 and 2 by Ambion Thermo Fisher Waltham MA) were diluted just prior to the
spiking to facilitate the mixing of manageable volumes For example the final 11000 dilution
reduced the SIRV mix concentration to 253 pgmicrol from which 237 microl were required to spike a 100 ng
total RNA sample with 006 ng SIRVs The RC-samples were produced in large batches to yield
hundreds of samples allowing for a protocol with fewer dilutions and larger volumes reducing
thereby sources of experimental errors
NGS LIBRARY PREPARATION AND SEQUENCING The experiments were carried out in technical
triplicates From 1 microg RC-0 RC-1 or RC-2 RNA in total nine NGS libraries were prepared by Fasteris SA
(Plan-les-Ouates CH) using the TruSeq stranded mRNA library preparation kit with polyA selection
(Illumina Inc San Diego CA) All primary library templates were amplified with 14 PCR cycles to
reach reproducible concentrations 155plusmn45 nM and insert sizes 165plusmn10 bp An equimolar lane-mix
was sequenced at the CSF Campus Science Support Facilities GmbH (CSF Vienna AUT) in PE125
mode in one lane of a HiSeq 2500 flowcell in 125 bp paired-end mode using V4 chemistry The run
yielded 305 M raw reads 293 M after demultiplexing and trimming which corresponds to a read
depth of 326plusmn22 M reads per library
not peer-reviewed) is the authorfunder All rights reserved No reuse allowed without permission The copyright holder for this preprint (which was httpdxdoiorg101101080747doi bioRxiv preprint first posted online Oct 13 2016
Spike-In RNA variant controls for RNA-Sequencing bioRxiv upload 2016-10-13
25
READ PROCESSING AND MAPPING Standard data processing routines (bbduk part of BBMap by
B Bushnell to be found at sourceforgenetprojectsbbmap) were applied removing low quality
reads and trimming adapter sequences Due to variable stringencies the mappers produced different
read statistics STAR mapped against the genome 897plusmn59 of the reads (864plusmn56 uniquely) and
TopHat2 852plusmn57 (794plusmn52 uniquely) Bowtie2 mapped against the transcriptome 693plusmn18
reads (151plusmn15 uniquely)
ESTIMATION OF THE MRNA CONTENTS Based on the obtained read distributions the relative
mass partition between external controls and endogenous RNA fraction can be estimated Because
the library preparation uses a poly(A)-enrichment step the targeted endogenous RNA corresponds
almost exclusively to the mRNA content of the samples The propagation of the input mass ratio to
the output read ratio depends on both the mRNA content and the efficiencies of how controls and
mRNA proceed through the library preparation The relationship is described by Eqn 1
reRNA times prod(1 rconifrasl )
j
i=1
= (EeRNA times meRNA) times prod(1 (Econi times mconi)frasl )
j
i=1
Equation 1
with r number of reads from eRNA the endogenous RNA fraction here mRNA and con the
controls here SIRVs and ERCC E the relative efficiency of how the fraction proceeds through the
workflow and m the input mass
Ratios are measured as relative read counts and the results as a product of efficiencies and
apparent amounts are also relative measures Therefore at least one de facto arbitrary reference
point needs to be defined to deduce comparable absolute results Several reference points or
default values can be defined which lead to different dependent variables and imply slightly variable
interpretation of the results The following three calculation examples are simple deductions from
not peer-reviewed) is the authorfunder All rights reserved No reuse allowed without permission The copyright holder for this preprint (which was httpdxdoiorg101101080747doi bioRxiv preprint first posted online Oct 13 2016
Spike-In RNA variant controls for RNA-Sequencing bioRxiv upload 2016-10-13
26
the ratio shown in Eqn 1 with the ERCC (con1) and the SIRVs (con2) respectively Variation 1 is
explained in greater detail while in the other variants only the differing aspects are highlighted
Variation 1 i) Here the first assumption is that the mRNA content in UHRR (Agilent Santa
Clara CA) is 3 (factor 003) and 2 (factor 002) in HBRR (Ambion Thermo Fisher Waltham MA)
which stays in close agreement to previous estimates concluded from experiments by Shippy et al in
2006 The amounts of total RNA were measured by Nanodrop absorbance spectroscopy The UHRR
samples contained 100 ng and the HBRR samples 1128 ng The mixing ratio of (2times RC-0) (1times RC-1)
determines the concentration of the 3rd sample RC-2 and further the amount of total RNA (10427
ng) as well as its related mRNA content (2times100 ng times 3 + 1times1128 ng times 2 ) (2times100 ng + 1times1128
ng) = 264 (factor 0026) The mRNA masses of the samples are calculated by the measured total
RNA input amounts and default mRNA contents are 3 ng 2256 ng and 2752 ng The second
assumption is that the endogenous mRNAs proceed with the maximal efficiency of 100 (factor 1)
through library preparation and sequencing The input of the spike-in controls is the product of the
concentration values which were either measured as in the case of the SIRV stocks or stated by the
vendor as in the case of the ERCC stocks and the pipetted volumes Both are treated as de facto
measured values
ii) The relative amounts of reads which have been assigned to either endogenous mRNA
ERCCs or SIRVs are obtained from the mapping statistics (read classification)
iii) The ratio of mass input to reads output allows to calculate the propagation efficiency of
the controls relative to the default efficiency of the endogenous mRNA In the present experiment
the SIRVs progress with a relative efficiency of 867plusmn57 and the ERCCs with 416plusmn47 The
significant difference between the relative efficiency of both controls is very likely caused by the
different lengths of the poly(A)-tails which might influence a different binding efficiency during
poly(A)-enrichment step The SIRVs with a 30 nt long poly(A)-tail perform much more in concordance
with the endogenous mRNA as the ERCCs which contain shorter and variable poly(A)-tails ( 23 nt)
The observed small differences in the experiments using RC-0 RC-1 or RC-2 could be caused by a
not peer-reviewed) is the authorfunder All rights reserved No reuse allowed without permission The copyright holder for this preprint (which was httpdxdoiorg101101080747doi bioRxiv preprint first posted online Oct 13 2016
Spike-In RNA variant controls for RNA-Sequencing bioRxiv upload 2016-10-13
27
two-way interference of samples and controls However the deviations are small and can rather be a
result of minor inaccuracies in determining the relative input amounts Both hypotheses would need
to be verified by a series of repeats with the aim to resolve potential influences of pipetting during
the sample preparation variations in the library preparation and other contributions
Variation 2 Here no varying interferences between samples and controls are permitted
which means that relative efficiencies of the controls are considered to be constant The causes of
the experimental variations are exclusively assigned to the input amounts (alike hypothesis two in
the above example in discussing the deviation of the results in RC-2) This would translate into input
standard deviations of 118 (SIRVs) and 76 (ERCCs) The variations meld all accumulating errors
made in determining the concentration of the control stock solutions preparing the subsequent
dilutions pipetting the samples and controls during the spike-in step itself as well as determining the
amount of sample RNA in the first place Against the background of potential errors the calculated
results can be considered as highly consistent
Variation 3 In addition to the assumptions made for the measurement of sample RC-0
the spike-in of 006 ng SIRVs to all samples is also set as default Alike variation 2 the experiments in
RC-1 and RC-2 adopt the same default setting for the relative efficiencies calculated in RC-0
According to the ratio of Eqn 1 one can obtain mRNA contents as well as ERCC input amounts in this
case for samples RC-1 and RC-2 The mRNA content of the HBRR sample (RC-1) relative to the default
mRNA content in the UHRR sample (set to 3 ) would be 172 lower than the previously assumed
2 According to the present mixing scheme it would also imply that sample RC-2 has an mRNA
content of 254 up from the calculated 234 The offsets of -79 is again small and very likely
refers to the level of accuracy in the experimental results as discussed above Using this method the
spiking of samples with controls such as the SIRVs allows to closely estimate the relative mRNA
content of any unknown sample and to draw conclusions eg on the transcriptional state of tissues
cell suspension or individual cells
not peer-reviewed) is the authorfunder All rights reserved No reuse allowed without permission The copyright holder for this preprint (which was httpdxdoiorg101101080747doi bioRxiv preprint first posted online Oct 13 2016
Spike-In RNA variant controls for RNA-Sequencing bioRxiv upload 2016-10-13
28
COEFFICIENT OF DEVIATION We implemented a strand specific Coefficient of Deviation
(CoD) which aims to reflect the quality of NGS pipelines targeted at specific effects in particular
lsquospikenessrsquo of the coverage while systematic effects like drop of the coverage at Transcription Start
Sites (TSS) and Transcription End Sites (TES) are being suppressed The CoD is implemented by Eqn
2
CoD = CoD(LTSSLTES) = sum (cidealp- crealp)2
TESe
p=TSS1
divide sum cidealp
TESe
p=TSS1
Equation 2
which is calculated in strand orientation for contigs along all exonic nucleotide position (p) from the
first annotated TSS (TSS1) up to the last annotated TES (TESe) whereby cideal are the ideal coverages
with the optimized transient regions (LrsquoTSS LrsquoTES) and creal are the real coverages scaled as such that
the total integrals along all positions of ideal and real coverages are equal
The transient function at TSS and TES is the error function erf(x) which corresponds to
Cufflinks assumption about normally distributed fragment lengths (Trapnell et al 2012) Since erf(x)
is a non-algebraic function we used the algebraic approximation by Abramowitz and Stegun
(httpsenwikipediaorgwikiError_function eq 7125) Once the optima (LrsquoTSS LrsquoTES ) are found
we declare CoD(LrsquoTSS LrsquoTES) to be the ultimate CoD value which mostly eliminated the transient region
effects We implemented an optimization algorithm (Nelder-Mead downhill simplex method) and
used as starting values (L0TSS L0
TES ) lengths of 150 In some cases the optimum found can be beyond
a reasonable range of values Therefore we censor the output Lopt of the mathematical optimization
as follows Lcensored = 50 if Lrsquo lt 50 Lcensored = 350 if Lrsquo gt 350 This corresponds to the maximal range of
not peer-reviewed) is the authorfunder All rights reserved No reuse allowed without permission The copyright holder for this preprint (which was httpdxdoiorg101101080747doi bioRxiv preprint first posted online Oct 13 2016
Spike-In RNA variant controls for RNA-Sequencing bioRxiv upload 2016-10-13
29
200plusmn150 This censoring needed to be applied in 8 cases out of 84 SIRVmixstrandend
combinations ie less than in 10
TRANSCRIPT CONCENTRATION MEASUREMENTS In order to estimate expression values on
transcript levels we applied RSEM (Li and Dewey 2011) which uses a Bayesian Network to compute
the likelihood of each fragment belonging to a given transcript Salmon (Patro et al 2015) estimates
the transcript expression values by a k-mer based mapping Similar to RSEM it uses an expectation-
maximization (EM) algorithm to compute the maximum likelihood of relative abundances Cufflinks2
(Trapnell et al 2013) estimates the transcript abundances with a coverage-based maximum
likelihood approach It determines the probability of read assignments to isoforms
DIFFERENTIAL EXPRESSION ANALYSIS We used the DESeq2 package (Love et al 2014) for
calculation of fold-differences between the results from different pipelines and different input samples
mixtures As explained in the main text all outputs from the evaluated pipelines (in form of relative
concentration measures) have been scaled Scaling by linear transformation is needed as a
consequence of the different mRNA contents in the samples but also to eventually compensate any
potential pipetting errors when small aliquots typically in the range of very few microliter are added
to individual samples The RC-samples in this experiment were produced in a large batch to ensure
high accuracy in volumetric ratios The main sample pool is practically invariant to the small relative
contribution of the controls but was technically treated in the same way by scaling the main sample
pools to identical sizes First SIRV concentrations were scaled to reach together 69 in E0 685 in E1
and 708 in E2 which is the dimensionless value identical to the fmolmicrol in the respective SIRV stock
solutions Then the lower threshold was set to 10-6 which corresponds to original FPKM values of
around 5∙10-3 ⅟7th of one read for a 1 kb long transcript at a read depth of 30 Mio reads or 1 gene
specific read to be divided between 7 equally possible transcript variants at said 1 kb length section
The threshold is to be understood as less than or equal to 10-6 which defines an averaged read
not peer-reviewed) is the authorfunder All rights reserved No reuse allowed without permission The copyright holder for this preprint (which was httpdxdoiorg101101080747doi bioRxiv preprint first posted online Oct 13 2016
Spike-In RNA variant controls for RNA-Sequencing bioRxiv upload 2016-10-13
30
resolution of the particular workflow at the given read depth By these means all ratios remain defined
Second for the DESeq2 calculations we multiplied all values with 106 after which fractions were
rounded to the closest integer We understand that for no-change hypothesis testing which is the
main purpose of the DESeq2 package transforming the relative concentrations (FPKM or TPM) to
lsquoquasi-read-countsrsquo is not recommended since DESeq2 internally corrects for library size by using size
factors However in our application we do not use the probability of the hypothesis rejection (P
values) but the raw fold changes detected (irrespectively of the dispersion values for that given
transcript) We also took into account the potential danger of censoring the input (by unintentionally
eliminating transcripts represented by extremely low FPKM or TPM values) by setting a suitable
threshold as described above The figures show only two differential expression analyses because the
3rd concentration ratio E2E0 is the product of E1E0 and E2E1
ERROR RATE ANALYSIS The four red data points two from the SIRV controls (circles) and two
from the endogenous mRNAs (squares) from the best agreement (P3 vs P1) and the four
corresponding black data points from the worst agreement (P4 vs P2) as shown in fig 5E were fitted
by linear approximation using the relationship as derived for Eqn 3
TP + FP = 1
FP = N times ER = (1-TP) times ER
(TP+FP) = TP + ER - TP times ER
(TP+FP) = (1-ER) times TP + ER Equation 3
where TP is the relative portion of true positives (differentially expressed as in our definition
possessing a LFC gt 1) N the relative portion of negatives ER the error rate at which negatives are
falsely detected as positives to result in false positives FP The least squares fitting method was
applied to derive values for the slope (1-ER) and the intercept ER
not peer-reviewed) is the authorfunder All rights reserved No reuse allowed without permission The copyright holder for this preprint (which was httpdxdoiorg101101080747doi bioRxiv preprint first posted online Oct 13 2016
Spike-In RNA variant controls for RNA-Sequencing bioRxiv upload 2016-10-13
31
The transformation of Eqn 3 leads to the relationship of Eqn 4
TP FPfrasl = (TP+FP) TPfrasl -1 Equation 4
which has been used for the graph in fig 5F In the present context the concept of ROC-curves is not
applicable because the true or false negatives are indistinguishable as long the ground truth of the
endogenous RNA are unknown
DATA ACCESS Sequencces and source data files data are in the process to be deposited at
NCBI under BioProject ID PRJNA312485
ACKNOWLEDGMENTS We thank SA Munro and M Salit (Material Measurement
Laboratory National Institute of Standards and Technology) for their efforts in further developing the
concepts of the External RNA Control Consortium (ERCC) in an updated suite of RNA controls and
analysis methods called ERCC 20 We thank A Tuerk for his contributions in finding suitable human
model genes G Wiktorin for carrying out the RSEM calculations M Mihaylova in helping with the
graphics design and I Gabler for critically reading the manuscript
AUTHOR CONTRIBUTIONS LP PK and TR designed the sequences and mixtures PK and GH
prepared the in vitro transcripts and spike-in mixtures TR AS and LP designed the research and
the experiments MA IH and TR evaluated the data TR and LP wrote the manuscript
DISCLOSURE DECLARATION The authors are employees of Lexogen GmbH from which the SIRVs
can be bought and AS has equity stakes in Lexogen GmbH LP PK and TR are named as
not peer-reviewed) is the authorfunder All rights reserved No reuse allowed without permission The copyright holder for this preprint (which was httpdxdoiorg101101080747doi bioRxiv preprint first posted online Oct 13 2016
Spike-In RNA variant controls for RNA-Sequencing bioRxiv upload 2016-10-13
32
inventors on a patent application regarding the production and use of RNA transcript variants and
Lexogen GmbH is the owner of this patent application
REFERENCES
Baker SC Bauer SR Beyer RP Brenton JD Bromley B Burrill J Causton H Conley MP Elespuru R Fero M et al 2005 The External RNA Controls Consortium a progress report Nat Methods 2(10) 731-4 Bokar JA Rottman FM 1998 Biosynthesis and Functions of Modified Nucleosides in Eukaryotic mRNA In Modification and Editing of RNA (eds Grosjean H Benne R) pp 183-200 ASM Press Washington DC Dobin A Davis CA Schlesinger F Drenkow J Zaleski C Jha S Batut P Chaisson M Gingeras TR 2013 STAR ultrafast universal RNA-seq aligner Bioinformatics 29(1) 15-21 Fed Reg Doc 2015-19742 2015 External RNA Controls Consortium - Call for Participation and Contributions to a Sequence Library Federal Register Citation 80 FR 48296 Griebel T Zacher B Ribeca P Raineri E Lacroix V Guigoacute R Sammeth M 2012 Modelling and simulating generic RNA-Seq experiments with the flux simulator Nucleic Acids Res 40(20) 10073-83 Jiang L Schlesinger F Davis CA Zhang Y Li R Salit M Gingeras TR Oliver B 2011 Synthetic spike-in standards for RNA-seq experiments Genome Res 21(9) 1543-51 Kim D Pertea G Trapnell C Pimentel H Kelley R Salzberg SL 2013 TopHat2 accurate alignment of transcriptomes in the presence of insertions deletions and gene fusions Genome Biol 14(4) R36 Kratz A Carninci P 2014 The devil in the details of RNA-seq Nat Biotechnol 32(9) 882-4 Lahens NF Kavakli IH Zhang R Hayer K Black MB Dueck H Pizarro A Kim J Irizarry R Thomas RS et al 2014 IVT-seq reveals extreme bias in RNA sequencing Genome Biol 15(6) R86 Langmead B Salzberg SL 2012 Fast gapped-read alignment with Bowtie 2 Nat Methods 9(4) 357-9 Li B Dewey CN 2011 RSEM accurate transcript quantification from RNA-Seq data with or without a reference genome BMC Bioinformatics 12 323 Li J Jiang H Wong WH 2010 Modeling non-uniformity in short-read rates in RNA-Seq data Genome Biol 11 R50 Li S Tighe SW Nicolet CM Grove D Levy S Farmerie W Viale A Wright C Schweitzer PA Gao Y et al 2014 Multi-platform assessment of transcriptome profiling using RNA-seq in the ABRF next-generation sequencing study Nat Biotechnology 32 915-25 Love MI Huber W Anders S 2014 Moderated estimation of fold change and dispersion for RNA-seq data with DESeq2 Genome Biol 15(12) 550
not peer-reviewed) is the authorfunder All rights reserved No reuse allowed without permission The copyright holder for this preprint (which was httpdxdoiorg101101080747doi bioRxiv preprint first posted online Oct 13 2016
Spike-In RNA variant controls for RNA-Sequencing bioRxiv upload 2016-10-13
33
Mortazavi A Williams BA McCue K Schaeffer L Wold B 2008 Mapping and quantifying mammalian transcriptomes by RNA-Seq Nat Methods 5(7) 621-8 Patro R Duggal G Kingsford C 2015 Accurate fast and model-aware transcript expression quantification with Salmon bioRxiv preprint doi httpdxdoiorg101101021592 Shippy R Fulmer-Smentek S Jensen RV Jones WD Wolber PK Johnson CD Pine PS Boysen C Guo X Chudin E et al 2006 Using RNA sample titrations to assess microarray platform performance and normalization techniques Nat Biotechnol 24(9) 1123-31 SEQCMAQC-III Consortium 2014 A comprehensive assessment of RNA-seq accuracy reproducibility and information content by the Sequencing Quality Control Consortium Nat Biotechnology 32 903-14 Tembe WD Pond SJ Legendre C Chuang HY Liang WS Kim NE Montel V Wong S McDaniel TK Craig DW Carpten JD 2014 Open-access synthetic spike-in mRNA-seq data for cancer gene fusions BMC Genomics 15 824 Trapnell C Roberts A Goff L Pertea G Kim D Kelley DR Pimentel H Salzberg SL Rinn JL Pachter L 2012 Differential gene and transcript expression analysis of RNA-seq experiments with TopHat and Cufflinks Nat Protoc 7(3) 562-78 Trapnell C Hendrickson DG Sauvageau M Goff L Rinn JL Pachter L 2013 Differential analysis of gene regulation at transcript resolution with RNA-seq Nat Biotechnol 31(1) 46-53 van Dijk EL Jaszczyszyn Y Thermes C 2014 Library preparation methods for next-generation sequencing tone down the bias Exp Cell Res 322(1) 12-20 Wang Z Gerstein M Snyder M 2009 RNA-Seq a revolutionary tool for transcriptomics Nat Rev Genet 1 57-63 Zheng W Chung LM Zhao H 2011 Bias detection and correction in RNA-Sequencing data BMC Bioinformatics 12290
not peer-reviewed) is the authorfunder All rights reserved No reuse allowed without permission The copyright holder for this preprint (which was httpdxdoiorg101101080747doi bioRxiv preprint first posted online Oct 13 2016
Spike-In RNA variant controls for RNA-Sequencing bioRxiv upload 2016-10-13
32
inventors on a patent application regarding the production and use of RNA transcript variants and
Lexogen GmbH is the owner of this patent application
REFERENCES
Baker SC Bauer SR Beyer RP Brenton JD Bromley B Burrill J Causton H Conley MP Elespuru R Fero M et al 2005 The External RNA Controls Consortium a progress report Nat Methods 2(10) 731-4 Bokar JA Rottman FM 1998 Biosynthesis and Functions of Modified Nucleosides in Eukaryotic mRNA In Modification and Editing of RNA (eds Grosjean H Benne R) pp 183-200 ASM Press Washington DC Dobin A Davis CA Schlesinger F Drenkow J Zaleski C Jha S Batut P Chaisson M Gingeras TR 2013 STAR ultrafast universal RNA-seq aligner Bioinformatics 29(1) 15-21 Fed Reg Doc 2015-19742 2015 External RNA Controls Consortium - Call for Participation and Contributions to a Sequence Library Federal Register Citation 80 FR 48296 Griebel T Zacher B Ribeca P Raineri E Lacroix V Guigoacute R Sammeth M 2012 Modelling and simulating generic RNA-Seq experiments with the flux simulator Nucleic Acids Res 40(20) 10073-83 Jiang L Schlesinger F Davis CA Zhang Y Li R Salit M Gingeras TR Oliver B 2011 Synthetic spike-in standards for RNA-seq experiments Genome Res 21(9) 1543-51 Kim D Pertea G Trapnell C Pimentel H Kelley R Salzberg SL 2013 TopHat2 accurate alignment of transcriptomes in the presence of insertions deletions and gene fusions Genome Biol 14(4) R36 Kratz A Carninci P 2014 The devil in the details of RNA-seq Nat Biotechnol 32(9) 882-4 Lahens NF Kavakli IH Zhang R Hayer K Black MB Dueck H Pizarro A Kim J Irizarry R Thomas RS et al 2014 IVT-seq reveals extreme bias in RNA sequencing Genome Biol 15(6) R86 Langmead B Salzberg SL 2012 Fast gapped-read alignment with Bowtie 2 Nat Methods 9(4) 357-9 Li B Dewey CN 2011 RSEM accurate transcript quantification from RNA-Seq data with or without a reference genome BMC Bioinformatics 12 323 Li J Jiang H Wong WH 2010 Modeling non-uniformity in short-read rates in RNA-Seq data Genome Biol 11 R50 Li S Tighe SW Nicolet CM Grove D Levy S Farmerie W Viale A Wright C Schweitzer PA Gao Y et al 2014 Multi-platform assessment of transcriptome profiling using RNA-seq in the ABRF next-generation sequencing study Nat Biotechnology 32 915-25 Love MI Huber W Anders S 2014 Moderated estimation of fold change and dispersion for RNA-seq data with DESeq2 Genome Biol 15(12) 550
not peer-reviewed) is the authorfunder All rights reserved No reuse allowed without permission The copyright holder for this preprint (which was httpdxdoiorg101101080747doi bioRxiv preprint first posted online Oct 13 2016
Spike-In RNA variant controls for RNA-Sequencing bioRxiv upload 2016-10-13
33
Mortazavi A Williams BA McCue K Schaeffer L Wold B 2008 Mapping and quantifying mammalian transcriptomes by RNA-Seq Nat Methods 5(7) 621-8 Patro R Duggal G Kingsford C 2015 Accurate fast and model-aware transcript expression quantification with Salmon bioRxiv preprint doi httpdxdoiorg101101021592 Shippy R Fulmer-Smentek S Jensen RV Jones WD Wolber PK Johnson CD Pine PS Boysen C Guo X Chudin E et al 2006 Using RNA sample titrations to assess microarray platform performance and normalization techniques Nat Biotechnol 24(9) 1123-31 SEQCMAQC-III Consortium 2014 A comprehensive assessment of RNA-seq accuracy reproducibility and information content by the Sequencing Quality Control Consortium Nat Biotechnology 32 903-14 Tembe WD Pond SJ Legendre C Chuang HY Liang WS Kim NE Montel V Wong S McDaniel TK Craig DW Carpten JD 2014 Open-access synthetic spike-in mRNA-seq data for cancer gene fusions BMC Genomics 15 824 Trapnell C Roberts A Goff L Pertea G Kim D Kelley DR Pimentel H Salzberg SL Rinn JL Pachter L 2012 Differential gene and transcript expression analysis of RNA-seq experiments with TopHat and Cufflinks Nat Protoc 7(3) 562-78 Trapnell C Hendrickson DG Sauvageau M Goff L Rinn JL Pachter L 2013 Differential analysis of gene regulation at transcript resolution with RNA-seq Nat Biotechnol 31(1) 46-53 van Dijk EL Jaszczyszyn Y Thermes C 2014 Library preparation methods for next-generation sequencing tone down the bias Exp Cell Res 322(1) 12-20 Wang Z Gerstein M Snyder M 2009 RNA-Seq a revolutionary tool for transcriptomics Nat Rev Genet 1 57-63 Zheng W Chung LM Zhao H 2011 Bias detection and correction in RNA-Sequencing data BMC Bioinformatics 12290
not peer-reviewed) is the authorfunder All rights reserved No reuse allowed without permission The copyright holder for this preprint (which was httpdxdoiorg101101080747doi bioRxiv preprint first posted online Oct 13 2016