Sirius SDI - Acil & Weber · The Sirius SDI (Surface Dissolution Imager) ... Functionality with...
4
Sirius SDI with Actipix™ Technology Surface Dissolution Imaging
Transcript of Sirius SDI - Acil & Weber · The Sirius SDI (Surface Dissolution Imager) ... Functionality with...

Sirius SDI with Actipix™ TechnologySurface Dissolution Imaging

See what you’re missing!
The Sirius SDI (Surface Dissolution Imager) is atechnological break-through in dissolution imaging. For thefirst time this instrument provides the ability to lookdirectly at the solid-liquid interface as the dissolutionprocess is happening. Real-time ultra-violet (UV) movies ofthe dissolution process can be gained microns from thedrug surface using as little as 2mg of sample and less than20mL of dissolution medium within 30 minutes. The SiriusSDI includes award-winning ActiPix™ UV area imagingtechnology combined with a laminar flow-through sampleholder, integrated syringe pump and software, enablingreal-time recording and review of data. The flow cellprovides a constant velocity of laminar flow, creatingsteady-state conditions to obtain reproducible values foreach moment of flow. A 2-dimensional (2-D) array of pixelscollect a series of images at pre-chosen wavelengths toprovide absorbance data over a 2-D area. When combinedwith specialized software analysis tools, analysts can gain aunique and time-saving insight into a compoundsperformance, as physical changes and dissolution can bevisualized simultaneously.
Used to accelerate pre-formulations development, theSirius SDI enables intrinsic dissolution rates to be obtainedin a fraction of time compared with conventionaldissolution systems. From new drug discovery to compoundformulation, the Sirius SDI will preserve precious testbatches along with saving months in development time.
ActiPix™ technology
At the heart of the ActiPix™, a parallel array detectorprovides intensity measurements at every point inside theviewing area, which has hundreds of pixels convertingphotons measuring absorbance over a large area. Individualpixels can be selected for measurement of absorbancevalues, and accurate measurement of location or distancerelative to any origin from the dimensions of each pixelallows for dimensional analysis and distance profiling. Theabsorbance values for each pixel in the selected viewingarea create a 2-D image, and the images collectedfor the duration of the experiment are used tocreate a movie. Therefore a high-resolution 2-Dmovie of UV absorbance is captured, providing adetailed view of the dissolution process at thesolid–liquid interface in real-time as it happens(Figures 1 and 2). Visual insight into thedissolution process can be gained for the firsttime!
Figure 1a: UV absorbance maps of thedissolution of a sample. Image is falsely coloured to aid visualization,where red represents high absorbance and darkblue represents low absorbance.
Figure 1b: Ranking of intrinsicdissolution rate fromexperimental onset. Dissolutionprofiles of a sample in dissolutionmedium at different pH (n=3).

Figure 2: Formation of concentration gradients. UV absorbance map showing iso-concentration contour lines of a sample after 5minutes of dissolution. Numbers represent apparent concentrations in micromolar.
Features Benefits
Visualization of dissolution phenomena in real-time
Provides a unique insight into the mechanistic understanding of the dissolution processof functional formulations as they happen, including visualization of physical changessuch as surface swelling, sample breakdown, wettability effects and cumulative massloss
Ranking of intrinsic dissolution and diffusionrate from experimental onset
Measurement of solution concentration from only a few hundred microns from thesurface of the solid/solution interface allows for ranking of the dissolution process rightfrom the very onset of the experiment. This provides an understanding of earlyoccurrences of the dissolution process directly at the drug surface otherwise missedusing traditional dissolution testing methods
Determination of formation of concentrationgradients
Determination of solution concentration at the microscopic level by measuring the localconcentration gradients by a spatially resolved concentration measurement techniqueprovides previously undetectable information about concentration gradients close tothe solid/solution interface
Ability to control variable flow rate Allows for ability to apply physiologically relevant flow rates of dissolution medium,therefore providing the ability to take fluid characteristics into account and includehydrodynamic effects
Small cell volume (0.5mL) Allows faster measurements in less than 30 minutes rather than hours or days
Minimal sample requirements (2-10mg) Ideal for early development stages with limited compound availabilities
Flexible cell to accommodate variety ofsamples
Powders, suspensions, creams, gels, liquids, pellets, crystals, stents, implants, trans-dermal patches and other samples can all be applied
Functionality with variety of media types Variety of dissolution media including bio-relevant media can be applied fromexperimental onset with less than 20mL requirement per experiment
Zero turbulence media flow cell Provides steady-state conditions for reproducible values
Ability of the flow cell to detect changes in pHsensitive dye
Detection of in situ surface pH measurements and determination of micro-environmental changes in pH
Compact
The Sirius SDI makes the best use of your laboratory space.With a small footprint of Xcm(W) x Xcm(D) x Xcm(H) it canbe easily accommodated in most laboratories.
Compliant
The Sirius SDI is available with (insert as appropriate)software.
Support
You are not on your own. When you purchase a Sirius SDIyou will have access to Sirius’ expert applications chemistand engineering support.
Try it!
The power of visualization, without needing numbers.Seeing is believing!
Sirius Analytical Ltd.Riverside, Unit 12, Forest Row Business Park, Forest Row, East Sussex, RH18 5DW, UK
Telephone: +44 (0) 1342 820720Fax: +44 (0) 1342 820725Email: [email protected]: www.sirius-analytical.com
Distributed by:
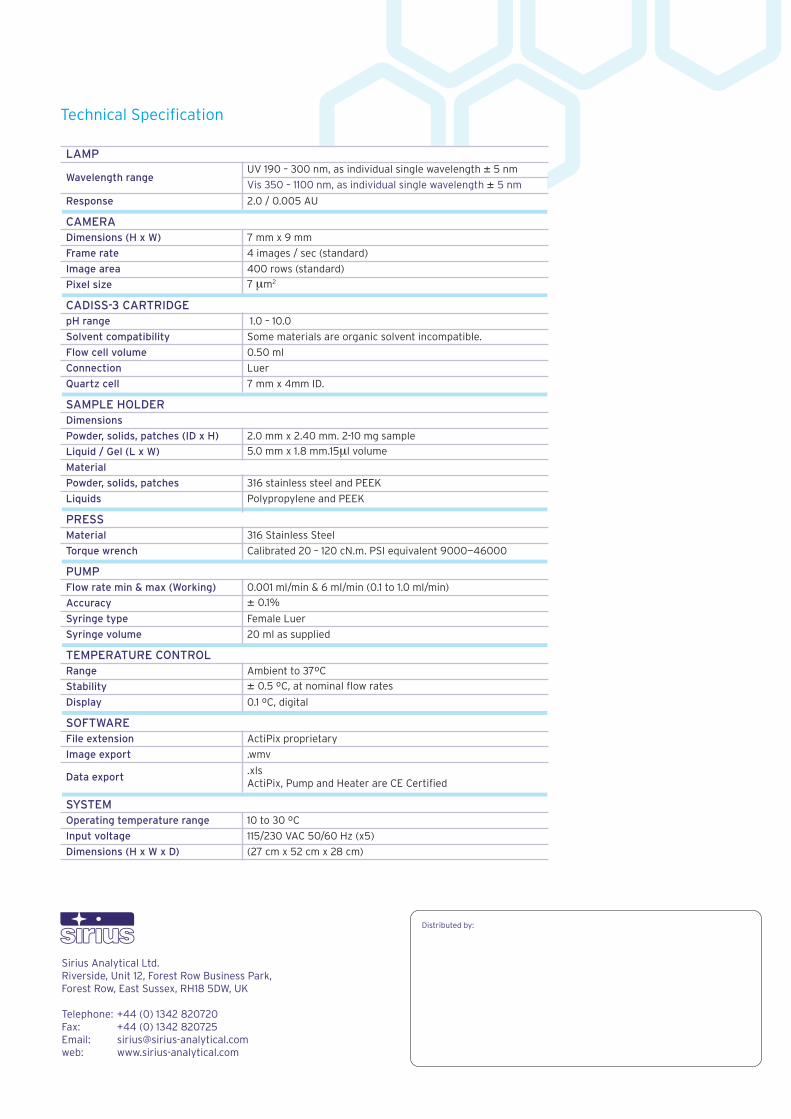
LAMP
Wavelength range UV 190 – 300 nm, as individual single wavelength ± 5 nm
Vis 350 – 1100 nm, as individual single wavelength ± 5 nm
Response 2.0 / 0.005 AU
CAMERADimensions (H x W) 7 mm x 9 mm
Frame rate 4 images / sec (standard)
Image area 400 rows (standard)
Pixel size 7 mm2
CADISS-3 CARTRIDGE pH range 1.0 – 10.0
Solvent compatibility Some materials are organic solvent incompatible.
Flow cell volume 0.50 ml
Connection Luer
Quartz cell 7 mm x 4mm ID.
SAMPLE HOLDER Dimensions
Powder, solids, patches (ID x H) 2.0 mm x 2.40 mm. 2-10 mg sample
Liquid / Gel (L x W) 5.0 mm x 1.8 mm.15ml volume
Material
Powder, solids, patches 316 stainless steel and PEEK
Liquids Polypropylene and PEEK
PRESS Material 316 Stainless Steel
Torque wrench Calibrated 20 – 120 cN.m. PSI equivalent 9000—46000
PUMPFlow rate min & max (Working) 0.001 ml/min & 6 ml/min (0.1 to 1.0 ml/min)
Accuracy ± 0.1%
Syringe type Female Luer
Syringe volume 20 ml as supplied
TEMPERATURE CONTROL Range Ambient to 37ºC
Stability ± 0.5 ºC, at nominal flow rates
Display 0.1 ºC, digital
SOFTWAREFile extension ActiPix proprietary
Image export .wmv
Data export .xls ActiPix, Pump and Heater are CE Certified
SYSTEMOperating temperature range 10 to 30 ºC
Input voltage 115/230 VAC 50/60 Hz (x5)
Dimensions (H x W x D) (27 cm x 52 cm x 28 cm)
Technical Specification