Sirius Real Estate Limited Annual Report and Accounts 2018 · 54 Audit Committee report 58...
120
Sirius Real Estate Limited Annual Report and Accounts 2018 Strong growth
-
Upload
phamnguyet -
Category
Documents
-
view
218 -
download
0
Transcript of Sirius Real Estate Limited Annual Report and Accounts 2018 · 54 Audit Committee report 58...

Sirius R
eal Estate Limited
An
nu
al Rep
ort an
d A
ccou
nts 2018 Sirius Real Estate Limited
Annual Report and Accounts 2018
Strong growth
Gathering pace
Progress this yearWe are one of the largest branded providers of mixed-use flexible workspace in Germany. Sirius Real Estate Limited (‘Sirius’ or ‘the Company’ or ‘the Group’) is a real estate company with a portfolio of 54 business parks owned or managed across Germany, providing a combination of conventional and flexible workspace.
> For more information, please visitwww.sirius-real-estate.com

What’s happened this year?
Our year of growth
A summary of key financial and operational highlights from the period that show continued success of the value-add business model of the Company and the strong and diverse asset management techniques that we use.
Capital recycling
The Group continues to be focused on growing both organically and acquisitively as well as recycling mature and non-core assets to free up capital to be used to acquire assets which it can transform and add greater value to.
Q&A with our CEO
Questions and answers with our CEO, Andrew Coombs, to discuss current year performance, industry challenges and future opportunities for Sirius.
P 2
P 6
Strategic report
2 Our highlights
3 Our business at a glance
6 Investment review
10 Senior Independent Director’s statement
12 CEO’s Q&A
14 Our business model
16 Our strategy
18 Our portfolio
21 Our markets
24 KPIs
26 Asset management review
32 Sustainability
34 Financial review
39 Principal risks and uncertainties
Governance
48 Board of Directors
50 Corporate governance
54 Audit Committee report
58 Nomination Committee report
60 Directors’ remuneration report
70 Social & Ethics Committee
72 Directors’ report
Financial statements
77 Independent auditors’ report
80 Consolidated statement of comprehensive income
81 Consolidated statement of financial position
82 Consolidated statement of changes in equity
83 Consolidated statement of cash flows
84 Notes to the financial statements
113 Business analysis
115 Glossary of terms
116 Corporate directory
Contents
P 12
> For more information, please visit www.sirius-real-estate.com
1Sirius Real Estate Limited Annual Report and Accounts 2018

18
17
The original capex investment programme commenced just over three years ago and is focused on transforming over 200,000sqm of vacant or sub-optimal space. As at 31 March 2018 the original programme is substantially complete with over 186,000sqm of this space fully refurbished and either let or being marketed for let. A total of €18.8 million has been invested into this space and, at 82% occupancy, it is generating €10.9 million of annualised rental income representing an income return on investment of 58%. Whilst there is still a little to go to finish the original programme, the focus now switches to the acquisitions capex investment programme which has gained momentum from the opportunistic acquisitions that completed during the last two financial years.
18
17
79.7
80.5
79.7% 1.0%Occupancy
18
17
40.8
42.3
40.8% 3.5%Loan to value ratio
18
17
64.18
57.84
64.18c 11.0%European Public Real Estate Association (“EPRA”) NAV per share
Successful recycling of €103.0 million of proceeds relating to the disposal of three mature assets, which were generating €6.7 million of annual net operating income on 90% occupancy, into 13 new assets costing €163.7 million initially generating €8.3 million of annual net operating income on 58% occupancy. These new assets provide the Company with close to 80,000sqm of vacant or sub-optimal space to invest into and continue generating returns as the capex investment programme has been producing over the last three years.
The Company delivered an exceptional 6.2% increase in like-for-like annualised rental income. This is the highest ever organic annualised rental income increase that the Company has achieved and is partly indicative of a strong market, but more importantly how well Sirius’ asset management platform is able to capture demand. Total Company annualised rental income grew from €71.0 million at the start of the period to €79.5 million when factoring in two acquisitions that completed on 1 April 2018.
The assets that were owned for the entire period increased in book value from €719.5 million to €803.9 million which represents an €84.4 million or 11.6% like-for-like valuation increase. The acquisitions that completed in the year were valued at €127.5 million, which is 7.6% higher than their purchase price (excluding acquisition costs) and only marginally lower than the total acquisition costs. Including the assets located in Saarbrücken and Düsseldorf II that completed on 1 April 2018, the Group’s portfolio has a book value of €967.5 million. As at 31 March 2018, the core assets within the portfolio are now valued on a gross yield of 8.1% and net yield of 7.4%.
18
17
931.2
823.3
€931.2m 13.1%Portfolio book value
18
17
89.6
76.4
€89.6m 17.4%Profit before tax
18
17
3.16
2.92
3.16c 8.2%Total dividend for the year
18
17
5.37
5.27
€5.37 1.9%Average rate per sqm
Completion of the reinvestment of disposal and equity raise proceeds
Original capex investment programme substantially complete with excellent returns
Exceptional organic rental income growth and lettings
Substantial valuation increases seen again
€75.8m 6.8%Gross annualised rental income at 31 March 2018
75.8
71.0
Throughout these accounts certain industry terms and alternative performance measures are used; see the glossary on page 115 for full explanations and reconciliations of alternative performance measures to IFRS numbers.
2 Sirius Real Estate Limited Annual Report and Accounts 2018Strategic report
Our highlights
Strong performance and opportunity for the future

As at 31 March 2018 the Group owned or managed a portfolio of 54 business parks in Germany containing approximately 1.4 million sqm of lettable space.
The majority of the Group’s business parks are a mixture of office, storage and production space. Whilst retaining the major core anchor industrial tenants, many of the business parks are restructured to enhance the working environment of the tenants.
We are an owner and operator of branded business parks providing conventional space and flexible workspace in Germany.
Total portfolio split
Tenant split by revenue
Production
Other SME tenants
Storage
Smartspace SME tenants
Office
Top 50 anchor tenants
Other
Smartspace
Some of our tenants
4,432Total number of tenants
2.6yrsAverage lease remaining
54Total properties owned and managed
€127.5mAssets acquired
€103.0mDisposals completed
28%
34%
24%
6%8%
45%48%
7%
3Sirius Real Estate Limited Annual Report and Accounts 2018
Our business at a glance
Flexible workspace

Our wide-ranging portfolio of office space offers both long and short-term lease options. The office space we provide comes either with or without a comprehensive service package.
Offices, office space and co-working in Sirius business parks.
Conventional offices
Smartspace office
Officepods
Virtual office
Large production areas form the base of many Sirius business parks; however, smaller workshop areas complement these, giving clients optionality.
Workshop spaces
Production
Smartspace Workbox
For businesses and private households alike, the wide range of storage space on offer provides many options on varying scales. The range of self-storage options and spacious warehouses offers customers what they need.
Warehouse, storerooms and self-storage options are available on Sirius business parks.
Classical storage spaces
Smartspace storage
Flexistorage
Offices Production and workshopsStorage
What we offerThe Group derives a large part of its rental income from conventional industrial tenants, which include international blue-chip corporations, but the majority of clients are German small to medium-sized enterprises (“SME”).
The stable long-term income from anchor tenants underpins the ability to generate higher revenues from the more flexible leasing options.
We have created a range of innovative and flexible products by investing into sub-optimal space. This attracts a large number of tenants to our sites whilst generating higher income and asset value growth from space that would often be left vacant or rented at low prices.
Diversified tenant structure
Flexible workspaceTypical tenantSMEs and retail customers
Typical lease lengthShort term
Type of spaceServiced offices, workshops and self-storage
% of Group annualised rental income 7%
% of total sqm occupied5%
Average rate per sqm€7.19
Conventional workspaceTypical tenant SMEs
Typical lease lengthLong and short term
Type of spaceProduction, office and storage
% of Group annualised rental income55%
% of total sqm occupied45%
Average rate per sqm€6.37
Large-scale workspaceTypical tenant International blue-chip corporations
Typical lease lengthLong term
Type of spaceProduction
% of Group annualised rental income 37%
% of total sqm occupied50%
Average rate per sqm€3.81
4 Sirius Real Estate Limited Annual Report and Accounts 2018Strategic report
Our business at a glance continued
What we operate

POTSDAM
MAGDEBURG
BAYREUTH
NÜRNBERG
HEIDENHEIM
MÜNCHEN
GRASBRUNN
DRESDEN
ROSTOCK
HAMBURGSCHENEFELD
BERLIN
BREMEN
HANNOVER
KASSEL
MAINTAL
MANNHEIM
MARKGRÖNINGEN
PFUNGSTADT
NEU-ISENBURG
OFFENBACH
FRANKFURTBONN
COLOGNE
KREFELD
WUPPERTAL
SOLINGENNEUSS
ESSEN
DÜSSELDORF
AACHEN
MAINZ
WIESBADEN
DREIEICH
LUDWIGSBURG
WEILIMDORF
FRICKENHAUSEN KIRCHHEIM
4,432Tenants
54Total number of properties owned and managed at period end
1.4mLettable sqm
Berlin
Cologne
Düsseldorf
Frankfurt
Hamburg
Munich
Stuttgart
Other
Non-Core
Managed
5Sirius Real Estate Limited Annual Report and Accounts 2018

Total acquisition cost€8,412,350Tenants0Lettable space11,223Occupancy0%Rental income€0Vacant space11,223Rate per sqm—
Hamburg December 2017
Total acquisition cost€18,074,950Tenants1Lettable space14,791Occupancy4%Rental income€97,243Vacant space14,279Rate per sqm€9.01
Grasbrunn July 2017
Total acquisition cost€6,079,000Tenants10Lettable space5,035Occupancy87%Rental income€498,850Vacant space673Rate per sqm€9.06
The year under review has proven to be an exceptionally active one for investment activity with the asset acquisition and recycling programme in full swing.
Frankfurt II September 2017
Acquisitions
Total acquisition cost€22,904,350Tenants15Lettable space20,342Occupancy100%Rental income€2,038,203Vacant space105Rate per sqm€7.64
Cologne June 2017
Total acquisition cost€9,635,066Tenants1Lettable space7,996Occupancy41%Rental income€472,041Vacant space4,692Rate per sqm€10.15
Neu-Isenburg September 2017
Total acquisition cost€4,497,850Tenants6Lettable space4,064Occupancy28%Rental income€153,260Vacant space2,926Rate per sqm€10.52
Frankfurt April 2017
Total acquisition cost€6,394,310Tenants21Lettable space12,826Occupancy62%Rental income€531,216Vacant space4,845Rate per sqm€5.35
Mahlsdorf II July 2017
Total acquisition cost€16,092,500Tenants6Lettable space18,258Occupancy38%Rental income€669,685Vacant space11,344Rate per sqm€8.89
Neuss September 2017
6 Sirius Real Estate Limited Annual Report and Accounts 2018Strategic report
Investment review
Capital recycling and increased value-add opportunity

Total acquisition cost€9,161,200Tenants6Lettable space10,398Occupancy72%Rental income€728,590Vacant space2,875Rate per sqm€7.44
Krefeld III January 2018
The year under review has proven to be an exceptionally active one for investment activity with the asset acquisition and recycling programme in full swing. In total eleven acquisitions completed in the period and two on 1 April 2018 as well as the disposal of three business parks and one land package in the period. Additionally, the sales of a further non-core business park, another land package and a residential building were completed just after the period and the last non-core business park was close to being notarised.
The 13 acquisitions that completed in or just after the period had total acquisition costs of €163.7 million and, with blended occupancy of only 58%, provide real income and value-add opportunity. All acquisitions are located in areas in which the Group has a deep market understanding and can be quickly incorporated into the Group’s operating platform.
Total acquisition cost€15,118,026Tenants5Lettable space42,220Occupancy71%Rental income€1,460,391Vacant space12,164Rate per sqm€4.04
Total acquisition cost€8,064,250Tenants3Lettable space8,672Occupancy80%Rental income€627,208Vacant space1,704Rate per sqm€6.90
Schenefeld March 2018
Düsseldorf II* April 2018
Total acquisition cost€11,149,150Tenants18Lettable space28,594Occupancy50%Rental income€800,448Vacant space14,423Rate per sqm€4.44
Total acquisition cost€28,085,000Tenants12Lettable space47,350Occupancy65%Rental income€3,057,184Vacant space16,774Rate per sqm€7.68
Frickenhausen March 2018
Saarbrücken* April 2018
The 13 acquisitions that completed in or just after the period provide real income and value-add opportunity.”
* Completed post year end.
7Sirius Real Estate Limited Annual Report and Accounts 2018

In completing the sale of €103.0 million of business parks the Company has demonstrated its ability to successfully realise the value it creates as well as recycle capital from non-core and mature sites into assets with higher value-add potential.
Notarised the sale of a non-core asset located in Bremen for €15.5 million in line with book value. The disposal of this asset unlocks €15.5 million of capital that the Company intends on reinvesting into our asset recycling programme where significant additional value can be created within our key markets. The sale completed on 1 May 2018.
Bremen Brinkman March 2018
Notarised the sale of non-income producing land in Rostock with a book value of €660,000 for €1.2 million. Proceeds are expected to be reinvested into capex investment programmes. The sale completed on 1 June 2018.
Rostock land February 2018
Disposals
The sale of the Munich Rupert Mayer Strasse asset for €85.0 million was notarised in January 2017 and completed in May 2017. Over the eight years that the site was owned by the Company it successfully repositioned the asset by replacing a single tenant with multiple tenants on substantially higher rents and improved cost-recovery contracts. This involved investing into the transformation of sub-optimal space and letting this space as well as improving the tenant contracts and service charge recovery mechanics. Hence the site’s net operating income significantly increased and the sale at €85.0 million represented a 48% increase on original purchase price and a 9% premium to last reported book value at 30 September 2016 prior to its notarisation.
Munich Rupert Mayer Strasse May 2017
Completed the sale of a mature asset located in the non-core area Kiel for €7.0 million representing an EPRA net operating yield of 7.4%. Proceeds of the sale were recycled into a much better located office building in Frankfurt which has acted as substitute for the Kiel asset within the existing SEB AG loan facility.
Kiel September 2017
The sale of the Düsseldorf Wiesenstrasse business park for €11.0 million was notarised in March 2017 and completed in May 2017. The asset was fully developed under the Sirius brand and, with occupancy in excess of 96%, was considered a mature asset within the Company’s portfolio. The sale at €11.0 million represented a 25% premium to the last reported book value on 30 September 2016 prior to its notarisation.
Düsseldorf Wiesenstrasse May 2017
Completed the sale of non-income producing land in Berlin Tempelhof with a book value of €650,000 for €950,000. Proceeds were reinvested into converting two floors of a derelict office building on that site into high-quality office space.
Berlin Tempelhof Land December 2017
Notarised the sale of a derelict residential building in Markgröningen with a book value of €350,000 for €625,000. Proceeds are expected to be reinvested into capex projects on that site. The sale completed on 1 June 2018.
Markgröningen residential building February 2018
Disposals
8 Sirius Real Estate Limited Annual Report and Accounts 2018Strategic report
Investment review continued

The disposal of the non-core Bremen Brinkman site that completed after the period end represents a significant breakthrough as this site had been earmarked for disposal for a number of years. At time of completion in May 2018 the Brinkman site was producing €0.9 million of annualised net operating income and contained 48,700sqm of vacant space. The asset was unencumbered and the proceeds from the disposal are expected to be recycled into assets with greater value creation potential.
9Sirius Real Estate Limited Annual Report and Accounts 2018

In summary: » Sirius’ core objective remains the delivery of attractive risk-adjusted returns through a mix of dividend yield and capital value appreciation.
» The year under review saw Sirius commence its capital recycling programme and replace two mature assets and one non-core site with new assets with greater scope for income and capital growth.
» The Sirius business model continues to deliver not only progressive income returns but also attractive capital growth as measured by adjusted net asset value per share (“adjusted NAV”).
A clear strategic approach
IntroductionSirius’ core objective remains the delivery of attractive risk-adjusted returns through a mix of dividend yield and capital value appreciation. This is achieved by maximising the opportunities across its portfolio of 54 business parks which it owns and manages. Key to this is the in-house model and operating platform which has significantly reduced the Company’s reliance on third party contractors leading to market expertise and experience being built up and maintained within the business which represents a key point of difference for Sirius. The year under review saw Sirius commence its capital recycling programme and replace two mature assets and one non-core site with new assets with greater scope for income and capital growth. Many of the new assets that have been acquired have high levels of vacancy providing the Company with a prime opportunity to apply its proven ability to transform vacant and sub-optimal space and create significant future value.
In December 2017, Neil Sachdev stepped down from the Board and the Company is making good progress in its search for a new Chairman. In the interim period the Board has appointed me as Acting Chairman.
FY17/18 highlightsAn impressive trading performanceIt is a pleasure to be able to report on an excellent twelve months of trading for Sirius, during which the Company continued to grow earnings whilst successfully recycling €103.0 million of capital from disposals, together with fundraising proceeds and bank lending, into 13 new assets with greater future growth potential. The Company delivered a profit before tax of €89.6 million, up 17% on the prior year, whilst funds from operations (“FFO”) increased by 4% to €38.4 million despite the earnings lag relating to disposed assets. The increase was mainly driven by the 6.2% like-for-like annualised rental income growth that was generated on the existing portfolio(1) which drove the total annualised rental income, including the two acquisitions which completed on 1 April 2018, to €79.5 million (2017: €71.0 million). This performance demonstrates the strength of the Company’s operating
10 Sirius Real Estate Limited Annual Report and Accounts 2018Strategic report
Senior Independent Director’s statement

One positive development arising from the King IV Code has been the establishment of a new Social & Ethics Committee which will help ensure we continue to conduct our business in a manner that upholds the principles of integrity and equality in everything we do.
Ensuring our Board has the right expertise to support and challenge the business is of paramount importance. We regularly review the composition of the Board to ensure our combined skillset is aligned to the strategic priorities of the business. We were delighted to welcome Jill May onto the Board in November 2017 as a non-executive director. As a former panel member of the Competition and Markets Authority and a current non-executive director of the Institute of Chartered Accountants (ICAEW), as well as two listed investment companies, Ruffer and JP Morgan Claverhouse, Jill brings a wealth of experience in financial and capital markets.
In September 2017, after more than ten years of distinguished service, Robert Sinclair formally stepped down from the Board. We remain ever grateful for the stewardship the Company benefited from during Robert’s service and we warmly send him our best wishes.
KPMG LLP London will not offer themselves up for re-election as the Company’s auditors at the next Annual General Meeting. The Board considered that in light of new regulation regarding the rotation of auditors, and, in line with best practice and due to the length of time KPMG had acted as audit firm to the Company, that a formal audit tender process would be undertaken during the reporting period. Following the completion of the audit tender process the Company advises that KPMG LLP will resign as auditors at the completion of this year’s audit and Ernst & Young LLP will be appointed. The Board is recommending that Ernst & Young LLP be reappointed as auditors from the date of the AGM in September 2018. We would like to thank KPMG for their long and dedicated service to the Company since it was first formed.
Thank you and outlookA collective effortAs the Group expands so does the number of stakeholders in the Company, all of whom contribute to its ongoing success. On behalf of the Board I would like to thank all those connected to Sirius for their efforts and hard work without which the Company could not have achieved what it has in the year to 31 March 2018. Having refuelled the business with 13 new assets, including Saarbrücken and Düsseldorf II, which completed on 1 April 2018, the Company’s annualised rental income was €79.5 million, which suggests the Company is well set to continue increasing recurring revenues and capital values into the next year. Whilst we remain cautious about the market and economic conditions in Germany and Europe, its proven track record of adding value through intensive asset management activity gives us confidence of another busy and successful year ahead.
James PeggieSenior Independent Director1 June 2018
platform to drive organic growth and the appeal of conventional and flexible workspace solutions to the German market especially the burgeoning Mittelstand market made up of small to medium-sized enterprises.
(1) Excludes disposals and acquisitions.
Shareholder returnsConsistent outperformanceThe Company’s stated policy is to pay dividends based on 65% of the Group’s FFO but as we indicated last year, due to the high level of disposals and the desire to maintain positive dividend growth, the Board would consider temporarily increasing the pay-out ratio. As a result, the Board has declared a final dividend of 1.60c per share representing 75% of FFO, a 4.6% increase on the same period last year. The total dividend for the year is 3.16c, an increase of 8.2% on the 2.92c total dividend for the year ended 31 March 2017.
Financial year Dividend per share
2015–2016 2.22
2016–2017 2.92
2017–2018 3.16
The Sirius business model continues to deliver not only progressive income returns but also attractive capital growth as measured by adjusted net asset value per share (“adjusted NAV”). Combining the growth in adjusted NAV and dividends paid, the Company has consistently delivered an annual return in excess of 15% for the last three years and this year was no exception with a return of 17.0% being recorded. Whilst income contributed approximately one-third and capital growth two-thirds of those total shareholder returns, it is pleasing to note that the valuation movement of our underlying investment property is heavily derived from organic increases in income rather than yield movement. This focus on growing income at property level positions the Company well for the future irrespective of the prevailing market conditions.
Financial year Total shareholder return(1)
2015–2016 16.0%
2016–2017 15.3%
2017–2018 17.0%
(1) Using adjusted NAV per share which excludes provisions for deferred tax and financial derivatives and includes dividends paid.
Governance and cultureIntegrating entrepreneurial drive and leadership with risk managementThe Board is fully committed to the UK Corporate Governance Code (“UK Code”) as published in June 2016 by the Financial Reporting Council as well as the King IV Report on Corporate Governance for South Africa 2016 (“King IV Code”) as issued by the Institute of Directors in Southern Africa NPC in November 2016. I am pleased to report that we are compliant with all principles of the UK Code. The JSE has granted the Company dispensation not to report on its application of the King IV Code, provided that Sirius continues to comply with the mandatory corporate governance provisions pursuant to paragraph 3.84 of the JSE Listing Requirements.
11Sirius Real Estate Limited Annual Report and Accounts 2018

Q&A with the CEO
Our recent acquisitions have seen the Company establish a greater critical mass within the key geographical locations in Germany. Not only do we regard these markets as attractive from an investment perspective but our existing presence in those markets allows us to benefit from meaningful operational efficiencies.”
What impact do you think Brexit will have on Sirius?One of the most debated potential impacts of Brexit has been the extent to which it influences foreign exchange rates. As a business operating in Germany, Sirius has very little exposure to changes in the value of the pound from a trading perspective; however, as the Company’s shares are traded in pounds, changes in underlying exchange rates will impact share price.
increasing demand for out of town and secondary locations. Should this happen, Sirius is well placed to benefit due to its concentration of properties in and around major German cities like Frankfurt, Hamburg, Berlin and Munich which have been highlighted as cities that might attract businesses and related investment as a direct result of Brexit.
More broadly with the successful outcome of coalition talks, the political landscape in Germany is now more certain than before which should provide additional confidence for inward investment as well as providing growth opportunities for the hugely significant SME market which makes up the majority of our tenant base.
How is this year’s performance different to last year?
Having delivered another positive set of results one could easily be mistaken for assuming our performance was an extension of what was delivered in the prior year. The financial year ended 31 March 2018 was in fact markedly different with the main characteristic being the successful recycling of equity from mature assets into assets with greater opportunity.
This year the Company completed transactions with a total value in excess of €350 million including eleven acquisitions, three disposals and three financings. In addition a further two acquisitions and three disposals were completed after the period end. Including capital raises the Company was involved in over 20 significant transactions which mark this year out as being arguably the busiest year the Company has ever experienced and it is testament to the experience and depth of management within the Company that they were able to execute such a heavy workload.
From a trading perspective the total result does not tell the full story of how the Company was successful in replacing €7.1 million of annualised rental income lost through disposal activity with €11.6 million of annualised rental income gained from acquisitions that completed in the period or immediately thereafter. The assets acquired or notarised in the year contain significantly more vacancy than assets acquired in previous years and, with some promising lettings already and a strong pipeline of new tenant enquiries for these sites,
Brexit has resulted in considerable press coverage and speculation regarding companies relocating their businesses to Germany which, in turn, could bring additional demand particularly for office space in major cities. One consequence of this may be companies being priced out of their current locations and, as a result,
Strong results and planning for the future
12 Sirius Real Estate Limited Annual Report and Accounts 2018Strategic report
CEO’s Q&A

How relevant is the Sirius business model in today’s market?
The simple answer to this question and what is unique to Sirius is that our business model is purpose built to succeed throughout the real estate cycle.
Sirius acquires property significantly below replacement cost and specialises in converting a small percentage of that into high yielding space using specifically designed products that meet market demands. By using a bottom-up, market-led approach we gain unequalled insight into markets which allows us to develop space to demand rather than speculation. Our highly specialised internal operating platform has many years of demonstrable experience in delivering organic growth which means, unlike many of our competitors, we are not reliant on yield shift to generate returns.
The Company itself is led by a team of highly experienced people who have been fully tested over the full real estate cycle and have created over €350 million of shareholder value net of capital raises over the last three years. This management team led the turnaround of the business out of the last downturn and can be regarded as a safe set of hands to steer the Company through the challenges of the next cycle including obsolescence as well as the management of loan to value ratios, debt service and leasing risk in particular.
What does the long-term vision look like and are new geographies on the horizon? Sirius has grown over the last five years from a small AIM-listed company to a Main Market, EPRA/NAREIT/MSCI Small Cap Index and SAPY index participant with aspirations to enter into the FTSE 250. The Company has delivered outstanding relative income and capital returns in a considered and low-risk manner and our vision is to continue doing so to the benefit of all shareholders.
Germany is Sirius’ core market and it is difficult to see that this would ever change. Whilst the Company has a clear focus on increasing the value of its property to in excess of €1.2 billion in Germany there remains a strategic question to be answered around future growth and potential diversification thereafter. Clearly any decision around geographical diversification would be subject to the same disciplined risk-adjusted approach we adopt in our regular investment activity and any such diversification would need to deliver meaningful accretive earnings and capital growth over the long term.
Andrew CoombsChief Executive Officer1 June 2018
we believe that we have positioned ourselves well for the years ahead. Equally impressive in this year’s performance is the 6.2% like-for-like increase in annualised rental income, in an economy with less than 2% inflation demonstrating our ability to deliver outstanding results organically whilst at the same time dealing with high transactional velocity.
Whilst financing our acquisitions with long-term debt on attractive terms is nothing new for Sirius, the financial year to 31 March 2018 was the first year in which we have taken advantage of favourable lending conditions to secure financing for our highly accretive capex investment programmes with capex facilities totalling €15.0 million completing in the period. This additional funding source provides the Company with greater flexibility and capacity with which to execute its investment programmes.
What can we expect in the year ahead?
The year ahead will see the asset recycling and acquisitions continue following the disposal of the Bremen Brinkman site, the residential units at Markgröningen and a land package in Rostock in the first half of the new financial year. The proceeds from this, along with the recent €40.0 million equity raise and further borrowings, are expected to be invested into around €100.0 million of new acquisitions. Additionally we will move forward with our new acquisitions capex investment programme whilst completing the original capex investment programme which is forecast to continue delivering exceptional returns. The new acquisitions capex investment programme is expected to be rolled out over a three year period and the €26.1 million budgeted investment is expected to generate an additional €8.1 million in annualised rental income. The effect of this from both an income and capital perspective will be significant. We are also active on the disposal of the Bremen HAG site which, if completed, would mean that we will have successfully disposed of all non-core sites.
Our recent acquisitions have seen the Company establish a greater critical mass within the key geographical locations in Germany. Not only do we regard these markets as attractive from an investment perspective but our existing presence in those markets allows us to benefit from meaningful operational efficiencies which we expect to grow as a result of further acquisition and selective asset recycling activity. Looking ahead we intend on continuing to build our presence in these markets and with over €1.0 billion of property under management including those properties managed through operating agreements and a market capitalisation exceeding €700 million we will explore methods in which our increased size can help us trade in different and more advantageous ways.
> To read more about opportunities going forward see the asset management review on page 26
> To read more about financing see the financial review on pages 34 to 38
13Sirius Real Estate Limited Annual Report and Accounts 2018
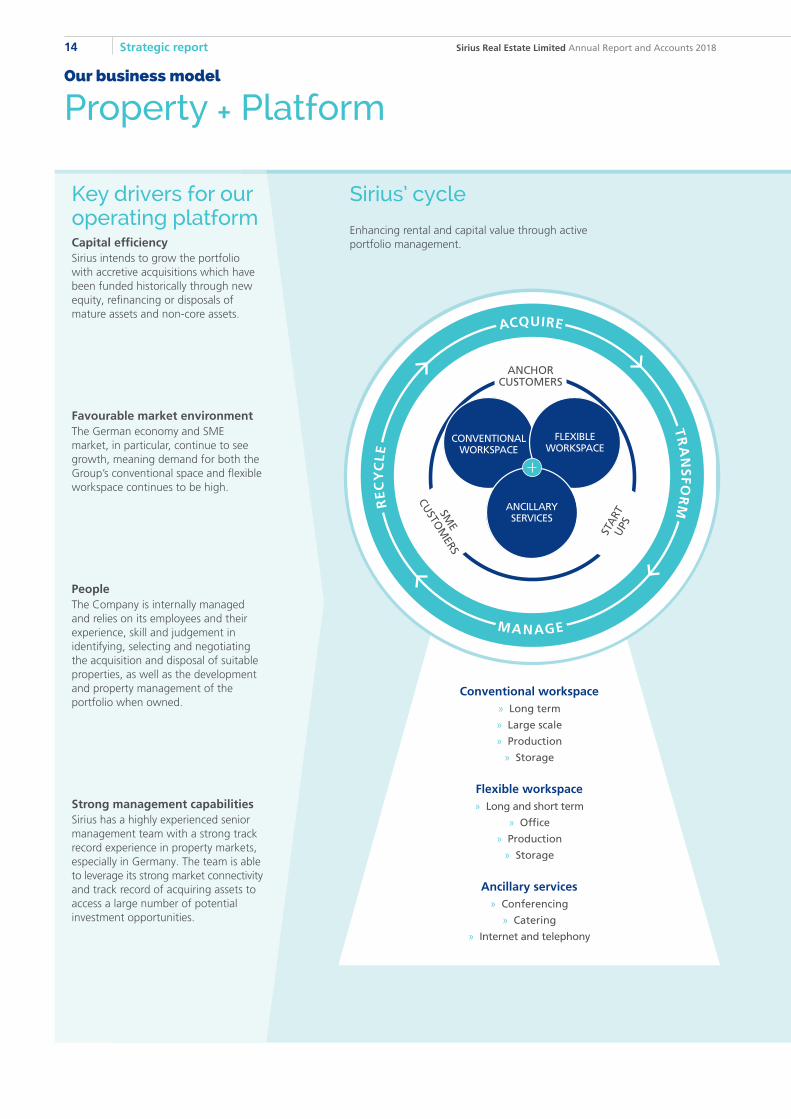
Conventional workspace » Long term
» Large scale
» Production
» Storage
-
Flexible workspace » Long and short term
» Office
» Production
» Storage
Ancillary services » Conferencing
» Catering
» Internet and telephony
Key drivers for our operating platformCapital efficiencySirius intends to grow the portfolio with accretive acquisitions which have been funded historically through new equity, refinancing or disposals of mature assets and non-core assets.
Favourable market environmentThe German economy and SME market, in particular, continue to see growth, meaning demand for both the Group’s conventional space and flexible workspace continues to be high.
PeopleThe Company is internally managed and relies on its employees and their experience, skill and judgement in identifying, selecting and negotiating the acquisition and disposal of suitable properties, as well as the development and property management of the portfolio when owned.
Strong management capabilitiesSirius has a highly experienced senior management team with a strong track record experience in property markets, especially in Germany. The team is able to leverage its strong market connectivity and track record of acquiring assets to access a large number of potential investment opportunities.
Sirius’ cycle
Enhancing rental and capital value through active portfolio management.
ACQUIRE
MANAGE
TR
AN
SFO
RMR
EC
YC
LE
14 Sirius Real Estate Limited Annual Report and Accounts 2018Strategic report
Our business model
Property + Platform
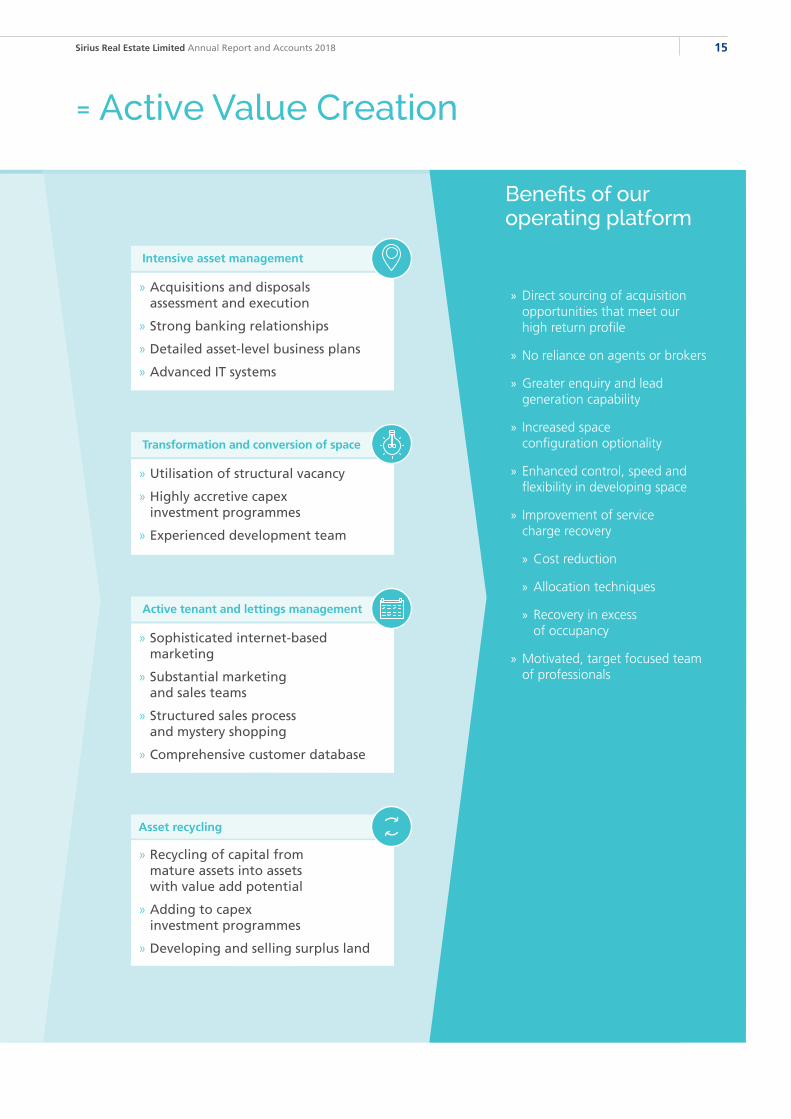
Benefits of our operating platform
Intensive asset management
» Acquisitions and disposals assessment and execution
» Strong banking relationships
» Detailed asset-level business plans
» Advanced IT systems
» Utilisation of structural vacancy
» Highly accretive capex investment programmes
» Experienced development team
Transformation and conversion of space
Active tenant and lettings management
» Sophisticated internet-based marketing
» Substantial marketing and sales teams
» Structured sales process and mystery shopping
» Comprehensive customer database
Asset recycling
» Recycling of capital from mature assets into assets with value add potential
» Adding to capex investment programmes
» Developing and selling surplus land
» Direct sourcing of acquisition opportunities that meet our high return profile
» No reliance on agents or brokers
» Greater enquiry and lead generation capability
» Increased space configuration optionality
» Enhanced control, speed and flexibility in developing space
» Improvement of service charge recovery
» Cost reduction
» Allocation techniques
» Recovery in excess of occupancy
» Motivated, target focused team of professionals
15Sirius Real Estate Limited Annual Report and Accounts 2018
= Active Value Creation

Active portfolio management
Transformation and conversion of vacant space
Our five value drivers
Link to risks
Sirius’ main objective is to maximise the income and value of all assets by way of active asset management throughout the period in which they are owned. The Group’s asset management platform is predominantly in house and focused on key drivers such as property and tenant management, new lettings, service charge recovery, lease management, tenant renewals and debt collection.
The main asset management initiatives are designed to convert properties into improved, more efficient, higher yielding conventional and flexible workspaces.
1,5,6,9 5
The Company’s extensive capex investment programme continues to deliver exceptional returns and remains one of the major drivers of organic income and capital value growth. The programme is focused on converting vacant or sub-optimal spaces like excess office space, redundant halls and basements into both the Group’s conventional and smartspace flexible workspaces. The investment also includes upgrading common and outside areas as well as branding sites. Often amenities like conferencing rooms, canteens and fitness centres are created on site and let to external operators which bring substantial footfall as well as bringing them to life and adding to the tenant work environment.
The returns that the Company achieves from its capex investment are high as typically they not only include rental income and service charge recovery improvements that come from letting the transformed areas but also include significant valuation uplifts that come from improving the space and business park. The current capex investment programme commenced in January 2014 and is focused on just over 200,000sqm of sub-optimal space and continues to grow as a result of the vacancy in our recent acquisitions. Of the 186,621sqm that has been fully converted at 31 March 2018, an investment of around €18.8 million has resulted in an increase in annualised rental income of €10.9 million based on 82% of this space being let. The return on investment to date has been 58%.
The Group’s core strategy is the acquisition of business parks at attractive yields and/or with value-add potential which are transformed through investment and asset management to become higher quality real estate assets. This transformation includes the reconfiguration and upgrade of existing and vacant space to appeal to the local market, branding of the site and extensive asset management which includes extending anchor tenants, letting up vacancy and significantly improving service charge cost recovery.
The type of asset that the Group acquires and develops can be divided into three categories as follows:
» Traditional industrial business parks – typically large production sites built many years ago by owner-occupiers and developed for their specific needs.
» Modern mixed-use business parks – typically higher quality office, service and warehouse properties built for multi-tenants in the 1980s and 1990s.
» Office buildings – typically good quality office buildings in secondary or tertiary locations near the big seven major office markets in Germany.
16 Sirius Real Estate Limited Annual Report and Accounts 2018Strategic report
Our strategy
Delivering our strategy

Occupancy and rental growth
Improvement in service charge recovery
Growth through acquisition and recycling
6,9 5,6 1,2,3,4
The internal asset management platform remains a key differentiator for Sirius over its competitors and plays an integral role in driving occupancy and rental growth. The internal marketing team has developed a significant internet presence over the last ten years and, at 31 March 2018, this drives the generation of an average in excess of 1,200 leads per month predominantly from the Company’s website and the internet portals upon which vacancies are advertised. Once leads have been generated, a dedicated call centre immediately deals with all enquiries and converts approximately 75% of all enquiries into viewings. The on site sales teams use a structured sales process and are currently converting about 19% of viewings into new deals.
This translates to approximately a 14% conversion rate of all enquiries into new lettings which the Company believes is best in class. All aspects of the Company’s sales process as well as those of many of its competitors are mystery shopped in order to measure performance and ensure standards are continually met. This highly specialised in-house capability enables the Company to secure and retain tenants without reliance on external agents and brokers and is the key behind being able to realise the full potential of the transformed vacant space that is created through the capex investment programme.
Poor recovery of service charge costs in mixed-use, multi-tenanted business parks typically results in high leakage from net operating income. Over the last ten years, the Group has invested substantially in building an in-house team that is entirely focused on optimising service levels and costs as well as improving service charge recovery levels. These investments include the following:
» developing utilities metering and consolidating purchasing power to negotiate better utilities deals and improve consumption allocation;
» creating detailed equipment lists and matrices to manage maintenance programmes better and improve allocation of these costs;
» increasing service charge prepayments to reduce the need to chase balancing payments at the end of each year; and
» improving the overall cost allocation and recovery process.
The Company has developed the ability to achieve a cost-recovery percentage that is higher than occupancy is something which the Company believes to be an unrivalled performance. Sirius is committed to achieving this high level of recovery on all its assets going forward.
Sirius has been active in growing its portfolio through acquisitions over the last three years and has been funding these with share placings as well as negotiating favourable banking deals. In order to establish and maintain a balanced portfolio, both opportunistic and stable assets have been acquired within the three categories of assets mentioned at the start of this section.
The Company remains committed to growing the portfolio through the successful recycling of mature and non-core assets, as appropriate opportunities arise. These opportunities are constantly assessed with the intention to recycle capital into new assets with attractive return profiles and greater opportunity to add value.
The Group continues to be focused on growing both organically and acquisitively as well as recycling mature and non-core assets to free up capital to be used to acquire assets which it can transform and add greater value to.”
17Sirius Real Estate Limited Annual Report and Accounts 2018

Strategy in action
Acquisition€m
As at31 March 2018
€m
Totalimprovement
€m
Total acquisition cost/valuation 29.4 38.0 8.6
Invested equity 13.5 — —
Annualised rental income 2.3 2.9 26.1%
Annualised net operating income 2.2 2.8 27.3%
Occupancy 84.9% 99.1% 14.2%
EPRA net yield(1) 7.5% 6.8% —
Three years to31 March 2018
€m
Retained profit(2) 6.7
Valuation increase 8.6
Capex (0.6)
Cumulative total shareholder return 14.7
(1) Includes purchaser acquisition costs.
(2) Retained profit calculated as net operating income less bank interest.
Actual three year returnsTotal
improvement
Geared annualised IRR 31.2%
Ungeared annualised IRR 15.8%
» Modern post-unification business park with 35,719sqm acquired on attractive net initial yield with value-add potential due to significant structural vacancy and expected major tenant move-out
» Financed by seven year fixed rate facility at 1.48% interest rate until maturity in October 2023
» €0.6 million capex investment into structural vacancy to create smartspace and conventional offices and smaller business units (e.g. laboratory space)
» Replaced major tenant (€247k annual rent on 2,264sqm) within four months with three tenants for a similar rent
» Site fully occupied and increased annualised rental income by 26.1%
» Shareholder return of €14.7 million on invested equity of €13.5 million in three years equating to a 31.2% geared IRR
» Site is generating €2.8 million of annual net operating income on total debt and equity investment of €30.0 million (acquisition costs plus capex) giving a 9.3% running NOI yield
Modern mixed-use business park Potsdam – December 2014
•
•
•
•
•
•
•
External view
Meeting room
Smartspace office
18 Sirius Real Estate Limited Annual Report and Accounts 2018Strategic report
Our portfolio
Strategy in action

Acquisition€m
As at31 March 2018
€m
Totalimprovement
€m
Total acquisition cost/valuation 14.3 47.7 33.4
Invested equity 7.1 — —
Annualised rental income 2.1 3.5 66.7%
Annualised net operating income 1.6 3.4 112.5%
Occupancy 68.0% 94.1% 26.1%
EPRA net yield(1) 11.4% 6.7% —
Total investment €m
Total acquisition costs 14.3
Capex 10.7
Funded from bank (16.0)
Total equity invested 9.0
(1) Includes purchaser acquisition costs.
Actual returnsTotal
improvement
Operating cash flow on investment (geared) 17.7%
Operating cash flow on investment (ungeared) 13.6%
» Traditional industrial business park totalling 68,722sqm acquired in 2007 and originally built for an owner-occupier
» Site currently financed by seven year fixed rate facility at 1.66% interest rate until maturity in April 2023
» Anchored by two tenants on long leases who between them generate 73% of the total annualised rental income
» Large irrecoverable service charge costs initially because most of the 22,000sqm of vacancy was structural and unlettable without significant investment
» Developed structural vacancy and let as conventional and smartspace offices and storage, large hardware store and to a number of other SME tenants. Site is almost fully occupied
» Significantly improved service charge recovery due to implementation of advanced measurement and allocation techniques
» Site generating annual net operating income of €3.4 million on a total investment of €25 million (acquisition costs and capex) representing a 13.6% running NOI yield and a €22.7 million valuation gain
Traditional business park Mannheim – July 2007
•
•
•
•
•
•
•
Strategy in action
External view
Meeting room
Smartspace office
19Sirius Real Estate Limited Annual Report and Accounts 2018

Acquisition€m
17 months’progress – to
31 March 2018€m
Business plan target – to
30 September 2019€m
Total expectedimprovement
€m
Total acquisition cost/valuation 17.7 21.3 32.6 14.9
Invested equity 11.7 — — —
Annualised rental income 1.9 2.1 2.5 31.6%
Annualised net operating income 1.6 1.7 2.4 50.0%
Occupancy 64.6% 86.5% 94.1% 29.5%
EPRA net yield(1) 9.1% 7.5% 6.9% —
17 months’progress – to
31 March 2018€m
Retained profit(2) 2.3
Valuation increase 3.6
Capex (0.9)
Cumulative total shareholder return 5.0
(1) Includes purchaser acquisition costs.
(2) Retained profit calculated as net operating income less bank interest.
Expected three year returnsTotal expectedimprovement
Geared annualised IRR 35.6%
Ungeared annualised IRR 26.1%
Strategy in action
Office building Wiesbaden – November 2016
Reception
Meeting room
Smartspace office
» Office building of 18,889sqm acquired at attractive net initial yield of 9.1% with only 65% occupancy and two tenants on a WALT of 2.3 years
» Financed by a seven year fixed rate facility at 1.48% interest rate until maturity in October 2023
» All of the vacancy was structural vacancy in poor condition within a very difficult floorplate on the basement, ground and first floors
» One of the two original tenants will vacate but the space is expected to be re-let quickly. Structural vacancy is being converted into a combination of a high-quality business centre (completed), a fitness studio (signed and awaiting permissions), a laboratory (still in negotiations) and smartspace storage (in progress)
» Expected three year geared IRR in excess of 35.6% based on business plan
» Total projected debt and equity investment of €20.7 million (acquisition costs plus capex) is expected to yield a €2.4 million NOI in year three giving a running NOI yield of 11.6% and a €11.9 million potential valuation gain
•
•
•
•
•
•
20 Sirius Real Estate Limited Annual Report and Accounts 2018Strategic report
Our portfolio continued

The Group benefits from the full breadth of the German economy and is well placed to take advantage of continuing demand for both its conventional space and flexible workspace.
From a tenant perspective, the Group benefits from the full breadth of the German economy and from a real estate perspective has benefited from the strong demand that the office and industrial markets have been experiencing in Germany.”
IntroductionSirius currently operates only in the German real estate market and focuses on the industrial, storage and office sectors.
The Group has a specific focus on owning and operating assets that are located in and around the big seven German markets namely: Berlin; Hamburg; Frankfurt; Munich; Cologne; Stuttgart; and Düsseldorf. The Group currently owns and manages a portfolio of 54 mixed-use business parks and office buildings across Germany which are marketed under the Sirius brand. The three major types of property the Group owns are traditional light industrial business parks, modern mixed-use business parks and office buildings.
The Group continues to maintain a well-balanced and diversified tenant base that ranges from large blue-chip corporations which are typically occupying large production halls on a long-term basis, SME business which benefit from conventional and flexible office and workspace solutions to retail tenants which predominantly lease high yielding Smartspace products on short to medium term agreements.
As such, from a tenant perspective, the Group benefits from the full breadth of the German economy and from a real estate perspective has benefited from the strong demand that the office and industrial markets have been experiencing in Germany. It is well placed to take advantage of the continuing demand for both its conventional space and flexible workspace.
German economyThe German economy remains the largest in Europe and the fourth largest in the world. It accounts for 28% of the Euro area economy. GDP grew by 2.5% in 2017. Germany’s underlying strength shows up in rapid gains in employment and a fiscal surplus. The ECB’s monetary policy continues to be favourable to investment and consumer spending whilst inflation remains low.
99% of all German companies belong to the German “Mittelstand” business segment which comprises all small and medium-sized enterprises. Unlike other major European countries the German economy is geographically well dispersed throughout the country with several locations being regarded as centres of industry excellence. Sirius continues to invest into the markets it regards as having attractive fundamentals which include those that service major economic hubs. In this way the Company continues to benefit from the strong occupier demand coming from the SME market which is typically located around such commercial centres.
German real estate market As mentioned above, the two main real estate segments within which the Company operates are the office and light industrial markets. It does have some exposure to the warehouse and logistics markets but this is more so within its modern business parks.
The 2017 year saw extremely high transaction volumes across the board with those relating to business parks, warehouse/logistics and light manufacturing property in Germany exceed €8 billion for the first time. This includes the combined effect of single asset and portfolio transactions as well as corporate merger and acquisition activity.
Office volumes were also high amounting to an aggregated result of €25.5 billion which represented 45% of the total investment volume in 2017 and the second-strongest result on record. 75% of total office investment volume was directed into the five major German city markets, where Frankfurt and Berlin alone accounted for approximately €11.1 billion.
99%of all German companies belong to the German “Mittelstand” business segment which comprises all small and medium-sized enterprises.
21Sirius Real Estate Limited Annual Report and Accounts 2018
Our markets
Strong occupier demand

German real estate market continuedSuch investment volumes are reflective of the desirability of both the industrial and office markets in Germany to both domestic and foreign investors and this has been reflected in yields coming in further. We are seeing the imbalance from the restricted supply of quality product and this extremely high demand from a broad investor base pushing prices up and the industrial and logistics asset class in particular has become increasingly more investible for many investors.
Industrial real estate marketThe industrial real estate market that comprises business parks, warehouse/logistics properties and light manufacturing properties continues to attract both investors and occupiers as evidenced by transactional volumes and strong take-up seen over the last year. Investors’ interest in the industrial market is typically considered to be based upon the attractive yields available relative to other asset classes, the impact of online retailing on warehouse/logistics properties and the versatility and conversion potential of business parks. Occupiers meanwhile are attracted by the operational continuity a strategically well placed industrial property provides whilst the mix of scalable units and service offering within a converted industrial space meets the flexible demands of SME’s and micro enterprises.
As expected gross initial yields across industrial real estate continued to tighten during 2017 as demonstrated in the tables below. The spread of gross initial yields for developed industrial business parks, based on transactions recorded, has narrowed from between 12% to 8% in 2013 down to between 8% and 6% in 2017. We are now seeing transactions completing at below 6% in the market, but these are usually for mature portfolios. This demonstrates the potential that can be achieved with developing industrial assets in the strong locations around Germany.
Office marketThe German office market has seen falling yields for some time now. As indicated by the table below average net yields for prime office stock in the six major office markets continue to fall year on year with a reduction of 38 basis points in 2017 bringing the average gross yield down to 3.21%. Whilst Sirius does not invest in the prime office space it does invest in good quality offices in the secondary and tertiary locations in and around the big six markets and, as a result, should also benefit from this positive yield movement. As office rental rates continue to grow in core locations it is reasonable to assume the pricing competitiveness of secondary locations becomes an increasingly attractive proposition for occupiers. Such dynamics combined with the capability of its operating platform to drive occupancy and rates gives the Company confidence to generate attractive returns at the property level without having to rely on yield movement.
Max. RenditeMax. yield
DurchschnittsrenditeAverage yield
Marktübliches SpektrumStandard market spectrum
SpitzenrenditePrime yield
Min. RenditeMin. yield
Business parks
4
2
0
6
8
10
12
14
H1 2013 H2 2013 H1 2014 H2 2014 H1 2015 H2 2015 H1 2016 H2 2016 H1 2017 H2 2017
Development of net prime yields in the big six
Source: Office Market Germany – Property Report 2018, BNP, 2018.
Cologne Hamburg Berlin Munich Düsseldorf Frankfurt
5.5%
5.0%
4.5%
4.0%
3.5%
3.0%
Net
prim
e yi
eld
%
2008 2009 2010 2011 2012 2013 2014 2015 2016 2017
22 Sirius Real Estate Limited Annual Report and Accounts 2018Strategic report
Our markets continued

Light manufacturing properties14%
12%
10%
8%
6%
4%
2%
0%H1 2013 H2 2013 H1 2014 H2 2014 H1 2015 H2 2015 H1 2016 H2 2016 H1 2017 H2 2017
Warehouse/logistics properties14%
12%
10%
8%
6%
4%
2%
0%H1 2013 H2 2013 H1 2014 H2 2014 H1 2015 H2 2015 H1 2016 H2 2016 H1 2017 H2 2017
Source: Initiative Unternehmensimmobilien, bulwiengesa, H2 2017.
23Sirius Real Estate Limited Annual Report and Accounts 2018

Adjusted profit before tax (€m)Reported profit before tax adjusted for property revaluation, changes in fair value of derivative financial instruments and other adjusting items including expenses relating to share incentive plans and other costs considered to be non-recurring in nature such as restructuring costs and expected selling costs relating to assets held for sale.
EPRA earnings per share (c)EPRA earnings per share is a definition of earnings as set out by the European Public Real Estate Association. EPRA earnings represents earnings after adjusting for property revaluation, changes in fair value of derivative financial instruments, profits and losses on disposals and deferred tax in respect of EPRA adjustments.
Average rate per sqm (€)Average letting rate per sqm for the total portfolio.
EPRA NAV per share (c)EPRA NAV per share is a definition of net asset value as set out by the European Public Real Estate Association. EPRA NAV represents net assets after adjusting for derivative financial instruments and deferred tax relating to valuation movements and derivatives. EPRA NAV per share also takes into account the effect of the granting of shares relating to long-term incentive plans.
Occupancy (%)Percentage of total lettable space occupied as at reporting date.
Property valuation (€m)The book value of investment property including that categorised as held for sale as derived from an independent valuation performed by Cushman & Wakefield LLP.
Dividend per share (c)Total dividend for the reporting period which is calculated as a percentage of funds from operations (“FFO”). The Company’s policy is to pay out 65% of FFO but this year the Directors decided to pay out 75% of FFO to distribute some of the profits from disposals and to compensate for the timing drag in reinvesting the proceeds.
KPI KPI measure
79.7% 1.0%
18
17
16
15
79.7
80.5
80.1
78.7
64.18c 11.0%
18
17
16
15
64.18
57.84
52.72
47.91
3.16c 8.2%
18
17
16
15
3.16
2.92
2.22
1.61
3.04c 4.4%
18
17
16
15
3.04
3.18
1.88
1.41
€931.2m 13.1%
18
17
16
15
931.2
823.3
687.5
545.6
€36.7m 4.0%
18
17
16
15
36.7
35.3
22.9
12.6
€5.37 1.9%
18
17
5.37
5.27
16
15
5.06
4.75
24 Sirius Real Estate Limited Annual Report and Accounts 2018Strategic report
KPIs
Measuring our performance...

To increase adjusted profit before tax with further organic growth and through acquisitions completed in the reporting period having a full year’s impact on earnings in the new financial year, as well as investing the funds from the latest equity raise and further disposals into assets with value-add opportunity.
Adjusted profit before tax for the year ended 31 March 2018 was €36.7 million, representing an increase of 4% on the same period the previous year. The earnings drag from the timing of asset recycling was largely offset by exceptional organic growth.
To increase EPRA earnings per share as a result of organic growth and through acquisition activity particularly from assets acquired in the reporting period which will have a full year’s impact on earnings in the new financial year.
EPRA earnings per share for the year ended 31 March 2018 was 3.04c, representing a decrease of 4% on the previous year. The decrease is due to loss of income from disposals where the equity released took time to reinvest and the increase in the number of shares issued as a result of equity raises which were used to fund new acquisitions that will only have a full year impact on earnings in the new financial year.
To continue to grow average rate and rental income whilst also improving the quality of the sites through investment and management of the tenant base.
The average rate per sqm increased to €5.37 at 31 March 2018 from €5.27 at the same point of the previous year, representing an increase of 1.9%.
To grow EPRA NAV per share through the Group’s asset management initiatives for organic growth and asset recycling.
EPRA NAV per share increased in the period by 11.0% to 64.18c (31 March 2017: 57.84c). This is mainly attributable to the valuation increases seen in the year, as well as the retention of a portion of FFO which is generated.
To reduce vacancy relating to sub-optimal space by transforming this space into higher quality conventional space and smartspace and looking for disposal opportunities relating to our one remaining non-core asset which contains significant structural vacancy that does not justify investment.
Occupancy decreased marginally to 79.7% in the period due to the high vacancy within assets acquired in the period. Like for like occupancy increased from 79.8% to 82.5%.
To continue to grow the value of the Group’s portfolio through acquisitions and valuation increases by increasing income across the portfolio. This is expected to come partly from contracted rental increases and uplifts on renewals but more importantly through the development and letting up of sub-optimal and vacant space through the Group’s capex investment programmes.
The book value of the Group’s investment property increased by 13.1% as a result of both acquisition and organic growth. The like-for-like portfolio increased in book value by €84.4 million or 11.6%. The core portfolio is valued at an average gross yield of 8.1% (31 March 2017: 8.6%) and net yield of 7.41% (31 March 2017: 7.46%).
To grow the dividend primarily through the accretive impact on earnings of acquisitions and the continued roll-out of the capex investment programmes which is one of the key drivers of organic growth. The Company remains committed to its policy of paying shareholders at least 65% of FFO semi-annually. See note 25 of this report for further details.
The final dividend declared of 1.60c represents an increase of 4.6% on the same period the previous year. The total dividend for the year is 3.16c, an increase of 8.2% on the prior year. The Company continues to offer shareholders the ability to receive dividends in scrip rather than cash.
Link to strategyCommentary FY18/19 ambition
25Sirius Real Estate Limited Annual Report and Accounts 2018
…against strategy

€103.0mproceeds from the sale of three assets
€163.7mof new assets acquired*
€79.5mtotal annualised rental income** Including two assets that completed on 1 April 2018.
€65.0mfrom two equity raises in August 2017 and March 2018
IntroductionThe Sirius in-house asset and property management model continues to be a significant driver of value across the business and one of the key reasons that the Company is able to make the level of returns on its assets that it does. While common practice is to outsource many of the key functions of asset and property management, Sirius continues to reap the rewards that come with being able to manage its portfolio with its own dedicated resources. This is conducted through a highly specialised operating platform with a substantial IT infrastructure and over 230 full-time employees, and continues to focus on acquisitions, disposals, financing, capital investment and development, lettings, service charge recovery, supplier management, debt collection, lease management, financial reporting and many other aspects of portfolio management. Progress on all elements has been made in the year under review, which has seen the Company’s strong track record in growing profits and adding significant value to the portfolio continue.
Asset recycling, acquisitions and disposals The Company has been through an intensive asset acquisition and recycling plan this financial year through which the following has been achieved:
» the completion of the sale of three assets with proceeds totalling €103.0 million in the first half of the financial year;
» the completion of two equity raises – €25.0 million in August 2017 and €40.0 million in March 2018; and
» the acquisition of €163.7 million of new assets (including two assets that completed on 1 April 2018).
The acquisitions were funded by a combination of new equity, three new banking facilities as well as the proceeds from disposals.
The recycling will prove to be accretive to shareholders because mature assets with little opportunity remaining for further improvement have been replaced with assets with substantially more opportunity for income and valuation enhancement through the Company’s asset management initiatives. This is highlighted by the fact that the three assets sold for €103.0 million were contributing €6.7 million of net operating income on 90% occupancy whereas the 13 assets acquired cost a total of €163.7 million including acquisition costs but were generating €8.3 million of net operating income from only 58% occupancy at the time of acquisition. These new assets provide the Company with close to 80,000sqm of vacant and sub-optimal space to invest into.
A summary of the disposal activity in the year to 31 March 2018 is included in the table below:
Disposals
Totalproceeds
€mTotalsqm
Occupancy%
Vacantsqm
Annualised rental income
€m
Non-recoverable service costs
€000
Maintenance costs€000
Annualisedacquisition
NOI€m
EPRAnet initial
yield (1)
%
Munich RMS 85.0 71.8 88% 7,027 5.4 (98) (40) 5.3 5.9%
Düsseldorf 11.0 16.6 96% 657 0.9 (23) (10) 0.8 7.2%
Kiel 7.0 10.1 90% 1,006 0.6 (22) (10) 0.6 7.4%
Total 103.0 98.4 90% 8,690 6.9 (143) (60) 6.7 6.2%
(1) Includes estimated purchaser costs.
Sirius conferencing centre reception
26 Sirius Real Estate Limited Annual Report and Accounts 2018Strategic report
Asset management review
Asset recycling and our operating platform prepare for the next phase of growth.

The two assets sold in Munich and Düsseldorf were considered mature assets, having been owned and subject to intensive asset management for several years whilst the Kiel asset was considered to be in a non-core location where favourable pricing made for an attractive exit. The three assets which were disposed of generated €103.0 million of proceeds representing a blended EPRA net initial purchaser’s yield of 6.2%.
A summary of the acquisition activity in the year to 31 March 2018 is included in the table below:
Acquisitions
Total investment(incl. acquisition
costs)€000
Totalacquisition
sqm
Acquisitionoccupancy
%
Acquisitionvacant
sqm
Annualised acquisition
rentalincome
€000
Acquisitionnon-recoverable
servicecharge
costs€000
Acquisitionmaintenance
costs€000
Annualisedacquisition
NOI€
EPRA netinitialyield
%
Completed
Cologne 22,904 20,342 100% 105 2,038 (171) (18) 1,849 8.1
Grasbrunn 18,075 14,791 4% 14,279 97 (319) (17) (239) 1.3
Mahlsdorf II 6,394 12,826 62% 4,845 531 (136) (8) 387 6.1
Neuss 16,093 18,258 38% 11,344 670 (296) (14) 360 2.2
Neu-Isenburg 9,635 7,996 41% 4,692 472 (117) (7) 348 3.6
Frankfurt 4,498 4,064 28% 2,926 153 (107) (2) 44 1.0
Frankfurt II 6,079 5,035 87% 673 499 (49) (5) 445 7.3
Krefeld III 9,161 10,398 72% 2,875 729 (106) (9) 614 6.7
Hamburg 8,412 11,223 0% 11,223 — (215) (7) (222) 2.6
Schenefeld 15,118 42,220 71% 12,164 1,460 (261) (19) 1,180 7.8
Frickenhausen 11,149 28,594 50% 14,423 800 (323) (26) 451 4.0
Subtotal 127,518 175,747 55% 79,549 7,449 (2,100) (132) 5,217 4.1
Completed post period
Saarbrücken 28,065 47,350 65% 16,744 3,057 (491) (43) 2,523 9.0
Düsseldorf II 8,084 8,672 80% 1,704 627 (83) (8) 536 6.6
Subtotal 36,149 56,022 67% 18,448 3,684 (574) (51) 3,059 8.5
Total 163,667 231,769 58% 97,997 11,133 (2,674) (183) 8,276 5.1
The acquisitions in general have much more opportunity than those acquired over the previous two years but some assets, like those located in Cologne, Frankfurt II and Düsseldorf II, are characterised by high occupancy and stable income and have been acquired in order to combine with the opportunistic assets to make portfolios more suitable for bank financing. Frankfurt II was used as a replacement for the Kiel asset within the original SEB loan facility whilst the Cologne and Düsseldorf assets act as the anchor assets within the new SEB 3 facility which completed in March 2018.
The Company’s management has been focusing on acquiring assets in the areas outlying Germany’s “big seven” cities and reducing those assets owned outside of these areas and this is certainly reflected in the asset recycling programme to date. All assets acquired, with the exception of Saarbrücken, are located around either the Berlin, Munich, Frankfurt, Stuttgart, Cologne or Düsseldorf markets, where benefits from operational synergies can be made and tenant demand is at its strongest. Additionally, two assets were acquired in the Hamburg area, which is a market that the Company has been seeking to enter for some time. The Hamburg Lademannbogen and Schenefeld sites are located in areas with attractive fundamentals and together provide an excellent mix of stability in the logistics space and opportunity within the office space.
In addition to the empty office building in Hamburg Lademannbogen, most of the opportunity within the acquisition portfolio lies within the assets located in Neuss (Düsseldorf), Neu-Isenburg (Frankfurt), Grasbrunn (Munich), Frickenhausen (Stuttgart), Mahlsdorf II (Berlin) and Frankfurt I, which combined have a blended occupancy of around 39%. This provides the Company with real opportunity to grow income, and hence values, by utilising the capability of its operating platform and take advantage of the high occupier demand for office and light industrial space that these markets are experiencing as well as benefiting from the operational synergies mentioned above.
Market conditions are making it more challenging to access higher occupied properties which fit the Company’s investment profile at the prices that are desired and as a result of that the number of year on year acquisition opportunities reviewed increased by 20%. The change in the market conditions is reflected in the significant yield compression seen in the German market over the last few years, particularly for portfolio deals. Whilst this is good for further asset recycling, our acquisition focus has shifted towards assets offering investor returns based upon solid IRRs over a three to five year period rather than 75% plus occupied properties with good net initial yields. This is because at this point in the cycle we believe the best way in which we can generate attractive and consistent risk-adjusted returns for shareholders is to acquire properties typically with less than 80% occupancy where the Company can make use of its central platform to fill vacancy and improve the yields going forward. In summary it is the IRR that has become the focus rather that the net initial yield.
Substantial work and resource continue to be devoted to finding assets and accurately determining potential returns. In the year under review, the Company performed micro-market analyses and compiled detailed asset-level business plans on 84 acquisition opportunities. As a result of this activity we acquired 13 new assets, including the two which completed immediately after the year end.
27Sirius Real Estate Limited Annual Report and Accounts 2018

Asset recycling, acquisitions and disposals continuedThe benefits from executing our investment process in such a disciplined way are we believe so significant that the efforts in relation to identifying investments are justified. Of the sites acquired in the year under review annualised rental income had already increased by 4% or €469,000 by 31 March 2018, providing encouraging evidence of how the operating platform can quickly begin to realise the potential value established from its due diligence.
Looking forward, the Group still has the proceeds from the €40.0 million equity raise completed in March 2018 to invest as well as funds from three disposal transactions which have completed or are expected to complete after the financial year end. These are classified as assets held for sale as at 31 March 2018 and are detailed in the table below.
Assets held for saleSite
Book value March 2018
€000
Bremen Brinkman 15,500
Rostock land 1,200
Markgröningen residential building 625
Total 17,325
The sale of the non-core Bremen Brinkman asset is significant because this is one of two non-core sites (both in Bremen) identified within the portfolio that have been earmarked for disposal for a number of years. With 48,700sqm of vacant space at 31 March 2018 and a short lease expiry profile, the sale of Brinkman, the much more valuable of the two, provides a good opportunity to recycle capital out of an asset in a challenging location into other opportunities where our equity can be utilised to greater effect. In the period the Company also notarised for sale a piece of non-income producing land located in Rostock for €1.2 million as well as a derelict residential apartment block in Markgröningen for €0.6 million. The proceeds from the Rostock and Markgröningen sales will be redeployed into our capex investment programme.
The combination of the activity outlined above, along with new banking facilities, provides the Company with the resources to acquire around €100.0 million of additional assets.
Rental growth and new lettings The year under review was an exceptional one from an organic rental growth perspective with the Company reporting a 6.2% like-for-like annualised rental income increase. This is the highest ever annual organic annualised rental income increase that the Company has achieved and partly indicative of a strong market, but more importantly how well Sirius’ asset management platform is functioning. Total Company annualised rental income grew from €71.0 million at the start of the period to €79.5 million when factoring in the two acquisitions that completed on 1 April 2018. The increase in annualised rental income of €8.5 million is explained as follows:
» a loss of €7.1 million from disposals;
» a gain of €11.6 million from acquisitions;
» a loss of €0.7 million from non-core assets held for sale; and
» a gain of €4.7 million from organic growth on the existing portfolio not held for sale.
Like-for-like organic growth, excluding Bremen Brinkman, has come from a combination of move-ins of 159,938sqm at an average rate of €5.77 per sqm compared to move-outs of 115,554sqm at an average rate of €5.72 per sqm as well as a further €1.5 million of annualised rental income from contracted rent increases and uplifts upon renewal. The contractual and renewal increases represent a 2.4% elevation on the rents at the start of the financial year. Together this has resulted in the average rate of passing rents for the like-for-like portfolio increasing by 2.9% from €5.11 to €5.26 per sqm. The total portfolio, including when combined with the acquisitions including Saarbrücken and Düsseldorf II, has an average rate of €5.46 per sqm (31 March 2017: €5.27).
The occupancy across the portfolio including Saarbrücken and Düsseldorf II has remained flat at 79% despite selling assets with 98,425sqm of net lettable area and 90% occupancy and replacing them with assets containing 231,769sqm of net lettable area but only 58% occupancy. Following the completion of the Bremen Brinkman disposal, the Company’s occupancy increased to 81% based on 31 March 2018 data.
One of the main drivers behind the strong lettings performance has been the capability of the Company’s internal sales and marketing platform to generate 14,805 enquiries for the year of which 81% came from the Company’s internally developed websites and large number of online portals through which Sirius advertises. Improving the quality of leads is a continuing focus and in the period Sirius was able to improve the enquiry to new lettings conversion ratio to 14% which also represents a historical high for the Company and resulted in 2,132 new deals being signed in the year. Sirius is also developing its external broker channels to focus mainly on larger lettings and having so many different options for the generation of new lettings allows the Company to be flexible in space configuration and development which provides much more optionality to tenants. Capturing and understanding the demand dynamics of the market can only truly be achieved when enquiries are dealt with internally, like Sirius does, and this knowledge and understanding is utilised very effectively in both acquisition and ongoing asset management activities.
28 Sirius Real Estate Limited Annual Report and Accounts 2018Strategic report
Asset management review continued

Capex investment programmesThe Group’s capex investment programmes are continuing to be a key driver of growing rental income and valuations. In the year €7.0 million was invested into sub-optimal vacancy and a further €3.8 million annualised rental income was contracted in the period.
The capex investment programmes are specifically designed to unlock income and value through the transformation of vacant and sub-optimal space into both higher quality conventional space and the Company’s innovative range of smartspace products. This allows Sirius to develop and realise much more from space that other owners and operators would often consider structural vacancy. Some asset-level examples of how such exceptional returns are generated from the capex investment programme can be seen in the case study section within this report.
The original capex investment programme commenced in January 2014 and was focused on just over 200,000sqm of sub-optimal space suitable for transformation. We are pleased to report that as at 31 March 2018 this programme is substantially complete with a total of 186,621sqm of this space completely refurbished and the remaining 17,400sqm either in the process of being refurbished or awaiting permissions to proceed. A total of €18.8 million has been invested into the completed space and, at 82% occupancy, it is generating €10.9 million of annualised rental income representing an income return on investment of 58%. This return does not include the additional benefit of improved cost recovery from letting this space or the valuation increases that have been generated as a result of the improved income returns.
More detail on the programme to date is provided in the following table:
Original capex investment programme progress Sqm
Investment budgeted
€m
Actualspend
€m
Annualised rental income
increase budgeted
€m
Annualised rental income
increase achieved to March 2018
€mOccupancy budgeted
Occupancy achieved to March 2018
Rate per sqm budgeted
€
Rateper sqm
achieved to March 2018
€
Completed 186,621 22.5 18.8 9.9 10.9 80% 82% 5.50 5.93
In progress 9,134 2.4 0.2 0.9 — 90% — 8.95 —
To commence in next financial year 8,266 1.0 0.1 0.4 — 80% — 4.73 —
Total 204,021 25.9 19.1 11.2 10.9 81% — 5.60 —
The original capex investment programme has further potential for increasing rents and values mainly from the remaining 17,400sqm of space that has not been fully renovated. This space is expected to be completed and available for letting in the new financial year. In order to complete the entire original capex investment programme a further €4.4 million of investment is required and €1.3 million more annualised rental income is expected as a result when it is completed.
Furthermore, the investment programme is expected to be delivered well within the original capex investment budget, a reflection of the Company’s increased operational efficiency and effectiveness in delivering a wide range of investment projects.
A follow-on acquisitions capex investment programme has been developed over the last two years relating to assets acquired since April 2016. The Company has identified 121,065sqm of sub-optimal and vacant space suitable for investment within 19 assets acquired as part of this second programme. The Company expects to invest a total of €26.1 million to generate €8.1 million of incremental annualised rental income on a blended occupancy of 76% as highlighted below:
New acquisitions capex investment programme progress Sqm
Investmentbudgeted
€m
Actualspend
€m
Annualisedrental income
increasebudgeted
€m
Annualisedrental income
increaseachieved to March 2018
€mOccupancybudgeted
Occupancy achieved to March 2018
Rate per sqm budgeted
€
Rateper sqm
achieved to March 2018
€
Completed 24,382 3.0 2.0 1.8 1.7 87% 59% 7.10 9.99
In progress 15,042 4.5 1.0 1.2 0.1 83% — 8.04 —
To commence in next financial year 81,641 18.6 — 5.1 — 71% — 7.41 —
Total 121,065 26.1 3.0 8.1 1.8 76% — 7.39 —
With the occupier market being as strong as it is, the speed at which this space can be transformed is important for delivering the target returns expected from these properties. As at 31 March 2018 24,382sqm of the 121,065sqm space identified was fully converted with an investment of €2.0 million generating incremental annualised rental income of €1.7 million leaving €22.87 million left to invest into the remaining 96,683sqm to generate a further €7.0 million annualised rental income from the programme over the next three years. As can be seen, the expected returns, from an income perspective, on the new acquisitions investment programme are lower than those achieved from the original capex investment programme. However, due to the condition of the relevant space being of a lower standard and, therefore, requiring higher levels of investment, the value initially attributed to this space is also lower which means that the returns from a valuation perspective are expected to be higher. Therefore the total shareholder returns at the site level should be similar to those achieved by the original capex investment programme.
29Sirius Real Estate Limited Annual Report and Accounts 2018

Stable portfolio with substantial opportunityWhilst the portfolio has seen a lot of asset recycling and tenant churn in the period, the make-up of the Company’s rental income has remained strong. The stable income which comes from the top 50 anchor tenants accounts for around 45% of total annualised rental income and provides an excellent base to generate the more flexible, higher-rate income from the Company’s smartspace products which now accounts for around 7% of the annualised rent roll. The remaining 48% of Sirius’ annualised rent roll is contracted to over 2,000 SME tenants which is Sirius’ key target market from which it is able to utilise its operating platform to successfully increase occupancy and generate most of its annual uplifts. This tenant mix combined with the Company’s asset management, when considering the points mentioned above, provides Sirius’ shareholders with a portfolio that possesses a much lower risk profile than would be typically associated with the asset class and 2.6 years weighted average lease expiry across the portfolio. As a result the Company benefits from the high yields and value-add opportunities associated with industrial assets whilst mitigating risk to a far greater extent than many of its competitors.
The table below illustrates the tenant mix across our portfolio at the end of the reporting period:
Type of tenant
No. oftenants as at
31 March 2018Occupied
sqm
Annualised rentalincome
€m
% of totalannualised
rental income
Rateper sqm
€
Top 50 anchor tenants(1) 50 544,669 34.3 45% 5.26
Smartspace SME tenants(2) 2,163 59,853 5.2 7% 7.19
Other SME tenants(3) 2,219 571,468 36.3 48% 5.29
Total 4,432 1,175,991 75.8 100% 5.37
(1) Mainly large national/international private and public tenants.
(2) Mainly small and medium-sized private and retail tenants.
(3) Mainly small and medium-sized private and public tenants.
Opportunity within vacancyThe opportunity that remains within the portfolio is expected to be realised through the Company’s asset management initiatives, including the capex investment programmes, as well as through the potential for lower valuation yields than the 8.1% gross yield that the core portfolio is currently valued at. An analysis of the vacant space as at 1 April 2018 (including the Saarbrücken and Düsseldorf II acquisitions) highlights the opportunity from developing the sub-optimal space as well as selling the non-core sites. This can be seen by comparing the two tables below which show the existing vacancy analysis compared to a pro-forma table which adjusts the existing position by excluding the two non-core Bremen assets (one of which was sold on shortly after the period end) and the expected impact of the capex investment programmes when fully completed.
Vacancy analysis – March 2018 position including Düsseldorf II and Saarbrücken acquisitions which completed on 1 April 2018
Total space (sqm) 1,531,774
Occupied space (sqm) 1,213,565
Vacant space (sqm) 318,209
Occupancy 79%
Sub-optimal space
% of total
space Sqm
Capex investment
€
ERV(post investment)
€
Subject to original capex investment programme 2% 16,574 3,198,000 1,241,000
Subject to acquisition capex investment programme 6% 92,922 22,017,000 6,210,000
Flexilager vacancy — 7,218 106,000 226,000
Total sub-optimal space 8% 116,715 25,321,000 7,677,000
Vacancy of non-core sites 6% 93,433 — —
Structural vacancy core sites 2% 25,749 — —
Lettable vacancy
Smartspace 1% 18,321 — 1,346,000
Other vacancy 4% 63,991 3,708,000 3,444,000
Total lettable space 5% 82,313 — —
Total vacancy 21% 318,209 29,029,000 12,466,000
Current total vacancy of 21% can be reduced to 10% based on completing the capex investment programmes, letting up 80% of this space (as budgeted) as well as disposing of the two non-core Bremen assets. In this scenario, the true lettable vacancy, which is not classified as structural vacancy or going through a capex investment programme, would increase from 5% to 8%, which indicates that there could be further opportunity for occupancy growth in addition to this.
30 Sirius Real Estate Limited Annual Report and Accounts 2018Strategic report
Asset management review continued

When considering the implications for the valuation of the Company’s portfolio, it is useful to separate the mature portfolio from the value-add portfolio. The table below shows the key metrics of the 31 March 2018 valuation as well as including the Saarbrücken and Düsseldorf II acquisitions at cost.
Rent roll€m
Book value€m
Non-recoverable€m
NOI€m
Capital value/sqm€ Gross yield Net yield
Vacant space sqm
Rate psm€
Occupancy%
Core value-add 40.0 486.3 (5.5) 34.6 552 8.2% 7.1% 193,136 5.55 75.7%
Core mature 37.2 461.7 (1.2) 35.9 785 8.0% 7.8% 28,794 5.73 94.9%
Non-core 2.3 19.4 (1.5) 0.8 107 12.0% 4.1% 96,279 2.67 43.0%
Other — — (1.8) (1.8) — — — — — —
Total 79.5 967.3 (10.1) 69.4 586 8.2% 7.2% 318,209 5.46 79.2%
What is evident from the table above is that when assets are mature, the gap between gross and net yields reduces significantly due to the higher recovery of costs. Additionally from the transactions that we are seeing complete in the market currently as well as from analyst research, gross yields, on the higher occupied assets in particular, have come in significantly over the last two years. The combination of the extra occupancy and income that is expected to come from the capex investment programme and a reduction of the c.8.1% gross yield at which the core portfolio is currently valued would have a substantial impact on the value of the Group’s portfolio. This point is strengthened from the fact that the assets will be of a higher quality post the capex investment and that the assets are now predominantly located around the big seven German cities.
Smartspace and First ChoiceSmartspace continues to be a success story and is proving to be particularly popular with tenants seeking a flexible workspace solution. The four smartspace products and First Choice Business Centres are specifically designed, from a landlord perspective, to create high-quality workspace from sub-optimal and vacant space and, from a tenant perspective, to provide flexibility for the changing requirements of small businesses, including a fixed price that provides the financial certainty that many smaller customers desire.
The annualised rental income now generated from smartspace products and First Choice has increased from €4.8 million to €5.2 million in the period due to the creation of more smartspace product through the capex investment programmes as well as further lettings of previously created space. Whilst the total smartspace remained flat in the year as a result of disposal activity, occupancy increased to 70% for the first time (31 March 2017: 68%) and rate per sqm increased by 8.1% from €6.65 to €7.19.
From an investment point of view, the returns that are achieved from entire business parks are significantly enhanced by smartspace conversion because it mainly relates to transforming sub-optimal and vacant space into high-quality offices, storage space and workboxes. This is essentially converting space that is acquired for a very low cost into premium space. Some of the benefits of using smartspace are illustrated in the case studies within this report.
During the period a further 6,232sqm of smartspace office, 510sqm of smartspace Workbox and 3,624sqm of smartspace Storage were created from vacant sub-optimal space and Flexilager, the low cost storage product that the Company uses typically to fill space while it develops plans for vacant space. Additionally the Company opened the First Choice Business Centre on an owned site to complement the First Choice Business Centre which has been run through an operating and management agreement in Essen for several years.
The new First Choice Business Centre was created on the ground floor of an office building acquired in Wiesbaden in November 2016 and is proving to be an ideal location for the product. The premium office specification in a pure office property clearly distinguishes First Choice office space from smartspace offices with First Choice being a five-star premium product and smartspace being closer to three-star. The Wiesbaden First Choice Business Centre opened for business in October 2017 and was already 40% occupied as at 31 March 2018 and generating rental income, excluding service charge cost recovery, of an impressive €28.81 per sqm. It offers a combination of office and co-working space. Now that the awareness of the news centre is greater, we are expecting to have it close to fully occupied in the first half of the new financial year.
The table below gives more detail on the smartspace and First Choice offerings across the whole portfolio:
First Choice and Smartspace product typeTotalsqm
Occupiedsqm
Occupancy%
Annualised rental income (excl.
service charge)€m
% of totalsmartspaceannualised
rental income
Rate per sqm(excl. service
charge)€
First Choice office 1,275 510 40% 0.2 3% 28.81
SMSP office 33,799 26,437 78% 2.6 50% 8.18
SMSP Workbox 6,268 4,840 77% 0.4 7% 6.07
SMSP Storage 32,620 23,880 73% 1.7 34% 6.06
SMSP subtotal 73,963 55,666 75% 4.9 94% 7.28
SMSP Flexilager(1) 11,406 4,187 37% 0.3 6% 6.06
SMSP total 85,368 59,853 70% 5.2 100% 7.19
(1) Not adjusted for common areas.
31Sirius Real Estate Limited Annual Report and Accounts 2018

First Choice Business Centre, Wiesbaden
EnvironmentSirius continues to seek ways in which it can reduce its environmental impact and actively encourages sustainability initiatives. We carefully manage our impact on the environment and work hard to ensure that space is maximised to its full potential. A fundamental part of our business model involves reconfiguring former industrial buildings and in doing so we extend the life and use of these ageing structures. We endeavour to ensure tenants are better equipped to monitor and manage their energy consumption and have made substantial progress in installing meters across many of our sites thereby facilitating the measurement and improvement of efficiencies in terms of the delivery and consumption of utilities throughout our portfolio of properties.
DiversitySirius has a diverse workforce and in 2014, the German Charter of Diversity was signed, making Sirius an official member. We are committed to equal opportunities and our diversity policy aims to ensure that no employee receives less favourable treatment because of gender, marital status, race, age, sexual preference, religion, belief or disability. As part of the Group’s obligations under the German Charter of Diversity all employees undertake basic training relating to equal rights in the workplace (Allgemeines Gleichstellungsgesetz) and we take steps to ensure this culture transcends our employees, as well as the providers of services to our business parks. As Sirius benefits from a diverse workforce and uses both the English and German language the Company continues to support staff in their language development by making language courses available to all employees.
CommunitySirius has enthusiastic and passionate employees who are keen to support their community by participating in worthwhile events. Sirius focuses attention on community causes in which employees have a personal interest and wish to be actively involved. We believe this ensures a deep commitment to the cause and enables us to see the direct impact of our support. Sirius continues to support many charities across Germany, both regionally and nationally, with a particular focus on the young, health and education.
Sirius Akademie training
32 Sirius Real Estate Limited Annual Report and Accounts 2018Strategic report
Sustainability
Corporate social responsibility

PeopleSirius recognises the importance of professional development for all employees within the Group. The Sirius Akademie internal training programme offers training for key employees across a range of topics including communication, finance and facility management. The Akademie has been running since 2009 and in the year to 31 March 2018 there were 13 training courses held with a total of 163 employees attending. In March 2017 the Leadership Development Initiative was introduced. This is a quarterly development programme for all team leaders providing participants with a specific framework within which to lead and manage their individual teams as the Company expands. One outcome of this development initiative has been the adoption of regular inter-departmental training sessions hosted by our team leaders. These training sessions ensure staff at all levels benefit from function-specific development. In order to encourage and monitor the provision of training, documentation and reporting have been introduced. In the year to 31 March 2018 every employee in the Company received training and a total of 2,018 training reports were completed.
Employee health and wellbeing awareness is actively promoted by Sirius with sports activities supported on a regular basis including team sports events conducted throughout the year. Events that took place during the year under review include running, football and yoga. In addition, working with local businesses, the Company was able to subsidise the membership cost of health and fitness clubs for its staff based in its Berlin headquarters.
Sirius sport and recreation – runningLeadership training
Sirius sport and recreation – football
Gender diversity of the Board and the Company as at 31 March 2018 (%) Age proportion – active employees (%)
Board (including Non-executive Directors)
Senior managers*
All employees
17
25
5446
83
75
60–69 years old
50–59 years old
40–49 years old
35–39 years old
18–34 years old
* A senior manager is an employee of the Company who has responsibility for planning, directing or controlling the activities of the Company, or a strategically significant part of the Company.
Key
Male
Female
47%
23%
18%
9%
3%
33Sirius Real Estate Limited Annual Report and Accounts 2018

The Company is now well placed to begin its next phase of growth in which multiple expansion and financing possibilities may be considered.”
Recycling of capital fuelling future growth Once again the Company has delivered a strong financial performance in the year ended 31 March 2018 despite the reduction in earnings from the disposal of mature assets at the start of the period which were replaced with more opportunistic assets towards the middle and end of the period. The resultant drag on earnings from the timings of the asset recycling was, however, largely offset by exceptional organic growth within the existing portfolio in the year. This growth has fed into the portfolio valuations and subsequently we have also seen significant growth in adjusted net asset value per share (“adjusted NAV”). Total shareholder return (“TSR”), based on adjusted NAV plus dividends paid was 17.0% (31 March 2017: 15.3%) and represents the best ever annual performance for the Company. Importantly, the TSR was 31% driven by dividends paid to shareholders and 69% by capital growth highlighting the ability of the Company to deliver strong income and capital returns whilst continuing to grow the business both organically and acquisitively.
The capex investment programmes continue to be major contributors to this performance through the exceptional returns, from both an income and value perspective, which are being realised from this investment. Excellent progress has been made on the capex investment programme this year and the asset recycling programme is not only substantially improving the quality of the portfolio but it is also increasing the opportunity remaining within the business.
The Company is now well placed to begin its next phase of growth in which multiple expansion and financing possibilities may be considered. The Company’s increased size, highly effective management platform and excellent track record will remain central to executing these plans. Another element which will be important for this growth is the strong shareholder support for the Company as evidenced by two successful capital raisings in the period totalling approximately €65.0 million. This has facilitated some of the acquisition activity within the year as well as providing the Company with firepower for further acquisitions into the new financial year.
Trading performanceSirius has reported a profit before tax in the year ended 31 March 2018 of €89.6 million (31 March 2017: €76.4 million) which is a 17% increase from the prior year. This includes property revaluation gains, net of total capex invested, of €63.5 million (31 March 2017: €49.8 million) as well as the effect of a number of non-recurring items. The adjusted profit before tax(1) for the period was up 4% to €36.7 million (31 March 2017: €35.3 million) whilst funds from operations(2) (“FFO”) also increased by 4% to €38.4 million (31 March 2017: €37.1 million). This is a very strong performance considering that close to €6.3 million of net operating income was lost from disposals in the year whereas acquisitions have only contributed around €2.6 million of net operating income in the period. Total income for the period was €72.1 million (31 March 2017: €68.8 million) which represents higher growth than earnings and is indicative of the higher vacancy and corresponding irrecoverable costs on the assets acquired during the year.
On a per share basis, basic EPS showed a 9.3% increase reflecting the strong valuation gains in the period whilst adjusted EPS, basic EPRA EPS and diluted EPRA EPS were impacted by the asset recycling described above as well as the increase in the number of shares issued from the equity raises completing in the year for which the proceeds take time to invest. As a result, the Board decided to temporarily increase the dividend pay-out ratio from 65% of FFO to 75% of FFO this financial year in order to distribute some of the profits made from disposals, which are not included within FFO, and compensate shareholders for the timing issue between disposals and acquisitions.
(1) Reported profit before tax adjusted for property revaluation, change in fair value of derivative financial instruments, gains and losses on disposals and other adjusting items including expense relating to long-term incentive plans.
(2) Adjusted profit before tax adjusted for depreciation, amortisation of financing fees and current tax receivable/incurred.
34 Sirius Real Estate Limited Annual Report and Accounts 2018Strategic report
Financial review
An active and positive year

Earnings €000 No. of shares
31 March 2018 cents per share
Earnings €000 No. of shares
31 March 2017 cents per share
Change %
Basic EPS 81,272 914,479,339 8.89 66,911 822,957,685 8.13 9.3
Adjusted EPS 36,041 914,479,339 3.94 34,963 822,957,685 4.25 (7.3)
Basic EPRA EPS 27,783 914,479,339 3.04 26,188 822,957,685 3.18 (4.4)
Diluted EPRA EPS 27,783 939,394,339 2.96 26,188 846,807,685 3.09 (4.2)
As at 31 March 2018 (including the Saarbrücken and Düsseldorf II acquisitions) the annualised rental income of the portfolio was €79.5 million (31 March 2017: €71.0 million), an increase in the period of €8.5 million which is described in more detail in the asset management review within this report. The rental income recorded in earnings in the period was only €70.0 million(1) which is below the level at the start of the year. This is reflective of the asset recycling points mentioned above; however, with a starting rent roll for the new year of €79.5 million and significant resources to acquire more assets, we should start to see some of the benefits from the recycling coming through in the next financial year.
(1) Total income of €72.0 million includes €2.0 million of other income.
As mentioned above, the full year’s FFO result of €38.4 million represented an increase of €1.3 million from the €37.1 million recorded last year despite the negative impact of around €3.0 million from asset recycling. Adjusting for this would give rise to around a 12% or €4.3 million FFO increase of approximately 12% which is more representative of the organic improvements seen over the last two years.
Most of the organic growth achieved within the earnings numbers this year has come from the 6.2% like-for-like annualised rental income increase, combined with the 5.1% that was achieved last year. In addition to this there have also been further improvements to service charge recovery, partly from increased occupancy of the existing portfolio, but more significantly from further improvements in our allocation and recovery techniques. These techniques will be rolled out to the acquired sites where we expect to see further improvements over the coming years.
Portfolio valuationThe portfolio, including assets held for sale, was independently valued at €933.7 million by Cushman & Wakefield LLP at 31 March 2018 (31 March 2017: €829.7 million) which converts to a book value of €931.2 million after the provision for tenant incentives. Adjusting for assets held for sale and including at cost the two acquisition assets in Saarbrücken and Düsseldorf II, which completed on 1 April 2018, would increase the portfolio book value to €967.3 million. The increase in book value of the portfolio of €126.1 million in the period is illustrated in the following table.
31 March 2018€000
Total investment properties at book value as at 1 April(1) 823,295
Additions 127,799
Capital expenditure 20,662
Disposals(2) (104,040)
Surplus on revaluation above capex 58,971
Adjustment in respect of lease incentives (487)
Movement in Directors’ discretionary impairment of non-core assets 4,968
Total investment properties at book value as at 31 March(1) 931,168
Additions completed 1 April 2018 (Saarbrücken and Düsseldorf II)(3) 36,149
Adjusted investment properties at book value as at 31 March(1) 967,317
(1) Including assets held for sale.
(2) Including disposals relating to assets held for sale.
(3) Using expected total acquisition costs.
The portfolio valuation movement which relates to newly acquired assets (31 March 2018 valuation compared to total acquisition costs) was a negative €20k whereas book valuation increases on assets held for the entire period amounted to €84.4 million or 11.6% (31 March 2017: 7.7%). The valuation of the eleven sites that were acquired in the period was €127.5 million, which was 7.6% higher than their purchase price albeit slightly lower than the total acquisition costs as mentioned above. This confirms that the Company continues to purchase assets well.
The valuation increases in the existing portfolio can be attributed to the rental income increases we have discussed as well as 37bps of gross yield compression. This further reinforces the high returns from both an income and valuation perspective that are being achieved from the investment within the capex investment programme.
35Sirius Real Estate Limited Annual Report and Accounts 2018

Portfolio valuation continuedThe entire portfolio as at 31 March 2018 comprised 52 assets with a book value of €931.2 million and can be reconciled to the Cushman & Wakefield market valuation as follows:
31 March 2018€m
31 March 2017€m
Investment properties at market value 933.7 829.7
Uplift in respect of assets held for sale 1.0 1.6
Adjustment in respect of lease incentives (3.5) (3.0)
Directors’ impairment of non-core asset valuations — (5.0)
Balance as at period end 931.2 823.3
Focusing on the core portfolio, the 31 March 2018 book value of €911.9 million represents an average gross yield of 8.1% (31 March 2017: 8.3%), a net yield of 7.4% (31 March 2017: 7.4%(1)) and an EPRA net yield (including purchaser costs) of 6.8% (31 March 2017: 6.8%(1)). The average capital value per sqm of the core portfolio is €645 (31 March 2017: €620(1)) which remains well below replacement cost.
(1) Adjusted for disposals.
Even though yield compression has been seen in many of the Group’s recent revaluations, the gross yields on the core portfolio of 8.1% could still be regarded as relatively high. In addition to this, the capex investment programme is predominantly focused on the vacant space of the value-add portfolio and transforming this space from sub-optimal, low-quality vacancy into more desirable, high-quality workspace which the Company’s lettings and marketing platform has proven to be very effective at filling with new tenants.
Unlike yield movements which are dependent on the wider market, the value creation from the capex investment programme is more within the Company’s control and the track record indicates that this can be realised regardless of market conditions. As such, we are hopeful that the recent positive trends we have seen within the portfolio valuations can continue going forward independent of movements in yield.
The valuation increases are obviously the main driver of NAV growth but the fact that there is a policy to pay out only 65% (75% this year) of FFO as dividend also has an impact. The adjusted NAV(1) per share increased to 65.71c at 31 March 2018, an increase of 11.7% from 58.82c as at 31 March 2017. As mentioned above, when this is combined with the 3.16c from the two dividends that were paid out this year, the total shareholder return of adjusted NAV growth plus dividends paid was 17.0% (31 March 2017: 15.3%). The movement in adjusted NAV is explained in the following table:
(1) Excludes the provisions for deferred tax and derivative financial instruments.
The EPRA net asset value (“EPRA NAV”) per share, which excludes the provisions for deferred tax and derivative financial instruments, but includes the potential impact of shares issued in relation to the Company’s long-term incentive programmes, was 64.18c (31 March 2017: 57.84c).
Adj
uste
d N
AV
per
sha
re (c
ps)
Equity raise, share awards
and non-recurring items
31 March2017
58.82 65.71 64.18
(0.51)
(2.71)(1.53)
3.71 6.40
Recurring profitbefore tax
Surplus onrevaluation
Scrip and cashdividend paid
Adjusted NAV per share31 March
2018
EPRAadjustments
EPRA net assets per share31 March
2018
0
10
20
30
40
50
60
70
80
36 Sirius Real Estate Limited Annual Report and Accounts 2018Strategic report
Financial review continued

FinancingThe Company continues to access long-term debt at attractive interest rates as well as having the trust and relationships with banks to finance opportunistic assets with very low occupancy rates. This was again evident in the three new facilities that were secured in the year to 31 March 2018. One of the differences in the deals to finance opportunistic assets is that alongside the acquisition facilities that the banks grant, capex facilities have been agreed which Sirius can draw down in the first few years in order to fund the capex investment programme on these assets. Given the higher returns that are made from this programme and the low interest rates that these facilities command, this is by far the most accretive way to fund capex. The details of the three new facilities are outlined below:
» In November 2017, the Group agreed to a seven year facility agreement with SEB AG for €22.9 million which was drawn down in two tranches and hedged with interest rate swaps locking in an initial all-in rate of 2.58%. Additionally a capex facility of €7.0 million is included within this loan which can be drawn down to fund capex within the first five years. The capex facility will be on a floating interest rate. The loan and swaps both terminate on 30 October 2024. This facility was secured against a portfolio of three assets with a blended occupancy of 26.7% and initial interest cover of only 1.04x. As such a higher margin was necessary; however, this steps down by 10bps when the occupancy of the portfolio exceeds 70%. Amortisation of 2.0% per annum of the acquisition facility was agreed with the remainder due in one instalment on the final maturity date. Given the low interest cover from the assets that the loan is secured against, the bank requires an ultimate parent company guarantee on this loan whilst occupancy is below a certain percentage.
» On 26 March 2018, the Group agreed to another seven year facility agreement with SEB AG for a €38.0 million acquisition facility and an €8.0 million capex facility. The loan facility is currently incurring a floating interest rate of 1.58% over six month EURIBOR (not less than 0%) but the Company is
required to enter into hedging arrangements on this facility by the end of June 2018. The loan terminates on 25 March 2025 and amortisation is 2% per annum on the acquisition facility with the remainder due in one instalment on the final maturity date. The higher exposure that SEB now has with Sirius meant that the bank required an ultimate parent guarantee for this facility along with some Group-level financial covenants.
» In March 2018, the Group agreed to a seven year facility agreement with Saarbrücken Sparkasse for €18.0 million. The loan is charged with an all-in fixed interest rate of 1.53% for the full term of the loan which expires on 28 February 2025. Amortisation is applied at 4.0% per annum with the remainder due in one instalment on the final maturity date. The facility is secured over the Saarbrücken asset which completed on 1 April 2018 and was acquired for a purchase price of €26.1 million.
The Group’s total cost of borrowings has remained at 2.0% (31 March 2017: 2.0%) and the weighted average debt expiry is 5.2 years (31 March 2017: 5.8 years). Total debt at the period end was €373.1 million (31 March 2017: €348.6 million) up €24.5 million from last year and reflective of the €79.0 million of new borrowings completed in the year, as described above, less €46.7 million of repayments relating to the disposals of the Düsseldorf and Munich Rupert Mayer Strasse assets and scheduled amortisation of €7.8 million.
The Group’s gross loan to value (“gross LTV”) ratio of 40.8% (31 March 2017: 42.3%) includes the new borrowings but not the two assets that completed on 1 April 2018 and were paid for in March 2018. When including the properties that completed immediately after year end and assets held for sale, gross LTV of the portfolio reduces to 38.6%, well within the Company target of 40%. Net LTV(1) reduced to 31.9% (31 March 2017: 38.0%) on 1 April 2018 after the Saarbrücken and Düsseldorf II asset acquisitions were completed.
(1) Net LTV is the ratio of principal value of gross debt less cash, excluding that which is restricted, to the aggregate value of investment property.
37Sirius Real Estate Limited Annual Report and Accounts 2018

DividendWhilst it remains the Company’s normal policy to pay dividends based on 65% of the Group’s FFO, the Board communicated in the Annual Report for the year ended 31 March 2017 the possibility of temporarily increasing the dividend pay-out ratio in order to maintain positive dividend growth whilst the proceeds from disposals of high-income producing mature assets are reinvested. As illustrated in this report, the Group’s FFO this year has been negatively impacted by around €3.0 million by the net impact of asset recycling; however, as the disposal proceeds are now fully reinvested, the new financial year is expected to see a commensurate benefit in earnings. Considering this as well as the premiums to book value at which disposals have been made, the Board has decided to maintain the dividend pay-out ratio at 75% as reported in the Group’s 30 September 2017 interim accounts. As the proceeds from the latest equity raise are invested and acquisition sites become integrated into our operating platform we expect the pay-out ratio to gradually move back towards our stated policy of 65%.
In accordance with this, the Board has declared a final dividend of 1.60c per share for the six month period ended 31 March 2018, which is an increase of 4.6% on the 1.53c dividend relating to the same period last year. The total dividend for the year is 3.16c, an increase of 8.2% on the 2.92c total dividend for the year ended 31 March 2017.
It is expected that the ex-dividend date will be on or around 11 July 2018 for shareholders on the South African register and on or around 12 July 2018 for shareholders on the UK register. It is further expected that the record date will be on or around 13 July 2018 for shareholders on the South African and UK registers and the dividend will be paid on or around 17 August 2018 for shareholders on both registers.
OutlookSirius has completed another active and positive year with high volumes of transactional activity including successfully reinvesting the proceeds from disposals of non-core and mature assets and equity raises into some excellent acquisitions with much greater opportunity in future years. This activity will continue into the new financial year with further disposals of non-core sites and the proceeds from the latest €40.0 million equity raise providing the Company with the funds, along with some further bank financing, to acquire another €100.0 million of assets. The pipeline for this investment is looking healthy and we look forward to updating shareholders on this in due course.
The Company’s operating platform is continuing to produce exceptional results with our best ever year for organic rental income growth and total shareholder return being recorded along with further significant improvements in service charge cost recovery. The capex investment programmes continue to deliver outstanding results and the new acquisitions have added valuable sub-optimal and vacant space to the programmes. All of this means that the Company is achieving the exceptionally high returns it desires at the asset level and the potential for this to continue into the future has been greatly enhanced by the asset recycling programme.
The focus of the Company remains to deliver attractive risk-adjusted returns by growing recurring income and capital values through intensive asset management and we look forward to updating shareholders on further progress over the coming year.
Alistair MarksChief Financial Officer1 June 2018
38 Sirius Real Estate Limited Annual Report and Accounts 2018Strategic report
Financial review continued

Sirius has policies and procedures in place for the timely identification, assessment and prioritisation of the Group’s material risks and uncertainties. This section describes how these risks are identified, managed and mitigated appropriately in order to deliver the Group’s strategic objectives.
Risk management frameworkThe Group has an established risk management approach to identify, monitor and mitigate risks. The Sirius Board has overall responsibility for risk management and is of the view that understanding and mitigating key risks is crucial to achieving the Group’s strategic objectives and long-term success. As such, a risk-based approach is taken on all major decision making and strategic initiatives.
Risk management is an integral part of the Group’s business and risks are considered at every level of decision making and across all business activities. A risk management framework is in place to ensure that risks are identified and mitigated in order to significantly increase the chances of being able to achieve the Group’s objectives of creating shareholder value whilst also preserving it. A detailed and extensive risk register is maintained that documents risks and related mitigating controls and has been created on the following basis.
Firstly, the Board categorises risk into five primary areas: 1. Corporate strategy – the risk the Group does not
meet its objectives and becomes unattractive to shareholders and investors.
2. Investment activity – the risk of being prevented from executing investments or that returns are not in line with expectations.
3. Compliance – the risk of non-compliance with laws, regulations and accepted practices.
4. Customers and service providers – the risk associated with customers and suppliers not being able to meet their contractual obligations.
5. Financial – the risk associated with the valuation, management and control of the Group’s assets and liabilities.
Following categorisation, risks are evaluated and catalogued according to their likelihood of occurring and potential impact on the business.
Finally, the risk register documents the controls in place that exist to mitigate the particular risk and sets out the frequency with which the risks are reviewed and by whom.
The Audit Committee takes responsibility for the review of the risk management methodology and the effectiveness of internal controls and the Board reviews the risk register on an annual basis.
This process includes the following:
» reviewing regular risk reporting prepared by the Senior Management Team;
» assessing the effectiveness of control design and implementation; and
» overseeing and advising the Board on current risk exposures and future risk strategy.
39Sirius Real Estate Limited Annual Report and Accounts 2018
Principal risks and uncertainties
Managing our risks

Risk management framework diagram Board of Directors » Overall responsibility for risk management.
» Overall responsibility for the Group’s system of internal control and review of its effectiveness.
Audit Committee » Delegated responsibility from the Board to
oversee risk management and internal controls.
» Reviews the effectiveness of the Group’s internal control and risk management processes.
» Monitors the independence and expertise of the external auditors.
Audit Committee and Executive Directors » Perform key business activity reviews, identify
control deficiencies and redesign processes.
» Monitor the role and effectiveness of internal compliance.
» Communicate risk management information and key initiatives across the Group.
Senior Management Team » Defines risk management responsibilities
at operational and key initiative level.
» Ensures risk is considered in all business decision making.
» Continuously identifies risks, provides assurance and self-assesses.
Board of
Directors
Audit Committee
Executive Directors
Compliance
Senior Management Team
MITIGATEMONITOR
IDENTIFY
ASSESSREPORT
Risk management process diagram
40 Sirius Real Estate Limited Annual Report and Accounts 2018Strategic report
Principal risks and uncertainties continued

Principal risks summary
Like
liho
od
ImpactLow
Low
Medium
Med
ium
High
Hig
h
1 2
3 5
6
7
84
9
Risk category Principal risk(s)
1 Financing » Availability and pricing of debt
» Compliance with facility covenants
2 Valuation » Property inherently difficult to value
» Susceptibility of property market to change in value
3 Market » Reliance on Germany
» Reliance on SME market
4 Acquisitive growth » Failure to acquire suitable properties with desired returns
5 Organic growth » Failure to deliver capex investment programme
» Failure to achieve targeted returns from investment
6 Customer » Decline in demand for space
» Significant tenant move-outs or insolvencies
» Exposure to tenants’ inability to meet rental and other lease commitments
7 Regulatory and tax » Non-compliance with tax or regulatory obligations
8 People » Inability to recruit and retain people with the appropriate skillset to deliver the Group strategy
9 Systems and data » System failures and loss of data
» Security breaches
» Data protection
Current assessment of principal business risks post mitigation
Risk change key: The risk change key applies to pages 42 to 46.
Increased risk
Decreased risk
No change
41Sirius Real Estate Limited Annual Report and Accounts 2018

FINANCING
» The Group has established a number of strong banking relationships with lenders who understand and value the Sirius model.
» The Sirius track record and methodology, especially its performance during the last downturn, is also valued highly by the lending market.
» Bank facilities are only entered into where attractive rates and long facility terms can be secured.
» It is Group policy to mitigate interest rate risk by fixing or capping interest rates on facilities.
» Loan facilities incorporate covenant headroom, cure provisions and sufficient flexibility to facilitate asset management initiatives including asset substitution.
» Bank reporting is prepared and reviewed regularly.
» The Group policy is to maintain a gross LTV ratio of 40% or below.
» The Group holds eight assets on an unencumbered basis with a book value of €56.9 million at 31 March 2018 which are more liquid to sell or could be injected into bank security pools if necessary.
Mitigation
» Completed three loan facilities with new long-term debt of €78.9 million at attractive low interest rates.
» Two of the new facilities incorporate Sirius Group guarantees and one of these also has Group-level covenants. The covenants have substantial headroom.
» 90% of the total borrowings of €373.1 million have been fixed with a fixed interest rate or swap. The remaining 10% is subject to an obligation to fix by 30 June 2018.
» The weighted average cost of debt remained stable at 2.0%.
» Weighted average debt expiry of 5.2 years down from 5.8 years at 31 March 2017.
» Group gross LTV ratio of 40.8%. When prepayments for assets that completed on 1 April 2018, for which debt was drawn down at 31 March 2018, and assets held for sale are taken into account, the Group gross LTV is 38.6%.
Developments in the year
1
» Reduced availability and increased cost of bank financing.
» A breach of banking facility covenants.
Principal risks
» Increase in cost of borrowing and reduction in Group profits.
» Inability to refinance when facilities expire.
» Requirement to dispose of assets at significantly discounted values.
» Limited ability to acquire new assets when yields are higher.
» Acceleration of the Group’s obligations to repay borrowings.
» Lender enforces security over the Group’s assets and restricts cash flow to the Group (e.g. cash traps).
Potential impact
VALUATION2
» Property assets are inherently difficult to value as there is no liquid market or standard pricing mechanism. As a result, valuations are subject to substantial uncertainty.
» Asset values decline as a result of macroeconomic and other external factors, such as the availability of debt and political change.
Principal risks
» Reported NAVs may not accurately reflect the value of the portfolio.
» Reduced liquidity and impact on returns.
» Detrimental to NAV growth.
» Potential non-compliance with loan facility covenants.
Potential impact
» Valuations are conducted half-yearly by an expert, independent, reputable major corporation in the property sector.
» Valuations are audited and involve the use of valuation experts.
» The German property market and transactions are continually monitored by the Group and independent research has been developed to analyse transactions within the Group’s asset class in Germany.
» The Group operates a value-add business model which involves significant investment into its assets with the intention of enhancing income and property value even in buildings with vacant or sub-optimal space.
» All acquisition, investment and disposal decisions are made strategically incorporating market analysis and conditions.
Mitigation
» Like-for-like valuations have increased by €84.4 million or 11.6% for the year on the back of the Group’s investment and asset management initiatives.
» Valuations of sites acquired in the year increased by €9.1 million (excluding acquisition costs) or 7.6% from purchase price, demonstrating the ability to buy at discounts to market price.
» Average gross yield of the portfolio of 8.1% remains high compared to transactions that have been seen by Sirius in the market for similar assets.
» During the year two properties totalling €10.9 million were acquired without financing, which may provide flexibility in the event of any market downturns.
Developments in the year
42 Sirius Real Estate Limited Annual Report and Accounts 2018Strategic report
Principal risks and uncertainties continued
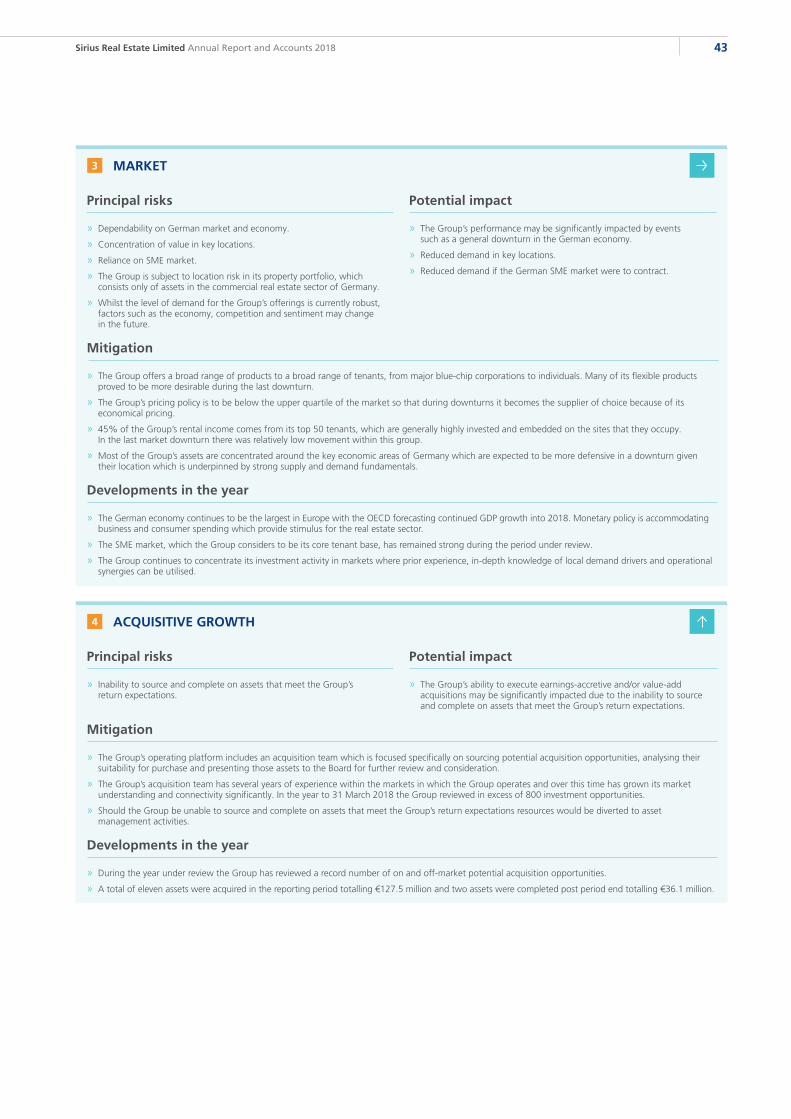
ACQUISITIVE GROWTH4
» The Group’s ability to execute earnings-accretive and/or value-add acquisitions may be significantly impacted due to the inability to source and complete on assets that meet the Group’s return expectations.
Potential impact
» During the year under review the Group has reviewed a record number of on and off-market potential acquisition opportunities.
» A total of eleven assets were acquired in the reporting period totalling €127.5 million and two assets were completed post period end totalling €36.1 million.
Developments in the year
» Inability to source and complete on assets that meet the Group’s return expectations.
Principal risks
» The Group’s operating platform includes an acquisition team which is focused specifically on sourcing potential acquisition opportunities, analysing their suitability for purchase and presenting those assets to the Board for further review and consideration.
» The Group’s acquisition team has several years of experience within the markets in which the Group operates and over this time has grown its market understanding and connectivity significantly. In the year to 31 March 2018 the Group reviewed in excess of 800 investment opportunities.
» Should the Group be unable to source and complete on assets that meet the Group’s return expectations resources would be diverted to asset management activities.
Mitigation
MARKET3
» The Group’s performance may be significantly impacted by events such as a general downturn in the German economy.
» Reduced demand in key locations.
» Reduced demand if the German SME market were to contract.
Potential impact
» The Group offers a broad range of products to a broad range of tenants, from major blue-chip corporations to individuals. Many of its flexible products proved to be more desirable during the last downturn.
» The Group’s pricing policy is to be below the upper quartile of the market so that during downturns it becomes the supplier of choice because of its economical pricing.
» 45% of the Group’s rental income comes from its top 50 tenants, which are generally highly invested and embedded on the sites that they occupy. In the last market downturn there was relatively low movement within this group.
» Most of the Group’s assets are concentrated around the key economic areas of Germany which are expected to be more defensive in a downturn given their location which is underpinned by strong supply and demand fundamentals.
Mitigation
» The German economy continues to be the largest in Europe with the OECD forecasting continued GDP growth into 2018. Monetary policy is accommodating business and consumer spending which provide stimulus for the real estate sector.
» The SME market, which the Group considers to be its core tenant base, has remained strong during the period under review.
» The Group continues to concentrate its investment activity in markets where prior experience, in-depth knowledge of local demand drivers and operational synergies can be utilised.
Developments in the year
» Dependability on German market and economy.
» Concentration of value in key locations.
» Reliance on SME market.
» The Group is subject to location risk in its property portfolio, which consists only of assets in the commercial real estate sector of Germany.
» Whilst the level of demand for the Group’s offerings is currently robust, factors such as the economy, competition and sentiment may change in the future.
Principal risks
43Sirius Real Estate Limited Annual Report and Accounts 2018

ORGANIC GROWTH5
» Income and valuation improvements do not meet expectations.
» The Group’s detailed site business plans and expected returns are not met.
» Assets are more difficult to sell and are valued accordingly.
Potential impact
» As at 31 March 2018 the original capex investment programme that commenced in 2014 is substantially complete with a total of 186,621sqm of space completely refurbished and the remaining 17,400sqm either in the process of being refurbished or awaiting permissions to proceed. A total of €18.8 million has been invested into the completed space and, at 82% occupancy, this space is generating €10.9 million of annualised rental income representing an income return on investment of 58%.
» An acquisitions capex investment programme has been developed over the last two years relating to assets acquired since April 2016. The acquisitions capex investment programme includes 121,065sqm of sub-optimal space suitable for investment within 19 assets. The Company expects to invest a total of €26.1 million into this space to generate €8.2 million of incremental annualised rental income on a blended occupancy of 76%.
» For more details on our organic growth programme see the case studies within this report.
Developments in the year
» Failure to invest into vacant space.
» Failure to realise the targeted returns on investment from the capex investment programme.
Principal risks
» Extensive analysis is performed to assess demand and costs before an investment decision is made to ensure each project meets local demands and returns are realistic.
» Sirius has ten years of experience and data on developing its vacancy and the take-up of its and its competitors’ products in the markets that it operates, so assessments and projections are based on detailed information and knowledge.
» The Group is continuing to invest in its internal operating platform, which ensures the delivery of all aspects of projects including development, marketing, lettings, renewals, service charge recovery and collections.
» Fortnightly conference calls are held with all relevant people discussing progress and expectations on all projects within the capex investment programme.
Mitigation
CUSTOMER6
» Reduced tenant demand for the Group’s offerings and lower take-up of vacant space.
» Substantial amount of existing tenants or tenants becoming insolvent.
» Tenants failing to meet their lease obligations.
Principal risks
» Inability to fill up vacant space and not meet profit growth targets/expectations.
» Occupancy and profit issues when a number of major anchor tenants vacate in a short time period.
» Tenant defaults result in loss of income and an increase in void costs and bad debt.
» Downward pressure on earnings and NAV.
Potential impact
» The Group has a large and active internal marketing and lettings team working within the German market and is not reliant on third parties with potentially competing clients to sign new and renew existing tenants. The Group’s online presence is such that during the year more than 80% of the average of 1,200 enquiries received each month come from the internet and the dedicated call centre and on site teams convert on average 14% of all leads into new lettings.
» On site management is focused on tenant needs and ensuring that their experience on a Sirius business park is as good as possible, which significantly mitigates the risk of tenants leaving.
» Continual engagement with tenants also provides an early indication of tenants that will leave so that work on replacement can start much earlier.
» The close relationships that have been developed with tenants help us to understand their businesses and meet their changing space requirements.
» Due to the industrial nature of most of the Group’s major tenants, they are generally highly invested on site and have been there for many years. The move-out rate of these tenants is low.
» All prospective tenants go through a robust credit check to provide comfort over their suitability and financial state.
» All lease agreements require tenants to provide deposits and/or bank guarantees.
» Service charge costs are subject to prepayments which are adjusted each year to reflect future expectations of actual costs.
Mitigation
» Over 70% of rental income that was up for renewal in the year was renewed.
» The Group generated 14,805 letting enquiries, of which 14% were converted into new deals, which let up 160,133sqm of space with contracted annualised rental income of €11.5 million.
» Like-for-like occupancy, which adjusts for the impact of acquisitions and disposals, increased from 80% to 83% in the period.
» As at 31 March 2018, 45% of rental income was contracted to the top 50 tenants.
» As at 31 March 2018, €8.3 million was held in escrow accounts for tenant deposits.
Developments in the year
44 Sirius Real Estate Limited Annual Report and Accounts 2018Strategic report
Principal risks and uncertainties continued

REGULATORY AND TAX7
» Significant extra tax payable in Germany, the UK and the Netherlands.
» Adverse effect on capital values of the Group’s property portfolio.
» Financial penalties and reputational damage.
» Forfeiture of tax losses resulting in significant impact on the tax charge.
Potential impact
» Conditions for the tax treatment of all Group entities are continually monitored. Close collaboration with advisers and relevant tax jurisdiction authorities ensures we are aware of emerging issues and keep up to date with ongoing developments.
» Other regulatory matters are considered by the Board and addressed within the Company risk register, which gets updated at least annually.
Mitigation
» No changes to accounting standards, tax law or accepted practice have been identified as material to the Group’s performance and results in the period.
» The Group continues to have tax losses that are potentially available for offset against future profits of its subsidiaries. As at 31 March 2018 tax losses amounted to €261.8 million.
» The Company continues to be provided with external specialist tax advice on all matters relating to structuring, investment activity and financing.
Developments in the year
» Change of tax laws or practices as a result of base erosion and profit shifting initiatives (“BEPS”).
» Change of tax rules relating to controlled foreign companies.
» Forfeiture of tax losses due to change of ownership.
» Change of tax rates or accounting practices applicable to the Company.
» The non-compliance with laws, regulations and accepted practices.
Principal risks
PEOPLE8
» The Company maintains an organisation structure with clear responsibilities and reporting lines. Formal appraisals are performed annually for performance, goal setting and development purposes.
» The remuneration structure for staff is designed to be competitive and assist in attracting and retaining high calibre staff that are required to deliver the strategic objectives of the Company.
» Incentives align individual and departmental targets to Company strategy and ensure that Executive Directors, the Senior Management Team and staff operate in the best interests of shareholders and are incentivised to remain in office.
» The Executive Directors and the Senior Management Team have significant shareholdings in the Company.
Mitigation
» Neil Sachdev is no longer Non-executive Chairman. James Peggie, Senior Independent Director, has taken on the additional responsibilities of the Chairman until such time a replacement is appointed. Jill May was appointed as a further Non-executive Director.
» For details relating to the remuneration of Directors, including the shareholdings of the Executive Directors and the Senior Management Team, please go to the Directors’ remuneration report.
Developments in the year
» Inability to recruit and retain suitable staff to implement the business strategy.
» Too much reliance on key personnel.
» As the Company is internally managed it is reliant on the performance and retention of key personnel. The departure of any of these individuals without adequate replacement may have a material adverse effect on the Company’s business prospects and results of operations.
Principal risks
» Reduced ability to implement the business strategy.
» Insufficient resources in place to support the Company’s growth ambitions.
» Loss of knowledge and expertise from exiting key personnel.
Potential impact
45Sirius Real Estate Limited Annual Report and Accounts 2018

SYSTEMS AND DATA9
» Impeded access to core systems for internal and external customers.
» Loss of business critical data.
» Penalties and private litigation.
» Reputational damage.
Potential impact
» The Group has a detailed IT strategy, which is under continual review and is focused on a balance between efficiency and control.
» An IT audit, designed to identify control weaknesses, is performed on an annual basis as part of the Group annual audit process.
» A comprehensive disaster recovery plan is in place to ensure minimal information and time are lost should an entire site go down.
» Of the three main systems used by the Company, two are hosted by third party experts and one is hosted internally. All three systems have service-level agreements in place for ongoing maintenance, upgrades, back-up and improvements.
» Payment transactions are automated and subject to an internal authority matrix, which is reviewed annually, to ensure appropriate controls, including segregation of duty, are enforced at all times.
Mitigation
» Upgrades carried out to improve on site internet bandwidth and reliability.
» Storage server and domain upgrades completed to incorporate latest available security settings and improve performance.
» Customer relationship and business intelligence systems upgraded to deliver increased functionality and automation.
Developments in the year
» System interruption or breakdown.
» Data protection breach.
» Financial loss due to security breach or fraudulent activity.
Principal risks
Viability statement In accordance with provision C.2.2 of the 2016 revision of the UK Corporate Governance Code (the “Code”) and the South African King IV Code, the Directors have assessed the prospects of the Group over a period longer than the twelve months required by the “going concern” provision. The Board has conducted this review taking into account the Group’s long-term strategy, principal risks, current position and future plans over a three year period.
A period of three years was chosen on the basis of:
» three years being the period for which detailed asset-level business plans are prepared;
» three years being the period considered optimal to balance planning requirements and the ability to make accurate estimations; and
» three years being indicative of the Group’s short-term redevelopment and asset management initiative cycle.
Particular attention is given to existing and planned financial commitments, financing arrangements including compliance, and broader macroeconomic considerations.
The Group’s three year plan is underpinned by a detailed financial model that consolidates the business plans of the Group’s property assets. The key assumptions underpinning the plan are:
» growth in rental income, principally from acquisitions and supported by delivery of the organic growth programme;
» a gradual decrease in irrecoverable service charges as a result of an increase in occupancy rates; and
» the broadly fixed nature of overheads which consist primarily of central management costs.
The financial model is stress tested to validate its resistance to changes relating to property valuations and associated yields, rental income rates, occupancy levels, overheads, committed capital expenditures, working capital requirements, and the ability to finance forecasted transactions and refinance maturing debt. The financial covenants to which the Group is subject are included in the financial model to ensure the conditions which would result in a breach of covenant can be anticipated.
Based on the results of their review, the Directors have a reasonable expectation that the Group will be able to continue in operation and meet its liabilities as they fall due over the three year period of its assessment.
46 Sirius Real Estate Limited Annual Report and Accounts 2018Strategic report
Principal risks and uncertainties continued

48 Board of Directors
50 Corporate governance
54 Audit Committee report
58 Nomination Committee report
60 Directors’ remuneration report
70 Social & Ethics Committee
72 Directors’ report
Governance
Responsible for good governance

ANDREW COOMBS (53)Chief Executive Officer
Appointed to the BoardAndrew Coombs joined the Sirius Real Estate Board in 2014.
ExperienceAndrew Coombs joined the Sirius Facilities Group in January 2010. Prior to joining Sirius, Andrew worked for the Regus Group as UK sales director and before that as director and general manager for MWB Business Exchange Plc. Prior to working in the property sector Andrew held a number of general management roles. Andrew’s responsibilities to Sirius Real Estate include formulating and agreeing the strategy for delivering shareholder value. He is also responsible for running Sirius Facilities GmbH, together with the group of other operating companies owned by Sirius in Germany, and it is through these operating companies that the strategy is ultimately executed.
ALISTAIR MARKS (49)Chief Financial Officer
Appointed to the BoardAlistair Marks joined the Sirius Real Estate Board in 2014.
ExperienceAlistair Marks joined the then external asset manager of Sirius in 2007 from MWB Business Exchange Plc just before the IPO on AIM and has remained with the Group following the management internalisation in January 2012. Prior to MWB Business Exchange, Alistair held financial roles with BBA Group Plc and Pfizer Ltd and qualified as a Chartered Accountant with BDO in Australia. Alistair is responsible for the Company’s banking relationships including restructuring, sourcing and negotiating all terms within the Group’s debt facilities. He is also responsible for the Group’s operations as well as overseeing the major capex programme and substantial improvement in service charge recovery over the last few years. Alistair is responsible for financial management and control across the Group.
JUSTIN ATKINSON (57)Independent Non-executive Director
Appointed to the BoardJustin Atkinson joined the Sirius Real Estate Board in 2017.
ExperienceJustin Atkinson was the chief executive of Keller Group plc from April 2004 to May 2015. Previously, Justin had been Keller’s group finance director and its chief operating officer. Justin trained and qualified as an accountant with Deloitte Haskins & Sells, now part of PwC, and spent the early part of his career with Thomson Reuters, before joining Keller Group in 1990. Justin is senior independent director of Kier Group plc, the senior independent director and chair of the audit committee of Forterra plc, an independent non-executive director and chair of the audit committee of James Fisher plc and a member of the audit committee of the National Trust.
Chairman of Committee
S A R SN
A Audit Committee Social & Ethics CommitteeSRemuneration CommitteeR Nomination CommitteeN
Committee membership
48 Sirius Real Estate Limited Annual Report and Accounts 2018Governance
Board of Directors
Introduction to the BoardThe Company has an experienced Board of two Executive Directors and four Non-executive Directors.

JAMES PEGGIE (47)Senior Independent Director and Acting Chairman
Appointed to the BoardJames Peggie joined the Sirius Real Estate Board in 2012.
ExperienceJames Peggie is a director of the Principle Capital group, a private investment business he co-founded in 2004. He is a qualified solicitor and previously was head of legal and corporate affairs at the Active Value group. Before that he worked in the corporate finance division of an international law firm. James graduated from the University of Oxford in 1992 and in 1994 from The College of Law. James has a wealth of experience as a director of various publicly listed and private companies, including Liberty plc from 2006 to 2010.
JILL MAY (57)Independent Non-executive Director
Appointed to the BoardJill May joined the Sirius Real Estate Board in 2017.
ExperienceJill May has 24 years’ City experience in investment banking and 13 years’ experience in mergers and acquisitions and more recently has worked as a managing director focused on strategy and organisational change at UBS. She has a broad knowledge of investment banking, asset management and private banking across EMEA. She is a non-executive director of ICAEW and a member of the Council of Durham University. She is a non-executive director of JPMorgan Claverhouse Investment Trust Plc and of Ruffer Investment Company.
WESSEL HAMMAN (45)Non-executive Director
Appointed to the BoardWessel Hamman joined the Sirius Real Estate Board in 2011.
ExperienceWessel Hamman is the chief executive of Clearance Capital Limited, a European Real Estate investment management firm he co-founded in 2008. Wessel qualified as a Chartered Accountant at KPMG in South Africa in 1997 and spent eleven years in the investment banking industry. Wessel serves as a non-executive director of various listed European real estate companies and funds including Capital & Regional plc and European Real Estate Investment Trust Limited.
R NA A R SNNA R S
49Sirius Real Estate Limited Annual Report and Accounts 2018

Compliance with the UK Corporate Governance Code 2016 (the “Code”)Sirius is a property company listed on the Main Market and premium segment of the London Stock Exchange and the Main Board of the Johannesburg Stock Exchange. It is a leading operator of branded business parks providing conventional space and flexible workspace in Germany. The Company was incorporated in Guernsey, with registered number 46442, in 2007. The Board has resolved that the disclosures to be made in the Annual Report regarding the operation of the Board and its sub-committees should comply with the requirements of the Companies (Guernsey) Law, 2008, the UK Corporate Governance Code and best practice generally.
Further to the dual primary listing of the Company in South Africa on 27 November 2017, the JSE accepted that Sirius will primarily comply with the Code as issued by the Financial Reporting Council in April 2016 (www.frc.org.uk) and will comply with all those provisions of the King IV Report on Governance for South Africa 2016 that are not included in the Code. It should be noted that during the reporting year ended 31 March 2018 and up to the date of this document the Company has complied with all of the Code principles, but has not complied with the following Code provisions:
Code B.2.3: Non-executive Directors should be appointed for a specified term.Explanation: Directors are appointed for a term which expires when either the Director (i) is not reappointed following retirement, (ii) is removed or vacates office for re-election, or (iii) terminates their appointment on three months’ notice. It should be noted that all Directors are subject to re-election every three years; however, they have opted to offer themselves up for re-election annually.
Statement of complianceThe Board is committed to at least the highest standards of corporate governance appropriate for a company of its size and has adopted processes and policies to seek to ensure a sound framework for the control and management of the business. The Board complies with the requirements of the UK Corporate Governance Code published in June 2016 by the Financial Reporting Council (“UK Corporate Governance Code”) as it relates to “smaller companies” (companies which are outside the FTSE 350 throughout the year immediately prior to the reporting year). The Company is not subject to the Code of Corporate Governance in Guernsey. The Company will continue to monitor its compliance with the King IV Code and the UK Corporate Governance Code and in accordance with the Listing Rules of the London Stock Exchange (“LSE”) and the Listings Requirements of the Johannesburg Stock Exchange (“JSE”).
The Company has adopted policies and procedures to comply with the Market Abuse Regulation and has a policy in place that all announcements need to be approved by at least one Director and the Company Secretary. The Company has adopted a share dealing code for the Board and will seek to ensure compliance by the Board and senior management and other third party service providers with the terms of the share dealing code.
The terms of reference of the Audit, Nomination and Remuneration Committees were widened and terms of reference were created for the new Social & Ethics Committee, following the Company’s move to a dual primary listing on the JSE in November 2017, to comply with the principles contained in both the King IV Code and the UK Corporate Governance Code, where applicable. The terms of reference of the Board and the sub-committees are available on request from the Company Secretary and are published on the Company’s website at www.sirius-real-estate.com.
Engagement with shareholdersThe Board is committed to providing shareholders with timely announcements of significant events or transactions affecting the Company, including its financial performance and any changes to strategy as well as material investment commitments and disposals. As part of this, the Company’s brokers provide regular market feedback to the Board and senior management.
In addition, the Chairman (when appointed) and Senior Independent Director are available to shareholders to discuss governance, strategy or any concerns they may have.
The Chief Executive Officer and the Chief Financial Officer are responsible for the Company’s interaction with existing shareholders, potential new shareholders and analysts. To ensure its financial and operational performance and strategic objectives are properly communicated, the Company operates a dedicated investor relations programme. This includes formal events along with other meetings outside the financial reporting calendar. In April 2017, the Chief Executive Officer and Chief Financial Officer, together with other members of the Senior Management Team, hosted the Company’s first investor day. This focused on risk management, value creation and origination of new investments.
50 Sirius Real Estate Limited Annual Report and Accounts 2018Governance
Corporate governance

BOARD AND BOARD COMMITTEE MEETINGS ATTENDANCE
Principal risks and uncertaintiesEach Director is fully aware of the risks inherent in the Company’s business and understands the importance of identifying, evaluating and monitoring these risks. The Board has adopted procedures and controls that enable it to carry out a robust assessment of the risks facing the Company, manage these risks within acceptable limits and meet its legal and regulatory obligations.
The Board thoroughly considers the process for identifying, evaluating and managing any significant risks faced by the Company on an ongoing basis and these risks are reported and discussed at Board meetings. It ensures that effective controls are in place to mitigate these risks and that a satisfactory compliance regime exists to ensure all applicable local and international laws and regulations are upheld.
For each material risk, the likelihood and consequence are identified, management controls and frequency of monitoring are confirmed, and results are reported and discussed at regular Board meetings. For further details see the Principal risks and uncertainties section within this report.
Leadership structureThe Board is collectively responsible for the long-term success of the Company.
The BoardLed by the Chairman, the Board is collectively responsible for the long-term success of the Company and operates under a formal schedule of matters reserved for the Board. This ensures that the Company’s strategy and objectives, risks, Group operations, internal controls, policies and debt providers are all reviewed throughout the year. To assist in the effectiveness of its operations, certain matters are delegated to Committees whose
roles and duties are outlined in terms of reference set by the Board. The Committee Chairs provide a summary of the Committee activities at each Board meeting, advising of any issues or recommendations. Day-to-day management of the Company is overseen by the Executive Directors, who carry out the strategy established by the Board, within the confines of the policies and delegated authorities set by the Board.
Four scheduled Board meetings were held, aligned to the financial calendar, and there were 20 ad hoc meetings held to facilitate dealing with the operational needs of the business, the majority of which were held via telephone.
Committee of the BoardApproves ad hoc matters between Board meetings, subject to authority levels and comprises any two Directors, one of whom should be independent.
Audit CommitteeEnsures that the Group’s financial reporting and risk management are properly monitored, controlled and reported.
Nomination CommitteeConsiders the composition, skills and succession planning of the Board.
Remuneration CommitteeDetermines the remuneration of the Executive Directors within the approved remuneration policy and monitors employee pay.
Social & Ethics CommitteeOversees the Company’s compliance with its obligations under the JSE Listing Requirements and to facilitate appropriate attention to the dimension of how the Company does business, specifically its value system surrounding ethical standards and social responsibility.
Chairman of Committee
Committee of the Board
Audit Committee
Nomination Committee
Remuneration Committee
Social & Ethics Committee
Total meetings 3 4 1 4 1
James Peggie (Senior Independent Director and Acting Chairman)
4/4 1/1 4/4 1/1
Justin Atkinson (Non-executive Director) 4/4 0/1 2/4 1/1
Jill May (Non-executive Director) 1/4 0/1 2/4 1/1
Wessel Hamman (Non-executive Director) 4/4 1/1 4/4
Andrew Coombs (Chief Executive Officer) 1/1
Alistair Marks (Chief Financial Officer)
Committee member
51Sirius Real Estate Limited Annual Report and Accounts 2018

Non-executive Directors
Board operations
Board meeting agendas
DirectorsThe Board of Directors is collectively responsible for the long-term success of the Company. The Board believes it has an appropriate balance of skills and experience necessary to undertake its duties.
The Board is actively seeking a replacement for Neil Sachdev. James Peggie is chairing the Board in the interim period. The Board shall ensure the new Chairman is an independent Non-executive Director. The offices of the Chairman and the Chief Executive Officer are held separately.
A Diversity Policy was adopted and approved by the Board during the reporting period, in accordance with which, the appointment of any potential candidates to the Board, would be considered on merit against objective criteria and with due regard for the potential benefits of gender and racial diversity at Board level. In line with this policy, an additional female, non-executive Board member, Mrs. Jill May, based on the recommendation of the Nomination Committee, was appointed during the year under review. The Board will continue to discuss and annually agree all measurable targets for achieving continued diversity on the Board.
In accordance with the Articles of Association of the Company, at each general meeting (a) any Director who was elected or last re-elected as a Director at or before the AGM held in the third calendar year before the current year shall retire by rotation, and (b) such further Directors (if any) shall retire by rotation as would bring the number retiring by rotation up to one-third of the number of Directors in office at that date. The current practice of the Board, however, is to offer themselves up for re-election annually, which they intend to do again at the Company’s next AGM.
Board composition Board tenure – Executive (years) Board tenure – Non-executive (years)
Wessel Hamman
Justin Atkinson
Jill May
Alistair Marks
Andrew Coombs James Peggie
67%
4 7
33%
4 8
1 0.5
Executive Directors (17% female and 83% male)
The average age of the Board is 51 years of age
Property reports:
» Report from the CEO
» Investment acquisitions and disposals
» Capex projects
» Operational and strategic updates
Management reports
» Report from the CFO
» Financial results
» Banking facilities
» Budget, cash flow and management accounts
» Internal controls and risk management
Shareholder and investor relations
» Shareholder information and trading statistics
» Shareholder communications
Administrative matters
» Committee reports
» Corporate governance updates
» Corporate governance and administrative matters
52 Sirius Real Estate Limited Annual Report and Accounts 2018Governance
Corporate governance continued

The Chairman will meet regularly with the other Non-executive Directors to discuss the performance of the Board and the Board sub-committees. The performance of Executive Directors is measured against predetermined objectives that are agreed with each Executive Director at the start of the financial year.
The Chairman will have no executive responsibilities but will lead and set the agenda for the Board. The Chairman will also act as an interface between the Executive Directors and Non-executive Directors.
The Senior Independent Director provides a sounding board for the Chairman and serves as an intermediary for the other Directors when necessary. The Senior Independent Director should be available to shareholders if they have concerns when contact through the normal channels of the Chairman or the Chief Executive Officer has failed to provide a resolution or for which such contact is inappropriate. James Peggie is the Senior Independent Director.
Board performance and evaluationThe Board formally reviews its performance annually through an internal process. Internal evaluation of the individual Directors and their roles on the Board and Committees has taken the form of performance evaluation questionnaires and discussions to determine effectiveness and performance, as well as an assessment of the Non-executive Directors’ continued independence where appropriate.
Company SecretaryThe Group Company Secretary, Aoife Bennett, was appointed by the Board on 24 July 2017. She is responsible for guiding the Chairman and the Directors, both individually and collectively, on their duties and responsibilities. She also advises on corporate governance, compliance with legislation, the LSE Listing Rules and the JSE Listing Requirements.
The Board, having assessed her abilities as part of her recruitment and based upon her qualifications, experience and the level of competence she has demonstrated since working with the Group (as required by Section 3.84(h) of the JSE Listing Requirements), agreed that Mrs Bennett is sufficiently qualified, competent and experienced to act as Group Company Secretary.
The Company Secretary is not a Director of the Company. She does, however, hold the office of director of Sirius Finance (Guernsey) Limited, a Group company.
Internal control and financial reportingThe Directors acknowledge that they are responsible for establishing and maintaining the Company’s system of internal control and reviewing its effectiveness. Internal control systems are designed to manage rather than eliminate the failure to achieve business objectives and can only provide reasonable but not absolute assurance against material misstatements or loss.
The Directors carry out a robust assessment of the principal risks facing the Company, including those that would threaten its business model, future performance, solvency or liquidity. The key procedures which have been established to provide internal control are that:
» the Board clearly defines the duties and responsibilities of the Company’s agents and advisers and appointments are made by the Board after due and careful consideration. The Board monitors the ongoing performance of such agents and advisers and will continue to do so;
» the Board monitors the actions of the Executive Directors and the Senior Management Team (to whom day-to-day operations of the Group have been delegated) at regular Board meetings and is given frequent updates on developments arising from the operations and strategic direction; and
» the Board has reviewed the need for an internal audit function and has decided that the systems and procedures employed by the Executive Directors, the Senior Management Team and the Company Secretary, including its own internal controls and procedures, provide sufficient assurance that an appropriate level of risk management and internal control, which safeguards shareholders’ investment and the Company’s assets, is maintained. The Company is considering the appointment of an audit firm (which is not the external audit firm) to undertake a review of the need for an internal audit function and the Audit Committee will report to the Board on this in due course.
Internal controls over financial reporting are designed to provide reasonable assurance regarding the reliability of financial reporting and the preparation of financial statements for external reporting purposes.
The systems of control referred to above are designed to ensure effectiveness and efficient operation, internal control and compliance with laws and regulations. In establishing the systems of internal control, regard is paid to the materiality of relevant risks and the costs of control.
It follows therefore that the systems of internal control can only provide reasonable but not absolute assurance against the risk of material misstatement or loss.
53Sirius Real Estate Limited Annual Report and Accounts 2018

The Audit Committee assists the Board in discharging its responsibilities with regard to financial reporting and monitors the integrity of the financial statements of the Company.”
Composition of the Audit CommitteeThe Audit Committee comprises four members, Justin Atkinson, who was appointed Chairman on 22 September 2017 is senior independent director of Kier Group plc, the senior independent director and chair of the audit committee of Forterra plc, an independent non-executive director and chair of the audit committee of James Fisher plc and a member of the audit committee of the National Trust. The other members of the Committee include Jill May, who joined the Committee on 19 January 2018, Wessel Hamman and James Peggie. The Audit Committee is in compliance with the UK Corporate Governance Code which recommends that an audit committee should comprise of at least three independent non-executive directors. In addition to this the UK Corporate Governance Code requires at least one member of the Audit Committee to have recent and relevant financial experience. The Board considers that Justin Atkinson and Wessel Hamman, both of whom are qualified Chartered Accountants, possess the necessary experience to satisfy this requirement. The Board considers that Wessel Hamman, as a non-independent Non-executive, but also former Chairman of the Audit Committee, continues to provide the Audit Committee and its members with relevant industry and financial experience in order to assist the Committee in executing its duties effectively.
54 Sirius Real Estate Limited Annual Report and Accounts 2018Governance
Dear shareholder
I am pleased to present my first Audit Committee report as Chairman of the Audit Committee which is also the Company’s first report since the move to a dual primary listing on the Johannesburg Stock Exchange in November 2017. I would like to thank Robert Sinclair for his contribution as Audit Committee Chairman until his retirement from the Board at the AGM in September 2017. The Audit Committee’s role is to protect the interests of shareholders by ensuring a sound control environment within the Group, the integrity of published financial information and an effective audit process.
This report describes the main focus areas of the Audit Committee and how it discharged its responsibilities during the financial year ended 31 March 2018. It sets out how the Audit Committee has assessed internal control, risk management, the Company’s financial statements and the effectiveness of the external audit in the year under review.
Committee member as at 31 March 2018 Meeting attendance
Justin Atkinson(1) (Chairman) 4/4Wessel Hamman 4/4James Peggie 4/4Jill May(2) 1/4Neil Sachdev(R) 2/4Robert Sinclair(R) 1/4
(1) Justin Atkinson joined the Audit Committee on 19 May 2017 and was appointed as Chairman on 22 September 2017.
(2) Jill May joined the Committee on 19 January 2018.
(R) Denotes retired/resigned.
Audit Committee report
Protecting our shareholders’ interests

Roles and responsibilitiesThe Audit Committee’s main role is to assist the Board in discharging its responsibilities with regard to the financial reporting process, the audit process and the system of internal controls of the Company and compliance with financial laws and regulations by the Company.
The ultimate responsibility for reviewing and approving the Annual Report and Interim Report remains with the Board; however, the Audit Committee helps to ensure the accuracy and integrity of these in particular with regards to any significant judgements contained within them and to monitor any formal announcements relating to the Company’s financial performance. The Audit Committee reviews and approves the external auditors’ annual audit plan to ensure it is consistent with the agreed scope of engagement and it takes responsibility for all aspects of the external auditors’ appointment, performance and independence. This includes monitoring the extent of non-audit related work undertaken by the external auditors.
The Audit Committee will give due consideration to laws and regulations, the provisions of the UK Corporate Governance Code along with the requirements of the LSE and JSE rules. Accordingly the Audit Committee will advise the Board on whether, taken as a whole, the Company’s financial statements present a fair, balanced and understandable assessment as well as provide shareholders with the necessary information to assess the Group’s performance, business model and strategy.
Similarly it is the Board which is ultimately responsible for the Group’s internal control environment but the responsibility for the Group’s risk management methodology and effectiveness of internal controls has been delegated to the Audit Committee. The Group’s risk management process and system of internal controls are designed to manage rather than totally eliminate risk and are described in more detail in the principal risks and uncertainties section of this Annual Report.
The Audit Committee also reviews the Group’s current trading performance and future cash flow forecasts in order to consider the going concern and viability of the Company. It is then the Audit Committee’s responsibility to advise the Board on this and review the Group’s viability statement.
The Audit Committee satisfied itself in terms of the JSE Listing Requirement 3.84(g)(i) that the Group Chief Financial officer has appropriate expertise and experience and resources, and is satisfied that the internal financial controls of the Company are working effectively.
Risk management and internal controlsIt considers in detail the Group’s risk management processes in addition to reviewing internal control procedures, the interim and full year results and external audit plans. Regular reviews of significant risks are undertaken at meetings of the Committee and its observations are reported to the Board. The Group’s system of internal control is designed to manage and mitigate rather than eliminate altogether the risk of failure to meet business objectives and can only provide reasonable, but not absolute, assurance against material financial misstatement or loss:
» review the effectiveness of the Company’s financial reporting and internal risk and control policies and procedures for the identification, assessment and reporting of risks;
» monitor the integrity of the Company’s financial statements and all formal announcements relating to its financial performance and ensure they are fair, balanced and understandable;
» review significant financial reporting issues and judgements;
» make recommendations relating to the appointment, reappointment and removal of external auditors;
» monitor the independence and effectiveness of the auditors; and
» review the Company’s procedures for preventing and detecting fraud and bribery.
Developments in the yearThe primary focus of the Audit Committee in the year under review was as follows:
» reviewing the Company’s financial results and supporting policies and procedures;
» reviewing compliance relating to fraud and bribery, the provisions of the UK Corporate Governance Code and the additional requirements of the Main Markets of the London and Johannesburg Stock Exchanges upon which the Company’s shares are listed;
» reviewing and understanding the forecasts used to create the Company’s viability statement;
» completing an audit tender process, details of which are set out later in this report;
» agreeing the audit plan, audit scope and audit fee; and
» reviewing the terms of reference of the Audit Committee.
55Sirius Real Estate Limited Annual Report and Accounts 2018

Activities of the Audit CommitteeThe Audit Committee met on four occasions within the financial year under review and the content of each meeting is described as follows:
» On 8 June 2017, the Audit Committee met to discuss the full year results for the year ended 31 March 2017. In this meeting, KPMG Channel Islands, the Company’s auditors, presented their Audit Committee report relating to their audit of the year ended 31 March 2017 Annual Report.
» On 21 June 2017 the Audit Committee met to review the Annual Report for the year ended 31 March 2017, the adequacy of disclosures and the appropriateness of preparing the Annual Report on a going concern basis. It was concluded that the Company’s financial position was such that it continued to be appropriate for accounts to be prepared on a going concern basis. The Audit Committee duly approved the Annual Report for the year ended 31 March 2017 for consideration by the Board.
» On 22 November 2017, the Audit Committee met to review the half year results of the Company for the period ending 30 November 2017 and to discuss the external audit tender process. The Interim Report was reviewed by the Audit Committee and it was concluded that the disclosures were appropriate and having reviewed the Group’s trading and future cash flow forecasts, it was agreed that the accounts be prepared on a going concern basis. Consequently the Interim Report was approved for consideration by the Board.
» On 20 March 2018, the Audit Committee met to receive the KPMG LLP London Audit Strategy & Planning Report and to discuss the consideration of Ernst & Young LLP as the new external audit firm, as well as further discussions in respect of the requirement for an internal audit function and carry out an evaluation of its performance during the reporting period.
The Audit Committee may also seek professional advice on any such matters and secure the attendance at its meetings of third parties with relevant experience and expertise if it considers this necessary.
External audit tenderGiven the length of time that KPMG have been the Company’s auditors, the Audit Committee made the decision to conduct a thorough and robust external audit tender process on the basis that the existing external audit firm, KPMG LLP, had been acting as the Company’s external audit firm for more than ten years. The Audit Committee invited KPMG and three other firms to make proposals regarding the provision of audit services; included within the tender process was a firm outside of the “Big Four”. The Audit Committee recommended two external audit firms and one preferred firm, Ernst & Young LLP, to the Board.
Following the completion of the audit tender process the Company advises that KPMG LLP will resign as auditors at the completion of this year’s audit and Ernst & Young LLP will be appointed. The Board is recommending that Ernst & Young LLP be reappointed as auditors from the date of the AGM in September 2018. The Audit Committee would like to thank KPMG for their long service as the Group’s auditors.
Internal auditThe decision on whether or not to implement an internal audit function is made by the Board and this is based on the recommendation of the Audit Committee which considers annually a number of factors in making its assessment. These include the growth and scale of the Company, the diversity and complexity of the Company’s activities, the procedures and systems in place, the number of employees and the risk that issues may arise as well as the cost and benefit of implementing such a function.
The Board, as in previous years, has determined that this important area of potential control will continue to be reviewed on an annual basis as the Company continues to grow. The formal internal audit function was not required in the year to 31 March 2018 for the following reasons:
» the Group has in place an internal compliance function which reviews and monitors the appropriateness of operating procedures and ensures and tests compliance with these throughout the Group;
» the experience of employees and internal controls reduce risks of material mistakes occurring; and
» the clear approval process based on authority matrices, the high level of accountability from regular detailed management reporting and assurances gained from the external auditors reduce the risk of material misstatement and fraud.
The Audit Committee will continue to review its position on the establishment of an internal audit function on an annual basis.
WhistleblowingThe Audit Committee has considered arrangements by which staff of the Company may, in confidence, raise concerns about possible improprieties in matters of financial reporting or other matters, which are incorporated in its terms of reference. It has concluded that adequate arrangements, including a Whistleblowing Policy which is made available to all Group employees, are in place for the proportionate and independent investigation of such matters and, where necessary, for appropriate follow-up action to be taken within their organisation. The Whistleblowing Policy is available in both English and German and is available to all employees and details the reporting mechanism in place to allow them to raise any such concerns that may arise.
56 Sirius Real Estate Limited Annual Report and Accounts 2018Governance
Audit Committee report continued

Going concern and viability statement testing The Group’s ability to continue as a going concern and viability statement is based on current trading and latest three year forecasts prepared by the Company’s Senior Management Team. A model has been created for this which uses a combination of existing contractual agreements and future assumptions of performance of existing assets and expected acquisitions and disposals for which the Group currently has the resources.
In order to test the robustness of the forecast, sensitivities have been applied to key income and expense items including rental income, service charge recovery and overhead costs creating three forecasts showing the worst, base and best case scenarios.
The Audit Committee has reviewed and agreed the assumptions used by management in these forecasts.
Independence and oversight of external audit On 7 November 2017 the Company appointed KPMG LLP London as its auditors following the resignation of KPMG Channel Islands Limited (together “KPMG”). KPMG have been the auditors of the Company since it was listed on AIM in London in April 2007. The Audit Committee’s review of the appropriateness of the external auditors included assessing their terms of engagement, remuneration, independence, qualifications and compliance.
The Audit Committee meets the external auditors on average three times a year to discuss their remit and any issues arising from their audit work. The Audit Committee Chair meets with the external audit firm partner outside of Audit Committee meetings at least twice a year.
The Audit Committee has satisfied itself that the external auditors are suitable for reappointment by considering, inter alia, the information stated in paragraph 22.15(h) of the JSE Listing Requirements.
The Audit Committee has ensured that appropriate financial reporting procedures were established and that those procedures are operating in line with the JSE Listing Requirement 3.84(g)(ii).
Non-audit services policyThe total non-audit fees paid to the external auditors, KPMG, during the year ended 31 March 2018 were €34,000 (31 March 2017: €500,000). The main non-audit related fees paid to KPMG in the period relate to professional fees associated with the move to the Main Markets of the London and Johannesburg Stock Exchanges. KPMG undertook their standard independence procedures in relation to all non-audit related services and concluded their independence and objectivity was not impaired.
Significant matters considered in relation to the financial statements
Significant matters considered Audit Committee response
Valuation of investment properties
The carrying value of investment properties is material to the Group’s balance sheet. The valuation, which is performed half-yearly by Cushman & Wakefield LLP, is based upon assumptions including future rental income, anticipated maintenance costs and an appropriate discount and exit cap rate. There is a risk that the carrying value will differ from its net realisable value.
The fair value of the Group’s investment properties is determined by an independent valuer on the basis of a discounted cash flow model using a range of ten – 14 years.
The Audit Committee considers the Company’s management’s assessment of the carrying value of investment property and the appropriateness of supporting business plans as well as the transactional evidence available on the market.
The Audit Committee also considers offers that have been received by the Group on properties that have been marketed for sale as well as the levels at which assets have been disposed.
The external auditors report to the Audit Committee at the half year on their review and the year end in relation to the audit on their results and findings of their assessment of Cushman & Wakefield’s valuation judgements.
Justin AtkinsonChairman of the Audit Committee1 June 2018
57Sirius Real Estate Limited Annual Report and Accounts 2018

The Committee considers and makes recommendations to the Board on its composition so as to maintain an appropriate balance of skills and knowledge, relevant experience, independence and diversity.”
Composition of the Nomination CommitteeThe Nomination Committee comprises four members. James Peggie is acting as Chairman following Neil Sachdev’s resignation from the Board. The other members are Wessel Hamman, Justin Atkinson and Jill May. Justin Atkinson and Jill May were appointed to the Committee on 19 January 2018. The Nomination Committee complies with the UK Corporate Governance Code which recommends that the majority of the members of a nomination committee should be independent non-executive directors.
The purpose of the Nomination Committee is to consider and make recommendations to the Board concerning all new Board appointments and the retirement of Directors and to make recommendations to the Board relating to the policy for the ongoing training and development of Directors. The Committee uses external search consultants or open advertising for recruitment purposes as deemed most appropriate. When nominating candidates for Non-executive Directorships, the Committee takes account of the need for appropriate skills and experience, independence and diversity.
The Nomination Committee has not set voluntary targets for racial or gender diversity at Board level, which are recommended by the JSE Listing Requirements. The Nomination Committee does not believe that fixed targets will adequately serve the needs of its shareholders and prefers to continue with its open door policy in terms of recruitment of Board Directors.
The Committee keeps under review and evaluates the composition of the Board and its Committees to maintain the most appropriate balance of diversity, skills, knowledge, experience and independence and to ensure their continued effectiveness. The Committee in conjunction with the Board considers its diversity, experience, composition and succession planning on an ongoing basis.
Dear shareholder
On behalf of the Board, I am pleased to present the Nomination Committee report for the year ended 31 March 2018.
Committee member as at 31 March 2018 Meeting attendance
James Peggie (Chairman)(1) 4/4Wessel Hamman 4/4Jill May(2) 2/4Justin Atkinson(2) 2/4Neil Sachdev(R) 2/4Robert Sinclair(R) 2/4
(1) Chairman since 1 January 2018.
(2) Appointed to the Committee on 19 January 2018.
(R) Denotes retired/resigned.
58 Sirius Real Estate Limited Annual Report and Accounts 2018Governance
Nomination Committee report
Ensuring adequate succession planning for the Board

Upon appointment, Non-executive Directors undertake an induction process to familiarise themselves with the Group’s activities, policies and key issues. During their appointment they are expected to dedicate adequate time to carry out their role effectively and to challenge management in a constructive way.
Details of attendance at the Nomination Committee meetings during the financial year ended 31 March 2018 are set out in this report.
Activities of the Nomination CommitteeTo discharge its duties the members of the Nomination Committee met once during the year under review. Following this meeting, one appointment was recommended to the Board for approval, namely the appointment of Jill May as an independent Non-executive Director, bringing additional skills and experience to the Board to support future growth and the strategic aims of the Company.
The Board employed the executive search firm Spencer Stuart in December 2017 to assist in the search for a new Chairman of the Board, which it concludes is an effective way to find suitable candidates. The Committee will hold further meetings to discuss potential candidates.
On appointment each Non-executive Director receives a letter of appointment, setting out, among other things, their role and duties and that they are expected to allocate sufficient time to perform their duties effectively, making themselves available for all regular and ad hoc meetings, as well as providing for them to sit on Committees of the Board as required during their tenure.
In accordance with the Articles of Association of the Company, at each general meeting (a) any Director who was elected or last re-elected as a Director at or before the AGM held in the third calendar year before the current year shall retire by rotation, and (b) such further Directors (if any) shall retire by rotation as would bring the number retiring by rotation up to one-third of the number of Directors in office at that date. The current practice of the Board, however, is to offer themselves up for re-election annually.
In addition the Nomination Committee reviewed and agreed the 2017 Board evaluation process and provided feedback on that process to the Board for consideration at the 22 September 2017 meeting. The evaluation was carried out on the performance of the Board, the Committees and individual Directors.
The Company maintains a register of Directors’ conflicts of interest. In addition, at the start of each Board meeting, as a routine item, Directors are asked to declare any interests that might conflict with the agenda items under discussion. Directors are required to notify the Company, via the Company Secretary, at any time, of any potential or future conflicts of interest that may arise. Any such notifications are reviewed at the next Board meeting or sooner if deemed necessary and, if considered appropriate, authorised. Directors do not participate in the discussion or vote regarding matters on which they have a conflict of interest. If authorised, any conflicts are entered in the register of Directors’ conflicts.
All Directors may take independent professional advice at the Group’s expense in the furtherance of their duties and have full access to the Company Secretary. The Company maintains directors’ and officers’ liability insurance in respect of claims made against its Directors on an ongoing basis.
James PeggieChairman of the Nomination Committee1 June 2018
Role and responsibilities of the Nomination Committee
» Review the structure, size, diversity (including gender), composition and performance of the Board.
» Prepare a description of the role and capabilities required for a particular appointment.
» Nominate new Directors to become part of the Board, as appropriate.
» Provide suitable terms of engagement and an induction plan to all new appointees.
» Identify, from a variety of sources including the possible use of search consultants, and nominate for the approval of the Board, candidates to fill Board vacancies as and when they arise.
» Undertake an annual performance evaluation of the Chairman and the Board.
» Evaluate the balance of skills, experience, independence and knowledge on the Board.
Nomination Committee summary
59Sirius Real Estate Limited Annual Report and Accounts 2018

This has been a very active year for the Committee as it prepares for a new remuneration policy and oversees the changes it has been required to make as a result of the moves onto the Main Markets of the London and Johannesburg Stock Exchanges.”
Remuneration reportThe Remuneration Committee sets and monitors the overall Remuneration Policy for the Executive Directors and other senior executives. The Committee reviews, but does not limit itself to, the following key areas and makes recommendations to the Board accordingly:
» total remuneration (including base pay, bonus and incentive arrangements);
» method of remuneration;
» service contracts; and
» terms and conditions and any material changes to the standard terms of employment.
The activities, recommendations and approvals of the Committee are reported to the next routinely scheduled Board meeting.
Activities of the CommitteeThis has been another busy year for the Committee, as the Company has moved to the Main Markets of both the London and Johannesburg Stock Exchanges, which has prompted a significant amount of change in the way the Company remunerates. We have undertaken extensive work over the year to draw up a new deferred bonus plan to deal with the new deferrals of executive bonuses into shares in the Company, and a new Employee Benefit Trust to increase flexibility over the way in which share awards are settled. We have also revised the way in which the bonuses of the Executive Directors are earned and oversaw an initiative to incentivise approximately 30 senior managers who were not participating in the 2015 Long Term Incentive Plan (the “2015 LTIP”), to be able to participate under the rules of that plan. Our other key area of focus this year, as disclosed in the Directors’ remuneration report for the year ended 31 March 2017, has been the development of a new Long Term Incentive Plan, as the 2015 LTIP vested shortly before the publication of this report. It is expected that shareholder approval for the new arrangement will be sought at a separate general meeting which is likely to be held on the same day as the AGM (21 September 2018), and the proposed arrangements will be set out in a shareholder circular relating to that general meeting.
Introduction
On behalf of the Board, I am pleased to present the Directors’ remuneration report (the “Report”) for the year ended 31 March 2018.
As a Guernsey-incorporated company we are not subject to the UK regulations regarding the presentation of the remuneration report and the disclosures to be made by UK-quoted companies, but the Committee has sought to apply the requirements on a voluntary basis in order to reflect evolving best practice and to demonstrate our compliance with the UK Corporate Governance Code.
The Report is presented in two main sections: the annual report on remuneration, which provides details on the amounts earned in respect of the year ended 31 March 2018 and includes the Directors’ Remuneration Policy (the “Remuneration Policy”) and a forward-looking statement on how the Remuneration Policy will be applied in the year ending 31 March 2019. The Remuneration Policy was approved at the 2017 AGM with a vote in favour of more than 95%. In this Report, we have set out the Remuneration Policy approved at the 2017 AGM, with clarification of minor points as noted on page 57. To meet the requirements of the Johannesburg Stock Exchange Listing Requirements, both the Remuneration Policy and annual report on remuneration will be subject to an advisory shareholder vote at the AGM. As set out below, at a separate general meeting, we intend to seek shareholder approval for a new Long Term Incentive Plan, and at that general meeting we will also seek approval, on an advisory basis, for an updated Remuneration Policy which reflects that Long Term Incentive Plan.
Committee member as at 31 March 2018 Meeting attendance
James Peggie (Chairman)(1) 4/4Wessel Hamman 4/4Jill May(2) 2/4Justin Atkinson(2) 2/4Neil Sachdev(R) 2/4Robert Sinclair(R) 2/4
(1) Chairman since 1 January 2018.
(2) Appointed 19 January 2018.
(R) Denotes retired/resigned.
60 Sirius Real Estate Limited Annual Report and Accounts 2018Governance
Directors’ remuneration report
Continuing the reformation of the remuneration practices

Business performance and incentive out-turn for 2018As described in the strategic report the Company’s performance has been very strong. For the year under review profit before tax increased to €89.6 million (2017: €76.4 million) driven by a combination of organic and acquisitive growth. The Board has declared a final dividend of 1.60c per share representing a 4.6% increase on the same period the previous year. The average cost of debt in the period remained stable at 2.0% (2017: 2.0%). Total debt at 31 March 2018 was €373.1 million (31 March 2017: €348.6 million) and the Group’s gross loan to value ratio(1) reduced to 38.6% (31 March 2017: 42.3%), whilst the Group’s net loan to value ratio reduced to 31.9% (31 March 2017: 38.0%). Total shareholder return, based on an adjusted NAV per share, was 17.0% in the period (31 March 2017: 15.3%) and market capitalisation increased by €168.6 million or 32.1% to €694.1 million(2) as at 31 March 2018.
(1) Including assets held for sale and prepayments for assets that completed on 1 April 2018 and for which related loan facilities were drawn down at 31 March 2018.
(2) Market capitalisation calculated using number of shares in issue, closing share price on the London Stock Exchange on 31 March 2018 and a conversion rate of GBP:EUR of 1.1366.
2018 bonusAs a consequence of this performance and very strong delivery around financial, strategic and personal targets, both Executive Directors earned their full bonus (100% of salary), details of which are provided on page 65. Base salary at the start of the financial year is used to calculate the bonus awards. 35% of the bonus has been deferred into shares, under the terms of the new deferred bonus plan, 50% of which will be released to the Executive Directors after one year and 50% after two years, subject to their continued employment.
2015 LTIPThe 2015 LTIP awards have vested based on performance conditions assessed over the three years to 31 March 2018, and a separate assessment based on total shareholder return assessed up to the 20th business day after the announcement of the results for the year to 31 March 2018. Vesting was at the maximum level for all participants.
Each of Andrew Coombs and Alistair Marks (as well as Rüdiger Swoboda, a member of the Senior Management Team) has agreed to surrender 4% of his 2015 LTIP to allow awards to be made to approximately 70 employees within the Group who do not currently participate in the 2015 LTIP. This resulted in a reallocation of 350,000 shares by Andrew Coombs and of 350,000 shares by Alistair Marks. The Committee believes this is a very positive action on behalf of the Executive Directors and Mr Swoboda.
Adding these employees to the senior managers who were added to the 2015 LTIP and whose performance condition of a 15% total NAV return has also been met means that the Committee is delighted to report that it now expects nearly half the workforce to be shareholders in the Company following these initiatives.
In line with the UK reporting regulations that the Committee has sought to apply on a voluntary basis, we will include the value of the vested 2015 LTIP awards (after taking into account the reallocation referred to above) in the single figure table in the Directors’ remuneration report for the year ending 31 March 2019.
The level of remuneration of the Non-executive Directors reflects the time commitment and responsibilities of their roles. The remuneration of the Non-executive Directors does not include any share options or other performance related elements and there are no plans to seek any shareholder waivers to deviate from this. The remuneration of the Board is set out in the Director’s remuneration report on page 65.
Rewards for the financial year ending 31 March 2019In summary
Fixed pay Bonus Long-term incentive
2018 No change 100% of base salary (start of year) maximum.
Bonuses of 100% of salary earned by each Executive Director reflecting strong performance.
65% of the bonus earned is paid in cash, with the balance deferred into shares for one year (50% of the deferred amount) or two years (50% of the deferred amount).
No awards made.
Awards under the 2015 LTIP vested at maximum in July 2018.
2019 No change 100% of base salary (start of year) maximum.
Up to 35% of the full bonus earned deferred into shares, with half vesting after one year and the balance after two years.
Shareholder approval for a new Long Term Incentive Plan is expected to be sought at a separate general meeting, likely to be held on the same day as the AGM, and the proposed arrangements will be set out in a separate shareholder circular relating to that general meeting.
The Committee recommends to shareholders the resolutions to approve (on an advisory basis) both the Remuneration Policy and the annual report on remuneration and hopes that shareholders will support both resolutions at the AGM on 21 September 2018.
61Sirius Real Estate Limited Annual Report and Accounts 2018

Directors’ Remuneration Policy report
The following section sets out our Remuneration Policy approved at the 2017 Annual General Meeting except that we have updated the table of Directors’ service contracts to reflect the current position, included the terms of the finalised deferred bonus plan, included information on the annual bonus performance measures for 2018/2019 and removed references to the Matching Share Plan which terminated with effect from 31 March 2017. At a separate general meeting, we expect to seek shareholder approval for a new Long Term Incentive Plan and at that general meeting we will also seek approval, on an advisory basis, for an updated Directors’ Remuneration Policy which reflects that Long Term Incentive Plan.
To meet the requirements of the Johannesburg Stock Exchange Listing Requirements, the Remuneration Policy will be subject to an advisory shareholder vote at the AGM. The aim of the Remuneration Policy is to align the interests of Executive Directors with the Group’s strategic vision and the long-term creation of shareholder value. The Remuneration Policy is intended to remunerate our Executive Directors competitively and appropriately for effective delivery of the Group’s strategy and creation of shareholder value, and allows them to share in this success and the value delivered to shareholders.
Executive Directors’ Remuneration PolicyThe table sets out the elements of Executive Directors’ remuneration and how each element operates, as well as the maximum opportunity of each element and any applicable performance measures.
Fixed remunerationElement, purpose and strategic link Operation Maximum opportunity
Basic salaryTo provide a competitive base salary for the market in which the Group operates to attract and retain Executive Directors of a suitable calibre.
Usually reviewed annually taking account of:
» Group performance;
» role, experience and individual performance;
» competitive salary levels and market forces; and
» pay and conditions elsewhere in the Group.
Increases will normally be in line with the range of salary increases awarded (in percentage terms) to other Group employees. Increases above this level may be awarded to take account of individual circumstances, such as:
» promotion;
» change in scope or increase in responsibilities;
» an individual’s development or performance in role; and
» a change in the size or complexity of the business.
BenefitsTo provide market competitive benefits as part of the total remuneration package.
Executive Directors currently receive private medical insurance, income insurance and death in service benefits.
Other benefits may be provided based on individual circumstances, for example, relocation or travel expenses or the provision of a company car or cash allowance.
Whilst the Committee has not set a maximum level of benefits that Executive Directors may receive, the value of benefits is set at a level which the Committee considers appropriate, taking into account market practice and individual circumstances.
Retirement benefitsTo provide an appropriate level of retirement benefit (or cash allowance equivalent).
Executive Directors are provided with a contribution to a self-invested pension plan or a cash allowance instead of contributions to a pension plan.
The maximum contribution level is set at 15% of salary.
Variable remunerationElement, purpose and strategic link Operation Maximum opportunity
Annual bonusRewards performance against targets which support the strategic direction and financial performance of the Group.
Deferral provides a retention element through share ownership and direct alignment to shareholders’ interests.
Awards are based on performance (typically measured over one year). Pay-out levels are normally determined by the Committee after the year end.
The Committee has discretion to amend pay-outs should any formulaic output not reflect their assessment of performance.
A proportion (normally up to 65%) of any bonus is paid in cash with the balance normally paid in the form of shares, half of which are usually deferred for one year and half for two years.
Awards may include dividend equivalents earned over the deferral period, which may be delivered in cash or in additional shares and which may assume the reinvestment of dividends on such basis as the Committee determines.
The annual bonus opportunity is up to a maximum of 100% of base salary.
Targets are set annually and aligned with key financial, strategic and/or individual targets with the weightings between these measures determined by the Committee each year considering the Group’s priorities at the time.
At least 50% of the bonus will be based on profit related measures.
For financial measures, no financial element is earned for threshold performance rising to 100% of the maximum for the financial element for maximum performance.
Vesting of the bonus in respect of strategic measures or individual objectives will be between 0% and 100% based on the Committee’s assessment of the extent to which the relevant metric or objective has been met.
62 Sirius Real Estate Limited Annual Report and Accounts 2018Governance
Directors’ remuneration report continued

Legacy plansThe Executive Directors have an interest in vested awards under the 2015 LTIP. No further grants will be made under the 2015 LTIP to the Executive Directors.
The Committee retains discretion to make any remuneration payment or payment for loss of office outside the Remuneration Policy in this report:
» where the terms of the payment were agreed before the policy came into effect (including the satisfaction of awards granted under the 2015 LTIP); and
» where the terms of the payment were agreed at a time when the relevant individual was not a Director of the Company and, in the opinion of the Committee, the payment was not in consideration of the individual becoming a Director of the Company.
For these purposes, “payment” includes the satisfaction of awards of variable remuneration and, in relation to an award over shares, the terms of the payment are agreed at the time the award is granted.
Information supporting the Remuneration Policy tableExplanation of performance measures chosenPerformance measures for the annual bonus and long-term incentive are selected to reflect the Group’s strategy. Performance targets are set each year by the Committee, taking into account a number of different factors.
For FY18/19, the annual bonus will be subject to appropriately stretching performance conditions based on adjusted funds from operations (“FFO”) (as regards 70% of the award), strategic objectives (as regards
10% of the award) and personal objectives (as regards 20% of the award). The Committee considers that adjusted FFO is the primary measure of short-term performance and seeks to balance this with other strategic and personal targets which reflect the contribution and focus of the Executive Directors.
The Committee retains the discretion to adjust or set different performance measures or targets where it considers it appropriate to do so (for example, to reflect a change in strategy, a material acquisition and/or a divestment of a Group business or change in prevailing market conditions and to assess performance on a fair and consistent basis from year to year). Awards and options may be adjusted in the event of a variation of share capital in accordance with the rules of the 2015 LTIP.
Recovery provisionsThe Committee has the right to reduce, cancel or impose further restrictions on unvested deferred bonus shares in certain circumstances (including a material error or misstatement of the financial results, gross misconduct or a material failure of risk management).
Shareholding guidelinesTo promote further alignment to shareholders’ interests and share ownership, Andrew Coombs and Alistair Marks are subject to a minimum shareholding requirement of 1,400,000 and 950,000 shares respectively.
This limit is kept under review by the Committee. Until this guideline is met Executive Directors will be required to retain half of any shares which vest under the deferred bonus plan or 2015 LTIP (after sales to cover tax).
Non-Executive Directors’ Remuneration PolicyThe Remuneration Policy for the Chairman and Non-executive Directors is to pay fees necessary to attract an individual of the calibre required, taking into consideration the size and complexity of the business and the time commitment of the role, without paying more than is necessary. Details are set out in the table below:
Approach to setting fees » The fees of the Non-executive Directors are agreed by the Chairman and CEO and the fees for the Chairman are determined by the Board as a whole.
» Fees are set taking into account the level of responsibility, relevant experience and specialist knowledge of each Non-executive Director and fees at companies of a similar size and complexity.
Basis of fees » Non-executive Directors are paid a basic fee for membership of the Board with additional fees being paid for Chairmanship of Board Committees.
» Additional fees may also be paid for other Board responsibilities or roles, such as the Senior Independent Director.
» Fees are normally paid in cash.
Other » Non-executive Directors may be eligible to receive reasonable reimbursements such as travel and other expenses.
» Neither the Chairman nor any of the Non-executive Directors are eligible to participate in any of the Group’s incentive arrangements.
63Sirius Real Estate Limited Annual Report and Accounts 2018

Directors’ Remuneration Policy report continued
Approach to recruitment remunerationThe Remuneration Policy aims to facilitate the appointment of individuals of sufficient calibre to lead the business and execute the strategy effectively for the benefit of shareholders. When appointing a new Executive Director the Committee seeks to ensure that arrangements are in the best interests of the Company and not to pay more than is appropriate. The Committee will take into consideration relevant factors, which may include the calibre of the individual, their existing remuneration package, and their specific circumstances, including the jurisdiction from which they are recruited.
The Committee will typically seek to align the remuneration package with the Group’s Remuneration Policy. The Committee may make payments or awards to recognise or “buy out” remuneration packages forfeited on leaving a previous employer. The Committee’s intention is that such awards would be made on a “like-for-like” basis to those forfeited. The discretion will not be used to make non-performance related incentive payments (for example, a “golden hello”).
Recognising that any new Executive Director appointed from outside the business would not immediately participate in any new LTIP or any other existing long-term incentive arrangement, an additional annual bonus opportunity may be offered until such time as a new long-term incentive arrangement is put in place in which that new Executive Director can participate. Accordingly taking this and the maximum annual bonus in the Remuneration Policy table into account, the overall variable pay maximum which could form part of the recruitment arrangement is 250% of salary.
The remuneration package for a newly appointed Chairman or Non-executive Director will normally be in line with the structure set out in the Non-executive Directors’ Remuneration Policy.
Service contractsEach of the Executive Directors has service contracts with the Group. The notice period of Executive Directors’ service contracts will not exceed six months. All Non-executive Directors have initial fixed term agreements with the Group for no more than three years. Details of the Directors’ service contracts are set out below:
Name Commencement Notice period
Andrew Coombs 20 January 2012 6 monthsAlistair Marks 20 January 2012 6 monthsJustin Atkinson 13 March 2017 3 monthsJames Peggie 27 November 2012 3 monthsJill May 27 November 2017 3 monthsWessel Hamman 17 May 2011 3 months
Payments for loss of officePayments for loss of office will be in line with the provisions of the Executive Directors’ service contracts and the rules of the share plans. The Company retains the right to terminate each Executive Director’s service contract by making a payment in lieu of some or all of the notice period. Any such payment would consist of base salary but not benefits in respect of the unexpired notice period. Post-termination restrictive covenants are in place for six months after notice of termination has been given, and under their service contracts, the Executive Directors are entitled to a payment of 100% of salary for observing these restrictions. This is a legacy arrangement in their service contracts and will not be replicated for future appointments.
Any payment to an Executive Director on termination in respect of annual bonus will be determined by the Committee taking into account the circumstances of the termination. Any payment will be pro-rated to reflect the proportion of the bonus year worked and subject to performance achieved. The Committee retains discretion to pay the whole of the bonus for the year of departure and/or the previous year in cash.
Any deferred amounts from bonuses earned in previous years will normally be retained unless the Executive Director resigns to join or set up a competitive business or is summarily dismissed. Payments will ordinarily only be made at the usual time (although the Committee retains discretion to make payments early in appropriate circumstances). The Committee retains discretion to pay the whole of the bonus for the year of departure and/or the previous year in cash.
In appropriate circumstances, payments may also be made in respect of accrued holiday, outplacement, legal fees and other benefits. The Committee reserves the right to make additional payments where such payments are made in good faith in discharge of an existing legal obligation (or by way of damages for breach of such an obligation) or by way of settlement or compromise of any claim arising in connection with the termination of a Director’s office or employment. Where the Committee retains discretion it will be used to provide flexibility in certain situations, taking into account the particular circumstances of the Director’s departure and performance.
On termination of employment, entitlements under the legacy LTIP in respect of both vested and unvested awards will be dealt with in accordance with the terms of that plan and the awards.
There is no entitlement to any compensation in the event of Non-executive Directors’ contracts not being renewed or being terminated without notice in accordance with their terms.
64 Sirius Real Estate Limited Annual Report and Accounts 2018Governance
Directors’ remuneration report continued

Consultation with shareholdersThe Committee will consider shareholder feedback received on remuneration matters including issues raised at the AGM as well as any additional comments received during any other meeting with shareholders. The Committee will seek to engage directly with major shareholders and their representative bodies should any material changes be made to the Remuneration Policy.
In the event that 25% or more of shareholders vote against either the Remuneration Policy or the annual report on remuneration, the Company will, in its voting results announcement, pursuant to the Johannesburg Stock Exchange Listing Requirements, extend an invitation to dissenting shareholders to engage with the Company, through dialogue, requesting written submissions or otherwise, in order to address shareholder concern, always with due regard to meeting the Company’s stated business objectives whilst being fair and responsible.
The Committee recommends to shareholders the resolution to approve (on an advisory basis) the Remuneration Policy and the annual report on remuneration and hopes that shareholders will support the resolutions at the AGM on 21 September 2018.
Statement of consideration of employment conditions elsewhere in the GroupThe Committee considers the pay and employment conditions of Group employees generally and takes these into account when determining the remuneration of the Executive Directors.
External appointmentsNeither of the Executive Directors currently has an external appointment. The Directors recognise that external appointments can broaden an individual’s skills and experience. If an Executive Director wishes to take up an external appointment, he or she must first seek approval from the Chairman.
Annual report on remuneration
Single figure tableThe following table sets out total remuneration for each Director in respect of the year ended 31 March 2018 (converted to euros based on the exchange rate of 1.14 unless stated otherwise).
31 March 2018 Salary/fees Benefits(1) Pension Bonus (7) Total
Executive DirectorsAndrew Coombs €456,000 €8,775 €68,400 €456,000 €989,175Alistair Marks €345,000 €25,665 €51,750 €345,000 €767,415Non-executive DirectorsNeil Sachdev(2) €121,983 — — — €121,983Robert Sinclair(3) €25,521 — — — €25,521Justin Atkinson(4) €50,593 — — — €50,593Wessel Hamman €46,094 — — — €46,094James Peggie(5) €76,255 — — — €76,255Jill May(6) €15,687 — — — €15,687
(1) Using exchange rates at the end of the month in which the transaction occurred.
(2) Neil Sachdev resigned on 31 December 2017.
(3) Robert Sinclair retired at the AGM on 22 September 2017.
(4) Justin Atkinson was appointed as Chairman of the Audit Committee on 22 September 2017 and his fees therefore reflect his role as both Non-executive Director and Chairman of the Audit Committee.
(5) James Peggie was appointed with effect from 1 January 2018 to chair the Board pending a replacement for Neil Sachdev being made. His fees reflect this role.
(6) Jill May was appointed to the Board on 27 November 2017 and her fees reflect her role as Non-executive Director since her appointment.
(7) Includes the value of the bonus paid in cash and the value of the bonus deferred into shares, as described below.
65Sirius Real Estate Limited Annual Report and Accounts 2018

Annual report on remuneration continued
Single figure table continuedThe following table sets out total remuneration for each Director in respect of the year ended 31 March 2017 using exchange rates at the end of the month in which the transaction occurred with the exception of those relating to the Matching Share Plan (“MSP”) which is calculated using exchange rates in place at time of approval. The MSP came to an end on 31 March 2017.
31 March 2017 Salary/fees Benefits Pension Bonus MSP Total
Executive DirectorsAndrew Coombs €351,928 €42,133 €47,992 €300,085 €164,005 €906,143Alistair Marks €308,574 €25,072 €35,699 €269,340 €171,063 €809,748Non-executive DirectorsNeil Sachdev(1) €71,187 — — — — €71,187Robert Sinclair(2) €55,433 — — — — €55,433Justin Atkinson(3) €2,450 — — — — €2,450Wessel Hamman €44,538 — — — — €44,538James Peggie(4) €57,112 — — — — €57,112
(1) Neil Sachdev was appointed as Non-executive Director on 6 July 2016 and was subsequently appointed as Chairman on 26 September 2016. His fees therefore reflect his role as a Non-executive Director and Chairman during the year.
(2) Robert Sinclair stepped down as Chairman on 26 September 2016 and continued as a Non-executive Director. His fees therefore reflect his role as Chairman and a Non-executive Director during the year.
(3) Justin Atkinson was appointed as a Non-executive Director on 13 March 2017.
(4) James Peggie took over some of Robert Sinclair’s responsibilities during a period when Robert Sinclair was unwell and received an extra fee for doing so. Robert Sinclair’s fees were adjusted accordingly for the period of his absence.
Additional disclosures in respect of the single figure tableBase salaryThe salaries applicable at the beginning of the financial year 1 April 2018 are shown below (converted to euros based on the exchange rate of 1.14).
Executive DirectorBase salary at1 April 2018(1)
Andrew Coombs €463,661Alistair Marks €350,796
(1) Neither Executive Director’s salary was increased for the financial year ended 31 March 2018. Base salary stated at 1 April 2018 reflects a contractual inflationary increase for each Executive Director over the previous year’s salary. The difference in Andrew Coombs’ salary as disclosed here and in the corresponding table in the Directors’ Remuneration Report for the year ended 31 March 2017 reflects changes made in the year to 31 March 2017 and the effect of exchange rates.
Taxable benefitsTaxable benefits for the Executive Directors include private medical insurance and income protection insurance.
66 Sirius Real Estate Limited Annual Report and Accounts 2018Governance
Directors’ remuneration report continued

Annual bonus For the year ended 31 March 2018, each of Andrew Coombs and Alistair Marks was awarded a bonus opportunity equal to 100% of base salary. The following table sets out the bonus earned by the Executive Directors and how this reflects performance for the year.
Performance measure
Opportunityfor maximumperformance(% of salary)
Actualperformance
Bonus earned(% of salary)
Adjusted funds from operations performanceAdjusted funds from operations (“Adjusted FFO”) to fall in a target range of €35,150,000 (no bonus) and of €38,850,000 (maximum bonus). Adjusted FFO means recurring profit before tax adjusted for depreciation, amortisation of financing fees, senior management bonuses and current tax receivable/incurred, and excluding any acquisitions completed in FY18 (except for the Frankfurt (Praunheimer Landstrasse) and Cologne (Frankfurter Strasse) acquisitions which completed in April 2017).
Capped at 60%
Adjusted FFO as calculated for this measure came to €40,071,550.
Maximum target range exceeded such that maximum bonus opportunity under this measure achieved.
60%
Personal objectivesAchievement of the following personal objectives.
20% Performance measures achieved based on the delivery of the following:
20%
Objectives applying to each Executive DirectorCompletion of the sale of Rupert Mayer Strasse in Munich. Rupert Mayer Strasse asset
completed in May 2017.Investing cash available from disposals and placing proceeds. All funds used to make acquisitions. Progressing the capex investment programme. 48,250sqm completed in the year.Disposing of non-core or mature sites or surplus land and improving rental income of the Group on a run rate basis.
Disposal of Berlin Tempelhof land, notarisation of sales of Bremen Brinkman, Rostock land and Markgröningen building.
Improving overall rental income on a run rate basis. 6.2% increase in rental income in existing portfolio.
Objectives applying to Mr CoombsBroadening the investor base and fulfilling key investor initiatives. Capital Markets Day, results
roadshows, investor presentations, two investor tours and one analyst tour. Nine major new institutional investors on board.
Improving relationships with other stakeholders and market participants. Developed relationships with a number of banks and corporate advisers.
Implementing training and career development programmes for non-Board levels of management, and demonstrating leadership and strategic initiative.
Delivering 5x one day senior manager development modules and 10x one day Sirius Skills Academy events involving 150 employees.
Objectives applying to Mr MarksImproving service charge recoverables on a run rate basis. €1.1 million improvement in
recoveries on existing portfolio.Executing attractive new financings. Three new long-term financings
(€79 million), charging attractive interest rates.
Delivering the first main market Annual Report. Annual Report delivered on schedule.
Bringing in house the former Intertrust service arrangements. Intertrust services all brought in house.
LTV performanceAchievement of a LTV performance target of 40% as at 31 March 2018. The target calculation allowed for the inclusion of property assets that were pre-paid at 31 March 2018 and for which external financing was drawn down.
10% Performance measure achieved.
Gross LTV of 38.6% (including property assets that were pre-paid at 31 March 2018 and for which external financing was drawn down). Net LTV of 31.9%).
10%
Indices inclusionInclusion of the Company’s shares in any of the constituents of the FTSE EPRA/NAREIT Global Real Estate Index Series (5% of bonus), the FTSE Index Series (2.5% of bonus) and the SA Listed Property Index (2.5% of bonus).
10% The Company’s shares are now included in each of the indices.
10%
67Sirius Real Estate Limited Annual Report and Accounts 2018
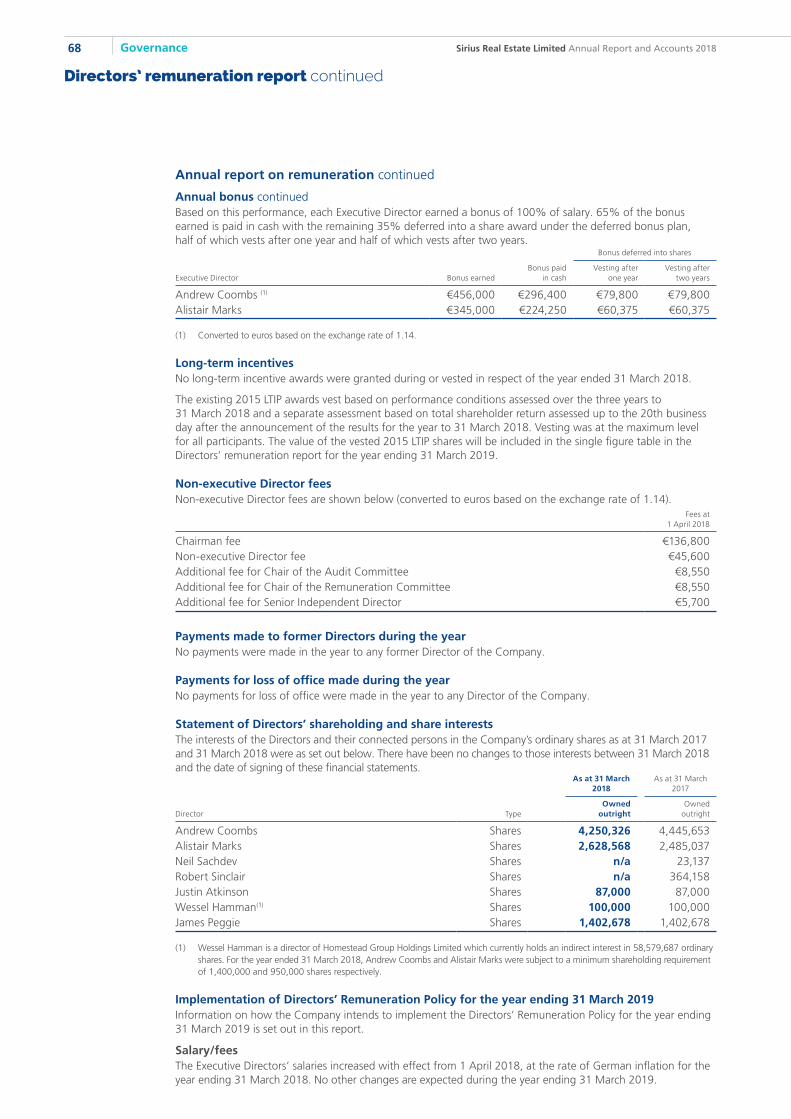
Annual report on remuneration continued
Annual bonus continuedBased on this performance, each Executive Director earned a bonus of 100% of salary. 65% of the bonus earned is paid in cash with the remaining 35% deferred into a share award under the deferred bonus plan, half of which vests after one year and half of which vests after two years.
Executive Director Bonus earnedBonus paid
in cash
Bonus deferred into shares
Vesting afterone year
Vesting aftertwo years
Andrew Coombs (1) €456,000 €296,400 €79,800 €79,800Alistair Marks €345,000 €224,250 €60,375 €60,375
(1) Converted to euros based on the exchange rate of 1.14.
Long-term incentivesNo long-term incentive awards were granted during or vested in respect of the year ended 31 March 2018.
The existing 2015 LTIP awards vest based on performance conditions assessed over the three years to 31 March 2018 and a separate assessment based on total shareholder return assessed up to the 20th business day after the announcement of the results for the year to 31 March 2018. Vesting was at the maximum level for all participants. The value of the vested 2015 LTIP shares will be included in the single figure table in the Directors’ remuneration report for the year ending 31 March 2019.
Non-executive Director feesNon-executive Director fees are shown below (converted to euros based on the exchange rate of 1.14).
Fees at1 April 2018
Chairman fee €136,800Non-executive Director fee €45,600Additional fee for Chair of the Audit Committee €8,550Additional fee for Chair of the Remuneration Committee €8,550Additional fee for Senior Independent Director €5,700
Payments made to former Directors during the yearNo payments were made in the year to any former Director of the Company.
Payments for loss of office made during the yearNo payments for loss of office were made in the year to any Director of the Company.
Statement of Directors’ shareholding and share interestsThe interests of the Directors and their connected persons in the Company’s ordinary shares as at 31 March 2017 and 31 March 2018 were as set out below. There have been no changes to those interests between 31 March 2018 and the date of signing of these financial statements.
Director Type
As at 31 March 2018
As at 31 March 2017
Ownedoutright
Ownedoutright
Andrew Coombs Shares 4,250,326 4,445,653Alistair Marks Shares 2,628,568 2,485,037Neil Sachdev Shares n/a 23,137Robert Sinclair Shares n/a 364,158Justin Atkinson Shares 87,000 87,000Wessel Hamman(1) Shares 100,000 100,000James Peggie Shares 1,402,678 1,402,678
(1) Wessel Hamman is a director of Homestead Group Holdings Limited which currently holds an indirect interest in 58,579,687 ordinary shares. For the year ended 31 March 2018, Andrew Coombs and Alistair Marks were subject to a minimum shareholding requirement of 1,400,000 and 950,000 shares respectively.
Implementation of Directors’ Remuneration Policy for the year ending 31 March 2019Information on how the Company intends to implement the Directors’ Remuneration Policy for the year ending 31 March 2019 is set out in this report.
Salary/fees The Executive Directors’ salaries increased with effect from 1 April 2018, at the rate of German inflation for the year ending 31 March 2018. No other changes are expected during the year ending 31 March 2019.
68 Sirius Real Estate Limited Annual Report and Accounts 2018Governance
Directors’ remuneration report continued

Annual bonusThe maximum annual bonus opportunity for the year ending 31 March 2019 will remain at 100% of base salary (being the salary applying at the start of year).
The annual bonus will be subject to stretching performance conditions based on adjusted FFO (as regards 70% of the award), strategic objectives (as regards 10% of the award) and personal objectives (as regards 20% of the award).
The Committee considers the performance targets and objectives to be commercially sensitive. Details of the performance targets and objectives, and performance against them, will be disclosed when they are no longer considered commercially sensitive.
Adjusted FFO means adjusted profit before tax(1) adjusted for depreciation, amortisation, costs and accruals of financing fees, senior management bonus and current tax receivable/incurred, and excluding any acquisitions or disposals completed in FY2019 (except for the Saarbrücken (Neugrabenweg) and Düsseldorf (In der Steele) acquisitions which completed on 1 April 2018 and the disposal of Braner Brinkmann (Herman-Ritler-Strasse) which completed on 2 May 2018.
(1) Reported profit before tax adjusted for property revaluation, change in fair value of derivative financial instruments and other adjusting items including expenses relating to share incentive plans.
35% of any bonus earned will be deferred into share awards which will ordinarily vest in equal tranches after one and two years respectively, subject to continued employment and malus provisions. The remainder of any bonus earned will be paid in cash. The awards are subject to the rules of the Deferred Bonus Plan.
New Long Term Incentive PlanShareholder approval for a new Long Term Incentive Plan (“New LTIP”) will be sought at a general meeting which is likely to be held on the same day as the AGM (21 September 2018). The proposed arrangements, including in relation to the operation of the New LTIP in the year ending 31 March 2019, are expected to be set out in a separate shareholder circular relating to that general meeting.
Consideration by the Directors of matters relating to Directors’ remunerationThe Committee comprised four Non-executive Directors as at 31 March 2018. The Committee members’ attendance at meetings was as follows:
Committee member as at 31 March 2018 Meeting attendance
James Peggie (Chairman) 4/4Wessel Hamman 4/4Jill May(1) 2/4Justin Atkinson(1) 2/4Neil Sachdev(R) 2/4Robert Sinclair(R) 2/4
(1) Appointed to the Committee on 19 January 2018.
(R) Denotes retired/resigned.
The Committee’s key responsibilities for the year ended 31 March 2018 included:
» confirming the annual bonus awards for the year ended 31 March 2018;
» setting the performance measures for the annual bonus awards for the year ended 31 March 2019;
» devising a new Long Term Incentive Plan, which is expected to be set out in a shareholder circular relating to a separate general meeting to approve the same and confirming the proposed awards to Executive Directors and members of the Senior Management Team;
» drafting the new Deferred Bonus Plan;
» establishing the new Employee Benefit Trust;
» agreeing and overseeing the addition of senior managers to the 2015 LTIP;
» agreeing and overseeing the reallocation of awards under the 2015 LTIP from the Executive Directors (and Mr Swoboda) to Group employees;
» reviewing the ongoing appropriateness and relevance of Remuneration Policy, including revising the Remuneration Policy to reflect the new Long Term Incentive Plan which is expected to be set out in a shareholder circular relating to a general meeting to be held to approve the same;
» recommending and monitoring the level and structure of remuneration of senior management; and
» production of the annual report on the Directors’ remuneration.
The Board considers that the membership of the Committee is compliant with the UK Corporate Governance Code recommendations. No individual is involved in determining their own remuneration.
Advice to the CommitteeAndrew Coombs and Alistair Marks occasionally attended meetings and provided information and support as requested. Neither Executive Director was involved in determining their own remuneration.
The Committee received independent advice from Deloitte LLP during the year ended 31 March 2018. Deloitte LLP is a founder signatory to the Remuneration Consultants Group’s Code of Conduct and is considered by the Committee to be independent.
ApprovalThis Report was approved by the Board on 1 June 2018 and signed on its behalf by:
James PeggieChairman of the Remuneration Committee1 June 2018
69Sirius Real Estate Limited Annual Report and Accounts 2018

70 Sirius Real Estate Limited Annual Report and Accounts 2018Governance
The Committee considers and makes recommendations to the Board in relation to the critical dimensions of how the Company does business.”
Composition of the Social & Ethics CommitteeThe Social & Ethics Committee comprises four members. Andrew Coombs acts as Chairman. The Board approved the appointment of Andrew Coombs as Chairman of the Committee as he would be able to assist the Committee with the most relevant and up to date considerations in relation to best German practices in industry, employment and corporate social responsibility. The other three members of the Committee are independent Non-executive Directors, being James Peggie, Justin Atkinson and Jill May. The composition of the Committee complies with the JSE Listing Requirements. It is not a requirement of the UK Corporate Governance Code to have this Committee. The formation of the Committee was approved by the Board on 19 January 2018, but its first substantive meeting will be held during the forthcoming financial year.
Social & Ethics Committee
Maintaining ethical standards
Dear shareholder
On behalf of the Board, I am pleased to present the Directors’ Social & Ethics Committee report for the year ended 31 March 2018.
The Social & Ethics Committee is a new Committee whose role is to oversee the Company’s compliance with its obligations under the JSE Listing Requirements. The Committee considers and makes recommendations to the Board in relation to the critical dimensions of how the Company does business, specifically its value system surrounding ethical standards and social responsibility.
The initial meeting of the Committee was held in January 2018 having been only recently formed following the Company’s move to a dual primary listing on the Main Board of the JSE in November 2017.
Committee member as at 31 March 2018 Meeting attendance
Andrew Coombs(1) (Chairman) 1/1James Peggie 1/1Jill May 1/1Justin Atkinson 1/1
(1) Andrew Coombs was appointed as Chairman of the Committee on 19 March 2018.

Role and responsibilitiesThe role of the Social & Ethics Committee is to consider and make recommendations to the Board in relation to the critical dimensions of how the Company does business, specifically its value system surrounding ethical standards and social responsibility.
The Committee shall:
» review the effectiveness of the Company’s systems for monitoring compliance with relevant legislation, legal requirements and/or codes of best practice;
» identify and monitor the non-financial aspects relevant to the business of the Company and review appropriate non-financial information that goes beyond assessing the financial and quantitative performance of the Company;
» review the effectiveness of the Company’s dealing with safety, health and environment (“SHE”) issues and to provide the necessary guidance in developing and approving the policy, strategy and structure to manage SHE issues;
» review the effectiveness of the Company’s environmental strategy regarding:
» the taking of reasonable measures to prevent significant pollution or degradation to the environment from occurring, continuing or recurring; and
» minimising and rectifying pollution or degradation that has already been caused;
» draw matters within its mandate to the attention of the Board as occasion requires; and
» report, through one of its members, to the shareholders at the Company’s Annual General Meeting, or in the Company’s Annual Report, on the matters within its mandate.
Andrew CoombsChairman of the Social & Ethics Committee1 June 2018
71Sirius Real Estate Limited Annual Report and Accounts 2018

The Directors submit their report with the audited financial statements for the year ended 31 March 2018. A review of the Group’s business and results for the year is contained in the Chairman’s statement, the Asset Management review and the financial review which should be read in conjunction with this report.
The Directors have complied with the provisions of the Companies (Guernsey) Law, 2008 in preparing the financial statements.
The Directors submit their report together with the Group’s consolidated statement of comprehensive income, consolidated statement of financial position, consolidated statement of changes in equity, consolidated statement of cash flows and related notes for the financial year ended 31 March 2018, which have been prepared in accordance with International Financial Reporting Standards (“IFRS”) as adopted by the European Union (“EU”) and in accordance with any relevant enactment for the time being in force, and are in agreement with accounting records, which have been properly kept in accordance with Section 238 of the Companies (Guernsey) Law, 2008.
Business of the GroupSirius Real Estate Limited is the Group’s holding company. The principal activity of its operating subsidiaries is the investment in, and development of, commercial property to provide conventional and flexible workspace in Germany.
Results for the yearThese results are set out in the consolidated statement of comprehensive income on page 80.
The Group’s profit after tax attributable to the equity holders of the Company for the year was €81.3 million (2017: €66.9 million).
The Board has declared a final dividend of 1.60c per share for the second half of the year ended 31 March 2018 representing 75% of FFO(1). The final dividend will be paid on 17 August 2018, with the ex-dividend dates being 11 July 2018 for shareholders on the South African register and 12 July 2018 for shareholders on the UK register. It is intended that this dividend will be paid in cash or at the shareholders’ election may be taken in shares by way of a scrip alternative. Dividends will continue to be paid in cash on a semi-annual basis and shareholders may also be offered a scrip alternative.
(1) Adjusted profit before tax adjusted for depreciation, amortisation of financing fees and current tax receivable/incurred.
Going concern and viability statementThe Directors have examined significant areas of possible financial risk and have reviewed cash flow forecasts and compliance with debt covenants, in particular the loan to value covenants and interest cover ratios on each of the Group’s financing commitments.
They have not identified any material uncertainties which would cast significant doubt on the Group’s ability to continue as a going concern for a period of not less than twelve months from the date of the approval of the financial statements. The Directors have satisfied themselves that the Group has adequate resources to continue in operational existence for the next twelve months. After due consideration, the Board believes it is appropriate to adopt the going concern basis in preparing the financial statements.
The viability statement can be found on page 46. The Group’s activities, strategy and performance are explained in the strategic report from page 2. Further details of the financial performance and financial position of the Group are provided in the financial statements on pages 80 to 112.
Valuation and net assets(i) ValuationCushman & Wakefield LLP (2017: Cushman & Wakefield LLP) valued the Group’s investment properties, excluding assets held for sale, at €917.3 million as at 31 March 2018 (2017: €735.3 million). After adjusting investment properties for lease incentive accounting the value of investment properties is shown as €913.8 million (2017: €727.3 million) in the consolidated statement of financial position.
(ii) Net assetsThe investment property valuation has been incorporated into the financial statements for the year ended 31 March 2018 and the net assets of the Group at that date amounted to €625.6 million (2017: €495.3 million).
72 Sirius Real Estate Limited Annual Report and Accounts 2018Governance
Directors’ report

DirectorsDate appointed
Wessel Hamman 17 May 2011James Peggie 28 November 2012Andrew Coombs 1 May 2014Alistair Marks 1 May 2014Justin Atkinson 13 March 2017Jill May 27 November 2017
Robert Sinclair retired from the Board and all Committees at the AGM on 22 September 2017.
Neil Sachdev resigned from the Board and all Committees with effect from 31 December 2017.
James Peggie took up the role of Acting Chairman and Chairman of the Nomination Committee with effect from 1 January 2018 and joined the Social & Ethics Committee on 19 January 2018.
Andrew Coombs joined the Social & Ethics Committee on 19 January and was appointed as Chairman of the Social & Ethics Committee on 19 March 2018.
Justin Atkinson joined the Audit Committee on 19 May 2017 and was appointed as Chairman of the Audit Committee on 22 September 2017. He joined the Remuneration, Nomination and Social & Ethics Committees on 19 January 2018.
Jill May joined the Board on 27 November 2017 as a Non-executive Director and joined the Remuneration, Nomination and Social & Ethics Committees on 19 January 2018.
Substantial shareholdersAt 31 March 2018, the following shareholders had substantial interests in the issued share capital of the Company:
Shareholder
Number ofordinary shares
in whichinterested
% of issuedshare capital
of theCompany
BlackRock Inc 90,706,622 9.15%Woodford Investment Management 70,116,777 7.07%Old Mutual Investment Group 67,959,649 6.86%Mstead Limited 58,579,687 5.91%BMO Global Asset Management 40,670,924 4.10%Investec Group 39,145,468 3.95%Coronation Fund Managers 29,873,343 3.01%
As at 31 March 2018 eleven non-public owners held 1.06% of shares (twelve holders and 1.12% including treasury shares) which includes those shares held by Executive and Non-executive Directors (and the entity that holds the treasury shares) and 8,553 public shareholders holding 98.88%.
Treasury operations and financial instrumentsThe Group’s policy in relation to financial risk management and the use of financial instruments is set out in notes 21 and 22 to the financial statements.
Statement of Directors’ responsibilities in respect of the annual report and the financial statementsThe directors are responsible for preparing the Annual Report and financial statements in accordance with applicable law and regulations.
Company law requires the directors to prepare financial statements for each financial year. Under that law they are required to prepare the financial statements in accordance with International Financial Reporting Standards as adopted by the EU and applicable law.
Under company law the directors must not approve the financial statements unless they are satisfied that they give a true and fair view of the state of affairs of the Company and of its profit or loss for that period.
In preparing these financial statements, the directors are required to:
» select suitable accounting policies and then apply them consistently;
» make judgements and estimates that are reasonable, relevant and reliable;
» state whether applicable accounting standards have been followed, subject to any material departures disclosed and explained in the financial statements;
» assess the Company’s ability to continue as a going concern, disclosing, as applicable, matters related to going concern; and
» use the going concern basis of accounting unless they either intend to liquidate the Company or to cease operations, or have no realistic alternative but to do so.
73Sirius Real Estate Limited Annual Report and Accounts 2018

Statement of Directors’ responsibilities in respect of the annual report and the financial statements continuedThe Directors are responsible for keeping proper accounting records that are sufficient to show and explain the Company’s transactions and disclose with reasonable accuracy at any time the financial position of the Company and enable them to ensure that its financial statements comply with the Companies (Guernsey) Law, 2008. They are responsible for such internal control as they determine is necessary to enable the preparation of financial statements that are free from material misstatement, whether due to fraud or error, and have general responsibility for taking such steps as are reasonably open to them to safeguard the assets of the Company and to prevent and detect fraud and other irregularities.
The directors are responsible for the maintenance and integrity of the corporate and financial information included on the company’s website. Legislation in the Guernsey governing the preparation and dissemination of financial statements may differ from legislation in other jurisdictions.
The Directors who hold office at the date of approval of this Director’s Report confirm that so far as they are aware, there is no relevant audit information of which the Company’s auditor is unaware, and that each Director has taken all the steps he ought to have taken as a director to make himself aware of any relevant audit information and to establish that the Company’s auditor is aware of that information.
Responsibility statement of the directors in respect of the annual financial report We confirm that to the best of our knowledge:
» the financial statements, prepared in accordance with the applicable set of accounting standards, give a true and fair view of the assets, liabilities, financial position and profit or loss of the company; and
» the strategic report includes a fair review of the development and performance of the business and the position of the issuer, together with a description of the principal risks and uncertainties that they face.
We consider the annual report and accounts, taken as a whole, is fair, balanced and understandable and provides the information necessary for shareholders to assess the Company’s position and performance, business model and strategy.
Corporate governanceThe Board has resolved that the disclosures to be made in the Annual Report regarding the operation of the Board and its sub-committees should comply with the requirements of the UK Corporate Governance Code, the Companies (Guernsey) Law, 2008, the King IV Code and best practice generally.
The Board of DirectorsThe Directors are responsible for the Group’s system of internal control and for reviewing its effectiveness. The risk management process and system of internal control are designed to manage rather than eliminate the risk of failure to achieve the Group’s objectives.
Any such system of internal control can only provide reasonable, but not absolute, assurance against material misstatement or loss. The Board believes it has an appropriate balance of skills and experience.
Board meetings follow a formal agenda of matters reserved for decision and approval by the Board and also address any special business. Matters reserved for the Board include the review of strategy, the review and monitoring of internal controls and risk management processes, the approval of significant investments and disposals, the approval of budgets, and the regular review of current trading and the financial position of the Group.
The Board receives regular reports on current trading and the financial position and forecasts of the Group prior to its meetings. In addition, the Board receives relevant information on business, corporate and strategic issues.
All Directors may take independent professional advice at the Group’s expense in the furtherance of their duties and have full access to the Company Secretary.
The Chairman meets regularly with the other Non-executive Directors to discuss the performance of the Board and the Board sub-committees. The performance of Executive Directors is measured against predetermined objectives that are agreed with each Executive Director at the start of the financial year.
74 Sirius Real Estate Limited Annual Report and Accounts 2018Governance
Directors’ report continued

Directors’ attendanceOf the 24 meetings held four were scheduled and the remainder were Board Committee meetings, Board telephone meetings or email resolutions. The majority of ad hoc meetings were held by telephone.
Meetings attended to 31 March 2018James
Peggie (1)
WesselHamman
JustinAtkinson (2)
AndrewCoombs (3)
AlistairMarks
Jill May (4)
NeilSachdev (5)
RobertSinclair (6)
Executive No No No Yes Yes No No NoNon-executive Yes Yes Yes n/a n/a Yes Yes YesIndependent Yes No Yes No No Yes Yes YesBoard 21/24 13/24 19/24 20/24 22/24 6/24 12/24 6/24Audit Committee 4/4 4/4 4/4 n/a n/a 1/4 2/4 1/4Nomination Committee 1/1 1/1 n/a n/a n/a n/a 1/1 n/aRemuneration Committee 4/4 4/4 2/4 n/a n/a 2/4 2/4 2/4Social & Ethics Committee(7) 1/1 n/a 1/1 1/1 n/a 1/1 n/a n/a
(1) James Peggie was appointed as Acting Chairman and Chairman of the Nomination Committee on 1 January 2018 and joined the Social & Ethics Committee on 19 January 2018.
(2) Justin Atkinson was appointed to the Audit Committee on 19 May 2017 and was appointed as the Audit Committee Chairman on 22 September 2017. He was also appointed to the Nomination, Remuneration and Social & Ethics Committees on 19 January 2018.
(3) Andrew Coombs was appointed to the Social & Ethics Committee on 19 January 2018 and appointed as Chairman of the Social & Ethics Committee on 19 March 2018.
(4) Jill May was appointed as a Non-executive Director on 27 November 2017 and was appointed to the Nomination, Remuneration, Audit and Social & Ethics Committees on 19 January 2018.
(5) Neil Sachdev was appointed on 6 July 2016 and resigned on 31 December 2017.
(6) Robert Sinclair retired from the Board at the AGM on 22 September 2017.
(7) The Social & Ethics Committee was formed on 19 January 2018.
Auditors and disclosure of information to auditorsThe Directors who held office at the date of approval of the financial statements confirm that, so far as they are each aware:
» there is no relevant audit information of which the Group’s auditors are unaware; and
» each Director has taken all the steps that he ought to have taken as a Director to make himself aware of any relevant audit information and to establish that the Group’s auditors are aware of that information.
KPMG LLP London will not offer themselves up for re-election as the Company’s auditors at the next Annual General Meeting. The Board considered that due to the length of time KPMG had acted as audit firm to the Company that a formal audit tender process would be undertaken during the reporting period. Following the completion of the audit tender process the Company advises that Ernst & Young LLP will be proposed as the new audit firm at the next Annual General Meeting.
Company websiteThe Directors are responsible for the maintenance and integrity of the corporate and financial information included on the Company’s website and for the preparation and dissemination of financial statements. Legislation in Guernsey governing the preparation and dissemination of financial statements may differ from legislation in other jurisdictions.
By order of the Board
Aoife BennettCompany Secretary1 June 2018
75Sirius Real Estate Limited Annual Report and Accounts 2018

77 Independent auditors’ report
80 Consolidated statement of comprehensive income
81 Consolidated statement of financial position
82 Consolidated statement of changes in equity
83 Consolidated statement of cash flows
84 Notes to the financial statements
113 Business analysis
115 Glossary of terms
116 Corporate directory
Financial statements

1. Our opinion is unmodified We have audited the Group financial statements of Sirius Real Estate Limited for the year ended 31 March 2018 which comprise the consolidated statement of comprehensive income, the consolidated statement of financial position, the consolidated statement of changes in equity, the consolidated statement of cash flows and the related notes, including the accounting policies in note 2.
In our opinion, the group financial statements:
» give a true and fair view of the financial position of the group as at 31 March 2018 and of its profit for the year then ended;
» are in accordance with International Financial Reporting Standards as adopted by the EU; and
» comply with the Companies (Guernsey) Law, 2008.
Basis for opinion We conducted our audit in accordance with International Standards on Auditing (UK) (“ISAs (UK”)) and applicable law. Our responsibilities are described below. We have fulfilled our ethical responsibilities under, and are independent of the Group in accordance with, UK ethical requirements including FRC Ethical Standards as applied to listed entities. We believe that the audit evidence we have obtained is a sufficient and appropriate basis for our opinion.
2. Key audit matters: our assessment of risks of material uncertainty Key audit matters are those matters that, in our professional judgement, were of most significance in the audit of the financial statements and include the most significant assessed risks of material misstatement (whether or not due to fraud) identified by us, including those which had the greatest effect on: the overall audit strategy; the allocation of resources in the audit; and directing the efforts of the engagement team. These matters were addressed in the context of our audit of the financial statements as a whole, and in forming our opinion thereon, and we do not provide a separate opinion on these matters. In arriving at our audit opinion above on the financial statements, the key audit matter was as follows:
Valuation of investment properties (no change in risk):
» €913.8 million (2017: €727.3 million).
» Refer to page 54 (Audit Committee report), note 2(k) on page 86 (accounting policy) and note 13 on page 96 (financial disclosures).
The risk Subjective valuation Investment properties balance represents 86% (2017: 81%) of the Group’s total assets. Investment properties are held at fair value in the financial statements.
The portfolio comprises 52 (2017: 45) properties which are externally valued by qualified independent valuers Cushman & Wakefield and held at fair value at the balance sheet date.
Each property’s fair value will be impacted by a number of factors including location, contracted and future potential rental income, quality and condition of the building, tenant covenant and market yields.
Whilst comparable market transactions provide good valuation evidence, the individual nature of each property means that a key factor in the property valuations are the assumptions used which involve significant levels of judgement.
Our response Our procedures included:
Evaluating valuer’s credentials We assessed Cushman & Wakefield’s objectivity, professional qualifications and resources through discussions with the valuer, and reading its valuation report.
Methodology choice We held discussions with the Cushman & Wakefield to determine the valuation methodology used. We used our own property valuation specialist to assist us in critically assessing the results of the valuer’s report by checking that the valuations are in accordance with the RICS Valuation Professional Standards (“The Red Book”) and relevant accounting standards and that the methodology adopted was appropriate by reference to acceptable valuation practice.
Benchmarking assumptions With the assistance of our own property valuation specialist, we held discussions with Cushman & Wakefield to understand the assumptions and methodologies used. For a sample of properties, we challenged the key assumptions upon which the valuations are based including those relating to forecast rents, yields, vacant periods and irrecoverable expenditure by making a comparison to our own understanding of the market and to industry benchmarks. The key assumptions are affected by subjective assessments of a number of factors including location, quality and condition of the building as well as tenant credit rating.
77Sirius Real Estate Limited Annual Report and Accounts 2018
Independent auditors’ report
to the members of Sirius Real Estate Limited

2. Key audit matters: our assessment of risks of material uncertainty continuedThe risk continuedTest of detail We compared the information provided by the Group to Cushman & Wakefield, for a sample, such as lease data, rental income and property costs as used in the valuation to the property database to supporting documents including lease agreements and purchase agreements.
Assessing transparency We considered the adequacy of disclosures about the degree of estimation and sensitivity to key assumptions made when valuing properties.
3. Our application of materiality and an overview of the scope of our audit Materiality for the financial statements as a whole was set at €9.4 million (2017: €5.9 million), determined with reference to a benchmark of Group gross assets of €1,064.5 million (2017: €892.8 million), of which it represents 0.9% (2017: 0.7%).
In addition, in the current year we applied lower specific materiality of €2.4 million to all balances and classes of transactions that do not impact the investment property balance for which we believe misstatement of lesser amounts than materiality for the financial statements as a whole can be reasonably expected to influence the Company’s members’ assessment of the financial performance of the Group. The specific materiality has been based on the funds from operations (an adjusted profit before tax figure) as described in note 25 to the financial statements.
We reported to the Audit Committee any corrected or uncorrected identified misstatements exceeding €0.5 million (2017: €0.3 million) or €0.1 million for misstatements relating to procedures performed to the lower specific materiality, in addition to other identified misstatements that warranted reporting on qualitative grounds. Our audit of the Group was undertaken to the materiality level specified above, which has informed our identification of significant risks of material misstatement and the associated audit procedures performed in those areas as detailed above.
The Group team performed the audit of the Group as if it were a single aggregated set of financial information. The audit was performed using the materiality level set out above and covered 100% (2017: 100%) of total Group revenue, Group profit before tax, total Group assets and total Group liabilities.
4. We have nothing to report on going concern We are required to report to you if we have concluded that the use of the going concern basis of accounting is inappropriate or there is an undisclosed material uncertainty that may cast significant doubt over the use of that basis for a period of at least twelve months from the date of approval of the financial statements. We have nothing to report in this respect.
5. We have nothing to report on the other information in the Annual Report The Directors are responsible for the other information presented in the Annual Report together with the financial statements. Our opinion on the financial statements does not cover the other information and, accordingly, we do not express an audit opinion or, except as explicitly stated below, any form of assurance conclusion thereon.
Our responsibility is to read the other information and, in doing so, consider whether, based on our financial statements audit work, the information therein is materially misstated or inconsistent with the financial statements or our audit knowledge. Based solely on that work we have not identified material misstatements in the other information.
Disclosures of principal risks and longer-term viability Based on the knowledge we acquired during our financial statements audit, we have nothing material to add or draw attention to in relation to:
» the Directors’ confirmation within the viability statement on page 46 that they have carried out a robust assessment of the principal risks facing the Group, including those that would threaten its business model, future performance, solvency and liquidity;
» the principal risk and uncertainties disclosures describing these risks and explaining how they are being managed and mitigated; and
» the Directors’ explanation in the viability statement of how they have assessed the prospects of the Group, over what period they have done so and why they considered that period to be appropriate, and their statement as to whether they have a reasonable expectation that the Group will be able to continue in operation and meet its liabilities as they fall due over the period of their assessment, including any related disclosures drawing attention to any necessary qualifications or assumptions.
78 Sirius Real Estate Limited Annual Report and Accounts 2018Financial statements
Independent auditors’ report continued
to the members of Sirius Real Estate Limited

5. We have nothing to report on the other information in the Annual Report continuedCorporate governance disclosures We are required to report to you if:
» we have identified material inconsistencies between the knowledge we acquired during our financial statements audit and the Directors’ statement that they consider that the Annual Report and financial statements taken as a whole is fair, balanced and understandable and provides the information necessary for shareholders to assess the Group’s position and performance, business model and strategy; or
» the section of the Annual Report describing the work of the Audit Committee does not appropriately address matters communicated by us to the Audit Committee.
We are required to report to you if the corporate governance statement does not properly disclose a departure from the eleven provisions of the 2016 UK Corporate Governance Code specified by the Listing Rules for our review.
We have nothing to report to you in these respects.
6. We have nothing to report in respect of the matters on which we are required to report by exception Under the Companies (Guernsey) Law, 2008, we are required to report to you if, in our opinion:
» the Company has not kept proper accounting records;
» the financial statements are not in agreement with the accounting records; or
» we have not received all the information and explanations, which to the best of our knowledge and beliefs are necessary for the purposes of our audit.
7. Respective responsibilities Directors’ responsibilities As explained more fully in their statement set out on page 72, the Directors are responsible for: the preparation of the financial statements including being satisfied that they give a true and fair view; such internal control as they determine is necessary to enable the preparation of financial statements that are free from material misstatement, whether due to fraud or error; assessing the Group’s ability to continue as a going concern, disclosing, as applicable, matters related to going concern; and using the going concern basis of accounting unless they either intend to liquidate the Group or to cease operations, or have no realistic alternative but to do so.
Auditors’ responsibilities Our objectives are to obtain reasonable assurance about whether the financial statements as a whole are free from material misstatement, whether due to fraud or error, and to issue our opinion in an auditors’ report. Reasonable assurance is a high level of assurance, but does not guarantee that an audit conducted in accordance with ISAs (UK) will always detect a material misstatement when it exists. Misstatements can arise from fraud or error and are considered material if, individually or in aggregate, they could reasonably be expected to influence the economic decisions of users taken on the basis of the financial statements.
A fuller description of our responsibilities is provided on the FRC’s website at www.frc.org.uk/auditorsresponsibilities.
8. The purpose of this report and restrictions on its use by persons other than the Company’s members as a body This report is made solely to the Company’s members, as a body, in accordance with Section 262 of the Companies (Guernsey) Law, 2008. Our audit work has been undertaken so that we might state to the Company’s members those matters we are required to state to them in an auditors’ report and for no other purpose. To the fullest extent permitted by law, we do not accept or assume responsibility to anyone other than the Company and the Company’s members, as a body, for our audit work, for this report, or for the opinions we have formed.
Mike Woodward for and on behalf of KPMG LLP Chartered Accountants and Recognised Auditors 15 Canada Square, London E14 5GL 1 June 2018
79Sirius Real Estate Limited Annual Report and Accounts 2018

Notes
Year ended31 March 2018
€000
Year ended31 March 2017
€000
Rental income 5 72,139 68,793Direct costs 6 (9,067) (8,267)
Net operating income 63,072 60,526Surplus on revaluation of investment properties 13 63,452 49,782(Loss)/gain on disposal of properties 6 (2,502) 79Administrative expenses 6 (24,184) (23,883)
Operating profit 99,838 86,504
Finance income 9 13 23Finance expense 9 (10,246) (10,224)Change in fair value of derivative financial instruments 43 133
Net finance costs (10,190) (10,068)
Profit before tax 89,648 76,436Taxation 10 (8,285) (9,500)
Profit for the year 81,363 66,936
Profit attributable to:Owners of the Company 81,272 66,911Non-controlling interest 91 25
Total comprehensive income for the year 81,363 66,936
Earnings per shareBasic earnings per share 11 8.89c 8.13cDiluted earnings per share 11 8.65c 7.90c
Basic EPRA earnings per share 11 3.04c 3.18cDiluted EPRA earnings per share 11 2.96c 3.09c
80 Sirius Real Estate Limited Annual Report and Accounts 2018Financial statements
Consolidated statement of comprehensive income
for the year ended 31 March 2018

Notes31 March 2018
€00031 March 2017
€000
Non-current assets Investment properties 13 913,843 727,295Plant and equipment 15 3,126 2,564Goodwill 16 3,738 3,738Deferred tax assets 10 811 240
Total non-current assets 921,518 733,837
Current assetsInvestment properties held for sale 14 17,325 96,000Trade and other receivables 17 45,063 14,290Cash and cash equivalents 18 79,605 48,695Total current assets 141,993 158,985
Total assets 1,063,511 892,822
Current liabilitiesTrade and other payables 19 (40,972) (33,963)Interest-bearing loans and borrowings 20 (7,844) (7,068)Current tax liabilities (3,045) (465)Derivative financial instruments (6) (7)
Total current liabilities (51,867) (41,503)
Non-current liabilitiesInterest-bearing loans and borrowings 20 (359,234) (334,724)Derivative financial instruments (292) (334)Deferred tax liabilities 10 (26,485) (20,993)
Total non-current liabilities (386,011) (356,051)
Total liabilities (437,878) (397,554)
Net assets 625,633 495,268
Equity Issued share capital 23 — —Other distributable reserve 24 519,320 470,318Retained earnings 106,141 24,869
Total equity attributable to the equity holders of the Company 625,461 495,187Non-controlling interests 172 81
Total equity 625,633 495,268
EPRA net asset value per share 12 64.18c 57.84c
The financial statements on pages 80 to 112 were approved by the Board of Directors on 1 June 2018 and were signed on its behalf by:
Alistair MarksChief Financial Officer
Company number: 46442
81Sirius Real Estate Limited Annual Report and Accounts 2018
Consolidated statement of financial position
as at 31 March 2018

Issuedshare
capital€000
Otherdistributable
reserve€000
Retainedearnings
€000
Total equityattributable to
the equityholders of the
Company€000
Non-controllinginterests
€000
Totalequity€000
As at 31 March 2016 — 429,094 (42,042) 387,052 56 387,108Shares issued, net of costs — 43,620 — 43,620 — 43,620Share-based payment transactions — 4,289 — 4,289 — 4,289Conversion of shareholder loan — 5,000 — 5,000 — 5,000Dividends paid — (11,685) — (11,685) — (11,685)Total comprehensive income for the year — — 66,911 66,911 25 66,936
As at 31 March 2017 — 470,318 24,869 495,187 81 495,268Shares issued, net of costs — 63,352 — 63,352 — 63,352Share-based payment transactions — 3,674 — 3,674 — 3,674Dividends paid — (18,024) — (18,024) — (18,024)Total comprehensive income for the year — — 81,272 81,272 91 81,363
As at 31 March 2018 — 519,320 106,141 625,461 172 625,633
82 Sirius Real Estate Limited Annual Report and Accounts 2018Financial statements
Consolidated statement of changes in equity
for the year ended 31 March 2018

Notes
Year ended31 March
2018€000
Year ended31 March
2017€000
Operating activitiesProfit after tax 81,272 66,911Taxation 10 8,285 9,500Non-controlling interests 91 25Loss/(gain) on sale of properties 6 2,502 (79)Share-based payments 6 4,310 4,290Surplus on revaluation of investment properties 13 (63,452) (49,782)Change in fair value of derivative financial instruments (43) (133)Depreciation 6 1,086 868Finance income 9 (13) (23)Finance expense 9 8,898 9,795Exit fees/prepayment penalties 9 1,348 428
Cash flows from operations before changes in working capital 44,284 41,800Changes in working capital(Increase)/decrease in trade and other receivables (2,730) 4,984Increase in trade and other payables 2,271 3,168Taxation paid (756) (17)
Cash flows from operating activities 43,069 49,935
Investing activitiesPurchase of investment properties (121,252) (76,265)Prepayments relating to new acquisitions 17 (34,585) (6,547)Capital expenditure (19,104) (16,540)Purchase of plant and equipment 15 (1,649) (1,523)Net proceeds on disposal of properties 102,510 7,201Interest received 6 13 23
Cash flows used in investing activities (74,067) (93,651)
Financing activitiesIssue of shares 63,352 43,620Dividends paid 25 (18,024) (11,685)Proceeds from loans 20 78,930 211,500Repayment of loans (53,551) (159,077)Exit fees/prepayment penalties (1,348) (428)Finance charges paid (7,451) (11,393)
Cash flows from financing activities 61,908 72,537
Increase in cash and cash equivalents 30,910 28,821Cash and cash equivalents at the beginning of the year 48,695 19,874
Cash and cash equivalents at the end of the year 18 79,605 48,695
83Sirius Real Estate Limited Annual Report and Accounts 2018
Consolidated statement of cash flows
for the year ended 31 March 2018

1. General informationSirius Real Estate Limited (the “Company”) is a company incorporated in Guernsey and resident in the United Kingdom, whose shares are publicly traded on the Main Markets of the London Stock Exchange (“LSE”) (primary listing) and the Main Board of the Johannesburg Stock Exchange (“JSE”) (primary listing).
The consolidated financial information of the Company comprises that of the Company and its subsidiaries (together referred to as the “Group”) for the year ended 31 March 2018.
The principal activity of the Group is the investment in, and development of, commercial property to provide conventional and flexible workspace in Germany.
2. Significant accounting policies (a) Basis of preparationThe consolidated financial information has been prepared on a historical cost basis, except for investment properties, investment properties held for sale and derivative financial instruments, which have been measured at fair value. The consolidated financial information is presented in euros and all values are rounded to the nearest thousand (€000) except where otherwise indicated. The functional currency of the Group is euro.
(b) Statement of complianceThe consolidated financial information has been prepared in accordance with the requirements of the Listing Rules of the UK Listing Authority, and in accordance with IFRS adopted for use in the EU (“Adopted IFRS”); the Companies (Guernsey) Law, 2008; the SAICA Financial Reporting Guides, as issued by the Accounting Practices Committee; the Financial Reporting Pronouncements, as issued by the Financial Reporting Standards Council; and the JSE Ltd Listing Requirements. The consolidated financial statements give a true and fair view and are in compliance with the Companies (Guernsey) Law, 2008.
(c) Going concernHaving reviewed the Group’s current and future trading, cash flow and covenant forecasts, together with sensitivities and exercisable mitigating factors and the available facilities, the Board has a reasonable expectation that the Group has adequate resources to continue in operational existence for the next twelve months. Accordingly, the Board continued to adopt the going concern basis in preparing the historical financial information.
(d) Basis of consolidationThe consolidated financial information comprises the financial information of the Group as at 31 March 2018. The financial information of the subsidiaries is prepared for the same reporting period as the Company, using consistent accounting policies.
All intra-group balances and transactions and any unrealised income and expenses arising from intra-group transactions are eliminated in preparing the consolidated financial statements.
Subsidiaries are fully consolidated from the date of acquisition, being the date on which the Group obtains control, and continue to be consolidated until the date that such control ceases.
Non-controlling interests represent the portion of profit or loss and net assets not held by the Group and are presented separately in the consolidated statement of comprehensive income and within equity in the consolidated statement of financial position, separately from the Company’s shareholders’ equity.
(e) AcquisitionsInvestment property acquisitions that are not accounted for as business combinations under IFRS 3 are dealt with as acquisitions of investment property assets.
(f) Foreign currency translationThe consolidated financial information is presented in euros, which is the functional and presentational currency of all members of the Group.
Transactions in foreign currencies are initially recorded in the functional currency at the exchange rate ruling at the date of the transaction. Monetary assets and liabilities denominated in foreign currencies are retranslated into the functional currency at the exchange rate ruling at the statement of financial position date. All differences are taken to the statement of comprehensive income.
(g) Revenue recognition Revenue is recognised to the extent that it is probable that the economic benefits will flow to the Group and the revenue can be reliably measured. In particular:
Rental incomeRental income from operating leases is recognised on a straight-line basis over the term of the relevant lease unless another systematic basis is more representative of the time pattern in which the benefit derived from the leased asset is diminished.
Fixed or determinable rental increases, which can take the form of actual amounts or agreed percentages, are recognised on a straight-line basis over the term of material leases. If the increases are related to a price index to cover inflationary cost increases then the policy is not to spread the amount but to recognise them when the increase takes place.
84 Sirius Real Estate Limited Annual Report and Accounts 2018Financial statements
Notes to the financial statements
for the year ended 31 March 2018Notes to the financial statements
for the year ended 31 March 2018

2. Significant accounting policies continued(g) Revenue recognition continuedRental income continuedThe value of rent free periods and all similar lease incentives is spread on a straight-line basis over the term of material leases only. Where there is a reasonable expectation that the tenant will exercise break options, the value of rent free periods and all similar lease incentives is booked up to the break date.
Interest incomeInterest income is recognised as it accrues (using the effective interest method, which is the rate that exactly discounts estimated future cash receipts through the expected life of the financial instrument).
Service chargesService charge income receivable is not treated as revenue; rather, it is set off against the direct costs to which such income relates.
(h) LeasesGroup as lessorLeases where the Group does not transfer substantially all the risks and benefits of ownership of the asset are classified as operating leases.
(i) Income taxCurrent income taxCurrent income tax assets and liabilities are measured at the reporting date at the amount expected to be recovered from or paid to the taxation authorities. The tax rates and tax laws used to compute the amount are those that are enacted or substantively enacted by the reporting date.
Certain subsidiaries may be subject to foreign taxes in respect of foreign sources of income. Sirius Real Estate Limited is UK resident for tax purposes.
Deferred income taxDeferred income tax is recognised on all temporary differences arising between the tax bases of assets and liabilities and their carrying amounts in the consolidated financial statements, with the following exceptions:
» where the temporary difference arises from the initial recognition of goodwill or of an asset or liability in a transaction that is not a business combination that at the time of the transaction affects neither accounting nor taxable profit or loss;
» in respect of taxable temporary differences associated with investments in subsidiaries, where the timing of the reversal of the temporary differences can be controlled and it is probable that the temporary differences will not reverse in the foreseeable future; and
» deferred tax assets are only recognised to the extent that it is foreseeable that taxable profit will be available against which the deductible temporary differences, carried forward tax credits or tax losses can be utilised.
Deferred income tax assets and liabilities are measured on an undiscounted basis at the tax rates that are expected to apply in the year when the related asset is realised or the liability is settled, based on tax rates (and tax laws) that have been enacted or substantively enacted at the reporting date.
(j) Sales taxRevenues, expenses and assets are recognised net of the amount of sales tax except:
» where the sales tax incurred on a purchase of assets or services is not recoverable from the taxation authority, in which case the sales tax is recognised as part of the cost of acquisition of the asset or as part of the expense item as applicable; and
» receivables and payables that are stated with the amount of sales tax included.
The net amount of sales tax recoverable from, or payable to, the taxation authority is included as part of receivables or payables in the statement of financial position.
(k) Investment propertiesInvestment properties are properties owned by the Group which are held for long-term rental income, capital appreciation or both.
Investment properties are initially recognised at cost, including transaction costs when legal ownership of the property is transferred. Where recognition criteria are met the carrying amount includes subsequent costs to add to or replace part of an investment property. Subsequent to initial recognition, investment properties are stated at fair value, which reflects market conditions at the reporting date.
Investment properties are derecognised when the risks and rewards of ownership of the asset are transferred to a third party.
Gains or losses arising from changes in the fair values of investment properties are included in profit or loss of the statement of comprehensive income in the period in which they arise.
The fair value of the Group’s investment properties at 31 March 2018 has been arrived at on the basis of a valuation carried out at that date by Cushman & Wakefield LLP (2017: Cushman & Wakefield LLP), an independent valuer. The valuations are in accordance with standards complying with the Royal Institute of Chartered Surveyors’ (“RICS’s”) approval and the conceptual framework that has been settled by the International Valuation Standards Committee.
85Sirius Real Estate Limited Annual Report and Accounts 2018

2. Significant accounting policies continued(k) Investment properties continuedThe valuation is based upon assumptions including future rental income, anticipated non-recoverable and maintenance costs, expected capital expenditure and an appropriate discount rate. The properties are valued on the basis of a discounted cash flow model using a range of 10–14 years supported by comparable evidence. The discounted cash flow calculation is a valuation of rental income considering non-recoverable costs and applying a discount rate for the current income risk over the measurement period. At the end of the period in which the cash flow is modelled, a determining residual value (exit scenario) is calculated. A capitalisation rate is applied to the more uncertain future income, discounted to present value. Each property is visited by the external valuer at least once every two years. The information provided to and assumptions made by the external valuer have not materially changed in the year.
Directors can make discretionary impairments of non-core assets when strong evidence exists to support an adjustment. In such circumstances the Audit Committee performs a review and satisfies itself the impairment can be fully substantiated and appropriately supported before a write-down is recognised in the Company’s books and records.
(l) Disposals of investment propertyInvestment property disposals are recognised in the financial information on the date of completion. Profit or loss arising on disposal of investment properties is calculated by reference to the most recent carrying value of the asset adjusted for subsequent capital expenditure.
(m) Investment properties held for saleInvestment properties held for sale are separately disclosed at the asset’s fair value. In order for an investment property held for sale to be recognised, the following conditions must be met:
» the asset must be available for immediate sale in its present condition and location;
» the asset is being actively marketed;
» the asset’s sale is expected to be completed within twelve months of classification as held for sale;
» there must be no expectation that the plan for selling the asset will be withdrawn or changed significantly; and
» the successful sale of the asset must be highly probable.
(n) Plant and equipmentRecognition and measurementItems of plant and equipment are stated at cost less accumulated depreciation and impairment losses.
DepreciationWhere parts of an item of plant and equipment have different useful lives, they are accounted for as separate items of plant and equipment.
Depreciation is charged in the statement of comprehensive income on a straight-line basis over the estimated useful lives of each part of an item of the fixed assets. The estimated useful lives are as follows:
Plant and equipment four to ten years
Fixtures and fittings four years
Depreciation methods, useful lives and residual values are reviewed at each reporting date.
(o) GoodwillGoodwill arising on consolidation represents the excess of the cost of the purchase consideration over the Group’s interest in the fair value of the identifiable assets and liabilities of a subsidiary at the date of acquisition.
Goodwill is initially recognised at cost and is subsequently measured at cost less any accumulated impairment losses. Goodwill is not amortised but is tested annually for impairment, or more frequently when there is an indication that the business to which the goodwill applies may be impaired.
(p) Trade receivablesTrade receivables are recognised initially at fair value and are subsequently measured at amortised cost using the effective interest method, less an allowance for impairment.
(q) Treasury SharesOwn equity instruments which are reacquired (“Treasury Shares”) are deducted from equity. No gain or loss is recognised in the statement of comprehensive income on the purchase, sale, issue or cancellation of the Group’s equity instruments.
(r) Share-based paymentsThe grant date fair value of share-based payment awards granted to employees is recognised as an employee expense, with a corresponding increase in equity, over the period that the employees unconditionally become entitled to the awards.
The amount recognised as an expense is adjusted to reflect the number of awards for which the related service and non-market vesting conditions are expected to be met, such that the amount ultimately recognised as an expense is based on the number of awards that meet the related service and non-market performance conditions at the vesting date.
86 Sirius Real Estate Limited Annual Report and Accounts 2018Financial statements
Notes to the financial statements continued
for the year ended 31 March 2018

2. Significant accounting policies continued(s) Cash and cash equivalentsCash and cash equivalents comprise cash at bank and in hand, demand deposits and other short-term, highly liquid investments with original maturities of three months or less that are readily convertible to a known amount of cash and are subject to an insignificant risk of change in value.
(t) Bank borrowings and costsInterest-bearing bank loans and borrowings are initially recorded at fair value, net of direct issue costs.
After initial recognition, interest-bearing loans and borrowings are subsequently measured at amortised cost using the effective interest method.
Borrowing costs directly attributable to the financing of assets are capitalised as part of the cost of the asset. All other borrowing costs are expensed in the period in which they occur. Borrowing costs consist of valuation, professional fees and other costs that an entity incurs in connection with the borrowing of funds.
(u) Trade payablesTrade payables are initially measured at fair value and are subsequently measured at amortised cost, using the effective interest rate method.
(v) Equity instrumentsEquity instruments issued by the Company are recorded at the proceeds received, net of direct issue costs.
(w) DividendsDividend distributions to the Company’s shareholders are recognised as a liability in the consolidated financial information in the period in which the dividends are approved by the Company’s Board. The final dividend relating to the year ended 31 March 2018 will be approved and recognised in the financial year ending 31 March 2019.
(x) Impairment excluding investment properties(i) Financial assetsA financial asset (excluding financial assets at fair value through profit and loss) is assessed at each reporting date to determine whether there is any objective evidence that it is impaired. A financial asset is considered to be impaired if objective evidence indicates that one or more events have had a negative effect on the estimated future cash flows of that asset. Objective evidence of impairment includes observable data that comes to the attention of the Group about one or more of the following loss events:
» significant financial difficulty of the debtor;
» excessive or persistent debtor ageing;
» a breach of contract, such as a default or delinquency in interest or principal payments; or
» it becomes probable that the debtor will enter bankruptcy or other financial reorganisation.
An impairment loss in respect of a financial asset measured at amortised cost is calculated as the difference between its carrying amount and the present value of the estimated future cash flows discounted at the original effective interest rate.
Individually significant financial assets are tested for impairment on an individual basis. The remaining financial assets are assessed collectively in groups that share similar credit risk characteristics.
All impairment losses are recognised in profit or loss of the statement of comprehensive income.
An impairment loss is reversed if the reversal can be related objectively to an event occurring after the impairment loss was recognised. For financial assets measured at amortised cost, the reversal is recognised in profit or loss of the statement of comprehensive income.
(ii) Non-financial assetsThe carrying amounts of the Group’s non-financial assets, other than investment property and deferred tax assets, are reviewed at each reporting date to determine whether there is any indication of impairment. If any such indication exists, then the asset’s recoverable amount is estimated.
The recoverable amount of an asset or cash-generating unit is the greater of its value in use and its fair value less costs to sell. In assessing value in use, the estimated future cash flows are discounted to their present value using a pre-tax discount rate that reflects current market assessments of the time value of money and the risks specific to the asset. For the purpose of impairment testing, assets are grouped together into the smallest group of assets that generate cash inflows from continuing use that are largely independent of the cash inflows of other assets or groups of assets (the “cash-generating unit”).
An impairment loss is recognised if the carrying amount of an asset or cash-generating unit exceeds its estimated recoverable amount. Impairment losses are recognised in profit or loss of the statement of comprehensive income. Impairment losses recognised in profit or loss in respect of cash-generating units are allocated first to reduce the carrying amount of any goodwill allocated to the units and then to reduce the carrying amount of the other assets in the unit (or group of units) on a pro rata basis.
87Sirius Real Estate Limited Annual Report and Accounts 2018

2. Significant accounting policies continued(y) Standards effective in the yearThe accounting policies adopted are consistent with those of the previous financial year. In the fiscal year 2017–2018, IFRS standards or IFRIC interpretations to be applied for the first time caused no material changes for the Group.
(z) Standards and interpretations in issue and not yet effectiveIFRS 9With the publication of the final version of IFRS 9 ‘Financial Instruments’ in July 2014, the IASB completed its project for replacing IAS 39 ‘Financial Instruments: Recognition and Measurement’. IFRS 9 provides a standardised approach for classification and measurement of financial assets and liabilities which is primarily based on the Company’s business model and the cash flows of the financial instrument. IFRS 9 contains three principal classification categories for financial assets: measured at amortised cost, FVOCI and FVTPL. The standard eliminates the existing IAS 39 categories of held to maturity, loans and receivables and available for sale.
In addition, IFRS 9 replaces the “incurred loss” model in IAS 39 with a forward-looking “expected credit loss” (“ECL”) model. This will require considerable judgement about how changes in economic factors affect ECLs, which will be determined on a probability-weighted basis. The new impairment model will apply to financial assets measured at amortised cost or FVOCI, except for investments in equity instruments, and to contract assets.
Finally, IFRS 9 also contains new guidelines for the use of hedge accounting, targeted in particular at better illustration of the risk management activities of a company and the monitoring of non-financial risks.
The Group has to apply IFRS 9 in the accounting period beginning 1 April 2018. The Group will take advantage of the exemption allowing it not to restate comparative information for prior periods with respect to classification and measurement (including impairment) changes. Differences in the carrying amounts of financial assets and financial liabilities resulting from the adoption of IFRS 9 will generally be recognised in retained earnings and reserves as at 1 April 2018.
Based on its assessment, the Group believes that the new classification and valuation of financial assets as well as the accounting for financial liabilities will only change to an insignificant extent. The Group will apply the simplified procedure for the determination of risk provision for expected credit losses for all trade receivables and contract assets in accordance with IFRS 15. Therefore, the Group does not expect any significant change in risk provisions compared to the current accounting. Due to the low level of relevant hedging instruments the Group expects no material adaptation effects. Overall, there will not be significant changes in the presentation and recognition of financial assets and liabilities because of the application of IFRS 9.
IFRS 15IFRS 15 ‘Revenue from Contracts with Customers’ was issued in May 2014 and applies to an annual reporting period beginning on or after 1 January 2018. IFRS 15 will completely replace the existing regulations for the recognition of revenue, including related interpretations, in accordance with IAS 18 ‘Revenue’ and IAS 11 ‘Construction Contracts’. Consequently, revenues will be recognised in the future, when the customer obtains control over the agreed goods and services and can derive benefits from these. Revenues are recognised in the amount of the consideration that the Company will presumably receive. The standard provides a single, principles-based, five-step model to be applied to all contracts with customers, in which the volume of sales and the time or the period of revenue recognition can be determined.
The model is as follows:
(1) identification of the customer contract;
(2) identification of the individual performance obligations;
(3) determination of the transaction price;
(4) allocation of the transaction price to the separate contractual obligations; and
(5) the realisation of revenue when individual contractual obligations are fulfilled.
The Group has to apply IFRS 15 in the accounting period beginning 1 April 2018. The Group plans to adopt IFRS 15 using the modified retrospective method, with the effect of initially applying this standard recognised at the date of initial application (i.e. 1 April 2018). As a result, the Group will not apply the requirements of IFRS 15 to the comparative period presented.
As the Group is generating more than 95% of the revenues from lease contracts which are out of the scope of IFRS 15, the estimated impact on retained earnings will be immaterial.
IFRS 16IFRS 16 replaces existing leases guidance, including IAS 17 ‘Leases’, IFRIC 4 ‘Determining Whether an Arrangement Contains a Lease’, SIC-15 ‘Operating Leases – Incentives’ and SIC-27 ‘Evaluating the Substance of Transactions Involving the Legal Form of a Lease’.
The standard is effective for annual periods beginning on or after 1 January 2019. Early adoption is permitted for entities that apply IFRS 15 at or before the date of initial application of IFRS 16.
IFRS 16 introduces a single, on balance sheet lease accounting model for lessees. A lessee recognises a right-of-use asset representing its right to use the underlying asset and a lease liability representing its obligation to make lease payments. There are recognition exemptions for short-term leases and leases of low-value items. Lessor accounting remains similar to the current standard – i.e. lessors continue to classify leases as finance or operating leases.
88 Sirius Real Estate Limited Annual Report and Accounts 2018Financial statements
Notes to the financial statements continued
for the year ended 31 March 2018

2. Significant accounting policies continued(z) Standards and interpretations in issue and not yet effective continuedIFRS 16 continuedThe Group has completed an initial assessment of the potential impact on its consolidated financial statements but has not yet completed its detailed assessment. The actual impact of applying IFRS 16 on the financial statements in the period of initial application will depend on future economic conditions, including the Group’s borrowing rate at 1 April 2019, the composition of the Group’s lease portfolio at that date, the Group’s latest assessment of whether it will exercise any lease renewal options and the extent to which the Group chooses to use practical expedients and recognition exemptions.
So far, the most significant impact identified is that the Group will recognise new assets and liabilities for its operating leases of office buildings and leases for space relating to operating management contracts. As at 31 March 2018, the Group’s future minimum lease payments under non-cancellable operating leases are disclosed under note 27.
In addition, the nature of expenses related to those leases will now change as IFRS 16 replaces the straight-line operating lease expense with a depreciation charge for right-of-use assets and interest expense on lease liabilities.
As a lessee, the Group can either apply the standard using a:
» retrospective approach; or
» modified retrospective approach with optional practical expedients.
The Group plans to apply IFRS 16 initially on 1 April 2019, using the modified retrospective approach, and will apply the election consistently to all of its leases.
Therefore, the cumulative effect of adopting IFRS 16 will be recognised as an adjustment to the opening balance of retained earnings at 1 April 2019, with no restatement of comparative information.
When applying the modified retrospective approach to leases previously classified as operating leases under IAS 17, the lessee can elect, on a lease-by-lease basis, whether to apply a number of practical expedients on transition. The Group is assessing the potential impact of using these practical expedients.
3. Significant accounting judgements, estimates and assumptionsJudgementsIn the process of applying the Group’s accounting policies, which are described in note 2, the Directors have made the following judgements that have the most significant effect on the amounts recognised in the financial information:
Operating lease commitments – Group as lessorThe Group has entered into commercial property leases on its investment property portfolio. The Group has determined that it retains all the significant risks and rewards of ownership of these properties and therefore accounts for them as operating leases.
Estimates and assumptionsThe key assumptions concerning the future and other key sources of estimation uncertainty at the reporting date that have a significant risk of causing a material adjustment to the carrying amounts of assets and liabilities within the next financial year are discussed below:
Valuation of investment propertiesThe fair value of the Group’s investment properties, excluding those held for sale of €917.3 million (31 March 2017: €735.3 million), was determined by Cushman & Wakefield LLP (2017: Cushman & Wakefield LLP), an independent valuer. After adjusting investment properties for lease incentive accounting and Directors’ discretionary impairments of non-core assets described below, the book value of investment properties is shown as €913.8 million (31 March 2017: €727.3 million).
The Cushman & Wakefield LLP valuation is based upon assumptions including future rental income, anticipated maintenance costs and an appropriate discount rate. The properties are valued on the basis of a ten year discounted cash flow model supported by comparable evidence. The discounted cash flow calculation is a valuation of rental income considering non-recoverable costs and applying a discount rate for the current income risk over a ten year period. After ten years, a determining residual value (exit scenario) is calculated. A capitalisation rate is applied to the more uncertain future income, discounted to a present value.
As a result of the level of judgement used in arriving at the market valuations, the amounts which may ultimately be realised in respect of any given property may differ from the valuations shown on the statement of financial position.
4. Operating segmentsThe Directors are of the opinion that the Group is engaged in a single segment of business, being property investment, and in one geographical area, Germany. All rental income is derived from operations in Germany. There is no one tenant that represents more than 10% of Group revenues. The chief operating decision maker is considered to be the Board of Directors, which is provided with consolidated IFRS, as adopted by the European Union (“EU”), information on a quarterly basis.
89Sirius Real Estate Limited Annual Report and Accounts 2018
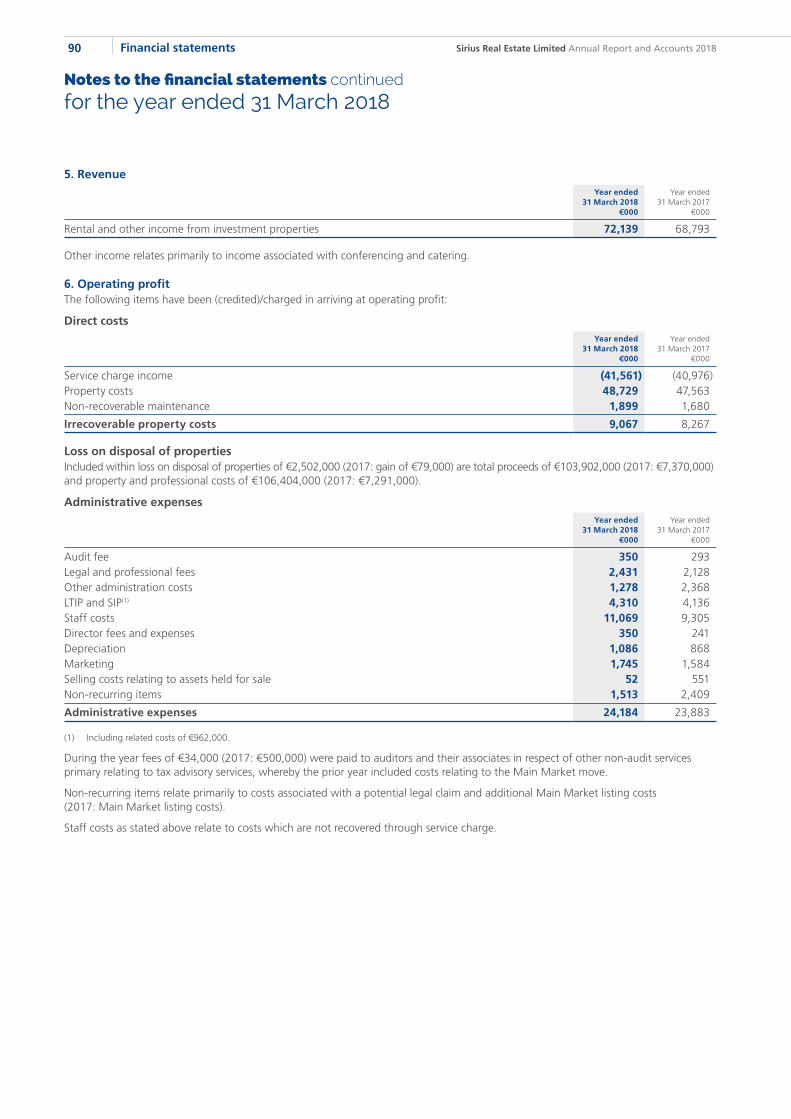
5. RevenueYear ended
31 March 2018€000
Year ended31 March 2017
€000
Rental and other income from investment properties 72,139 68,793
Other income relates primarily to income associated with conferencing and catering.
6. Operating profitThe following items have been (credited)/charged in arriving at operating profit:
Direct costsYear ended
31 March 2018€000
Year ended31 March 2017
€000
Service charge income (41,561) (40,976)Property costs 48,729 47,563Non-recoverable maintenance 1,899 1,680
Irrecoverable property costs 9,067 8,267
Loss on disposal of properties Included within loss on disposal of properties of €2,502,000 (2017: gain of €79,000) are total proceeds of €103,902,000 (2017: €7,370,000) and property and professional costs of €106,404,000 (2017: €7,291,000).
Administrative expensesYear ended
31 March 2018€000
Year ended31 March 2017
€000
Audit fee 350 293Legal and professional fees 2,431 2,128Other administration costs 1,278 2,368LTIP and SIP(1) 4,310 4,136Staff costs 11,069 9,305Director fees and expenses 350 241Depreciation 1,086 868Marketing 1,745 1,584Selling costs relating to assets held for sale 52 551Non-recurring items 1,513 2,409
Administrative expenses 24,184 23,883
(1) Including related costs of €962,000.
During the year fees of €34,000 (2017: €500,000) were paid to auditors and their associates in respect of other non-audit services primary relating to tax advisory services, whereby the prior year included costs relating to the Main Market move.
Non-recurring items relate primarily to costs associated with a potential legal claim and additional Main Market listing costs (2017: Main Market listing costs).
Staff costs as stated above relate to costs which are not recovered through service charge.
90 Sirius Real Estate Limited Annual Report and Accounts 2018Financial statements
Notes to the financial statements continued
for the year ended 31 March 2018

7. Employee costs and numbersYear ended
31 March 2018€000
Year ended31 March 2017
€000
Wages and salaries 16,355 13,970Social security costs 2,927 2,544Pension 204 174Other employment costs 95 215
19,581 16,903
The costs for the year ended 31 March 2018 include those relating to Executive Directors and an expense including related costs of €3,541,000 (31 March 2017: €4,136,000) relating to the granting or award of shares under LTIPs (see note 8).
All employees are employed directly by one of the following Group subsidiary companies: Sirius Facilities GmbH, Sirius Facilities (UK) Limited, Curris Facilities & Utilities Management GmbH, SFG NOVA GmbH and Sirius Corporate Services B.V. The average number of people employed by the Group during the year was 232 (31 March 2017: 204), expressed in full-time equivalents. In addition, the Board of Directors consists of four Non-executive Directors (31 March 2017: five) and two Executive Directors (31 March 2017: two) as at 31 March 2018. Based on the performance criteria and subject to the vesting conditions a total of 23,850,000 shares are expected to be issued.
8. Employee schemesEquity-settled share-based paymentsLTIPAn LTIP for the benefit of the Executive Directors and the Senior Management Team was approved in October 2015. The fair value determined at the grant date is expensed on a straight-line basis over the vesting and holding period, based on the Company’s estimate of the shares that will eventually vest and adjusted for the effect of non-market-based vesting conditions. Under the LTIP, the awards are granted in the form of whole shares at no cost to the participants. Shares vest after the three year performance period followed by a holding period of twelve months. The performance conditions used to determine the vesting of the award are based on net asset value and total shareholder return allowing vesting of 0% to a maximum of 125%. As a result, a maximum of 25,150,000 shares were granted, subject to performance criteria, under the scheme in December 2015. An expense including related costs of €3,541,000 was recognised in the statement of comprehensive income to 31 March 2018.
Movements in the number of shares outstanding and their weighted average exercise prices are as follows:
Year ended 31 March 2018
Year ended 31 March 2017
Number ofshares
Weightedaverageexercise
price€
Number ofshares
Weightedaverageexercise
price€
Balance outstanding as at the beginning of the period (nil exercisable) 23,850,000 — 25,150,000 —Maximum granted during the period — — — —Forfeited during the period — — (1,300,000) —Exercised during the period — — — —
Balance outstanding as at the end of the period (nil exercisable) 23,850,000 — 23,850,000 —
The fair value per share was determined using the Monte Carlo model, with the following assumptions used in the calculation as at grant date:
Weighted average share price – € 0.52Weighted average exercise price – € —Expected volatility – % 20Expected life – years 2.48Risk free rate based on European treasury bonds’ rate of return – % (0.11)Expected dividend yield – % 3.41
Assumptions considered in the model include: expected volatility of the Company’s share price, as determined by calculating the historical volatility of the Company’s share price over the historical period immediately prior to the date of grant and commensurate with the expected life of the awards; dividend yield based on the actual dividend yield as a percentage of the share price at the date of grant; expected life of the awards; risk free rates; and correlation between comparators.
91Sirius Real Estate Limited Annual Report and Accounts 2018

8. Employee schemes continuedEquity-settled share-based payments continuedSIPA new share incentive plan (“SIP”) for the benefit of senior employees of the Company was approved in May 2017. The fair value is based on the Company’s estimate of the shares that will eventually vest. Under the SIP, the awards are granted in the form of whole shares at no cost to the participants. Shares vest after a one year performance period followed by a holding period of twelve months. The performance conditions used to determine the vesting of the award are based on the adjusted net asset value including dividends paid and allow vesting of 100% or 0%. As a result, a maximum of 1,065,000 shares were granted, subject to performance criteria, under the scheme in June 2017 and an expense including related costs of €769,000 was recognised in the consolidated statement of comprehensive income to 31 March 2018.
Employee benefit scheme During the year 487,166 shares were issued to the Company’s management through its MSP programme (31 March 2017: 313,608).
A reconciliation of share-based payments and their impact on the consolidated statement of changes in equity is as follows:
Year ended31 March 2018
€000
Year ended31 March 2017
€000
Charge relating to MSP 326 153Charge relating to new LTIP 2,617 4,136Charge relating to new SIP 731 —
Share-based payment transactions as per consolidated statement of changes in equity 3,674 4,289
9. Finance income and expenseYear ended
31 March 2018€000
Year ended31 March 2017
€000
Bank interest income 13 23
Finance income 13 23
Bank loan interest expense (6,721) (7,151)Bank charges (145) (139)Amortisation of capitalised finance costs (1,173) (1,172)Refinancing costs, exit fees and prepayment penalties (2,207) (1,762)
Finance expense (10,246) (10,224)
Net finance expense (10,233) (10,201)
The refinancing costs on derecognition of loans for the year ended 31 March 2018 of €2.2 million relate to the costs associated with the part repayment of tranche 1 of the Berlin Hyp AG/Deutsche Pfandbriefbank AG facility and full repayment of tranche 2 of the Berlin Hyp AG/Deutsche Pfandbriefbank AG facility following the sales of the Düsseldorf and Munich Rupert Mayer Strasse assets.
92 Sirius Real Estate Limited Annual Report and Accounts 2018Financial statements
Notes to the financial statements continued
for the year ended 31 March 2018

10. TaxationConsolidated statement of comprehensive income
Year ended31 March 2018
€000
Year ended31 March 2017
€000
Current income taxCurrent income tax charge (604) (576)Current income tax charge relating to disposals of investment properties (1,921) —Accrual relating to tax treatment of swap break (839) 264
Total current income tax (3,364) (312)
Deferred taxRelating to origination and reversal of temporary differences (5,492) (9,245)Relating to LTIP charge for the year 571 57
Total deferred tax (4,921) (9,188)
Income tax charge reported in the statement of comprehensive income (8,285) (9,500)
The current income tax charge of €3,364,000 (31 March 2017: €312,000) reflects a release of tax accruals for prior years as well as the tax charge for the year. The effective income tax rate for the period differs from the standard rate of corporation tax in Germany of 15.825% (2017: 15.825%). The differences are explained below:
Year ended31 March 2018
€000
Year ended31 March 2017
€000
Profit before tax 89,648 76,436
Profit before tax multiplied by the rate of corporation tax in Germany of 15.825% (2017: 15.825%) 14,187 12,096Effects of:Deductible interest on internal financing (5,573) (4,451)Non-deductible expenses 835 567Tax losses utilised (4,726) (1,200)Property valuation movements due to differences in accounting treatments 3,270 2,657Adjustments in respect of prior periods 839 (264)Other (547) 95
Total income tax charge in the statement of comprehensive income 8,285 9,500
Deferred income tax liabilityYear ended
31 March 2018€000
Year ended31 March 2017
€000
Opening balance (20,993) (11,748)Release due to disposals 4,883 —Taxes on the revaluation of investment properties (10,375) (9,245)
Balance as at year end (26,485) (20,993)
Deferred income tax assetYear ended
31 March 2018€000
Year ended31 March 2017
€000
Opening balance 240 183Relating to LTIP charge for the year 571 57
Balance as at year end 811 240
The Group has tax losses of €261,763,000 (2017: €262,525,000) that are available for offset against future profits of its subsidiaries in which the losses arose under the restrictions of the minimum taxation rule. Deferred tax assets have not been recognised in respect of the revaluation losses on investment properties and interest rate swaps as they may not be used to offset taxable profits elsewhere in the Group as realisation is not assured. Deferred tax assets have been recognised in respect of the valuation of the Company LTIP.
93Sirius Real Estate Limited Annual Report and Accounts 2018

11. Earnings per shareThe calculations of the basic, diluted, headline and adjusted earnings per share are based on the following data:
Year ended31 March 2018
€000
Year ended31 March 2017
€000
Earnings Basic earnings 81,272 66,911Diluted earnings 81,272 66,911EPRA earnings 27,783 26,188Diluted EPRA earnings 27,783 26,188Headline earnings 27,755 26,318Diluted headline earnings 27,755 26,318
AdjustedBasic earnings after tax 81,272 66,911Deduct revaluation surplus, net of related tax (57,940) (40,514)Add loss/deduct gain on sale of properties, net of related tax 4,423 (79)
Headline earnings after tax 27,755 26,318Deduct change in fair value of derivative financial instruments, net of related tax (63) (156)Add adjusting items, net of related tax(1) 8,349 8,801
Adjusted earnings after tax 36,041 34,963
Number of sharesWeighted average number of ordinary shares for the purpose of basic, headline, adjusted and basic EPRA earnings per share 914,479,339 822,957,685
Weighted average number of ordinary shares for the purpose of diluted and diluted EPRA earnings per share 939,394,339 846,807,685
Basic earnings per share 8.89c 8.13c
Diluted earnings per share 8.65c 7.90c
Basic EPRA earnings per share 3.04c 3.18c
Diluted EPRA earnings per share 2.96c 3.09c
Headline earnings per share 3.04c 3.20c
Diluted headline earnings per share 2.95c 3.11c
Adjusted earnings per share 3.94c 4.25c
Adjusted diluted earnings per share 3.84c 4.13c
(1) See reconciliation between adjusting items as stated within earnings per share and those stated within administrative expenses in note 6 below.
Year ended31 March 2018
€000
Year ended 31 March 2017
€000
Non-recurring items 6 1,513 2,409Finance restructuring costs 9 2,207 1,762Selling costs relating to assets held for sale 6 52 551LTIP and SIP 6 4,310 4,136Change in deferred tax assets 10 (571) (57)Accrual relating to tax treatment of swap break 10 839 —
Adjusting items as per note 11 8,349 8,801
The Directors have chosen to disclose adjusted earnings per share in order to provide an alternative indication of the Group’s underlying business performance; accordingly, it excludes the effect of adjusting items net of related tax, gains/losses on sale of properties net of related tax, the revaluation deficits/surpluses on the investment properties net of related tax and derivative financial instruments net of related tax.
In addition the Directors have chosen to disclose EPRA earnings in order to assist in comparisons with similar businesses. The reconciliation between basic and diluted earnings and EPRA earnings is as follows:
94 Sirius Real Estate Limited Annual Report and Accounts 2018Financial statements
Notes to the financial statements continued
for the year ended 31 March 2018

11. Earnings per share continuedEPRA earnings
Year ended31 March 2018
€000
Year ended31 March 2017
€000
Basic and diluted earnings attributable to owners of the Company 81,272 66,911Basic and diluted earnings attributable to non-controlling interest 91 25
Basic and diluted earnings attributable to owners of the Company and non-controlling interests 81,363 66,936Surplus on revaluation of investment properties (63,452) (49,782)Loss/(gain) on disposal of properties (including tax) 4,423 (79)Change in fair value of derivative financial instruments (43) (133)Deferred tax in respect of EPRA adjustments 5,492 9,246
EPRA earnings 27,783 26,188
The number of shares has been reduced by 574,892 shares (2017: 1,062,058 shares) that are held by the Company as Treasury Shares at 31 March 2018, for the calculation of basic, headline, adjusted and diluted earnings per share.
The weighted average number of shares for the purpose of diluted, EPRA diluted, headline diluted and adjusted diluted earnings per share is calculated as follows:
2018€000
2017€000
Weighted average number of ordinary shares for the purpose of basic, basic EPRA, headline and adjusted earnings per share 914,479,339 822,957,685Effect of grant of SIP shares 1,065,000 —Effect of grant of LTIP shares 23,850,000 23,850,000
Weighted average number of ordinary shares for the purpose of diluted, diluted EPRA, diluted headline and adjusted diluted earnings per share 939,394,339 846,807,685
The Company has chosen to report EPRA earnings per share (“EPRA EPS”). EPRA EPS is a definition of earnings as set out by the European Public Real Estate Association. EPRA earnings represents earnings after adjusting for property revaluation, changes in fair value of derivative financial instruments, profits and losses on disposals and deferred tax in respect of EPRA adjustments.
12. Net assets per share2018€000
2017€000
Net assets Net assets for the purpose of assets per share (assets attributable to the equity holders of the Company) 625,461 495,187Deferred tax arising on revaluation surplus and LTIP valuation 25,674 20,753Derivative financial instruments 298 341
Adjusted net assets attributable to equity holders of the Company 651,433 516,281
Number of sharesNumber of ordinary shares for the purpose of net assets per share 991,329,614 877,786,535Number of ordinary shares for the purpose of EPRA net assets per share 1,016,244,614 901,636,535Net assets per share 63.09c 56.41cAdjusted net assets per share 65.71c 58.82cEPRA net assets per share 64.18c 57.84c
Net assets at the end of the year (basic) 625,461 495,187Directors’ discretionary impairment of non-core assets — 4,968Derivative financial instruments at fair value 298 341Deferred tax in respect of EPRA adjustments 26,485 20,993
EPRA net assets 652,244 521,489
95Sirius Real Estate Limited Annual Report and Accounts 2018

12. Net assets per share continuedThe number of ordinary shares for the purpose of EPRA net assets per share is calculated as follows:
2018€000
2017€000
Number of ordinary shares for the purpose of net assets per share 991,329,614 877,786,535Effect of grant of SIP shares 1,065,000 —Effect of grant of LTIP shares 23,850,000 23,850,000
Number of ordinary shares for the purpose of EPRA net assets per share 1,016,244,614 901,636,535
The Company has chosen to report EPRA net assets per share (“EPRA NAV per share”). EPRA NAV per share is a definition of net asset value as set out by the European Public Real Estate Association. EPRA NAV represents net assets after adjusting for derivative finical instruments and deferred tax relating to valuation movement and derivatives. EPRA NAV per share takes into account the effect of the granting of shares relating to incentive plans.
The number of shares has been reduced by 574,892 shares (2017: 1,062,058 shares) that are held by the Company as Treasury Shares at 31 March 2018, for the calculation of net assets and adjusted net assets per share.
13. Investment propertiesThe movement in the book value of investment properties is as follows:
2018€000
2017€000
Total investment properties at book value as at 1 April(1) 727,295 687,453Additions 127,799 76,265Capital expenditure 20,662 16,493Disposals (8,040) (6,698)Reclassified as investment properties held for sale (17,325) (96,000)Surplus on revaluation above capex 58,971 50,040Adjustment in respect of lease incentives (487) (600)Movement in Directors’ impairment of non-core assets 4,968 342
Total investment properties at book value as at 31 March 913,843 727,295
The reconciliation of the valuation carried out by the external valuer to the carrying values shown in the statement of financial position is as follows:
2018€000
2017€000
Investment properties at market value per valuer’s report(1) 917,340 735,290Adjustment in respect of lease incentives (3,497) (3,027)Directors’ impairment of non-core assets — (4,968)
Balance as at year end 913,843 727,295
(1) Excluding assets held for sale of €17.3 million.
The fair value (market value) of the Group’s investment properties at 31 March 2018 has been arrived at on the basis of a valuation carried out at that date by Cushman & Wakefield LLP (2017: Cushman & Wakefield LLP), an independent valuer.
The value of each of the properties has been assessed in accordance with the RICS valuation standards on the basis of market value. See note 2(k) for further details.
The weighted average lease expiry remaining across the whole portfolio at 31 March 2018 was 2.6 years (2017: 2.5 years).
As a result of the estimates used in arriving at the market valuations, the amounts that may ultimately be realised in respect of any given property may differ from the valuations shown in the statement of financial position.
96 Sirius Real Estate Limited Annual Report and Accounts 2018Financial statements
Notes to the financial statements continued
for the year ended 31 March 2018

13. Investment properties continuedThe reconciliation of surplus on revaluation above capex as per the statement of comprehensive income is as follows:
2018€000
2017€000
Surplus on revaluation above capex 58,971 50,040Adjustment in respect of lease incentives (487) (600)Movement in Directors’ impairment of non-core assets 4,968 342
Surplus on revaluation of investment properties reported in the statement of comprehensive income 63,452 49,782
Included in the surplus on revaluation of investment properties reported in the statement of comprehensive income are gross gains of €72.9 million and gross losses of €9.4 million.
Other than the capital commitments disclosed in note 27, the Group is under no contractual obligation to purchase, construct or develop any investment property. The Group is responsible for routine maintenance to the investment properties.
All investment properties are categorised as Level 3 fair values as they use significant unobservable inputs. There have not been any transfers between levels during the year. Investment properties have been classed according to their real estate sector. Information on these significant unobservable inputs per class of investment property is disclosed below:
As at 31 March 2018Sector Market value (€) Technique Significant assumption Range
Business park 913,390,000 Discounted cash flow Current rental income €0k–€5,858kMarket rental income €424k–€5,800kGross initial yield 0.0%–14.9%Discount factor 4.9%–8.8%Void period (months) 12–24Estimated capital value per sqm €275–€1,426
Other 3,950,000 Discounted cash flow Current rental income €510k–€1,932kMarket rental income €899k–€3,365kGross initial yield 8.9%–10.1%Discount factor 8.5%–12.0%Void period (months) 12–24Estimated capital value per sqm €67–€126
As at 31 March 2017Sector Market value (€) Technique Significant assumption Range
Business park 711,320,000 Discounted cash flow Current rental income €288k–€5,655kMarket rental income €424k–€6,035kGross initial yield 3.8%–15.6%Discount factor 4.75%–12.0%Void period (months) 12–24Estimated capital value per sqm €67–€1,261
Other 23,970,000 Discounted cash flow Current rental income €398k–€1,905kMarket rental income €466k–€2,119kGross initial yield 3.8%–10.1%Discount factor 6.3%–9.5%Void period (months) 12–24Estimated capital value per sqm €597–€941
The valuation is performed on a lease-by-lease basis due to the mixed-use nature of the sites. This gives rise to large ranges in the inputs.
As a result of the estimates used in arriving at the market valuations, the amounts which may ultimately be realised in respect of any given property may differ from the valuations shown in the statement of financial position. For example, an increase in market rental values of 5% would lead to an increase in the fair value of the investment properties of €47,690,000 and a decrease in market rental values of 5% would lead to a decrease in the fair value of the investment properties of €47,980,000. Similarly, an increase in the discount rates of 0.25% would lead to a decrease in the fair value of the investment properties of €18,900,000 and a decrease in the discount rates of 0.25% would lead to an increase in the fair value of the investment properties of €19,770,000.
The highest and best use of properties do not differ from their current use.
Most of the Group’s properties are pledged as security for loans obtained by the Group. See note 20 for details.
97Sirius Real Estate Limited Annual Report and Accounts 2018

14. Investment properties held for sale31 March 2018
€00031 March 2017
€000
Bremen Brinkman 15,500 —Rostock land 1,200 —Markgröningen residential 625 —Munich Rupert Mayer Strasse — 85,000Düsseldorf — 11,000
Balance as at year end 17,325 96,000
15. Plant and equipmentPlant and
equipment€000
Fixturesand fittings
€000Total€000
CostAs at 31 March 2017 6,013 2,826 8,839Additions in year 896 753 1,649Disposals in year (15) (34) (49)
As at 31 March 2018 6,894 3,545 10,439
DepreciationAs at 31 March 2017 (4,520) (1,755) (6,275)Charge for year (780) (306) (1,086)Disposals in year 14 34 48
As at 31 March 2018 (5,286) (2,027) (7,313)
Net book value as at 31 March 2018 1,608 1,518 3,126
CostAs at 31 March 2016 4,879 2,542 7,421Additions in year 1,173 350 1,523Disposals in year (39) (66) (105)
As at 31 March 2017 6,013 2,826 8,839
DepreciationAs at 31 March 2016 (3,934) (1,544) (5,478)Charge for year (607) (261) (868)Disposals in year 21 50 71
As at 31 March 2017 (4,520) (1,755) (6,275)
Net book value as at 31 March 2017 1,493 1,071 2,564
16. Goodwill2018€000
2017€000
Opening balance 3,738 3,738Additions — —Impairment — —
Closing balance 3,738 3,738
On 30 January 2012, a transaction was completed to internalise the Asset Management Agreement and, as a result of the consideration given exceeding the net assets acquired, goodwill of €3,738,000 was recognised. Current business plans indicate that the balance is unimpaired.
98 Sirius Real Estate Limited Annual Report and Accounts 2018Financial statements
Notes to the financial statements continued
for the year ended 31 March 2018

16. Goodwill continuedGoodwill is tested at least annually for impairment and whenever there are indications that goodwill might be impaired. The recoverable amount of a cash-generating unit is based on its value in use. Value in use is the present value of the projected cash flows of the cash-generating unit. The key assumptions regarding the value in use calculations were budgeted growth in revenue and the discount rate applied. Budgeted profit margins were estimated based on actual performance over the past two financial years and expected market changes. The discount rate used is a pre-tax rate and reflects the risks specific to the real estate industry. The Group prepares cash flow forecasts based on the most recent financial budget approved by management, which covers a one year period. Cash flows beyond this period are extrapolated to a period of five years using a revenue growth rate of 2.0% (2017: 2.0%), which is consistent with the long-term average growth rate for the real estate sector. A discount rate of 7.05% (2017: 6.75%) and terminal value of 5.05% (2017: 4.75%) was applied in the impairment review. A discount rate of 8.30% (2017: 10.0%) would be required for the carrying value of goodwill to be greater than the fair value. A negative revenue growth rate of 0.77% (2017: 1.16%) would be required for the carrying value of goodwill to be greater than the fair value.
17. Trade and other receivables2018€000
2017€000
Trade receivables 3,899 2,837Other receivables 5,523 4,470Prepayments 35,641 6,983
Balance as at year end 45,063 14,290
Other receivables include lease incentives of €3,497,000 (2017: €3,269,000).
Prepayments include amounts totalling €34,585,000 (2017: €6,547,000) relating to the payments and associated costs for the acquisition of two new sites that completed post period end (see note 30).
18. Cash and cash equivalents2018€000
2017€000
Cash at bank and in hand 79,605 48,695
Balance as at year end 79,605 48,695
Cash at bank earns interest at floating rates based on daily bank deposit rates. The fair value of cash as at 31 March 2018 is €79,605,000 (2017: €48,695,000).
As at 31 March 2018 €15,191,000 (2017: €12,753,000) of cash is held in blocked accounts. Of this, €8,256,000 (2017: €6,933,000) relates to deposits received from tenants. An amount of €16,000 (2017: €16,000) is cash held in escrow as requested by a supplier and €131,000 (2017: €131,000) is held in restricted accounts for office rent deposits. An amount of €3,344,000 (2017: €2,850,000) relates to amounts reserved for future bank loan interest and amortisation payments, pursuant to certain of the Group’s banking facilities. An amount of €3,268,000 (2017: €2,823,000) relates to amounts reserved for future capital expenditure and an amount of €176,000 (2017: €nil) relates to amounts reserved for future debt servicing, pursuant to certain of the Group’s banking facilities.
19. Trade and other payables2018€000
2017€000
Trade payables 6,381 5,865Accrued expenses 14,453 12,206Accrued interest 2,031 509Other payables 18,107 15,383
Balance as at year end 40,972 33,963
99Sirius Real Estate Limited Annual Report and Accounts 2018

20. Interest-bearing loans and borrowingsEffective
interest rate% Maturity
2018€000
2017€000
CurrentDeutsche Genossenschafts-Hypothekenbank AG– fixed rate facility 1.59 31 March 2021 320 320Bayerische Landesbank– hedged floating rate facility Hedged (1) 19 October 2020 508 508SEB AG– fixed rate facility 1.84 1 September 2022 1,180 1,180– hedged floating rate facility Hedged (2) 30 October 2024 229 —– floating rate facility Floating (3) 25 March 2025 760 —Berlin Hyp AG/Deutsche Pfandbriefbank AG– floating rate facility Floating (4) 27 April 2023 — 1,063– fixed rate facility 1.66 27 April 2023 2,551 2,413Berlin Hyp AG– fixed rate facility 1.48 29 October 2023 1,799 1,773K-Bonds I – fixed rate facility 6.00 31 July 2020 1,000 1,000Saarbrücken Sparkasse – fixed rate facility 1.53 28 February 2025 726 —Capitalised finance charges on all loans (1,229) (1,189)
7,844 7,068
Non-currentDeutsche Genossenschafts-Hypothekenbank AG– fixed rate facility 1.59 31 March 2021 14,040 14,360Bayerische Landesbank– hedged floating rate facility Hedged (1) 19 October 2020 23,606 24,113SEB AG– fixed rate facility 1.84 1 September 2022 54,870 56,050– hedged floating rate facility Hedged (2) 30 October 2024 22,701 —– floating rate facility Floating (3) 25 March 2025 37,240 —Berlin Hyp AG/Deutsche Pfandbriefbank AG– floating rate facility Floating (4) 27 April 2023 — 40,375– fixed rate facility 1.66 27 April 2023 81,554 89,927Berlin Hyp AG– fixed rate facility 1.48 29 October 2023 65,697 67,496K-Bonds I – fixed rate facility 4.00 31 July 2023 45,000 45,000– fixed rate facility 6.00 31 July 2020 2,000 3,000Saarbrücken Sparkasse – fixed rate facility 1.53 28 February 2025 17,274 —Capitalised finance charges on all loans (4,748) (5,597)
359,234 334,724
Total 367,078 341,792
(1) This facility is hedged with a swap charged at a rate of 1.66%.
(2) Tranche 1 of this facility is hedged with a swap charged at a rate of 2.58%; tranche 2 of this facility is hedged with a swap charged at a rate of 2.56%.
(3) This facility is charged with a floating rate of 1.58% over six month EURIBOR (not less than 0%) for the full term of the loan.
(4) Tranche 2 of this facility was fully repaid in September 2017.
100 Sirius Real Estate Limited Annual Report and Accounts 2018Financial statements
Notes to the financial statements continued
for the year ended 31 March 2018

20. Interest-bearing loans and borrowings continuedThe borrowings are repayable as follows:
2018€000
2017€000
On demand or within one year 9,073 8,256In the second year 9,383 8,323In the third to tenth years inclusive 354,599 331,998
Total 373,055 348,577
The Group has pledged 46 (2017: 38) investment properties to secure related interest-bearing debt facilities granted to the Group including two properties that completed immediately after period end. Of this the 44 (2017: 38) properties had a combined valuation of €872,408,000 as at 31 March 2018 (2017: €774,120,000).
Deutsche Genossenschafts-Hypothekenbank AGOn 24 March 2016, the Group agreed to a facility agreement with Deutsche Genossenschafts-Hypothekenbank AG for €16.0 million. As at 31 March 2017 tranche 1 had been drawn down in full totalling €15.0 million. The loan terminates on 31 March 2021. Amortisation is 2% per annum with the remainder of the loan due in the fifth year. The facility is charged at a fixed interest rate of 1.59%. The facility is secured over one property asset and is subject to various covenants with which the Group has complied.
Bayerische LandesbankOn 20 October 2015, the Group agreed to a facility agreement with Bayerische Landesbank for €25.4 million. The loan terminates on 19 October 2020. Amortisation is 2% per annum with the remainder due in the fourth year. The full facility has been hedged at a rate of 1.66% until 19 October 2020 by way of an interest rate swap. The facility is secured over four property assets and is subject to various covenants with which the Group has complied.
SEB AGOn 2 September 2015, the Group agreed to a facility agreement with SEB AG for €59.0 million to refinance the two existing Macquarie loan facilities. The loan terminates on 1 September 2022. Amortisation is 2% per annum with the remainder due in the seventh year. The loan facility is charged at a fixed interest rate of 1.84%. This facility is secured over twelve of the 14 property assets previously financed through the Macquarie loan facilities, thereby two non-core assets were unencumbered in the refinancing process. The facility is subject to various covenants with which the Group has complied.
On 30 October 2017, the Group agreed to a second facility agreement with SEB AG for €22.9 million. Tranche 1, totalling €20.0 million, has been hedged at a rate of 2.58% until 30 October 2024 by way of an interest rate swap. Tranche 2, totalling €2.9 million, has been hedged at a rate of 2.56% until 30 October 2024 by way of an interest rate swap. The loan terminates on 30 October 2024. Amortisation is 2.0% per annum across the full facility with the remainder due in one instalment on the final maturity date. The facility is secured over three property assets and is subject to various covenants with which the Group has complied.
On 26 March 2018, the Group agreed to a third facility agreement with SEB AG for €38.0 million. The loan terminates on 25 March 2025. Amortisation is 2% per annum with the remainder due in one instalment on the final maturity date. The loan facility is charged with a floating rate of 1.58% over six month EURIBOR (not less than 0%) for the full term of the loan and requires a hedging instrument to be put in place in order to fix the rate before the end of June 2018. The facility is secured over six property assets, one of which completed immediately after period end and is subject to various covenants with which the Group has complied.
Berlin Hyp AG/Deutsche Pfandbriefbank AGOn 31 March 2014, the Group agreed to a facility agreement with Berlin Hyp AG and Deutsche Pfandbriefbank AG for €115.0 million. The loan terminates on 31 March 2019. Amortisation is 2% p.a. for the first two years, 2.5% for the third year and 3.0% thereafter, with the remainder due in the fifth year. Half of the facility (€55.2 million) is charged interest at 3% plus three month EURIBOR and is capped at 4.5%, and the other half (€55.2 million) has been hedged at a rate of 4.265% until 31 March 2019. This facility is secured over nine property assets and is subject to various covenants with which the Group has complied. On 28 April 2016, the Group agreed to refinance this facility which had an outstanding balance of €110.4 million at 31 March 2016. The new facility is split in two tranches totalling €137.0 million and terminates on 27 April 2023. Tranche 1, totalling €94.5 million, is charged at a fixed interest rate of 1.66% for the full term of the loan. Tranche 2, totalling €42.5 million, is charged with a floating rate of 1.57% over three month EURIBOR (not less than 0%) for the full term of the loan. Amortisation is set at 2.5% across the full facility with the remainder due in one instalment on the final maturity date. The facility is secured over eleven property assets and is subject to various covenants with which the Group has complied.
On 30 June 2017, the Group repaid a total of €5.8 million following the disposal of the Düsseldorf asset. On 30 September 2017, the Group repaid tranche 2 of the loan in full amounting to €40.9 million following the disposal of the Munich Rupert Mayer Strasse asset. The facility is now secured over nine property assets.
101Sirius Real Estate Limited Annual Report and Accounts 2018

20. Interest-bearing loans and borrowings continuedBerlin Hyp AGOn 15 December 2014, the Group agreed to a facility agreement with Berlin Hyp AG for €36.0 million. The loan terminates on 31 December 2019. Amortisation is 2% per annum for the first two years, 2.4% for the third year and 2.8% thereafter, with the remainder due in the fifth year. The facility is charged at a fixed interest rate of 2.85%. This facility is secured over three property assets and is subject to various covenants with which the Group has complied. On 28 April 2016, the Group agreed to add an additional tranche to this facility which had an outstanding balance of €35.1 million at 31 March 2016. The additional tranche of €4.5 million brings the total loan to €39.6 million. The maturity of the additional loan tranche is coterminous with the existing loan at 31 December 2019. Amortisation is 2.5% per annum, with the remainder due at maturity. The additional loan tranche is charged with a fixed interest rate of 1.32% for the full term of the loan. The original facility agreement was amended to include one previously unencumbered property asset located in Würselen. The terms of the original loan are unchanged and the loan continues to be subject to various covenants with which the Group has complied.
On 20 October 2016, the Group concluded an agreement with Berlin Hyp AG to refinance and extend this facility which had an outstanding balance of €39.2 million at 30 September 2016. The new facility totals €70.0 million and terminates on 29 October 2023. Amortisation is 2.5% per annum with the remainder due at maturity. The facility is charged with an all-in fixed interest rate of 1.48% for the full term of the loan. The facility is secured over six property assets which include the recent acquisitions in Dresden and Wiesbaden which were added to the security pool in order to increase the facility. The loan is subject to various covenants with which the Group has complied.
K-BondsOn 1 August 2013, the Group agreed to a facility agreement with K-Bonds for €52.0 million. The loan consists of a senior tranche of €45.0 million and a junior tranche of €7.0 million. The senior tranche has a fixed interest rate of 4% per annum and is due in one sum on 31 July 2023. The junior tranche has a fixed interest rate of 6% and terminates on 31 July 2020. The junior tranche is amortised at €1.0 million per annum over a seven year period. This facility is secured over four properties and is subject to various covenants with which the Group has complied.
Saarbrücken SparkasseOn 28 March 2018, the Group agreed to a facility agreement with Saarbrücken Sparkasse for €18.0 million. The loan terminates on 28 February 2025. Amortisation is 4.0% per annum with the remainder due in one instalment on the final maturity date. The facility is charged with an all-in fixed interest rate of 1.53% for the full term of the loan. The facility is secured over one property asset that completed immediately after period end and is subject to various covenants with which the Group has complied.
A summary of the Group’s debt covenants is set out below:
Outstanding at
31 March 2018
€000
Propertyvalues at31 March
2018€000
Loan to valueratio at
31 March 2018 (1)
Loan to value
covenant at31 March
2018
Interest cover
ratio at31 March
2018 (2)
Debt servicecover
ratio at31 March
2018 (2)
Debt yieldratio at
31 March 2018 (2)
Cover ratiocovenant at
31 March 2018
Deutsche Genossenschafts-Hypothekenbank AG 14,360 30,151 47.6% 68.0% n/a 2.03 n/a 1.25Bayerische Landesbank 24,114 62,780 38.4% 65.0% n/a 3.78 n/a 2.50SEB AG 56,050 137,715 40.7% 57.5% 7.39 n/a n/a 5.90SEB AG II 22,930 44,396 51.6% 61.5% n/a n/a 3.39 1.70SEB AG III 38,000 65,200 58.3% 60.0% n/a n/a 10.81 7.50Berlin Hyp AG/Deutsche Pfandbriefbank AG 84,105 263,670 31.9% 62.5% n/a 3.18 n/a 1.50Berlin Hyp AG 67,496 158,923 42.5% 65.0% n/a 3.28 n/a 1.40K-Bonds I 48,000 109,573 43.8% n/a 4.06 n/a n/a 2.50Saarbrücken Sparkasse 18,000 — n/a n/a n/a 2.52 n/a 2.00Unencumbered properties — 41,435 n/a
Total 373,055 913,843 40.8%
(1) Based on Cushman & Wakefield LLP valuations adjusted in respect of lease incentives and Directors’ discretionary impairment of non-core assets.
(2) Based on contractual calculations which are often less representative of actual trading performance.
102 Sirius Real Estate Limited Annual Report and Accounts 2018Financial statements
Notes to the financial statements continued
for the year ended 31 March 2018

20. Interest-bearing loans and borrowings continuedReconciliation of movements of liabilities arising from financing activities:
Liabilities
Derivativesheld to hedge
long-termborrowings Equity
Loans and borrowings
Otherliabilities
Interest rateswap used
for hedgingliabilities
Sharecapital Reserves
Retained earnings
Non-controlling
interest Total
As at 31 March 2017 341,792 509 341 — 470,318 24,869 81 837,910
Changes from financing cash flowProceeds from issue of share capital — — — — 63,352 — — 63,352Proceeds from loans and borrowings 78,930 — — — — — — 78,930Repayment of loans (53,551) — — — — — — (53,551)Exit fees/prepayment penalties — (1,348) — — — — — (1,348)Interest paid — (7,451) — — — — — (7,451)Dividend paid — — — — (18,024) — — (18,024)
Total changes from financing cash flow 25,379 (8,799) — — 45,328 — — 61,908
Changes in fair value — — (43) — — — — (43)Accrued amortisation and interest (903) 10,322 — — — — — 9,419Transaction cost related to loans and borrowings 810 — — — — — — 810Total equity related other changes — — — — 3,674 81,272 91 85,037
As at 31 March 2018 367,078 2,032 298 — 519,320 106,141 172 995,041
21. Financial risk management objectives and policiesThe Group’s principal financial liabilities comprise bank loans, derivative financial instruments and trade payables. The main purpose of these financial instruments is to raise finance for the Group’s operations. The Group has various financial assets, such as trade receivables and cash, which arise directly from its operations.
The main risks arising from the Group’s financial instruments are credit risk, liquidity risk, market risk and interest rate risk.
Credit riskCredit risk arises when a failure by counterparties to discharge their obligations could reduce the amount of future cash inflows from financial assets on hand at the reporting date. The credit risk on liquid funds is limited because the counterparties are banks with high credit ratings assigned by international credit rating agencies. The risk management policies employed by the Group to manage these risks are discussed below. In the event of a default by an occupational tenant, the Group will suffer a rental shortfall and incur additional costs, including expenses incurred to try and recover the defaulted amounts and legal expenses in maintaining, insuring and marketing the property until it is re-let. During the year, the Group monitored the tenants in order to anticipate and minimise the impact of defaults by occupational tenants, as well as to ensure that the Group has a diversified tenant base.
The carrying amount of financial assets represents the maximum credit exposure. The maximum exposure to credit risk at the reporting date was:
2018€000
2017€000
Trade receivables 3,899 2,837Other receivables 5,523 4,470Cash and cash equivalents 79,605 48,695
89,027 56,002
103Sirius Real Estate Limited Annual Report and Accounts 2018

21. Financial risk management objectives and policies continuedCredit risk continuedThe ageing of trade receivables at the statement of financial position date was:
Gross2018€000
Impairment2018€000
Gross2017€000
Impairment2017€000
Past due 0–30 days 5,238 (1,984) 2,784 (1,121)Past due 31–120 days 437 (298) 1,267 (789)More than 120 days 2,702 (2,196) 2,928 (2,232)
8,377 (4,478) 6,979 (4,142)
The movement in the allowance for impairment in respect of trade receivables during the year was as follows:
2018€000
2017€000
Balance at 1 April (4,142) (4,332)Impairment loss (released)/recognised (336) 190
Balance at 31 March (4,478) (4,142)
The allowance account for trade receivables is used to record impairment losses unless the Group believes that no recovery of the amount owing is possible; at that point the amounts considered irrecoverable are written off against the trade receivables directly.
Most trade receivables are generally due one month in advance. The exception is service charge balancing billing, which is due ten days after it has been invoiced. Included in the Group’s trade receivables are debtors with carrying amounts of €3,899,000 (2017: €2,837,000) that are past due at the reporting date for which the Group has not provided as there has not been a significant change in credit quality and the amounts are still considered recoverable.
Liquidity riskLiquidity risk is the risk that arises when the maturity of assets and liabilities does not match. An unmatched position potentially enhances profitability but can also increase the risk of losses. The Group has procedures with the objective of minimising such losses, such as maintaining sufficient cash and other highly liquid current assets and having available an adequate amount of committed credit facilities. The Group prepares cash flow forecasts and continually monitors its ongoing commitments compared to available cash. Cash and cash equivalents are placed with financial institutions on a short-term basis which allows immediate access. This reflects the Group’s desire to maintain a high level of liquidity in order to meet any unexpected liabilities that may arise due to the current financial position. Similarly, accounts receivable are due either in advance (e.g. rents and recharges) or within ten days (e.g. service charge reconciliations), further bolstering the Group’s liquidity level.
The table below summarises the maturity profile of the Group’s financial liabilities as at 31 March 2018, based on contractual undiscounted payments:
Year ended 31 March 2018
Bank andshareholder
loans€000
Derivative financial
instruments€000
Tradeand otherpayables
€000Total€000
Undiscounted amounts payable in:Six months or less (8,659) (165) (40,972) (49,796)Six months to one year (7,851) (163) — (8,014)One to two years (16,627) (323) — (16,950)Two to five years (129,888) (549) — (130,437)Five to ten years (246,970) (231) — (247,201)
(409,995) (1,431) (40,972) (452,398)Interest 36,940 1,431 — 38,371
(373,055) — (40,972) (414,027)
104 Sirius Real Estate Limited Annual Report and Accounts 2018Financial statements
Notes to the financial statements continued
for the year ended 31 March 2018

21. Financial risk management objectives and policies continuedLiquidity risk continued
Year ended 31 March 2017
Bank andshareholder
loans€000
Derivative financial
instruments€000
Tradeand otherpayables
€000Total€000
Undiscounted amounts payable in:Six months or less (8,085) (82) (33,963) (42,130)Six months to one year (7,048) (82) — (7,130)One to two years (15,021) (161) — (15,182)Two to five years (76,764) (320) — (77,084)Five to ten years (279,706) — — (279,706)
(386,624) (645) (33,963) (421,232)Interest 38,046 645 — 38,691
(348,578) — (33,963) (382,541)
Currency riskThere is no significant foreign currency risk as most of the assets and liabilities of the Group are maintained in euros. Small amounts of UK sterling and South African rand are held to ensure payments made in UK sterling and South African rand can be achieved at an effective rate.
Interest rate riskThe Group’s exposure to interest rate risk relates primarily to the Group’s long-term floating rate debt obligations. The Group’s policy is to mitigate interest rate risk by ensuring that a minimum of 80% of its total borrowing is at fixed or capped interest rates by taking out fixed rate loans or derivative financial instruments to hedge interest rate exposure, or interest rate caps.
A change in interest will only have an impact on the floating loans capped due to the fact that the other loans have a general fixed interest rate or they are effectively fixed by a swap. An increase in 100bps in interest rate would result in a decreased post tax profit in the consolidated statement of comprehensive income of €381,000 (excluding the movement on derivative financial instruments) and a decrease in 100bps in interest rate would result in an increased post tax profit in the consolidated statement of comprehensive income of €381,000 (excluding the movement on derivative financial instruments).
Market riskThe Group’s activities are within the real estate market, exposing it to very specific industry risks.
The yields available from investments in real estate depend primarily on the amount of revenue earned and capital appreciation generated by the relevant properties, as well as expenses incurred. If properties do not generate sufficient revenues to meet operating expenses, including debt service and capital expenditure, the Group’s revenue will be adversely affected.
Revenues from properties may be adversely affected by: the general economic climate; local conditions, such as an oversupply of properties, or a reduction in demand for properties, in the market in which the Group operates; the attractiveness of the properties to the tenants; the quality of the management; competition from other available properties; and increased operating costs.
In addition, the Group’s revenue would be adversely affected if a significant number of tenants were unable to pay rent or its properties could not be rented on favourable terms. Certain significant expenditures associated with each equity investment in real estate (such as external financing costs, real estate taxes and maintenance costs) are generally not reduced when circumstances cause a reduction in revenue from properties. By diversifying in product, risk categories and tenants, the Group expects to lower the risk profile of the portfolio.
Capital managementThe Group seeks to enhance shareholder value both by investing in the business so as to improve the return on investment and by managing the capital structure.
The Group manages its capital structure and makes adjustments to it in light of changes in economic conditions. To maintain or adjust the capital structure, the Group may adjust the dividend payment to shareholders, issue shares or undertake transactions such as those that occurred with the internalisation of the Asset Management Agreement.
The Company holds 574,892 of its own shares which continue to be held as Treasury Shares. During the year to 31 March 2018 487,166 shares were issued from treasury and no shares were bought back.
The Group monitors capital using a gross debt to property assets ratio, which was 40.8% as at 31 March 2018 (2017: 42.3%).
The Group is not subject to externally imposed capital requirements other than those related to the covenants of the bank loan facilities.
105Sirius Real Estate Limited Annual Report and Accounts 2018

22. Financial instrumentsFair valuesSet out below is a comparison by category of carrying amounts and fair values of all of the Group’s financial instruments that are carried in the financial statements:
2018 2017
Carryingamount
€000
Fairvalue€000
Carryingamount
€000
Fairvalue€000
Financial assetsCash 79,605 79,605 48,695 48,695Trade receivables 3,899 3,899 2,837 2,837
Financial liabilitiesTrade payables 6,381 6,381 5,865 5,865Derivative financial instruments 298 298 341 341Interest-bearing loans and borrowings:Floating rate borrowings 38,000 38,000 41,438 41,438Floating rate borrowings – hedged(1) 47,044 47,044 24,621 24,621Fixed rate borrowings 288,011 293,547 282,519 288,288
(1) The Group holds interest rate swap contracts designed to manage the interest rate and liquidity risks of expected cash flows of its borrowings with the variable rate facilities with Bayerische Landesbank and SEB AG. Please refer to note 20 for details of swap contracts.
Fair value hierarchyFor financial assets or liabilities measured at amortised cost and whose carrying value is a reasonable approximation to fair value there is no requirement to analyse their value in the fair value hierarchy.
The table below analyses financial instruments measured at fair value into a fair value hierarchy based on the valuation technique used to determine fair value:
Level 1: quoted prices (unadjusted) in active markets for identical assets or liabilities;
Level 2: inputs other than quoted prices included within Level 1 that are observable for the asset or liability, either directly (i.e. as prices) or indirectly (i.e. derived from prices); and
Level 3: inputs for the asset or liability that are not based on observable market data (unobservable inputs).
Level 1€000
Level 2€000
Level 3€000
Total€000
2018Derivative financial instruments — (298) — (298)Fixed rate borrowings — 293,547 — 293,547Floating rate borrowings — 85,044 — 85,044
2017Derivative financial instruments — (341) — (341)Fixed rate borrowings — (288,288) — (288,288)Floating rate borrowings — (66,059) — (66,059)
The interest rate swap contract is reset on a quarterly basis. The Company will settle the difference between the fixed and floating interest rates on a net basis. The fair value of interest rate swaps is based on broker quotes. Those quotes are tested for reasonableness by discounting estimated future cash flows based on the terms and maturity of each contract and using market interest rates for a similar instrument at the measurement date. The average interest rate is based on the outstanding balances at the end of the reporting period. The interest rate swap is measured at fair value with changes recognised in profit or loss.
106 Sirius Real Estate Limited Annual Report and Accounts 2018Financial statements
Notes to the financial statements continued
for the year ended 31 March 2018

22. Financial instruments continuedInterest rate riskThe following table sets out the carrying amount, by maturity, of the Group’s financial instruments that are exposed to interest rate risk:
2018Within 1 year
€0001–2 years
€0002–3 years
€0003–4 years
€0004+ years
€000Total€000
SEB AG (760) (760) (760) (760) (34,960) (38,000)
2017Within 1 year
€0001–2 years
€0002–3 years
€0003–4 years
€0004–5 years
€000Total€000
Berlin Hyp AG/Deutsche Pfandbriefbank AG (1,063) (1,063) (1,063) (1,063) (37,188) (41,440)
The other financial instruments of the Group that are not included in the above tables are non-interest bearing or have fixed interest rates and are therefore not subject to interest rate risk.
23. Issued share capital
AuthorisedNumber
of shares
Sharecapital
€
Ordinary shares of no par value Unlimited —
As at 31 March 2018 Unlimited —
Issued and fully paidNumber
of shares
Sharecapital
€
As at 31 March 2016 751,984,887 —Issued ordinary shares 125,488,040 —Issued Treasury Shares 313,608 —
As at 31 March 2017 877,786,535 —Issued ordinary shares 113,055,913 —Issued Treasury Shares 487,166 —
As at 31 March 2018 991,329,614 —
Holders of the ordinary shares are entitled to receive dividends and other distributions and to attend and vote at any general meeting. Shares held in treasury are not entitled to receive dividends or to vote at general meetings.
On 7 July 2017, the Company issued 487,166 ordinary shares out of treasury to the Company’s two Executive Directors and some of the Group’s Senior Management Team, pursuant to the Company’s MSP incentive scheme. This resulted in the Company’s overall issued share capital being 878,848,593 ordinary shares, of which 574,892 were held in treasury. The total number of ordinary shares with voting rights in the Company at this date was 878,273,701.
Pursuant to an equity raise of €25.0 million on 4 August 2017, the Company issued 39,888,185 ordinary shares at an issue price of £0.56, resulting in the Company’s overall issued share capital being 918,736,778 ordinary shares, of which 574,892 were held in treasury. The total number of ordinary shares with voting rights in the Company at this date was 918,161,886. Costs associated with the equity raise amounted to €612,000.
Pursuant to a scrip dividend offering on 18 August 2017, the Company issued 7,991,787 ordinary shares at an issue price of £0.5621, resulting in the Company’s overall issued share capital being 926,728,565 ordinary shares, of which 574,892 were held in treasury. The total number of ordinary shares with voting rights in the Company at this date was 926,153,673.
Pursuant to a scrip dividend offering on 19 January 2018, the Company issued 6,842,608 ordinary shares at an issue price of £0.6198, resulting in the Company’s overall issued share capital being 933,571,173 ordinary shares, of which 574,892 were held in treasury. The total number of ordinary shares with voting rights in the Company at this date was 932,996,281.
Pursuant to an equity raise of €40.0 million on 28 March 2018, the Company issued 58,333,333 ordinary shares at an issue price of £0.60, resulting in the Company’s overall issued share capital being 991,904,506 ordinary shares, of which 574,892 were held in treasury. The total number of ordinary shares with voting rights in the Company at this date was 991,329,614. Costs associated with the equity raise amounted to €884,000.
The Company holds 574,892 of its own shares, which are held in treasury (2017: 1,062,058). During the year 487,166 shares were issued from treasury.
All shares issued in the period were issued under general authority. No shares were bought back in the year.
107Sirius Real Estate Limited Annual Report and Accounts 2018

24. Other reservesOther distributable reserveThe other distributable reserve was created for the payment of dividends, share-based payment transactions and the buyback of shares and is €519,320,000 in total at 31 March 2018 (2017: €470,318,000).
25. DividendsOn 4 July 2017, the Company announced a dividend of 1.53c per share, with a record date of 14 July 2017 for UK and South African shareholders and payable on 18 August 2017. On the record date, 878,848,593 shares were in issue, of which 574,892 were held in treasury and 878,273,701 were entitled to participate in the dividend. Holders of 329,660,344 shares elected to receive the dividend in ordinary shares under the Scrip Dividend Alternative, representing a dividend of €5,044,000, while holders of 548,613,357 shares opted for a cash dividend with a value of €8,378,000. The total dividend was €13,422,000.
On 27 November 2017, the Company announced a dividend of 1.56c per share, with a record date of 15 December 2017 for UK and South African shareholders and payable on 19 January 2018. On the record date, 926,728,565 shares were in issue, of which 574,892 were held in treasury and 926,153,673 were entitled to participate in the dividend. Holders of 313,136,432 shares elected to receive the dividend in ordinary shares under the Scrip Dividend Alternative, representing a dividend of €4,885,000, while holders of 613,017,241 shares opted for a cash dividend with a value of €9,646,000. The total dividend was €14,531,000.
The Group’s profit attributable to the equity holders of the Company for the year was €81.3 million (2017: €66.9 million). The Board has declared a final dividend of 1.60c per share for the year ended 31 March 2018 representing a continuation of the temporary increase in the pay-out ratio of 75% of FFO(1) introduced in the first half of the year. It is expected that the ex-dividend date will be on or around 11 July 2018 for shareholders on the South African register and on or around 12 July 2018 for shareholders on the UK register. It is further expected that the record date will be on or around 13 July 2018 for shareholders on the South African and UK registers and the dividend will be paid on or around 17 August 2018 for shareholders on both registers.
The dividend paid per the statement of changes in equity is the value of the cash dividend.
(1) Adjusted profit before tax adjusted for depreciation, amortisation of financing fees and current tax receivable/incurred.
The dividend per share was calculated as follows:
31 March 2018€ million
31 March 2017€ million
Reported profit before tax 89.6 76.4Adjustments for:Surplus on revaluation (63.5) (49.8)Loss/(gain) of disposals 2.5 (0.1)Other adjusting items(1) 8.1 8.9Change in fair value of financial derivatives — (0.1)
Adjusted profit before tax 36.7 35.3Adjustments for:Depreciation 1.1 0.9Amortisation of financing fees 1.2 1.2Current taxes incurred (see note 10) (3.4) (0.6)Add back current tax relating to disposals and prior year adjustments 2.8 0.3
Funds from operations, year ended 31 March 38.4 37.1
Funds from operations, six months ended 30 September 18.5 17.1
Funds from operations, six months ended 31 March 19.9 20.0
Dividend pool, six months ended 30 September 14.4 11.7
Dividend pool, six months ended 31 March(2) 15.9 13.4
Dividend per share, six months ended 30 September 1.56c 1.39c
Dividend per share, six months ended 31 March 1.60c 1.53c
(1) Includes the net effect of refinancing costs, management LTIP and SIP awards excluding the change in deferred tax assets and expected selling costs associated with assets held for sale. See note 11 for details.
(2) Calculated as 75% of FFO of 2.13c per share (31 March 2017: 2.38c per share using 65% of FFO) based on average number of shares outstanding of 930,142,690 (31 March 2017: 846,641,989).
108 Sirius Real Estate Limited Annual Report and Accounts 2018Financial statements
Notes to the financial statements continued
for the year ended 31 March 2018

26. Related partiesKey management personnel compensationFees paid to people or entities considered to be key management personnel of the Group during the year include:
2018€000
2017€000
Directors’ fees 336 231Salary and employee benefits 3,034 2,759Share-based payments 3,550 3,926
Total 6,920 6,916
The share-based payments relating to key management personnel for the year ended 31 March 2018 include an accrued expense of €3,550,000 (2017: €3,404,000) for the granting of shares under the LTIP (see note 8).
Information on Directors’ emoluments is given in the remuneration report on pages 60 to 69.
27. Capital and other commitmentsThe Group’s commitments derived from office rental contracts are as follows:
2018€000
2017€000
Less than one year(1) 6,984 528Between one and five years(1) 21,909 1,959More than five years 529 245
29,422 2,732
(1) Includes commitments relating to the operating and management contract for the Rupert Mayer Strasse asset which was disposed of during the year.
As at 31 March 2018, the Group had contracted capital expenditure on existing properties of €8,745,000 (2017: €5,951,000).
These were committed but not yet provided for in the financial statements.
28. Operating lease arrangementsGroup as lessorAll properties leased by the Group are under operating leases and the future minimum lease payments receivable under non-cancellable leases are as follows:
2018€000
2017€000
Less than one year 67,982 63,375Between one and five years 114,675 102,176More than five years 23,869 23,140
206,526 188,691
The Group leases out its investment properties under operating leases. Most operating leases are for terms of one to ten years.
109Sirius Real Estate Limited Annual Report and Accounts 2018

29. List of subsidiary undertakingsThe Group consists of 86 subsidiary companies. All subsidiaries are consolidated in full in accordance with IFRS.
Company nameCountry
of incorporation
Ownership at31 March 2018
%
Ownership at31 March 2017
%
Curris Facilities & Utilities Management GmbH Germany 100.00 100.00DDS Aspen B.V. Netherlands 100.00 100.00DDS Bagnut B.V. Netherlands 100.00 100.00DDS Bramble B.V. Netherlands n/a 100.00DDS Business Centers B.V. Netherlands 100.00 100.00DDS Conferencing & Catering GmbH Germany 100.00 100.00DDS Edelweiss B.V. Netherlands 100.00 100.00DDS Elm B.V. Netherlands 100.00 100.00DDS Fir B.V. Netherlands 100.00 100.00DDS Hawthorn B.V. Netherlands 100.00 100.00DDS Hazel B.V. Netherlands 100.00 100.00DDS Hyacinth B.V. Netherlands 100.00 100.00DDS Lark B.V. Netherlands 100.00 100.00DDS Lime B.V. Netherlands 100.00 100.00DDS Maple B.V. Netherlands 100.00 100.00DDS Mulberry B.V. Netherlands 100.00 100.00DDS Rose B.V. Netherlands 100.00 100.00DDS Walnut B.V. Netherlands 100.00 100.00DDS Yew B.V. Netherlands 100.00 100.00LB² Catering and Services GmbH Germany 100.00 100.00Marba Daffodil B.V. Netherlands 100.00 n/aMarba Holland B.V. Netherlands 100.00 100.00Marba Lavender B.V. Netherlands 100.00 n/aMarba Olive B.V. Netherlands 100.00 n/aMarba Violin B.V. Netherlands 100.00 n/aMarba Willstätt B.V. Netherlands 100.00 100.00SFG NOVA Construction and Services GmbH Germany 100.00 100.00Sirius Acerola GmbH & Co. KG Germany 100.00 n/aSirius Alder B.V. Netherlands 100.00 100.00Sirius Almond GmbH & Co. KG Germany 100.00 n/aSirius Aloe GmbH & Co. KG Germany 100.00 n/aSirius Ash B.V. Netherlands 100.00 100.00Sirius Aster GmbH & Co. KG K Germany 100.00 n/aSirius Beech B.V. Netherlands 100.00 100.00Sirius Bluebell GmbH & Co. KG Germany 100.00 n/aSirius Coöperatief U.A. Netherlands 100.00 100.00Sirius Corporate Services B.V. Netherlands 100.00 100.00Sirius Facilities (UK) Limited UK 100.00 100.00Sirius Facilities GmbH Germany 100.00 100.00Sirius Finance (Guernsey) Ltd. Guernsey 100.00 100.00Sirius Four B.V. Netherlands 100.00 100.00Sirius Frankfurt Erste GmbH & Co. KG Germany 100.00 n/aSirius Gum B.V. Netherlands 100.00 100.00Sirius Ivy B.V. Netherlands 100.00 100.00Sirius Juniper B.V. Netherlands 100.00 100.00Sirius Krefeld Erste GmbH & Co. KG Germany 100.00 n/aSirius Laburnum B.V. Netherlands 100.00 100.00Sirius Lily B.V. Netherlands 100.00 100.00Sirius Management One GmbH Germany 100.00 100.00Sirius Management Two GmbH Germany 100.00 100.00Sirius Management Three GmbH Germany 100.00 n/aSirius Management Four GmbH Germany 100.00 n/a
110 Sirius Real Estate Limited Annual Report and Accounts 2018Financial statements
Notes to the financial statements continued
for the year ended 31 March 2018
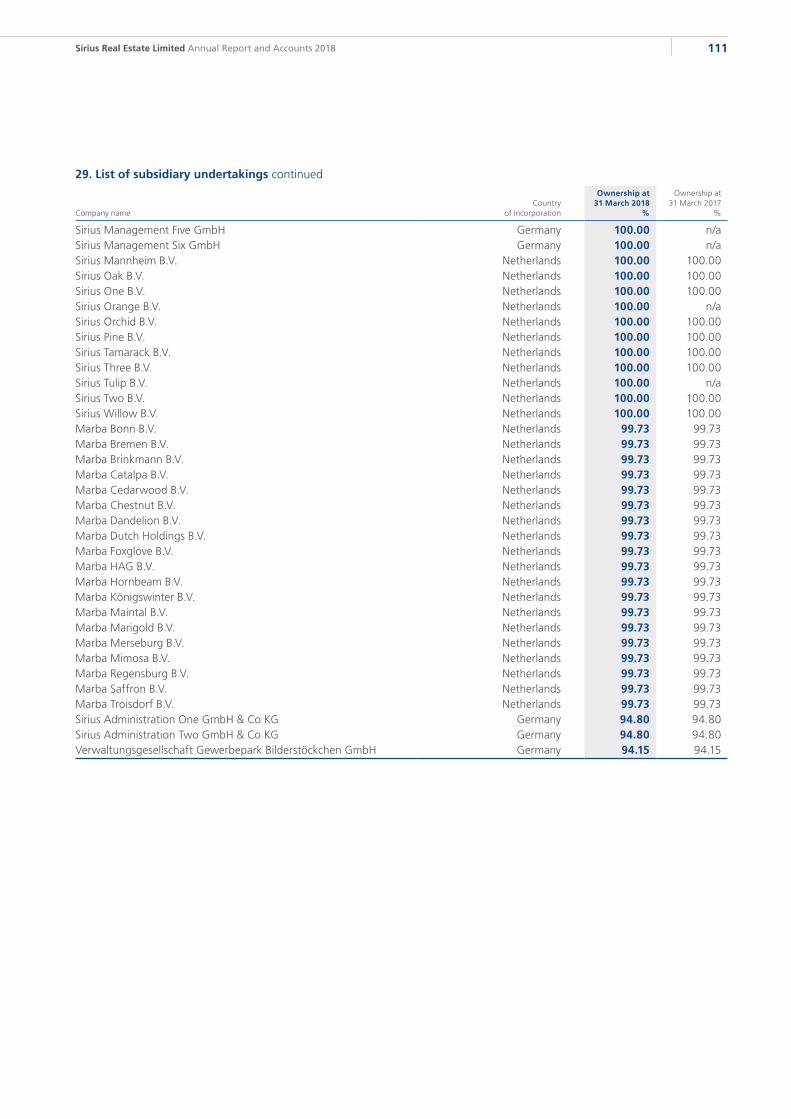
Company nameCountry
of incorporation
Ownership at31 March 2018
%
Ownership at31 March 2017
%
Sirius Management Five GmbH Germany 100.00 n/aSirius Management Six GmbH Germany 100.00 n/aSirius Mannheim B.V. Netherlands 100.00 100.00Sirius Oak B.V. Netherlands 100.00 100.00Sirius One B.V. Netherlands 100.00 100.00Sirius Orange B.V. Netherlands 100.00 n/aSirius Orchid B.V. Netherlands 100.00 100.00Sirius Pine B.V. Netherlands 100.00 100.00Sirius Tamarack B.V. Netherlands 100.00 100.00Sirius Three B.V. Netherlands 100.00 100.00Sirius Tulip B.V. Netherlands 100.00 n/aSirius Two B.V. Netherlands 100.00 100.00Sirius Willow B.V. Netherlands 100.00 100.00Marba Bonn B.V. Netherlands 99.73 99.73Marba Bremen B.V. Netherlands 99.73 99.73Marba Brinkmann B.V. Netherlands 99.73 99.73Marba Catalpa B.V. Netherlands 99.73 99.73Marba Cedarwood B.V. Netherlands 99.73 99.73Marba Chestnut B.V. Netherlands 99.73 99.73Marba Dandelion B.V. Netherlands 99.73 99.73Marba Dutch Holdings B.V. Netherlands 99.73 99.73Marba Foxglove B.V. Netherlands 99.73 99.73Marba HAG B.V. Netherlands 99.73 99.73Marba Hornbeam B.V. Netherlands 99.73 99.73Marba Königswinter B.V. Netherlands 99.73 99.73Marba Maintal B.V. Netherlands 99.73 99.73Marba Marigold B.V. Netherlands 99.73 99.73Marba Merseburg B.V. Netherlands 99.73 99.73Marba Mimosa B.V. Netherlands 99.73 99.73Marba Regensburg B.V. Netherlands 99.73 99.73Marba Saffron B.V. Netherlands 99.73 99.73Marba Troisdorf B.V. Netherlands 99.73 99.73Sirius Administration One GmbH & Co KG Germany 94.80 94.80Sirius Administration Two GmbH & Co KG Germany 94.80 94.80Verwaltungsgesellschaft Gewerbepark Bilderstöckchen GmbH Germany 94.15 94.15
29. List of subsidiary undertakings continued
111Sirius Real Estate Limited Annual Report and Accounts 2018
30. Post balance sheet eventsOn 1 April 2018, the Group completed the acquisition of a business park in Saarbrücken. Total acquisition costs are expected to be €28.1 million. The property is a single building comprising office and conferencing space and has a net lettable area of 47,000sqm. The property is 65% occupied and let to twelve tenants, producing €3.1 million of annual income and having a weighted average remaining lease term of 5.9 years.
On 1 April 2018, the Group completed the acquisition of a second business park located in Düsseldorf. Total acquisition costs are expected to be €8.1 million. The property comprises two buildings of warehouse and office space with a net lettable area of 9,000sqm. The property is 80% occupied and let to three tenants producing €0.6 million annual income and having a weighted average remaining lease term of 4.3 years.
On 19 April 2018, the Group notarised the acquisition of a property located in Friedrichsdorf, near Frankfurt am Main. Total acquisition costs are expected to be €17.8 million. The property is a mixed-use business park and has a net lettable area of c.17,300sqm. The property is 91.8% occupied and let to 18 tenants, producing an annual income of €1.4 million and having a remaining weighted average lease term of 2.3 years. Expected handover is August 2018.
On 30 April 2018, the Group completed the sale of the non-core Bremen Brinkman asset for €15.5 million in line with book value. The asset is a former tobacco manufacturing facility and, at time of sale, generated €0.9 million of net operating income and contained 48,700sqm of vacant space which due to the costs and complexity involved has limited the potential for investment to reconfigure the space.
On 1 June 2018 the Group completed the sale of a vacant residential apartment block in Markgröningen for €0.625 million. The proceeds from the sale will be reinvested into the site.
On 1 June 2018 the Group completed the sale of a 22,000sqm piece of non-income producing land located in Rostock for €1.2 million. The proceeds of the sale will be used to fund ongoing capex investment programmes.
112 Sirius Real Estate Limited Annual Report and Accounts 2018Financial statements
Notes to the financial statements continued
for the year ended 31 March 2018

Non-IFRS measuresYear ended
31 March 2018€000
Year ended31 March 2017
€000
Reported profit for the year 81,363 66,936Surplus on revaluation of investment properties (63,452) (49,782)Loss/(gain) on disposal of properties (including tax) 4,423 (79)Change in fair value of derivative financial instruments (43) (133)Deferred tax in respect of EPRA adjustments 5,492 9,246
EPRA earnings 27,783 26,188Deduct non-controlling interest (91) (25)Add change in deferred tax relating to derivative financial instruments 20 23Add change in fair value of derivative financial instruments 43 133
Headline earnings after tax 27,755 26,319Add/deduct change in fair value of derivative financial instruments net of related tax (63) (156)Add adjusting items(1), net of related tax 8,349 8,801
Adjusted earnings after tax 36,041 34,964
(1) See note 11 to the financial statements.
Year ended31 March 2018
€000
Year ended31 March 2017
€000
EPRA earnings 27,783 26,188Weighted average number of ordinary shares 914,479,339 822,957,685
EPRA earnings per share (cents) 3.04 3.18
Headline earnings after tax 27,755 26,319Weighted average number of ordinary shares 914,479,339 822,957,685
Headline earnings per share (cents) 3.04 3.20
Adjusted earnings after tax 36,041 34,964Weighted average number of ordinary shares 914,479,339 822,957,685
Adjusted earnings per share (cents) 3.94 4.25
2018€000
Total investment properties at book value as at 1 April(1) 823,295Additions 127,799Capital expenditure 20,662Disposals(2) (104,040)Surplus on revaluation above capex 58,971Adjustment in respect of lease incentives (487)Movement in Directors’ discretionary impairment of non-core assets 4,968
Total investment properties at book value as at 31 March(1) 931,168
Additions completed 1 April 2018 (Saarbrücken and Düsseldorf II)(3) 36,149
Adjusted investment properties at book value as at 31 March(1) 967,317
(1) Including assets held for sale.
(2) Including disposals relating to assets held for sale.
(3) Using expected total acquisition costs.
113Sirius Real Estate Limited Annual Report and Accounts 2018
Business analysis

Property analysis
March 2018No. of
propertiesTotal sqm
000 OccupancyRate psm
€
Annualised rent
€m% of portfolio
by rentValue
€m (3) Gross yieldWALE
rentWALE
sqm
Frankfurt 12 286 86.7% 5.89 17.6 22% 210.4 8.3% 2.2 2.2Berlin 6 204 93.6% 5.57 12.7 16% 156.7 8.1% 2.6 2.8Stuttgart 6 232 85.8% 4.41 10.5 13% 119.2 8.8% 3.0 3.2Cologne 7 128 89.0% 6.83 9.3 12% 113.1 8.3% 2.3 2.3Munich 2 105 74.1% 6.06 5.7 7% 101.5 5.6% 3.9 4.6Düsseldorf(1) 8 103 77.7% 5.77 5.5 7% 74.2 7.5% 2.6 2.5Hamburg 2 51 58.1% 4.15 1.5 2% 23.7 6.2% 2.3 2.3Non-core 2 169 43.0% 2.67 2.3 3% 19.3 12.1% 1.5 1.1Other(2) 9 254 79.5% 5.92 14.3 18% 151.7 9.4% 3.6 3.3
Total 54 1,532 79.2% 5.46 79.5 100% 969.8 8.2% 2.8 2.8
(1) Including Düsseldorf II completed 1 April 2018.
(2) Including Saarbrücken completed 1 April 2018.
(3) Cushman & Wakefield valuation with Düsseldorf II and Saarbrücken included at cost.
Usage analysis
Usage% of occupied
sqm% of annualised
rental incomeVacant
sqmRate psm
€
Office 27% 37% 93,265 7.16Storage 32% 22% 130,724 3.80Production 27% 21% 31,477 4.12Other(1) 8% 13% 18,780 8.47Smartspace 5% 7% 25,515 7.19
Total 100% 100% 299,761 5.37
(1) Other includes: catering, other usage, residential, retail, technical space, land and car parking.
114 Sirius Real Estate Limited Annual Report and Accounts 2018Financial statements
Business analysis continued

Adjusted NAV is the assets attributable to the equity holders of the Company adjusted for deferred tax and derivative financial instruments
Annualised rental income is the contracted rental income of a property at a specific reporting date expressed in annual terms
Capital value is the market value of a property divided by the total sqm of a property
EPRA net yield is the net operating income generated by a property expressed as a percentage of its value plus purchase costs
Funds from operations is reported profit before tax adjusted for property revaluation, gain/loss on disposals, change in the fair value of derivative financial instruments, adjusting items, depreciation, amortisation of financing fees and current tax receivable/incurred
Geared IRR is an estimate of the rate of return taking into consideration debt
Gross loan to value ratio is the ratio of principal value of total debt to the aggregated value of investment property
Gross yield is the annualised rental income generated by a property expressed as a percentage of its value
Like for like refers to the manner in which metrics are subject to adjustment in order to make them directly comparable. Like-for-like adjustments are made in relation to annualised rental income, rate and occupancy and eliminate the effect of asset acquisitions and disposals that occur in the reporting period
Net loan to value ratio is the ratio of principal value of total debt less cash, excluding that which is restricted, to the aggregate value of investment property
Net operating income is the income generated by a property less directly attributable costs
Net yield is the net operating income generated by a property expressed as a percentage of its value
Occupancy is the percentage of total lettable space occupied as at reporting date
Operating cash flow on investment (geared)
is an estimate of the rate of return based on operating cash flows and taking into consideration debt
Operating cash flow on investment (ungeared)
is an estimate of the rate of return based on operating cash flows
Rate is rental income per sqm expressed on a monthly basis as at a specific reporting date
Total debt is the aggregate amount of the Company’s interest-bearing loans and borrowings
Total shareholder return based on adjusted NAV
is the return obtained by a shareholder calculated by combining both movements in adjusted NAV per share plus dividends paid
Total return is the return for a set period of time combining valuation movement and income generated
Ungeared IRR is an estimate of the rate of return
Weighted average cost of debt is the weighted effective rate of interest of loan facilities expressed as a percentage
Weighted average debt expiry is the weighted average time to repayment of loan facilities expressed in years
115Sirius Real Estate Limited Annual Report and Accounts 2018
Glossary of terms

Registered officeTrafalgar Court 2nd Floor East Wing Admiral Park St Peter Port Guernsey GY1 3EL Channel Islands
Registered numberIncorporated in Guernsey under the Companies (Guernsey) Law, 2008, as amended, under number 46442
Company SecretaryA L BennettSirius Real Estate LimitedTrafalgar Court 2nd Floor East Wing Admiral Park St Peter Port Guernsey GY1 3EL Channel Islands
UK solicitorsNorton Rose Fulbright LLP3 More London Riverside London SE1 2AQ
Financial PRNovella Communications1a Garrick House Carrington Street London W1J 7AF
JSE sponsorPSG Capital Proprietary Limited1st Floor, Ou Kollege 35 Kerk Street Stellenbosch 7600 South Africa
Joint brokerPeel Hunt LLP120 London Wall London EC2Y 5ET
Joint brokerBerenberg60 Threadneedle Street London EC2R 8HP
Property valuerCushman & Wakefield LLPRathenauplatz 1 60313 Frankfurt am Main Germany
Independent auditorsKPMG LLP15 Canada Square London E14 5GL
Guernsey solicitorsCarey OlsenPO Box 98 7 New Street St. Peter Port Guernsey GY1 4BZ Channel Islands
116 Sirius Real Estate Limited Annual Report and Accounts 2018Financial statements
Corporate directory

Discover more onlinesirius-real-estate.comKeep up to date with our corporate website.
Sirius Real EstateFollow our business on LinkedIn.
@SiriusREFollow our corporate news feeds on Twitter.

Sirius R
eal Estate Limited
An
nu
al Rep
ort an
d A
ccou
nts 2018
Sirius Real Estate LimitedPO Box 119 Martello Court Admiral Park St. Peter Port Guernsey GY1 3HB Channel Islands
www.sirius-real-estate.com