Siraj, Tammeen; The University of Western Ontario, Civil ... · PDF fileASME B31G Modified...
40
Draft Reliability Consistent Mitigation Criteria for Corrosion Defects on Natural Gas Transmission Pipelines Journal: Canadian Journal of Civil Engineering Manuscript ID cjce-2015-0232.R1 Manuscript Type: Article Date Submitted by the Author: 31-Aug-2015 Complete List of Authors: Zhou, Wenxing; The University of Western Ontario Siraj, Tammeen; The University of Western Ontario, Civil and Environmental Engineering Gong, Changqing; The University of Western Ontario, Civil and Environmental Engineering Keyword: Struct.Eng. & Constr.Mate, reliability analyses < Struct.Eng. & Constr.Mate https://mc06.manuscriptcentral.com/cjce-pubs Canadian Journal of Civil Engineering
Transcript of Siraj, Tammeen; The University of Western Ontario, Civil ... · PDF fileASME B31G Modified...

Draft
Reliability Consistent Mitigation Criteria for Corrosion
Defects on Natural Gas Transmission Pipelines
Journal Canadian Journal of Civil Engineering
Manuscript ID cjce-2015-0232R1
Manuscript Type Article
Date Submitted by the Author 31-Aug-2015
Complete List of Authors Zhou Wenxing The University of Western Ontario Siraj Tammeen The University of Western Ontario Civil and Environmental Engineering Gong Changqing The University of Western Ontario Civil and Environmental Engineering
Keyword StructEng amp ConstrMate reliability analyses lt StructEng amp ConstrMate
httpsmc06manuscriptcentralcomcjce-pubs
Canadian Journal of Civil Engineering
Draft
Reliability Consistent Mitigation Criteria for Corrosion Defects on Natural
Gas Transmission Pipelines
W Zhou1 T Siraj
2 and C Gong
2
1 Corresponding author Associate Professor Department of Civil and Environmental
Engineering The University of Western Ontario 1151 Richmond Street London ON N6A
5B9 Email wzhouenguwoca Tel 519-661-2111 x 87931 Fax 519-667-3779
2 PhD Candidate Department of Civil and Environmental Engineering The University of
Western Ontario London ON N6A 5B9
Word count approximately 9000 word equivalents
Page 1 of 39
httpsmc06manuscriptcentralcomcjce-pubs
Canadian Journal of Civil Engineering
Draft
Abstract
This article deals with reliability-based mitigation of metal-loss corrosion defects on steel
natural gas transmission pipelines The failure pressure ratios (FPRs) and probabilities of
burst associated with corrosion defects with various sizes on representative gas pipelines are
evaluated using the ASME B31G Modified model and first-order reliability method (FORM)
The pipelines considered have different values of the maximum operating pressure steel
grade wall thickness outside diameter and utilization factor The analysis results suggest
that FPR and the reliability index corresponding to the probability of burst follow a linear
relationship for pipelines with the same utilization factor Based on the analysis results
linear regression equations that relate FPR to the reliability index are developed for pipelines
with different utilization factors The equation can be employed to determine the threshold
FPR corresponding to a target reliability index (or allowable probability of burst) for a given
utilization factor to identify critical corrosion defects for mitigation This study will facilitate
the risk- and reliability-based corrosion management of gas transmission pipelines
Keyword Gas transmission pipeline Metal-loss corrosion probability of burst reliability
index failure pressure ratio and utilization factor
Page 2 of 39
httpsmc06manuscriptcentralcomcjce-pubs
Canadian Journal of Civil Engineering
Draft
Introduction
Metal-loss corrosion is one of the leading causes for failures of buried steel oil and gas
transmission pipelines (Nessim et al 2009) Corrosion defects compromise the ability of
pipelines to contain the internal pressure A corroded pipeline will burst due to its internal
pressure if the depth (in the through-pipe wall thickness direction) and length (in the pipeline
longitudinal direction) of the corrosion defect are sufficiently large Many empirical or semi-
empirical burst pressure capacity models for corroded pipelines have been developed in the
past for example the well known ASME B31G Modified DNV and PCORRC models (Zhou
and Huang 2012) Although in various forms these models generally are functions of the
depth and length of the corrosion defect pipe geometry (ie diameter and wall thickness) and
material strength (eg yield strength tensile strength or flow stress)
To manage the structural integrity of pipelines with respect to corrosion pipeline engineers
typically use the high-resolution in-line inspections (ILI) tools to periodically detect locate
and size the corrosion defects Based on the ILI-reported sizes of the defects burst pressure
capacity models are employed to compute the capacities of the pipeline at the locations of the
defects A failure pressure ratio (FPR) for each defect is then evaluated as the ratio between
the burst pressure capacity of the pipeline evaluated at the defect and maximum operating
pressure (MOP) of the pipeline Finally those defects that have FPRs less than a pre-selected
threshold FPR (eg 11 or 125) are deemed critical and subsequently mitigated through field
excavation and repair There is inconsistency in the selection of the threshold FPR in the
current practice (Kariyawasam and Huang 2014) For example ASME B318S (ASME 2010)
recommends a threshold FPR of 11 for all gas pipelines whereas the Canadian standard CSA
Z662 (CSA 2011) recommends different threshold FPRs for gas pipelines in different class
Page 3 of 39
httpsmc06manuscriptcentralcomcjce-pubs
Canadian Journal of Civil Engineering
Draft
locations (the meaning of the class location is explained in the next section) eg threshold
FRPs of 125 139 179 and 227 for Classes 1 2 3 and 4 pipelines respectively
Many uncertainties are involved in the pipeline corrosion management the ILI tool is
imperfect and associated with measurement errors the actual geometric and material
properties of the pipeline are uncertain and the burst pressure capacity models are not
perfectly accurate and therefore involve model errors As a result the reliability-based
corrosion management is being increasingly adopted by pipeline operators because it provides
a rationale framework to deal with the aforementioned uncertainties One desirable outcome
of the reliability-based corrosion management is to identify critical corrosion defects for
mitigation based on consistent levels of the probability of burst that is a given corrosion
defect will be mitigated if the probability of burst of the pipeline at the defect exceeds a pre-
defined allowable probability of burst Questions therefore arise as to the implied reliability
levels associated with the currently-used threshold FPRs Furthermore because it may not be
practical to require pipeline engineers to evaluate the probability of burst corresponding to
each individual defect a practical means to achieve reliability-consistent mitigations of
corrosion defects is to determine the threshold FPR corresponding to a given allowable
probability of burst Such a study which is somewhat similar to the calibration of the load
and resistance factors for the design of buildings and bridges (eg Bartlett et al 2003 Nowak
1995) however has not been reported in the literature
The objectives of the work reported in this paper were to 1) investigate the implied reliability
levels associated with the threshold FPR values employed in the current corrosion mitigation
practice and 2) determine the threshold FPR levels corresponding to different allowable
probabilities of burst to facilitate the reliability-consistent corrosion mitigation The study
Page 4 of 39
httpsmc06manuscriptcentralcomcjce-pubs
Canadian Journal of Civil Engineering
Draft
was focused on natural gas transmission pipelines designed according to the Canadian
Standards Association (CSA) Z662-11 Oil and Gas Pipeline Systems (CSA 2011) Liquid
transmission pipelines were excluded because of a lack of probabilistic characteristics of the
internal pressure in the literature A set of representative gas pipelines with different values
of the outside diameter steel grade operating pressure and wall thickness were developed
The ASME B31G Modified model (Kiefner and Vieth 1989) which is widely used in the
industry to predict burst capacities of corroded pipelines was employed to evaluate FPRs for
the analysis cases with corrosion defects of various sizes and also incorporated in the first-
order reliability method (FORM) (Melchers 1999 Low and Tang 1997 2007) to evaluate the
corresponding probabilities of burst The uncertainties in the defect sizes pipe geometric and
material properties internal pressure and accuracy of the B31G Modified model were
considered in the reliability analysis
The rest of the paper is organized as follows The next section briefly describes the design of
gas transmission pipelines according to CSA Z662 followed by the description of the B31G
Modified model and determination of FPR After that the analysis cases methodology for
the reliability analysis and probabilistic characteristics of the uncertain parameters involved in
the analysis are presented The Analysis Results section presents the results of the
reliability analysis the implied reliability levels associated with the currently-used threshold
FPRs and development of the empirical relationship between FPR and the probability of burst
Two illustrate examples are employed to illustrate the application of the relationship between
FPR and the probability of burst to achieve reliability-consistent corrosion mitigation
followed by discussion and conclusions
Design of Gas Pipelines per CSA Z662
Page 5 of 39
httpsmc06manuscriptcentralcomcjce-pubs
Canadian Journal of Civil Engineering
Draft
The design criterion for steel gas transmission pipelines prescribed in CSA Z662-11 can be
generally summarized as follows
[1] UF = ∙∙13 le ∙
where UF is defined as the utilization factor in this study but is often referred to as the
SMYS factor in practice (Kariyawasam and Huang 2014) tn is the nominal pipe wall
thickness Pd is the design pressure D is the nominal pipe outside diameter SMYS is the
specified minimum yield strength of the pipe steel F is the design factor and equals 08 and
L is the location factor that depends on the class location of the pipeline Because the actual
pipe outside diameter typically equals the nominal outside diameter with negligible
uncertainty (CSA 2011) no distinction is made between these two quantities and a single
notation D for the pipe outside diameter is used throughout the paper
The class location characterizes the population density in the vicinity of the pipeline There
are four class location designations namely Classes 1 2 3 and 4 for gas pipelines The
population density increases as the class location increases with Class 1 representing sparsely
populated areas and Class 4 representing high population density areas such as city centres
(CSA 2011) For pipelines that transport non-sour natural gas and are not near roads or
railways (which is the most common scenario) L equals 10 09 07 and 055 for Classes 1 2
3 and 4 respectively It follows that the product of F and L equals 08 072 056 and 044
for most Classes 1 2 3 and 4 gas pipelines respectively per CSA Z662-11
In most cases UF equals FL Given UF Pd D and SMYS the nominal pipe wall thickness
that satisfies the design criterion can be readily determined from Eq [1] However UF is less
Page 6 of 39
httpsmc06manuscriptcentralcomcjce-pubs
Canadian Journal of Civil Engineering
Draft
than FL if tn is governed by the minimum wall thickness requirement resulting from
constructability considerations (CSA 2011) The required minimum wall thickness increases
with the pipe diameter for instance it equals 40 mm for D = 2731 mm ie nominal pipe
size (NPS) 10 inches and 48 mm for D = 508 mm (NPS 20) (CSA 2011)
ASME B31G Modified Model and FPR
Suppose that a metal-loss corrosion defect on a pipeline has been detected and sized by ILI
The nominal burst pressure capacity of the pipeline at the defect Pbn can be evaluated from
the following equation based on the ASME B318 Modified model
[2a] = (13) $ $ amp) le 08
[2b] = -1 + 06275 56 minus 0003375 59()6 56 le 5033 + 0032 56 56 gt 50
where SMYS + 6895 (MPa) (or equivalently SMYS + 10 (ksi)) represents the flow stress of
the pipe steel dILI and lILI are the maximum depth (the defect typically has an irregular
through-thickness profile with varying depths along the profile) and length reported by ILI
respectively and M is the bulging or Folias factor It should be noted that the flow stress is
an empirical concept used to convert the stress-strain relationship of a strain-hardening
elastic-plastic material into an equivalent elastic-perfectly plastic stress-strain relationship
(Cosham and Hopkins 2002) While a commonly adopted definition of the flow stress is the
average of the yield and tensile strengths the flow stress is defined as SMYS + 6895 (MPa)
in the B31G Modified model The adequacy of such a definition especially for high-grade
Page 7 of 39
httpsmc06manuscriptcentralcomcjce-pubs
Canadian Journal of Civil Engineering
Draft
pipe steels can be a subject of future investigations As indicated in Eq [2a] the B31G
Modified model is only applicable to defects that are no more than 80 through the pipe wall
thickness Finally it is worth mentioning that commonly used ILI tools (eg the magnetic
flux leakage tool) typically report dILI as a fraction of tn ie dILItn but lILI as an absolute value
Let Po (Po le Pd) denote the MOP of the pipeline The FPR associated with the corrosion
defect can be simply evaluated as Pbn divided by Po It follows from Eq [1] that FPR can be
written as
[3] FPR = =gt = (13)13AB $ $ amp) le 08
[4] UFC = UF ∙ DgtE = gt∙∙13 where UFa is the de-facto utilization factor of the pipeline during operation which reflects a
combination of the safety margin incorporated in the design and any additional safety margin
resulting from the pipeline not operating at its full design capacity ie Po lt Pd
Equation [3] indicates that FPR evaluated from the B31G Modified model depends on
(SMYS+6895)SMYS UFa dILItn and lILI Because UFa usually corresponds to the class
location the recommendation in CSA Z662-11 that the threshold FPR be dependent on the
class location of the pipeline is justified Given SMYS dILItn and lILI a larger UFa leads to a
lower FPR and a smaller UFa leads to a higher FPR It is interesting to evaluate the upper
bound FPR FPRmax ie the value of FPR corresponding to an infinitesimally small defect It
follows from Eq [3] that FPRmax = (SMYS+6895)(UFaSMYS) For commonly used pipe
Page 8 of 39
httpsmc06manuscriptcentralcomcjce-pubs
Canadian Journal of Civil Engineering
Draft
steel grades with SMYS ranging from 290 to 483 MPa ie X42 to X70 grades (API 2004)
the values of (SMYS+6895)SMYS and FPRmax are listed in Table 1
Analysis Cases
We considered a set of 20 representative pipelines corresponding to three diameters (D = 273
(NPS 10) 406 (NPS 16) and 762 (NPS 30) mm) three SMYS values (SMYS = 289 359 and
483 MPa) and two MOPs (Po = 40 and 60 MPa) These pipelines cover wide ranges of tn
(from 40 to 179 mm) and UFa (from 028 to 080) as shown in Table 2 Note that cases 19
and 20 in the table were selected to represent small-diameter low-pressure pipelines for
which the minimum wall thicknesses requirement (CSA 2011) governs and consequently
results in low utilization factors For each pipeline a total of 24 representative corrosion
defects corresponding to all combinations of four dILItn values (dILItn = 025 035 045 and
05) and six lILI values (lILI = 50 100 150 200 300 and 400 mm) were considered
Methodology and Input for the Reliability Analysis
The limit state function for burst of a pipeline at a corrosion defect g can be written as
[5] F = minus 1
where Pb is the actual (as opposed to nominal) burst pressure capacity at the defect P is the
internal pressure of the pipeline and g le 0 represents failure (ie burst) It must be
emphasized that P is a random quantity whereas Pd and Po are both nominal pressure
parameters Pb is evaluated using the B31G Modified model as follows
[6] = G (HI) $ J$ amp) le 08
Page 9 of 39
httpsmc06manuscriptcentralcomcjce-pubs
Canadian Journal of Civil Engineering
Draft
[7] K = -1 + 06275 56 minus 0003375 59()6 56 le 5033 + 0032 56 56 gt 50
where ξ is the model error associated with the B31G Modified model t is the actual pipe wall
thickness σy is the yield strength of the pipe steel and d and l are the actual maximum depth
and length of the corrosion defect respectively The probability of failure (burst) pf is given
by
[8] LM = N OP(Q)RQSTU
where fX(x) denotes the joint probability density of the random variables involved in the limit
state function The FORM was employed in this study to evaluate the integral in Eq [6] by
calculating the reliability index β which is the shortest distance from the origin to the limit
state surface in the standard normal space The probability of burst is then evaluated as pf =
Φ(-β) with Φ(bull) being the standard normal distribution function
Ideally the time-dependency of the probability of burst should be taken into account because
the corrosion defect grows in size with time and the internal pressure of the pipeline also
fluctuates with time Because the corrosion mitigation is typically carried out a relatively
short time (say within a year) after ILI the reliability analysis was simplified as time-
independent in this study That is the growth of the corrosion defect was ignored and the
internal pressure was assumed to be a time-independent random variable represented by the
annual maximum operating pressure The probability of burst evaluated is therefore with
respect to a period of one year
Page 10 of 39
httpsmc06manuscriptcentralcomcjce-pubs
Canadian Journal of Civil Engineering
Draft
The B31G Modified model is applicable for dt le 08 but the FORM analysis may involve
the evaluation of Pb corresponding to 08 lt dt le 1 during the search for the design point or
the most probable failure point To deal with this issue a simple and practical extension of
the B31G Modified model was employed (Zhou and Zhang 2015) Pb was assumed to
decrease linearly from that calculated using Eq [6] at dt = 08 to zero at dt = 1
The statistical information summarized in Annex O of CSA Z662-11 indicates that ttn
generally follows a normal distribution with the mean ranging from 10 to 101 and the
coefficient of variation (COV) ranging from 10 to 17 Therefore ttn was assumed to be
normally distributed with the mean equal to unity and COV equal to 15 in this study Jiao
et al (1995) reported that σySMYS can be characterized by an either normal or lognormal
distribution with the mean ranging from 108 to 111 and COV ranging from 33 to 35
based on statistical analyses of extensive coupon test data Jiao et al also suggested that the
annual maximum operating pressure for gas pipelines can be characterized by a Gumbel
distribution with the mean between 103Po and 107Po and COV between 1 and 2
However it is pointed out in Annex O of CSA Z662-11 that this distribution is applicable to
locations immediately downstream of a compressor station Because the pressure drops along
the pipeline between compressor stations this distribution is a conservative estimate of the
annual maximum operating pressure at locations further downstream of a compressor station
It is further indicated in Annex O of CSA Z662-11 that the annual maximum operating
pressure of gas pipelines follows a beta distribution with the mean equal to 0993Po and COV
equal to 34 based on pressure records from one pipeline operator In this study σySMYS
was assumed to follow a lognormal distribution with the mean equal to 11 and COV equal to
Page 11 of 39
httpsmc06manuscriptcentralcomcjce-pubs
Canadian Journal of Civil Engineering
Draft
35 and PPo was assumed to follow a Gumbel distribution with the mean equal to unity
and COV equal to 30
Zhou and Zhang (2015) showed that the model error for the burst pressure capacity model is
critically important for evaluating the probability of burst of pipelines containing corrosion
defects Zhou and Huang (2012) evaluated the model errors associated with eight well-
known burst pressure capacity models for corroded pipes based on 150 full-scale burst tests
of pipe segments containing single isolated natural corrosion defects (as opposed to machined
defects) collected from the literature They suggested that the model error for the B31G
Modified model be characterized by a Gumbel distribution with the mean and COV equal to
1297 and 258 respectively This model error was adopted in this study
By assuming additive measurement errors (DNV 2010 Zhou and Nessim 2011) the ILI-
reported defect depth and length are related to the actual defect depth and length respectively
as follows
[9a] RVWV = R + X)
[9b] YVWV = Y + X5 where εd and εl are the measurement errors associated with the maximum depth and length
respectively It is common to assume that εd and εl follow normal distributions with a zero
mean (DNV 2010 Zhou and Nessim 2011) The standard deviations of εd and εl can then be
inferred from typical specifications of ILI tools ie dILI and lILI within plusmn10tn and plusmn10 mm of
d and l respectively 80 of the time (Stephens and Nessim 2006) Table 3 summarizes the
Page 12 of 39
httpsmc06manuscriptcentralcomcjce-pubs
Canadian Journal of Civil Engineering
Draft
probabilistic characteristics of the random variables involved in the reliability analysis It is
assumed that all the random variables are mutually independent of each other
It is advantageous to write PbP in the limit state function (ie Eq [5]) in the following form
[10] = G D $$ED ZI[[] ^[[EABD __gtE D $$EUD$ `$ED $$E J D$ `$Eamp Equation [10] suggests that given dILItn and lILI the probability of burst is largely dependent
on UFa a larger UFa leads to a higher probability of burst and a smaller UFa leads to a lower
probability of burst
Analysis Results
The values of FPR corresponding to the assumed 24 corrosion defects are plotted against the
reliability indices obtained from the FORM analysis in Fig 1 for an analysis case (case 8)
arbitrarily selected from Table 2
Two observations of Fig 1 are in order First there is essentially a one-to-one relationship
between FPR and the reliability index (probability of burst) for the pipeline The reliability
index increases monotonically as FPR increases for example FPR and β equal 130 and 243
respectively corresponding to dILItn =045 and lILI = 150 mm and 134 and 259 respectively
corresponding to dILItn =035 and lILI = 200 mm There are a few anomalies in the FPR - β
relationship if FPRs corresponding to different defects are very close For example FPR
equals 138 for dILItn = 025 and lILI = 400 mm with the corresponding β equal to 267
whereas FPR equals 137 for dILItn = 05 and lILI = 100 mm with the corresponding β equal to
269 Such anomalies however can be attributed to the minor numerical inaccuracies
Page 13 of 39
httpsmc06manuscriptcentralcomcjce-pubs
Canadian Journal of Civil Engineering
Draft
involved in the FORM analysis and are considered inconsequential Second the relationship
between FPR and β for the pipeline is almost perfectly linear For the other analysis cases
shown in Table 2 the above observations are equally applicable
The approximately linear relationship between FPR and β as demonstrated in Fig 1 deserves
some explanations To this end the limit state function given by Eq [5] is rewritten as
follows
[11] F = ( ==)( =) minus 1
The internal pressure P is expressed as γPo (γ is a Gumbel-distributed random variable with
the mean equal to unity and COV equal to 3 as indicated in Table 3) whereas Pbn equals
FPRtimesPo It follows that Eq [11] is now
[12] F = Aabc d minus 1
where X = PbPbn is a random variable representing the burst pressure capacity normalized by
Pbn The burst condition ie g lt 0 is equivalent to ln(FPRXγ) lt 0 The simple Monte
Carlo simulation of X was carried out based on the statistics of the basic parameters
summarized in Table 3 The results indicated that the lognormal distribution can fit simulated
samples of X reasonably well with the COV of X being around 26 Because the uncertainty
in X is much higher than that in γ γ is simplified as a deterministic quantity for the purpose of
investigating the relationship between FPR and β Given the above β can now be obtained as
[13] e asymp 5Aabghi5cHhi
Page 14 of 39
httpsmc06manuscriptcentralcomcjce-pubs
Canadian Journal of Civil Engineering
Draft
where mlnX and σlnX are the mean and standard deviation of lnX respectively Within the
relatively narrow range of FPR values for a given pipeline (eg between 10 and 17 for case
8 and between 25 and 36 for case 19 in Table 2) lnFPR is an almost linear function of
FPR It then follows that the FPR-β relationship is approximately linear
In each of Figs 2(a) through 2(h) FPRs are plotted against the corresponding β values for all
the analysis cases with the same UFa Figure 2 suggests that somewhat surprisingly the
above-described two observations about the FPR -β relationship for a given pipeline are also
applicable to different pipelines with the same UFa although there is slightly more scatter in
the data That is the FPR - β relationship only depends on UFa and is independent of the
other pipeline attributes such as the diameter pressure SMYS and wall thickness For a
given UFa the following equation is proposed to relate FPR to β
[14] FPR = je + k
where a and b are coefficients obtained from the simple linear regression analysis The
values of a and b corresponding to different values of UFa are summarized in Table 4 Also
shown in Table 4 is the range of β values (and the corresponding range of probabilities of
burst) over which Eq [14] was developed for each UFa ie the range of β values
corresponding to the 24 corrosion defects considered in the analysis Implications of these
ranges for the practical application are discussed in the next section
The threshold FPR corresponding to a selected target reliability index βt (or equivalently an
allowable probability of burst pfa) can be readily obtained from Eq [14] for UFa values given
in Table 4 The threshold FPR for a value of UFa not given in Table 4 can be determined by a
Page 15 of 39
httpsmc06manuscriptcentralcomcjce-pubs
Canadian Journal of Civil Engineering
Draft
linear interpolation of the threshold FPRs corresponding to the two nearest bounding UFa
values given in the table Furthermore values of βt and pfa implied by the threshold FPRs
recommended by ASME B318S and CSA Z662-11 were obtained from Eq [14] and are
summarized in Table 5 The results in Table 5 suggest that the threshold FPR of 11
recommended by ASME B318S leads to relatively low target reliability levels For pipelines
with high class location designations (ie high population density in the vicinity of the
pipelines) and thus low UFa values such as 056 and 044 the implied target reliability levels
appear too low to be commensurate with the potentially severe human safety-related
consequences of burst associated with such pipelines (Nessim et al 2009) On the other hand
the target reliability level implied by the threshold FPR recommended by CSA Z662-11
increases markedly as the class location increases βt increases from 226 for Class 1 pipelines
(UFa = 080) to 502 for Class 4 pipelines (UFa = 044) with the corresponding pfa decreasing
by approximately five orders of magnitude from 12 times 10-2
to 26 times 10-7
Considering that pfa
= 26 times 10-7
is an extremely low failure probability the threshold FPR of 227 for Class 4
pipelines is perhaps overly stringent The drawback of the CSA Z662 threshold FPRs
however is that they are associated with the class location of the pipeline rather than UFa
(Kariyawasam and Huang 2014) Two pipelines with the same class location can have
different values of UFa In this case applying the same CSA Z662 threshold FPR will lead to
different implied reliability levels for the two pipelines This drawback is overcome by the
use of Eq [14] and Table 4 For example consider two Class 2 pipelines with UFa equal to
072 and 060 respectively From Eq [14] and Table 4 the implied values of βt were
determined to be 275 (pfa = 30 times 10-3
) and 265 (pfa = 40 times 10-3
) for UFa = 072 and 060
Page 16 of 39
httpsmc06manuscriptcentralcomcjce-pubs
Canadian Journal of Civil Engineering
Draft
respectively corresponding to the CSA Z662 threshold FPR of 139 To achieve βt = 275 for
the pipeline with UFa = 060 the corresponding threshold FPR should be 142
Illustrative Examples
In this section two hypothetical examples are used to validate Eq [14] as well as illustrate its
application The first example involves a pipeline with D = 508 mm (NPS 20) SMYS = 359
MPa Po = 70 MPa tn = 69 mm and UFa = 072 It is assumed that an allowable probability
of burst of 10 times 10-3
(ie βt = 309) is selected for mitigating the defects on the pipeline The
corresponding threshold FPR is then determined as 148 from Eq [14] Consider three
representative corrosion defects with FPRs equal to the threshold FPR of 148 The ILI-
reported depths and lengths of these defects are summarized in Table 6 The probabilities of
burst of the three defects were evaluated using the FORM based on the same statistical
information as summarized in Table 3 and are shown in Table 6 As the probabilities of burst
associated with all three defects are slightly (10 - 15) below 10 times 10-3
the results
demonstrate the validity and simplicity of using Eq [14] to achieve reliability-consistent
mitigation of corrosion defects
The second example involves a pipeline with D = 6096 mm (NPS 24) SMYS = 448 MPa Po
= 68 MPa tn = 71 mm and UFa = 065 An allowable probability of burst of 50 times 10-4
(ie
βt = 329) was assumed for the defect mitigation The corresponding threshold FPR was
calculated to be 156 by linearly interpolating the FPR values corresponding to βt = 329 for
UFa = 072 and 060 respectively Consider three representative corrosion defects that have
FPRs equal to 156 The ILI-reported depths and lengths of the defects as well as the
probabilities of burst associated with the defects are also shown in Table 6 As indicated in
Page 17 of 39
httpsmc06manuscriptcentralcomcjce-pubs
Canadian Journal of Civil Engineering
Draft
the table the three probabilities of burst are about 15 - 20 below 50 times 10-4
which again
demonstrates the validity of Eq [14]
Discussion
The FPRs corresponding to the set of 24 corrosion defects included in the analysis are
representative of FPRs for the corrosion defects found in practice As such the ranges of β
values given in Table 4 are representative for the corresponding values of UFa Although Eq
[14] can be extrapolated to β values beyond the ranges given in Table 4 the extrapolation
may result in threshold FPRs that are either impractical or non-governing For example a βt
of 35 (pfa = 23 times 10-4
) for UFa = 080 which is greater than the upper bound of the
corresponding β range given in Table 4 results in a threshold FPR of 155 This threshold
FPR is clearly impractical for pipelines with UFa = 080 and SMYS ge 290 MPa (ie X42) as
the corresponding values of FPRmax are all less than or equal to 155 (see Table 1) On the
other hand a βt of 30 (pfa = 14 times 10-3
) for UFa = 044 which is smaller than the lower bound
of the corresponding β range results in a threshold FPR of 151 If this threshold FPR is
applied to case 18 (D = 762 mm SMYS = 483 MPa and tn = 108 mm) in Table 2 any
corrosion defects with dILItn lt 076 and lILI lt 150 mm will be considered non-critical as the
corresponding FPRs are greater than 151 In practice however most pipeline operators will
mitigate defects with dILItn gt 060 - 070 regardless of their FPRs (Kariyawasam and Huang
2014) Such a practice may also dictate the mitigation of defects on pipelines governed by
the minimum wall thickness requirement eg the cases with UFa = 035 and 028 in Table 2
unless a high target reliability level (eg βt gt 40) is justified for such pipelines
Page 18 of 39
httpsmc06manuscriptcentralcomcjce-pubs
Canadian Journal of Civil Engineering
Draft
It must be emphasized that Eq [14] and Table 4 are valid for a particular burst pressure
capacity model ie the ASME B31G Modified model and a specific set of input in the
reliability analysis as summarized in Table 3 A re-evaluation of the FPR-β relationship is
needed if a different burst pressure capacity model eg the ASME B31G or PCORRC model
is employed to determine FPR andor if the probabilistic characteristics of ttn σySMYS
PPo εd and εl for a specific pipeline deviate from those summarized in Table 3 to the extent
that the use of Eq [14] and Table 4 results in significantly non-conservative threshold FPRs
Conclusions
This study investigated the relationship between FPR and the probability of burst for metal-
loss corrosion defects on natural gas transmission pipelines designed per CSA Z662-11 The
ASME B31G Modified model was employed to evaluate the burst pressure capacity of the
pipeline at the corrosion defect A set of 20 representative gas pipelines with different
diameters maximum operating pressure and steel grades were developed corresponding to
wide ranges of the pipe wall thickness and utilization factor (UFa) For each pipeline FPRs
for 24 representative corrosion defects with dILItn ranging from 025 to 05 and lILI ranging
from 50 to 400 mm were evaluated using the B31G Modified model Furthermore the
FORM was employed to evaluate the probability of burst of the pipeline at each of the 24
corrosion defects by taking into account uncertainties in the wall thickness yield strength and
internal pressure measurement errors associated with the ILI-reported defect sizes and the
model error associated with the B31G Modified model
The analysis results suggest that a unique linear relationship exists between FPR and the
reliability index (β) corresponding to the probability of burst for different pipelines with the
Page 19 of 39
httpsmc06manuscriptcentralcomcjce-pubs
Canadian Journal of Civil Engineering
Draft
same utilization factor Simple linear regression equations between FPR and β for different
utilization factors were then developed on the basis of the analysis results These equations
allow rapid determination of the threshold FPR corresponding to a given target reliability
level for the purpose of identifying critical defects thus achieving reliability-consistent
mitigation of corrosion defects on pipelines Two examples were used to illustrate the
application and validity of the developed equations The implied reliability levels associated
with the threshold FPRs recommended by ASME B318S and CSA Z662-11 were also
clarified based on the FPR - β equations developed It is observed that the ASME B318S
threshold FPR implies relatively low reliability levels especially for pipelines with high class
location designations whereas the reliability levels implied by the CSA Z662 threshold FPRs
increase markedly as the class location increases Finally it is emphasized that the
application of the proposed FPR - β equation to a specific pipeline is predicated on the B31G
Modified model as well as the condition that the probabilistic characteristics of the relevant
random variables for the pipeline do not deviate markedly from those assumed in this study
Acknowledgement
The authors gratefully acknowledge the financial support provided by TransCanada Pipelines
Ltd and the Natural Sciences and Engineering Research Council of Canada (NSERC) in the
form of a Collaborative Research and Development project (CRDPJ 470571-14) Helpful
comments from the two anonymous reviewers are appreciated
Page 20 of 39
httpsmc06manuscriptcentralcomcjce-pubs
Canadian Journal of Civil Engineering
Draft
References
American Petroleum Institute (API) 2004 API Specification 5L specification for line pipe
American Petroleum Institute Washington DC
American Society of Mechanical Engineers (ASME) 2010 ASME B318S-2010 Managing
system integrity of gas pipelines ASME Code for Pressure Piping B31 Supplement to
ASME B318 American Society of Mechanical Engineers New York
Bartlett F M Hong H P and Zhou W 2003 Load factor calibration for the proposed 2005
edition of the National Building Code of Canada companion action load combination
Canadian Journal of Civil Engineering 30 440-448
Cosham A and Hopkins P 2002 The pipeline defect assessment manual In Proceedings
of the 4th
International Pipeline Conference Calgary 29 Sept - 3 Oct 2002 American Society
of Mechanical Engineers IPC2002-27067
Canadian Standards Association (CSA) 2011 CSA Z662 Oil and gas pipeline systems
Canadian Standards Association Mississauga Ontario
Det Norske Veritas (DNV) 2010 DNV RP-F101 Corroded pipelines DNV Recommended
Practice Det Norske Veritas Hovik Norway
Jiao G Sotberg T and Igland R T 1995 SUPERB 2M statistical data-basic uncertainty
measures for reliability analysis of offshore pipelines SUPERB JIP Report No STF70-
F95212 Norwegian Marine Technology Research Institute Trondheim Norway
Page 21 of 39
httpsmc06manuscriptcentralcomcjce-pubs
Canadian Journal of Civil Engineering
Draft
Kariyawasam S and Huang T 2014 How safe failure pressure ratios are related to SMYS
In Proceedings of the 10th
International Pipeline Conference Calgary 29 Sept - 3 Oct 2014
American Society of Mechanical Engineers IPC2014-33647
Kiefner J F and Vieth P H 1989 A modified criterion for evaluating the remaining
strength of corroded pipe PR 3-805 American Gas Association Washington DC
Low B K and Tang W H 1997 Efficient reliability evaluation using spreadsheet Journal
of Engineering Mechanics ASCE 123(7) 749-752
Low B K and Tang W H 2007 Efficient spreadsheet algorithm for first-order reliability
method Journal of Engineering Mechanics ASCE 133(12) 1378-1387
Melchers R E 1999 Structural reliability analysis and prediction 2nd Ed John Wiley amp
Sons Chichester England
Nessim M A Zhou W Zhou J Rothwell B and McLamb M 2009 Target reliability
levels for design and assessment of onshore natural gas pipelines Journal of Pressure Vessel
Technology ASME 131(6) 061701 1-12
Nowak AS 1995 Calibration of LRFD bridge code Journal of Structural Engineering
ASCE 121(8) 1245-1251
Stephens M and Nessim M A 2006 Comprehensive approach to corrosion management
based on structural reliability methods In Proceedings of 6th International Pipeline
Conference Calgary 25 - 29 Sept 2006 American Society of Mechanical Engineers
IPC2006-10458
Page 22 of 39
httpsmc06manuscriptcentralcomcjce-pubs
Canadian Journal of Civil Engineering
Draft
Zhou W and Zhang S 2015 Impact of model errors of burst capacity models on the
reliability evaluation of corroding pipelines Journal of Pipeline Systems Engineering and
Practice DOI 101061(ASCE)PS1949-12040000210 04015011 1-11
Zhou W and Huang GX 2012 Model error assessments of burst capacity models for
corroded pipelines International Journal of Pressure Vessels and Piping 99-100 1-8
Zhou W and Nessim MA 2011 Optimal deign of onshore natural gas pipelines Journal
of Pressure Vessel Technology ASME 133(3) 031702 1-11
Page 23 of 39
httpsmc06manuscriptcentralcomcjce-pubs
Canadian Journal of Civil Engineering
Draft
Table 1 Values of FPRmax for different pipe steel grades
Steel Grade X42 X52 X60 X65 X70
SMYS (MPa) 290 359 413 448 483
(SMYS+6895)SMYS 124 119 117 115 114
FPRmax
UFa = 08 155 149 146 144 143
UFa = 072 172 165 163 160 158
UFa = 056 221 213 209 205 204
UFa = 044 282 270 266 261 259
Page 24 of 39
httpsmc06manuscriptcentralcomcjce-pubs
Canadian Journal of Civil Engineering
Draft
Table 2 Attributes of representative pipelines considered in the analysis
Case
No
Po
(MPa)
SMYS
(MPa)
D
(mm)
tn
(mm)
UFa
1 6 290 762 99 080
2 6 290 762 109 072
3 6 290 762 131 060
4 6 290 762 141 056
5 6 290 762 158 050
6 6 290 762 179 044
7 6 359 762 80 080
8 6 359 762 88 072
9 6 359 762 106 060
10 6 359 762 114 056
11 6 359 762 127 050
12 6 359 762 145 044
13 6 483 762 59 080
14 6 483 762 66 072
15 6 483 762 79 060
16 6 483 762 85 056
17 6 483 762 95 050
18 6 483 762 108 044
19 4 483 273 40 028
20 4 483 406 48 035
Page 25 of 39
httpsmc06manuscriptcentralcomcjce-pubs
Canadian Journal of Civil Engineering
Draft
Table 3 Probabilistic characteristics of random variables in the reliability analysis
Variable Distribution Mean COV () Source
ttn Normal 10 15 CSA (2011)
σySMYS Lognormal 11 35 Jiao et al (1995)
PPo Gumbel 10 30 Jiao et al (1995)
CSA (2011)
εd (tn) Normal 0 781 Stephens amp Nessim (2006)
εl (mm) Normal 0 781 Stephens and Nessim (2006)
ξ Gumbel 1297 258 Zhou and Huang (2012)
1 The values are standard deviations
Page 26 of 39
httpsmc06manuscriptcentralcomcjce-pubs
Canadian Journal of Civil Engineering
Draft
Table 4 Regression coefficients in the FPR - β relationship for different values of UFa
UFa a b Range of β Range of pf
080 0242 0704 [124 329] [50 times 10-4
11 times 10-1
]
072 0257 0683 [128 378] [78 times 10-5
10 times 10-1
]
060 0292 0617 [205 469] [14 times 10-6
20 times 10-2
]
056 0308 0578 [238 505] [22 times 10-7
87 times 10-3
]
050 0338 0500 [287 560] [11 times 10-8
20 times 10-3
]
044 0377 0377 [344 617] [34 times 10-10
29 times 10-4
]
035 0406 0360 [403 655] [29 times 10-11
28 times 10-5
]
028 0479 0156 [474 729] [16 times 10-13
11 times 10-6
]
Page 27 of 39
httpsmc06manuscriptcentralcomcjce-pubs
Canadian Journal of Civil Engineering
Draft
Table 5 Target reliability levels (βt and pfa) implied by threshold FPRs recommended by
ASME B318S and CSA Z662-11
Standard Threshold FPR UFa βt pfa
ASME
B318S
11 0721 162 53 times 10
-2
11 056 1692 46 times 10
-2
11 044 1922 27 times 10
-2
CSA
Z662-11
125 080 226 12 times 10-2
139 072 275 30 times 10-3
179 056 394 41 times 10-5
227 044 502 26 times 10-7
Note 1 Pipelines designed per the ASME standard typically have a maximum
utilization factor of 072
2 The value of βt is beyond the range of β values indicated in Table 4
Page 28 of 39
httpsmc06manuscriptcentralcomcjce-pubs
Canadian Journal of Civil Engineering
Draft
Table 6 Probabilities of burst of corrosion defects in Examples 1 and 2
Example Defect dILItn lILI (mm) FPR pf
1
1 049 50
148
90 times 10-4
2 034 75 85 times 10-4
3 027 100 88 times 10-4
2
1 058 50
156
43 times 10-4
2 042 75 42 times 10-4
3 033 100 40 times 10-4
Page 29 of 39
httpsmc06manuscriptcentralcomcjce-pubs
Canadian Journal of Civil Engineering
Draft
Figure Captions
Figure 1 FPR vs Reliability Index for Case 8 (D = 762 mm Po = 6 MPa SMYS = 359 MPa
tn = 88 mm and UFa = 072)
Figure 2 FPR vs Reliability Index for Analysis Cases with the Same UFa
(a) UFa = 080
(b) UFa = 072
(c) UFa = 060
(d) UFa = 056
(e) UFa = 050
(f) UFa = 044
(g) UFa = 035
(h) UFa = 028
Page 30 of 39
httpsmc06manuscriptcentralcomcjce-pubs
Canadian Journal of Civil Engineering
Draft
10
11
12
13
14
15
16
17
10 15 20 25 30 35 40
FPR
Reliability Index ββββ
Data
Linear fit
Page 31 of 39
httpsmc06manuscriptcentralcomcjce-pubs
Canadian Journal of Civil Engineering
Draft
10
11
12
13
14
15
16
10 15 20 25 30 35
FPR
Reliability Index ββββ
Data
Linear fit
Page 32 of 39
httpsmc06manuscriptcentralcomcjce-pubs
Canadian Journal of Civil Engineering
Draft
10
11
12
13
14
15
16
17
18
10 15 20 25 30 35 40
FPR
Reliability Index ββββ
Data
Linear fit
Page 33 of 39
httpsmc06manuscriptcentralcomcjce-pubs
Canadian Journal of Civil Engineering
Draft
10
12
14
16
18
20
22
10 20 30 40 50
FPR
Reliability Index ββββ
Data
Linear fit
Page 34 of 39
httpsmc06manuscriptcentralcomcjce-pubs
Canadian Journal of Civil Engineering
Draft
10
12
14
16
18
20
22
24
10 20 30 40 50 60
FPR
Reliability Index ββββ
Data
Linear fit
Page 35 of 39
httpsmc06manuscriptcentralcomcjce-pubs
Canadian Journal of Civil Engineering
Draft
10
12
14
16
18
20
22
24
26
10 20 30 40 50 60
FPR
Reliability Index ββββ
Data
Linear fit
Page 36 of 39
httpsmc06manuscriptcentralcomcjce-pubs
Canadian Journal of Civil Engineering
Draft
10
12
14
16
18
20
22
24
26
28
30
10 20 30 40 50 60 70
FPR
Reliability Index β
DataLinear fit
Page 37 of 39
httpsmc06manuscriptcentralcomcjce-pubs
Canadian Journal of Civil Engineering
Draft
10
15
20
25
30
35
10 20 30 40 50 60 70
FPR
Reliability Index ββββ
Data
Linear fit
Page 38 of 39
httpsmc06manuscriptcentralcomcjce-pubs
Canadian Journal of Civil Engineering
Draft
10
15
20
25
30
35
40
10 20 30 40 50 60 70 80
FPR
Reliability Index ββββ
Data
Linear fit
Page 39 of 39
httpsmc06manuscriptcentralcomcjce-pubs
Canadian Journal of Civil Engineering

Draft
locations (the meaning of the class location is explained in the next section) eg threshold
FRPs of 125 139 179 and 227 for Classes 1 2 3 and 4 pipelines respectively
Many uncertainties are involved in the pipeline corrosion management the ILI tool is
imperfect and associated with measurement errors the actual geometric and material
properties of the pipeline are uncertain and the burst pressure capacity models are not
perfectly accurate and therefore involve model errors As a result the reliability-based
corrosion management is being increasingly adopted by pipeline operators because it provides
a rationale framework to deal with the aforementioned uncertainties One desirable outcome
of the reliability-based corrosion management is to identify critical corrosion defects for
mitigation based on consistent levels of the probability of burst that is a given corrosion
defect will be mitigated if the probability of burst of the pipeline at the defect exceeds a pre-
defined allowable probability of burst Questions therefore arise as to the implied reliability
levels associated with the currently-used threshold FPRs Furthermore because it may not be
practical to require pipeline engineers to evaluate the probability of burst corresponding to
each individual defect a practical means to achieve reliability-consistent mitigations of
corrosion defects is to determine the threshold FPR corresponding to a given allowable
probability of burst Such a study which is somewhat similar to the calibration of the load
and resistance factors for the design of buildings and bridges (eg Bartlett et al 2003 Nowak
1995) however has not been reported in the literature
The objectives of the work reported in this paper were to 1) investigate the implied reliability
levels associated with the threshold FPR values employed in the current corrosion mitigation
practice and 2) determine the threshold FPR levels corresponding to different allowable
probabilities of burst to facilitate the reliability-consistent corrosion mitigation The study
Page 4 of 39
httpsmc06manuscriptcentralcomcjce-pubs
Canadian Journal of Civil Engineering
Draft
was focused on natural gas transmission pipelines designed according to the Canadian
Standards Association (CSA) Z662-11 Oil and Gas Pipeline Systems (CSA 2011) Liquid
transmission pipelines were excluded because of a lack of probabilistic characteristics of the
internal pressure in the literature A set of representative gas pipelines with different values
of the outside diameter steel grade operating pressure and wall thickness were developed
The ASME B31G Modified model (Kiefner and Vieth 1989) which is widely used in the
industry to predict burst capacities of corroded pipelines was employed to evaluate FPRs for
the analysis cases with corrosion defects of various sizes and also incorporated in the first-
order reliability method (FORM) (Melchers 1999 Low and Tang 1997 2007) to evaluate the
corresponding probabilities of burst The uncertainties in the defect sizes pipe geometric and
material properties internal pressure and accuracy of the B31G Modified model were
considered in the reliability analysis
The rest of the paper is organized as follows The next section briefly describes the design of
gas transmission pipelines according to CSA Z662 followed by the description of the B31G
Modified model and determination of FPR After that the analysis cases methodology for
the reliability analysis and probabilistic characteristics of the uncertain parameters involved in
the analysis are presented The Analysis Results section presents the results of the
reliability analysis the implied reliability levels associated with the currently-used threshold
FPRs and development of the empirical relationship between FPR and the probability of burst
Two illustrate examples are employed to illustrate the application of the relationship between
FPR and the probability of burst to achieve reliability-consistent corrosion mitigation
followed by discussion and conclusions
Design of Gas Pipelines per CSA Z662
Page 5 of 39
httpsmc06manuscriptcentralcomcjce-pubs
Canadian Journal of Civil Engineering
Draft
The design criterion for steel gas transmission pipelines prescribed in CSA Z662-11 can be
generally summarized as follows
[1] UF = ∙∙13 le ∙
where UF is defined as the utilization factor in this study but is often referred to as the
SMYS factor in practice (Kariyawasam and Huang 2014) tn is the nominal pipe wall
thickness Pd is the design pressure D is the nominal pipe outside diameter SMYS is the
specified minimum yield strength of the pipe steel F is the design factor and equals 08 and
L is the location factor that depends on the class location of the pipeline Because the actual
pipe outside diameter typically equals the nominal outside diameter with negligible
uncertainty (CSA 2011) no distinction is made between these two quantities and a single
notation D for the pipe outside diameter is used throughout the paper
The class location characterizes the population density in the vicinity of the pipeline There
are four class location designations namely Classes 1 2 3 and 4 for gas pipelines The
population density increases as the class location increases with Class 1 representing sparsely
populated areas and Class 4 representing high population density areas such as city centres
(CSA 2011) For pipelines that transport non-sour natural gas and are not near roads or
railways (which is the most common scenario) L equals 10 09 07 and 055 for Classes 1 2
3 and 4 respectively It follows that the product of F and L equals 08 072 056 and 044
for most Classes 1 2 3 and 4 gas pipelines respectively per CSA Z662-11
In most cases UF equals FL Given UF Pd D and SMYS the nominal pipe wall thickness
that satisfies the design criterion can be readily determined from Eq [1] However UF is less
Page 6 of 39
httpsmc06manuscriptcentralcomcjce-pubs
Canadian Journal of Civil Engineering
Draft
than FL if tn is governed by the minimum wall thickness requirement resulting from
constructability considerations (CSA 2011) The required minimum wall thickness increases
with the pipe diameter for instance it equals 40 mm for D = 2731 mm ie nominal pipe
size (NPS) 10 inches and 48 mm for D = 508 mm (NPS 20) (CSA 2011)
ASME B31G Modified Model and FPR
Suppose that a metal-loss corrosion defect on a pipeline has been detected and sized by ILI
The nominal burst pressure capacity of the pipeline at the defect Pbn can be evaluated from
the following equation based on the ASME B318 Modified model
[2a] = (13) $ $ amp) le 08
[2b] = -1 + 06275 56 minus 0003375 59()6 56 le 5033 + 0032 56 56 gt 50
where SMYS + 6895 (MPa) (or equivalently SMYS + 10 (ksi)) represents the flow stress of
the pipe steel dILI and lILI are the maximum depth (the defect typically has an irregular
through-thickness profile with varying depths along the profile) and length reported by ILI
respectively and M is the bulging or Folias factor It should be noted that the flow stress is
an empirical concept used to convert the stress-strain relationship of a strain-hardening
elastic-plastic material into an equivalent elastic-perfectly plastic stress-strain relationship
(Cosham and Hopkins 2002) While a commonly adopted definition of the flow stress is the
average of the yield and tensile strengths the flow stress is defined as SMYS + 6895 (MPa)
in the B31G Modified model The adequacy of such a definition especially for high-grade
Page 7 of 39
httpsmc06manuscriptcentralcomcjce-pubs
Canadian Journal of Civil Engineering
Draft
pipe steels can be a subject of future investigations As indicated in Eq [2a] the B31G
Modified model is only applicable to defects that are no more than 80 through the pipe wall
thickness Finally it is worth mentioning that commonly used ILI tools (eg the magnetic
flux leakage tool) typically report dILI as a fraction of tn ie dILItn but lILI as an absolute value
Let Po (Po le Pd) denote the MOP of the pipeline The FPR associated with the corrosion
defect can be simply evaluated as Pbn divided by Po It follows from Eq [1] that FPR can be
written as
[3] FPR = =gt = (13)13AB $ $ amp) le 08
[4] UFC = UF ∙ DgtE = gt∙∙13 where UFa is the de-facto utilization factor of the pipeline during operation which reflects a
combination of the safety margin incorporated in the design and any additional safety margin
resulting from the pipeline not operating at its full design capacity ie Po lt Pd
Equation [3] indicates that FPR evaluated from the B31G Modified model depends on
(SMYS+6895)SMYS UFa dILItn and lILI Because UFa usually corresponds to the class
location the recommendation in CSA Z662-11 that the threshold FPR be dependent on the
class location of the pipeline is justified Given SMYS dILItn and lILI a larger UFa leads to a
lower FPR and a smaller UFa leads to a higher FPR It is interesting to evaluate the upper
bound FPR FPRmax ie the value of FPR corresponding to an infinitesimally small defect It
follows from Eq [3] that FPRmax = (SMYS+6895)(UFaSMYS) For commonly used pipe
Page 8 of 39
httpsmc06manuscriptcentralcomcjce-pubs
Canadian Journal of Civil Engineering
Draft
steel grades with SMYS ranging from 290 to 483 MPa ie X42 to X70 grades (API 2004)
the values of (SMYS+6895)SMYS and FPRmax are listed in Table 1
Analysis Cases
We considered a set of 20 representative pipelines corresponding to three diameters (D = 273
(NPS 10) 406 (NPS 16) and 762 (NPS 30) mm) three SMYS values (SMYS = 289 359 and
483 MPa) and two MOPs (Po = 40 and 60 MPa) These pipelines cover wide ranges of tn
(from 40 to 179 mm) and UFa (from 028 to 080) as shown in Table 2 Note that cases 19
and 20 in the table were selected to represent small-diameter low-pressure pipelines for
which the minimum wall thicknesses requirement (CSA 2011) governs and consequently
results in low utilization factors For each pipeline a total of 24 representative corrosion
defects corresponding to all combinations of four dILItn values (dILItn = 025 035 045 and
05) and six lILI values (lILI = 50 100 150 200 300 and 400 mm) were considered
Methodology and Input for the Reliability Analysis
The limit state function for burst of a pipeline at a corrosion defect g can be written as
[5] F = minus 1
where Pb is the actual (as opposed to nominal) burst pressure capacity at the defect P is the
internal pressure of the pipeline and g le 0 represents failure (ie burst) It must be
emphasized that P is a random quantity whereas Pd and Po are both nominal pressure
parameters Pb is evaluated using the B31G Modified model as follows
[6] = G (HI) $ J$ amp) le 08
Page 9 of 39
httpsmc06manuscriptcentralcomcjce-pubs
Canadian Journal of Civil Engineering
Draft
[7] K = -1 + 06275 56 minus 0003375 59()6 56 le 5033 + 0032 56 56 gt 50
where ξ is the model error associated with the B31G Modified model t is the actual pipe wall
thickness σy is the yield strength of the pipe steel and d and l are the actual maximum depth
and length of the corrosion defect respectively The probability of failure (burst) pf is given
by
[8] LM = N OP(Q)RQSTU
where fX(x) denotes the joint probability density of the random variables involved in the limit
state function The FORM was employed in this study to evaluate the integral in Eq [6] by
calculating the reliability index β which is the shortest distance from the origin to the limit
state surface in the standard normal space The probability of burst is then evaluated as pf =
Φ(-β) with Φ(bull) being the standard normal distribution function
Ideally the time-dependency of the probability of burst should be taken into account because
the corrosion defect grows in size with time and the internal pressure of the pipeline also
fluctuates with time Because the corrosion mitigation is typically carried out a relatively
short time (say within a year) after ILI the reliability analysis was simplified as time-
independent in this study That is the growth of the corrosion defect was ignored and the
internal pressure was assumed to be a time-independent random variable represented by the
annual maximum operating pressure The probability of burst evaluated is therefore with
respect to a period of one year
Page 10 of 39
httpsmc06manuscriptcentralcomcjce-pubs
Canadian Journal of Civil Engineering
Draft
The B31G Modified model is applicable for dt le 08 but the FORM analysis may involve
the evaluation of Pb corresponding to 08 lt dt le 1 during the search for the design point or
the most probable failure point To deal with this issue a simple and practical extension of
the B31G Modified model was employed (Zhou and Zhang 2015) Pb was assumed to
decrease linearly from that calculated using Eq [6] at dt = 08 to zero at dt = 1
The statistical information summarized in Annex O of CSA Z662-11 indicates that ttn
generally follows a normal distribution with the mean ranging from 10 to 101 and the
coefficient of variation (COV) ranging from 10 to 17 Therefore ttn was assumed to be
normally distributed with the mean equal to unity and COV equal to 15 in this study Jiao
et al (1995) reported that σySMYS can be characterized by an either normal or lognormal
distribution with the mean ranging from 108 to 111 and COV ranging from 33 to 35
based on statistical analyses of extensive coupon test data Jiao et al also suggested that the
annual maximum operating pressure for gas pipelines can be characterized by a Gumbel
distribution with the mean between 103Po and 107Po and COV between 1 and 2
However it is pointed out in Annex O of CSA Z662-11 that this distribution is applicable to
locations immediately downstream of a compressor station Because the pressure drops along
the pipeline between compressor stations this distribution is a conservative estimate of the
annual maximum operating pressure at locations further downstream of a compressor station
It is further indicated in Annex O of CSA Z662-11 that the annual maximum operating
pressure of gas pipelines follows a beta distribution with the mean equal to 0993Po and COV
equal to 34 based on pressure records from one pipeline operator In this study σySMYS
was assumed to follow a lognormal distribution with the mean equal to 11 and COV equal to
Page 11 of 39
httpsmc06manuscriptcentralcomcjce-pubs
Canadian Journal of Civil Engineering
Draft
35 and PPo was assumed to follow a Gumbel distribution with the mean equal to unity
and COV equal to 30
Zhou and Zhang (2015) showed that the model error for the burst pressure capacity model is
critically important for evaluating the probability of burst of pipelines containing corrosion
defects Zhou and Huang (2012) evaluated the model errors associated with eight well-
known burst pressure capacity models for corroded pipes based on 150 full-scale burst tests
of pipe segments containing single isolated natural corrosion defects (as opposed to machined
defects) collected from the literature They suggested that the model error for the B31G
Modified model be characterized by a Gumbel distribution with the mean and COV equal to
1297 and 258 respectively This model error was adopted in this study
By assuming additive measurement errors (DNV 2010 Zhou and Nessim 2011) the ILI-
reported defect depth and length are related to the actual defect depth and length respectively
as follows
[9a] RVWV = R + X)
[9b] YVWV = Y + X5 where εd and εl are the measurement errors associated with the maximum depth and length
respectively It is common to assume that εd and εl follow normal distributions with a zero
mean (DNV 2010 Zhou and Nessim 2011) The standard deviations of εd and εl can then be
inferred from typical specifications of ILI tools ie dILI and lILI within plusmn10tn and plusmn10 mm of
d and l respectively 80 of the time (Stephens and Nessim 2006) Table 3 summarizes the
Page 12 of 39
httpsmc06manuscriptcentralcomcjce-pubs
Canadian Journal of Civil Engineering
Draft
probabilistic characteristics of the random variables involved in the reliability analysis It is
assumed that all the random variables are mutually independent of each other
It is advantageous to write PbP in the limit state function (ie Eq [5]) in the following form
[10] = G D $$ED ZI[[] ^[[EABD __gtE D $$EUD$ `$ED $$E J D$ `$Eamp Equation [10] suggests that given dILItn and lILI the probability of burst is largely dependent
on UFa a larger UFa leads to a higher probability of burst and a smaller UFa leads to a lower
probability of burst
Analysis Results
The values of FPR corresponding to the assumed 24 corrosion defects are plotted against the
reliability indices obtained from the FORM analysis in Fig 1 for an analysis case (case 8)
arbitrarily selected from Table 2
Two observations of Fig 1 are in order First there is essentially a one-to-one relationship
between FPR and the reliability index (probability of burst) for the pipeline The reliability
index increases monotonically as FPR increases for example FPR and β equal 130 and 243
respectively corresponding to dILItn =045 and lILI = 150 mm and 134 and 259 respectively
corresponding to dILItn =035 and lILI = 200 mm There are a few anomalies in the FPR - β
relationship if FPRs corresponding to different defects are very close For example FPR
equals 138 for dILItn = 025 and lILI = 400 mm with the corresponding β equal to 267
whereas FPR equals 137 for dILItn = 05 and lILI = 100 mm with the corresponding β equal to
269 Such anomalies however can be attributed to the minor numerical inaccuracies
Page 13 of 39
httpsmc06manuscriptcentralcomcjce-pubs
Canadian Journal of Civil Engineering
Draft
involved in the FORM analysis and are considered inconsequential Second the relationship
between FPR and β for the pipeline is almost perfectly linear For the other analysis cases
shown in Table 2 the above observations are equally applicable
The approximately linear relationship between FPR and β as demonstrated in Fig 1 deserves
some explanations To this end the limit state function given by Eq [5] is rewritten as
follows
[11] F = ( ==)( =) minus 1
The internal pressure P is expressed as γPo (γ is a Gumbel-distributed random variable with
the mean equal to unity and COV equal to 3 as indicated in Table 3) whereas Pbn equals
FPRtimesPo It follows that Eq [11] is now
[12] F = Aabc d minus 1
where X = PbPbn is a random variable representing the burst pressure capacity normalized by
Pbn The burst condition ie g lt 0 is equivalent to ln(FPRXγ) lt 0 The simple Monte
Carlo simulation of X was carried out based on the statistics of the basic parameters
summarized in Table 3 The results indicated that the lognormal distribution can fit simulated
samples of X reasonably well with the COV of X being around 26 Because the uncertainty
in X is much higher than that in γ γ is simplified as a deterministic quantity for the purpose of
investigating the relationship between FPR and β Given the above β can now be obtained as
[13] e asymp 5Aabghi5cHhi
Page 14 of 39
httpsmc06manuscriptcentralcomcjce-pubs
Canadian Journal of Civil Engineering
Draft
where mlnX and σlnX are the mean and standard deviation of lnX respectively Within the
relatively narrow range of FPR values for a given pipeline (eg between 10 and 17 for case
8 and between 25 and 36 for case 19 in Table 2) lnFPR is an almost linear function of
FPR It then follows that the FPR-β relationship is approximately linear
In each of Figs 2(a) through 2(h) FPRs are plotted against the corresponding β values for all
the analysis cases with the same UFa Figure 2 suggests that somewhat surprisingly the
above-described two observations about the FPR -β relationship for a given pipeline are also
applicable to different pipelines with the same UFa although there is slightly more scatter in
the data That is the FPR - β relationship only depends on UFa and is independent of the
other pipeline attributes such as the diameter pressure SMYS and wall thickness For a
given UFa the following equation is proposed to relate FPR to β
[14] FPR = je + k
where a and b are coefficients obtained from the simple linear regression analysis The
values of a and b corresponding to different values of UFa are summarized in Table 4 Also
shown in Table 4 is the range of β values (and the corresponding range of probabilities of
burst) over which Eq [14] was developed for each UFa ie the range of β values
corresponding to the 24 corrosion defects considered in the analysis Implications of these
ranges for the practical application are discussed in the next section
The threshold FPR corresponding to a selected target reliability index βt (or equivalently an
allowable probability of burst pfa) can be readily obtained from Eq [14] for UFa values given
in Table 4 The threshold FPR for a value of UFa not given in Table 4 can be determined by a
Page 15 of 39
httpsmc06manuscriptcentralcomcjce-pubs
Canadian Journal of Civil Engineering
Draft
linear interpolation of the threshold FPRs corresponding to the two nearest bounding UFa
values given in the table Furthermore values of βt and pfa implied by the threshold FPRs
recommended by ASME B318S and CSA Z662-11 were obtained from Eq [14] and are
summarized in Table 5 The results in Table 5 suggest that the threshold FPR of 11
recommended by ASME B318S leads to relatively low target reliability levels For pipelines
with high class location designations (ie high population density in the vicinity of the
pipelines) and thus low UFa values such as 056 and 044 the implied target reliability levels
appear too low to be commensurate with the potentially severe human safety-related
consequences of burst associated with such pipelines (Nessim et al 2009) On the other hand
the target reliability level implied by the threshold FPR recommended by CSA Z662-11
increases markedly as the class location increases βt increases from 226 for Class 1 pipelines
(UFa = 080) to 502 for Class 4 pipelines (UFa = 044) with the corresponding pfa decreasing
by approximately five orders of magnitude from 12 times 10-2
to 26 times 10-7
Considering that pfa
= 26 times 10-7
is an extremely low failure probability the threshold FPR of 227 for Class 4
pipelines is perhaps overly stringent The drawback of the CSA Z662 threshold FPRs
however is that they are associated with the class location of the pipeline rather than UFa
(Kariyawasam and Huang 2014) Two pipelines with the same class location can have
different values of UFa In this case applying the same CSA Z662 threshold FPR will lead to
different implied reliability levels for the two pipelines This drawback is overcome by the
use of Eq [14] and Table 4 For example consider two Class 2 pipelines with UFa equal to
072 and 060 respectively From Eq [14] and Table 4 the implied values of βt were
determined to be 275 (pfa = 30 times 10-3
) and 265 (pfa = 40 times 10-3
) for UFa = 072 and 060
Page 16 of 39
httpsmc06manuscriptcentralcomcjce-pubs
Canadian Journal of Civil Engineering
Draft
respectively corresponding to the CSA Z662 threshold FPR of 139 To achieve βt = 275 for
the pipeline with UFa = 060 the corresponding threshold FPR should be 142
Illustrative Examples
In this section two hypothetical examples are used to validate Eq [14] as well as illustrate its
application The first example involves a pipeline with D = 508 mm (NPS 20) SMYS = 359
MPa Po = 70 MPa tn = 69 mm and UFa = 072 It is assumed that an allowable probability
of burst of 10 times 10-3
(ie βt = 309) is selected for mitigating the defects on the pipeline The
corresponding threshold FPR is then determined as 148 from Eq [14] Consider three
representative corrosion defects with FPRs equal to the threshold FPR of 148 The ILI-
reported depths and lengths of these defects are summarized in Table 6 The probabilities of
burst of the three defects were evaluated using the FORM based on the same statistical
information as summarized in Table 3 and are shown in Table 6 As the probabilities of burst
associated with all three defects are slightly (10 - 15) below 10 times 10-3
the results
demonstrate the validity and simplicity of using Eq [14] to achieve reliability-consistent
mitigation of corrosion defects
The second example involves a pipeline with D = 6096 mm (NPS 24) SMYS = 448 MPa Po
= 68 MPa tn = 71 mm and UFa = 065 An allowable probability of burst of 50 times 10-4
(ie
βt = 329) was assumed for the defect mitigation The corresponding threshold FPR was
calculated to be 156 by linearly interpolating the FPR values corresponding to βt = 329 for
UFa = 072 and 060 respectively Consider three representative corrosion defects that have
FPRs equal to 156 The ILI-reported depths and lengths of the defects as well as the
probabilities of burst associated with the defects are also shown in Table 6 As indicated in
Page 17 of 39
httpsmc06manuscriptcentralcomcjce-pubs
Canadian Journal of Civil Engineering
Draft
the table the three probabilities of burst are about 15 - 20 below 50 times 10-4
which again
demonstrates the validity of Eq [14]
Discussion
The FPRs corresponding to the set of 24 corrosion defects included in the analysis are
representative of FPRs for the corrosion defects found in practice As such the ranges of β
values given in Table 4 are representative for the corresponding values of UFa Although Eq
[14] can be extrapolated to β values beyond the ranges given in Table 4 the extrapolation
may result in threshold FPRs that are either impractical or non-governing For example a βt
of 35 (pfa = 23 times 10-4
) for UFa = 080 which is greater than the upper bound of the
corresponding β range given in Table 4 results in a threshold FPR of 155 This threshold
FPR is clearly impractical for pipelines with UFa = 080 and SMYS ge 290 MPa (ie X42) as
the corresponding values of FPRmax are all less than or equal to 155 (see Table 1) On the
other hand a βt of 30 (pfa = 14 times 10-3
) for UFa = 044 which is smaller than the lower bound
of the corresponding β range results in a threshold FPR of 151 If this threshold FPR is
applied to case 18 (D = 762 mm SMYS = 483 MPa and tn = 108 mm) in Table 2 any
corrosion defects with dILItn lt 076 and lILI lt 150 mm will be considered non-critical as the
corresponding FPRs are greater than 151 In practice however most pipeline operators will
mitigate defects with dILItn gt 060 - 070 regardless of their FPRs (Kariyawasam and Huang
2014) Such a practice may also dictate the mitigation of defects on pipelines governed by
the minimum wall thickness requirement eg the cases with UFa = 035 and 028 in Table 2
unless a high target reliability level (eg βt gt 40) is justified for such pipelines
Page 18 of 39
httpsmc06manuscriptcentralcomcjce-pubs
Canadian Journal of Civil Engineering
Draft
It must be emphasized that Eq [14] and Table 4 are valid for a particular burst pressure
capacity model ie the ASME B31G Modified model and a specific set of input in the
reliability analysis as summarized in Table 3 A re-evaluation of the FPR-β relationship is
needed if a different burst pressure capacity model eg the ASME B31G or PCORRC model
is employed to determine FPR andor if the probabilistic characteristics of ttn σySMYS
PPo εd and εl for a specific pipeline deviate from those summarized in Table 3 to the extent
that the use of Eq [14] and Table 4 results in significantly non-conservative threshold FPRs
Conclusions
This study investigated the relationship between FPR and the probability of burst for metal-
loss corrosion defects on natural gas transmission pipelines designed per CSA Z662-11 The
ASME B31G Modified model was employed to evaluate the burst pressure capacity of the
pipeline at the corrosion defect A set of 20 representative gas pipelines with different
diameters maximum operating pressure and steel grades were developed corresponding to
wide ranges of the pipe wall thickness and utilization factor (UFa) For each pipeline FPRs
for 24 representative corrosion defects with dILItn ranging from 025 to 05 and lILI ranging
from 50 to 400 mm were evaluated using the B31G Modified model Furthermore the
FORM was employed to evaluate the probability of burst of the pipeline at each of the 24
corrosion defects by taking into account uncertainties in the wall thickness yield strength and
internal pressure measurement errors associated with the ILI-reported defect sizes and the
model error associated with the B31G Modified model
The analysis results suggest that a unique linear relationship exists between FPR and the
reliability index (β) corresponding to the probability of burst for different pipelines with the
Page 19 of 39
httpsmc06manuscriptcentralcomcjce-pubs
Canadian Journal of Civil Engineering
Draft
same utilization factor Simple linear regression equations between FPR and β for different
utilization factors were then developed on the basis of the analysis results These equations
allow rapid determination of the threshold FPR corresponding to a given target reliability
level for the purpose of identifying critical defects thus achieving reliability-consistent
mitigation of corrosion defects on pipelines Two examples were used to illustrate the
application and validity of the developed equations The implied reliability levels associated
with the threshold FPRs recommended by ASME B318S and CSA Z662-11 were also
clarified based on the FPR - β equations developed It is observed that the ASME B318S
threshold FPR implies relatively low reliability levels especially for pipelines with high class
location designations whereas the reliability levels implied by the CSA Z662 threshold FPRs
increase markedly as the class location increases Finally it is emphasized that the
application of the proposed FPR - β equation to a specific pipeline is predicated on the B31G
Modified model as well as the condition that the probabilistic characteristics of the relevant
random variables for the pipeline do not deviate markedly from those assumed in this study
Acknowledgement
The authors gratefully acknowledge the financial support provided by TransCanada Pipelines
Ltd and the Natural Sciences and Engineering Research Council of Canada (NSERC) in the
form of a Collaborative Research and Development project (CRDPJ 470571-14) Helpful
comments from the two anonymous reviewers are appreciated
Page 20 of 39
httpsmc06manuscriptcentralcomcjce-pubs
Canadian Journal of Civil Engineering
Draft
References
American Petroleum Institute (API) 2004 API Specification 5L specification for line pipe
American Petroleum Institute Washington DC
American Society of Mechanical Engineers (ASME) 2010 ASME B318S-2010 Managing
system integrity of gas pipelines ASME Code for Pressure Piping B31 Supplement to
ASME B318 American Society of Mechanical Engineers New York
Bartlett F M Hong H P and Zhou W 2003 Load factor calibration for the proposed 2005
edition of the National Building Code of Canada companion action load combination
Canadian Journal of Civil Engineering 30 440-448
Cosham A and Hopkins P 2002 The pipeline defect assessment manual In Proceedings
of the 4th
International Pipeline Conference Calgary 29 Sept - 3 Oct 2002 American Society
of Mechanical Engineers IPC2002-27067
Canadian Standards Association (CSA) 2011 CSA Z662 Oil and gas pipeline systems
Canadian Standards Association Mississauga Ontario
Det Norske Veritas (DNV) 2010 DNV RP-F101 Corroded pipelines DNV Recommended
Practice Det Norske Veritas Hovik Norway
Jiao G Sotberg T and Igland R T 1995 SUPERB 2M statistical data-basic uncertainty
measures for reliability analysis of offshore pipelines SUPERB JIP Report No STF70-
F95212 Norwegian Marine Technology Research Institute Trondheim Norway
Page 21 of 39
httpsmc06manuscriptcentralcomcjce-pubs
Canadian Journal of Civil Engineering
Draft
Kariyawasam S and Huang T 2014 How safe failure pressure ratios are related to SMYS
In Proceedings of the 10th
International Pipeline Conference Calgary 29 Sept - 3 Oct 2014
American Society of Mechanical Engineers IPC2014-33647
Kiefner J F and Vieth P H 1989 A modified criterion for evaluating the remaining
strength of corroded pipe PR 3-805 American Gas Association Washington DC
Low B K and Tang W H 1997 Efficient reliability evaluation using spreadsheet Journal
of Engineering Mechanics ASCE 123(7) 749-752
Low B K and Tang W H 2007 Efficient spreadsheet algorithm for first-order reliability
method Journal of Engineering Mechanics ASCE 133(12) 1378-1387
Melchers R E 1999 Structural reliability analysis and prediction 2nd Ed John Wiley amp
Sons Chichester England
Nessim M A Zhou W Zhou J Rothwell B and McLamb M 2009 Target reliability
levels for design and assessment of onshore natural gas pipelines Journal of Pressure Vessel
Technology ASME 131(6) 061701 1-12
Nowak AS 1995 Calibration of LRFD bridge code Journal of Structural Engineering
ASCE 121(8) 1245-1251
Stephens M and Nessim M A 2006 Comprehensive approach to corrosion management
based on structural reliability methods In Proceedings of 6th International Pipeline
Conference Calgary 25 - 29 Sept 2006 American Society of Mechanical Engineers
IPC2006-10458
Page 22 of 39
httpsmc06manuscriptcentralcomcjce-pubs
Canadian Journal of Civil Engineering
Draft
Zhou W and Zhang S 2015 Impact of model errors of burst capacity models on the
reliability evaluation of corroding pipelines Journal of Pipeline Systems Engineering and
Practice DOI 101061(ASCE)PS1949-12040000210 04015011 1-11
Zhou W and Huang GX 2012 Model error assessments of burst capacity models for
corroded pipelines International Journal of Pressure Vessels and Piping 99-100 1-8
Zhou W and Nessim MA 2011 Optimal deign of onshore natural gas pipelines Journal
of Pressure Vessel Technology ASME 133(3) 031702 1-11
Page 23 of 39
httpsmc06manuscriptcentralcomcjce-pubs
Canadian Journal of Civil Engineering
Draft
Table 1 Values of FPRmax for different pipe steel grades
Steel Grade X42 X52 X60 X65 X70
SMYS (MPa) 290 359 413 448 483
(SMYS+6895)SMYS 124 119 117 115 114
FPRmax
UFa = 08 155 149 146 144 143
UFa = 072 172 165 163 160 158
UFa = 056 221 213 209 205 204
UFa = 044 282 270 266 261 259
Page 24 of 39
httpsmc06manuscriptcentralcomcjce-pubs
Canadian Journal of Civil Engineering
Draft
Table 2 Attributes of representative pipelines considered in the analysis
Case
No
Po
(MPa)
SMYS
(MPa)
D
(mm)
tn
(mm)
UFa
1 6 290 762 99 080
2 6 290 762 109 072
3 6 290 762 131 060
4 6 290 762 141 056
5 6 290 762 158 050
6 6 290 762 179 044
7 6 359 762 80 080
8 6 359 762 88 072
9 6 359 762 106 060
10 6 359 762 114 056
11 6 359 762 127 050
12 6 359 762 145 044
13 6 483 762 59 080
14 6 483 762 66 072
15 6 483 762 79 060
16 6 483 762 85 056
17 6 483 762 95 050
18 6 483 762 108 044
19 4 483 273 40 028
20 4 483 406 48 035
Page 25 of 39
httpsmc06manuscriptcentralcomcjce-pubs
Canadian Journal of Civil Engineering
Draft
Table 3 Probabilistic characteristics of random variables in the reliability analysis
Variable Distribution Mean COV () Source
ttn Normal 10 15 CSA (2011)
σySMYS Lognormal 11 35 Jiao et al (1995)
PPo Gumbel 10 30 Jiao et al (1995)
CSA (2011)
εd (tn) Normal 0 781 Stephens amp Nessim (2006)
εl (mm) Normal 0 781 Stephens and Nessim (2006)
ξ Gumbel 1297 258 Zhou and Huang (2012)
1 The values are standard deviations
Page 26 of 39
httpsmc06manuscriptcentralcomcjce-pubs
Canadian Journal of Civil Engineering
Draft
Table 4 Regression coefficients in the FPR - β relationship for different values of UFa
UFa a b Range of β Range of pf
080 0242 0704 [124 329] [50 times 10-4
11 times 10-1
]
072 0257 0683 [128 378] [78 times 10-5
10 times 10-1
]
060 0292 0617 [205 469] [14 times 10-6
20 times 10-2
]
056 0308 0578 [238 505] [22 times 10-7
87 times 10-3
]
050 0338 0500 [287 560] [11 times 10-8
20 times 10-3
]
044 0377 0377 [344 617] [34 times 10-10
29 times 10-4
]
035 0406 0360 [403 655] [29 times 10-11
28 times 10-5
]
028 0479 0156 [474 729] [16 times 10-13
11 times 10-6
]
Page 27 of 39
httpsmc06manuscriptcentralcomcjce-pubs
Canadian Journal of Civil Engineering
Draft
Table 5 Target reliability levels (βt and pfa) implied by threshold FPRs recommended by
ASME B318S and CSA Z662-11
Standard Threshold FPR UFa βt pfa
ASME
B318S
11 0721 162 53 times 10
-2
11 056 1692 46 times 10
-2
11 044 1922 27 times 10
-2
CSA
Z662-11
125 080 226 12 times 10-2
139 072 275 30 times 10-3
179 056 394 41 times 10-5
227 044 502 26 times 10-7
Note 1 Pipelines designed per the ASME standard typically have a maximum
utilization factor of 072
2 The value of βt is beyond the range of β values indicated in Table 4
Page 28 of 39
httpsmc06manuscriptcentralcomcjce-pubs
Canadian Journal of Civil Engineering
Draft
Table 6 Probabilities of burst of corrosion defects in Examples 1 and 2
Example Defect dILItn lILI (mm) FPR pf
1
1 049 50
148
90 times 10-4
2 034 75 85 times 10-4
3 027 100 88 times 10-4
2
1 058 50
156
43 times 10-4
2 042 75 42 times 10-4
3 033 100 40 times 10-4
Page 29 of 39
httpsmc06manuscriptcentralcomcjce-pubs
Canadian Journal of Civil Engineering
Draft
Figure Captions
Figure 1 FPR vs Reliability Index for Case 8 (D = 762 mm Po = 6 MPa SMYS = 359 MPa
tn = 88 mm and UFa = 072)
Figure 2 FPR vs Reliability Index for Analysis Cases with the Same UFa
(a) UFa = 080
(b) UFa = 072
(c) UFa = 060
(d) UFa = 056
(e) UFa = 050
(f) UFa = 044
(g) UFa = 035
(h) UFa = 028
Page 30 of 39
httpsmc06manuscriptcentralcomcjce-pubs
Canadian Journal of Civil Engineering
Draft
10
11
12
13
14
15
16
17
10 15 20 25 30 35 40
FPR
Reliability Index ββββ
Data
Linear fit
Page 31 of 39
httpsmc06manuscriptcentralcomcjce-pubs
Canadian Journal of Civil Engineering
Draft
10
11
12
13
14
15
16
10 15 20 25 30 35
FPR
Reliability Index ββββ
Data
Linear fit
Page 32 of 39
httpsmc06manuscriptcentralcomcjce-pubs
Canadian Journal of Civil Engineering
Draft
10
11
12
13
14
15
16
17
18
10 15 20 25 30 35 40
FPR
Reliability Index ββββ
Data
Linear fit
Page 33 of 39
httpsmc06manuscriptcentralcomcjce-pubs
Canadian Journal of Civil Engineering
Draft
10
12
14
16
18
20
22
10 20 30 40 50
FPR
Reliability Index ββββ
Data
Linear fit
Page 34 of 39
httpsmc06manuscriptcentralcomcjce-pubs
Canadian Journal of Civil Engineering
Draft
10
12
14
16
18
20
22
24
10 20 30 40 50 60
FPR
Reliability Index ββββ
Data
Linear fit
Page 35 of 39
httpsmc06manuscriptcentralcomcjce-pubs
Canadian Journal of Civil Engineering
Draft
10
12
14
16
18
20
22
24
26
10 20 30 40 50 60
FPR
Reliability Index ββββ
Data
Linear fit
Page 36 of 39
httpsmc06manuscriptcentralcomcjce-pubs
Canadian Journal of Civil Engineering
Draft
10
12
14
16
18
20
22
24
26
28
30
10 20 30 40 50 60 70
FPR
Reliability Index β
DataLinear fit
Page 37 of 39
httpsmc06manuscriptcentralcomcjce-pubs
Canadian Journal of Civil Engineering
Draft
10
15
20
25
30
35
10 20 30 40 50 60 70
FPR
Reliability Index ββββ
Data
Linear fit
Page 38 of 39
httpsmc06manuscriptcentralcomcjce-pubs
Canadian Journal of Civil Engineering
Draft
10
15
20
25
30
35
40
10 20 30 40 50 60 70 80
FPR
Reliability Index ββββ
Data
Linear fit
Page 39 of 39
httpsmc06manuscriptcentralcomcjce-pubs
Canadian Journal of Civil Engineering
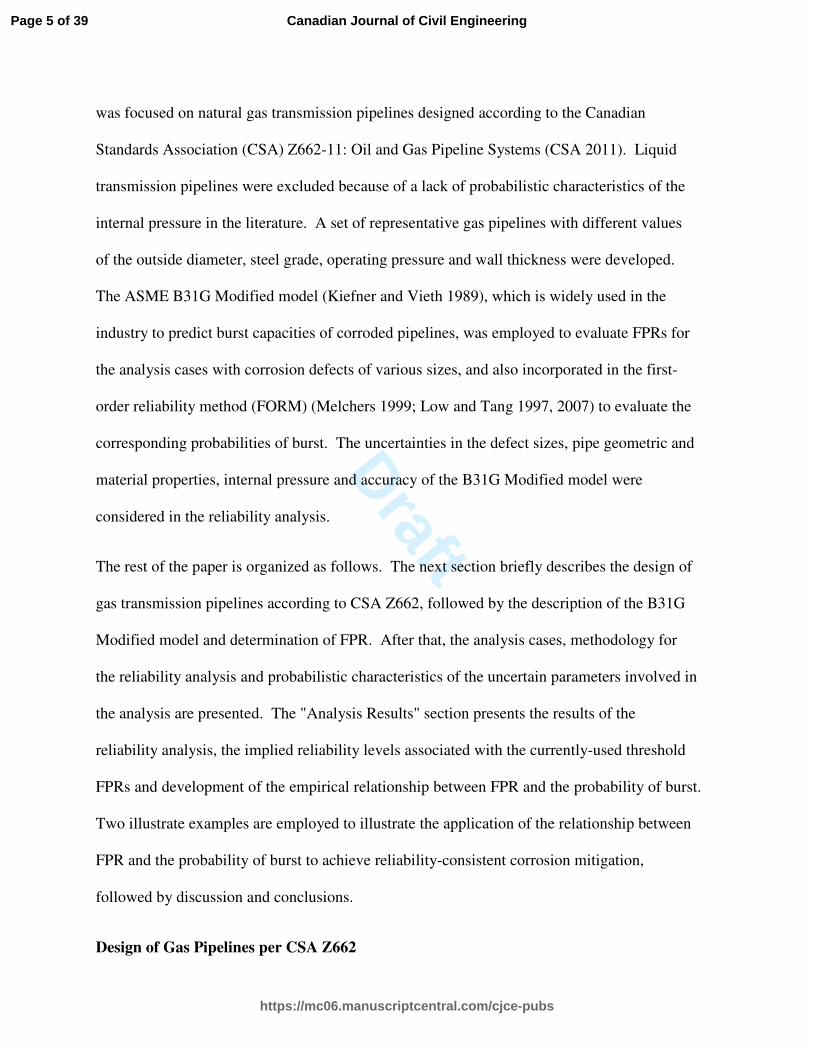
Draft
was focused on natural gas transmission pipelines designed according to the Canadian
Standards Association (CSA) Z662-11 Oil and Gas Pipeline Systems (CSA 2011) Liquid
transmission pipelines were excluded because of a lack of probabilistic characteristics of the
internal pressure in the literature A set of representative gas pipelines with different values
of the outside diameter steel grade operating pressure and wall thickness were developed
The ASME B31G Modified model (Kiefner and Vieth 1989) which is widely used in the
industry to predict burst capacities of corroded pipelines was employed to evaluate FPRs for
the analysis cases with corrosion defects of various sizes and also incorporated in the first-
order reliability method (FORM) (Melchers 1999 Low and Tang 1997 2007) to evaluate the
corresponding probabilities of burst The uncertainties in the defect sizes pipe geometric and
material properties internal pressure and accuracy of the B31G Modified model were
considered in the reliability analysis
The rest of the paper is organized as follows The next section briefly describes the design of
gas transmission pipelines according to CSA Z662 followed by the description of the B31G
Modified model and determination of FPR After that the analysis cases methodology for
the reliability analysis and probabilistic characteristics of the uncertain parameters involved in
the analysis are presented The Analysis Results section presents the results of the
reliability analysis the implied reliability levels associated with the currently-used threshold
FPRs and development of the empirical relationship between FPR and the probability of burst
Two illustrate examples are employed to illustrate the application of the relationship between
FPR and the probability of burst to achieve reliability-consistent corrosion mitigation
followed by discussion and conclusions
Design of Gas Pipelines per CSA Z662
Page 5 of 39
httpsmc06manuscriptcentralcomcjce-pubs
Canadian Journal of Civil Engineering
Draft
The design criterion for steel gas transmission pipelines prescribed in CSA Z662-11 can be
generally summarized as follows
[1] UF = ∙∙13 le ∙
where UF is defined as the utilization factor in this study but is often referred to as the
SMYS factor in practice (Kariyawasam and Huang 2014) tn is the nominal pipe wall
thickness Pd is the design pressure D is the nominal pipe outside diameter SMYS is the
specified minimum yield strength of the pipe steel F is the design factor and equals 08 and
L is the location factor that depends on the class location of the pipeline Because the actual
pipe outside diameter typically equals the nominal outside diameter with negligible
uncertainty (CSA 2011) no distinction is made between these two quantities and a single
notation D for the pipe outside diameter is used throughout the paper
The class location characterizes the population density in the vicinity of the pipeline There
are four class location designations namely Classes 1 2 3 and 4 for gas pipelines The
population density increases as the class location increases with Class 1 representing sparsely
populated areas and Class 4 representing high population density areas such as city centres
(CSA 2011) For pipelines that transport non-sour natural gas and are not near roads or
railways (which is the most common scenario) L equals 10 09 07 and 055 for Classes 1 2
3 and 4 respectively It follows that the product of F and L equals 08 072 056 and 044
for most Classes 1 2 3 and 4 gas pipelines respectively per CSA Z662-11
In most cases UF equals FL Given UF Pd D and SMYS the nominal pipe wall thickness
that satisfies the design criterion can be readily determined from Eq [1] However UF is less
Page 6 of 39
httpsmc06manuscriptcentralcomcjce-pubs
Canadian Journal of Civil Engineering
Draft
than FL if tn is governed by the minimum wall thickness requirement resulting from
constructability considerations (CSA 2011) The required minimum wall thickness increases
with the pipe diameter for instance it equals 40 mm for D = 2731 mm ie nominal pipe
size (NPS) 10 inches and 48 mm for D = 508 mm (NPS 20) (CSA 2011)
ASME B31G Modified Model and FPR
Suppose that a metal-loss corrosion defect on a pipeline has been detected and sized by ILI
The nominal burst pressure capacity of the pipeline at the defect Pbn can be evaluated from
the following equation based on the ASME B318 Modified model
[2a] = (13) $ $ amp) le 08
[2b] = -1 + 06275 56 minus 0003375 59()6 56 le 5033 + 0032 56 56 gt 50
where SMYS + 6895 (MPa) (or equivalently SMYS + 10 (ksi)) represents the flow stress of
the pipe steel dILI and lILI are the maximum depth (the defect typically has an irregular
through-thickness profile with varying depths along the profile) and length reported by ILI
respectively and M is the bulging or Folias factor It should be noted that the flow stress is
an empirical concept used to convert the stress-strain relationship of a strain-hardening
elastic-plastic material into an equivalent elastic-perfectly plastic stress-strain relationship
(Cosham and Hopkins 2002) While a commonly adopted definition of the flow stress is the
average of the yield and tensile strengths the flow stress is defined as SMYS + 6895 (MPa)
in the B31G Modified model The adequacy of such a definition especially for high-grade
Page 7 of 39
httpsmc06manuscriptcentralcomcjce-pubs
Canadian Journal of Civil Engineering
Draft
pipe steels can be a subject of future investigations As indicated in Eq [2a] the B31G
Modified model is only applicable to defects that are no more than 80 through the pipe wall
thickness Finally it is worth mentioning that commonly used ILI tools (eg the magnetic
flux leakage tool) typically report dILI as a fraction of tn ie dILItn but lILI as an absolute value
Let Po (Po le Pd) denote the MOP of the pipeline The FPR associated with the corrosion
defect can be simply evaluated as Pbn divided by Po It follows from Eq [1] that FPR can be
written as
[3] FPR = =gt = (13)13AB $ $ amp) le 08
[4] UFC = UF ∙ DgtE = gt∙∙13 where UFa is the de-facto utilization factor of the pipeline during operation which reflects a
combination of the safety margin incorporated in the design and any additional safety margin
resulting from the pipeline not operating at its full design capacity ie Po lt Pd
Equation [3] indicates that FPR evaluated from the B31G Modified model depends on
(SMYS+6895)SMYS UFa dILItn and lILI Because UFa usually corresponds to the class
location the recommendation in CSA Z662-11 that the threshold FPR be dependent on the
class location of the pipeline is justified Given SMYS dILItn and lILI a larger UFa leads to a
lower FPR and a smaller UFa leads to a higher FPR It is interesting to evaluate the upper
bound FPR FPRmax ie the value of FPR corresponding to an infinitesimally small defect It
follows from Eq [3] that FPRmax = (SMYS+6895)(UFaSMYS) For commonly used pipe
Page 8 of 39
httpsmc06manuscriptcentralcomcjce-pubs
Canadian Journal of Civil Engineering
Draft
steel grades with SMYS ranging from 290 to 483 MPa ie X42 to X70 grades (API 2004)
the values of (SMYS+6895)SMYS and FPRmax are listed in Table 1
Analysis Cases
We considered a set of 20 representative pipelines corresponding to three diameters (D = 273
(NPS 10) 406 (NPS 16) and 762 (NPS 30) mm) three SMYS values (SMYS = 289 359 and
483 MPa) and two MOPs (Po = 40 and 60 MPa) These pipelines cover wide ranges of tn
(from 40 to 179 mm) and UFa (from 028 to 080) as shown in Table 2 Note that cases 19
and 20 in the table were selected to represent small-diameter low-pressure pipelines for
which the minimum wall thicknesses requirement (CSA 2011) governs and consequently
results in low utilization factors For each pipeline a total of 24 representative corrosion
defects corresponding to all combinations of four dILItn values (dILItn = 025 035 045 and
05) and six lILI values (lILI = 50 100 150 200 300 and 400 mm) were considered
Methodology and Input for the Reliability Analysis
The limit state function for burst of a pipeline at a corrosion defect g can be written as
[5] F = minus 1
where Pb is the actual (as opposed to nominal) burst pressure capacity at the defect P is the
internal pressure of the pipeline and g le 0 represents failure (ie burst) It must be
emphasized that P is a random quantity whereas Pd and Po are both nominal pressure
parameters Pb is evaluated using the B31G Modified model as follows
[6] = G (HI) $ J$ amp) le 08
Page 9 of 39
httpsmc06manuscriptcentralcomcjce-pubs
Canadian Journal of Civil Engineering
Draft
[7] K = -1 + 06275 56 minus 0003375 59()6 56 le 5033 + 0032 56 56 gt 50
where ξ is the model error associated with the B31G Modified model t is the actual pipe wall
thickness σy is the yield strength of the pipe steel and d and l are the actual maximum depth
and length of the corrosion defect respectively The probability of failure (burst) pf is given
by
[8] LM = N OP(Q)RQSTU
where fX(x) denotes the joint probability density of the random variables involved in the limit
state function The FORM was employed in this study to evaluate the integral in Eq [6] by
calculating the reliability index β which is the shortest distance from the origin to the limit
state surface in the standard normal space The probability of burst is then evaluated as pf =
Φ(-β) with Φ(bull) being the standard normal distribution function
Ideally the time-dependency of the probability of burst should be taken into account because
the corrosion defect grows in size with time and the internal pressure of the pipeline also
fluctuates with time Because the corrosion mitigation is typically carried out a relatively
short time (say within a year) after ILI the reliability analysis was simplified as time-
independent in this study That is the growth of the corrosion defect was ignored and the
internal pressure was assumed to be a time-independent random variable represented by the
annual maximum operating pressure The probability of burst evaluated is therefore with
respect to a period of one year
Page 10 of 39
httpsmc06manuscriptcentralcomcjce-pubs
Canadian Journal of Civil Engineering
Draft
The B31G Modified model is applicable for dt le 08 but the FORM analysis may involve
the evaluation of Pb corresponding to 08 lt dt le 1 during the search for the design point or
the most probable failure point To deal with this issue a simple and practical extension of
the B31G Modified model was employed (Zhou and Zhang 2015) Pb was assumed to
decrease linearly from that calculated using Eq [6] at dt = 08 to zero at dt = 1
The statistical information summarized in Annex O of CSA Z662-11 indicates that ttn
generally follows a normal distribution with the mean ranging from 10 to 101 and the
coefficient of variation (COV) ranging from 10 to 17 Therefore ttn was assumed to be
normally distributed with the mean equal to unity and COV equal to 15 in this study Jiao
et al (1995) reported that σySMYS can be characterized by an either normal or lognormal
distribution with the mean ranging from 108 to 111 and COV ranging from 33 to 35
based on statistical analyses of extensive coupon test data Jiao et al also suggested that the
annual maximum operating pressure for gas pipelines can be characterized by a Gumbel
distribution with the mean between 103Po and 107Po and COV between 1 and 2
However it is pointed out in Annex O of CSA Z662-11 that this distribution is applicable to
locations immediately downstream of a compressor station Because the pressure drops along
the pipeline between compressor stations this distribution is a conservative estimate of the
annual maximum operating pressure at locations further downstream of a compressor station
It is further indicated in Annex O of CSA Z662-11 that the annual maximum operating
pressure of gas pipelines follows a beta distribution with the mean equal to 0993Po and COV
equal to 34 based on pressure records from one pipeline operator In this study σySMYS
was assumed to follow a lognormal distribution with the mean equal to 11 and COV equal to
Page 11 of 39
httpsmc06manuscriptcentralcomcjce-pubs
Canadian Journal of Civil Engineering
Draft
35 and PPo was assumed to follow a Gumbel distribution with the mean equal to unity
and COV equal to 30
Zhou and Zhang (2015) showed that the model error for the burst pressure capacity model is
critically important for evaluating the probability of burst of pipelines containing corrosion
defects Zhou and Huang (2012) evaluated the model errors associated with eight well-
known burst pressure capacity models for corroded pipes based on 150 full-scale burst tests
of pipe segments containing single isolated natural corrosion defects (as opposed to machined
defects) collected from the literature They suggested that the model error for the B31G
Modified model be characterized by a Gumbel distribution with the mean and COV equal to
1297 and 258 respectively This model error was adopted in this study
By assuming additive measurement errors (DNV 2010 Zhou and Nessim 2011) the ILI-
reported defect depth and length are related to the actual defect depth and length respectively
as follows
[9a] RVWV = R + X)
[9b] YVWV = Y + X5 where εd and εl are the measurement errors associated with the maximum depth and length
respectively It is common to assume that εd and εl follow normal distributions with a zero
mean (DNV 2010 Zhou and Nessim 2011) The standard deviations of εd and εl can then be
inferred from typical specifications of ILI tools ie dILI and lILI within plusmn10tn and plusmn10 mm of
d and l respectively 80 of the time (Stephens and Nessim 2006) Table 3 summarizes the
Page 12 of 39
httpsmc06manuscriptcentralcomcjce-pubs
Canadian Journal of Civil Engineering
Draft
probabilistic characteristics of the random variables involved in the reliability analysis It is
assumed that all the random variables are mutually independent of each other
It is advantageous to write PbP in the limit state function (ie Eq [5]) in the following form
[10] = G D $$ED ZI[[] ^[[EABD __gtE D $$EUD$ `$ED $$E J D$ `$Eamp Equation [10] suggests that given dILItn and lILI the probability of burst is largely dependent
on UFa a larger UFa leads to a higher probability of burst and a smaller UFa leads to a lower
probability of burst
Analysis Results
The values of FPR corresponding to the assumed 24 corrosion defects are plotted against the
reliability indices obtained from the FORM analysis in Fig 1 for an analysis case (case 8)
arbitrarily selected from Table 2
Two observations of Fig 1 are in order First there is essentially a one-to-one relationship
between FPR and the reliability index (probability of burst) for the pipeline The reliability
index increases monotonically as FPR increases for example FPR and β equal 130 and 243
respectively corresponding to dILItn =045 and lILI = 150 mm and 134 and 259 respectively
corresponding to dILItn =035 and lILI = 200 mm There are a few anomalies in the FPR - β
relationship if FPRs corresponding to different defects are very close For example FPR
equals 138 for dILItn = 025 and lILI = 400 mm with the corresponding β equal to 267
whereas FPR equals 137 for dILItn = 05 and lILI = 100 mm with the corresponding β equal to
269 Such anomalies however can be attributed to the minor numerical inaccuracies
Page 13 of 39
httpsmc06manuscriptcentralcomcjce-pubs
Canadian Journal of Civil Engineering
Draft
involved in the FORM analysis and are considered inconsequential Second the relationship
between FPR and β for the pipeline is almost perfectly linear For the other analysis cases
shown in Table 2 the above observations are equally applicable
The approximately linear relationship between FPR and β as demonstrated in Fig 1 deserves
some explanations To this end the limit state function given by Eq [5] is rewritten as
follows
[11] F = ( ==)( =) minus 1
The internal pressure P is expressed as γPo (γ is a Gumbel-distributed random variable with
the mean equal to unity and COV equal to 3 as indicated in Table 3) whereas Pbn equals
FPRtimesPo It follows that Eq [11] is now
[12] F = Aabc d minus 1
where X = PbPbn is a random variable representing the burst pressure capacity normalized by
Pbn The burst condition ie g lt 0 is equivalent to ln(FPRXγ) lt 0 The simple Monte
Carlo simulation of X was carried out based on the statistics of the basic parameters
summarized in Table 3 The results indicated that the lognormal distribution can fit simulated
samples of X reasonably well with the COV of X being around 26 Because the uncertainty
in X is much higher than that in γ γ is simplified as a deterministic quantity for the purpose of
investigating the relationship between FPR and β Given the above β can now be obtained as
[13] e asymp 5Aabghi5cHhi
Page 14 of 39
httpsmc06manuscriptcentralcomcjce-pubs
Canadian Journal of Civil Engineering
Draft
where mlnX and σlnX are the mean and standard deviation of lnX respectively Within the
relatively narrow range of FPR values for a given pipeline (eg between 10 and 17 for case
8 and between 25 and 36 for case 19 in Table 2) lnFPR is an almost linear function of
FPR It then follows that the FPR-β relationship is approximately linear
In each of Figs 2(a) through 2(h) FPRs are plotted against the corresponding β values for all
the analysis cases with the same UFa Figure 2 suggests that somewhat surprisingly the
above-described two observations about the FPR -β relationship for a given pipeline are also
applicable to different pipelines with the same UFa although there is slightly more scatter in
the data That is the FPR - β relationship only depends on UFa and is independent of the
other pipeline attributes such as the diameter pressure SMYS and wall thickness For a
given UFa the following equation is proposed to relate FPR to β
[14] FPR = je + k
where a and b are coefficients obtained from the simple linear regression analysis The
values of a and b corresponding to different values of UFa are summarized in Table 4 Also
shown in Table 4 is the range of β values (and the corresponding range of probabilities of
burst) over which Eq [14] was developed for each UFa ie the range of β values
corresponding to the 24 corrosion defects considered in the analysis Implications of these
ranges for the practical application are discussed in the next section
The threshold FPR corresponding to a selected target reliability index βt (or equivalently an
allowable probability of burst pfa) can be readily obtained from Eq [14] for UFa values given
in Table 4 The threshold FPR for a value of UFa not given in Table 4 can be determined by a
Page 15 of 39
httpsmc06manuscriptcentralcomcjce-pubs
Canadian Journal of Civil Engineering
Draft
linear interpolation of the threshold FPRs corresponding to the two nearest bounding UFa
values given in the table Furthermore values of βt and pfa implied by the threshold FPRs
recommended by ASME B318S and CSA Z662-11 were obtained from Eq [14] and are
summarized in Table 5 The results in Table 5 suggest that the threshold FPR of 11
recommended by ASME B318S leads to relatively low target reliability levels For pipelines
with high class location designations (ie high population density in the vicinity of the
pipelines) and thus low UFa values such as 056 and 044 the implied target reliability levels
appear too low to be commensurate with the potentially severe human safety-related
consequences of burst associated with such pipelines (Nessim et al 2009) On the other hand
the target reliability level implied by the threshold FPR recommended by CSA Z662-11
increases markedly as the class location increases βt increases from 226 for Class 1 pipelines
(UFa = 080) to 502 for Class 4 pipelines (UFa = 044) with the corresponding pfa decreasing
by approximately five orders of magnitude from 12 times 10-2
to 26 times 10-7
Considering that pfa
= 26 times 10-7
is an extremely low failure probability the threshold FPR of 227 for Class 4
pipelines is perhaps overly stringent The drawback of the CSA Z662 threshold FPRs
however is that they are associated with the class location of the pipeline rather than UFa
(Kariyawasam and Huang 2014) Two pipelines with the same class location can have
different values of UFa In this case applying the same CSA Z662 threshold FPR will lead to
different implied reliability levels for the two pipelines This drawback is overcome by the
use of Eq [14] and Table 4 For example consider two Class 2 pipelines with UFa equal to
072 and 060 respectively From Eq [14] and Table 4 the implied values of βt were
determined to be 275 (pfa = 30 times 10-3
) and 265 (pfa = 40 times 10-3
) for UFa = 072 and 060
Page 16 of 39
httpsmc06manuscriptcentralcomcjce-pubs
Canadian Journal of Civil Engineering
Draft
respectively corresponding to the CSA Z662 threshold FPR of 139 To achieve βt = 275 for
the pipeline with UFa = 060 the corresponding threshold FPR should be 142
Illustrative Examples
In this section two hypothetical examples are used to validate Eq [14] as well as illustrate its
application The first example involves a pipeline with D = 508 mm (NPS 20) SMYS = 359
MPa Po = 70 MPa tn = 69 mm and UFa = 072 It is assumed that an allowable probability
of burst of 10 times 10-3
(ie βt = 309) is selected for mitigating the defects on the pipeline The
corresponding threshold FPR is then determined as 148 from Eq [14] Consider three
representative corrosion defects with FPRs equal to the threshold FPR of 148 The ILI-
reported depths and lengths of these defects are summarized in Table 6 The probabilities of
burst of the three defects were evaluated using the FORM based on the same statistical
information as summarized in Table 3 and are shown in Table 6 As the probabilities of burst
associated with all three defects are slightly (10 - 15) below 10 times 10-3
the results
demonstrate the validity and simplicity of using Eq [14] to achieve reliability-consistent
mitigation of corrosion defects
The second example involves a pipeline with D = 6096 mm (NPS 24) SMYS = 448 MPa Po
= 68 MPa tn = 71 mm and UFa = 065 An allowable probability of burst of 50 times 10-4
(ie
βt = 329) was assumed for the defect mitigation The corresponding threshold FPR was
calculated to be 156 by linearly interpolating the FPR values corresponding to βt = 329 for
UFa = 072 and 060 respectively Consider three representative corrosion defects that have
FPRs equal to 156 The ILI-reported depths and lengths of the defects as well as the
probabilities of burst associated with the defects are also shown in Table 6 As indicated in
Page 17 of 39
httpsmc06manuscriptcentralcomcjce-pubs
Canadian Journal of Civil Engineering
Draft
the table the three probabilities of burst are about 15 - 20 below 50 times 10-4
which again
demonstrates the validity of Eq [14]
Discussion
The FPRs corresponding to the set of 24 corrosion defects included in the analysis are
representative of FPRs for the corrosion defects found in practice As such the ranges of β
values given in Table 4 are representative for the corresponding values of UFa Although Eq
[14] can be extrapolated to β values beyond the ranges given in Table 4 the extrapolation
may result in threshold FPRs that are either impractical or non-governing For example a βt
of 35 (pfa = 23 times 10-4
) for UFa = 080 which is greater than the upper bound of the
corresponding β range given in Table 4 results in a threshold FPR of 155 This threshold
FPR is clearly impractical for pipelines with UFa = 080 and SMYS ge 290 MPa (ie X42) as
the corresponding values of FPRmax are all less than or equal to 155 (see Table 1) On the
other hand a βt of 30 (pfa = 14 times 10-3
) for UFa = 044 which is smaller than the lower bound
of the corresponding β range results in a threshold FPR of 151 If this threshold FPR is
applied to case 18 (D = 762 mm SMYS = 483 MPa and tn = 108 mm) in Table 2 any
corrosion defects with dILItn lt 076 and lILI lt 150 mm will be considered non-critical as the
corresponding FPRs are greater than 151 In practice however most pipeline operators will
mitigate defects with dILItn gt 060 - 070 regardless of their FPRs (Kariyawasam and Huang
2014) Such a practice may also dictate the mitigation of defects on pipelines governed by
the minimum wall thickness requirement eg the cases with UFa = 035 and 028 in Table 2
unless a high target reliability level (eg βt gt 40) is justified for such pipelines
Page 18 of 39
httpsmc06manuscriptcentralcomcjce-pubs
Canadian Journal of Civil Engineering
Draft
It must be emphasized that Eq [14] and Table 4 are valid for a particular burst pressure
capacity model ie the ASME B31G Modified model and a specific set of input in the
reliability analysis as summarized in Table 3 A re-evaluation of the FPR-β relationship is
needed if a different burst pressure capacity model eg the ASME B31G or PCORRC model
is employed to determine FPR andor if the probabilistic characteristics of ttn σySMYS
PPo εd and εl for a specific pipeline deviate from those summarized in Table 3 to the extent
that the use of Eq [14] and Table 4 results in significantly non-conservative threshold FPRs
Conclusions
This study investigated the relationship between FPR and the probability of burst for metal-
loss corrosion defects on natural gas transmission pipelines designed per CSA Z662-11 The
ASME B31G Modified model was employed to evaluate the burst pressure capacity of the
pipeline at the corrosion defect A set of 20 representative gas pipelines with different
diameters maximum operating pressure and steel grades were developed corresponding to
wide ranges of the pipe wall thickness and utilization factor (UFa) For each pipeline FPRs
for 24 representative corrosion defects with dILItn ranging from 025 to 05 and lILI ranging
from 50 to 400 mm were evaluated using the B31G Modified model Furthermore the
FORM was employed to evaluate the probability of burst of the pipeline at each of the 24
corrosion defects by taking into account uncertainties in the wall thickness yield strength and
internal pressure measurement errors associated with the ILI-reported defect sizes and the
model error associated with the B31G Modified model
The analysis results suggest that a unique linear relationship exists between FPR and the
reliability index (β) corresponding to the probability of burst for different pipelines with the
Page 19 of 39
httpsmc06manuscriptcentralcomcjce-pubs
Canadian Journal of Civil Engineering
Draft
same utilization factor Simple linear regression equations between FPR and β for different
utilization factors were then developed on the basis of the analysis results These equations
allow rapid determination of the threshold FPR corresponding to a given target reliability
level for the purpose of identifying critical defects thus achieving reliability-consistent
mitigation of corrosion defects on pipelines Two examples were used to illustrate the
application and validity of the developed equations The implied reliability levels associated
with the threshold FPRs recommended by ASME B318S and CSA Z662-11 were also
clarified based on the FPR - β equations developed It is observed that the ASME B318S
threshold FPR implies relatively low reliability levels especially for pipelines with high class
location designations whereas the reliability levels implied by the CSA Z662 threshold FPRs
increase markedly as the class location increases Finally it is emphasized that the
application of the proposed FPR - β equation to a specific pipeline is predicated on the B31G
Modified model as well as the condition that the probabilistic characteristics of the relevant
random variables for the pipeline do not deviate markedly from those assumed in this study
Acknowledgement
The authors gratefully acknowledge the financial support provided by TransCanada Pipelines
Ltd and the Natural Sciences and Engineering Research Council of Canada (NSERC) in the
form of a Collaborative Research and Development project (CRDPJ 470571-14) Helpful
comments from the two anonymous reviewers are appreciated
Page 20 of 39
httpsmc06manuscriptcentralcomcjce-pubs
Canadian Journal of Civil Engineering
Draft
References
American Petroleum Institute (API) 2004 API Specification 5L specification for line pipe
American Petroleum Institute Washington DC
American Society of Mechanical Engineers (ASME) 2010 ASME B318S-2010 Managing
system integrity of gas pipelines ASME Code for Pressure Piping B31 Supplement to
ASME B318 American Society of Mechanical Engineers New York
Bartlett F M Hong H P and Zhou W 2003 Load factor calibration for the proposed 2005
edition of the National Building Code of Canada companion action load combination
Canadian Journal of Civil Engineering 30 440-448
Cosham A and Hopkins P 2002 The pipeline defect assessment manual In Proceedings
of the 4th
International Pipeline Conference Calgary 29 Sept - 3 Oct 2002 American Society
of Mechanical Engineers IPC2002-27067
Canadian Standards Association (CSA) 2011 CSA Z662 Oil and gas pipeline systems
Canadian Standards Association Mississauga Ontario
Det Norske Veritas (DNV) 2010 DNV RP-F101 Corroded pipelines DNV Recommended
Practice Det Norske Veritas Hovik Norway
Jiao G Sotberg T and Igland R T 1995 SUPERB 2M statistical data-basic uncertainty
measures for reliability analysis of offshore pipelines SUPERB JIP Report No STF70-
F95212 Norwegian Marine Technology Research Institute Trondheim Norway
Page 21 of 39
httpsmc06manuscriptcentralcomcjce-pubs
Canadian Journal of Civil Engineering
Draft
Kariyawasam S and Huang T 2014 How safe failure pressure ratios are related to SMYS
In Proceedings of the 10th
International Pipeline Conference Calgary 29 Sept - 3 Oct 2014
American Society of Mechanical Engineers IPC2014-33647
Kiefner J F and Vieth P H 1989 A modified criterion for evaluating the remaining
strength of corroded pipe PR 3-805 American Gas Association Washington DC
Low B K and Tang W H 1997 Efficient reliability evaluation using spreadsheet Journal
of Engineering Mechanics ASCE 123(7) 749-752
Low B K and Tang W H 2007 Efficient spreadsheet algorithm for first-order reliability
method Journal of Engineering Mechanics ASCE 133(12) 1378-1387
Melchers R E 1999 Structural reliability analysis and prediction 2nd Ed John Wiley amp
Sons Chichester England
Nessim M A Zhou W Zhou J Rothwell B and McLamb M 2009 Target reliability
levels for design and assessment of onshore natural gas pipelines Journal of Pressure Vessel
Technology ASME 131(6) 061701 1-12
Nowak AS 1995 Calibration of LRFD bridge code Journal of Structural Engineering
ASCE 121(8) 1245-1251
Stephens M and Nessim M A 2006 Comprehensive approach to corrosion management
based on structural reliability methods In Proceedings of 6th International Pipeline
Conference Calgary 25 - 29 Sept 2006 American Society of Mechanical Engineers
IPC2006-10458
Page 22 of 39
httpsmc06manuscriptcentralcomcjce-pubs
Canadian Journal of Civil Engineering
Draft
Zhou W and Zhang S 2015 Impact of model errors of burst capacity models on the
reliability evaluation of corroding pipelines Journal of Pipeline Systems Engineering and
Practice DOI 101061(ASCE)PS1949-12040000210 04015011 1-11
Zhou W and Huang GX 2012 Model error assessments of burst capacity models for
corroded pipelines International Journal of Pressure Vessels and Piping 99-100 1-8
Zhou W and Nessim MA 2011 Optimal deign of onshore natural gas pipelines Journal
of Pressure Vessel Technology ASME 133(3) 031702 1-11
Page 23 of 39
httpsmc06manuscriptcentralcomcjce-pubs
Canadian Journal of Civil Engineering
Draft
Table 1 Values of FPRmax for different pipe steel grades
Steel Grade X42 X52 X60 X65 X70
SMYS (MPa) 290 359 413 448 483
(SMYS+6895)SMYS 124 119 117 115 114
FPRmax
UFa = 08 155 149 146 144 143
UFa = 072 172 165 163 160 158
UFa = 056 221 213 209 205 204
UFa = 044 282 270 266 261 259
Page 24 of 39
httpsmc06manuscriptcentralcomcjce-pubs
Canadian Journal of Civil Engineering
Draft
Table 2 Attributes of representative pipelines considered in the analysis
Case
No
Po
(MPa)
SMYS
(MPa)
D
(mm)
tn
(mm)
UFa
1 6 290 762 99 080
2 6 290 762 109 072
3 6 290 762 131 060
4 6 290 762 141 056
5 6 290 762 158 050
6 6 290 762 179 044
7 6 359 762 80 080
8 6 359 762 88 072
9 6 359 762 106 060
10 6 359 762 114 056
11 6 359 762 127 050
12 6 359 762 145 044
13 6 483 762 59 080
14 6 483 762 66 072
15 6 483 762 79 060
16 6 483 762 85 056
17 6 483 762 95 050
18 6 483 762 108 044
19 4 483 273 40 028
20 4 483 406 48 035
Page 25 of 39
httpsmc06manuscriptcentralcomcjce-pubs
Canadian Journal of Civil Engineering
Draft
Table 3 Probabilistic characteristics of random variables in the reliability analysis
Variable Distribution Mean COV () Source
ttn Normal 10 15 CSA (2011)
σySMYS Lognormal 11 35 Jiao et al (1995)
PPo Gumbel 10 30 Jiao et al (1995)
CSA (2011)
εd (tn) Normal 0 781 Stephens amp Nessim (2006)
εl (mm) Normal 0 781 Stephens and Nessim (2006)
ξ Gumbel 1297 258 Zhou and Huang (2012)
1 The values are standard deviations
Page 26 of 39
httpsmc06manuscriptcentralcomcjce-pubs
Canadian Journal of Civil Engineering
Draft
Table 4 Regression coefficients in the FPR - β relationship for different values of UFa
UFa a b Range of β Range of pf
080 0242 0704 [124 329] [50 times 10-4
11 times 10-1
]
072 0257 0683 [128 378] [78 times 10-5
10 times 10-1
]
060 0292 0617 [205 469] [14 times 10-6
20 times 10-2
]
056 0308 0578 [238 505] [22 times 10-7
87 times 10-3
]
050 0338 0500 [287 560] [11 times 10-8
20 times 10-3
]
044 0377 0377 [344 617] [34 times 10-10
29 times 10-4
]
035 0406 0360 [403 655] [29 times 10-11
28 times 10-5
]
028 0479 0156 [474 729] [16 times 10-13
11 times 10-6
]
Page 27 of 39
httpsmc06manuscriptcentralcomcjce-pubs
Canadian Journal of Civil Engineering
Draft
Table 5 Target reliability levels (βt and pfa) implied by threshold FPRs recommended by
ASME B318S and CSA Z662-11
Standard Threshold FPR UFa βt pfa
ASME
B318S
11 0721 162 53 times 10
-2
11 056 1692 46 times 10
-2
11 044 1922 27 times 10
-2
CSA
Z662-11
125 080 226 12 times 10-2
139 072 275 30 times 10-3
179 056 394 41 times 10-5
227 044 502 26 times 10-7
Note 1 Pipelines designed per the ASME standard typically have a maximum
utilization factor of 072
2 The value of βt is beyond the range of β values indicated in Table 4
Page 28 of 39
httpsmc06manuscriptcentralcomcjce-pubs
Canadian Journal of Civil Engineering
Draft
Table 6 Probabilities of burst of corrosion defects in Examples 1 and 2
Example Defect dILItn lILI (mm) FPR pf
1
1 049 50
148
90 times 10-4
2 034 75 85 times 10-4
3 027 100 88 times 10-4
2
1 058 50
156
43 times 10-4
2 042 75 42 times 10-4
3 033 100 40 times 10-4
Page 29 of 39
httpsmc06manuscriptcentralcomcjce-pubs
Canadian Journal of Civil Engineering
Draft
Figure Captions
Figure 1 FPR vs Reliability Index for Case 8 (D = 762 mm Po = 6 MPa SMYS = 359 MPa
tn = 88 mm and UFa = 072)
Figure 2 FPR vs Reliability Index for Analysis Cases with the Same UFa
(a) UFa = 080
(b) UFa = 072
(c) UFa = 060
(d) UFa = 056
(e) UFa = 050
(f) UFa = 044
(g) UFa = 035
(h) UFa = 028
Page 30 of 39
httpsmc06manuscriptcentralcomcjce-pubs
Canadian Journal of Civil Engineering
Draft
10
11
12
13
14
15
16
17
10 15 20 25 30 35 40
FPR
Reliability Index ββββ
Data
Linear fit
Page 31 of 39
httpsmc06manuscriptcentralcomcjce-pubs
Canadian Journal of Civil Engineering
Draft
10
11
12
13
14
15
16
10 15 20 25 30 35
FPR
Reliability Index ββββ
Data
Linear fit
Page 32 of 39
httpsmc06manuscriptcentralcomcjce-pubs
Canadian Journal of Civil Engineering
Draft
10
11
12
13
14
15
16
17
18
10 15 20 25 30 35 40
FPR
Reliability Index ββββ
Data
Linear fit
Page 33 of 39
httpsmc06manuscriptcentralcomcjce-pubs
Canadian Journal of Civil Engineering
Draft
10
12
14
16
18
20
22
10 20 30 40 50
FPR
Reliability Index ββββ
Data
Linear fit
Page 34 of 39
httpsmc06manuscriptcentralcomcjce-pubs
Canadian Journal of Civil Engineering
Draft
10
12
14
16
18
20
22
24
10 20 30 40 50 60
FPR
Reliability Index ββββ
Data
Linear fit
Page 35 of 39
httpsmc06manuscriptcentralcomcjce-pubs
Canadian Journal of Civil Engineering
Draft
10
12
14
16
18
20
22
24
26
10 20 30 40 50 60
FPR
Reliability Index ββββ
Data
Linear fit
Page 36 of 39
httpsmc06manuscriptcentralcomcjce-pubs
Canadian Journal of Civil Engineering
Draft
10
12
14
16
18
20
22
24
26
28
30
10 20 30 40 50 60 70
FPR
Reliability Index β
DataLinear fit
Page 37 of 39
httpsmc06manuscriptcentralcomcjce-pubs
Canadian Journal of Civil Engineering
Draft
10
15
20
25
30
35
10 20 30 40 50 60 70
FPR
Reliability Index ββββ
Data
Linear fit
Page 38 of 39
httpsmc06manuscriptcentralcomcjce-pubs
Canadian Journal of Civil Engineering
Draft
10
15
20
25
30
35
40
10 20 30 40 50 60 70 80
FPR
Reliability Index ββββ
Data
Linear fit
Page 39 of 39
httpsmc06manuscriptcentralcomcjce-pubs
Canadian Journal of Civil Engineering
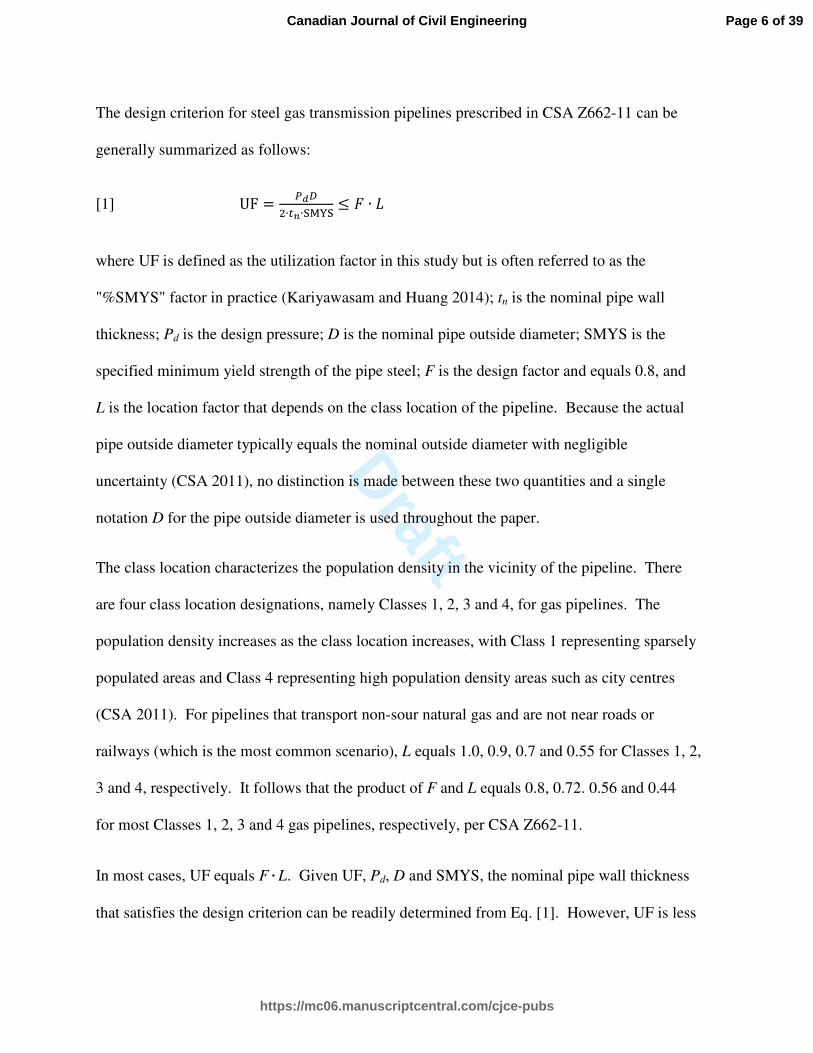
Draft
than FL if tn is governed by the minimum wall thickness requirement resulting from
constructability considerations (CSA 2011) The required minimum wall thickness increases
with the pipe diameter for instance it equals 40 mm for D = 2731 mm ie nominal pipe
size (NPS) 10 inches and 48 mm for D = 508 mm (NPS 20) (CSA 2011)
ASME B31G Modified Model and FPR
Suppose that a metal-loss corrosion defect on a pipeline has been detected and sized by ILI
The nominal burst pressure capacity of the pipeline at the defect Pbn can be evaluated from
the following equation based on the ASME B318 Modified model
[2a] = (13) $ $ amp) le 08
[2b] = -1 + 06275 56 minus 0003375 59()6 56 le 5033 + 0032 56 56 gt 50
where SMYS + 6895 (MPa) (or equivalently SMYS + 10 (ksi)) represents the flow stress of
the pipe steel dILI and lILI are the maximum depth (the defect typically has an irregular
through-thickness profile with varying depths along the profile) and length reported by ILI
respectively and M is the bulging or Folias factor It should be noted that the flow stress is
an empirical concept used to convert the stress-strain relationship of a strain-hardening
elastic-plastic material into an equivalent elastic-perfectly plastic stress-strain relationship
(Cosham and Hopkins 2002) While a commonly adopted definition of the flow stress is the
average of the yield and tensile strengths the flow stress is defined as SMYS + 6895 (MPa)
in the B31G Modified model The adequacy of such a definition especially for high-grade
Page 7 of 39
httpsmc06manuscriptcentralcomcjce-pubs
Canadian Journal of Civil Engineering
Draft
pipe steels can be a subject of future investigations As indicated in Eq [2a] the B31G
Modified model is only applicable to defects that are no more than 80 through the pipe wall
thickness Finally it is worth mentioning that commonly used ILI tools (eg the magnetic
flux leakage tool) typically report dILI as a fraction of tn ie dILItn but lILI as an absolute value
Let Po (Po le Pd) denote the MOP of the pipeline The FPR associated with the corrosion
defect can be simply evaluated as Pbn divided by Po It follows from Eq [1] that FPR can be
written as
[3] FPR = =gt = (13)13AB $ $ amp) le 08
[4] UFC = UF ∙ DgtE = gt∙∙13 where UFa is the de-facto utilization factor of the pipeline during operation which reflects a
combination of the safety margin incorporated in the design and any additional safety margin
resulting from the pipeline not operating at its full design capacity ie Po lt Pd
Equation [3] indicates that FPR evaluated from the B31G Modified model depends on
(SMYS+6895)SMYS UFa dILItn and lILI Because UFa usually corresponds to the class
location the recommendation in CSA Z662-11 that the threshold FPR be dependent on the
class location of the pipeline is justified Given SMYS dILItn and lILI a larger UFa leads to a
lower FPR and a smaller UFa leads to a higher FPR It is interesting to evaluate the upper
bound FPR FPRmax ie the value of FPR corresponding to an infinitesimally small defect It
follows from Eq [3] that FPRmax = (SMYS+6895)(UFaSMYS) For commonly used pipe
Page 8 of 39
httpsmc06manuscriptcentralcomcjce-pubs
Canadian Journal of Civil Engineering
Draft
steel grades with SMYS ranging from 290 to 483 MPa ie X42 to X70 grades (API 2004)
the values of (SMYS+6895)SMYS and FPRmax are listed in Table 1
Analysis Cases
We considered a set of 20 representative pipelines corresponding to three diameters (D = 273
(NPS 10) 406 (NPS 16) and 762 (NPS 30) mm) three SMYS values (SMYS = 289 359 and
483 MPa) and two MOPs (Po = 40 and 60 MPa) These pipelines cover wide ranges of tn
(from 40 to 179 mm) and UFa (from 028 to 080) as shown in Table 2 Note that cases 19
and 20 in the table were selected to represent small-diameter low-pressure pipelines for
which the minimum wall thicknesses requirement (CSA 2011) governs and consequently
results in low utilization factors For each pipeline a total of 24 representative corrosion
defects corresponding to all combinations of four dILItn values (dILItn = 025 035 045 and
05) and six lILI values (lILI = 50 100 150 200 300 and 400 mm) were considered
Methodology and Input for the Reliability Analysis
The limit state function for burst of a pipeline at a corrosion defect g can be written as
[5] F = minus 1
where Pb is the actual (as opposed to nominal) burst pressure capacity at the defect P is the
internal pressure of the pipeline and g le 0 represents failure (ie burst) It must be
emphasized that P is a random quantity whereas Pd and Po are both nominal pressure
parameters Pb is evaluated using the B31G Modified model as follows
[6] = G (HI) $ J$ amp) le 08
Page 9 of 39
httpsmc06manuscriptcentralcomcjce-pubs
Canadian Journal of Civil Engineering
Draft
[7] K = -1 + 06275 56 minus 0003375 59()6 56 le 5033 + 0032 56 56 gt 50
where ξ is the model error associated with the B31G Modified model t is the actual pipe wall
thickness σy is the yield strength of the pipe steel and d and l are the actual maximum depth
and length of the corrosion defect respectively The probability of failure (burst) pf is given
by
[8] LM = N OP(Q)RQSTU
where fX(x) denotes the joint probability density of the random variables involved in the limit
state function The FORM was employed in this study to evaluate the integral in Eq [6] by
calculating the reliability index β which is the shortest distance from the origin to the limit
state surface in the standard normal space The probability of burst is then evaluated as pf =
Φ(-β) with Φ(bull) being the standard normal distribution function
Ideally the time-dependency of the probability of burst should be taken into account because
the corrosion defect grows in size with time and the internal pressure of the pipeline also
fluctuates with time Because the corrosion mitigation is typically carried out a relatively
short time (say within a year) after ILI the reliability analysis was simplified as time-
independent in this study That is the growth of the corrosion defect was ignored and the
internal pressure was assumed to be a time-independent random variable represented by the
annual maximum operating pressure The probability of burst evaluated is therefore with
respect to a period of one year
Page 10 of 39
httpsmc06manuscriptcentralcomcjce-pubs
Canadian Journal of Civil Engineering
Draft
The B31G Modified model is applicable for dt le 08 but the FORM analysis may involve
the evaluation of Pb corresponding to 08 lt dt le 1 during the search for the design point or
the most probable failure point To deal with this issue a simple and practical extension of
the B31G Modified model was employed (Zhou and Zhang 2015) Pb was assumed to
decrease linearly from that calculated using Eq [6] at dt = 08 to zero at dt = 1
The statistical information summarized in Annex O of CSA Z662-11 indicates that ttn
generally follows a normal distribution with the mean ranging from 10 to 101 and the
coefficient of variation (COV) ranging from 10 to 17 Therefore ttn was assumed to be
normally distributed with the mean equal to unity and COV equal to 15 in this study Jiao
et al (1995) reported that σySMYS can be characterized by an either normal or lognormal
distribution with the mean ranging from 108 to 111 and COV ranging from 33 to 35
based on statistical analyses of extensive coupon test data Jiao et al also suggested that the
annual maximum operating pressure for gas pipelines can be characterized by a Gumbel
distribution with the mean between 103Po and 107Po and COV between 1 and 2
However it is pointed out in Annex O of CSA Z662-11 that this distribution is applicable to
locations immediately downstream of a compressor station Because the pressure drops along
the pipeline between compressor stations this distribution is a conservative estimate of the
annual maximum operating pressure at locations further downstream of a compressor station
It is further indicated in Annex O of CSA Z662-11 that the annual maximum operating
pressure of gas pipelines follows a beta distribution with the mean equal to 0993Po and COV
equal to 34 based on pressure records from one pipeline operator In this study σySMYS
was assumed to follow a lognormal distribution with the mean equal to 11 and COV equal to
Page 11 of 39
httpsmc06manuscriptcentralcomcjce-pubs
Canadian Journal of Civil Engineering
Draft
35 and PPo was assumed to follow a Gumbel distribution with the mean equal to unity
and COV equal to 30
Zhou and Zhang (2015) showed that the model error for the burst pressure capacity model is
critically important for evaluating the probability of burst of pipelines containing corrosion
defects Zhou and Huang (2012) evaluated the model errors associated with eight well-
known burst pressure capacity models for corroded pipes based on 150 full-scale burst tests
of pipe segments containing single isolated natural corrosion defects (as opposed to machined
defects) collected from the literature They suggested that the model error for the B31G
Modified model be characterized by a Gumbel distribution with the mean and COV equal to
1297 and 258 respectively This model error was adopted in this study
By assuming additive measurement errors (DNV 2010 Zhou and Nessim 2011) the ILI-
reported defect depth and length are related to the actual defect depth and length respectively
as follows
[9a] RVWV = R + X)
[9b] YVWV = Y + X5 where εd and εl are the measurement errors associated with the maximum depth and length
respectively It is common to assume that εd and εl follow normal distributions with a zero
mean (DNV 2010 Zhou and Nessim 2011) The standard deviations of εd and εl can then be
inferred from typical specifications of ILI tools ie dILI and lILI within plusmn10tn and plusmn10 mm of
d and l respectively 80 of the time (Stephens and Nessim 2006) Table 3 summarizes the
Page 12 of 39
httpsmc06manuscriptcentralcomcjce-pubs
Canadian Journal of Civil Engineering
Draft
probabilistic characteristics of the random variables involved in the reliability analysis It is
assumed that all the random variables are mutually independent of each other
It is advantageous to write PbP in the limit state function (ie Eq [5]) in the following form
[10] = G D $$ED ZI[[] ^[[EABD __gtE D $$EUD$ `$ED $$E J D$ `$Eamp Equation [10] suggests that given dILItn and lILI the probability of burst is largely dependent
on UFa a larger UFa leads to a higher probability of burst and a smaller UFa leads to a lower
probability of burst
Analysis Results
The values of FPR corresponding to the assumed 24 corrosion defects are plotted against the
reliability indices obtained from the FORM analysis in Fig 1 for an analysis case (case 8)
arbitrarily selected from Table 2
Two observations of Fig 1 are in order First there is essentially a one-to-one relationship
between FPR and the reliability index (probability of burst) for the pipeline The reliability
index increases monotonically as FPR increases for example FPR and β equal 130 and 243
respectively corresponding to dILItn =045 and lILI = 150 mm and 134 and 259 respectively
corresponding to dILItn =035 and lILI = 200 mm There are a few anomalies in the FPR - β
relationship if FPRs corresponding to different defects are very close For example FPR
equals 138 for dILItn = 025 and lILI = 400 mm with the corresponding β equal to 267
whereas FPR equals 137 for dILItn = 05 and lILI = 100 mm with the corresponding β equal to
269 Such anomalies however can be attributed to the minor numerical inaccuracies
Page 13 of 39
httpsmc06manuscriptcentralcomcjce-pubs
Canadian Journal of Civil Engineering
Draft
involved in the FORM analysis and are considered inconsequential Second the relationship
between FPR and β for the pipeline is almost perfectly linear For the other analysis cases
shown in Table 2 the above observations are equally applicable
The approximately linear relationship between FPR and β as demonstrated in Fig 1 deserves
some explanations To this end the limit state function given by Eq [5] is rewritten as
follows
[11] F = ( ==)( =) minus 1
The internal pressure P is expressed as γPo (γ is a Gumbel-distributed random variable with
the mean equal to unity and COV equal to 3 as indicated in Table 3) whereas Pbn equals
FPRtimesPo It follows that Eq [11] is now
[12] F = Aabc d minus 1
where X = PbPbn is a random variable representing the burst pressure capacity normalized by
Pbn The burst condition ie g lt 0 is equivalent to ln(FPRXγ) lt 0 The simple Monte
Carlo simulation of X was carried out based on the statistics of the basic parameters
summarized in Table 3 The results indicated that the lognormal distribution can fit simulated
samples of X reasonably well with the COV of X being around 26 Because the uncertainty
in X is much higher than that in γ γ is simplified as a deterministic quantity for the purpose of
investigating the relationship between FPR and β Given the above β can now be obtained as
[13] e asymp 5Aabghi5cHhi
Page 14 of 39
httpsmc06manuscriptcentralcomcjce-pubs
Canadian Journal of Civil Engineering
Draft
where mlnX and σlnX are the mean and standard deviation of lnX respectively Within the
relatively narrow range of FPR values for a given pipeline (eg between 10 and 17 for case
8 and between 25 and 36 for case 19 in Table 2) lnFPR is an almost linear function of
FPR It then follows that the FPR-β relationship is approximately linear
In each of Figs 2(a) through 2(h) FPRs are plotted against the corresponding β values for all
the analysis cases with the same UFa Figure 2 suggests that somewhat surprisingly the
above-described two observations about the FPR -β relationship for a given pipeline are also
applicable to different pipelines with the same UFa although there is slightly more scatter in
the data That is the FPR - β relationship only depends on UFa and is independent of the
other pipeline attributes such as the diameter pressure SMYS and wall thickness For a
given UFa the following equation is proposed to relate FPR to β
[14] FPR = je + k
where a and b are coefficients obtained from the simple linear regression analysis The
values of a and b corresponding to different values of UFa are summarized in Table 4 Also
shown in Table 4 is the range of β values (and the corresponding range of probabilities of
burst) over which Eq [14] was developed for each UFa ie the range of β values
corresponding to the 24 corrosion defects considered in the analysis Implications of these
ranges for the practical application are discussed in the next section
The threshold FPR corresponding to a selected target reliability index βt (or equivalently an
allowable probability of burst pfa) can be readily obtained from Eq [14] for UFa values given
in Table 4 The threshold FPR for a value of UFa not given in Table 4 can be determined by a
Page 15 of 39
httpsmc06manuscriptcentralcomcjce-pubs
Canadian Journal of Civil Engineering
Draft
linear interpolation of the threshold FPRs corresponding to the two nearest bounding UFa
values given in the table Furthermore values of βt and pfa implied by the threshold FPRs
recommended by ASME B318S and CSA Z662-11 were obtained from Eq [14] and are
summarized in Table 5 The results in Table 5 suggest that the threshold FPR of 11
recommended by ASME B318S leads to relatively low target reliability levels For pipelines
with high class location designations (ie high population density in the vicinity of the
pipelines) and thus low UFa values such as 056 and 044 the implied target reliability levels
appear too low to be commensurate with the potentially severe human safety-related
consequences of burst associated with such pipelines (Nessim et al 2009) On the other hand
the target reliability level implied by the threshold FPR recommended by CSA Z662-11
increases markedly as the class location increases βt increases from 226 for Class 1 pipelines
(UFa = 080) to 502 for Class 4 pipelines (UFa = 044) with the corresponding pfa decreasing
by approximately five orders of magnitude from 12 times 10-2
to 26 times 10-7
Considering that pfa
= 26 times 10-7
is an extremely low failure probability the threshold FPR of 227 for Class 4
pipelines is perhaps overly stringent The drawback of the CSA Z662 threshold FPRs
however is that they are associated with the class location of the pipeline rather than UFa
(Kariyawasam and Huang 2014) Two pipelines with the same class location can have
different values of UFa In this case applying the same CSA Z662 threshold FPR will lead to
different implied reliability levels for the two pipelines This drawback is overcome by the
use of Eq [14] and Table 4 For example consider two Class 2 pipelines with UFa equal to
072 and 060 respectively From Eq [14] and Table 4 the implied values of βt were
determined to be 275 (pfa = 30 times 10-3
) and 265 (pfa = 40 times 10-3
) for UFa = 072 and 060
Page 16 of 39
httpsmc06manuscriptcentralcomcjce-pubs
Canadian Journal of Civil Engineering
Draft
respectively corresponding to the CSA Z662 threshold FPR of 139 To achieve βt = 275 for
the pipeline with UFa = 060 the corresponding threshold FPR should be 142
Illustrative Examples
In this section two hypothetical examples are used to validate Eq [14] as well as illustrate its
application The first example involves a pipeline with D = 508 mm (NPS 20) SMYS = 359
MPa Po = 70 MPa tn = 69 mm and UFa = 072 It is assumed that an allowable probability
of burst of 10 times 10-3
(ie βt = 309) is selected for mitigating the defects on the pipeline The
corresponding threshold FPR is then determined as 148 from Eq [14] Consider three
representative corrosion defects with FPRs equal to the threshold FPR of 148 The ILI-
reported depths and lengths of these defects are summarized in Table 6 The probabilities of
burst of the three defects were evaluated using the FORM based on the same statistical
information as summarized in Table 3 and are shown in Table 6 As the probabilities of burst
associated with all three defects are slightly (10 - 15) below 10 times 10-3
the results
demonstrate the validity and simplicity of using Eq [14] to achieve reliability-consistent
mitigation of corrosion defects
The second example involves a pipeline with D = 6096 mm (NPS 24) SMYS = 448 MPa Po
= 68 MPa tn = 71 mm and UFa = 065 An allowable probability of burst of 50 times 10-4
(ie
βt = 329) was assumed for the defect mitigation The corresponding threshold FPR was
calculated to be 156 by linearly interpolating the FPR values corresponding to βt = 329 for
UFa = 072 and 060 respectively Consider three representative corrosion defects that have
FPRs equal to 156 The ILI-reported depths and lengths of the defects as well as the
probabilities of burst associated with the defects are also shown in Table 6 As indicated in
Page 17 of 39
httpsmc06manuscriptcentralcomcjce-pubs
Canadian Journal of Civil Engineering
Draft
the table the three probabilities of burst are about 15 - 20 below 50 times 10-4
which again
demonstrates the validity of Eq [14]
Discussion
The FPRs corresponding to the set of 24 corrosion defects included in the analysis are
representative of FPRs for the corrosion defects found in practice As such the ranges of β
values given in Table 4 are representative for the corresponding values of UFa Although Eq
[14] can be extrapolated to β values beyond the ranges given in Table 4 the extrapolation
may result in threshold FPRs that are either impractical or non-governing For example a βt
of 35 (pfa = 23 times 10-4
) for UFa = 080 which is greater than the upper bound of the
corresponding β range given in Table 4 results in a threshold FPR of 155 This threshold
FPR is clearly impractical for pipelines with UFa = 080 and SMYS ge 290 MPa (ie X42) as
the corresponding values of FPRmax are all less than or equal to 155 (see Table 1) On the
other hand a βt of 30 (pfa = 14 times 10-3
) for UFa = 044 which is smaller than the lower bound
of the corresponding β range results in a threshold FPR of 151 If this threshold FPR is
applied to case 18 (D = 762 mm SMYS = 483 MPa and tn = 108 mm) in Table 2 any
corrosion defects with dILItn lt 076 and lILI lt 150 mm will be considered non-critical as the
corresponding FPRs are greater than 151 In practice however most pipeline operators will
mitigate defects with dILItn gt 060 - 070 regardless of their FPRs (Kariyawasam and Huang
2014) Such a practice may also dictate the mitigation of defects on pipelines governed by
the minimum wall thickness requirement eg the cases with UFa = 035 and 028 in Table 2
unless a high target reliability level (eg βt gt 40) is justified for such pipelines
Page 18 of 39
httpsmc06manuscriptcentralcomcjce-pubs
Canadian Journal of Civil Engineering
Draft
It must be emphasized that Eq [14] and Table 4 are valid for a particular burst pressure
capacity model ie the ASME B31G Modified model and a specific set of input in the
reliability analysis as summarized in Table 3 A re-evaluation of the FPR-β relationship is
needed if a different burst pressure capacity model eg the ASME B31G or PCORRC model
is employed to determine FPR andor if the probabilistic characteristics of ttn σySMYS
PPo εd and εl for a specific pipeline deviate from those summarized in Table 3 to the extent
that the use of Eq [14] and Table 4 results in significantly non-conservative threshold FPRs
Conclusions
This study investigated the relationship between FPR and the probability of burst for metal-
loss corrosion defects on natural gas transmission pipelines designed per CSA Z662-11 The
ASME B31G Modified model was employed to evaluate the burst pressure capacity of the
pipeline at the corrosion defect A set of 20 representative gas pipelines with different
diameters maximum operating pressure and steel grades were developed corresponding to
wide ranges of the pipe wall thickness and utilization factor (UFa) For each pipeline FPRs
for 24 representative corrosion defects with dILItn ranging from 025 to 05 and lILI ranging
from 50 to 400 mm were evaluated using the B31G Modified model Furthermore the
FORM was employed to evaluate the probability of burst of the pipeline at each of the 24
corrosion defects by taking into account uncertainties in the wall thickness yield strength and
internal pressure measurement errors associated with the ILI-reported defect sizes and the
model error associated with the B31G Modified model
The analysis results suggest that a unique linear relationship exists between FPR and the
reliability index (β) corresponding to the probability of burst for different pipelines with the
Page 19 of 39
httpsmc06manuscriptcentralcomcjce-pubs
Canadian Journal of Civil Engineering
Draft
same utilization factor Simple linear regression equations between FPR and β for different
utilization factors were then developed on the basis of the analysis results These equations
allow rapid determination of the threshold FPR corresponding to a given target reliability
level for the purpose of identifying critical defects thus achieving reliability-consistent
mitigation of corrosion defects on pipelines Two examples were used to illustrate the
application and validity of the developed equations The implied reliability levels associated
with the threshold FPRs recommended by ASME B318S and CSA Z662-11 were also
clarified based on the FPR - β equations developed It is observed that the ASME B318S
threshold FPR implies relatively low reliability levels especially for pipelines with high class
location designations whereas the reliability levels implied by the CSA Z662 threshold FPRs
increase markedly as the class location increases Finally it is emphasized that the
application of the proposed FPR - β equation to a specific pipeline is predicated on the B31G
Modified model as well as the condition that the probabilistic characteristics of the relevant
random variables for the pipeline do not deviate markedly from those assumed in this study
Acknowledgement
The authors gratefully acknowledge the financial support provided by TransCanada Pipelines
Ltd and the Natural Sciences and Engineering Research Council of Canada (NSERC) in the
form of a Collaborative Research and Development project (CRDPJ 470571-14) Helpful
comments from the two anonymous reviewers are appreciated
Page 20 of 39
httpsmc06manuscriptcentralcomcjce-pubs
Canadian Journal of Civil Engineering
Draft
References
American Petroleum Institute (API) 2004 API Specification 5L specification for line pipe
American Petroleum Institute Washington DC
American Society of Mechanical Engineers (ASME) 2010 ASME B318S-2010 Managing
system integrity of gas pipelines ASME Code for Pressure Piping B31 Supplement to
ASME B318 American Society of Mechanical Engineers New York
Bartlett F M Hong H P and Zhou W 2003 Load factor calibration for the proposed 2005
edition of the National Building Code of Canada companion action load combination
Canadian Journal of Civil Engineering 30 440-448
Cosham A and Hopkins P 2002 The pipeline defect assessment manual In Proceedings
of the 4th
International Pipeline Conference Calgary 29 Sept - 3 Oct 2002 American Society
of Mechanical Engineers IPC2002-27067
Canadian Standards Association (CSA) 2011 CSA Z662 Oil and gas pipeline systems
Canadian Standards Association Mississauga Ontario
Det Norske Veritas (DNV) 2010 DNV RP-F101 Corroded pipelines DNV Recommended
Practice Det Norske Veritas Hovik Norway
Jiao G Sotberg T and Igland R T 1995 SUPERB 2M statistical data-basic uncertainty
measures for reliability analysis of offshore pipelines SUPERB JIP Report No STF70-
F95212 Norwegian Marine Technology Research Institute Trondheim Norway
Page 21 of 39
httpsmc06manuscriptcentralcomcjce-pubs
Canadian Journal of Civil Engineering
Draft
Kariyawasam S and Huang T 2014 How safe failure pressure ratios are related to SMYS
In Proceedings of the 10th
International Pipeline Conference Calgary 29 Sept - 3 Oct 2014
American Society of Mechanical Engineers IPC2014-33647
Kiefner J F and Vieth P H 1989 A modified criterion for evaluating the remaining
strength of corroded pipe PR 3-805 American Gas Association Washington DC
Low B K and Tang W H 1997 Efficient reliability evaluation using spreadsheet Journal
of Engineering Mechanics ASCE 123(7) 749-752
Low B K and Tang W H 2007 Efficient spreadsheet algorithm for first-order reliability
method Journal of Engineering Mechanics ASCE 133(12) 1378-1387
Melchers R E 1999 Structural reliability analysis and prediction 2nd Ed John Wiley amp
Sons Chichester England
Nessim M A Zhou W Zhou J Rothwell B and McLamb M 2009 Target reliability
levels for design and assessment of onshore natural gas pipelines Journal of Pressure Vessel
Technology ASME 131(6) 061701 1-12
Nowak AS 1995 Calibration of LRFD bridge code Journal of Structural Engineering
ASCE 121(8) 1245-1251
Stephens M and Nessim M A 2006 Comprehensive approach to corrosion management
based on structural reliability methods In Proceedings of 6th International Pipeline
Conference Calgary 25 - 29 Sept 2006 American Society of Mechanical Engineers
IPC2006-10458
Page 22 of 39
httpsmc06manuscriptcentralcomcjce-pubs
Canadian Journal of Civil Engineering
Draft
Zhou W and Zhang S 2015 Impact of model errors of burst capacity models on the
reliability evaluation of corroding pipelines Journal of Pipeline Systems Engineering and
Practice DOI 101061(ASCE)PS1949-12040000210 04015011 1-11
Zhou W and Huang GX 2012 Model error assessments of burst capacity models for
corroded pipelines International Journal of Pressure Vessels and Piping 99-100 1-8
Zhou W and Nessim MA 2011 Optimal deign of onshore natural gas pipelines Journal
of Pressure Vessel Technology ASME 133(3) 031702 1-11
Page 23 of 39
httpsmc06manuscriptcentralcomcjce-pubs
Canadian Journal of Civil Engineering
Draft
Table 1 Values of FPRmax for different pipe steel grades
Steel Grade X42 X52 X60 X65 X70
SMYS (MPa) 290 359 413 448 483
(SMYS+6895)SMYS 124 119 117 115 114
FPRmax
UFa = 08 155 149 146 144 143
UFa = 072 172 165 163 160 158
UFa = 056 221 213 209 205 204
UFa = 044 282 270 266 261 259
Page 24 of 39
httpsmc06manuscriptcentralcomcjce-pubs
Canadian Journal of Civil Engineering
Draft
Table 2 Attributes of representative pipelines considered in the analysis
Case
No
Po
(MPa)
SMYS
(MPa)
D
(mm)
tn
(mm)
UFa
1 6 290 762 99 080
2 6 290 762 109 072
3 6 290 762 131 060
4 6 290 762 141 056
5 6 290 762 158 050
6 6 290 762 179 044
7 6 359 762 80 080
8 6 359 762 88 072
9 6 359 762 106 060
10 6 359 762 114 056
11 6 359 762 127 050
12 6 359 762 145 044
13 6 483 762 59 080
14 6 483 762 66 072
15 6 483 762 79 060
16 6 483 762 85 056
17 6 483 762 95 050
18 6 483 762 108 044
19 4 483 273 40 028
20 4 483 406 48 035
Page 25 of 39
httpsmc06manuscriptcentralcomcjce-pubs
Canadian Journal of Civil Engineering
Draft
Table 3 Probabilistic characteristics of random variables in the reliability analysis
Variable Distribution Mean COV () Source
ttn Normal 10 15 CSA (2011)
σySMYS Lognormal 11 35 Jiao et al (1995)
PPo Gumbel 10 30 Jiao et al (1995)
CSA (2011)
εd (tn) Normal 0 781 Stephens amp Nessim (2006)
εl (mm) Normal 0 781 Stephens and Nessim (2006)
ξ Gumbel 1297 258 Zhou and Huang (2012)
1 The values are standard deviations
Page 26 of 39
httpsmc06manuscriptcentralcomcjce-pubs
Canadian Journal of Civil Engineering
Draft
Table 4 Regression coefficients in the FPR - β relationship for different values of UFa
UFa a b Range of β Range of pf
080 0242 0704 [124 329] [50 times 10-4
11 times 10-1
]
072 0257 0683 [128 378] [78 times 10-5
10 times 10-1
]
060 0292 0617 [205 469] [14 times 10-6
20 times 10-2
]
056 0308 0578 [238 505] [22 times 10-7
87 times 10-3
]
050 0338 0500 [287 560] [11 times 10-8
20 times 10-3
]
044 0377 0377 [344 617] [34 times 10-10
29 times 10-4
]
035 0406 0360 [403 655] [29 times 10-11
28 times 10-5
]
028 0479 0156 [474 729] [16 times 10-13
11 times 10-6
]
Page 27 of 39
httpsmc06manuscriptcentralcomcjce-pubs
Canadian Journal of Civil Engineering
Draft
Table 5 Target reliability levels (βt and pfa) implied by threshold FPRs recommended by
ASME B318S and CSA Z662-11
Standard Threshold FPR UFa βt pfa
ASME
B318S
11 0721 162 53 times 10
-2
11 056 1692 46 times 10
-2
11 044 1922 27 times 10
-2
CSA
Z662-11
125 080 226 12 times 10-2
139 072 275 30 times 10-3
179 056 394 41 times 10-5
227 044 502 26 times 10-7
Note 1 Pipelines designed per the ASME standard typically have a maximum
utilization factor of 072
2 The value of βt is beyond the range of β values indicated in Table 4
Page 28 of 39
httpsmc06manuscriptcentralcomcjce-pubs
Canadian Journal of Civil Engineering
Draft
Table 6 Probabilities of burst of corrosion defects in Examples 1 and 2
Example Defect dILItn lILI (mm) FPR pf
1
1 049 50
148
90 times 10-4
2 034 75 85 times 10-4
3 027 100 88 times 10-4
2
1 058 50
156
43 times 10-4
2 042 75 42 times 10-4
3 033 100 40 times 10-4
Page 29 of 39
httpsmc06manuscriptcentralcomcjce-pubs
Canadian Journal of Civil Engineering
Draft
Figure Captions
Figure 1 FPR vs Reliability Index for Case 8 (D = 762 mm Po = 6 MPa SMYS = 359 MPa
tn = 88 mm and UFa = 072)
Figure 2 FPR vs Reliability Index for Analysis Cases with the Same UFa
(a) UFa = 080
(b) UFa = 072
(c) UFa = 060
(d) UFa = 056
(e) UFa = 050
(f) UFa = 044
(g) UFa = 035
(h) UFa = 028
Page 30 of 39
httpsmc06manuscriptcentralcomcjce-pubs
Canadian Journal of Civil Engineering
Draft
10
11
12
13
14
15
16
17
10 15 20 25 30 35 40
FPR
Reliability Index ββββ
Data
Linear fit
Page 31 of 39
httpsmc06manuscriptcentralcomcjce-pubs
Canadian Journal of Civil Engineering
Draft
10
11
12
13
14
15
16
10 15 20 25 30 35
FPR
Reliability Index ββββ
Data
Linear fit
Page 32 of 39
httpsmc06manuscriptcentralcomcjce-pubs
Canadian Journal of Civil Engineering
Draft
10
11
12
13
14
15
16
17
18
10 15 20 25 30 35 40
FPR
Reliability Index ββββ
Data
Linear fit
Page 33 of 39
httpsmc06manuscriptcentralcomcjce-pubs
Canadian Journal of Civil Engineering
Draft
10
12
14
16
18
20
22
10 20 30 40 50
FPR
Reliability Index ββββ
Data
Linear fit
Page 34 of 39
httpsmc06manuscriptcentralcomcjce-pubs
Canadian Journal of Civil Engineering
Draft
10
12
14
16
18
20
22
24
10 20 30 40 50 60
FPR
Reliability Index ββββ
Data
Linear fit
Page 35 of 39
httpsmc06manuscriptcentralcomcjce-pubs
Canadian Journal of Civil Engineering
Draft
10
12
14
16
18
20
22
24
26
10 20 30 40 50 60
FPR
Reliability Index ββββ
Data
Linear fit
Page 36 of 39
httpsmc06manuscriptcentralcomcjce-pubs
Canadian Journal of Civil Engineering
Draft
10
12
14
16
18
20
22
24
26
28
30
10 20 30 40 50 60 70
FPR
Reliability Index β
DataLinear fit
Page 37 of 39
httpsmc06manuscriptcentralcomcjce-pubs
Canadian Journal of Civil Engineering
Draft
10
15
20
25
30
35
10 20 30 40 50 60 70
FPR
Reliability Index ββββ
Data
Linear fit
Page 38 of 39
httpsmc06manuscriptcentralcomcjce-pubs
Canadian Journal of Civil Engineering
Draft
10
15
20
25
30
35
40
10 20 30 40 50 60 70 80
FPR
Reliability Index ββββ
Data
Linear fit
Page 39 of 39
httpsmc06manuscriptcentralcomcjce-pubs
Canadian Journal of Civil Engineering
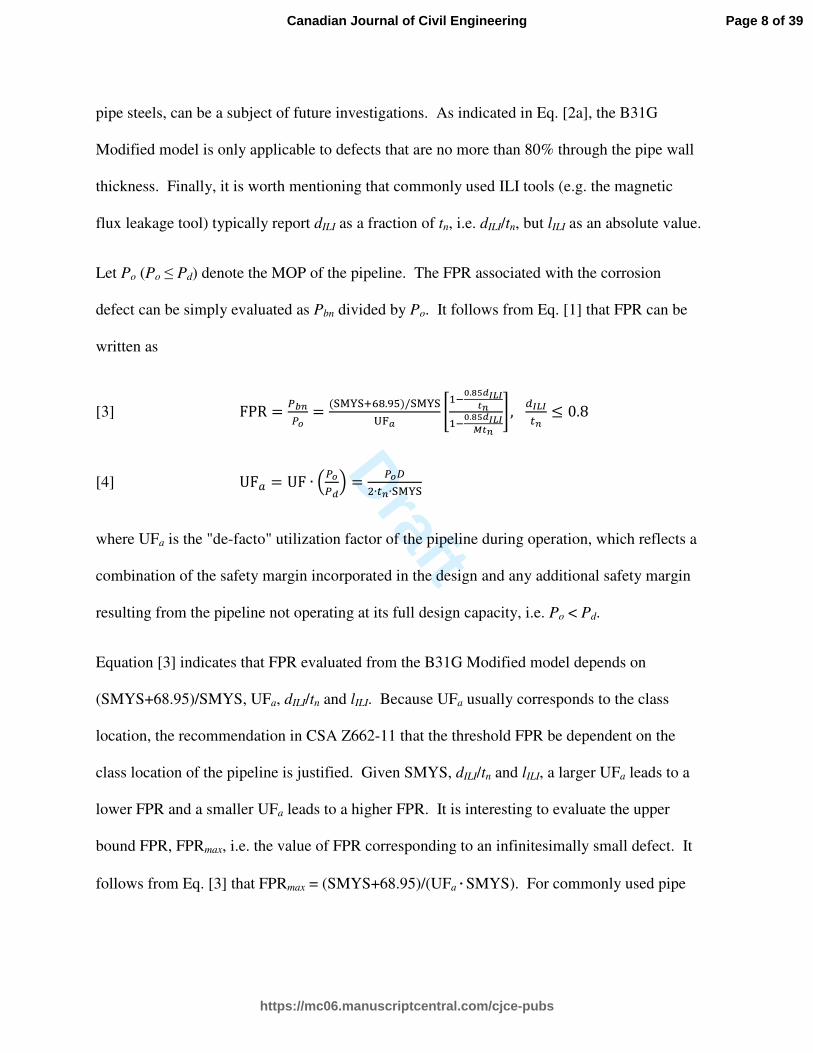
Draft
Table 3 Probabilistic characteristics of random variables in the reliability analysis
Variable Distribution Mean COV () Source
ttn Normal 10 15 CSA (2011)
σySMYS Lognormal 11 35 Jiao et al (1995)
PPo Gumbel 10 30 Jiao et al (1995)
CSA (2011)
εd (tn) Normal 0 781 Stephens amp Nessim (2006)
εl (mm) Normal 0 781 Stephens and Nessim (2006)
ξ Gumbel 1297 258 Zhou and Huang (2012)
1 The values are standard deviations
Page 26 of 39
httpsmc06manuscriptcentralcomcjce-pubs
Canadian Journal of Civil Engineering
Draft
Table 4 Regression coefficients in the FPR - β relationship for different values of UFa
UFa a b Range of β Range of pf
080 0242 0704 [124 329] [50 times 10-4
11 times 10-1
]
072 0257 0683 [128 378] [78 times 10-5
10 times 10-1
]
060 0292 0617 [205 469] [14 times 10-6
20 times 10-2
]
056 0308 0578 [238 505] [22 times 10-7
87 times 10-3
]
050 0338 0500 [287 560] [11 times 10-8
20 times 10-3
]
044 0377 0377 [344 617] [34 times 10-10
29 times 10-4
]
035 0406 0360 [403 655] [29 times 10-11
28 times 10-5
]
028 0479 0156 [474 729] [16 times 10-13
11 times 10-6
]
Page 27 of 39
httpsmc06manuscriptcentralcomcjce-pubs
Canadian Journal of Civil Engineering
Draft
Table 5 Target reliability levels (βt and pfa) implied by threshold FPRs recommended by
ASME B318S and CSA Z662-11
Standard Threshold FPR UFa βt pfa
ASME
B318S
11 0721 162 53 times 10
-2
11 056 1692 46 times 10
-2
11 044 1922 27 times 10
-2
CSA
Z662-11
125 080 226 12 times 10-2
139 072 275 30 times 10-3
179 056 394 41 times 10-5
227 044 502 26 times 10-7
Note 1 Pipelines designed per the ASME standard typically have a maximum
utilization factor of 072
2 The value of βt is beyond the range of β values indicated in Table 4
Page 28 of 39
httpsmc06manuscriptcentralcomcjce-pubs
Canadian Journal of Civil Engineering
Draft
Table 6 Probabilities of burst of corrosion defects in Examples 1 and 2
Example Defect dILItn lILI (mm) FPR pf
1
1 049 50
148
90 times 10-4
2 034 75 85 times 10-4
3 027 100 88 times 10-4
2
1 058 50
156
43 times 10-4
2 042 75 42 times 10-4
3 033 100 40 times 10-4
Page 29 of 39
httpsmc06manuscriptcentralcomcjce-pubs
Canadian Journal of Civil Engineering
Draft
Figure Captions
Figure 1 FPR vs Reliability Index for Case 8 (D = 762 mm Po = 6 MPa SMYS = 359 MPa
tn = 88 mm and UFa = 072)
Figure 2 FPR vs Reliability Index for Analysis Cases with the Same UFa
(a) UFa = 080
(b) UFa = 072
(c) UFa = 060
(d) UFa = 056
(e) UFa = 050
(f) UFa = 044
(g) UFa = 035
(h) UFa = 028
Page 30 of 39
httpsmc06manuscriptcentralcomcjce-pubs
Canadian Journal of Civil Engineering
Draft
10
11
12
13
14
15
16
17
10 15 20 25 30 35 40
FPR
Reliability Index ββββ
Data
Linear fit
Page 31 of 39
httpsmc06manuscriptcentralcomcjce-pubs
Canadian Journal of Civil Engineering
Draft
10
11
12
13
14
15
16
10 15 20 25 30 35
FPR
Reliability Index ββββ
Data
Linear fit
Page 32 of 39
httpsmc06manuscriptcentralcomcjce-pubs
Canadian Journal of Civil Engineering
Draft
10
11
12
13
14
15
16
17
18
10 15 20 25 30 35 40
FPR
Reliability Index ββββ
Data
Linear fit
Page 33 of 39
httpsmc06manuscriptcentralcomcjce-pubs
Canadian Journal of Civil Engineering
Draft
10
12
14
16
18
20
22
10 20 30 40 50
FPR
Reliability Index ββββ
Data
Linear fit
Page 34 of 39
httpsmc06manuscriptcentralcomcjce-pubs
Canadian Journal of Civil Engineering
Draft
10
12
14
16
18
20
22
24
10 20 30 40 50 60
FPR
Reliability Index ββββ
Data
Linear fit
Page 35 of 39
httpsmc06manuscriptcentralcomcjce-pubs
Canadian Journal of Civil Engineering
Draft
10
12
14
16
18
20
22
24
26
10 20 30 40 50 60
FPR
Reliability Index ββββ
Data
Linear fit
Page 36 of 39
httpsmc06manuscriptcentralcomcjce-pubs
Canadian Journal of Civil Engineering
Draft
10
12
14
16
18
20
22
24
26
28
30
10 20 30 40 50 60 70
FPR
Reliability Index β
DataLinear fit
Page 37 of 39
httpsmc06manuscriptcentralcomcjce-pubs
Canadian Journal of Civil Engineering
Draft
10
15
20
25
30
35
10 20 30 40 50 60 70
FPR
Reliability Index ββββ
Data
Linear fit
Page 38 of 39
httpsmc06manuscriptcentralcomcjce-pubs
Canadian Journal of Civil Engineering
Draft
10
15
20
25
30
35
40
10 20 30 40 50 60 70 80
FPR
Reliability Index ββββ
Data
Linear fit
Page 39 of 39
httpsmc06manuscriptcentralcomcjce-pubs
Canadian Journal of Civil Engineering
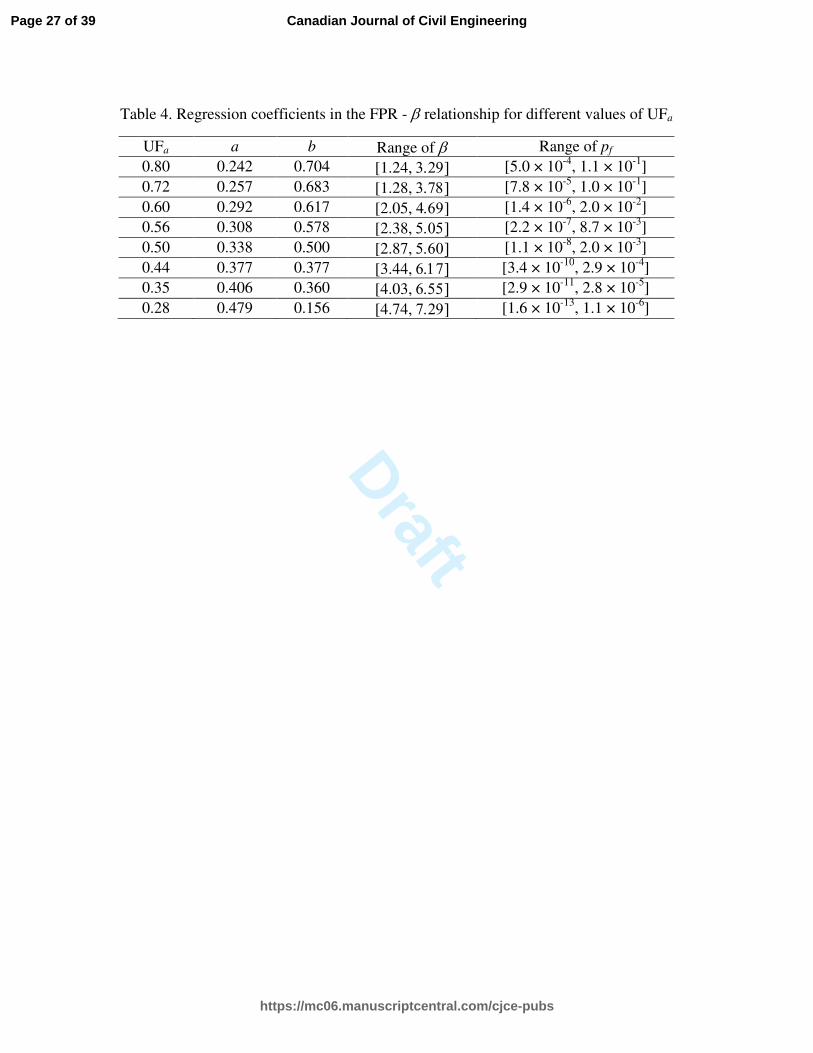
Draft
10
11
12
13
14
15
16
17
10 15 20 25 30 35 40
FPR
Reliability Index ββββ
Data
Linear fit
Page 31 of 39
httpsmc06manuscriptcentralcomcjce-pubs
Canadian Journal of Civil Engineering
Draft
10
11
12
13
14
15
16
10 15 20 25 30 35
FPR
Reliability Index ββββ
Data
Linear fit
Page 32 of 39
httpsmc06manuscriptcentralcomcjce-pubs
Canadian Journal of Civil Engineering
Draft
10
11
12
13
14
15
16
17
18
10 15 20 25 30 35 40
FPR
Reliability Index ββββ
Data
Linear fit
Page 33 of 39
httpsmc06manuscriptcentralcomcjce-pubs
Canadian Journal of Civil Engineering
Draft
10
12
14
16
18
20
22
10 20 30 40 50
FPR
Reliability Index ββββ
Data
Linear fit
Page 34 of 39
httpsmc06manuscriptcentralcomcjce-pubs
Canadian Journal of Civil Engineering
Draft
10
12
14
16
18
20
22
24
10 20 30 40 50 60
FPR
Reliability Index ββββ
Data
Linear fit
Page 35 of 39
httpsmc06manuscriptcentralcomcjce-pubs
Canadian Journal of Civil Engineering
Draft
10
12
14
16
18
20
22
24
26
10 20 30 40 50 60
FPR
Reliability Index ββββ
Data
Linear fit
Page 36 of 39
httpsmc06manuscriptcentralcomcjce-pubs
Canadian Journal of Civil Engineering
Draft
10
12
14
16
18
20
22
24
26
28
30
10 20 30 40 50 60 70
FPR
Reliability Index β
DataLinear fit
Page 37 of 39
httpsmc06manuscriptcentralcomcjce-pubs
Canadian Journal of Civil Engineering
Draft
10
15
20
25
30
35
10 20 30 40 50 60 70
FPR
Reliability Index ββββ
Data
Linear fit
Page 38 of 39
httpsmc06manuscriptcentralcomcjce-pubs
Canadian Journal of Civil Engineering
Draft
10
15
20
25
30
35
40
10 20 30 40 50 60 70 80
FPR
Reliability Index ββββ
Data
Linear fit
Page 39 of 39
httpsmc06manuscriptcentralcomcjce-pubs
Canadian Journal of Civil Engineering

Draft
10
11
12
13
14
15
16
17
18
10 15 20 25 30 35 40
FPR
Reliability Index ββββ
Data
Linear fit
Page 33 of 39
httpsmc06manuscriptcentralcomcjce-pubs
Canadian Journal of Civil Engineering
Draft
10
12
14
16
18
20
22
10 20 30 40 50
FPR
Reliability Index ββββ
Data
Linear fit
Page 34 of 39
httpsmc06manuscriptcentralcomcjce-pubs
Canadian Journal of Civil Engineering
Draft
10
12
14
16
18
20
22
24
10 20 30 40 50 60
FPR
Reliability Index ββββ
Data
Linear fit
Page 35 of 39
httpsmc06manuscriptcentralcomcjce-pubs
Canadian Journal of Civil Engineering
Draft
10
12
14
16
18
20
22
24
26
10 20 30 40 50 60
FPR
Reliability Index ββββ
Data
Linear fit
Page 36 of 39
httpsmc06manuscriptcentralcomcjce-pubs
Canadian Journal of Civil Engineering
Draft
10
12
14
16
18
20
22
24
26
28
30
10 20 30 40 50 60 70
FPR
Reliability Index β
DataLinear fit
Page 37 of 39
httpsmc06manuscriptcentralcomcjce-pubs
Canadian Journal of Civil Engineering
Draft
10
15
20
25
30
35
10 20 30 40 50 60 70
FPR
Reliability Index ββββ
Data
Linear fit
Page 38 of 39
httpsmc06manuscriptcentralcomcjce-pubs
Canadian Journal of Civil Engineering
Draft
10
15
20
25
30
35
40
10 20 30 40 50 60 70 80
FPR
Reliability Index ββββ
Data
Linear fit
Page 39 of 39
httpsmc06manuscriptcentralcomcjce-pubs
Canadian Journal of Civil Engineering

Draft
10
12
14
16
18
20
22
24
10 20 30 40 50 60
FPR
Reliability Index ββββ
Data
Linear fit
Page 35 of 39
httpsmc06manuscriptcentralcomcjce-pubs
Canadian Journal of Civil Engineering
Draft
10
12
14
16
18
20
22
24
26
10 20 30 40 50 60
FPR
Reliability Index ββββ
Data
Linear fit
Page 36 of 39
httpsmc06manuscriptcentralcomcjce-pubs
Canadian Journal of Civil Engineering
Draft
10
12
14
16
18
20
22
24
26
28
30
10 20 30 40 50 60 70
FPR
Reliability Index β
DataLinear fit
Page 37 of 39
httpsmc06manuscriptcentralcomcjce-pubs
Canadian Journal of Civil Engineering
Draft
10
15
20
25
30
35
10 20 30 40 50 60 70
FPR
Reliability Index ββββ
Data
Linear fit
Page 38 of 39
httpsmc06manuscriptcentralcomcjce-pubs
Canadian Journal of Civil Engineering
Draft
10
15
20
25
30
35
40
10 20 30 40 50 60 70 80
FPR
Reliability Index ββββ
Data
Linear fit
Page 39 of 39
httpsmc06manuscriptcentralcomcjce-pubs
Canadian Journal of Civil Engineering

Draft
10
12
14
16
18
20
22
24
26
28
30
10 20 30 40 50 60 70
FPR
Reliability Index β
DataLinear fit
Page 37 of 39
httpsmc06manuscriptcentralcomcjce-pubs
Canadian Journal of Civil Engineering
Draft
10
15
20
25
30
35
10 20 30 40 50 60 70
FPR
Reliability Index ββββ
Data
Linear fit
Page 38 of 39
httpsmc06manuscriptcentralcomcjce-pubs
Canadian Journal of Civil Engineering
Draft
10
15
20
25
30
35
40
10 20 30 40 50 60 70 80
FPR
Reliability Index ββββ
Data
Linear fit
Page 39 of 39
httpsmc06manuscriptcentralcomcjce-pubs
Canadian Journal of Civil Engineering

Draft
10
15
20
25
30
35
40
10 20 30 40 50 60 70 80
FPR
Reliability Index ββββ
Data
Linear fit
Page 39 of 39
httpsmc06manuscriptcentralcomcjce-pubs
Canadian Journal of Civil Engineering