Sinon Corporation and Subsidiaries part of an audit in accordance with the auditing standards...
67
Sinon Corporation and Subsidiaries Consolidated Financial Statements for the Years Ended December 31, 2016 and 2015 and Independent Auditors’ Report
Transcript of Sinon Corporation and Subsidiaries part of an audit in accordance with the auditing standards...

Sinon Corporation and Subsidiaries Consolidated Financial Statements for the Years Ended December 31, 2016 and 2015 and Independent Auditors’ Report


- 3 -
anomalies, the Group’s annual operating income has thusly been affected. Such affects were significant for the
consolidated financial statements; therefore, we identified the recognition of revenue as a key audit matter.
Our audit procedures performed in respect of this key audit matter included the following:
1. Assessed the appropriateness of the design and operating effectiveness of the relevant operating procedures
for the revenue recognition of the crop protection department in the Group and tested the effective
operation of the relevant operations in the year.
2. Understood and analyzed the changes in the transactions of the major export customers in the crop
protection department, executed substantive procedures to sample the major export customers in the crop
protection department from the export revenue subsidiary ledger, and checked the sales receipts and
shipping records to confirm the authenticity of the sales revenue.
Evaluated impairment of trade receivables
For the related accounting policies and detailed information on revenue recognition, refer to Notes 5 and 9 of
the consolidated financial statements. The Group’s trade receivables, net was $1,897,939 thousand as of
December 31, 2016 (excluding $206,279 thousand of allowances for impairment loss).
The Group’s management assessed the impairment of accounts receivable which were considered to have a
possible recoverability and the background for the yet-unrecovered state.
Such impairment assessment involved management’s subjective judgment, and the balance of the Group’s
accounts receivable was significant; therefore, we identified the impairment of trade receivables as a key audit
matter.
Our audit procedures performed in respect of this key audit matter included the following:
1. Assessed management’s policies of the allowance for impairment, including analyzing the allowance for
doubtful accounts by surveying management, reviewing the historical payment situation of customers, and
tracing the abnormalities resulting from such treatment.
2. Tested the aging of accounts receivable and reviewed the allowance for impairment to confirm the
appropriateness of the accounting estimates.
Other Matter
We have also audited the parent company only financial statements of Sinon Corporation as of and for the years
ended December 31, 2016 and 2015 on which we have issued an unmodified opinon.
Responsibilities of Management and Those Charged with Governance for the Consolidated Financial
Statements
Management is responsible for the preparation and fair presentation of the consolidated financial statements in
accordance with the Regulations Governing the Preparation of Financial Reports by Securities Issuers, and IFRS,
IAS, IFRIC, and SIC endorsed and issued into effect by the Financial Supervisory Commission of the Republic
of China, and for such internal control as management determines is necessary to enable the preparation of
consolidated financial statements that are free from material misstatement, whether due to fraud or error.
In preparing the consolidated financial statements, management is responsible for assessing the Group’s ability
to continue as a going concern, disclosing, as applicable, matters related to going concern and using the going
concern basis of accounting unless management either intends to liquidate the Group or to cease operations, or
has no realistic alternative but to do so.

- 4 -
Those charged with governance, including the audit committee, are responsible for overseeing the Group’s
financial reporting process.
Auditors’ Responsibilities for the Audit of the Consolidated Financial Statements
Our objectives are to obtain reasonable assurance about whether the consolidated financial statements as a
whole are free from material misstatement, whether due to fraud or error, and to issue an auditors’ report that
includes our opinion. Reasonable assurance is a high level of assurance, but is not a guarantee that an audit
conducted in accordance with the auditing standards generally accepted in the Republic of China will always
detect a material misstatement when it exists. Misstatements can arise from fraud or error and are considered
material if, individually or in the aggregate, they could reasonably be expected to influence the economic
decisions of users taken on the basis of these consolidated financial statements.
As part of an audit in accordance with the auditing standards generally accepted in the Republic of China, we
exercise professional judgment and maintain professional skepticism throughout the audit. We also:
1. Identify and assess the risks of material misstatement of the consolidated financial statements, whether due
to fraud or error, design and perform audit procedures responsive to those risks, and obtain audit evidence
that is sufficient and appropriate to provide a basis for our opinion. The risk of not detecting a material
misstatement resulting from fraud is higher than for one resulting from error, as fraud may involve
collusion, forgery, intentional omissions, misrepresentations, or the override of internal control.
2. Obtain an understanding of internal control relevant to the audit in order to design audit procedures that are
appropriate in the circumstances, but not for the purpose of expressing an opinion on the effectiveness of
the Group’s internal control.
3. Evaluate the appropriateness of accounting policies used and the reasonableness of accounting estimates
and related disclosures made by management.
4. Conclude on the appropriateness of management’s use of the going concern basis of accounting and, based
on the audit evidence obtained, whether a material uncertainty exists related to events or conditions that
may cast significant doubt on the Group’s ability to continue as a going concern. If we conclude that a
material uncertainty exists, we are required to draw attention in our auditors’ report to the related
disclosures in the consolidated financial statements or, if such disclosures are inadequate, to modify our
opinion. Our conclusions are based on the audit evidence obtained up to the date of our auditors’ report.
However, future events or conditions may cause the Group to cease to continue as a going concern.
5. Evaluate the overall presentation, structure and content of the consolidated financial statements, including
the disclosures, and whether the consolidated financial statements represent the underlying transactions and
events in a manner that achieves fair presentation.
6. Obtain sufficient and appropriate audit evidence regarding the financial information of entities or business
activities within the Group to express an opinion on the consolidated financial statements. We are
responsible for the direction, supervision, and performance of the group audit. We remain solely
responsible for our audit opinion.
We communicate with those charged with governance regarding, among other matters, the planned scope and
timing of the audit and significant audit findings, including any significant deficiencies in internal control that
we identify during our audit.
We also provide those charged with governance with a statement that we have complied with relevant ethical
requirements regarding independence, and to communicate with them all relationships and other matters that
may reasonably be thought to bear on our independence, and where applicable, related safeguards.

- 5 -
From the matters communicated with those charged with governance, we determine those matters that were of
most significance in the audit of the consolidated financial statements for the year ended December 31, 2016
and are therefore the key audit matters. We describe these matters in our auditors’ report unless law or
regulation precludes public disclosure about the matter or when, in extremely rare circumstances, we determine
that a matter should not be communicated in our report because the adverse consequences of doing so would
reasonably be expected to outweigh the public interest benefits of such communication.
The engagement partners on the audit resulting in this independent auditors’ report are Shu-Jing Chiang and
Tung-Yun Tseng.
Deloitte & Touche
Taipei, Taiwan
Republic of China
March 24, 2017
Notice to Readers
The accompanying consolidated financial statements are intended only to present the consolidated financial
position, financial performance and cash flows in accordance with accounting principles and practices
generally accepted in the Republic of China and not those of any other jurisdictions. The standards,
procedures and practices to audit such consolidated financial statements are those generally applied in the
Republic of China.
For the convenience of readers, the independent auditors’ report and the accompanying consolidated financial
statements have been translated into English from the original Chinese version prepared and used in the
Republic of China. If there is any conflict between the English version and the original Chinese version or any
difference in the interpretation of the two versions, the Chinese-language independent auditors’ report and
consolidated financial statements shall prevail.

- 6 -
SINON CORPORATION AND SUBSIDIARIES
CONSOLIDATED BALANCE SHEETS
DECEMBER 31, 2016 AND 2015
(In Thousands of New Taiwan Dollars)
2016 2015
ASSETS Amount % Amount %
CURRENT ASSETS
Cash and cash equivalents (Notes 4 and 6) $ 1,364,330 9 $ 1,113,769 7
Available-for-sale financial assets - current (Notes 4 and 7) 14,558 - 17,269 -
Notes receivable from non-related parties 160,715 1 170,230 1
Trade receivables from non-related parties (Notes 4, 5 and 9) 1,897,939 12 1,614,544 10
Trade receivables from related parties (Note 27) - - 274 -
Other receivables (Note 27) 304,234 2 207,371 1
Inventories - manufacturing (Notes 4 and 10) 2,981,612 19 3,226,975 21
Inventories - construction (Notes 4, 11, 28 and 29) 435,658 3 437,280 3
Prepayments 274,041 2 218,930 2
Other current assets 22,842 - 37,734 -
Total current assets 7,455,929 48 7,044,376 45
NON-CURRENT ASSETS
Financial assets measured at cost - non-current (Notes 4 and 8) 18,918 - 18,918 -
Investments accounted for using equity method (Notes 4 and 13) 33,934 - 28,204 -
Property, plant and equipment (Notes 4, 14, 27, 28 and 29) 7,498,813 48 7,709,432 49
Deferred tax assets (Notes 4 and 22) 87,017 - 175,717 1
Prepayments for equipment 108,568 1 116,465 1
Refundable deposits (Note 28) 90,182 1 96,757 1
Other non-current assets (Note 15) 383,415 2 388,472 3
Total non-current assets 8,220,847 52 8,533,965 55
TOTAL $ 15,676,776 100 $ 15,578,341 100
LIABILITIES AND EQUITY
CURRENT LIABILITIES
Short-term borrowings (Notes 16 and 28) $ 1,599,851 10 $ 1,607,608 10
Short-term bills payable (Note 16) 300,000 2 50,000 -
Financial liabilities at fair value through profit or loss - current (Notes 4 and 17) - - 1,955 -
Notes payable to non-related parties 98,048 1 72,135 1
Trade payables to non-related parties 1,606,892 10 1,521,769 10
Trade payables to related parties (Note 27) 2,359 - 1,593 -
Current tax liabilities (Note 22) 4,252 - 38,309 -
Other payables (Note 18) 884,797 6 842,819 6
Current portion of long-term borrowings (Notes 16 and 28) 221,663 1 455,635 3
Current portion of bonds payable (Notes 4 and 17) - - 970,947 6
Other current liabilities 413,334 3 159,113 1
Total current liabilities 5,131,196 33 5,721,883 37
NON-CURRENT LIABILITIES
Bonds payable (Notes 4 and 17) 836,610 5 - -
Long-term borrowings (Notes 16 and 28) 2,877,938 18 3,041,039 19
Deferred tax liabilities (Notes 4 and 22) 242,114 2 259,639 2
Net defined benefit liability (Notes 4 and 19) 573,495 4 1,010,332 6
Guarantee deposits 132,546 1 112,706 1
Other non-current liabilities 39,111 - 37,221 -
Total non-current liabilities 4,701,814 30 4,460,937 28
Total liabilities 9,833,010 63 10,182,820 65
EQUITY ATTRIBUTABLE TO OWNERS OF THE COMPANY
Ordinary shares 3,565,168 23 3,448,032 22
Capital surplus 250,688 1 212,494 2
Retained earnings
Legal reserve 576,728 3 541,454 4
Special reserve 108,783 1 39,262 -
Unappropriated earnings 1,444,343 9 1,155,330 7
Other equity (203,887) (1) (108,782) (1)
Total equity attributable to owners of the Company 5,741,823 36 5,287,790 34
NON-CONTROLLING INTERESTS 101,943 1 107,731 1
Total equity 5,843,766 37 5,395,521 35
TOTAL $ 15,676,776 100 $ 15,578,341 100
The accompanying notes are an integral part of the consolidated financial statements.

- 7 -
SINON CORPORATION AND SUBSIDIARIES
CONSOLIDATED STATEMENTS OF COMPREHENSIVE INCOME
FOR THE YEARS ENDED DECEMBER 31, 2016 AND 2015
(In Thousands of New Taiwan Dollars, Except Earnings Per Share)
2016 2015
Amount % Amount %
OPERATING REVENUE (Notes 4 and 27) $ 16,289,119 100 $ 17,731,881 100
OPERATING COSTS (Notes 10, 21 and 27) 11,812,381 72 13,057,664 74
GROSS PROFIT 4,476,738 28 4,674,217 26
OPERATING EXPENSES (Note 21 and 27)
Selling and marketing expenses 3,450,809 21 3,519,724 20
General and administrative expenses 228,613 2 289,917 1
Research and development expenses 153,308 1 190,986 1
Total operating expenses 3,832,730 24 4,000,627 22
PROFIT FROM OPERATIONS 644,008 4 673,590 4
NON-OPERATING INCOME AND EXPENSES
Other income (Note 21) 80,643 - 107,277 1
Other gains and losses (Note 21) (15,420) - 28,007 -
Foreign exchange gain (loss), net (Note 4) 125,381 1 (252,955) (2)
Finance costs (Note 21) (115,175) (1) (116,191) (1)
Share of profit of associates (Notes 4 and 13) 2,905 - 3,455 -
Total non-operating income and expenses 78,334 - (230,407) (2)
PROFIT BEFORE INCOME TAX 722,342 4 443,183 2
INCOME TAX EXPENSE (Notes 4 and 22) 154,483 1 82,680 -
NET PROFIT FOR THE YEAR 567,859 3 360,503 2
OTHER COMPREHENSIVE INCOME (LOSS)
Items that will not be reclassified subsequently to
profit or loss:
Remeasurement of defined benefit plans (Notes 4
and 19) 52,227 - (65,992) -
Share of the other comprehensive income (loss) of
associates accounted for using the equity
method (Notes 4 and 13) 2,281 - (1,062) -
Income tax relating to items that will not be
reclassified subsequently to profit or loss (Notes
4 and 22) (8,878) - 11,218 -
45,630 - (55,836) -
(Continued)

- 8 -
SINON CORPORATION AND SUBSIDIARIES
CONSOLIDATED STATEMENTS OF COMPREHENSIVE INCOME
FOR THE YEARS ENDED DECEMBER 31, 2016 AND 2015
(In Thousands of New Taiwan Dollars, Except Earnings Per Share)
2016 2015
Amount % Amount %
Items that may be reclassified subsequently to profit
or loss:
Exchange differences on translating foreign
operations (Notes 4 and 12) $ (99,272) - $ (67,835) (1)
Unrealized gain (loss) on available-for-sale
financial assets (Notes 4 and 7) 1,953 - (1,687) -
Share of the other comprehensive income of
associates accounted for using the equity
method (Notes 4 and 13) 2,214 - - -
(95,105) - (69,522) (1)
Other comprehensive loss for the year, net of
income tax (49,475) - (125,358) (1)
TOTAL COMPREHENSIVE INCOME FOR THE
YEAR $ 518,384 3 $ 235,145 1
NET PROFIT ATTRIBUTABLE TO:
Owners of the Company $ 554,470 3 $ 352,733 2
Non-controlling interests 13,389 - 7,770 -
$ 567,859 3 $ 360,503 2
TOTAL COMPREHENSIVE INCOME
ATTRIBUTABLE TO:
Owners of the Company $ 505,584 3 $ 228,952 1
Non-controlling interests 12,800 - 6,193 -
$ 518,384 3 $ 235,145 1
EARNINGS PER SHARE (Note 23)
Basic $ 1.60 $ 1.03
Diluted $ 1.36 $ 0.89
The accompanying notes are an integral part of the consolidated financial statements. (Concluded)

- 9 -
SINON CORPORATION AND SUBSIDIARIES
CONSOLIDATED STATEMENTS OF CHANGES IN EQUITY
FOR THE YEARS ENDED DECEMBER 31, 2016 AND 2015
(In Thousands of New Taiwan Dollars)
Equity Attributable to Owners of the Company
Other Equity (Notes 4 and 20)
Exchange
Differences on Unrealized Gain
Retained Earnings (Note 20) Translating (Loss) on
Share Capital
(Note 20)
Capital Surplus
(Note 20) Legal Reserve Special Reserve
Unappropriated
Earnings
Foreign
Operations
Available-for-sale
Financial Assets Total
Non-controlling
Interests Total Equity
BALANCE, JANUARY 1, 2015 $ 3,378,944 $ 185,927 $ 490,804 $ 61,013 $ 1,194,166 $ (45,861) $ 6,601 $ 5,271,594 $ 101,352 $ 5,372,946
Appropriation of 2014 earnings
Legal reserve - - 50,650 - (50,650) - - - - -
Cash dividends distributed by the Company - - - - (308,411) - - (308,411) - (308,411)
Reversal of special reserve - - - (21,751) 21,751 - - - - -
Net profit for the year ended December 31, 2015 - - - - 352,733 - - 352,733 7,770 360,503
Other comprehensive loss for the year ended December 31,
2015, net of income tax - - - - (54,259) (67,835) (1,687) (123,781) (1,577) (125,358)
Total comprehensive income (loss) for the year ended
December 31, 2015 - - - - 298,474 (67,835) (1,687) 228,952 6,193 235,145
Convertible bonds converted to ordinary shares 69,088 28,790 - - - - - 97,878 - 97,878
Difference between equity purchase price and carrying amount
in actual acquisition or disposal of subsidiaries - (2,223) - - - - - (2,223) 544 (1,679)
Decrease in non-controlling interest - - - - - - - - (358) (358)
BALANCE AT DECEMBER 31, 2015 3,448,032 212,494 541,454 39,262 1,155,330 (113,696) 4,914 5,287,790 107,731 5,395,521
Appropriation of 2015 earnings
Legal reserve - - 35,274 - (35,274) - - - - -
Special reserve - - - 69,521 (69,521) - - - - -
Cash dividends distributed by the Company - - - - (206,881) - - (206,881) - (206,881)
Net profit for the year ended December 31, 2016 - - - - 554,470 - - 554,470 13,389 567,859
Other comprehensive income (loss) for the year ended
December 31, 2016, net of income tax - - - - 46,219 (99,272) 4,167 (48,886) (589) (49,475)
Total comprehensive income (loss) for the year ended
December 31, 2016 - - - - 600,689 (99,272) 4,167 505,584 12,800 518,384
Convertible bonds converted to ordinary shares 117,136 38,539 - - - - - 155,675 - 155,675
Difference between equity purchase price and carrying amount
in actual acquisition or disposal of subsidiaries - (345) - - - - - (345) 407 62
Decrease in non-controlling interest - - - - - - - - (18,995) (18,995)
BALANCE AT DECEMBER 31, 2016 $ 3,565,168 $ 250,688 $ 576,728 $ 108,783 $ 1,444,343 $ (212,968) $ 9,081 $ 5,741,823 $ 101,943 $ 5,843,766
The accompanying notes are an integral part of the financial statements.

- 10 -
SINON CORPORATION AND SUBSIDIARIES
CONSOLIDATED STATEMENTS OF CASH FLOWS
FOR THE YEARS ENDED DECEMBER 31, 2016 AND 2015
(In Thousands of New Taiwan Dollars)
2016 2015
CASH FLOWS FROM OPERATING ACTIVITIES
Income before income tax $ 722,342 $ 443,183
Adjustments for :
Depreciation expenses 685,812 692,808
Impairment loss recognized on trade receivables 19,866 3,475
Net gain on fair value change of financial assets and liabilities
designated at fair value through profit or loss
(1,955) (296)
Financial costs 115,175 116,191
Interest income (14,294) (13,241)
Dividend income (1,148) (2,010)
Share of profit of associates (2,905) (3,455)
Gain on disposal of property, plant and equipment (117,555) (42,109)
Loss on disposal of investment 700 -
Loss on disposal of associates 32 -
Impairment loss recognized on non-financial assets (20,829) 29,307
Net gain on unrealized foreign currency exchange (1,702) (59,416)
Loss from disasters 98,370 -
Changes in operating assets and liabilities
Notes receivable 9,515 (4,482)
Trade receivables (454,269) 13,417
Other receivables 139,444 (10,266)
Inventories 23,455 26,477
Prepayments (54,149) 125,669
Other current assets 12,098 (12,421)
Notes payable 25,913 (32,453)
Trade payables 398,842 107,770
Other payables 39,722 183,514
Other current liabilities 260,772 (116,057)
Net defined benefit liability (392,900) (51,395)
Cash generated from operations 1,490,352 1,394,210
Interest received 14,294 3,476
Dividends received 3,129 2,010
Interest paid (93,917) (87,894)
Income tax paid (150,337) (136,097)
Net cash generated from operating activities 1,263,521 1,175,705
CASH FLOWS FROM INVESTING ACTIVITIES
Purchase of available-for-sale financial assets - (1,005)
Proceeds from sale of available-for-sale financial assets 3,964 -
Payments for property, plant and equipment (778,312) (1,156,753)
Proceeds from disposal of property, plant and equipment 256,492 128,522
Decrease in refundable deposits 6,575 96,850
Decrease in other non-current assets 5,057 26,390
Increase in prepayments for equipment (117,159) (61,279)
Net cash used in investing activities (623,383) (967,275)
(Continued)

- 11 -
SINON CORPORATION AND SUBSIDIARIES
CONSOLIDATED STATEMENTS OF CASH FLOWS
FOR THE YEARS ENDED DECEMBER 31, 2016 AND 2015
(In Thousands of New Taiwan Dollars)
2016 2015
CASH FLOWS FROM FINANCING ACTIVITIES
Repayment of short-term borrowings $ (63,632) $ (651,156)
Proceeds from (repayment of) short-term bills payable 250,000 (175,000)
Proceeds from long-term borrowings 20,000 3,300,000
Repayments of long-term borrowings (366,393) (2,639,402)
Increase (decrease) in guarantee deposits received 19,840 (2,215)
Increase (decrease) in non-current liabilities 1,803 (59,114)
Dividends paid to owners of the Company (206,881) (308,434)
Acquisition of subsidiaries (16,250) (2,223)
Increase (decrease) in non-controlling interests (3,665) 186
Net cash used in financing activities (365,178) (537,358)
EFFECT OF EXCHANGE RATE CHANGES ON THE BALANCE OF
CASH HELD IN FOREIGN CURRENCIES
(24,399) (73,109)
NET INCREASE (DECREASE) IN CASH AND CASH
EQUIVALENTS
250,561 (402,037)
CASH AND CASH EQUIVALENTS AT THE BEGINNING OF THE
YEAR
1,113,769 1,515,806
CASH AND CASH EQUIVALENTS AT THE END OF THE YEAR $ 1,364,330 $ 1,113,769
The accompanying notes are an integral part of the consolidated financial statements. (Concluded)

- 12 -
SINON CORPORATION AND SUBSIDIARIES
NOTES TO CONSOLIDATED FINANCIAL STATEMENTS
FOR THE YEARS ENDED DECEMBER 31, 2016 AND 2015
(In Thousands of New Taiwan Dollars, Unless Stated Otherwise)
1. GENERAL INFORMATION
Sinon Corporation (the “Company”) was incorporated in November 1963. It mainly manufactures and
sells various chemicals and fertilizer.
The Company’s shares have been listed on the Taiwan Stock Exchange (“TWSE”) since December 14,
1989.
Refer to Note 12 for the list of the Company’s subsidiaries. The Company and its subsidiaries are
collectively referred to as “the Group”.
2. APPROVAL OF FINANCIAL STATEMENTS
The consolidated financial statements were approved by the Company’s board of directors on March 24,
2017.
3. APPLICATION OF NEW, AMENDED AND REVISED STANDARDS AND INTERPRETATIONS
a. Amendments to the Regulations Governing the Preparation of Financial Reports by Securities Issuers
and the International Financial Reporting Standards (IFRS), International Accounting Standards (IAS),
Interpretations of IFRS (IFRIC), and Interpretations of IAS (SIC) endorsed by the Financial
Supervisory Commission (FSC) for application starting from 2017.
Rule No. 1050050021 and Rule No. 1050026834 issued by the FSC stipulated that starting January 1,
2017, the Group should apply the amendments to the Regulations Governing the Preparation of
Financial Reports by Securities Issuers and the IFRS, IAS, IFRIC and SIC (collectively, the “IFRSs”)
issued by the IASB and endorsed by the FSC for application starting from 2017.
New, Amended or Revised Standards and Interpretations
(the “New IFRSs”)
Effective Date
Announced by IASB (Note 1)
Annual Improvements to IFRSs 2010-2012 Cycle July 1, 2014 (Note 2)
Annual Improvements to IFRSs 2011-2013 Cycle July 1, 2014
Annual Improvements to IFRSs 2012-2014 Cycle January 1, 2016 (Note 3)
Amendments to IFRS 10, IFRS 12 and IAS 28 “Investment Entities:
Applying the Consolidation Exception”
January 1, 2016
Amendment to IFRS 11 “Accounting for Acquisitions of Interests in
Joint Operations”
January 1, 2016
IFRS 14 “Regulatory Deferral Accounts” January 1, 2016
Amendment to IAS 1 “Disclosure Initiative” January 1, 2016
Amendments to IAS 16 and IAS 38 “Clarification of Acceptable
Methods of Depreciation and Amortization”
January 1, 2016
Amendments to IAS 16 and IAS 41 “Agriculture: Bearer Plants” January 1, 2016
Amendment to IAS 19 “Defined Benefit Plans: Employee
Contributions”
July 1, 2014
(Continued)

- 13 -
New, Amended or Revised Standards and Interpretations
(the “New IFRSs”)
Effective Date
Announced by IASB (Note 1)
Amendment to IAS 27 “Equity Method in Separate Financial
Statements”
January 1, 2016
Amendment to IAS 36 “Impairment of Assets: Recoverable Amount
Disclosures for Non-financial Assets”
January 1, 2014
Amendment to IAS 39 “Novation of Derivatives and Continuation of
Hedge Accounting”
January 1, 2014
IFRIC 21 “Levies” January 1, 2014
(Concluded)
Note 1: Unless stated otherwise, the above New IFRSs are effective for annual periods beginning on
or after their respective effective dates.
Note 2: The amendment to IFRS 2 applies to share-based payment transactions with grant date on or
after July 1, 2014; the amendment to IFRS 3 applies to business combinations with acquisition
date on or after July 1, 2014; the amendment to IFRS 13 is effective immediately; the
remaining amendments are effective for annual periods beginning on or after July 1, 2014.
Note 3: The amendment to IFRS 5 is applied prospectively to changes in a method of disposal that
occur in annual periods beginning on or after January 1, 2016; the remaining amendments are
effective for annual periods beginning on or after January 1, 2016.
The initial application in 2017 of the above IFRSs and related amendments to the Regulations
Governing the Preparation of Financial Reports by Securities Issuers would not have any material
impact on the Group’s accounting policies.
As of the date the consolidated financial statements were authorized for issue, the Group continues
assessing other possible impacts that application of the aforementioned amendments and the related
amendments to the Regulations Governing the Preparation of Financial Reports by Securities Issuers
will have on the Group’s financial position and financial performance, and will disclose these other
impacts when the assessment is completed.
b. New IFRSs in issue but not yet endorsed by the FSC
The Group has not applied the following IFRSs issued by the IASB but not yet endorsed by the FSC.
The FSC announced that IFRS 9 and IFRS 15 will take effect starting January 1, 2018. As of the date
the consolidated financial statements were authorized for issue, the FSC has not announced the effective
dates of other new IFRSs.
New IFRSs
Effective Date
Announced by IASB (Note 1)
Annual Improvements to IFRSs 2014-2016 Cycle Note 2
Amendment to IFRS 2 “Classification and Measurement of
Share-based Payment Transactions”
January 1, 2018
Amendments to IFRS 4“Applying IFRS 9 Financial Instruments with
IFRS 4 Insurance Contracts”
January 1, 2018
IFRS 9 “Financial Instruments” January 1, 2018
Amendments to IFRS 9 and IFRS 7 “Mandatory Effective Date of
IFRS 9 and Transition Disclosures”
January 1, 2018
(Continued)

- 14 -
New IFRSs
Effective Date
Announced by IASB (Note 1)
Amendments to IFRS 10 and IAS 28 “Sale or Contribution of Assets
between an Investor and its Associate or Joint Venture”
To be determined by IASB
IFRS 15 “Revenue from Contracts with Customers” January 1, 2018
Amendments to IFRS 15 “Clarifications to IFRS15 Revenue from
Contracts with Customers”
January 1, 2018
IFRS 16 “Leases” January 1, 2019
Amendment to IAS 7 “Disclosure Initiative” January 1, 2017
Amendments to IAS 12 “Recognition of Deferred Tax Assets for
Unrealized Losses”
January 1, 2017
Amendments to IAS 40 “Transfers of Investment Property” January 1, 2018
IFRIC 22 “Foreign Currency Transactions and Advance
Consideration”
January 1, 2018
(Concluded)
Note 1: Unless stated otherwise, the above New IFRSs are effective for annual periods beginning on
or after their respective effective dates.
Note 2: The amendment to IFRS 12 is retrospectively applied for annual periods beginning on or after
January 1, 2017; the amendment to IAS 28 is retrospectively applied for annual periods
beginning on or after January 1, 2018.
1) IFRS 9 “Financial Instruments”
Recognition and measurement of financial assets
With regards to financial assets, all recognized financial assets that are within the scope of IAS 39
“Financial Instruments: Recognition and Measurement” are subsequently measured at amortized
cost or fair value. Under IFRS 9, the requirement for the classification of financial assets is stated
below.
For the Group’s debt instruments that have contractual cash flows that are solely payments of
principal and interest on the principal amount outstanding, their classification and measurement are
as follows:
a) For debt instruments, if they are held within a business model whose objective is to collect the
contractual cash flows, the financial assets are measured at amortized cost and are assessed for
impairment continuously with impairment loss recognized in profit or loss, if any. Interest
revenue is recognized in profit or loss by using the effective interest method;
b) For debt instruments, if they are held within a business model whose objective is achieved by
both the collecting of contractual cash flows and the selling of financial assets, the financial
assets are measured at fair value through other comprehensive income (FVTOCI) and are
assessed for impairment. Interest revenue is recognized in profit or loss by using the effective
interest method, and other gain or loss shall be recognized in other comprehensive income,
except for impairment gains or losses and foreign exchange gains and losses. When the debt
instruments are derecognized or reclassified, the cumulative gain or loss previously recognized
in other comprehensive income is reclassified from equity to profit or loss.

- 15 -
Except for the above, all other financial assets are measured at fair value through profit or loss.
However, the Group may make an irrevocable election to present subsequent changes in the fair
value of an equity investment (that is not held for trading) in other comprehensive income, with
only dividend income generally recognized in profit or loss. No subsequent impairment
assessment is required, and the cumulative gain or loss previously recognized in other
comprehensive income cannot be reclassified from equity to profit or loss.
Impairment of financial assets
IFRS 9 requires impairment loss on financial assets to be recognized by using the “Expected Credit
Losses Model”. The credit loss allowance is required for financial assets measured at amortized
cost, financial assets mandatorily measured at FVTOCI, lease receivables, contract assets arising
from IFRS 15 “Revenue from Contracts with Customers”, certain written loan commitments and
financial guarantee contracts. A loss allowance for the 12-month expected credit losses is required
for a financial asset if its credit risk has not increased significantly since initial recognition. A loss
allowance for full lifetime expected credit losses is required for a financial asset if its credit risk has
increased significantly since initial recognition and is not low. However, a loss allowance for full
lifetime expected credit losses is required for trade receivables that do not constitute a financing
transaction.
For purchased or originated credit-impaired financial assets, the Group takes into account the
expected credit losses on initial recognition in calculating the credit-adjusted effective interest rate.
Subsequently, any changes in expected losses are recognized as a loss allowance with a
corresponding gain or loss recognized in profit or loss.
Transition
Financial instruments that have been derecognized prior to the effective date of IFRS 9 cannot be
reversed to apply IFRS 9 when it becomes effective. Under IFRS 9, the requirements for
classification, measurement and impairment of financial assets are applied retrospectively with the
difference between the previous carrying amount and the carrying amount at the date of initial
application recognized in the current period and restatement of prior periods is not required. The
requirements for general hedge accounting shall be applied prospectively and the accounting for
hedging options shall be applied retrospectively.
2) IFRS 16 “Leases”
IFRS 16 sets out the accounting standards for leases that will supersede IAS 17 and a number of
related interpretations.
Under IFRS 16, if the Group is a lessee, it shall recognize right-of-use assets and lease liabilities for
all leases on the consolidated balance sheets except for low-value and short-term leases. The
Group may elect to apply the accounting method similar to the accounting for operating lease under
IAS 17 to the low-value and short-term leases. On the consolidated statements of comprehensive
income, the Group should present the depreciation expense charged on the right-of-use asset
separately from interest expense accrued on the lease liability; interest is computed by using
effective interest method. On the consolidated statements of cash flows, cash payments for the
principal portion of the lease liability are classified within financing activities; cash payments for
interest portion are classified within operating activities.
The application of IFRS 16 is not expected to have a material impact on the accounting of the
Group as lessor.
When IFRS 16 becomes effective, the Group may elect to apply this Standard either retrospectively
to each prior reporting period presented or retrospectively with the cumulative effect of the initial
application of this Standard recognized at the date of initial application.

- 16 -
Except for the above impact, as of the date the consolidated financial statements were authorized for
issue, the Group is continuously assessing the possible impact that the application of other standards
and interpretations will have on the Group’s financial position and financial performance, and will
disclose the relevant impact when the assessment is completed.
4. SUMMARY OF SIGNIFICANT ACCOUNTING POLICIES
a. Statement of compliance
The consolidated financial statements have been prepared in accordance with the Regulations
Governing the Preparation of Financial Reports by Securities Issuers and IFRSs as endorsed and issued
into effect by the FSC.
b. Basis of preparation
The consolidated financial statements have been prepared on the historical cost basis except for
financial instruments which are measured at fair value.
The fair value measurements, which are grouped into Levels 1 to 3 based on the degree to which the
fair value measurement inputs are observable and based on the significance of the inputs to the fair
value measurement in its entirety, are described as follows:
1) Level 1 inputs are quoted prices (unadjusted) in active markets for identical assets or liabilities;
2) Level 2 inputs are inputs other than quoted prices included within Level 1 that are observable for
the asset or liability, either directly (i.e. as prices) or indirectly (i.e. derived from prices); and
3) Level 3 inputs are unobservable inputs for the asset or liability.
c. Classification of current and non-current assets and liabilities
Current assets include:
1) Assets held primarily for the purpose of trading;
2) Assets expected to be realized within 12 months after the reporting period; and
3) Cash and cash equivalents unless the asset is restricted from being exchanged or used to settle a
liability for at least 12 months after the reporting period.
Current liabilities include:
1) Liabilities held primarily for the purpose of trading;
2) Liabilities due to be settled within 12 months after the reporting period, even if an agreement to
refinance, or to reschedule payments, on a long-term basis is completed after the reporting period
and before the consolidated financial statements are authorized for issue; and
3) Liabilities for which the Group does not have an unconditional right to defer settlement for at least
12 months after the reporting period. Terms of a liability that could, at the option of the
counterparty, result in its settlement by the issue of equity instruments do not affect its
classification.

- 17 -
Assets and liabilities that are not classified as current are classified as non-current.
The Group engages in the construction business, which has an operating cycle of over 1 year. The
normal operating cycle applies when considering the classification of the Group’s construction-related
assets and liabilities.
d. Basis of consolidation
The consolidated financial statements incorporate the financial statements of the Company and the
entities controlled by the Company (i.e. its subsidiaries).
When necessary, adjustments are made to the financial statements of subsidiaries to bring their
accounting policies into line with those used by the Company.
All intra-group transactions, balances, income and expenses are eliminated in full upon consolidation.
Total comprehensive income of subsidiaries is attributed to the owners of the Company and to the
non-controlling interests even if this results in the non-controlling interests having a deficit balance.
Changes in the Group’s ownership interests in subsidiaries that do not result in the Group losing control
over the subsidiaries are accounted for as equity transactions. The carrying amounts of the Group’s
interests and the non-controlling interests are adjusted to reflect the changes in their relative interests in
the subsidiaries. Any difference between the amount by which the non-controlling interests are
adjusted and the fair value of the consideration paid or received is recognized directly in equity and
attributed to the owners of the Company.
When the Group loses control of a subsidiary, a gain or loss is recognized in profit or loss and is
calculated as the difference between (i) the aggregate of the fair value of the consideration received and
any investment retained in the former subsidiary at its fair value at the date when control is lost and (ii)
the assets (including any goodwill) and liabilities and any non-controlling interests of the former
subsidiary at their carrying amounts at the date when control is lost. The Group accounts for all
amounts recognized in other comprehensive income in relation to that subsidiary on the same basis as
would be required if the Group had directly disposed of the related assets or liabilities.
See Note 12, Table 7 and Table 8 for the detailed information of subsidiaries (including the percentage
of ownership and main business).
e. Foreign currencies
In preparing the financial statements of each individual group entity, transactions in currencies other
than the entity’s functional currency (foreign currencies) are recognized at the rates of exchange
prevailing at the dates of the transactions.
At the end of each reporting period, monetary items denominated in foreign currencies are retranslated
at the rates prevailing at that date. Exchange differences on monetary items arising from settlement or
translation are recognized in profit or loss in the period in which they arise.
Non-monetary items measured at fair value that are denominated in foreign currencies are retranslated
at the rates prevailing at the date when the fair value was determined. Exchange differences arising
from the retranslation of non-monetary items are included in profit or loss for the period except for
exchange differences arising from the retranslation of non-monetary items in respect of which gains and
losses are recognized directly in other comprehensive income, in which cases, the exchange differences
are also recognized directly in other comprehensive income.
Non-monetary items that are measured at historical cost in a foreign currency are not retranslated.

- 18 -
For the purpose of presenting consolidated financial statements, the functional currencies of the
Company and the Group entities (including subsidiaries, associates in other countries that use currency
different from the currency of the Company) are translated into the presentation currency - New Taiwan
dollars as follows: Assets and liabilities are translated at the exchange rates prevailing at the end of
the reporting period; income and expense items are translated at the average exchange rates for the
period. The resulting currency translation differences are recognized in other comprehensive income
(attributed to the owners of the Company and non-controlling interests as appropriate).
On the disposal of a foreign operation (i.e. a disposal of the Company’s entire interest in a foreign
operation, or a disposal involving loss of control over a subsidiary that includes a foreign operation, or a
partial disposal of an interest in an associate that includes a foreign operation of which the retained
interest becomes a financial asset), all of the exchange differences accumulated in equity in respect of
that operation attributable to the owners of the Company are reclassified to profit or loss.
In relation to a partial disposal of a subsidiary that does not result in the Company losing control over
the subsidiary, the proportionate share of accumulated exchange differences is re-attributed to the
non-controlling interests of the subsidiary and is not recognized in profit or loss. For all other partial
disposals, the proportionate share of the accumulated exchange differences recognized in other
comprehensive income is reclassified to profit or loss.
f. Inventories
Inventories consist of raw materials, supplies, finished goods, work-in-process and for development real
estate and are stated at the lower of cost or net realizable value. Inventory write-downs are made by
item, except where it may be appropriate to group similar or related items. Net realizable value is the
estimated selling price of inventories less all estimated costs of completion and costs necessary to make
the sale. Inventories are recorded at weighted-average cost on the balance sheet date. Contract costs
are recognized when the conditions for the recognition of contract revenue have been satisfied.
g. Investment in associates
An associate is an entity over which the Group has significant influence and that is neither a subsidiary
nor an interest in a joint venture.
The Group uses the equity method to account for its investments in associates.
Under the equity method, investments in an associate are initially recognized at cost and adjusted
thereafter to recognize the Group’s share of the profit or loss and other comprehensive income of the
associates. The Group also recognizes the changes in the Group’s share of the equity of associates.
When the Group subscribes for additional new shares of the associate at a percentage different from its
existing ownership percentage, the resulting carrying amount of the investment differs from the amount
of the Group’s proportionate interest in the associate. The Group records such a difference as an
adjustment to investments with the corresponding amount charged or credited to capital surplus -
changes in the Group’s shares of equity of associates. If the Group’s ownership interest is reduced due
to the additional subscription of the new shares of the associate, the proportionate amount of the gains
or losses previously recognized in other comprehensive income in relation to that associate is
reclassified to profit or loss on the same basis as would be required if the investee had directly disposed
of the related assets or liabilities. When the adjustment should be debited to capital surplus, but the
capital surplus recognized from investments accounted for by the equity method is insufficient, the
shortage is debited to retained earnings.
The entire carrying amount of the investment is tested for impairment as a single asset by comparing its
recoverable amount with its carrying amount. Any impairment loss recognized forms part of the
carrying amount of the investment. Any reversal of that impairment loss is recognized to the extent
that the recoverable amount of the investment subsequently increases.

- 19 -
When a Group entity transacts with its associate, profits and losses resulting from the transactions with
the associate are recognized in the Group’ consolidated financial statements only to the extent that
interests in the associate are not related to the Group.
h. Property, plant and equipment
Property, plant and equipment are stated at cost, less accumulated depreciation and accumulated
impairment loss.
Property, plant and equipment in the course of construction are carried at cost, less any recognized
impairment loss. Cost includes professional fees and borrowing costs eligible for capitalization.
Such assets are depreciated and classified to the appropriate categories of property, plant and equipment
when completed and ready for intended use.
Depreciation on property, plant and equipment is recognized using the straight-line method. Each
significant part is depreciated separately. If the lease term is shorter than the useful lives, assets are
depreciated over the lease term. The estimated useful lives, residual values and depreciation method
are reviewed at the end of each reporting period, with the effect of any changes in estimate accounted
for on a prospective basis.
On derecognition of an item of property, plant and equipment, the difference between the sales proceeds
and the carrying amount of the asset is recognized in profit or loss.
i. Impairment of tangible asset
At the end of each reporting period, the Group reviews the carrying amounts of its tangible assets, to
determine whether there is any indication that those assets have suffered an impairment loss. If any
such indication exists, the recoverable amount of the asset is estimated in order to determine the extent
of the impairment loss. When it is not possible to estimate the recoverable amount of an individual
asset, the Company estimates the recoverable amount of the cash-generating unit to which the asset
belongs. Corporate assets are allocated to the individual cash-generating units on a reasonable and
consistent basis of allocation.
Recoverable amount is the higher of fair value less costs to sell and value in use. If the recoverable
amount of an asset or cash-generating unit is estimated to be less than its carrying amount, the carrying
amount of the asset or cash-generating unit is reduced to its recoverable amount, with the resulting
impairment loss recognized in profit or loss.
When an impairment loss is subsequently reversed, the carrying amount of the asset or cash-generating
unit is increased to the revised estimate of its recoverable amount, but only to the extent of the carrying
amount that would have been determined had no impairment loss been recognized for the asset or
cash-generating unit in prior years. A reversal of an impairment loss is recognized in profit or loss.
j. Financial instruments
Financial assets and financial liabilities are recognized when a group entity becomes a party to the
contractual provisions of the instruments.
Financial assets and financial liabilities are initially measured at fair value. Transaction costs that are
directly attributable to the acquisition or issue of financial assets and financial liabilities (other than
financial assets and financial liabilities at fair value through profit or loss) are added to or deducted
from the fair value of the financial assets or financial liabilities, as appropriate, on initial recognition.
Transaction costs directly attributable to the acquisition of financial assets or financial liabilities at fair
value through profit or loss are recognized immediately in profit or loss.

- 20 -
Financial assets
All regular way purchases or sales of financial assets are recognized and derecognized on a trade date
basis.
a. Measurement category
Financial assets are classified into the following categories: Available-for-sale financial assets and
loans and receivables.
1) Available-for-sale financial assets
Available-for-sale financial assets are non-derivatives that are either designated as
available-for-sale or are not classified as loans and receivables, held-to-maturity investments or
financial assets at fair value through profit or loss.
Available-for-sale financial assets are measured at fair value. Changes in the carrying amount
of available-for-sale monetary financial assets relating to changes in foreign currency exchange
rates, interest income calculated using the effective interest method and dividends on
available-for-sale equity investments are recognized in profit or loss. Other changes in the
carrying amount of available-for-sale financial assets are recognized in other comprehensive
income and will be reclassified to profit or loss when the investment is disposed of or is
determined to be impaired.
Dividends on available-for-sale equity instruments are recognized in profit or loss when the
Group’s right to receive the dividends is established.
Available-for-sale equity investments that do not have a quoted market price in an active market
and whose fair value cannot be reliably measured and derivatives that are linked to and must be
settled by delivery of such unquoted equity investments are measured at cost less any identified
impairment loss at the end of each reporting period and are presented in a separate line item as
financial assets carried at cost. If, in a subsequent period, the fair value of the financial assets
can be reliably measured, the financial assets are remeasured at fair value. The difference
between carrying amount and fair value is recognized in profit or loss or other comprehensive
income on financial assets. Any impairment losses are recognized in profit and loss.
2) Loans and receivables
Loans and receivables (including cash and cash equivalents, notes receivable, trade receivables,
and other receivables) are measured at amortized cost using the effective interest method, less
any impairment, except for short-term receivables when the effect of discounting is immaterial.
Cash equivalents include time deposits with original maturities within 3 months from the date of
acquisition, which are highly liquid, readily convertible to a known amount of cash and are
subject to an insignificant risk of changes in value. These cash equivalents are held for the
purpose of meeting short-term cash commitments.
b. Impairment of financial assets
Financial assets, other than those at fair value through profit or loss, are assessed for indicators of
impairment at the end of each reporting period. Financial assets are considered to be impaired
when there is objective evidence that, as a result of one or more events that occurred after the initial
recognition of the financial asset, the estimated future cash flows of the investment have been
affected.

- 21 -
For financial assets carried at amortized cost, such as note receivables, trade receivables and other
receivables, such assets are assessed for impairment on a collective basis even if they were assessed
not to be impaired individually. Objective evidence of impairment for a portfolio of receivables
could include the Group’s past experience of collecting payments, an increase in the number of
delayed payments in the portfolio past the average credit period, as well as observable changes in
national or local economic conditions that correlate with default on receivables.
For financial assets carried at amortized cost, the amount of the impairment loss recognized is the
difference between the asset’s carrying amount and the present value of estimated future cash flows,
discounted at the financial asset’s original effective interest rate.
For financial assets measured at amortized cost, if, in a subsequent period, the amount of the
impairment loss decreases and the decrease can be related objectively to an event occurring after the
impairment was recognized, the previously recognized impairment loss is reversed through profit or
loss to the extent that the carrying amount of the investment at the date the impairment is reversed
does not exceed what the amortized cost would have been had the impairment not been recognized.
For available-for-sale equity investments, a significant or prolonged decline in the fair value of the
security below its cost is considered to be objective evidence of impairment.
For all other financial assets, objective evidence of impairment could include significant financial
difficulty of the issuer or counterparty, breach of contract, such as a default or delinquency in
interest or principal payments, it is becoming probable that the borrower will enter bankruptcy or
financial re-organization, or the disappearance of an active market for that financial asset because of
financial difficulties.
When an available-for-sale financial asset is considered to be impaired, cumulative gains or losses
previously recognized in other comprehensive income are reclassified to profit or loss in the period.
In respect of available-for-sale equity securities, impairment loss previously recognized in profit or
loss are not reversed through profit or loss. Any increase in fair value subsequent to an
impairment loss is recognized in other comprehensive income.
For financial assets that are carried at cost, the amount of the impairment loss is measured as the
difference between the asset’s carrying amount and the present value of the estimated future cash
flows discounted at the current market rate of return for a similar financial asset. Such impairment
loss will not be reversed in subsequent periods.
The carrying amount of the financial asset is reduced by the impairment loss directly for all
financial assets with the exception of trade receivables and other receivables, where the carrying
amount is reduced through the use of an allowance account. When trade receivables and other
receivables are considered uncollectible, they are written off against the allowance account.
Subsequent recoveries of amounts previously written off are credited against the allowance account.
Changes in the carrying amount of the allowance account are recognized in profit or loss except for
uncollectible trade receivables and other receivables that are written off against the allowance
account.
c. Derecognition of financial assets
The Group derecognizes a financial asset only when the contractual rights to the cash flows from
the asset expire, or when it transfers the financial asset and substantially all the risks and rewards of
ownership of the asset to another party.
On derecognition of a financial asset in its entirety, the difference between the asset’s carrying
amount and the sum of the consideration received and receivable and the cumulative gain or loss
that had been recognized in other comprehensive income is recognized in profit or loss.

- 22 -
Financial liabilities
a. Subsequent measurement
The financial liabilities are measured at amortized cost using the effective interest method.
b. Derecognition of financial liabilities
The difference between the carrying amount of the financial liability derecognized and the
consideration paid, including any non-cash assets transferred or liabilities assumed, is recognized in
profit or loss.
Convertible bonds
The component parts of compound instruments (convertible bonds) issued by the Group are classified
separately as financial liabilities and equity in accordance with the substance of the contractual
arrangements and the definitions of a financial liability and an equity instrument.
On initial recognition, the fair value of the liability component is estimated using the prevailing market
interest rate for similar non-convertible instruments. This amount is recorded as a liability on an
amortized cost basis using the effective interest method until extinguished upon conversion or the
instrument’s maturity date. Any embedded derivative liability is measured at fair value.
The conversion option classified as equity is determined by deducting the amount of the liability
component from the fair value of the compound instrument as a whole. This is recognized and
included in equity, net of income tax effects, and is not subsequently remeasured. In addition, the
conversion option classified as equity will remain in equity until the conversion option is exercised, in
which case, the balance recognized in equity will be transferred to capital surplus - share premium.
When the conversion option remains unexercised at maturity, the balance recognized in equity will be
transferred to capital surplus - share premium.
Transaction costs that relate to the issue of the convertible notes are allocated to the liability and equity
components in proportion to the allocation of the gross proceeds. Transaction costs relating to the
equity component are recognized directly in equity. Transaction costs relating to the liability
component are included in the carrying amount of the liability component.
Derivative financial instruments
The Group enters into a variety of derivative financial instruments to manage its exposure to foreign
exchange rate risks, including foreign exchange forward contracts.
Derivatives are initially recognized at fair value at the date the derivative contracts are entered into and
are subsequently remeasured to their fair value at the end of each reporting period. The resulting gain
or loss is recognized in profit or loss immediately. When the fair value of derivative financial
instruments is positive, the derivative is recognized as a financial asset; when the fair value of
derivative financial instruments is negative, the derivative is recognized as a financial liability.
k. Provisions
Provisions are measured at the best estimate of the discounted cash flows of the consideration required
to settle the present obligation at the end of the reporting period, taking into account the risks and
uncertainties surrounding the obligation.

- 23 -
l. Revenue recognition
Revenue is measured at the fair value of the consideration received or receivable. Revenue is reduced
for estimated customer returns, rebates and other similar allowances. Allowances for sales returns and
liabilities for returns are recognized at the time of sale based on the seller’s reliable estimate of future
returns and based on past experience and other relevant factors.
1) Sale of goods
Revenue from the sale of goods is recognized when all the following conditions are satisfied:
a) The Group has transferred to the buyer the significant risks and rewards of ownership of the
goods;
b) The Group retains neither continuing managerial involvement to the degree usually associated
with ownership nor effective control over the goods sold;
c) The amount of revenue can be measured reliably;
d) It is probable that the economic benefits associated with the transaction will flow to the Group;
and
e) The costs incurred or to be incurred in respect of the transaction can be measured reliably.
The Group does not recognize sales revenue on materials delivered to subcontractors because this
delivery does not involve a transfer of risks and rewards of the materials’ ownership.
According to sales contracts, income from properties developed for sale is recognized when
construction is completed, construction has passed qualified inspections, and rewards of ownership
of the properties are transferred to buyers.
2) Dividend and interest income
Dividend income from investments is recognized when a shareholder’s right to receive payment has
been established provided that it is probable that the economic benefits will flow to the Group and
the amount of income can be measured reliably.
Interest income from a financial asset is recognized when it is probable that the economic benefits
will flow to the Group and the amount of income can be measured reliably. Interest income is
accrued on a time basis, by reference to the principal outstanding and at the applicable effective
interest rate.
m. Leasing
Leases are classified as finance leases whenever the terms of the lease transfer substantially all the risks
and rewards of ownership to the lessee. All other leases are classified as operating leases.
1) The Group as lessor
Rental income from operating leases is recognized on a straight-line basis over the term of the
relevant lease when the Group is the lessor.
2) The Group as lessee
Operating lease payments are recognized as an expense on a straight-line basis over the lease term.
Contingent rent is recognized as expenses in the period in which they are incurred.

- 24 -
n. Borrowing costs
Borrowing costs directly attributable to the acquisition, construction or production of qualifying assets
are added to the cost of those assets, until such time as the assets are substantially ready for their
intended use or sale.
Investment income earned on the temporary investment of specific borrowings pending their
expenditure on qualifying assets is deducted from the borrowing costs eligible for capitalization.
Other than stated above, all other borrowing costs are recognized in profit or loss in the period in which
they are incurred.
o. Employee benefits
1) Short-term employee benefits
Liabilities recognized in respect of short-term employee benefits are measured at the undiscounted
amount of the benefits expected to be paid in exchange for the related service.
2) Retirement benefits
Payments to defined contribution retirement benefit plans are recognized as an expense when
employees have rendered service entitling them to the contributions.
Defined benefit costs (including service cost, net interest and remeasurement) under the defined
benefit retirement benefit plans are determined using the projected unit credit method. Service
cost and net interest on the net defined benefit liability (asset) are recognized as employee benefit
expenses in the period they occur. Remeasurement, comprising actuarial gains and losses and the
return on plan assets (excluding interest), is recognized in other comprehensive income in the period
in which it occurs. Remeasurement recognized in other comprehensive income is reflected
immediately in retained earnings and will not be reclassified to profit or loss.
Net defined benefit liability represents the actual deficit in the Group’s defined benefit plan. Any
surplus resulting from this calculation is limited to the present value of any refunds from the plans
or reductions in future contributions to the plans.
3) Other long-term employee benefits
Other long-term employee benefits are accounted for in the same way as the accounting required for
a defined benefit plan except that remeasurement is recognized in profit or loss.
p. Taxation
Income tax expense represents the sum of the tax currently payable and deferred tax.
1) Current tax
According to the Income Tax Law, an additional tax at 10% of unappropriated earnings is provided
for as income tax in the year the shareholders approve to retain the earnings.
Adjustments of prior years’ tax liabilities are added to or deducted from the current year’s tax
provision.

- 25 -
2) Deferred tax
Deferred tax is recognized on temporary differences between the carrying amounts of assets and
liabilities in the consolidated financial statements and the corresponding tax bases used in the
computation of taxable profit. Deferred tax liabilities are generally recognized for all taxable
temporary differences. Deferred tax assets are generally recognized for all deductible temporary
differences and unused loss carry forward to the extent that it is probable that taxable profits will be
available against which those deductible temporary differences can be utilized.
Deferred tax liabilities are recognized for taxable temporary differences associated with investments
in subsidiaries, except where the Group is able to control the reversal of the temporary difference
and it is probable that the temporary difference will not reverse in the foreseeable future. Deferred
tax assets arising from deductible temporary differences associated with such investments and
interests are only recognized to the extent that it is probable that there will be sufficient taxable
profits against which to utilize the benefits of the temporary differences and they are expected to
reverse in the foreseeable future.
The carrying amount of deferred tax assets is reviewed at the end of each reporting period and
reduced to the extent that it is no longer probable that sufficient taxable profits will be available to
allow all or part of the asset to be recovered. A previously unrecognized deferred tax asset is also
reviewed at the end of each reporting period and recognized to the extent that it has become
probable that future taxable profit will allow the deferred tax asset to be recovered.
Deferred tax liabilities and assets are measured at the tax rates that are expected to apply in the
period in which the liabilities are settled or the assets are realized, based on tax rates and tax laws
that have been enacted or substantively enacted by the end of the reporting period. The
measurement of deferred tax liabilities and assets reflects the tax consequences that would follow
from the manner in which the Group expects, at the end of the reporting period, to recover or settle
the carrying amount of its assets and liabilities.
3) Current and deferred tax for the year
Current and deferred tax are recognized in profit or loss, except when they relate to items that are
recognized in other comprehensive income or directly in equity, in which case, the current and
deferred tax are also recognized in other comprehensive income or directly in equity respectively.
Where current tax or deferred tax arises from the initial accounting for the acquisition of a
subsidiary, the tax effect is included in the accounting for the investments in subsidiaries.
q. Construction Business Accounting
The price paid out before acquiring ownership is recorded as prepaid premises. Housing investment is
calculated according to the cost of various projects. Land held for construction site and construction
costs are recorded in Construction in Progress. After completion the project is transferred to Premises
Held for Sale. The receipts from pre-selling premises are recorded in Advance Real Estate Receipts.
Pre-sold housing projects completed and delivered are accounted for at the property settlement.
Buildings and Land Held for Sale and Advance Real Estate Receipts are recognized in profit or loss
whenever the contract transfer to the buyer control and the significant risks and rewards of ownership of
the real estate in its entirely completion, upon or after delivery.
Housing project has reached a settlement state and has the actual date of transfer of ownership of the
premises at the completion and settlement identified profit attributable to the year.

- 26 -
5. CRITICAL ACCOUNTING JUDGMENTS AND KEY SOURCES OF ESTIMATION
UNCERTAINTY
In the application of the Group's accounting policies, management is required to make judgments, estimates
and assumptions about the carrying amounts of assets and liabilities that are not readily apparent from other
sources. The estimates and associated assumptions are based on historical experience and other factors
that are considered relevant. Actual results may differ from these estimates.
The estimates and underlying assumptions are reviewed on an ongoing basis. Revisions to accounting
estimates are recognized in the period in which the estimate is revised if the revision affects only that period
or in the period of the revision and future periods if the revision affects both current and future periods.
Estimated impairment of trade receivables
When there is objective evidence of impairment loss of receivables, the Group takes into consideration the
estimation of future cash flows such receivables. The amount of the impairment loss of such an asset is
measured as the difference between the asset’s carrying amount and the present value of estimated future
cash flows (excluding future credit losses that have not been incurred) discounted at the financial asset’s
original effective interest rate. Where the actual future cash flows are less than expected, a material
impairment loss may arise.
6. CASH AND CASH EQUIVALENTS
December 31 2016 2015
Cash on hand $ 61,212 $ 35,824 Checking accounts and demand deposits 1,211,445 983,058 Cash equivalent
Commercial papers 91,673 94,887 $ 1,364,330 $ 1,113,769
7. AVAILABLE-FOR-SALE FINANCIAL ASSETS
December 31 2016 2015
Domestic investments Mutual funds $ 14,558 $ 13,865 Listed shares and emerging market shares - 2,423 Corporate bonds - 981 $ 14,558 $ 17,269
- 27 -
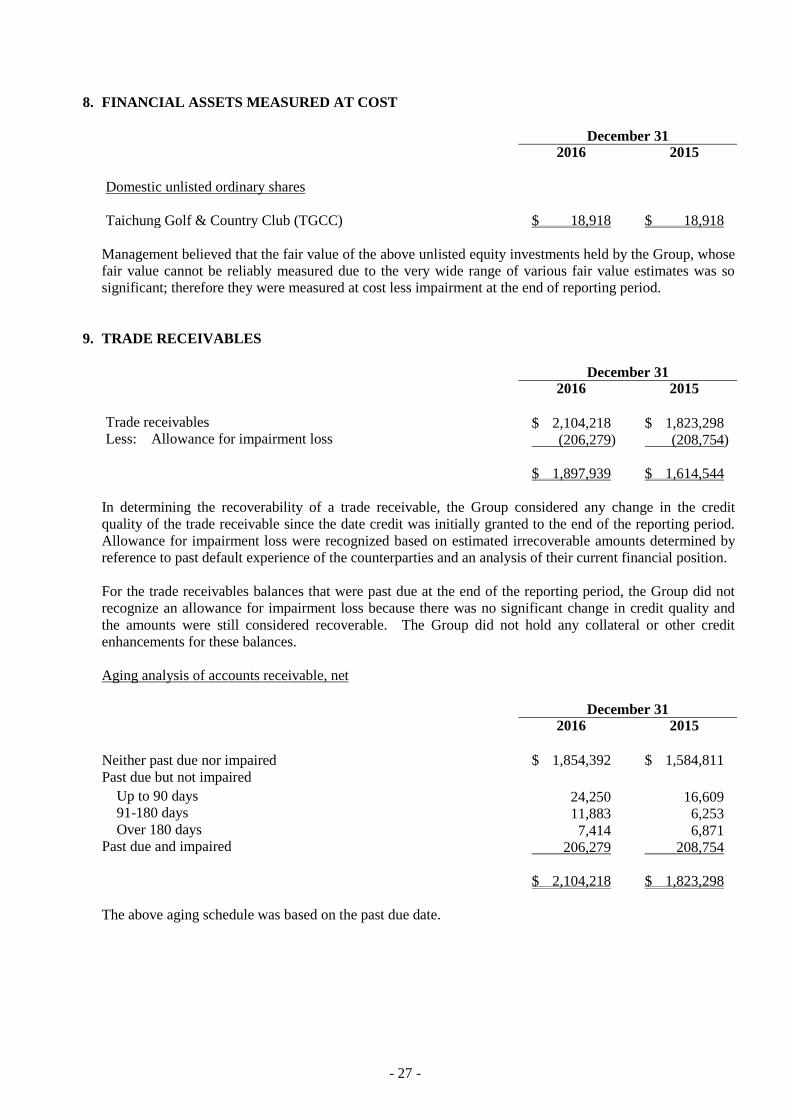
8. FINANCIAL ASSETS MEASURED AT COST
December 31 2016 2015
Domestic unlisted ordinary shares
Taichung Golf & Country Club (TGCC) $ 18,918 $ 18,918
Management believed that the fair value of the above unlisted equity investments held by the Group, whose
fair value cannot be reliably measured due to the very wide range of various fair value estimates was so
significant; therefore they were measured at cost less impairment at the end of reporting period.
9. TRADE RECEIVABLES
December 31 2016 2015
Trade receivables $ 2,104,218 $ 1,823,298 Less: Allowance for impairment loss (206,279) (208,754)
$ 1,897,939 $ 1,614,544
In determining the recoverability of a trade receivable, the Group considered any change in the credit
quality of the trade receivable since the date credit was initially granted to the end of the reporting period.
Allowance for impairment loss were recognized based on estimated irrecoverable amounts determined by
reference to past default experience of the counterparties and an analysis of their current financial position.
For the trade receivables balances that were past due at the end of the reporting period, the Group did not
recognize an allowance for impairment loss because there was no significant change in credit quality and
the amounts were still considered recoverable. The Group did not hold any collateral or other credit
enhancements for these balances.
Aging analysis of accounts receivable, net
December 31 2016 2015
Neither past due nor impaired $ 1,854,392 $ 1,584,811
Past due but not impaired Up to 90 days 24,250 16,609 91-180 days 11,883 6,253 Over 180 days 7,414 6,871
Past due and impaired 206,279 208,754
$ 2,104,218 $ 1,823,298
The above aging schedule was based on the past due date.

- 28 -
Movements of the allowance for doubtful trade receivables
Individually
Assessed for
Impairment
Collectively
Assessed for
Impairment Total
Balance at January 1, 2015 $ 46,000 $ 225,689 $ 271,689
Add: Impairment losses recognized on
receivables (5,064)
8,539
3,475
Foreign exchange translation gains and losses - (66,410) (66,410)
Balance at December 31, 2015 40,936 167,818 208,754
Add: Impairment losses recognized on
receivables (3,797)
23,663
19,866
Less: Amounts written off during the year as
uncollectible -
(172)
(172)
Foreign exchange translation gains and losses - (22,169) (22,169)
Balance at December 31, 2016 $ 37,139 $ 169,140 $ 206,279
10. INVENTORIES - MANUFACTURING
December 31 2016 2015
Finished goods $ 398,418 $ 399,566 Work in progress 364,907 500,439 Raw materials 712,187 764,784 Agricultural produce 1,490,113 1,553,671 Inventory in transit 15,987 8,515 $ 2,981,612 $ 3,226,975
The cost of inventories recognized as cost of goods sold for the years ended December 31, 2016 and 2015
was $11,812,381 thousand and $13,057,664 thousand, respectively.
The cost of inventories recognized as cost of goods sold for the years ended December 31, 2016 and 2015
included reversal of inventory write-downs of $20,829 thousand and inventory write-downs of $29,307
thousand, respectively.
11. INVENTORIES - CONTRUCTION
December 31 2016 2015
Construction in progress $ 1,552 $ 1,552
Land held for construction 317,269 328,728
Construction held for sale 116,837 107,000 $ 435,658 $ 437,280
The land held for construction and construction held for sale provided by the Group as collateral for their
bank loans were set out in Note 28.

- 29 -
12. SUBSIDIARIES
Subsidiaries included in the consolidated financial statements
% of Ownership
Investor Investee
Functional
Currencies
December
31, 2016
December
31, 2015 Remark
Sinon
Corporation
Hsing Wei Corporation (“Hsing Wei”) TWD 100 100
Syntai Chemicals Ltd. (“Syntai
Chemicals”) (Former name: Syntai
Chemicals & Pharmaceuticals, Ltd.)
TWD 100 100
Sinon Do Brazil Ltda. (“Sinon Brazil”) BRL 100 100
Sinon Cayman Corporation
(“Sinon Cayman”)
USD 100 100
Sinon Trading Co., Ltd.
(“Sinon Trading”)
TWD 100 100 1)
Taiwan Fresh Supermarket Co., Ltd.
(“TFS”)
TWD 88 88
Synjia Corporation (“Synjia”) TWD 100 100
Yumei Yen Co., Ltd. (“Yumei, Yen”) TWD 100 100
Sinon (Thailand) Co., Ltd.
(“Sinon Thailand”)
THB 100 100 1), 2)
Sinon Eu GmbH (“Sinon Germany”) EUR 100 100 1)
Sinon USA, Inc. (“Sinon USA”) USD 100 100
Sinon De Mexico S.A. De C.V.
(“Sinon Mexico”)
USD 100 100 1)
Sinon Australia Pty Limited
(“Sinon Australia”)
AUD 100 100
Pt Sinon Indonesia (“Sinon Indonesia”) IDR 100 100 1)
Hsing Wei Dao Xian Construction Co., Ltd.
(“Dao Xiang”)
TWD 88 85
TFS Feng Nien Corporation (“Feng Nien”) TWD 100 100 1)
Feng Nien Weightstone Vineyard Estate & Winery
Co., Ltd. (“Weightstone”)
TWD 100 100
Yumei Yen Taiwan Agriculture and Food Health
Testing Co., Ltd. (“TAFHT”)
(Former name: Yumei Yen Inspection
Technology Co., Ltd.)
TWD - 100 1), 3)
Yumei Loose Leaf Tea Co., Ltd.
(“Yumei Loose Leaf Tea”)
TWD - 60 1)
Sinon Cayman Zhongshan Sinon Daily Products Co.,
Ltd. (“Sinon Zhongshan”)
CNY 70 70
Sinon Hong Kong Co., Ltd.
(“Sinon Hong Kong”)
USD 100 100
Sinon Winchester, Inc.
(“Sinon Winchester”)
USD - 71 1)
Sinon Hong Kong Sinon China CNY 100 100
Sinon Chemical (Nantong) Co., Ltd.
(“Sinon Nantong”)
CNY 100 100
Sinon China Sinon Zhongshan CNY 30 30
Zhongshan Sinon Agriculture Counseling
Servings Co., Ltd. (“Sinon Zhongshan
Servings”)
CNY 100 100
Poise Packing Co., LTD. (“Poise
Packing”) (Former name: Shanghai Yu
Ting Plastic Products Co., Ltd.)
CNY 100 100
(Continued)

- 30 -
% of Ownership
Investor Investee
Functional
Currencies
December
31, 2016
December
31, 2015 Remark
Poise Packing Shanghai Fun-Cha Trading Co., Ltd.
(“Fun-Cha Trading”)
CNY - 100
Synjia Synjia Cayman Corporation
(“Synjia Cayman”)
USD 100 100
Synjia Cayman Synjia Hong Kong Corporation Limited
(“Synjia Hong Kong”)
USD 100 100
Synjia Hong
Kong
Zhongshan Synjia Daily Products Co.,
Ltd. (“Synjia Zhongshan”)
CNY 100 100
(Concluded)
1) Such investee is a major subsidiary, and its financial statements have not been audited. The
management believes that an audit of the financial statements of the subsidiary would not result in a
significant impact on the Group’s consolidated financial statements.
2) Due to certain restrictions to foreign investors in Thailand, 51% of the shares of Sinon Thailand are
held by the local investors. However, the Company has effective control over Sinon Thailand.
3) In January 2016, Yumei Yei didn’t subscribe for additional new shares of TAFHT, which reduced it’s
continuing ownership interest down to 30%. The investment was thusly accounted for as an associate
which is excluded from the consolidated financial statements.
13. INVESTMENTS ACCOUNTED FOR USING EQUITY METHOD
December 31
2016 2015
Amount % Amount %
Unlisted companies
K&S $ 33,581 49 $ 28,204 49 TAFHT 353 30 - - $ 33,934 $ 28,204
See Table 7 for the nature of activities, principal place of business and country of incorporation of the
associates.
The summarized financial information in respect of the Group’s associates is set out below:
December 31 2016 2015
Total assets $ 121,346 $ 121,958 Total liabilities $ 51,351 $ 64,160
For the Year Ended December 31
2016 2015
Revenue $ 124,678 $ 101,806 Profit for the year $ 6,279 $ 6,981 Other comprehensive income $ 9,013 $ (8,058)

- 31 -
Except for TAFHT, investments accounted for by the equity method and the share of profit or loss and
other comprehensive income of those investments were calculated based on financial statements that have
been audited. Management believes there would be no material impact on the equity method accounting
or the calculation of the share of profit or loss and other comprehensive income based on the financial
statements of TAFHT, which have not been audited.
14. PROPERTY, PLANT AND EQUIPMENT
Year Ended December 31, 2016
Beginning
Balance Additions Reclassified Disposals
Exchange
Differences
Ending
Balance
Cost
Land $ 3,279,568 $ 43,074 $ 7,098 $ (45,221 ) $ - $ 3,284,519 Buildings 1,627,631 9,218 27,449 (153,188 ) (28,733 ) 1,482,377
Machinery and equipment 2,874,896 114,281 97,681 (347,237 ) (22,298 ) 2,717,323
Transportation equipment 137,795 5,598 642 (17,259 ) (2,128 ) 124,648 Leasehold improvements 840,508 31,266 52,838 (1,959 ) - 922,653
Other equipment 3,055,501 220,675 130,591 (333,143 ) (19,968 ) 3,053,656
Construction in progress 566,051 361,907 (191,243 ) - (32,202 ) 704,513 12,381,950 $ 786,019 $ 125,056 $ (898,007 ) $ (105,329 ) 12,289,689
Accumulated depreciation
Buildings 513,045 $ 53,527 $ 6,769 $ (61,983 ) $ (5,487 ) 505,871
Machinery and equipment 1,582,164 242,387 5,884 (189,464 ) (8,382 ) 1,632,589 Transportation equipment 95,243 9,742 635 (13,346 ) (1,530 ) 90,744
Leasehold improvements 640,222 24,965 - - - 665,187
Other equipment 1,841,844 355,191 (5,581 ) (285,212 ) (9,757 ) 1,896,485
4,672,518 $ 685,812 $ 7,707 $ (550,005 ) $ (25,156 ) 4,790,876
$ 7,709,432 $ 7,498,813
Year Ended December 31, 2015
Beginning
Balance Additions Reclassified Disposals
Exchange
Differences
Ending
Balance
Cost
Land $ 3,314,950 $ 7,911 $ 1,463 $ (44,756 ) $ - $ 3,279,568 Buildings 1,543,818 77,393 49,647 (42,551 ) (676 ) 1,627,631
Machinery and equipment 2,742,328 88,023 169,085 (123,710 ) (830 ) 2,874,896
Transportation equipment 137,300 15,107 191 (14,094 ) (709 ) 137,795 Leasehold improvements 792,048 48,475 (15 ) - - 840,508
Other equipment 2,865,923 193,873 189,642 (193,433 ) (504 ) 3,055,501
Construction in progress 209,123 725,971 (369,445 ) - 402 566,051 11,605,490 $ 1,156,753 $ 40,568 $ (418,544 ) $ (2,317 ) 12,381,950
Accumulated depreciation
Buildings 477,194 $ 58,493 $ - $ (22,510 ) $ (132 ) 513,045
Machinery and equipment 1,449,422 245,817 - (112,804 ) (271 ) 1,582,164 Transportation equipment 91,655 12,709 - (8,725 ) (396 ) 95,243
Leasehold improvements 618,653 21,569 - - - 640,222
Other equipment 1,678,211 354,220 - (190,194 ) (393 ) 1,841,844 4,315,135 $ 692,808 $ - $ (334,233 ) $ (1,192 ) 4,672,518
$ 7,290,355 $ 7,709,432
The above items of property, plant and equipment were depreciated on a straight-line basis over the
estimated useful lives as follows:
Buildings
Main buildings 4-61 years
Machinery and equipment 3-21 years
Transportation equipment 2-16 years
Leasehold improvements 2-30 years
Other equipment 2-25 years

- 32 -
Refer to Note 28 for the carrying amount of property, plant and equipment pledged by the Group to secure
borrowings/general banking facilities granted to the Group.
In order to develop quality agriculture, the Group acquired the agricultural land at the price of $78,305
thousand in Nantou County and Taichung City. The land is restricted to agricultural use and registered in
the name of others. However, the Group retains control over the land.
15. NON-CURRENT ASSETS - OTHER
December 31 2016 2015
Land $ 233,763 $ 237,358 Prepaid lease payments 101,530 113,455 Long-term receivables 44,764 37,659 Other 3,358 - $ 383,415 $ 388,472
Land is restricted to agricultural use and registered in the name of others. However, the Group retains
control over the land. Land used as roads were also reclassified as other assets.
Prepaid lease payments include land use right, income transfer right, rent out and mortgage right, which are
located in Mainland China. All of the acquired lots are used to build factories and office building. The
period of land use rights is 50 years. The rights were acquired by Sinon China in 2001 and Sinon Nanton
in 2013. Before the end of the lease period, the Group could renew the contract except if the rules are
violated or the land is taken back in advance for public good.
16. BORROWINGS
a. Short-term borrowings
December 31 2016 2015
Foreign currency loans $ 395,212 $ 374,929 Secured borrowings 438,229 215,894 Unsecured borrowings 766,410 1,016,785 $ 1,599,851 $ 1,607,608
Interest (%) Foreign currency loans 1.19-2.57 1.16-1.82 Secured borrowings 1.17-5.22 1.29-5.41 Unsecured borrowings 0.72-5.00 0.88-6.06
b. Short-term bills payable
Short-term bills payable were commercial paper due within one year. These instruments were issued
with an annual interest rate of 1.088% - 1.238% in 2016 and 1.238% in 2015.

- 33 -
c. Long-term borrowings
December 31 2016 2015
Secured borrowings $ 2,415,823 $ 2,797,500 Unsecured borrowings 683,778 699,174 3,099,601 3,496,674 Less: Current portion (221,663) (455,635) Long-term borrowings $ 2,877,938 $ 3,041,039 Interest rate (%) Secured borrowings 1.65-1.80 1.78-1.85 Unsecured borrowings 1.36-1.65 1.52-1.59
In June 2015, for repayment of borrowings from financial institutions, working capital needs and for
redemption of convertible bonds issued in 2013 as well as for repayment of the previous NT$3.4 billion
syndicated loan, the Company and Sinon Cayman entered into a NT$5.0 billion syndicated loan
agreement with Mega International Commercial Bank and other 11 banks. The loan period is 5 years,
which may vary depending on the loan type, starting from the first loan drawdown date.
Under the loan agreement, the Company commits to meet the following ratios base on the annual and
semiannual consolidated financial statements: current ratio no lower than 100%, financial debt ratio
no higher than 130%, interest coverage at least 600% and shareholders’ equity no less than $4 billion.
17. CONVERTIABLE BONDS PAYABLE
December 31 2016 2015
Domestic unsecured convertible bonds $ 836,610 $ 970,947
Less: Current portion - (970,947) $ 836,610 $ -
As of August 15, 2013, the Company issued 12 thousand 0% NT dollar-denominated unsecured convertible
bonds in Taiwan, with an aggregate principal amount of $1,200,000 thousand.
Each bond entitles the holder to convert into ordinary shares of the Company at a conversion price of $16.
Conversion may occur at any time between September 16, 2013 and August 5, 2018. If the bonds have
not been converted, they will be redeemed on August 15, 2018 at $100 thousand each. The bondholder
has the right to require the Company to redeem all or part of the bondholdings on August 5, 2016 at
principal amount plus interest rate of 0% per annum. In accordance with the rules for the bonds, because
of the issuing of cash dividends, the conversion price was adjusted to $13.83 from $14.45 on July 26, 2016.
The convertible bonds contain both liability and equity components. The equity component was presented
in equity under the heading of capital surplus - option. The effective interest rate of the liability
component was 2.2142% per annum on initial recognition.

- 34 -
Proceeds from issue (less transaction costs $5,175 thousand) $ 1,194,825
Equity component (less transaction costs allocated to the equity component of $484
thousand
(110,876)
Conversion option derivative (9,600)
Liability component at the date of issue (less transaction costs allocated to the liability
component of $4,691 thousand)
1,074,349
Interest charged at an effective interest rate 75,756 Convertible bonds converted into ordinary shares (313,495)
Liability component at December 31, 2016 $ 836,610
Movements of the conversion option derivative instrument during 2016 were as follows:
Issued date $ 9,600 Fair value changes gain (9,373)
Convertible bonds converted into common shares (227)
Balance at December 31, 2016 $ -
The convertible bonds were issued at face value, recognized by embedded derivative and host contract,
including call and put option, and are measured at fair value; the changes in fair value are recognized in
profit or loss and the liability component of the convertible bonds is measured at amortized cost using the
effective interest method.
As of December 31, 2016, the bondholders exercise their conversion rights with $333,300 thousand to
convert into 22,825 thousand shares.
The gains valuation of option derivative instrument in 2016 and 2015 were $1,955 thousand and $296
thousand, respectively.
18. OTHER PAYABLES
December 31 2016 2015
Accrued salary and bonus $ 349,282 $ 367,828 Bonus to employees and remuneration to directors and supervisors 37,429 32,510 Accrued payable on land 6,844 8,217 Others 491,242 434,264 $ 884,797 $ 842,819
19. RETIREMENT BENEFIT PLANS
a. Defined contribution plans
The Company and its domestic subsidiaries of the Group adopted a pension plan under the Labor
Pension Act (the “LPA”), which is a state-managed defined contribution plan. Under the LPA, an
entity makes monthly contributions to employees’ individual pension accounts at 6% of monthly
salaries and wages.

- 35 -
The employees of the Group’s subsidiary in China are members of a state-managed retirement benefit
plan operated by the government of China. The subsidiary is required to contribute amounts at a
specified percentage of payroll costs to the retirement benefit scheme to fund the benefits. The only
obligation of the Group with respect to the retirement benefit plan is to make the specified
contributions.
Sinon Brazil, Sinon Thailand and Sinon Australia contribute certain percentages of salaries for
medication and retirement benefits.
Sinon USA, Sinon Mexico, Sinon Germany and Sinon Indonesia have no pension plans.
Sinon Cayman, Sinon Hong Kong, Synjia Cayman and Synjia Hong Kong are investment holding
companies that have no pension plans.
b. Defined benefit plans
The defined benefit plan adopted by the Company and its domestic subsidiaries in accordance with the
Labor Standards Law is operated by the government. Pension benefits are calculated on the basis of
the length of service and average monthly salaries of the 6 months before retirement. Pension
contributions are deposited in the Bank of Taiwan in the committee’s name.
The Company, K&S, Yumei Yen and TFS make monthly contributions equal to 2% of salaries to a
pension fund. The funds are administered by pension fund monitoring committees and deposited in
the committees’ name in the Bank of Taiwan. Pension costs and contributions of other companies in
the Group are calculated at amounts equal to certain percentage of salaries. The percentage rates are:
Syntai Chemicals and Hsing Wei contribution 3%, Feng Nien accrual 4%, and Sinon Trading accrual
3%.
Before the end of each year, the Group assesses the balance in the pension fund. If the amount of the
balance in the pension fund is inadequate to pay retirement benefits for employees who conform to
retirement requirements in the next year, the Group is required to fund the difference in one
appropriation that should be made before the end of March of the next year. The pension fund is
managed by the Bureau of Labor Funds, Ministry of Labor (“the Bureau”); the Group has no right to
influence the investment policy and strategy.
The amounts included in the consolidated balance sheets in respect of the Group’s defined benefit plans
were as follows:
December 31
2016 2015
Present value of defined benefit obligation $ 1,037,065 $ 1,163,124 Fair value of plan assets (463,570) (152,792) Net defined benefit liability $ 573,495 $ 1,010,332

- 36 -
Movements in net defined benefit liability (asset) were as follows:
Present Value
of the Defined
Benefit
Obligation
Fair Value of
the Plan Assets
Net Defined
Benefit
Liability (Asset)
Balance at January 1, 2015 $ 1,107,701 $ (45,974) $ 1,061,727
Service cost
Current service cost 19,738 - 19,738
Past service cost and loss on settlements 4,121 - 4,121
Net interest expense (income) 21,600 (711) 20,889
Recognized in profit or loss 45,459 (711) 44,748
Remeasurement
Return on plan assets (excluding amounts
included in net interest) - (1,200) (1,200)
Actuarial loss - changes in demographic
assumptions 34 - 34
Actuarial loss - changes in financial
assumptions 71,398 - 71,398
Actuarial gain - experience adjustments (4,189) - (4,189)
Others (51) - (51)
Recognized in other comprehensive income 67,192 (1,200) 65,992
Contributions from the employer - (160,869) (160,869)
Benefits paid (56,311) 55,962 (349)
Others (917) - (917)
Balance at December 31, 2015 1,163,124 (152,792) 1,010,332
Service cost
Current service cost 18,005 - 18,005 Past service cost and loss (gain) on
settlements - -
- Net interest expense (income) 17,142 (2,068) 15,074 Recognized in profit or loss 35,147 (2,068) 33,079 Remeasurement
Return on plan assets (excluding amounts
included in net interest) - (586)
(586) Actuarial loss - changes in demographic
assumptions 119 -
119 Actuarial gain - experience adjustments (51,760) - (51,760)
Recognized in other comprehensive income (51,641) (586) (52,227) Contributions from the employer - (417,689) (417,689) Benefits paid (109,565) 109,565 - Balance at December 31, 2016 $ 1,037,065 $ (463,570) $ 573,495
Through the defined benefit plans under the Labor Standards Law, the Group is exposed to the
following risks:
1) Investment risk: The plan assets are invested in domestic/ and foreign equity and debt securities,
bank deposits, etc. The investment is conducted at the discretion of the Bureau or under the
mandated management. However, in accordance with relevant regulations, the return generated by
plan assets should not be below the interest rate for a 2-year time deposit with local banks.
2) Interest risk: A decrease in the corporate bond interest rate will increase the present value of the
defined benefit obligation; however, this will be partially offset by an increase in the return on the
plan’s debt investments.

- 37 -
3) Salary risk: The present value of the defined benefit obligation is calculated by reference to the
future salaries of plan participants. As such, an increase in the salary of the plan participants will
increase the present value of the defined benefit obligation.
The actuarial valuations of the present value of the defined benefit obligation were carried out by
qualified actuaries. The significant assumptions used for the purposes of the actuarial valuations were
as follows:
December 31
2016 2015
Discount rate(s) 1.5% 1.5%
Expected rate(s) of salary increase 3.00% 3.00%
If possible reasonable change in each of the significant actuarial assumptions will occur and all other
assumptions will remain constant, the present value of the defined benefit obligation would increase
(decrease) as follows:
December 31
2016 2015
Discount rate(s)
0.25% increase $ (31,300) $ (33,809) 0.25% decrease $ 32,633 $ 35,305
Expected rate(s) of salary increase
0.25% increase $ 32,068 $ 34,694 0.25% decrease $ (30,419) $ (33,406)
Turnover rate
10% increase $ (763) $ (1,043) 10% decrease $ 765 $ 1,047
The sensitivity analysis presented above may not be representative of the actual change in the present
value of the defined benefit obligation as it is unlikely that the change in assumptions would occur in
isolation of one another as some of the assumptions may be correlated.
December 31
2016 2015
The expected contributions to the plan for the next year $ 9,329 $ 10,683
The average duration of the defined benefit obligation 11 to 15 years 12 to 16 years
20. EQUITY
a. Ordinary shares
December 31
2016 2015
Number of shares authorized (in thousands) 500,000 500,000
Shares authorized $ 5,000,000 $ 5,000,000
Number of shares issued and fully paid (in thousands) 356,517 344,803
Convertible bonds (in thousands) 11,714 6,909
Shares issued $ 3,565,168 $ 3,448,032

- 38 -
A holder of issued ordinary share with par value of NT$10 per share is entitled to vote and receive
dividends.
b. Capital surplus
December 31
2016 2015
Arising from conversion of bonds $ 116,269 $ 62,762
Arising from treasury share transactions 51,819 51,819
Arising from the difference between consideration received or
paid and the carrying amount of the subsidiaries’ net assets
during actual disposal or acquisition 2,521 2,866
Arising from share warrants 80,079 95,047
$ 250,688 $ 212,494
1) Such capital surplus may be used to offset a deficit; in addition, when the Company has no deficit,
such capital surplus may be distributed as cash dividends or transferred to share capital limited to a
certain percentage of the Company’s capital surplus and once a year.
2) Capital surplus arising from investments accounted for using equity method, employee share
options and share warrants may not be used for any purpose.
c. Retained earnings and dividend policy
In accordance with the amendments to the Company Act from May 2015, the recipients of dividends
and bonuses are limited to shareholders and do not include employees. The shareholders held their
regular meeting on June 17, 2016 and, in that meeting, resolved amendments to the Company’s Articles
of Incorporation (the “Articles”), particularly the amendment to the policy on dividend distribution and
the addition of the policy on the distribution of employees’ compensation.
Under the dividend policy as set forth in the amended Articles, where the Company made a profit in a
fiscal year, the profit shall be first utilized for paying taxes, offsetting losses of previous years, setting
aside as a legal reserve 10% of the remaining profit, setting aside or reversing a special reserve in
accordance with the laws and regulations, and then any remaining profit together with any undistributed
retained earnings shall be used by the Company’s board of directors as the basis for proposing a
distribution plan, which should be resolved in the shareholders’ meeting for the distribution of
dividends and bonuses to shareholders. For the policies on the distribution of employees’
compensation and remuneration of directors and supervisors, refer to “Employee benefits expense” in
Note 21 e.
The Articles also provide that, in line with the Company’s continuing growth, cash dividend payable
may not be lower than 30% of the total dividends distributed. If total dividends to be distributed are
under $100,000 thousand, the limitation can be waived.
The appropriation of earnings to a legal reserve shall be made until the legal reserve equals the
Company’s paid-in capital. The legal reserve may be used to offset a deficit. If the Company’s has
no deficit and the legal reserve has exceeded 25% of the Company’s paid-in capital, the excess may be
transferred to capital or distributed in cash.
Items referred to under Rule No. 1010012865 and Rule No. 1010047490 issued by the FSC and the
directive titled “Questions and Answers for Special Reserves Appropriated Following Adoption of
IFRSs” should be appropriated to or reversed from a special reserve by the Company.

- 39 -
Except for non-ROC resident shareholders, all shareholders receiving dividends are allowed a tax credit
equal to their proportionate share of the income tax paid by the Company.
The appropriations of earnings for 2015 and 2014 as approved in the shareholders’ meetings in June
2016 and June 2015, respectively, were as follows:
Appropriation of Earnings Dividends Per Share (NT$)
For the Year Ended
December 31
For the Year Ended
December 31
2015 2014 2015 2014
Legal reserve $ 35,274 $ 50,650
Special reserve 69,521 (21,751)
Cash dividends 206,881 308,411 $ 0.6 $ 0.9
The appropriation of earnings for 2016 had been proposed by the Company’s board of directors in
March 2017. The appropriations and dividends per share were as follows:
Appropriation
of Earnings
Dividends Per
Share (NT$)
Legal reserve $ 55,447
Special reserve 95,104
Cash dividends 362,858 $ 1
The appropriation of earnings for 2016 are subject to resolution in the shareholders’ meeting to be held
in June 2017.
21. COMPREHENSIVE INCOME FOR THE YEAR
a. Other income
For the Year Ended December 31
2016 2015
Rental income $ 15,492 $ 11,797
Interest income 14,294 13,241
Dividends 1,148 2,010
Others 49,709 80,229
$ 80,643 $ 107,277
b. Other gains and losses
For the Year Ended December 31
2016 2015
Gain on disposal of property, plant and equipment $ 117,555 $ 42,109
Loss on disposal of investment (700) -
Net gain (loss) arising on financial liabilities classified as held
for trading (1,955) (296)
Loss from disasters (98,370) -
Others (31,950) (13,806)
$ (15,420) $ 28,007

- 40 -
The Group entity which is located in the Dadu Dist. of Taichung City experienced a fire in February
2016. The Group has filed for insurance claims for which it is still awaiting approval. The
above-mentioned disaster losses are reduced by the amount of compensation that is expected to be
granted by the insurance provider.
Net gain (loss) on financial liabilities held for trading was earned from the issue of convertible bonds.
c. Finance costs
For the Year Ended December 31
2016 2015
Interest on bank overdrafts and loans $ 91,495 $ 92,164
Interest on convertible bonds 21,339 21,784
Other finance costs 2,341 2,243
$ 115,175 $ 116,191
Information about capitalized interest was as follows:
For the Year Ended December 31
2016 2015
Capitalized interest $ 3,810 $ 6,028
Capitalization rate 1.746% 1.7719%
d. Depreciation
For the Year Ended December 31
2016 2015
An analysis of depreciation by function
Operating costs $ 407,901 $ 433,142
Operating expenses 277,911 259,666
$ 685,812 $ 692,808
e. Employee benefits expense
Operating
Costs
Operating
Expenses Total
For the Year Ended December 31, 2016
Salary and wages $ 444,988 $ 1,544,509 $ 1,989,497
Labor and health insurance costs 75,784 183,104 258,888
Post-employment benefits
Defined contribution plans 15,824 55,477 71,301
Defined benefit plans 14,307 18,772 33,079
Other employee benefits 26,689 59,289 85,978

- 41 -
Operating
Costs
Operating
Expenses Total
For the Year Ended December 31, 2015
Salary and wages $ 438,292 $ 1,642,918 $ 2,081,210
Labor and health insurance costs 70,885 185,058 255,943
Post-employment benefits
Defined contribution plans 15,294 52,453 67,747
Defined benefit plans 15,265 29,483 44,748
Other employee benefits 30,694 61,633 92,327
1) Employees’ compensation and remuneration of directors for 2016 and 2015
In Compliance with the Company Act as amended in May 2015 and the amended Articles of
Incorporation of the Company approved by the shareholders in their meeting in June 2016, the
Company accrued employees’ compensation and remuneration of directors at the rates no less than
1% and no higher than 5%, respectively, of net profit before income tax, employees’ compensation,
and remuneration of directors. The employees’ compensation and remuneration of directors for
the years ended December 31, 2016 and 2015 which have been approved by the Company’s board
of directors in March 2017 and March 2016, respectively, were as follows:
For the Year Ended December 31
2016 2015
Cash Accrual rate Amount Accrual rate Amount
Employees’ compensation 1% $ 6,105 1% $ 5,177
Remuneration of directors 5% 30,526 5% 25,884
If there is a change in the amounts after the annual consolidated financial statements were
authorized for issue, the differences are recorded as a change in the accounting estimate.
There was no difference between the actual amounts of employees’ compensation and remuneration
of directors paid and the amounts recognized in the consolidated financial statements for the year
ended December 31, 2015.
Information on the employees’ compensation and remuneration of directors resolved by the
Company’s board of directors in 2017 and 2016 is available at the Market Observation Post System
website of the Taiwan Stock Exchange.
2) Bonus to employees and remuneration of directors and supervisors for 2014
The bonus to employees and remuneration of directors and supervisors for 2014 which have been
approved in the shareholders’ meeting in June 2015 were as follows:
For the Year
Ended
December 31,
2014
Bonus to employees $ 4,558 Remuneration of directors and supervisors 22,793

- 42 -
There was no difference between the amounts of the bonus to employees and the remuneration of
directors and supervisors approved in the shareholders’ meeting in June 2015 and the amounts
recognized in the consolidated financial statements for the year ended December 31, 2014.
Information on the bonus to employees and remuneration of directors and supervisors resolved by
the shareholders in their meeting in 2015 is available at the Market Observation Post System
website of the Taiwan Stock Exchange.
22. INCOME TAXES
a. Major components of tax expense recognized in profit or loss
For the Year Ended December 31
2016 2015
Current tax
In respect of the current year $ 249,477 $ 34,890
Income tax on unappropriated earnings - 21,220
Adjustments for prior years 16,942 29,260
Deferred tax
In respect of the current year (111,936) (2,690)
Income tax expense recognized in profit or loss $ 154,483 $ 82,680
A reconciliation of accounting profit and income tax expenses is as follows:
For Year Ended December 31
2016 2015
Income tax expense calculated at the statutory rate $ 249,477 $ 34,890
Tax effect of adjusting items:
Tax-exempt income (18,814) (13,092)
Permanent differences (249) (15,814)
Temporary differences (82,461) (44)
Additional income tax on unappropriated earnings - 21,220
Unrecognized loss carryforwards 1,937 -
Investment tax credits used (186) (8,532)
Current income tax expense 149,704 18,628
Deferred income tax
Temporary difference (12,163) 34,792
Prior year’s adjustment 16,942 29,260
Income tax expense recognized in profit or loss $ 154,483 $ 82,680
The applicable tax rate used above is the corporate tax rate of 17% payable by the Group in the ROC,
while the applicable tax rate used by subsidiaries in China is 25%. Tax rates used by other group
entities operating in other jurisdictions are based on the tax laws in those jurisdictions.
As the status of 2017 appropriations of earnings is uncertain, the potential income tax consequences of
2016 unappropriated earnings are not reliably determinable.

- 43 -
b. Deferred tax assets and liabilities
The movements of deferred tax assets and deferred tax liabilities were as follows:
For the year ended December 31, 2016
Deferred Tax Assets Opening
Balance
Recognized in
Profit or Loss
Recognized in
Other
Comprehensive
Income
Closing
Balance
Temporary differences
Associates $ 62,856 $ 36,598 $ - $ 99,454
Provisions 4,818 1,353 - 6,171
Defined benefit obligation 64,822 6,020 8,878 79,720
Others 43,221 (141,549) - (98,328)
$ 175,717 $ (97,578) $ 8,878 $ 87,017
Deferred Tax Liabilities
Temporary differences
Land appreciation Tax $ 222,510 $ (14,525) $ - $ 207,985
Foreign investment income 28,401 4,459 - 32,860
Others 8,728 (7,459) - 1,269
$ 259,639 $ (17,525) $ - $ 242,114
For the year ended December 31, 2015
Deferred Tax Assets Opening
Balance
Recognized in
Profit or Loss
Recognized in
Other
Comprehensive
Income
Closing
Balance
Temporary differences
Associates $ 18,980 $ 43,876 $ - $ 62,856
Provisions 14,428 (9,610) - 4,818
Defined benefit obligation 70,858 (17,254) 11,218 64,822
Others 4,958 38,263 - 43,221
$ 109,224 $ 55,275 $ 11,218 $ 175,717
Deferred Tax Liabilities
Temporary differences
Land appreciation Tax $ 222,510 $ - $ - $ 222,510
Foreign investment income 23,560 4,841 - 28,401
Others 8,043 685 - 8,728
$ 254,113 $ 5,526 $ - $ 259,639

- 44 -
c. Deductible temporary differences which no deferred tax assets have been recognized in the consolidated
balance sheets
December 31 2016 2015
Deductible temporary differences $ 131,202 $ 158,994
d. Integrated income tax
All of the Company’s earnings generated prior to December 31, 1997 have been appropriated.
December 31 2016 2015
Shareholder - imputed credit account $ 223,057 $ 225,341
The creditable ratio for distribution of earnings of 2016 and 2015 was 15.44% (expected) and 23.16%,
respectively.
e. Income tax assessments
Income tax returns through 2014 of the Company and ROC subsidiaries have been assessed by the tax
authorities.
23. EARNINGS PER SHARE
Number of
Shares
Amounts Denominator
(Numerator) (In Thousands) EPS (NT$)
Year ended December 31, 2016
Basic EPS
Net income available to common shareholders
of the parent $ 554,470
346,652 $ 1.60
Effect of dilutive potential common shares
Employees’ compensation - 399
Convertible bonds 17,712 72,533
Diluted EPS
Net income available to common shareholders
of the parent (including effect of dilutive
potential common shares) $ 572,182
419,584 $ 1.36

- 45 -
Number of
Shares
Amounts Denominator
(Numerator) (In Thousands) EPS (NT$)
Year ended December 31, 2015
Basic EPS
Net income available to common shareholders
of the parent $ 352,733
343,405 $ 1.03
Effect of dilutive potential common shares
Employees’ compensation - 398
Convertible bonds 18,080 72,588
Diluted EPS
Net income available to common shareholders
of the parent (including effect of dilutive
potential common shares) $ 370,813
416,391 $ 0.89
If the Group offered to settle compensation or bonuses paid to employees in cash or shares, the Group
assumed the entire amount of the compensation or bonus will be settled in shares and the resulting potential
shares were included in the weighted average number of shares outstanding used in the computation of
diluted earnings per share, as the effect is dilutive. Such dilutive effect of the potential shares is included
in the computation of diluted earnings per share until the number of shares to be distributed to employees is
resolved in the following year.
24. OPERATING LEASE ARRANGEMENTS
Operating leases relate to leases of land with lease terms between 5 and 10 years. The Group does not
have a bargain purchase option to acquire the leased land at the expiration of the lease periods.
The future minimum lease payments of non-cancellable operating lease commitments were as follows:
December 31 2016 2015
Not later than 1 year $ 216,947 $ 182,973
Later than 1 year and not later than 5 years 612,522 587,950
Later than 5 years 454,159 435,449
$ 1,283,628 $ 1,206,372
The lease payments recognized in profit or loss for the current period were as follows:
For Year Ended December 31
2016 2015
Minimum lease payments $ 347,086 $ 290,551

- 46 -
25. CAPITAL MANAGEMENT
The Group manages its capital to ensure that entities in the Group will be able to continue as going
concerns while maximizing the return to shareholders through the optimization of the debt and equity
balance.
The capital structure of the Group consists of net debt (borrowings offset by cash and cash equivalents) and
equity of the Group (comprising share capital, capital surplus, retained earnings and other equity).
Key management personnel of the Group review the capital structure on a quarterly basis. As part of this
review, the key management personnel consider the cost of capital and the risks associated with each class
of capital. Based on recommendations of the key management personnel, in order to balance the overall
capital structure, the Group may adjust the amount of dividends paid to shareholders, the number of new
shares issued or repurchased, and the amount of new debt issued or existing debt redeemed.
26. FINANCIAL INSTRUMENTS
a. Fair value of financial instruments
1) Short-term financial instruments used book value as fair value because the carrying amounts
reported in the balance sheets approximate their fair value. The accounts include cash and cash
equivalents, notes receivable and payable, other receivable, refundable deposits, short-term bank
loans, short-term bills payable, accounts receivable and payable, other payable and guarantee
deposits received.
2) Fair value measurements recognized in the consolidated balance sheets
Level 1 Level 2 Level 3 Total
December 31, 2016
Available-for-sale financial
assets
Mutual funds $ 14,558 $ - $ - $ 14,558
Financial assets measured
at cost
Shares not listed in the
ROC - - 18,918 18,918
$ 14,558 $ - $ 18,918 $ 33,476
Financial liabilities
measured at amortized
cost
Convertible bonds $ 836,610 $ - $ - $ 836,610

- 47 -
Level 1 Level 2 Level 3 Total
December 31, 2015
Available-for-sale financial
assets
Shares listed in the ROC $ 2,423 $ - $ - $ 2,423
Mutual funds 13,865 - - 13,865
Bond listed in the ROC 981 - - 981
Financial assets measured
at cost
Shares not listed in the
ROC - - 18,918 18,918
$ 17,269 $ - $ 18,918 $ 36,187
Financial liabilities at
FVTPL
Conversion option $ - $ 1,955 $ - $ 1,955
Financial liabilities
measured at amortized
cost
Convertible bonds 970,947 - - 970,947
$ 970,947 $ 1,955 $ - $ 972,902
There were no transfers between Level 1 and Level 2 in 2016 and 2015.
3) Valuation techniques and assumptions applied for the purpose of measuring fair value
The fair values of financial assets and financial liabilities were determined as follows:
a) The fair values of financial assets and financial liabilities with standard terms and conditions
and traded in active liquid markets are determined with reference to quoted market prices;
b) The fair values of derivative instruments were calculated using quoted prices. Where such
prices were not available, a discounted cash flow analysis was performed using the applicable
yield curve for the duration of the instruments for non-optional derivatives, and option pricing
models for optional derivatives.
c) The fair values of other financial assets and financial liabilities (excluding those described
above) were determined in accordance with generally accepted pricing models based on
discounted cash flow analysis.
b. Categories of financial instruments
December 31 2016 2015
Financial assets
Loans and receivables (1) $ 3,817,400 $ 3,202,945
Available-for-sale financial assets 14,558 17,269
Financial assets measured at cost - noncurrent 18,918 18,918

- 48 -
December 31 2016 2015
Financial liabilities
Fair value through profit or loss (FVTPL) $ - $ 1,955
Amortized cost (2) 8,560,704 8,676,251
1) The balances included loans and receivables measured at amortized cost, which comprise cash and
cash equivalents, notes receivable, trade and other receivables, and refundable deposit.
2) The balances included financial liabilities measured at amortized cost, which comprise short-term
and long-term loans, short-term bills payable, notes payable, accounts payable, other payables,
bonds issued, and guarantee deposit received.
c. Financial risk management objectives and policies
The Group’s major financial instruments include trade receivables, trade payables, and borrowings.
The Group’s Corporate Treasury function provides services to the business, coordinates access to
domestic and international financial markets, monitors and manages the financial risks relating to the
operations of the Group through internal risk reports which analyze exposures by degree and magnitude
of risks. These risks include market risk (including currency risk and interest rate risk), credit risk and
liquidity risk.
The Group sought to minimize the effects of these risks by using derivative financial instruments to
hedge risk exposures. The use of financial derivatives was governed by the Group’s policies approved
by the Company’s board of directors. Compliance with policies and exposure limits was reviewed by
the internal auditors on a continuous basis.
1) Market risk
The Group’s activities exposed it primarily to the financial risks of changes in foreign currency
exchange rates and interest rates.
There had been no change to the Group’s exposure to market risks or the manner in which these
risks were managed and measured.
a) Foreign currency risk
Several subsidiaries of the Company had foreign currency sales and purchases, which expose
the Group to foreign currency risk.
The carrying amounts of the Group’s foreign currency-denominated monetary assets and
monetary liabilities at the end of the reporting period are listed in Note 30.
Sensitivity analysis
For a 1% weakening of US dollars against the functional currency, there would be opposite
impact on pre-tax profit as follows:
For Year Ended December 31
Functional Currency 2016 2015
NTD $ 15,416 $ 14,597
BRL (11,750) (9,907)

- 49 -
This was mainly attributable to the exposure of outstanding receivables and payables
denominated in USD, which were not hedged at the end of the reporting period. The above
table details the Group’s sensitivity to a 1% increase and decrease in U.S. dollars against the
relevant functional currencies. The sensitivity rate of 1% is used when reporting foreign
currency risk internally to key management personnel and represents management’s assessment
of the reasonably possible change in foreign exchange rates.
In management’s opinion, the sensitivity analysis was unrepresentative of the inherent foreign
exchange risk because the exposure at the end of the reporting period did not reflect the
exposure during the period.
b) Interest rate risk
The carrying amount of the Group’s financial assets and financial liabilities with exposure to
interest rates at the end of the reporting period were as follows.
December 31 2016 2015
Cash flow interest rate risk
Financial assets $ 1,211,445 $ 983,058
Financial liabilities 4,699,452 5,104,282
Sensitivity analysis
For financial assets and liabilities, assuming all other variables were held constant, a
hypothetical increase in interest rate of 100 basis point (0.25%) would have resulted in an
increase in the interest expense before tax by approximately $9,512 thousand and $9,805
thousand for the years ended December 31, 2016 and 2015, respectively. A sensitivity rate of
0.25% increase or decrease was used when reporting interest rate risk internally to the directors
and represents the directors’ assessment of the reasonably possible change in interest rates.
2) Credit risk
Credit risk refers to the risk that counterparty will default on its contractual obligations resulting in
financial loss to the Group. As at the end of the reporting period, the Group’s maximum exposure
to credit risk which will cause a financial loss to the Group due to failure of counterparties to
discharge an obligation and financial guarantees provided by the Group could arise from the
carrying amount of the respective recognized financial assets as stated in the balance sheets.
The Group adopted a policy of only dealing with creditworthy counterparties and obtaining
sufficient collateral, where appropriate, as a means of mitigating the risk of financial loss from
defaults. The Group only transacts with entities that are rated the equivalent of investment grade.
The Group uses other publicly available financial information and its own trading records to rate its
major customers. The Group’s exposure and the credit ratings of its counterparties are
continuously monitored and the aggregate value of transactions concluded is spread amongst
approved counterparties. Credit exposure is controlled by counterparty limits that are reviewed
and approved by the risk management committee annually.
In order to minimize credit risk, management of the Group has delegated a team responsible for
determining credit limits, credit approvals and other monitoring procedures to ensure that follow-up
action is taken to recover overdue debts. In addition, the Group reviews the recoverable amount of
each individual trade debt at the end of the reporting period to ensure that adequate allowances are
made for irrecoverable amounts. In this regard, management believes the Group’s credit risk was
significantly reduced.

- 50 -
Trade receivables are dispersed in various industries and geographical locations. Ongoing credit
evaluation is performed on the financial condition of trade receivables and, where appropriate,
credit guarantee insurance cover is purchased.
The Group’s concentration of credit risk by geographical location was in Brazil, which accounted
for 35% and 22% of the total trade receivable as of December 31, 2016 and 2015, respectively.
3) Liquidity risk
Ultimate responsibility for liquidity risk management rests with the board of directors, which has
built an appropriate liquidity risk management framework for the Group’s short, medium and
long-term funding and liquidity management requirements. The Group manages liquidity risk by
maintaining adequate reserves, banking facilities and reserve borrowing facilities, and continuously
monitoring forecast and actual cash flows as well as matching the maturity profiles of financial
assets and liabilities. As of December 31, 2016 and 2015, the Group had available unutilized
short-term bank loan facilities in the amounts of $6,990,369 thousand and $7,295,393 thousand,
respectively.
The following tables details the Group’s remaining contractual maturity for its non-derivative
financial liabilities with agreed repayment periods. The tables had been drawn up based on the
undiscounted cash flows of financial liabilities from the earliest date on which the Group can be
required to pay. The tables included both interest and principal cash flows. Specifically, bank
loans with a repayment on demand clause were included in the earliest time band regardless of the
probability of the banks choosing to exercise their rights. The maturity dates for other
non-derivative financial liabilities were based on the agreed repayment dates.
Non-derivative financial liabilities
Less Than
3 Months
3 Months to
1 Year 1+Year
December 31, 2016
Non-interest bearing $ 2,592,096 $ - $ -
Variable interest rate liabilities 1,599,851 521,663 2,877,938
$ 4,191,947 $ 521,663 $ 2,877,938
December 31, 2015
Non-interest bearing $ 2,438,316 $ - $ -
Variable interest rate liabilities 1,607,608 505,635 3,041,039
$ 4,045,924 $ 505,635 $ 3,041,039
27. TRANSACTIONS WITH RELATED PARTIES
Balances and transactions between the Company and its subsidiaries, which are related parties of the
Company, have been eliminated on consolidation and are not disclosed in this note. Details of
transactions between the Group and other related parties are disclosed below.

- 51 -
a. Sales of goods
For the Year Ended December 31
Related Party Categories 2016 2015
Associates $ 1,041 $ 1,776
There was no material difference in sales prices and terms between related and third parties. The
general credit term was 30 to 60 days.
The balance of receivables from related parties was as follows:
December 31
Related Party Categories 2016 2015
Associates $ - $ 274
The balance of payable to related parties was as follows:
December 31
Related Party Categories 2016 2015
Associates $ 2,359 $ 1,593
The outstanding trade payables to related parties are unsecured. No expense was recognized for the
years ended December 31, 2016 and 2015 for allowance for impairment of trade receivables with
respect to the amounts owed by related parties.
b. Compensation of key management personnel
The Compensation to directors and other key management personnel were as follows:
For the Year Ended December 31
2016 2015
Short-term employee benefits $ 18,735 $ 15,988
Post-employment benefits 432 216
$ 19,167 $ 16,204
The compensation to directors and other key management personnel were determined by the
compensation committee having regard to the performance of individuals and market trends.
c. Others
For the Year Ended December 31
2016 2015
1) Manufacturing and operating expenses
Associates $ 1,599 $ 2,891
2) Rental income
Associates $ 1,680 $ 1,680

- 52 -
3) Purchase property transactions
For the Year Ended December 31
Objects Account Items 2016 2015
Associates Other assets $ 7,716 $ 4,543
December 31
2016 2015
4) Other receivables
Associates $ 189 $ 189
28. ASSETS PLEDGED AS COLLATERAL OR FOR SECURITY
The following assets were provided as collateral for commercial paper, performance guarantee, letters of
credit, bank borrowings, and for hiring foreign workers:
December 31 2016 2015
Property, plant and equipment $ 2,173,050 $ 2,147,795
Refundable deposits 1,900 1,900
Inventories - construction - 328,728
Construction held for sale - 107,000
$ 2,174,950 $ 2,585,423
29. SIGNIFICANT CONTINGENT LIABILITIES AND UNRECOGNIZED COMMITMENTS
In addition to those disclosed in other notes, significant commitments and contingencies of the Group as of
December 31, 2016 and 2015 were as follows:
a. Significant commitments
1) As of December 31, 2016 and 2015, unused letters of credit for purchases of raw materials and
machinery and equipment amounted to approximately $46,443 thousand and $56,727 thousand,
respectively.
2) TFS issued coupons and performance guarantees to banks in the amounts of $45,410 thousand and
$13,935 thousand as of December 31, 2016 and 2015, respectively.
b. Unrecognized commitments
For the Year Ended December 31
2016 2015
Acquisition of property, plant and equipment $ 43,223 $ 138,194

- 53 -
c. Housing construction contract with company
For the Year Ended December 31
2016 2015
Price $ 191,033 $ 189,524
Paid according to progress of the project (191,033) (161,095)
$ - $ 28,429
d. Signed by pre-sale purchase agreement
For the Year Ended December 31
2016 2015
Guo’an section
Price $ 514,355 $ 301,060
Received amount 390,955 244,693
30. SIGNIFICANT ASSETS AND LIABILITIES DENOMINATED IN FOREIGN CURRENCIES
The following information was aggregated by the foreign currencies other than functional currencies of the
Group entities and the exchange rates between foreign currencies and respective functional currencies were
disclosed. The significant assets and liabilities denominated in foreign currencies were as follows:
December 31, 2016 December 31, 2015
Foreign
Currencies
Exchange
Rate
Carrying
Amount
Foreign
Currencies
Exchange
Rate
Carrying
Amount
Financial assets
Monetary items
USD (USD/NTD) $ 62,531 32.279 $ 2,018,433 $ 60,475 33.066 $1,999,665
Financial liabilities
Monetary items
USD (USD/NTD) 60,344 32.279 1,947,853 55,329 33.066 1,829,509
USD (USD/BRL) 30,636 3.253 1,175,004 29,961 3.962 990,679
The Group is mainly exposed to USD. The following information was aggregated by the functional
currencies of the group entities, and the exchange rates between respective functional currencies and the
presentation currency were disclosed. The significant realized and unrealized foreign exchange gains
(losses) were as follows:
For the Year Ended December 31
2016 2015
Foreign
Currencies Exchange Rate
Net Foreign
Exchange Gain
(Loss) Exchange Rate
Net Foreign
Exchange Gain
(Loss)
NTD 1 (NTD:NTD) $ (31,522) 1 (NTD:NTD) $ 29,510
BRL 9.273 (BRL:NTD) 162,662 9.571 (BRL:NTD) (295,725)
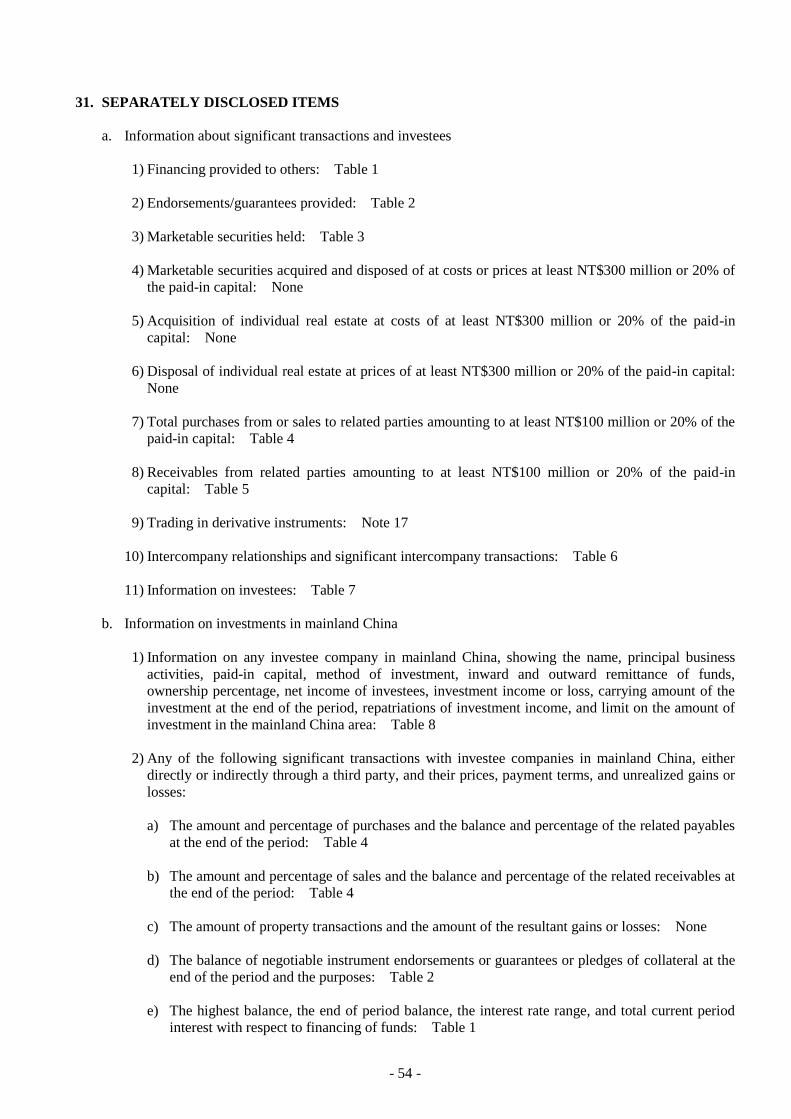
- 54 -
31. SEPARATELY DISCLOSED ITEMS
a. Information about significant transactions and investees
1) Financing provided to others: Table 1
2) Endorsements/guarantees provided: Table 2
3) Marketable securities held: Table 3
4) Marketable securities acquired and disposed of at costs or prices at least NT$300 million or 20% of
the paid-in capital: None
5) Acquisition of individual real estate at costs of at least NT$300 million or 20% of the paid-in
capital: None
6) Disposal of individual real estate at prices of at least NT$300 million or 20% of the paid-in capital:
None
7) Total purchases from or sales to related parties amounting to at least NT$100 million or 20% of the
paid-in capital: Table 4
8) Receivables from related parties amounting to at least NT$100 million or 20% of the paid-in
capital: Table 5
9) Trading in derivative instruments: Note 17
10) Intercompany relationships and significant intercompany transactions: Table 6
11) Information on investees: Table 7
b. Information on investments in mainland China
1) Information on any investee company in mainland China, showing the name, principal business
activities, paid-in capital, method of investment, inward and outward remittance of funds,
ownership percentage, net income of investees, investment income or loss, carrying amount of the
investment at the end of the period, repatriations of investment income, and limit on the amount of
investment in the mainland China area: Table 8
2) Any of the following significant transactions with investee companies in mainland China, either
directly or indirectly through a third party, and their prices, payment terms, and unrealized gains or
losses:
a) The amount and percentage of purchases and the balance and percentage of the related payables
at the end of the period: Table 4
b) The amount and percentage of sales and the balance and percentage of the related receivables at
the end of the period: Table 4
c) The amount of property transactions and the amount of the resultant gains or losses: None
d) The balance of negotiable instrument endorsements or guarantees or pledges of collateral at the
end of the period and the purposes: Table 2
e) The highest balance, the end of period balance, the interest rate range, and total current period
interest with respect to financing of funds: Table 1

- 55 -
f) Other transactions that have a material effect on the profit or loss for the period or on the
financial position, such as the rendering or receiving of services: None
32. SEGMENT INFORMATION
Information reported to the chief operating decision maker for the purposes of resource allocation and
assessment of segment performance focuses on types of goods or services delivered or provided. The
Group’s reportable segments are therefore as follows:
Crop protection - manufacture chemicals and fertilizer.
Supermarket - supermarket and general retail industry.
a. Segment revenues and results
The following was an analysis of the Group’s revenue and results from continuing operations by
reportable segment.
Year Ended December 31
Segment Revenue Segment Profit
2016 2015 2016 2015
Corp protection $ 9,594,556 $ 11,082,584 $ 614,078 $ 723,367
Supermarket 4,529,180 4,290,087 80,545 74,731
Others 2,165,383 2,359,210 4,517 26,684
Total from continuing operations $ 16,289,119 $ 17,731,881 699,140 824,782
Share of profits of associates
accounted for using the equity
method 2,905 3,455
Finance costs (115,175) (116,191)
Unallocated 135,472 (268,863)
Profit before tax $ 722,342 $ 443,183
The revenues reported above were trade revenues from external customers. For the years ended
December 31, 2016 and 2015, the inter-segment revenues were $24,294 thousand and $72,393
thousand, respectively.
Segment profit represented the profit before tax earned by each segment without allocation of central
administration costs and directors’ salaries, share of profits of associates, gain recognized on the
disposal of interest in former associates, rental revenue, interest income, gain or loss on disposal of
property, plant and equipment, gain or loss on disposal of financial instruments, exchange gain or loss,
valuation gain or loss on financial instruments, finance costs and income tax expense. This was the
measure reported to the chief operating decision maker for the purpose of resource allocation and
assessment of segment performance.

- 56 -
b. Segment total assets and liabilities
December 31
2016 2015
Segment assets
Continuing operations
Crop Protection $ 12,295,187 $ 12,371,744
Supermarket 1,534,298 1,328,302
Other 1,847,291 1,878,295
Consolidated total assets $ 15,676,776 $ 15,578,341
Segment liabilities
Continuing operations
Crop Protection $ 7,973,294 $ 8,518,079
Supermarket 1,115,863 970,603
Other 743,853 694,138
Consolidated total liabilities $ 9,833,010 $ 10,182,820
For the purpose of monitoring segment performance and allocating resources between segments:
1) All assets were allocated to reportable segments other than interests in associates accounted for
using the equity method, other financial assets, and current and deferred tax assets. Assets used
jointly by reportable segments were allocated on the basis of the revenues earned by individual
reportable segments; and
2) All liabilities were allocated to reportable segments other than borrowings, other financial
liabilities, current and deferred tax liabilities. Liabilities for which reportable segments are jointly
liable were allocated in proportion to segment assets.
c. Revenue from major products and services
The following is an analysis of the Group’s revenue from continuing operations from its major products
and services.
For the Year Ended December 31
2016 2015
Crop protection $ 9,594,556 $ 11,082,584
Supermarket 4,529,180 4,290,087
Household supplies and mission catering 1,502,629 1,657,646
Others 662,754 701,564
$ 16,289,119 $ 17,731,881
d. Geographical information
The Group operates in three principal geographical areas – Asia, the United States (USA), and Europe.
The Group’s revenue from continuing operations from external customers by location of operations and
information about its non-current assets by location of assets are detailed below.

- 57 -
Revenue from
External Customers Non-current Assets
For the Year Ended December 31 December 31,
2016 2015 2016 2015
Asia $ 13,249,054 $ 14,340,971 $ 8,168,583 $ 8,417,073
USA 1,840,871 2,049,276 52,132 116,708
Europe 851,788 1,033,921 4 11
Australia 308,167 282,902 128 173
Others 39,239 24,811 - -
$ 16,289,119 $ 17,731,881 $ 8,220,847 $ 8,533,965
Non-current assets exclude non-current assets classified as held for sale, and exclude financial
instruments, deferred tax assets and post-employment benefit assets, and assets arising from insurance
contracts.
f. Information about major customers
No other single customers contributed 10% or more to the Group’s revenue for both years ended
December 31, 2016 and 2015.

- 58 -
TABLE 1
SINON CORPORATION AND SUBSIDIARIES
FINANCING PROVIDED TO RELATED PARTIES
FOR THE YEAR ENDED DECEMBER 31, 2016
(In Thousands of New Taiwan Dollars, Unless Stated Otherwise)
No. Lender Borrower Financial
Statement Account
Related
Parties
Highest Balance
for the Period Ending Balance
Actual
Borrowing
Amount
Range of
Interest
Rate
(%)
Nature of Financing
Business
Transaction
Amount
Reasons for
Short-term
Financing
Allowance for
Bad Debt
Collateral Financing Limits
for Each
Borrowing
Company
(Note 1)
Financing
Company’s Total
Financing
Amount Limits
(Note 2)
Item Value
0 Sinon Corporation Sinon USA Other receivables Y US$ 500 US$ 500 $ - - Short-term financing $ - Operation $ - - $ - $ 574,182 $ 1,148,365
Sinon Germany Other receivables Y US$ 500 US$ 500 - - Short-term financing - Operation - - - 574,182 1,148,365
Sinon Thailand Other receivables Y US$ 1,000 US$ 1,000 - - Short-term financing - Operation - - - 574,182 1,148,365
Sinon Zhongshan Other prepayments Y US$ 2,500 US$ 2,500 - - Short-term financing - Operation - - - 574,182 1,148,365
Sinon China Other prepayments Y US$ 5,000 US$ 5,000 - - Short-term financing - Operation - - - 574,182 1,148,365
Sinon Brazil Other receivables Y US$ 12,000 US$ 12,000 - - Short-term financing - Operation - - - 574,182 1,148,365
1 Sinon China Sinon Zhongshan Other receivables Y RMB$ 4,000 RMB$ 4,000 RMB$ 1,500 6 Short-term financing - Operation - - - RMB$ 26,127 RMB$ 41,804
Sinon Zhongshan Servings Other receivables Y RMB$ 8,000 RMB$ 8,000 - - Short-term financing - Operation - - - RMB$ 26,127 RMB$ 41,804
Poise Packing Other receivables Y RMB$ 12,000 RMB$ 12,000 RMB$ 7,000 6 Short-term financing - Operation - - - RMB$ 26,127 RMB$ 41,804
Note 1: The financing amount of the Company should not exceed 10% of the Company’s shareholders’ equity; that of subsidiaries should not exceed 25% of the subsidiaries’ shareholders’ equity.
Note 2: The financing amount of the Company should not exceed 20% of the Company’s shareholders’ equity; that of subsidiaries should not exceed 40% of the subsidiaries’ shareholders’ equity.

- 59 -
TABLE 2
SINON CORPORATION AND SUBSIDIARIES
ENDORSEMENT/GUARANTEES PROVIDED
FOR THE YEAR ENDED DECEMBER 31, 2016
(In Thousands of New Taiwan Dollars, Unless Stated Otherwise)
No. Endorser/Guarantor
Endorsed/Guaranteed Party
Limits on
Endorsement/
Guarantee Given
on Behalf of
Each Party
Maximum
Amount
Endorsed/Guaran
teed During the
Period
Outstanding
Endorsement/
Guarantee at the
End of the Period
Actual Borrowing
Amount
Amount
Endorsed/
Guaranteed by
Collaterals
Ratio of
Accumulated
Endorsement/
Guarantee to Net
Equity In Latest
Financial
Statements
(%)
Aggregate
Endorsement/
Guarantee Limit
(Note 2)
Endorsement/
Guarantee Given
by Parent on
Behalf of
Subsidiaries
Endorsement/
Guarantee Given
by Subsidiaries on
Behalf of Parent
Endorsement/
Guarantee Given
On behalf of
Companies in
Mainland China
Name
Nature of
Relationship
(Note 1)
0 Sinon Corporation Simon China 2. (Note 2) US$ 7,610 US$ 6,300 US$ 1,860 None 3.54 $ 2,296,729 Y - Y
Yumei Yen 1. (Note 2) $ 300,950 296,837 96,994 None 5.17 2,296,729 Y - N
1 Sinon China Poise Packing 1. (Note 2) RMB$ 4,180 RMB$ 4,000 RMB$ 2,460 None 3.83 RMB$ 41,804 Y - Y
Note 1: The relationship between guarantor and guaranteed party:
1. Subsidiary which is directly held over 50% of the issued share capital.
2. Investee which is held over 50% of the issued share capital held combine by the Company and subsidiaries combined.
Note 2: Domestic subsidiary, based on 20% of issued capital of the guarantor; overseas subsidiary, based on 30% of issued capital of the guarantor; total guarantee, based on 40% of issued capital of guarantor.

- 60 -
TABLE 3
SINON CORPORATION AND SUBSIDIARIES
MARKETABLE SECURITIES HELD
DECEMBER 31, 2016
(In Thousands of New Taiwan Dollars, Unless Stated Otherwise)
Holding Company Type and Name of Marketable Securities Relationship with the Holding
Company Financial Statement Account
December 31, 2012
Note Shares
Carrying
Value
Percentage of
Ownership
Market Value
or Net Asset
Value (Note)
Sinon Corporation Ordinary shares
TGCC The Corporation is the director of TGCC Financial assets measured at cost - noncurrent 1,891,792 $ 18,918 9.7 $ 22,866
Syntai Chemicals Beneficiary certificate
Evenstar Fund Nil Available-for-sale financial assets - current 109 14,558 - 14,558
Note: Listed companies and OTC shares have been calculated according to closing price at the balance sheet date. Beneficiary certificates have been calculated according to closing price of the balance sheet date. The estimated fair values of
securities held without available quoted market price were based on the net assets of the investees.

- 61 -
TABLE 4
SINON CORPORATION AND SUBSIDIARIES
TOTAL PURCHASES FROM OR SALES TO RELATED PARTIES AMOUNTING TO AT LEAST NT$100 MILLION OR 20% OF THE PAID-IN CAPITAL
FOR THE YEAR ENDED DECEMBER 31, 2016
(In Thousands of New Taiwan Dollars)
Purchaser or Seller Related Party Nature of the
Relationship
Transaction Details Abnormal Transaction Notes / Accounts
Receivable (Payable) Note
Purchase / Sales Amount %
to Total Payment/Collection Terms Unit Price Collection Terms Ending Balance
%
to Total
Sinon Corporation Sinon China Subsidiary Purchase $ 890,389 19 30-60 days after transaction day $ - - $ (20,740) (3)
Sinon Brazil Subsidiary Sales (1,030,453) (13) T/T 180-270 days after transaction day - - 1,180,882 54
Sinon Australia Subsidiary Sales (159,097) (2) T/T 240 days after transaction day - - 172,694 8
Sinon Thailand Subsidiary Sales (118,933) (2) T/T 180-270 days after transaction day - - 85,479 4
Note: Significant intercompany accounts and transactions have been eliminated, see Table 6.

- 62 -
TABLE 5
SINON CORPORATION AND SUBSIDIARIES
RECEIVABLE FROM RELATED PARTIES AMOUNTING TO AT LEAST NT$100 MILLION OR 20% OF PAID-IN CAPITAL
DECEMBER 31, 2016
(In Thousands of New Taiwan Dollar, Unless Stated Otherwise)
Company Name Related Party Nature of the Relationship Ending Balance
(Note)
Turnover
Rate
Overdue Amounts
Received in
Subsequent
Period
Allowance for
Doubtful
Accounts Amount Action Taken
Sinon Corporation Sinon Brazil Subsidiary $ 1,180,882 0.94 $ - - $ 31,313 $ -
Sinon Australia Subsidiary 172,694 0.8 - - 29,484 -
Note: Ending balances included accounts receivable and pledged accounts receivable. Significant intercompany accounts and transactions have been eliminated, see Table 6.

- 63 -
TABLE 6
SINON CORPORATION AND SUBSIDIARIES
INTERCOMPANY RELATIONSHIPS AND SIGNIFICANT INTERCOMPANY TRANSACTIONS
FOR THE YEARS ENDED DECEMBER 31, 2016
(In Thousands of New Taiwan Dollars, Unless Stated Otherwise)
No. Company Name Counterparty Relationship
(Note 1)
Transaction Details
Financial Statements Accounts Amount Payment Terms
Percentage of
Consolidated Net Revenue
or Total Assets
0 Sinon Corporation Sinon Brazil 1 Sales $ 1,030,453 T/T 180-270 days 6
Sinon China 1 Purchase 890,389 30-60 days 5
Sinon Brazil 1 Account receivable 1,180,882 T/T 180-270 days 8
Sinon Australia 1 Account receivable 172,694 T/T 240 days 1
Note 1: Relationship of counterparty: (1) parent company to subsidiary (2) subsidiary to parent company (3) subsidiary to subsidiary.
Note 2: The criteria of the disclosures above are (a) for the assets and liabilities, at least 1% of the consolidated total assets (b) for the income and expenses, at least 1% of the consolidated gross sales. The significant intercompany accounts and
transactions have been eliminated.

- 64 -
TABLE 7
SINON CORPORATION AND SUBSIDIARIES
INFORMATION ON INVESTEES
FOR THE YEAR ENDED DECEMBER 31, 2016
(In Thousands of New Taiwan Dollar, Unless Stated Otherwise)
Investor Company Investee Company
(Note 2) Location Main Businesses and Products
Original Investment Amount As of December 31, 2016 Net Income
(Loss) of the
Investee
Share of Profit
(Loss)
(Note 1)
Note December 31,
2016
December 31,
2015 Shares
Percentage of
Ownership
Carrying
Amount
Sinon Corporation Sinon Cayman British Cayman Islands Holding company $ 1,205,275 $ 1,109,334 38,100,000 100 $ 1,339,617 $ 23,275 $ 23,275 Subsidiary
Sinon Brazil Alegre, Brazil Manufacture and import and export of medical and
chemical products
510,379 510,379 32,316,471 100 193,466 119,567 119,567 Subsidiary
Syntai Chemicals Taichung, ROC Pharmaceuticals 294,765 294,765 42,200,000 100 397,854 (66,893) (66,893) Subsidiary
Hsing Wei Taichung, ROC Manufacture and sale of cement 525,609 525,609 63,800,000 100 706,146 17,930 17,930 Subsidiary
TFS Taichung, ROC Supermarket 264,793 264,793 26,379,500 88 345,128 71,223 62,698 Subsidiary
Synjia Changhua, ROC Sales of household supplies and plastic products 79,000 79,000 7,900,000 100 75,137 1,601 1,601 Subsidiary
K&S Taichung, ROC Design and sale of software 22,966 22,966 2,439,875 49 33,581 6,007 2,883 Investments
accounted for
by the equity
method
Yumei Yen Changhua, ROC Housewares, Catering Service and retail of
agricultural products
500,317 500,317 20,030,000 100 412,199 9,764 9,764 Subsidiary
Sinon Australia Sydney, Australia Import and export of chemical products 174,548 174,548 6,100,000 100 (35) 5,128 5,128 Subsidiary
Sinon Thailand Bangkok, Thailand Import and export of chemical products 17,109 17,109 20,000 100 (2,768) (8,037) (8,037) Subsidiary
Sinon Indonesia Jakarta, Indonesia Import and export of chemical products 106,555 106,555 3,500,000 100 1,261 (23,106) (23,106) Subsidiary
Sinon USA California, USA Import and export of chemical products 1,689 1,689 50,000 100 1,704 126 126 Subsidiary
Sinon Germany Hamburger, Germany Import and export of chemical products 1,049 1,049 25,000 100 1,831 142 142 Subsidiary
Sinon Trading Taichung, ROC Trading 1,001 1,001 100,000 100 571 269 269 Subsidiary
Sinon Mexico Mexico City, Mexico Import and export of chemical products 135 135 50,000 100 - - - Subsidiary
TFS Feng Nien Taichung, ROC Supermarket 47,271 47,271 1,420,000 100 33,672 3,925 3,925 Indirectly owned
subsidiary
Feng Nien Weightstone Taichung, ROC Food and special crops; Retail sale of tobacco and
alcoholic drinks
30,000 30,000 1,200,000 100 30,314 110 110 Indirectly owned
subsidiary
Hsing Wei DX Taichung, ROC Interior decorating of apartment and office building
and sale of real estate
398,000 381,750 39,800,000 88 398,195 16,327 14,173 Indirectly owned
subsidiary
Yumei Yen Yumei Losse Leaf Tea Changhua, ROC Manufacture and sale of tea - 1,800 - - - (57) (57) Indirectly owned
subsidiary
TAFHT Taichung, ROC Inspection of environment and medication 304 304 30,000 30 353 272 79 Investments
accounted for
by the equity
method
Sinon Cayman Sinon Hong Kong Wanchai, Hong Kong Holding company US$ 34,500 US$ 31,500 - 100 US$ 38,123 US$ 893 US$ 893 Indirectly owned
subsidiary
Sinon Winchester California, USA Orchid planting and sale US$ - US$ 400 - - US$ - US$ 286 US$ 286 Indirectly owned
subsidiary
Synjia Synjia Cayman British Cayman Islands Holding company 78,509 78,509 2,650,000 100 76,265 1,830 1,830 Indirectly owned
subsidiary
Synjia Cayman Synjia Hong Kong Hong Kong Holding company US$ 2,700 US$ 2,700 2,700,000 100 US$ 2,413 US$ 57 US$ 57 Indirectly owned
subsidiary
(Continued)

- 65 -
Investor Company Investee Company
(Note 2) Location Main Businesses and Products
Original Investment Amount As of December 31, 2016 Net Income
(Loss) of the
Investee
Share of Profit
(Loss)
(Note 1)
Note December 31,
2016
December 31,
2015 Shares
Percentage of
Ownership
Carrying
Amount
K&S K3 Systems Sdn. Bhd. Malaysia Software design and information security
maintenance
$ 2,856 $ 2,856 337,500 45 $ 2,831 $ 721 $ 324 Investments
accounted for
by the equity
method
(Concluded)
Note 1: The equity-method investees’ financial statements, which had been used to determine the carrying amount of the Company’s investments, had been audited, except those of Sinon Indonesia, Sinon Thailand, Sinon Germany, Sinon Trading, Sinon Mexico, Feng Nien and TAFHT. The Group
believes that, had those companies’ financial statements been audited, any adjustments would have had no material effect on the Company’s financial statements.
Note 2: Except K&S and TAFHT, significant intercompany accounts and transactions have been eliminated.

- 66 -
TABLE 8
SINON CORPORATION AND SUBSIDIARIES
INFORMATION ON INVESTMENTS IN MAINLAND CHINA
FOR THE YEAR ENDED DECEMBER 31, 2016
(In Thousands of New Taiwan Dollars, Unless Stated Otherwise)
Investee Company Main Businesses and
Products Paid-in Capital Method of Investment
Accumulated
Outward
Remittance for
Investment from
Taiwan as of
January 1, 2014
Remittance of Funds Accumulated
Outward
Remittance for
Investment from
Taiwan as of
December 31, 2016
Net Income (Loss)
of the Investee
% Ownership
of Direct or
Indirect
Investment
Investment
Gain (Loss)
(Note 1)
Carrying Amount
as of December 31,
2016
Accumulated
Repatriation of
Investment Income
as of December 31,
2016
Outward Inward
Sinon Zhongshan Manufacture and sale of
grocery, pesticide and
plastics
$ 33,075
(US$ 1,000)
The investment was made through
a subsidiary incorporated in a
third area which in turn makes
direct investments in companies
in mainland China
$ 25,364
(US$ 700)
$ - $ - $ 25,364
(US$ 700)
$ (7,847) 100%
(Note 2)
$ (7,847) $ (33,473) $ -
Sinon China Manufacture and sale of
various chemicals
271,113
(US$ 8,000)
The investment was made through
a subsidiary incorporated in a
third area which in turn makes
direct investments in companies
in mainland China
271,113
(US$ 8,000)
- - 271,113
(US$ 8,000)
27,292 100% 27,292 485,888 -
Sinon ZhongShan
Servings
Import and export of
chemical products
RMB 500 The investment was made by the
subsidiary located in mainland
China directly
- - - - 5,468 100% 5,468 18,243 -
Poise Packing Import and export of plastic
products
RMB 11,000 The investment was made by the
subsidiary located in mainland
China directly
- - - - (6,580) 100% (6,580) 51,888
Sinon Nantong Manufacture and sale of
various chemicals
815,848
(US$ 26,500)
The investment was made through
a subsidiary incorporated in a
third area which in turn makes
direct investments in companies
in mainland China
719,907
(US$ 23,500)
95,941
(US$ 3,000)
- 815,848
(US$ 26,500)
1,557 100% 1,557 744,689 -
Synjia Zhongshan Manufacture and sale of
grocery, pesticide and
plastics
80,008
(US$ 2,700)
The investment was made through
a subsidiary incorporated in a
third area which in turn makes
direct investments in companies
in mainland China
78,509
(US$ 2,650)
- - 78,509
(US$ 2,650)
1,830 100% 1,830 77,879 -
Fun-Cha Trading Sale of agricultural products RMB 100 The investment was made by the
subsidiary located in mainland
China directly
- - - - (54) 100% (54) - -
Investor Company Accumulated Outward Remittance for Investment
in Mainland China as of December 31 31, 2016
Investment Amounts Authorized by Investment
Commission, MOEA
Upper Limited on the Amount of Investment
Stipulated by Investment Commission, MOEA
The Company $ 1,112,325 US$ 43,200 No limit (Note 3)
Synjia 78,509 US$ 2,700 $80,000 (Note 4)
Note 1: The Group recognized its investment gain (loss) based on the audited financial statements as of and for the year ended December 31, 2016.
Note 2: The ownership of Sinon Cayman and Sinon China was 70% and 30%, respectively.
Note 3: According to the “Regulations for Screening of Application to Engage in Technical Cooperation in Mainland China” issued by the Investment Commission of the Ministry of Economic Affairs on August 29, 2008, there is no limit on the investment in mainland China since Sinon
Corporation had acquired the approval by the Industrial Development Bureau of the company’s establishment of operating headquarters in Taiwan.
Note 4: According to the “Regulations for Screening of Application to Engage in Technical Cooperation in Mainland China” issued by the Investment Commission of the Ministry of Economic Affairs, Synjia belongs to small and medium-sized enterprise, the limit on the investment is NT$80,000
thousand.
Note 5: Significant intercompany accounts and transactions have been eliminated.