Sinking failure of scour protection at wind turbine … Volume 166 Issue EN4 Sinking failure of...
19
Energy Volume 166 Issue EN4 Sinking failure of scour protection at wind turbine foundation Sumer and Nielsen ice I proceedings Proceedings of the Institution of Civil Engineers Energy 166 November 2013 Issue EN4 Pages 170-188 http://dx.doi.org/10.1680/ener.12.00006 Paper 1200006 Received 29/05/2012 Accepted 22/11/2012 Keywords: coastal engineering/granular materials/offshore engineering ICE Publishing: All rights reserved Institution of Civil Engineers publishing Sinking failure of scour protection at wind turbine foundation D B. Mutlu Sumer PhD Professor, Technical University of Denmark, DTU Mekanlk, Section for Fluid Mechanics, Coastal and Maritime Engineering, Lyngby, Denmark B Anders W. Nielsen PhD Former PhD student, Technical University of Denmark, DTU Mekanlk, Section for Fluid Mechanics, Coastal and Maritime Engineering, Lyngby, Denmark; currently Hydraulic Research Engineer, DHI, Horsholm, Denmark This paper summarises the results of an experimental study on scour protection around offshore wind turbine foundations, with special emphasis on the sinking failure of the scour protection work in Horns Rev 1 offshore wind farm (Denmark). The paper reviews previous results obtained by the author (AN), and is organised as follows. Section 2 addresses flow around a pile with a scour protection. Section 3 looks at the initiation of sand motion beneath scour protection. Section 4 discusses sediment motion beneath scour protection and resulting sinking. Section 5 investigates the Horns Rev 1 case. A brief account is also given of filter criteria and their application to the Horns Rev 1 case, whereby the present results and the filter criteria results are linked. Notation D, Dv pile diameter Dh grain size of bed sediment Dc cover-stone size Df filter-stone size e sinking of scour protection ^Tiiax maximum sinking of scour protection g acceleration due to gravity h water depth I hydraulic gradient in horizontal direction / cr critical value of I, corresponding to initiation of sediment motion beneath filter layer KC Keulegan-Carpenter number, Equation 2 k turbulent kinetic energy, k = \(Tt'2 + v'2 + w'2) Nc number of cover layers Nf number of filter layers n{ porosity of filter material P pressure Reg grain Reynolds number based on approach velocity, Reg = UooDhjv s specific gravity of sand grains T wave period tc thickness of cover layer tf thickness of filter layer t/cc, UQ approach current velocity um maximum value of orbital velocity of water particles at bed it stream-wise velocity t t / It , V, W fluctuating components of stream-wise, transverse and vertical components of velocity, respectively -V, V, " coordinate system; see Figure 3 for definition sketch V kinematic viscosity of water (1 sediment mobility defined by Equation 4 Der critical value of fl, corresponding to the initiation of sediment motion beneath filter layer 1. Introduction During the past decade, more and more wind farms have been erected offshore. An ever-increasing number of offshore wind farms (OWFs) will be added to the already existing farms, because offshore wind energy has proven to be one of the key elements in the future renewable energy supply in Northern Europe. Many of these new OWFs will be placed in harsh environments and in order to reduce the costs without compromising the safety it is important to have a detailed understanding of the entire structure, including scour and scour protection around the foundations. Although foundations of offshore wind turbines (OWTs) with no scour protection are considered to be a viable option 170
Transcript of Sinking failure of scour protection at wind turbine … Volume 166 Issue EN4 Sinking failure of...

EnergyVolum e 166 Issue EN4
Sinking failure o f scour protection at w ind turbine foundationSum er and Nielsen
ice I proceedings
Pro ceed in g s of th e Institu tio n o f Civil EngineersEnergy 166 November 2013 Issue EN4Pages 170-188 http://dx.doi.org/10.1680/ener.12.00006Paper 1200006Received 29/05/2012 Accepted 22/11/2012
K eyw ords: coastal engineering/granular materials/offshore engineering
ICE Publishing: All rights reserved
In s titu tio n o f Civil Engineers
publishing
Sinking failure of scour protection at wind turbine foundationD B. Mutlu Sumer PhD
Professor, Technical University o f Denmark, DTU M ekanlk, Section fo r Fluid Mechanics, Coastal and M aritim e Engineering, Lyngby, Denmark
B Anders W. Nielsen PhDFormer PhD student, Technical University o f Denmark, DTU Mekanlk, Section fo r Fluid Mechanics, Coastal and M aritim e Engineering, Lyngby, Denmark; curren tly Hydraulic Research Engineer, DHI, Horsholm, Denmark
This paper summarises the results of an experimental study on scour protection around offshore wind turbine
foundations, w ith special emphasis on the sinking failure of the scour protection work in Horns Rev 1 offshore wind
farm (Denmark). The paper reviews previous results obtained by the author (AN), and is organised as follows. Section 2 addresses flow around a pile w ith a scour protection. Section 3 looks at the initiation of sand motion
beneath scour protection. Section 4 discusses sediment motion beneath scour protection and resulting sinking. Section 5 investigates the Horns Rev 1 case. A brief account is also given of filter criteria and their application to the
Horns Rev 1 case, whereby the present results and the filter criteria results are linked.
NotationD , D v pile diam eterD h grain size o f bed sedimentD c cover-stone sizeD f filter-stone sizee sinking of scour protection
Tiiax m axim um sinking o f scour protection
g acceleration due to gravityh w ater depthI hydraulic gradient in horizontal direction/ cr critical value o f I, corresponding to in itiation of
sediment m otion beneath filter layerK C K eulegan-C arpen ter num ber, E quation 2k turbu len t kinetic energy, k = \(Tt'2 + v' 2 + w'2)N c num ber o f cover layersN f num ber o f filter layersn{ porosity o f filter m aterial
P pressureR eg grain Reynolds num ber based on approach velocity,
R eg = UooDhjvs specific gravity o f sand grainsT wave period
tc thickness o f cover layer
tf thickness o f filter layert/cc, UQ approach current velocity
u m m axim um value of orbital velocity o f w aterparticles a t bed
it stream-wise velocityt t /It , V , W fluctuating com ponents o f stream-wise, transverse
and vertical com ponents o f velocity, respectively-V, V, " coordinate system; see Figure 3 for definition sketchV kinem atic viscosity of w ater(1 sediment m obility defined by E quation 4Der critical value o f f l , corresponding to the initiation
o f sediment m otion beneath filter layer
1. IntroductionD uring the past decade, m ore and m ore w ind farm s have been erected offshore. A n ever-increasing num ber o f offshore wind farm s (OW Fs) will be added to the already existing farms, because offshore w ind energy has proven to be one o f the key elements in the future renewable energy supply in N orthern Europe. M any o f these new O W Fs will be placed in harsh environm ents and in order to reduce the costs w ithout com prom ising the safety it is im portan t to have a detailed understanding o f the entire structure, including scour and scour protection a round the foundations.
A lthough foundations o f offshore w ind turbines (OW Ts) w ith no scour protection are considered to be a viable option
170

EnergyVolum e 166 Issue EN4
Pile
Cover layer, t,:Filter layer, ft
Seabed
Figure 1. Definition sketch. Scour protection around foundation of offshore wind turbine
(W ittrup, 2012), a large percentage of O W T foundations are alm ost invariably designed to have scour protection. R ock/ stone dum ping is one of the m ethods widely used for scour protection, in w hich a stone cover is installed a round the pile (with or w ithout a filter layer between the seabed and the stone layer), extending over an area o f three to four times the pile diam eter, Figure 1.
As a consequence of the lessons learned from the first OW Fs, a substantial am ount o f research on scour and scour protection has accum ulated in recent years. Several studies have reported seabed measurements from the installed O W Fs, see Flansen et al. (2007), Raaijmakers et al. (2007) and W hitehouse et al. (2011a, 2011b). The first two comprise data from specific wind farms (Florns Rev 1 and Egm ond aan Zee, respectively). W hitehouse et al. (2011a) compiled data from several farms, w ith and w ithout scour protection, whereas W hitehouse et al. (2 0 1 1 b) provide a review o f the experience w ith gravity-based foundations, both prototype and model scale. O ther studies have focused on prediction of the scour development, including Nielsen and Flansen (2007), Raaijmakers and R udolph (2008a, 2008b), Flarris et al. (2010), Nielsen et al. (2012) and Sumer et al. (2013) am ong others. A third group o f studies have reported results from physical model tests w ith scour protections around the monopile foundations: Chiew (1995, 2002) and Chiew and Lini (2 0 0 0 ) studied the stability o f scour protection under current conditions, whereas de Vos et al. (2011, 2012) studied the stability o f scour protections around a monopile under offshore conditions.
One o f the first larger O W Fs is the Florns Rev I installed at relatively shallow w ater (6-5-13 m) about 14 km off the D anish west coast in the N o rth Sea, consisting o f 80 OW Ts, supported by 4-2 m diam eter m onopiles. This area is exposed to tidal currents and large waves from the N o rth Sea. The wind farm was installed in the sum m er o f 2002. A control survey in 2005 showed tha t the scour protections adjacent to the m onopiles sank up to 1-5 m , ano ther im portan t failure m ode of scour protection different from tha t studied by Chiew (1995, 2002), Chiew and Lini (2000) and de Vos et al. (2011, 2012). The dam aged protection w ork has been subsequently repaired, and no significant sinking has been reported
Sinking failure o f scour protection atw ind turbine foundationSumer and Nielsen
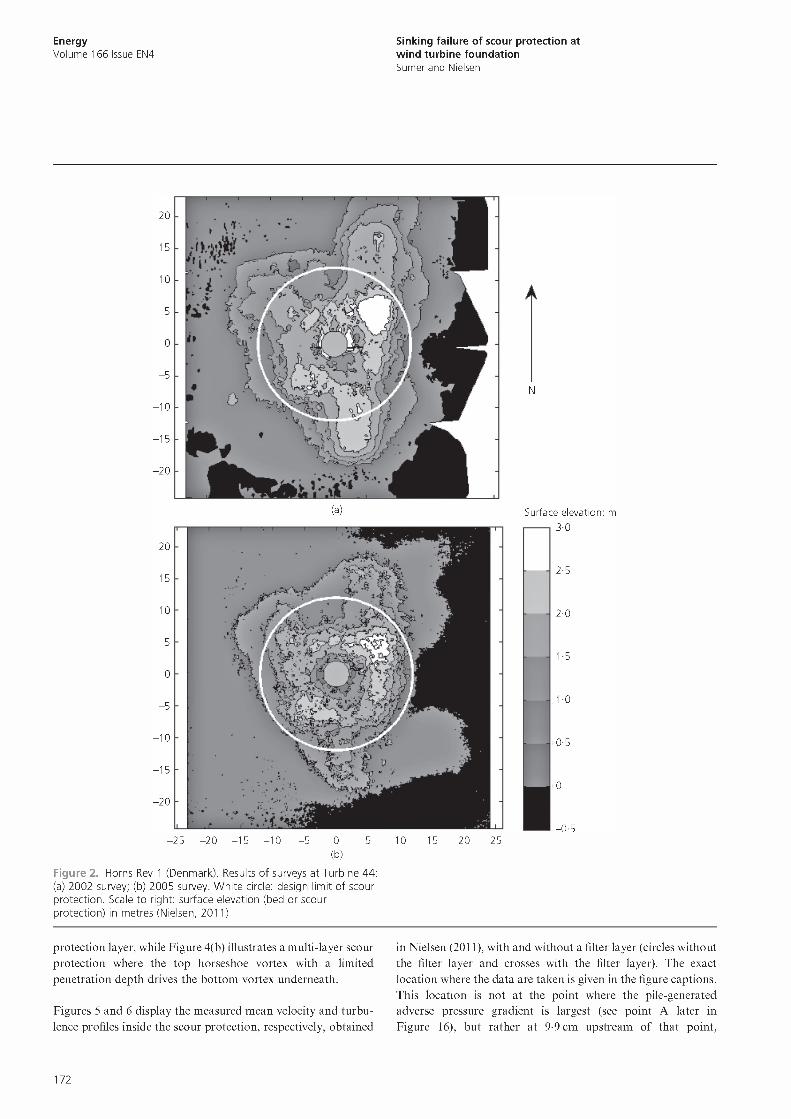
after the repair. A n example o f the survey results can be seen in Figure 2. Flansen et al. (2007) report tha t the 50-year-return- period tidal current velocity is 0-88 m/s. The same au thors also report th a t the following set o f wave param eters represents a typical storm situation at this locality: significant wave height, H = 3-5 in; peak wave period, T = 10 s; and w ater depth, h = 10 m. Im portan t features o f the scour protection as well as the sand size a t H orns Rev 1 are given later in Tables 3 and 6 , while Figure 2 illustrates the p lan view dimensions.
The above-m entioned incident prom pted the present research, w ith the focus on obtaining an understanding o f the m echanisms governing the sinking of scour p rotection of O W T foun dations. The present research, a P hD project (Nielsen, 2011), is one o f the research projects undertaken as part o f the program m e ‘Seabed and wind farm in teraction’ (h ttp ://sbw i. dhigroup.com /), a 4-year (2008-2012) research program m e financed by D anish Strategic Research (D SF), and coordinated by the first author.
The present paper essentially provides a review o f Nielsen (2011) (also reported in Nielsen et al., 2011), highlighting the key results. The paper further includes a detailed com parison between the results o f N ielsen (2011) and the observed sinking at H orns Rev I O W F, and often-used design criteria for scour protections (de G raauw et al., 1984).
2. Flow around a pile w ith scour protectionO bservations show (Nielsen, 2011; Nielsen et al., 2011) tha t w hen a pile w ith a scour protection a t the bo ttom is placed on a bed, three m ajor changes will occur, as follows.
(a) A horseshoe vortex will be form ed in front o f the pile, w hich penetrates into the scour protection (Figure 3); an accom panying, small horseshoe vortex also will be form ed in front o f the scour protection, as sketched in Figure 3.
(b) A lee-wake vortex flow will be form ed behind the pile (Figure 3).
(c) The flow will contract in p lan view a t the sides o f the pile.
Each flow feature will now be considered individually.
2.1 Horseshoe vortex flowThe horseshoe vortex, the key elem ent in scour a round piles, is caused by the adverse pressure gradient owing to the presence of the pile (Sumer and Fredsoe, 2002). Flow visualisation and flow m easurem ents (using laser doppler anem om etry (LD A )) m ade inside the scour protection (including several m ulti-layer cases) in Nielsen (2011; also reported in N ielsen et al., 2011) indicate the flow picture, as illustrated in Figure 4.
Figure 4(a) illustrates a tw o-layer scour protection where the horseshoe vortex penetrates across the entire thickness o f the
171
EnergyVolum e 166 Issue EN4
Sinking failure o f scour protection atw ind turbine foundationSumer and Nielsen
Surface e leva tion : m
- 2 5 - 2 0 - 1 5 - 1 0 - 5 0 5 10 15 2 0 25
(b)
Figure 2. Horns Rev 1 (Denmark). Results of surveys a t Turbine 44: (a) 2002 survey; (b) 2005 survey. White circle: design limit of scour protection. Scale to right: surface elevation (bed or scour protection) In metres (Nielsen, 2011)
protection layer, while Figure 4(b) illustrates a m ulti-layer scour protection where the top horseshoe vortex w ith a limited penetration depth drives the bo ttom vortex underneath.
Figures 5 and 6 display the m easured m ean velocity and tu rb u lence profiles inside the scour protection, respectively, obtained
in Nielsen (2011), w ith and w ithout a filter layer (circles w ithout the filter layer and crosses w ith the filter layer). The exact location where the data are taken is given in the figure captions. This location is no t a t the poin t where the pile-generated adverse pressure gradient is largest (see point A later in Figure 16), bu t ra ther a t 9-9 cm upstream o f th a t point,
172

EnergyVolume 166 Issue EN4
Sinking failure o f scour protection atw ind turbine foundationSumer and Nielsen
A p p ro a chf lo w
Downflow
Separa tion
Lee-wake ^ v o r t ice s
H orseshoe vo rte x
Separa tion line
Figure 3. Schematic description (Nielsen eta l., 2011)
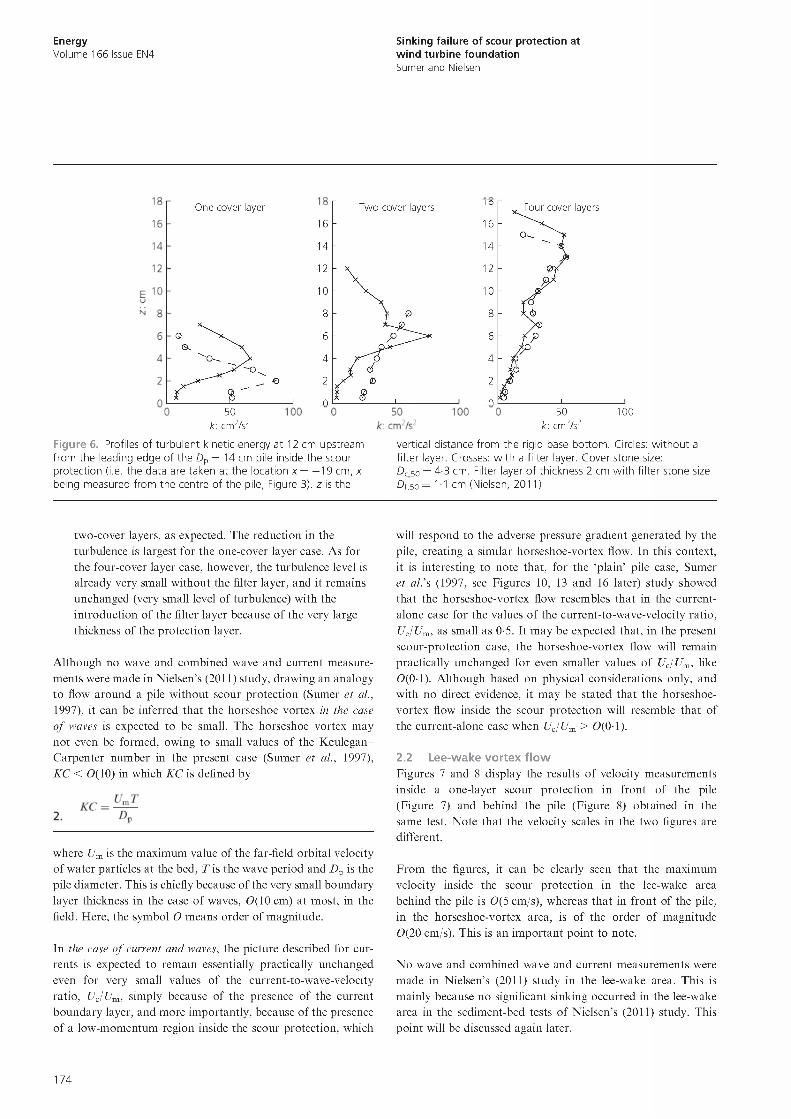
corresponding to x = —19 cm. The pile-generated adverse pressure gradient and its m axim um value will be discussed in detail in Section 6.2. The current velocity in these tests was 40 cm/s and the flow depth was 30 cm for one- and two-cover layer cases, and 45 cm for four-cover layer cases (Nielsen, 2011: p. 51). The quantity u is the m ean stream wise velocity, and k is the turbulent kinetic energy, defined by
1 . k = \{u '2 + v'2 + w'2)
in which u'2 is the m ean-square value o f the fluctuating com ponent o f u, and so on. The role o f the filter layer is described as follows.
Pile Pile
(a) (b)
Figure 4. Schematic illustration of flow inside the scour protection (Nielsen eta l., 2011)
(<a) In the case o f the one-cover layer, the m ean velocity profile in the flow-reversal region is displaced upw ard with the in troduction o f the filter, and the near-bed velocity is reduced (Figure 5). (The reverse flow here is essentially the upstream -directed flow o f the horseshoe vortex inside the scour protection; see the illustration in Figure 4(a).)
(b) In the case o f two- and four-cover layers, the role o f the filter layer is no t as described above. By contrast, the upstream -directed flow o f the horseshoe vortex is ra ther weak in the case o f the two-cover layer w ithout the filter, and it essentially changes direction in the case o f the four-cover layer (see the illustration in Figure 4(b) for the latter). The near-bed m ean flow actually rem ains practically unchanged when the filter layer is in troduced (Figure 5), simply because the thickness o f the cover layer in these two cases is too large.
(c) R egarding the turbulent-kinetic-energy profiles, Figure 6
clearly shows th a t the turbulence is reduced quite considerably near the base bo ttom (Figure 6 ) for one- and
81O ne cover layer
16
14
12
10
8
6
4
2
00 20 40
18T w o cover layers
16
14
12
10
8
6
4
2
00 20 40
u: cm /s
Figure 5. Mean velocity profiles at 12 cm upstream from the leading edge of the Dp = 14 cm pile inside the scour protection (i.e. the data are taken at the location x = - 1 9 cm, x being measured from the centre of the pile, Figure 3). z is the vertical
u: cm /s
18Four cover layers
16
14
12
10
8
6
4
2
00 20 40
u: cm /s
distance from the rigid base bottom. Circles: w ithout a filter layer. Crosses: with a filter layer. Cover stone size: Dc 50 = 4-3 cm. Filter layer of thickness 2 cm with filter stone size Dff50 = 1 -1 cm (Nielsen, 2011)
173
EnergyVolum e 166 Issue EN4
Sinking failure o f scour protection atw ind turbine foundationSumer and Nielsen
One cover layer16
14
12
10
8
Two cover layers
50 100k: cm2/s2
50 k: cm2/s2
Four cover layers
Figure 6. Profiles of turbulent kinetic energy a t 12 cm upstream from the leading edge of the Dp = 14 cm pile Inside the scour protection (I.e. the data are taken at the location x = — 19 cm, x being measured from the centre of the pile, Figure 3). z Is the
vertical distance from the rigid base bottom. Circles: without a filter layer. Crosses: with a filter layer. Cover stone size:Dc so = 4-3 cm. Filter layer of thickness 2 cm with filter stone size Df.so = 1 -1 cm (Nielsen, 2011)
tw o-cover layers, as expected. The reduction in the turbulence is largest for the one-cover layer case. As for the four-cover layer case, however, the turbulence level is already very small w ithout the filter layer, and it rem ains unchanged (very small level o f turbulence) w ith the in troduction o f the filter layer because o f the very large thickness of the protection layer.
A lthough no wave and com bined wave and current m easurem ents were m ade in N ielsen’s (2011) study, draw ing an analogy to flow around a pile w ithout scour protection (Sumer et al., 1997), it can be inferred tha t the horseshoe vortex in the case o f waves is expected to be small. The horseshoe vortex m ay no t even be form ed, owing to small values o f the K eulegan- C arpenter num ber in the present case (Sum er et al., 1997), K C < 0(10) in w hich K C is defined by
where Um is the m axim um value of the far-field orbital velocity o f w ater particles a t the bed, T is the wave period and D v is the pile diam eter. This is chiefly because o f the very small boundary layer thickness in the case o f waves, 0 ( 1 0 cm) a t m ost, in the field. H ere, the symbol O m eans order o f m agnitude.
In the case o f current and waves, the picture described for currents is expected to rem ain essentially practically unchanged even for very small values o f the current-to-w ave-velocity ratio , U JU nl, simply because of the presence of the current boundary layer, and m ore im portantly , because o f the presence o f a low -m om entum region inside the scour protection, which
will respond to the adverse pressure gradient generated by the pile, creating a similar horseshoe-vortex flow. In this context, it is interesting to note that, for the ‘p lain’ pile case, Sumer et al.’s (1997, see Figures 10, 13 and 16 later) study showed th a t the horseshoe-vortex flow resembles th a t in the current- alone case for the values o f the current-to-w ave-velocity ratio , U JU nl, as small as 0-5. It m ay be expected that, in the present scour-protection case, the horseshoe-vortex flow will rem ain practically unchanged fo r even sm aller values o f U JU nl, like 0(0-1). A lthough based on physical considerations only, and w ith no direct evidence, it m ay be stated th a t the horseshoe- vortex flow inside the scour protection will resemble th a t of the current-alone case w hen Uc/U nl > 0(0-1).
2.2 Lee-wake vortex flowFigures 7 and 8 display the results o f velocity m easurem ents inside a one-layer scour protection in front o f the pile (Figure 7) and behind the pile (Figure 8 ) obtained in the same test. N ote th a t the velocity scales in the two figures are different.
F rom the figures, it can be clearly seen th a t the m axim um velocity inside the scour protection in the lee-wake area behind the pile is 0 (5 cm/s), whereas th a t in front o f the pile, in the horseshoe-vortex area, is o f the order o f m agnitude 0(20 cm/s). This is an im portan t poin t to note.
N o wave and com bined wave and current m easurem ents were m ade in N ielsen’s (2011) study in the lee-wake area. This is m ainly because no significant sinking occurred in the lee-wake area in the sedim ent-bed tests o f N ielsen’s (2011) study. This point will be discussed again later.
174

EnergyVolum e 166 Issue EN4
Sinking failure o f scour protection atw ind turbine foundationSumer and Nielsen
Scour p ro te c tio n
30
4 0 cm /s25
20
Pile
15
10
5
Scour p ro te c tio n
- 6 0 - 5 0 - 4 0 - 3 0 - 2 0 10 0
x : cm
Figure 7. Velocity profiles Inside a one-layer scour protection with stones sized 4-3 cm In front of the pile. Note the velocity scale top right (Nielsen e t al., 2011)
2.3 Side flowThe flow tow ards the side o f the pile takes place in a convergent geometry. This convergent geom etry creates a large, ‘favourable’ pressure gradient over the pile surface a t the sides, w ith the contraction o f streamlines, com bined w ith the presence of
Scour p ro te c tio n
30r
25
20
15
0 cm /s
Pile
- > - >
Scourp ro te c tio n
0 10 20 30 4 0 50
Figure 8. Velocity profiles Inside a one-layer scour protection with stones sized 4-3 cm behind the pile. Note the velocity scale top left (Nielsen e t al., 2011)
the horseshoe-vortex flow, resulting in concentration of flow near the pile. To illustrate the latter, two figures borrow ed from Sumer et al. (1997) are included in Figures 9 and 10 where the am plification o f the bed shear stress a round a circular ‘p lain’ pile is given in the form o f a con tour plot, w ith a very b road range of the K eulegan-C arpenter num ber, K C = 2-8 to 20-1 in Figure 9, and w ith KC = oo, the current case, in Figure 10.
F rom the figures, the following can be noted. First, a lthough the undisturbed bed shear stress is amplified by as m uch as a factor of 5 in the horseshoe vortex area in the current case (Figure 10), this am plification is even higher, as m uch as 11, a t a round 45° from the stagnation poin t (Figure 10). This point will be addressed again later. This area is associated w ith the com bined effect o f contraction o f streamlines and the horseshoe vortex where the swirling horseshoe vortex a round the pile eventually trails o ff dow nstream . Second, the am plification o f the bed shear stress in the lee-wake area in the current case is fairly small (Figure 10), consistent w ith the result discussed in conjunction w ith Figures 7 and 8 . T hird, the amplification o f the bed shear stress in the case o f waves (Figure 9) is generally substantially smaller than th a t in the case o f current (Figure 10).
3. Initiation of sand m otion beneath scour protection
Consider a scour p rotection consisting o f arm our stones over a sand bed w ith filter stones between the arm our cover and the
175

Energy Sinking failure o f scour protection atVolume 166 Issue EN4 wind turbine foundation
Sumer and Nielsen
Q
00-5
0-5
1-0
1-5■1-5 -1 -0 -0 -5 0 0-5 1-0 1-5
i
Q
Q
x/D(a)
0
4-5
0-50-5
1-0
1-5■1-5 -1 -0 -0 -5 0 0-5 1-0 1-5
x/D(b)
0
0-5
1-0
1-5■1-5 -1 -0 -0 -5 0 0-5 1-0 1-5
x/D(c)
0
0-5
1-0
1-5■1-5 -1 -0 -0 -5 0 0-5 1-0 1-5
x/D(d)
Figure 9. Amplification of the bed shear stress around a circular,'plain' pile. Waves, KC= 2-8 to 20-1 (Sumer e t al., 1997): (a) KC = 2-8; (b) K C = 6 -1 ; (c) KC = 10-3; (d) K C = 2 0 -1 . Copyright Cambridge University Press
sand bed. Increase the flow velocity. W hen the velocity reaches a certain point, the sand particles beneath the filter stones begin to move, the so-called in itiation o f m otion, similar to the notion o f in itiation o f m otion in sediment transport. F rom Figure 10, it
m ay be inferred th a t the in itiation o f m otion first begins a t the sides, possibly a t around 45°, and in fron t o f the pile.
Nielsen (2011) m ade an extensive series o f experiments where the in itiation o f m otion o f small plastic particles (with very small specific gravities) introduced onto the base bo ttom was observed through the glass bo ttom o f the experim ental flume, using a large-scale set-up. This was done a t the areas where the bed shear stress is largest in fron t o f the pile. It is im portan t to note th a t no sediment layer was present in these experiments; the scour protection (with or w ithout the filter layer) was placed on the rigid, glass bo ttom o f the flume. The test conditions in N ielsen’s experiments will be given later in the section.
N ow, on dim ensional grounds, the in itiation o f m otion o f the base sand in the field can be described by the following non- dim ensional param eters
3.(lCI= f [ R e g, N c, N {, ^ , ^
in which i l cr is the critical value o f the m obility param eter Í 1 , corresponding to the in itiation o f m otion o f the sediment beneath the scour protection in which Í1 is defined by
4.i l = -
U i 1-Dr « f
g(s - 1 )Dh D p 1 1 - n r
In E quation 3, R eg is the grain Reynolds num ber corresponding to the bed sediment
5. R e g =UooDu
in which Uoo is the approach flow velocity, D b is the bed sedim ent size and v is the kinem atic viscosity o f water. The quantity N c in E quation 3 is the num ber o f arm our stones (cover) layers, defined by
6 . N c = l tc D c
Nr is the num ber o f filter layers, defined by
7.JVf = —f
in which tc and tr are the thickness o f the arm our (cover) layer, and th a t o f the filter layer, respectively, D c is the arm our (cover) stone size, D f is the filter stone size, while D p is the pile size. In E quation 4, s is the specific gravity o f sediment grains, g is the acceleration due to gravity and «f is the porosity o f the filter (appearing in E quation 4 in the form o f «f/( 1 — wf); see the next parag raph for the physical m eaning o f the latter quantity).
176

EnergyVolume 166 Issue EN4
Sinking failure o f scour protection atw ind turbine foundationSumer and Nielsen
Flow
0-5
1 1
- 1-0 -0-5
Figure 10. Amplification of the bed shear stress around a circular, 'plain' pile. Current, K C = oo (Sumer et al., 1997)
0
x/D0-5 1-0
It should be noted th a t the flow through the scour protection (arm our and filter layers) occurs in the tu rbu len t regime, and therefore the Reynolds num ber associated w ith this flow is no t included in the above non-dim ensional form ulation. The large- and medium-scale experiments conducted in N ielsen’s (2 0 1 1 ) study satisfy the latter condition, w ith even the smallest filter stone size being D f > 1 cm. W ith the latter filter stone size, considering the velocity in the pores as being like O (1 cm/s), the grain Reynolds num ber will be larger than 0(100) in N ielsen’s experiments. This Re num ber is large com pared w ith Recr = 20, the critical Re num ber below which the flow around a sphere occurs in the so-called creeping flow regime. (The authors note th a t the corresponding field Reynolds num bers are evidently an order o f m agnitude larger than tha t experienced in the laboratory .) Considering also th a t filter stones will, for the m ost part, have sharp-edged shapes, it m ay be concluded th a t the role o f the Reynolds num ber associated with the flow around individual m em bers o f stone protection (for bo th the filter layer and the cover layer) will no t be very significant, and therefore can be om itted.
The mobility num ber in E quation 4, Í2, is an extended version of the familiar Shields param eter; the friction velocity in the Shields param eter is replaced by the approach velocity for convenience. Also, the product Df«f/(1 — nf) represents the ‘void ra tio ’ associated w ith the filter stone size; the larger the value o f this quantity, the m ore susceptible the base sediment to the incipient motion. Likewise, the non-dimensional quantity form ed by Uoo, g and Dp in Equation 4, namely (Ul0/g)/D v>, represents the adverse pressure gradient in front o f the pile, or the pressure gradient over the surface o f the pile discussed previously in Section 2 above, the agitating force; the larger the value o f this quantity, the larger the mobility o f the base sediment.
The grain Reynolds num ber, R eg, in E quation 3 is involved because the in itiation o f m otion is also governed by this quantity , reflecting the degree o f the em bedm ent o f the sand
grains in the viscous sublayer, in the same way as in the fam iliar Shields diagram o f the in itiation o f m otion a t the bed.
The num ber o f arm our layers, N c, and th a t o f filter layers, Nf, should also be involved because these quantities along w ith their corresponding stone sizes, D c/D p and Df/Dp, are central in the penetration o f the horseshoe-vortex flow and the side flow inside the scour protection. H ere the cover/arm our stone size and the filter stone size are norm alised by the pile diam eter.
Figure 11 displays the initiation-of-m otion data extracted from Nielsen (2011). The data presented in Figure 11 are selected from N ielsen’s (2011) overall da ta such th a t the values o f the non-dim ensional param eters th a t govern the in itiation of m otion m atch with (or close to) those in the field, w ith N c = 2, N f= 9, D c/D p = 0-08 to 0-09 and Df/Dp = 0-02, corresponding to the selected set o f da ta (see legend o f Figure 11). (This po in t will be revisited later in conjunction w ith the check for sand m otion beneath scour protection in the H orns Rev 1 case.) The test conditions (Nielsen, 2011) for the data p lo tted in Figure 11 are sum m arised in Table 1. It is noted th a t experim enting w ith the pile, the size D = l m (see the last row in Table 1) will be a t the expense o f a blockage effect, as the pile diam eter in this case is no t small. F rom the potential flow theory, this blockage effect is estim ated to be less than 7% , m eaning tha t the velocities in this experiment will be increased slightly, by a small am ount, similar to the latter figure. W hen inspected closely, no clear trend is observed, however, o f any blockage effect in Figure 11, and, if anything, it seems tha t this effect is overshadowed by the scatter in the data.
The large scatter in Figure 11 is due to the random orientation o f the pores in the scour protection and the random position of the location on the bo ttom where the particle was released. (By the random position, it is m eant th a t the particle release position in the pore is random w ith respect to the pore geometry.) Nevertheless, the data exhibit a fairly well-defined trend.
177

EnergyVolume 166 Issue EN4
Sinking failure o f scour protection atwind turbine foundationSumer and Nielsen
a
10-
Sym bol A/f Dc/Dp0 -080 -080-09
Df/Dp0-020-020-02
M o tio n
o o0 0 0 yko<%>
o*
No m o tio n
J .....................I J .....................I102 103
. D A
Figure 11 Initiation of motion of sand beneath scour protection around foundation of offshore wind turbine. Current. Data extracted from Nielsen (2011) such tha t the values of the non- dimensional parameters governing the initiation of motion (see the legend in the figure) match with (or close to) those in a typical application to offshore wind farms
move or not, as will be dem onstrated later for the case o f H orns Rev 1.
The range o f the param eters used in Figure 11 is given in the figure legend for N c, Nf, Dc/D p, and D f/D p. The range o f R eg, on the other hand, is R eg = 80 to 550. Clearly, caution m ust be observed when using the given diagram outside the indicated range o f the param eters. F o r the test conditions corresponding to the actual tests, the reader is referred to Table 1.
3.1 Discussion of other parameters influencing the initiation of motion
There are other param eters which can influence the in itiation o f m otion. The w ater depth is one potential param eter when considering very shallow waters. This is because the horseshoe vortex is influenced by this param eter. Unless the water- depth-to-pile-diam eter ratio , h/D p, is smaller than 0(4), the effect o f this param eter will not, however, be significant (Sumer and Fredsoe, 2002: Figure 3.4). The latter publication shows th a t the size o f the horseshoe vortex decreases w ith decreasing h/D p, m eaning th a t the m obility o f sand grains decreases w ith decreasing h/D p. I t m ay be noted, however, th a t the reduction in the size o f the horseshoe vortex is only 2 0 % even w ith a w ater-depth-to-pile-diam eter ratio as small as h/D p = 1 (Sumer and Fredsoe, 2002: Figure 3.4). Therefore, although neglecting the influence o f the w ater depth will be slightly on the conservative side, this effect m ay be ignored for all practical purposes.
According to this trend, the critical mobility num ber decreases with increasing Reg. This is no t unexpected. The critical value o f the mobility num ber decreases because the particles beneath the filter layer are m ore and m ore exposed as Reg increases, and therefore they will be more susceptible to the agitation of the flow.
The area above the trend in Figure 11 corresponds to the ‘m otion ’ regime, and th a t below corresponds to the ‘no-m otion’ regime. The diagram in Figure 11 can be used as a first screening to check w hether the sand beneath the scour protection can
A nother param eter is the effect o f waves. In the case o f waves alone, the in itiation o f m otion will be m uch delayed because the agitating flow features such as the horseshoe vortex and the concentration o f flow at the sides are significantly smaller than in the case o f currents. (Recall the discussion in Section 2 in conjunction w ith waves; see Figures 9 and 10.) Therefore, the wave-alone case is insignificant, as far as the in itiation o f m otion is concerned. It m ust be pointed out, however, th a t the effect o f steady streaming, which m ay be induced by waves similar to Sumer and Fredsoe (2001), is unknow n.
Symbols in Figure 11
Pilediam.,
DP:m
Cover s tone size, Dc: cm
Cover layer thickness, fc = Nc Dc: cm
Filter s tone size, Df: cm
Filter layer th ickness, it = Nf Df: cm
A pproachvelocity,Uoo'.cm/s
Bed sed im en t size, Db: mm
Specific gravity of bed sed im ent, 5
O 0-55 4-3 00 cr> 1-1 10 1 6 -5 -28-4 0 -4 9 -0 -8 5 1-045• 0-55 4-3 00 cr> 1-1 10 44 -2 -5 2 -9 0-62 1-310o 1 0 9-0 1 8 0 2-3 20 18-5 -25-7 0 -4 4 -2 -4 5 1-045
Table 1. Test conditions co rresponding to th e laboratory da ta plo tted in Figure 11 . W a te r d e p th w a s h = 0-9 m, and th e f lume w id th w a s 3-0 m (Nielsen, 2011)
178

Energy Sinking failure o f scour protection atVolume 166 Issue EN4 wind turbine foundation
Sumer and Nielsen
The effect o f waves, when superimposed on a current, will be similar to the case o f waves alone when the current-to-w ave-velocity ra tio is very small, like Uc/U m < 0(0-1); see the discussion in Section 2.1. Otherwise, the effect o f a wave will probably be to increase the agitation owing to the phase-resolved com ponent o f the wave. Hence it is expected th a t the in itiation of sand m otion a t the base bo ttom will start earlier than in the current-alone case. In the absence o f data, therefore, caution should be observed when checking the in itiation o f the m otion based on the current-alone data.
4. Sand m otion beneath scour protection and resulting sinking
W hen the mobility num ber is larger than the critical value (Figure 11), Í1 > i l cr, the sand will begin to move. The mechanism o f sediment m otion involves the flow inside the scour protection discussed in Section 2. The sediment is stirred up by the mean and turbulence com ponents o f the flow (Figures 5 and 6 ), and rem oved off the bed, and the m ean com ponent o f the flow inside the scour protection (Figures 4 and 5) will carry the sedim ent away. The end result is the sinking o f the entire scour protection, as discussed in Section 1. In the presence o f waves in a combined current and wave environment, the phase-resolved com ponent o f the flow inside the scour protection will help further agitate the sand on the bed. The mechanism o f sediment m otion and the resulting sinking, however, will largely be unaffected.
As in the case o f the in itiation o f m otion, the sinking is, for the m ost part, expected to take place m ore strongly in fron t o f the pile and at the sides. See the discussion in the preceding section.
Let <?max be the m axim um equilibrium sinking o f the scour protection. On dim ensional grounds, this quantity is described by the following non-dim ensional param eters
8 .
in which £max is norm alised by the arm our stone size, D c.
Nielsen (2011) carried ou t extensive experiments w ith a sand bed with scour protection, where he m easured the sinking of the scour protection. He did two kinds o f experiments, as follows.
(a) Experim ents were conducted w ithout filter stones where the current was strong enough to cause sediment m otion underneath the scour protection and therefore sinking of the protection layer.
(b) H e repeated these experiments in a limited num ber of tests where filter stones also were used. O f the six tests conducted w ith filter stones, three tests had a cover stone size o f D c/D p = 0-4 to 0-5, too large a value to represent a
typical field situation. Therefore, these three tests will no t be considered in the present analysis.
Incidentally, N ielsen (2011: p. 14) reports that, in his sediment bed experiments, the sinking took place in fron t o f and along the sides o f the pile adjacent to the scour protection. This is obviously no t unexpected, and it is consistent w ith the discussion in the preceding paragraphs.
Figure 12 presents da ta from N ielsen’s (2011) experiments, p lo tted according to the non-dim ensional form ulation given in E quation 8 . The set o f da ta p lo tted in Figure 12 is selected so
Symbol Nc A/f Dc/Dp Df/Dp Q Reg
□ 1 1-4 0-09 0-06 2-7 72▼ 1 2-9 0-21 0-095 4-3 72▲ 1 2-3 0-21 0-06 2-7 72
Dc/Dp = 0-09
0-2 0-3
— = A/f — Dp Dp
(a)
0-4 0-5 0-6
5
4
3
Q
2
1
00 0-1 0-2 0-3 0-4 0-5 0-6
-5- = A/f —Dp Dp
(b)
Figure 12. Maximum sinking of scour protection. The origin of the horizontal axis, ff/Dp = 0, corresponds to the no-filter case. The filter-case symbols (see the legends) are also used for the nofilter case as well, for convenience. Data extracted from Nielsen's (2011) data; data for t f/Dp = 0 are taken according to the best-fit line through the data
179
EnergyVolume 166 Issue EN4
Sinking failure o f scour protection atwind turbine foundationSumer and Nielsen
th a t the test conditions are closest to typical conditions encountered in OW Fs; the order o f m agnitude values o f typical conditions in the field m ay be sum m arised as N c = 0(2), N { = 0(10), Dc/D p = 0(0-1), and D f/D p = 0(0-01). The test conditions corresponding to the da ta p lo tted in Figure 12 are given in Table 2. It is noted th a t Nielsen (2011) (also reported in N ielsen et al., 2011: Figure 11) gives the entire set o f da ta for the no-filter experiments, p lo tted in the form of emax/A: against D p/D c, w ith N c taking the values o f 1, 2 and 3.
Figure 12 illustrates very clearly the role o f the filter used in scour protection. The figure shows th a t the sinking o f scour p ro tection w ith an arm our cover w ith D c/D p = 0-09 is drastically reduced from emax/D c = 4*5 to 1-5 by introducing filter stones w ith tf/Dp = 0-1. Likewise, the sinking in the case o f D c/D p = 0 * 2 1 is even m ore dram atically reduced from emax/D = 3 to abou t 0*2 by introducing filter stones w ith tf/Dp = 0*2. Clearly, the latter results are linked to the reduction o f the agitating forces w ith the in troduction o f the filter stones, as discussed in Section 2 (see Figures 5 and 6 ).
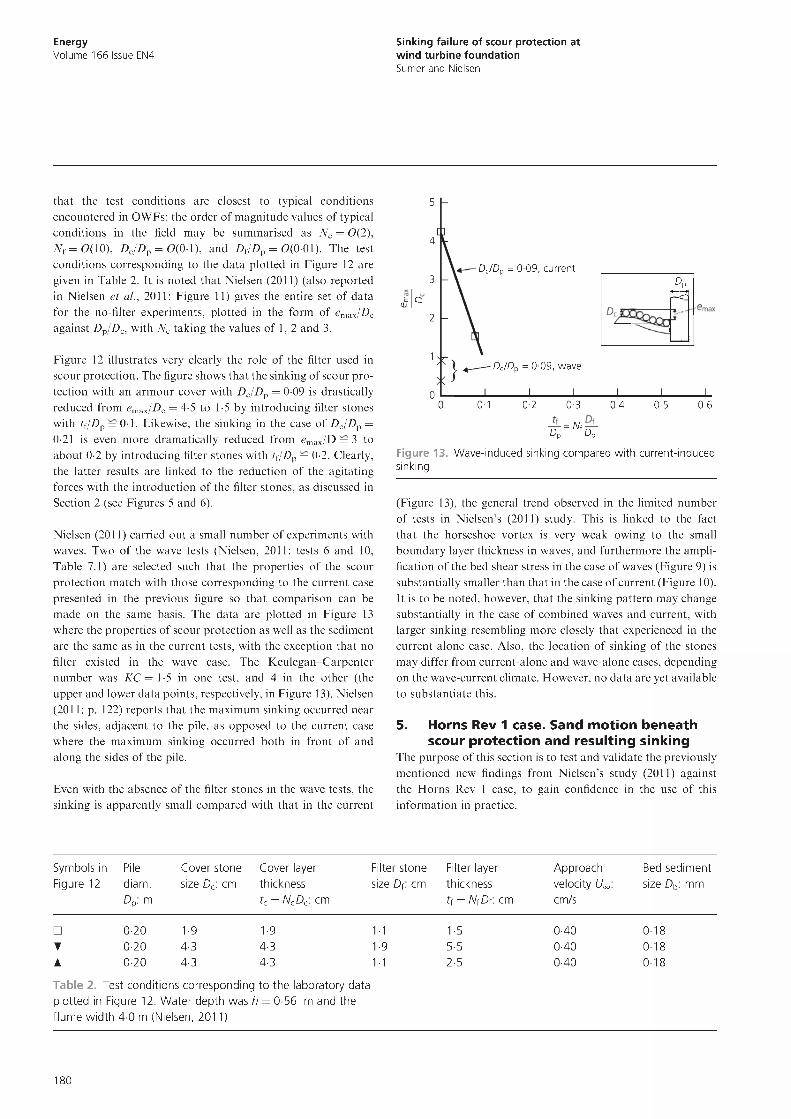
Nielsen (2011) carried ou t a small num ber o f experiments w ith waves. Two o f the wave tests (Nielsen, 2011: tests 6 and 10, Table 7.1) are selected such th a t the properties o f the scour p rotection m atch with those corresponding to the current case presented in the previous figure so th a t com parison can be m ade on the same basis. The data are p lo tted in Figure 13 where the properties o f scour p rotection as well as the sediment are the same as in the current tests, w ith the exception th a t no filter existed in the wave case. The K eulegan-C arpenter num ber was K C = 1-5 in one test, and 4 in the other (the upper and lower data points, respectively, in Figure 13). Nielsen (2 0 1 1 : p. 1 2 2 ) reports th a t the m axim um sinking occurred near the sides, adjacent to the pile, as opposed to the current case where the m axim um sinking occurred bo th in fron t o f and along the sides o f the pile.
Even with the absence o f the filter stones in the wave tests, the sinking is apparently small com pared w ith th a t in the current
nE Q
D c/D p = 0 -09 , c u rre n tDp
p a
D c/D p = 0 -09 , w ave
I________ I________ I________ I________ I________ L0 0-1 0-2 0-3 0-4 0-5 0-6
— = A/f—Dp Dp
Figure 13. Wave-induced sinking compared with current-induced sinking
(Figure 13), the general trend observed in the lim ited num ber o f tests in N ielsen’s (2011) study. This is linked to the fact th a t the horseshoe vortex is very weak owing to the small boundary layer thickness in waves, and furtherm ore the am plification o f the bed shear stress in the case o f waves (Figure 9) is substantially smaller than th a t in the case o f current (Figure 10). It is to be noted, however, th a t the sinking pattern m ay change substantially in the case o f com bined waves and current, w ith larger sinking resembling m ore closely th a t experienced in the current-alone case. Also, the location o f sinking o f the stones m ay differ from current-alone and w ave-alone cases, depending on the w ave-current climate. However, no data are yet available to substantiate this.
5. Horns Rev 1 case. Sand m otion beneath scour protection and resulting sinking
The purpose o f this section is to test and validate the previously m entioned new findings from N ielsen’s study (2011) against the H orns Rev 1 case, to gain confidence in the use o f this inform ation in practice.
Symbols in Figure 12
Pile diam. Dp. m
Cover s tone size Dc: cm
Cover layer thickness tc = NCDC: cm
Filter s tone size Df. cm
Filter layer th ickness tf = NfDf. cm
A pproach velocity Uoo'. cm/s
Bed sed im en t size Db: m m
□ 0-20 1-9 1-9 1-1 1-5 0-40 0-18T 0-20 4-3 4-3 1-9 5-5 0-40 0-18A 0-20 4-3 4-3 1-1 2-5 0-40 0-18
Table 2. Test conditions co rresponding to th e laboratory da ta plo tted in Figure 12. W ate r d e p th w a s h = 0-56 m and th e f lume w id th 4-0 m (Nielsen, 2011)
180

EnergyVolume 166 Issue EN4
Sinking failure o f scour protection atw ind turbine foundationSumer and Nielsen
Pile Coverdiam eter , s tone Dp: m size,
Dc: m
Cover Filter Filter layer Bedlayer s tone thickness, sed im en tthickness, size, t{. m size, Db:tc: m Df: m m m
4-2 0-40 1 0 0-10 0-50 0-5
Table 3. Input pa ram ete rs , Florns Rev 1 case. Note th a t all D values in th e tab le are D50
5.1 Initiation of motion beneath scour protectionTable 3 presents the input param eters for the H orns Rev 1 case (H ansen et al., 2007). Three velocity values are adopted in the calculations, Uoo = 0-88, 1-0 and 1-5 m /s in which 0-88 m /s is the 50-year-return-period velocity, as m entioned previously (H ansen et al., 2007). The latter authors, however, also state th a t m axim um currents up to 1 m /s m ay be encountered. The stone sizes and the grain size o f the seabed sediment in Table 3 all correspond to D 50, the size a t which 50% of the sediment weight is finer. The m obility num ber, f t , the Reynolds num ber, R eg, and other non-dim ensional param eters, N c, N f ,
D c/D p, D f/D p, th a t govern the in itiation o f m otion beneath scour protection, are calculated, based on the input param eters in Table 3. The calculated values o f these param eters for the three different velocities are given in Table 4.
C om parison o f the values o f the governing param eters in Table 4 w ith those given in Figure 11 shows th a t the values p ractically m atch, w ith the exception th a t the num ber o f filter layers in H orns Rev 1 is N f = 5 whereas th a t for the data in Figure 11 is N f = 9. Nevertheless com parison can be m ade, bearing in m ind th a t the N f in H orns Rev 1 is a factor o f 2 smaller than the critical m obility da ta o f Figure 11.
Figure 14 displays the results. In Figure 14, the symbol H represents the m obility for the H orns Rev 1 for the three velocities, Uoo = 0*88, 1-0 and 1-5 m /s in Table 4, while the rest o f the data in Figure 14 are reproduced from Figure 11.
a
Symbol Nc A/f Dc/Dp Df/Dpo 2 9 0-08 0-02• 2 9 0-08 0-02O 2 9 0-09 0-02
Motiono o
Oo% HH«
No motion
J i i i i i M J I I I I I 1110 102
Rea =
103CooDb
Figure 14. Check for initiation-of-motion on the sediment beneath scour protection, Florns Rev 1 case. Symbol FI corresponds to the points for Florns Rev 1, for velocities Uoo = 0.88 m/s (lowermost point), Uoo = 1 m/s (middle point) and for Uoo = 1 -5 m/s (uppermost point). The values of f t indicated in the diagram for these three points are: 0 = 1 - 2 with Reg = 440 for Uoo = 0-88 m/s; 0 = 1 - 6 with Reg = 500 for L/«, = 1 -0 m/s; and O = 3-6 with Reg = 750 for Coo = 1-5 m/s. Rest of data are reproduced from Figure 11, the data corresponding to the initiation of motion of Nielsen (2011)
Figure 14 clearly shows th a t the sediment underneath the scour protection in H orns Rev 1 is certainly no t in the ‘no-m otion’ state, even w ith the critical m obility da ta o f Figure 11, which are obtained for a filter layer w ith N f = 9 , a value th a t is a factor o f 2 larger than the field value a t H orns Rev 1. The analysis in Section 6 in connection w ith filter criteria will also confirm this finding.
A pproach velocity Uoo- m/s
Mobilityp a ram e te rft
Grain Reynolds n um ber, Reg
N um ber of cover (arm our) layers, A/c
N um ber of filter layers,
A/f
Normalised cover (armour) s tone size,Dc/Dp
Normalised filter s tone size, Df/Dp
Thickness of filter layer, if/Dp
0 - 8 8 1 - 2 440 2-5 5 0-095 0 - 0 2 0 - 1
1 - 0 0 1 - 6 500 2-5 5 0-095 0 - 0 2 0 - 1
1-50 3-6 750 2-5 5 0-095 0 - 0 2 0 - 1
Table 4. Non-dimensional pa ram ete rs governing th e initiation of m otion b e n ea th scour protection , Florns Rev 1 case
181

EnergyVolume 166 Issue EN4
Sinking failure o f scour protection at wind turbine foundationSumer and Nielsen
Mobilityp a ram e te rn
Grain Reynolds n um ber , Reg
N um ber of cover (armour) layers,
Nc
Num ber of filter layers, A/f
Normalised cover (armour) s tone size, Dc/D p
Normalised filter s tone size, Df/Dp
Thickness of filter layer, if /Dp
Symbols in Figure 12(a)
2-7 72 1 1-4 0-09 0-06 0-075
Horns Revi 1-6 500 2-5
T able 5. Governing p a ram ete rs for laboratory tes ts and Horns Rev 1 case
5 0-095 0-02 0-1
5.2 Sinking of scour protectionAs m entioned in the preceding paragraphs, the sinking data w ith filter stones present, p lo tted in Figure 12, are very limited, w ith only three data points. O f these, the top panel is closest to the H orns Rev 1 case, w ith the cover arm our stone size D c/D p = 0-09, which is very m uch the same as in H orns Rev 1 (Table 4). Yet, it is noted th a t there are significant differences between the values o f the governing param eters in N ielsen’s (2011) experiments (Figure 12(a), Table 5) and in H orns Rev 1 case (Tables 4 and 5). Therefore com parison between the reported sinking a t H orns Rev 1 and Figure 12(a) should be treated with extra caution. Nevertheless, com parison is p resented in Figure 15 where the standard deviation sign represents the range o f the observed sinking a t H orns Rev 1, namely from practically zero up to 1-5 m, or alternatively, when scaled w ith the arm our cover stone size, emax/A : = 0 to 3*8. A lthough there are significant differences between the values o f the governing param eters, the two sets o f da ta appear to lie over the same range.
6. Filter criteria
6.1 A design approachA detailed design strategy for the filter layer m ay be adopted, following the w ork o f de G raauw et al. (1984). This is sum m arised below.
First, determ ine D f 35 o f the filter m aterial from
9- D c 15 < 5T)f 85
(know n as the Terzaghi criterion) in which D c 15 corresponds to 15% o f the arm our/cover weight being finer. This criterion is essentially based on geometrical considerations. The arm our stone size is, by definition, large com pared with the filter stone size, bu t nevertheless, it should no t be too large to allow the filter stones to be washed ou t th rough the pores o f the arm our m aterial. The above criterion ensures th a t the filter stones will no t be washed out.
£ Q
Sym bol Q Reg A/c A/f Dc/Dp Df/Dp tf/tpData from
Figure 12(a) □ 2-7 72 1 1-4 0-09 0-06 0-075Horns Rev 1
Standard dev. sign 1-6 500 2-5 5-0 0-095 0-02 0-1
0-2 0-3
— = A/f — Dp Dp
0-4 0-5 0-6
Figure 15 Maximum sinking of scour protection. Comparison between observed Horns Rev 1 and Nielsen's (2011) laboratory data (reproduced from Figure 12(a)). For the laboratory data, the
filter-case symbol also is used for the no-filter case (fp/Dp = 0), on the vertical axis
182

EnergyVolume 166 Issue EN4
Sinking failure o f scour protection atw ind turbine foundationSumer and Nielsen
Second, determ ine Z>f,i5 o f the filter m aterial from
10. / < / cr
in which I is m axim um hydraulic gradient in the horizontal direction present in the filter layer, and Icr is the critical value o f the hydraulic gradient corresponding to the in itiation of m otion at the interface between the filter layer and the base sand bed. This criterion ensures th a t the base sand o f the size D i>15 (and coarser) will no t be washed ou t as a result o f the flow th a t takes place inside the filter layer (see Section 2). The quantity 7cr is given by de G raauw et al. (1984) as follows
I r r =
11 .
0.06n3 n 4/3 f f, 15
n5/3D l/3 n f f, 15
1000
in which wf is the porosity o f the filter m aterial, taken in the present application as 0-35, and Z>f,i5 and T)b 85 are given in metres.
The bed-sedim ent size in the above equation is taken as A>,85 ra ther than T>b,5o- This is on the recom m endation o f de G raauw et al. (1984), who argue that, in the case o f graded base m aterial, it m ay be assum ed th a t the base m aterial will be better characterised by T)b ,85 (de G raauw et al., 1984: p. 84). Furtherm ore, the quantity V*CT is the critical shear velocity approxim ated from the Shields diagram by
12 . F*cr = l-3T>b;57>b,50 + 8*3 x 1 0 - 8^ 5 0
for sand in which V*cr is in metres per second and D h 50 is in metres. E quation 12 given by de G raauw et al. (1984) actually represents the critical curve (corresponding to the in itiation of m otion) in the fam iliar Shields diagram where the grain size is the m ean sediment size (Shields, 1936).
The above criterion, E quation 11 given in de G raauw et al. (1984), was based on their extensive experiments under steady current conditions.
0-15 D
Figure 16. Definition sketch. Point S: stagnation point. Point A: location where the horizontal hydraulic gradient in front of the pile (the adverse pressure gradient) becomes maximum. Point B: location where the horizontal hydraulic gradient over the surface of the pile (the favourable pressure gradient) becomes maximum
First, the horizontal hydraulic gradient in fron t o f the pile (the upstream -directed, adverse pressure gradient th a t drives the horseshoe vortex system)
13.1 = d(p /y )
dx 2 g D1 - -
14 (x /D )2]
1
It can readily be shown th a t the m axim um value o f this gradient occurs a t a distance 0 1 5D from the upstream edge o f the pile, po in t A in Figure 16.
Second, the horizontal hydraulic gradient over the surface o f the pile (the dow nstream -directed, favourable pressure gradient over the surface o f the pile caused by the ‘convergent’ geometry o f the flow from the stagnation po in t tow ards the sides o f the pile)
14.j = 9(jV r) = 1 sin(2V /D ) cos(2
dx' 2 g D
in which x is the distance over the surface o f the pile, m easured from the stagnation po in t (point S in Figure 16). The m axim um value o f this hydraulic gradient occurs a t 45° from the stagnation point, po in t B in Figure 16.
6.2 Horizontal hydraulic gradients in currentsThere are two kinds o f horizontal hydraulic gradients which are potentially capable o f m oving the base sediment a t the bed underneath the filter layer
(a) hydraulic gradient in fron t o f the pile(b) hydraulic gradient over the surface o f the pile.
The above hydraulic gradients can be considered to ‘penetrate’ th rough the granular protection layer, and therefore are present a t the seabed level. N o data are available yet to confirm this assum ption. However, there is experim ental and theoretical, ‘indirect’ evidence supporting this assum ption (Sumer and Fredsoe, 2002: pp. 484-485; Sumer et al., 2010: p. 870) in the case o f waves.
These hydraulic gradients are, from the potential flow theory (Sumer et al., 1997), given as follows (see Figure 16 for definition sketch).
A n im portan t po in t in connection with the above hydraulic gradients is th a t the hydraulic gradient over the surface o f the pile, E quation 14, is a factor o f 5 larger than th a t in fron t o f
183

EnergyVolum e 166 Issue EN4
Sinking failure o f scour protection atw ind turbine foundationSumer and Nielsen
the pile. E quation 13 (Sum er et al., 1997). The hydraulic gradient over the surface of the pile is, in real life, associated w ith the com bined effect o f contraction o f streamlines and the horseshoe vortex where the swirling horseshoe vortex around the pile eventually trails off dow nstream , as discussed in Section 2 in conjunction w ith Figure 10.
6.3 Horizontal hydraulic gradients in wavesThe horizontal hydraulic gradients, bo th in fron t o f the pile and over the surface of the pile, in the case of waves can be calculated from M acC am y and Fuchs (1954) potential flow solution, see for example, Sum er and Fredsoe (1997: p. 276). The analytical expressions are som ewhat cum bersom e, and therefore will no t be given here. Only the results (obtained for the horizontal hydraulic gradients at the bed) will be presented in Section 7 where the im plem entation of the filter criteria is discussed for the Florns Rev 1 case.
7. Filter criteria applied to Horns Rev 1 caseThe stone sizes o f the scour protection and the sand sizes o f the sediment bed for Florns Rev 1 case are reproduced from Flansen et al. (2007) in Table 6, including D 50 values given already in Table 3.
7.1 Terzaghi criterionF o r the filter m aterial to rem ain stable, E quation 9, the Terzaghi criterion, should be satisfied. F rom Table 6, D c i5 = 370 mm, and D f ss = 200 mm. It can be seen th a t the Terzaghi criterion, 7 1 c ,15 'V 5D f §5, is satisfied. Hence the observed failure o f the scour protection cannot be linked to the Terzaghi criterion. (F or an extensive account o f filter criteria (the stability, internal stability and perm eability) and the use o f filters in hydraulic engineering, the reader is referred to C IR IA /C U R /C etm ef (2007).)
7.2 de Graauw e t al. criterionTable 7 lists the horizontal hydraulic gradients obtained from Equations 13 and 14, for three current velocities, (7co = 0-88, 1-0 and 1-5 m/s. O n the o ther hand, taking the stone/grain sizes from Table 6, and the porosity of the filter as iif = 0-35, the critical Shields velocity and the critical hydraulic gradient are obtained from Equations 11 and 12, respectively, and the results are given in Table 8.
Ö-IS: m m D50: mm D85: mm
A rm o u r cover 370 4 0 0 550Filter 20 100 200Seabed 0-1 0-5 1-0
Table 6. Scour protection a n d base sed im en t , Horns Rev 1 (taken from Hansen e t al. (2007))
(Too: M aximum value o f / In M aximum value of / overm/s f ro n t o f th e pile, from th e surface o f th e pile,
Equation 13 from Equation 14
0-88 0 0 1 4 0 0751 0 0 0 1 8 0 0971-5 0 0 4 0 0-218
Table 7. Maximum values of th e horizontal hydraulicgradient: current, Horns Rev 1 case
C om parison between the critical hydraulic gradient (Table 8) and the values given in Table 7 indicates that, w ith the 1 m /s velocity, the sediment beneath the filter layer will move at areas 45° from the stagnation point (at areas a round point B in Figure 16), and therefore the scour protection will fail, a result consistent w ith Section 5 and Figure 14. (As noted earlier, current velocities up to 1 m /s can occur a t H orns Rev 1 (H ansen et a i , 2007).)
D irect com parison of the present criterion given in Figure 11 and th a t o f de G raauw et al. (1984) is no t possible. However, an indirect com parison can be m ade w ith reference to the H orns Rev 1 case. The results o f the la tter are sum m arised in Table 9. A lthough the present criterion indicates tha t the sedim ent m otion is at the threshold for the velocity Uoo = 0-88 m/s while de G raauw et al.’s criterion indicates th a t there is no sedim ent m otion for this velocity, bo th criteria show, however, that there is sediment m otion for the o ther tw o velocities. N o clear explanation has been found for the discrepancy for the velocity Ua, = 0-88 m /s. W hile the present criterion was obtained from a labora to ry experim ent sim ulating precisely the same process as in the field (i.e. the in itiation of m otion beneath the scour- pro tection filter layer a round the foundation o f an offshore w ind turbine), de G raauw et al.’s (1984) criterion was obtained from an experim ent where the sediment m otion beneath a filter layer was studied in a horizontal pressure gradient field. Despite the completely different experim ental settings, it is rem arkable th a t the tw o criteria give similar results. The current authors believe th a t the new set o f inform ation described in the present paper (including the hydrodynam ics described in Sections 2 4) and the filter criteria o f de G raauw et al. (1984) form a com plem entary source o f inform ation on scour protection w ith special reference to O W T foundations.
Df.is Hb, 50 Db,85 V. /cr
2 0 m m 0-5 m m 1 0 m m 1-8 cm/s 0-083
Table 8. Critical hydraulic gradient; Horns Rev 1 from Equation 11
184

EnergyV o lu m e 166 Issue EN4
Sinking failure o f scour protection at w ind turbine foundationSum er and Nielsen
Uoo'. Present criterion accord ing to Figure 11 de G ra au w e f a/. 's (1984) criterion
m s Mobility, Criticalf l mobility from
Figure 11,
f l Cr
Is sand u n d e rn ea th th e filter In m otion? (I.e. f l > f l cr)
M aximum value of Critical hydraulic hydraulic g rad ien t over th e g rad ien t from surface o f th e pile, from Equation 11, /cr Equatlon 14, /
Is sand u n d e rn ea th t h e filter In m otion? (I.e. / > /cr)
0-88 1-2 ~ 1 -2 Critical 0-075 0-083 No1-0 1-6 ~ 1 -2 Yes 0-097 0-083 Yes1-5 3-6 ~ 0 - 7 Yes 0-218 0-083 Yes
Table 9. C om parison o f th e p re sen t criterion in Figure 11 and th a t o f de G ra au w e t al. (1984), w ith re ference to th e Horns Rev 1 case
Clearly, w hen applying de G raauw et al.’s (1984) criteria, caution m ust be observed w ith regard to the hydraulic gradient involved in the form ulation o f de G raauw et al. This has been determ ined in the present study from a potential-flow approach, E quation 14, and the agreem ent between the present study and the de G raauw et al.’s w ork implies th a t this approach is evidently reasonable. However, ano ther approach m ay be to use directly com puted values o f the hydraulic gradient from a com pu ta tional fluid dynam ics (C FD ) exercise w hereby the flow w ithin and a round the scour p rotection layer (and therefore the hydraulic gradient) is calculated.
7.2.1 Discussion o f t h e e f fec t o f w av esAs pointed out earlier, the two horizontal hydraulic gradients in the case of waves can be calculated, using M acC am y and Fuchs’ (1954) solution (e.g. see Sumer and Fredsoe, 1997: p. 276). The m axim um values o f these hydraulic gradients, obtained from M acC am y and Fuchs’ solution, are indicated in Table 10 for the following wave conditions: wave height, the significant wave height, H = 3-5 m; the wave period, the peak wave period, T = 10 s; and the w ater depth, h = 10 m, representing a typical storm condition, as m entioned previously (H ansen et al., 2007: section 4.1.4). F o r this wave period and w ater depth, the wave length from the sm all-am plitude wave theory is found to be L = 92-4 m.
M aximum value o f / In fron t of th e pile a t th e seabed , from M acC am y an d Fuchs (1954) solution
M aximum value of / over surface o f pile, a t th e seabed , from M acC am y an d Fuchs (1954) solution
- 0-1 0-195
Table 10. M aximum values of th e horizontal hydraulic g radient: w aves
The M acC am y and Fuchs’ solution indicates th a t the m axim um value of the hydraulic gradient over the surface o f the pile a t the bed occurs a t approxim ately 88° (alm ost a t the sides) from the offshore edge o f the pile. This result is consistent w ith the fact tha t N ielsen (2011) consistently observed th a t the sinking of scour protection (albeit small) always occurred a t the sides of the pile in the case o f waves, contrary to w hat occurred in currents, namely tha t the sinking occurred a t the sides and in fron t o f the pile.
C om parison between the critical hydraulic gradient (Table 8) and the values given in Table 10 indicates th a t the sediment beneath the filter layer will move, as I = 0-195 is considerably larger than the critical value 7cr = 0-083, and this will occur at areas alm ost a t the sides o f the pile, as pointed out earlier. Therefore the scour p rotection will fail a t these areas, a result consistent w ith N ielsen’s (2011) experim ents in waves. However, see the following discussion.
7.2.2 Discussion o f t h e applicab il i ty o f E qu a tio n 11 in w av es
The present au thors believe th a t the applicability o f E quation 11 for the waves-alone case m ay lead to som ewhat conservative results for the following reasons. F irst o f all, the de G raauw et al. equation, E quation 11, was obtained for steady current conditions, no t for waves, and therefore is, in principle, not applicable for waves.
Second, in de G raauw et al.’s (1984) study, critical horizontal hydraulic gradients also are determ ined from oscillatory flow experiments, de G raauw et al. (1984) stated th a t the behaviour of the critical hydraulic gradient was similar to th a t o f currents only during the first cycle o f m otion. W ith the com pletion of the first cycle, the filter resistance was increased, becoming so large th a t the critical hydraulic gradient became alm ost unity, 7cr «s 1. This is clearly because, w ith the reversal o f the flow, the grains will rearrange, and therefore the filter m aterial will
185

EnergyVolum e 166 Issue EN4
Sinking failure o f scour protection atw ind turbine foundationSumer and Nielsen
be com pacted, and hence the critical hydraulic gradient will be increased.
T hird, the preceding consideration implies therefore tha t the critical hydraulic gradient for waves alone cannot be approxim ated by tha t obtained under current conditions.
It m ay be argued th a t the current critical hydraulic gradient, E quation 11, m ay be used for the first cycle o f m otion. But obviously, the sinking is a long-term process; even if sediment m otion is obtained under the given set o f wave conditions, this does no t have any significance because the sediment m otion will stop in the next cycle because the filter resistance will be increased quite considerably after the first cycle, and therefore no further m otion o f the sediment will take place, and therefore no sinking o f the scour protection.
F ou rth , a lthough limited, N ielsen’s (2011) experiments indicated tha t the wave-induced sinking was small com pared w ith th a t in currents (Figure 13). Therefore, a w ave-induced hydraulic gradient like I = 0-195 (Table 10), causing sediment m otion and resulting sinking as opposed to the current-induced hydraulic gradient 7 = 0 -0 9 7 (Table 7), is no t consistent w ith N ielsen’s (2011) observations.
R egarding the case o f com bined waves and current, no study is yet available investigating the in itiation o f m otion and the resulting sinking in com bined waves and current, as discussed earlier. As already pointed out, the effect o f wave, when superimposed on a current, will be similar to the case o f waves alone w hen the current-to-w ave-velocity ra tio is very small (wave- dom inated case); see the discussion in Section 2.1. Therefore, the discussion in the preceding paragraphs for the case o f waves alone will be valid fo r this case, too. W hen the latter ra tio is large, however, larger than 0(0-1), the horseshoe- vortex flow inside the scour protection will resemble the current-alone case (as discussed in Section 2.1), and therefore the m axim um horizontal hydraulic gradient can be calculated from E quation 14, w ith possibly the approach velocity taken as the sum o f the current approach velocity and the wave- induced velocity a t the bed, + Um . As already stated, no data are available yet to substantiate these physical considerations, and therefore extreme caution m ust be observed when im plem enting this recom m endation.
7.2.3 W h a t is t h e f i l te r s to n e size t o satisfy t h e d e G ra a u w cri te r ion?
W ith a back calculation, it is possible to w ork out the filter stone size, D fj 5 , w hich satisfies the de G raauw criterion. F o r this, the m axim um value of the hydraulic gradient over the surface o f the pile from E quation 14 is pu t equal to the critical hydraulic gradient, E quation 11, and the equation is solved for the filter stone size D fJs . This gives a D i l5 o f 17-8 m m for the velocity
Uo¡> = 1-0 m/s. Thus, a filter stone size 7)f 15 equal to o r smaller than 17-8 m m will be stable.
8. DiscussionThe to ta l sinking a t H orns Rev 1 is about 1-5 m. Stability calculations can readily indicate tha t the arm our stones cannot be m oved even w ith the harshest wave and current conditions present a t this location. D iver inspection also confirm ed tha t no arm our stones were displaced as a result o f instability of the arm our layer. Therefore, the failure in the form o f the observed lowering of the scour protection was presum ably caused by the sinking of the entire protection into the seabed adjacent to the m onopile base. However, it is interesting to discuss w hether the sinking has taken place owing to the m ovem ent o f filter stones into the cover layer, or m ovem ent o f bed sand into the filter, o r m ovem ent o f sand up from between filter stones and cover stones.
R egarding the first question, w hether o r no t sinking has taken place owing to the m ovem ent o f filter stones into the cover layer, the present au thors have, in Section 7.1, discussed the Terzaghi criterion in the context o f the interaction between the filter layer and the cover layer, and found th a t the Terzaghi criterion is satisfied. This ensures th a t no filter stones will move into the cover layer. Furtherm ore, when im plem ented fo r the H orns Rev 1 conditions, the design guidelines given in D ixen et al. (2008) will indicate th a t the filter stones will no t be winnow ed out from between cover stones.
As for the m ovem ent o f bed sand into the filter layer, or m ovem ent o f sand up th rough b o th filter layer and cover layer, w hat happened during the period between the tw o surveys (see Section 1) is unknow n. However, from N ielsen’s (2011) physical m odel observations, it is likely th a t the sand mobilised by the horseshoe vortex inside the protection layer entrained constantly into the m ain body o f the flow along the entire outer boundary of the horseshoe vortex (‘encircling’ the upstream half o f the pile) until the sinking process atta ined a steady state, and from then on the sand deposited inside the protection layer.
A nother issue is th a t the 50-year current speed o f 0-88 m /s is too fast for norm al conditions (e.g. see the synthetically generated bu t calibrated current time series representing current as well as tide and surge da ta given in Nielsen and H ansen (2007)), and therefore the norm al current will lie below the critical m otion trend in Figure 14 (or Figure 11). A lthough the da ta in Figure 11 were obtained from tests where the num ber of filter layers, Nf , is a factor o f 2 larger than the H orns Rev case, the observed sinking a t H orns Rev 1 can also, in part, be explained by the presence o f waves in ordinary current conditions, discussed in the preceding paragraphs.
186

Energy Sinking failure o f scour protection atVolum e 166 Issue EN4 wind turbine foundation
Sumer and Nielsen
9. Conclusions(a) Flow around a pile w ith scour protection, in itiation of
m otion a t the sediment bed beneath the scour protection, and sediment m otion beneath the scour protection and resulting sinking have been described in the light o f the recent w ork o f Nielsen (2011), which is also sum m arised in Nielsen et al. (2011).
(b) The findings o f the above w ork were form ulated in the form o f a set o f non-dim ensional param eters for (i) the in itiation o f m otion beneath the scour protection, and (ii) sinking o f the scour protection. The results were com pared w ith the H orns Rev 1 case. G ood agreem ent was obtained, w ith the results revealing the potential cause o f failure observed from the field surveys conducted in 2002 and 2005. The la tter gave confidence in the use o f the results in practice.
(c) Scour p rotection has also been studied from the poin t of view o f filter criteria, based on the w ork o f de G raauw et al. (1984).
(d ) A ccording to the la tter criteria, it was found tha t the filter criteria are no t satisfied in the H orns Rev 1 case, consistent w ith the observed failure.
A cknowledgem entThis study was partially funded by: (a) the D anish Council for Strategic Research (D SF)/Energy and E nvironm ent Program m e ‘Seabed W ind F arm In terac tion ’; (b) S tatkraft AS (N orw ay) ‘SO ER P - S tatkraft O cean Energy Research Program m e’; (c) D H I; (d) D anish GTS-universitetssamarbejde project ‘Frem tidens M arine K onstruktioner’; and (e) E U Seventh Fram ew ork Program m e ‘Innovative M ulti-purpose Off-shore Platforms: Planning, Design and O peration (M E R M A ID )’.
REFERENCES
Chiew YM (1995) M echanics o f rip rap failure a t bridge piers.Journal o f Hydraulic Engineering 121(9): 635-643.
Chiew YM (2002) Failure m echanism o f rip rap layer around bridge piers. Proceedings o f the 1st International Conference on Scour o f Foundations, vol. I, pp. 70-91.
Chiew YM and Lim FH (2000) Failure behavior o f rip rap layer a t bridge piers and live-bed conditions. Journal o f Hydraulic Engineering 126(1): 43.
CIRIA/CUR/Cetmef (2007) The R ock Manual. The Use o f R ock in Hydraulic Engineering, 2nd edn. C IR IA , L ondon, U K , C683.
de G raauw AF, van der Meulen T and de Bye MRD (1984) G ranu lar filters: design criteria. Journal o f Waterway,Port, Coastal and Ocean Engineering, A S C E 110(1):80-96.
de Vos L, de Rouck J, Troch P and Frigaard P (2011)Em pirical design o f scour protections a round m onopile foundations p art 1 : Static approach. Coastal Engineering 58(6): 540-553.
de Vos L, de Rouck J, Troch P and Frigaard P (2012)Em pirical design of scour protections a round m onopile foundations p art 2: D ynam ic approach. Coastal Engineering 60(February): 286-298.
Dixen FH, Sumer BM and Fredsoe J (2008) Suction rem oval o f sediment from between arm our blocks. II. W aves. Journal o f Hydraulic Engineering, A S C E 134(10): 1405-1420.
Hansen EA, Simonsen HJ, Nielsen AW, Pedersen J and Hogedal M (2007) Scour protection a round offshore wind turbine foundations, full-scale m easurem ents. Proceedings o f the European Energy Conference 2007 - E W E C 2007, pp. 132-138.
Harris JM, W hitehouse RJS and Benson T (2010) The time evolution of scour a round offshore structures.Proceedings o f the Institution o f Civil Engineers - M aritim e Engineering 163(1): 3-17, h ttp ://dx .do i.o rg /10 . 1680/maen.2010.163.1.3.
MacCamy RC and Fuchs RA (1954) Wave Forces on Piles: A Diffraction Theory. U.S. A rm y C orps o f Engineers, Beach Erosion B oard, U SA, Technical M em o N o. 69.
Nielsen AW (2011) Scour Protection o f Offshore W ind Farms. PhD thesis, D epartm ent o f M echanical Engineering, Technical University o f D enm ark, Section o f Coastal, M aritim e and S tructural Engineering, Lyngby, D enm ark.
Nielsen AW and Hansen EA (2007) Tim e-varying wave and current-induced scour a round offshore w ind turbines. Proceedings o f the International Conference on Offshore Mechanics and Arctic Engineering - O M A E , vol. 5, pp. 399-408.
Nielsen AW, Sumer BM, Fredsoe J and Christensen ED (2011) Sinking o f arm our layer a round a cylinder exposed to a current. Proceedings o f the Institution o f Civil Engineers - M aritim e Engineering 164(4): 159-172, h ttp ://dx .do i.o rg /10 . 1680/m aen.2011.164.4.159.
Nielsen AW, Sumer BM, Ebbe SS and Fredsoe J (2012) Experim ental study on the scour a round a m onopile in breaking waves. Journal o f Waterway, Port, Coastal and Offshore Engineering, A S C E 138(6): 501-506.
Raaijmakers TC and Rudolph D (2008a) Tim e-dependent scour developm ent under com bined current and waves conditions - laboratory experim ents w ith online m onitoring technique. Proceedings o f the 4th International Conference on Scour and Erosion , vol. 1, pp. 152-161.
Raaijmakers TC and Rudolph D (2008b) Tim e-dependent scour developm ent under com bined current and waves conditions - hindcast o f field m easurem ents. Proceedings o f the 4th International Conference on Scour and Erosion, vol. 1, pp. 340-347.
Raaijmakers TC, Rudolph D, Bergen MRJV and Lieshout HV (2007) O ffshore w indpark Egm ond aan Zee - perform ance o f scour protection and edge scour developm ent. Proceedings o f the European O ff shore Wind C onf erence 2007 - E O W 2007, Berlin, Germany, p. 10.
187

EnergyVolum e 166 Issue EN4
Sinking failure o f scour protection atw ind turbine foundationSumer and Nielsen
Shields A (1936) Application o f Sim ilarity Principles and Turbulence Research to Bedload M ovem ent (translated from Anwendung der Aehnlichkeitsmechanik und der Turbulenzforschung a u f die Geschiebe-bewegung,Mitteilungen der Preussischen Versuchsanstalt für Nassexbau und Schiffbau, Berlin, 1936 by O tt W P and van U chelen JC). Soil C onservation Service C ooperative L aboratory , C alifornia Institu te o f Technology, Pasadena, California.
Sumer BM and Fredsoe J (1997) H ydrodynamics Around Cylindrical Structures, 1st edn (2nd revised edn, 2006). W orld Scientific, New Jersey, Singapore, London, H ong Kong.
Sumer BM and Fredsoe J (2001) W ave scour a round a large vertical circular cylinder. Journal o f Waterway, Port,Coasted and Ocean Engineering, A S C E 127(3): 125-134.
Sumer BM and Freds0e J (2002) The Mechanics o f Scour in the M arine Environment. W orld Scientific, New Jersey, Singapore, L ondon and H ong Kong.
Sumer BM, Christiansen N and Freds0e J (1997) H orseshoe vortex and vortex shedding a round a vertical w all-m ounted cylinder exposed to waves. Journal o f Fluid Mechanics 332(February): 41-70.
Sumer BM, Dixen FH and Freds0e J (2010) C over stones on liquefiable soil bed under waves. Coasted Engineering 57(9): 864-873.
Sumer BM, Petersen TU, Locatelli L e t a / . (2013) Backfilling of a scour hole a round a pile in waves and current. Journal o f Waterway, Port, Coastal and Offshore Engineering, A S C E 139(1): 9-23.
W hitehouse FUS, Harris JM, Sutherland J and Rees J (2011a) The nature o f scour developm ent and scour protection at offshore w indfarm foundations. M arine Pollution Bulletin 62(1): 73-88.
W hitehouse RJS, Sutherland J and Harris JM (2011b) Evaluating scour a t m arine gravity foundations.Proceedings o f the Institution o f Civil Engineers - M aritim e Engineering 164(4): 143-157, http://dx.doi.org/10.1680/ m aen.2011.164.4.143.
W ittrup S (2012) H orseshoe vortex washes ou t the sediment a round offshore w ind turbines. Ingenioren/energi&miljo,16 January , see http://ing.dk/artikel/125792-hestesko- hvirvler-vasker-bunden-om kring-havvindm oeller-vaek (in D anish).
W H A T D O YOU TH IN K ?
To discuss th is paper , p lease email up t o 500 w o rd s t o th e e d i to r a t journals@ ice .org .uk . Y our co n tr ib u t io n will be fo r w a rd e d t o t h e au thor(s) fo r a reply an d , if considered a p p ro p r ia t e by th e ed itoria l panel, will b e pub lished as a discussion in a fu tu re issue o f th e journal.
Proceedings jo u rna ls rely entire ly on con tr ib u t io n s sen t in by civil e n g in e e r in g professionals, academ ics a n d s tuden ts . Papers shou ld be 2000-5000 w o rd s long (br iefing pape rs shou ld b e 1000-2000 w o rd s long), w i th a d e q u a t e illust r a t io n s a n d references. You can sub m it y o u r p a p e r on line via w w w .icev ir tua l l ib ra ry .com /con ten t/ jou rna ls , w h e r e you will also f ind d e ta i le d a u th o r guidelines.
188